

Submitted:
28 April 2024
Posted:
01 May 2024
You are already at the latest version
Abstract
This study delves into the dynamics of 'Variations' and 'Claims' within construction projects, specifically under the FIDIC-Red Book 1999 (FIDIC 1999) framework. It aims to identify, categorize, and devise mitigation strategies for key types of Variations and Claims, aligning with the FIDIC Conditions of Contract. The research, drawing on inputs from construction industry professionals including Contract Administrators and Project Managers, focuses on the MENA re-gion. This choice is driven by the region's extensive adoption of FIDIC standards and its rapidly growing construction sector.
Data collection encompassed a questionnaire distributed to 80 industry experts, predominantly through interviews, focusing on countries like Saudi Arabia, UAE, Kuwait, and Egypt. These locations were chosen to reflect diverse construction practices and the involvement of international firms. Utilizing SPSS-V.25 for statistical analysis, the study uncovers the most prevalent and impactful causes of Variations and Claims, highlighting the critical need for managerial intervention.
A key feature of this study is the integration of Scientometric Analysis for a quantitative review of current literature, providing a comprehensive academic context. A significant addition to the methodology is the implementation of a k-means clustering analysis. This advanced statistical technique further classifies the data into distinct clusters, each representing unique combinations of 'Frequency' and 'Impact' of Variations and Claims. The k-means analysis elucidates intricate patterns and potential solutions, offering profound insights into effectively managing these issues. These analytical advancements are crucial in identifying significant and manageable responses to reduce the frequency and impact of Variations and Claims in construction projects.
Keywords:
construction industry
; international contracts
; FIDIC 1999 Red Book
; variations
; claims
; scientometric analysis
; statistical analysis
; relative importance index (RII)
; K-means clustering
1. Introduction
Construction Industry represents a vital indicator to the countries’ economies, its success lead to achieve development and stability, while its failure adversely affects economy. As a result of its complexity, unique nature compared with other industries and the participation of several parties from all market sectors within or outside the country, therefore any event or circumstance affecting the construction industry has the ability to influence the economy as a whole. According to market research until 2020 for “Construction Industry “worldwide, published in www.MarketReportsStore.com website where the study of the global construction forecasts up to the year 2020 and how the evolution of “Construction Industry “in all the major countries, according to The CIC's (Construction Intelligence Center) Global 50s, This encompasses over 50 of the world's biggest and most significant markets. The Middle East and Africa are expected to have the fastest-growing "Construction Industry" in the coming years, according to a report. This is due in large part to the significant investments made in infrastructure and buildings in these regions, despite fluctuations in oil prices and their vulnerability to economic growth. The report also confirmed that the Asia-Pacific region will account for a growing portion of the global construction industry, rising from 40% in 2010 to nearly 49% in 2020. Variations and Claims are common in Construction industry due to requirements and needs as well as the growing complexity of the processes of construction. However, construction industry contracts of huge funding values undergo many "Variations" during project stages; Design stage, contracting stage and construction stage, Abdelalim, A.M., (2016-2023). The primary objectives of this study are to explore and investigate contractual variants and raised claims in compliance with the employer's FIDIC-Red Book 1999 (FIDIC 1999); Conditions of Contract for Construction of building and engineering works, as well as their underlying reasons. Based on feedback from construction professionals' experience; clients, consultants, contractors, and claim experts through the conducted questionnaire.
1.1. Research Objectives
Research mainly aims to carry out a study of “Variations” and “Claims" in the Conditions of Contract for Construction of building and engineering works designed by the employer (FIDIC 1999) in order to achieve the following objectives:
- Identification and characterization of the significant types of “Variations” and “Claims" in construction projects in accordance with the terms of the Conditions of Contract for Construction (FIDIC-1999).
- Study the significant Causes of the “Variations” and “Claims" in construction projects.
- Suggest recommendations and proposed solutions to benefit from the results of the study and avoid the Causes of “Variations” and “Claims”.
1.1. Research Methodology
The research methodology adopts a multi-faceted approach, essential for comprehensively addressing the intricacies of Variations and Claims in International Contracts, specifically under FIDIC guidelines. The methodology is structured into distinct but interrelated stages, each contributing uniquely towards achieving our research objectives, as shown in Figure 1.
1.1. Scientometric Analysis
In the Scientometric Analysis phase of this research, a thorough and systematic examination of the existing scholarly literature on Variations and Claims in International Contracts, with a specific focus on those under the FIDIC framework, is carried out. This examination is pivotal for pinpointing the dominant themes, trends, and notable gaps within this academic field. Utilizing advanced data analysis tools, the research delves into a carefully curated collection of academic journals, conference papers, and industry reports. This process aims to intricately map the scholarly landscape surrounding the topic, thereby affirming the pertinence of the research focus.
To initiate this analysis, Scopus, a comprehensive database known for its wide array of scientific publications and rapid indexing, is selected as the primary source for data retrieval. This choice enhances the likelihood of accessing relevant and recent literature in this field. In December 2023, a specific search query is employed to gather data. The query, formulated as "( TITLE-ABS-KEY ( "Construction" AND "FIDIC" AND "Claim" ) OR TITLE-ABS-KEY ( "Construction" AND "FIDIC" AND "Variation" ) ) AND ( LIMIT-TO ( LANGUAGE , "English" ) ) AND ( LIMIT-TO ( DOCTYPE , "cp" ) OR LIMIT-TO ( DOCTYPE , "ar" ) )," is designed to capture publications that focus on 'Construction,' 'FIDIC,' along with either 'Claim' or 'Variation.'
Recognizing the enduring significance of 'construction claims' as a topic of research in the construction sector, the authors decide against setting a time restriction for the publications. Initially, 62 articles are retrieved through this process. To ensure the quality and relevance of the review, inclusion and exclusion criteria are established. Articles not in English and those not categorized as either 'journal articles' or 'conference articles' are excluded. This refining process narrows down the selection to 49 manuscripts, which are then downloaded and meticulously reviewed.
For deeper analysis, VOS-viewer software, an open-source tool acclaimed for its capability to construct and visualize bibliometric networks, is utilized. This software applies the visualization of similarities (VOS) technique, as formulated by (van Eck & Waltman, 2010), for this analysis. The process includes examining all keywords found in the selected publications, with a predetermined threshold set to include those appearing at least twice. Among 324 keywords, 54 meet this criterion, revealing six main thematic clusters in the analysis as shown in Figure 2. These clusters are visually represented in a keyword co-occurrence network, where each cluster is color-coded, and the size of each node (keyword) indicates its frequency of occurrence. The relationships between keywords are depicted through arcs, with the thickness of each line signifying the strength of the relationship. The clusters identified are: the yellow cluster representing ‘contractors,’ the red cluster for ‘construction industry and EOT,’ the green cluster signifying ‘construction project management,’ the purple cluster for ‘civil engineering,’ the blue cluster denoting ‘construction and FIDIC,’ and the sky blue cluster for ‘construction contracts.’ The most prominent keyword, serving as the central node in this network, is ‘construction projects’.
This visualization, despite not being constrained by strict keyword thresholds, highlights a critical observation: previous studies have not extensively explored the causes of claims and variations within the context of FIDIC contracts. This gap in the literature underscores the necessity for this research to delve deeply into these aspects, thereby contributing to a more comprehensive understanding of Variations and Claims in construction contracts under FIDIC regulations.
The insights gained from this scientometric analysis not only affirm the significance of the research topic within both academic and industry circles but also provide a foundational guide for the direction and emphasis of subsequent stages of investigation. This ensures that the research approach is both comprehensive and well-informed, addressing the complexities of Variations and Claims in a manner that is grounded in the current state of academic and industry understanding. This stage of the research, therefore, serves as a critical stepping stone in developing a nuanced and contextually relevant exploration of the subject matter, aiming to contribute meaningfully to the field of construction management and contract administration.
Literature Study
Variations and Claims generally arise between the employer and the contractor due to their respective rights and obligations under the Contract Clauses; or due to some events or circumstances. The FIDIC Conditions of Contract tried to ensure the balanced rights of all parties even at the exposure of the employers, engineers and contractors to claims.
1.1. Classification of Variations and Claims
According to the terms of Conditions of Contract for Construction of building and engineering works designed by the employer (FIDIC 1999), Variations and Claims between the Employer and the Contractor, they are classified into: Time Claims, Cost Claims and Profit Claims as per Table 1.
1.1. Causes of Variations and Claims
According to the terms of Conditions of Contract for Construction of building and engineering works designed by the employer (FIDIC 1999), causes of variations and claims can be classified as shown in Table 2.
1.1. Significance and Avoid ability
Significance and avoid-ability are two key issues that have been addressed of real strategy for reducing Variations and Claims Causes. The Significance of causes reflects its potentiality to occur and adversely affects the overall performance of construction projects. Avoid-ability is more concerned with the precautions and preventive procedures that can reduce the consequences of variations and claims. Both of them are essential in studying causes of claims and recommended responses.
Methods and Techniques
1.1. Characteristics of the Survey Targeted Participants and Statistical Investigation
The sample size for the survey was determined with consideration for the limited availability of Claims & Disputes experts. To ensure a statistically representative sample of the population, the following formula was used for the initial calculation:
This calculation is based on:
A confidence level value (z) of 1.96 indicates a 95% confidence level, an estimated proportion (p) of 0.5, commonly used when the exact proportion is unknown. A margin of error (ε) set at 0.05, equating to 5%.
The initial sample size calculated using this formula was 384. However, due to the finite population of Claims & Disputes experts, a correction was applied to this initial figure. The corrected sample size (n) was determined by the following equation, which accounts for the limited population size:
In this equation, N represents the total population of Claims & Disputes experts. This adjustment resulted in a final sample size of approximately 80. This methodological approach is critical to ensure that the sample size is adequately representative of the expert population, enhancing the reliability of the survey results.
The characteristics of respondents were classified and denoted into six groups; PC01, PC02, PC03, PC04, PC05 and PC06 as shown in figures 3 and 4. Those are: the role of respondents and managerial level in their firms, personal respondent’s experiences and organization’s past experiences and finally the business in hand in terms of number of projects operated by company. This information was collected through respondents’ profile part in the questionnaire.
1.1. Participant Profiles and Group Classifications in the Survey
- The survey categorized respondents into six distinct groups, each defined by specific criteria that captured various dimensions of their professional profiles. This categorization facilitated a detailed analysis of the data, allowing for nuanced insights into industry practices. The groups were as follows:
- PC01 - Role of the Respondent (Identity): This classification focused on the professional role of each respondent, identifying their specific position or function within their organization.
- PC02 - Detailed Managerial Level: Respondents were classified based on their managerial level within their organizations, offering insights into the decision-making hierarchy and leadership structure.
- PC03 - Years of Experience: This category evaluated the individual professional experience of each respondent, highlighting the depth and range of their expertise in the industry.
- PC04 - Organization/Firm's Experience (Firm's Number of Years in Business): This group focused on the longevity and historical context of the organizations represented, providing an understanding of the firm's experience and stability in the industry.
- PC05 - Organization/Firm's Annual Number of Projects: This classification detailed the scale and scope of operations of the respondents' firms, based on the number of projects managed or undertaken annually.
- PC06 - Organization/Firm's Number of Employees: This group provided insights into the size and human resource capacity of the organizations, highlighting the scale of their operations in terms of personnel.
The following Figure 3 and Figure 4 provide a visual representation of these classifications, illustrating the diversity and distribution of the participant pool across these varied criteria. This systematic approach to categorizing the respondents enriched the survey's findings, ensuring a comprehensive understanding of the industry as viewed through the diverse perspectives and experiences of professionals across different roles, managerial levels, and organizational contexts.
1.1. Evaluation of Survey Validity and Reliability
The survey underwent a rigorous evaluation for validity and reliability, focusing on types of variations and claims in terms of frequency, impact, and their underlying causes. The validity was quantitatively established with a Cronbach’s alpha value of 0.97, indicating a high level of internal consistency since this value notably surpasses the commonly accepted threshold of 0.70. Furthermore, the lowest item-total statistic in the survey did not fall below 0.969, reinforcing the validity of the findings. In terms of reliability, the corrected item-total correlation for all survey factors, both dependent and independent, exceeded 0.30. This statistical affirmation underscores that the survey elements were both reliable and consistent, providing a solid foundation for the study's conclusions.
1.1. Relative Importance Index Test (RII)
The survey incorporated the Relative Importance Index (RII) to analyze participants' perceptions of various factors. Respondents were requested to assign a rating to each factor, ranging from 1 ('very rare') to 5 ('very high'). Absent responses were not assigned any weight in the RII calculation. This rating system facilitated the categorization of responses into five distinct levels of importance: extremely rare (very low), rare (low), average, high, and very high. The application of RII in analyzing the survey results enabled a nuanced understanding of how different factors were perceived in terms of their importance and frequency within the context of the study.
1.1. Assessment of Frequency for Types of Variations and Claims
In assessing the frequency of different types of variations and claims, responses from clients, consultants, and contractors were collectively evaluated, as summarized in Table 3. This comprehensive analysis identified a total of fifty-one distinct types of variations and claims, initially detailed in Table 1. Among these, ten types emerged as the most frequently encountered in projects, as consistently reported across all respondent groups. The remaining forty-one types were notably less frequent, indicating a lower occurrence rate in construction projects.
1.1. Assessment of Impact for Types of Variations and Claims
The impact assessment of variations and claims, based on the collective feedback from clients, consultants, and contractors, is presented in Table 4. This evaluation aimed to understand the severity of different types of variations and claims as experienced in the industry. The analysis revealed that thirty-two types of variations and claims were frequently identified as having a significant impact on construction projects. In contrast, nineteen types were perceived to have a less severe impact, suggesting that their occurrence typically results in less disruption or fewer consequences for the projects involved.
1.1. Causes of Variations and Claims (Perceived Agreement Assessment)
Every replying group affirmed to the possibility that the majority of the causes listed above could result in claims and variances in construction projects. With varying degrees of agreement, each group concurred that there are 31 possible causes that could lead to these kinds of construction variations and claims. This illustrates the disparities in agreement as each group perceived it. The assessment of the cause by the different responding groups (i.e., clients, consultants, and contractors) was compared using Table 5. The generation of different kinds of construction variations and claims can be attributed to these thirty-one proposed causes. Furthermore, based on their experiences and backgrounds, the respondents were evidently biased in some way, according to the data. But this bias is not unexpected—in fact, other people have already noted it such as Kumaraswamy (1997).
1.1. Causes of Variations and Claims (Perceived Significance Assessment)
The responses for the cause's significant assessment from the viewpoint of all respondents, for the first 10 categories of variations and claims, are shown in Table 6.
1.1. Causes of Variations and Claims (Perceived Avoid ability Assessment)
Analysis was done on the responses from the different groups about the Avoidability of factors that can lead to or "trigger" the kinds of variations and claims. Nonetheless, the analysis of the total response data is presented in this section. The answers for the top ten avoidable causes of variations and claims are shown in Table 7.
Results and Discussion
In this study, the employment of various statistical analysis methods was pivotal for a comprehensive understanding of the intricate dynamics of Variations and Claims in FIDIC contracts in the MENA region. Each method contributed uniquely to unraveling different facets of the data. Starting with descriptive and inferential statistics allowed for establishing a foundational understanding of the data distribution and relationships among variables. Advancing to more complex analyses like the Relative Importance Index (RII) and Spearman's Correlation, deeper insights into the significance and interconnectedness of factors influencing Variations and Claims were obtained. The culmination of the analysis with k-means clustering, a robust unsupervised machine learning technique, enabled the classification of vast and complex data into meaningful categories. This facilitated the identification of distinct patterns and trends, which might not have been discernible through simpler analytical methods. By concluding with k-means clustering, the study provided actionable insights and targeted recommendations, ensuring that findings were not only statistically significant but also practically relevant to industry stakeholders.
1.1. Analysis of the findings (Statistical Hypothesis- Kruskal Wallis Test)
Nothing presumptive exists in the Kruskal-Wallis Test. The alternative hypothesis states that the samples originate from distinct populations, while the null hypothesis states that the samples are from the same populations. The p-value was compared to the significance level in order to evaluate the null hypothesis and determine whether any of the differences between the medians are statistically significant. According to the null hypothesis, each population median is equal. Typically, a significance threshold of 0.05 (represented as α or alpha) is effective. A 5% chance of determining that a difference exists when there isn't one is indicated by a significance level of 0.05. P-value < α indicates statistical significance in the discrepancies between some of the medians. The null hypothesis is true if the p-value is less than or equal to the significance level.
The majority of the six group respondents to this statistical test said that, with the exception of T12, which is statistically significant in relation to Personal Experience (PC03) with a p-value of less than 0.05, the differences between the medians are not statistically significant. As a result, not all group medians are equal and the null hypothesis was rejected. Furthermore, T14's relationship to Organization/Firm's Experience (Firm's Number of Years in Business) (PC04) was determined to be statistically significant with a p-value of 0.01. The null hypothesis was rejected, indicating that not all item medians are identical, and T16 was also statistically significant in relation to Organization/Firm's Experience (Firm's Number of Years in Business) (PC04), with a p-value of =0.009 (lower than 0.05). T39 showed statistical significance in relation to the organization's or firm's Annual Number of Projects (PC05) with p-value =0.007. In terms of frequency, it is evident that the majority of variations and claims have no disparities between the medians that are statistically significant, refer to Table 8.
1.1. Kruskal Wallis Test (Types of Variations and Claims – Impact)
For this statistical test, most of the group respondents (PC01, PC02, PC03, PC04, PC05, PC06) responded that the differences between the medians are not statistically significant except for PC01 group we find that T11, T49, T02, T21, T45, T27, T38 and T43 with p-value of 0.002,0.005,0.007,0.035,0.040,0.041,0.042 and 0.049 respectively. In addition, for the Managerial level; PC02 group, was found that T32, T29, T22 and T25 are statistically significant with p-value = 0.026, 0.028, 0.038 and 0.046 respectively. Also, for PC03 group note that only one type T49 is statistically significant with p-value =0.0.044. For PC04 group the two types T02, T11 are statistically significant with p-value =0.012 and 0.021 respectively For PC05 group the two types T16, T39 are statistically significant with p-value =0.009 and 0.013 respectively. Finally, PC06 group there are three types T16, T47 and T26 are statistically significant with p-value =0.032, 0.040 and 0.040. It is clear that the most of types of variations and claims in terms of impact have no differences between the group respondents’ medians which are not statistically significant as shown in Table 9.
1.1. Kruskal Wallis Test (Cause of Variations and Claims – Agreement)
For this statistical test, most of the group respondents (PC01, PC02, PC03, PC04, PC05, and PC06) responded that the differences between the medians are not statistically significant except for PC01 group; it was found that one cause C31 with p-value of 0.029. In addition, PC02 group we found that no causes are statistically significant. Although, for PC03 group note that only one type C12, C11, C19, C20, C30, C14 and C10 are statistically significant with p-value equals 0.006, 0.009, 0.021, 0.024, 0.026, 0.026 and 0.027 respectively. For PC04 group C04, C06, C08, C10, C14, C07, C12, C29, C11, C17, C20, C25, C13, C28, C24, C03, C27 and C2 are statistically significant with p-value =0.00, 0.00, 0.001, 0.003, 0.005, 0.005, 0.005, 0.010, 0.011, 0.019, 0.021, 0.027, 0.027, 0.039, 0.041, 0.044, 0.048, 0.050 respectively. Too, PC05 group C06, C05, C12, C03, C11, C25, C09 and C29 are statistically significant with p-value =0.002, 0.003, 0.004, 0.011, 0.015, 0.023, 0.025 and 0.042 respectively. Finally, PC06 group C27, C24, C29, C25, C17, C14, C13, C03, C06, C16, C02, C20, C28, C18, C11, C09, C30, C19 are statistically significant with p-value lower than 0.05. It is clear that the most of causes of variations and claims in terms of agreement have no differences between the group respondents’ medians which were not statistically significant as shown in Table 10.
1.1. Kruskal Wallis Test (Cause of Variations and Claims – Significance)
Similarly, most of the group respondents (PC01, PC02, PC03, PC04, PC05, PC06) responded that the differences between the medians are not statistically significant except for PC01 group we found that causes C29, C20, C12, C03, C01, C07, C23, C15, C28, C05, C11, C18 and C09 with p-value of 0.001, 0.004, 0.009, 0.011, 0.012, 0.012, 0.019, 0.025, 0.031, 0.0310, 035, 0.037 and 0.046 respectively. In addition, PC02 group has no causes are statistically significant. Although, for PC03 group have three types C04, C10 and C20 are statistically significant with p-value =0.025, 0.039, and 0.043 respectively. As well PC04 group has three causes C04, C11 and C18 are statistically significant with p-value =0.014, 0.020 and 0.039 respectively. Too, PC05 group C20, C15, C21, C10, C05, C01, C29, C16 and C29 are statistically significant with p-value =0.003, 0.006, 0.009, 0.009, 0.012, 0.013, 0.027, 0.027 and 0.048 respectively. Finally, for PC06 group; C17, C15, C05, C07, C10, C19, C21, C16, C08, C24, C13, C06 and C29 are statistically significant with p-value lower than 0.05. It is clear that most of the causes of variations and claims in terms of significance have no differences between the group respondents’ medians which are not statistically significant, Table 11.
1.1. Kruskal Wallis Test (Cause of Variations and Claims – Avoid-ability)
Similarly, most of the group respondents (PC01, PC02, PC03, PC04, PC05 and PC06) responded that the differences between the medians are not statistically significant except for PC01 group; it was found that three causes C06, C08 and C21 with p-value of 0.011, 0.017 and 0.034 respectively. In addition, PC02 group has no causes statistically significant. Although, for PC03 group have three types C09, C30 and C10 are statistically significant with p-value =0.010, 0.036, and 0.044 respectively. As well PC04 group has three causes; C06, C13 and C02 are statistically significant with p-value =0.020, 0.029 and 0.032 respectively. But, PC05 group has no statistically significant causes. Finally, PC06 group has one statistically significant cause C13 with p-value lower than 0.05 which = 0.008. It is clear that the most causes of variations and claims in terms of avoid-ability have no differences between the group respondents’ medians which were not statistically significant, Table 12.
1.1. Spearman’s Correlation Test
The next step was to measure the correlation between the top ten frequented types and top ten significant causes to summarize the strength of relationship between each variable of the two groups. As known that the relationship appears in 3 phases; first phase was that (- r < 0); it means that There is a negative relationship between the two variables. Second phase is that (+ r > 0) which means that there is a positive relationship between the two variables. Third phase is that (r = 0) which means that there is no relationship between the two variables.
To understand spearman correlation coefficient, if the correlation coefficient value (r) = 0 that means no relationship between variables. While if the correlation coefficient value (0.0 < r < 0.25) that indicated a weak positive relationship. For the correlation coefficient value (0.25 ≤ r < 0.75) that indicated an average positive relationship. But if the correlation coefficient value (0.75 ≤ r < 1) that means there was a strong positive relationship. While if the correlation coefficient value equals 1(r = 1) means that the relationship is complete positive relationship.
Regarding the correlation hypothesis if r = 0 there is no relation between the two variables and accepting the zero hypothesis (H0), but if r not equal to 0 there is a relation between the two variables and rejecting the zero hypothesis (H0) and accept the alternative hypothesis (H1).While if sig. > 0.05 then accepting the zero hypothesis (H0), but if sig. < 0.05 the zero hypothesis (H0) will be refused.
1.1.1. Spearman’s Correlation Test (Types-Frequency) & (Causes -Significance)
For this statistical test, the correlation between the most frequented types and the most significant causes was conducted by spearman’s test. In Table 13, it was appearing that there is a highly positive correlation denoted by red color, related to the p-value. And also those denoted by the green color revealed the correlation relationship between significant causes; C21, C10, C05 and frequent types T16, T23, T38 and T31. While it was lower than 0.05 so, the H0 hypothesis was not accept and accepting the H1 hypothesis alternatively. Similarly, for significant causes C15, C16, C17 had a correlation relationship with frequented types T16, T23, T31.Also significant cause C19 has a correlation with frequent types T16, T23, T45 and T31. In addition, the significant cause C20 had a correlation relationship with frequent types T16, T23, T38 and T31. The same for significant cause C01 had a correlation relationship with frequent types T16, T38, T31, T07 and T09 .Finally, significant cause C06 had a correlation relationship with frequent types T16, T23, T38, T31, T34 and T10. For the correlation hypothesis while significance is lower than 0.05 to reject the H0 zero hypotheses and accept the H1 alternative hypothesis, Table 13.
1.1.1. Spearman’s Correlation Test (Types-Impact) & (Causes -Significance)
Similarly, the correlation between the most impacted types and significant causes was investigated by spearman’s test. It is appearing that there is a highly positive correlation for mentioned correlation coefficient by red color, related to p-value (sig.). The green color reveals that there was a correlation relationship between significant causes C21, C16, C17, C20, C01 and Impacted types T39, T47, T16, T41, T27, T38, T33, T23, T26 while it is lower than 0.05. Therefore, rejecting the H0 and accept the H1 hypothesis alternatively. Similarly, for significant cause C10 which had a correlation relationship with Impacted types T39, T47, T16, T41, T27, T38, T33 and T26. Also, significant causes C05, C15 have a correlation relationship with impacted types T39, T47, T16, T41, T27, T38, T33, T23, T26 and T48. In addition, the significant cause C19 had a correlation relationship with Impacted types T39, T47, T16, T41,T27,T38,T33,T26,T48.Finally for significant cause C06 has a correlation relationship with Impacted types T39, T47, T16, T41, T27, T38, T33 and T26. For the correlation hypothesis, while significance was lower than 0.05, we will not accept the H0 zero hypothesis and accept the H1 alternative hypothesis, Table 14.
1.1.1. Spearman’s Correlation Test (Types-Frequency) & (Causes –Avoid-ability)
Similarly, there was a highly positive correlation for mentioned correlation coefficients by red color, related to p-value (significant) which had green color revealing a correlation relationship between avoidable cause C10 and frequent types T23, T38. Also, for avoidable cause C13 which had a correlation relationship with frequented types T38, T45, T31. Also avoidable cause C06 had a correlation with frequented types T16, T23, T38, and T31. In addition, the avoidable cause C05 had a correlation with frequented types T16, T31, T09. Moreover, for avoidable causes C01, C04 and C09 have a correlation with frequented type T09. On the other hand, the avoidable cause C05 had a correlation with frequent types T38, T09. However the avoidable cause C02 had a correlation relationship with frequented types T38, T07, T09 and T10. Meanwhile, the avoidable cause C07 had no correlation with any frequent types. Finally the avoidable cause C08 had a correlation with frequent types T38, T09, T45 and T10. For the correlation hypothesis while significance was lower than 0.05 to exclude the H0 zero hypotheses and accept the H1 alternative hypothesis, Table 15.
1.1.1. Spearman’s Correlation Test (Types-Impact) & (Causes –Avoid-ability)
In Table 16, the correlation between the most impacted types and the most avoidable causes by spearman’s test was investigated. It is appearing that there was highly positive correlation for denoted by red color, related to p-value (sig.) which has green color reveals that there is a correlation relationship between avoidable cause C10 and impacted types T47, T16, T41, T27 while significant was lower than 0.05 , so we will not accept the H0 and accept the H1 alternative hypothesis. For avoidable cause C13 which had a correlation with impacted types T47, T41, T27 and T38. Also avoidable cause C06 had a correlation with impacted types T39, T47, T18, T41, T27, T38, T33 and T26. In addition, avoidable cause C05 had a correlation with impact types T39, T47, T16, T27, T38, T33 and T26.
Moreover, for avoidable causes C01, it had a correlation with impacted types T47 and T33.On the other hand, the avoidable cause C24 had a correlation with impacted types T47, T27, T38, T33, T23, T26 and T48. However, the avoidable cause C02 had a correlation with impacted types T41, T27, T38, T33 and T26 .In contrast, the avoidable cause C04 and C09 have no correlation with any impacted types. And, the avoidable cause C08 had a correlation with impacted types T47, T16, T27, T38, T33, T26 and T48. Finally, the avoidable cause C07 had a correlation with impacted type T33. For the correlation hypothesis while significance was lower than 0.05 we will not accept the H0 zero hypothesis and accept the H1 alternative hypothesis.
1.1. Overall Questionnaire Participant’s Assessment
Respondents were asked to score the questionnaire's overall coverage in this area, as well as the variables under each section. Additionally, to provide any other remarks on the parts of the variable and any related issues. Table 17 presents respondents’ responses regarding the types of variations and claims and its significance, where, 94.1 % of the clients think that the common types of variations and claims are significant, for the consultants 88.4 % think that it was significant and 93.8% for the contractors.
Table 18 presents respondents’ responses regarding the causes of variations and claims and its significance, where 88.2 % of the clients think that the common types of variations and claims are significant, for the consultants 95.3 % think that it was significant; finally for the contractors 93.8 think that it was significant.
Table 19 presents respondents’ responses regarding The Questionnaire; will questions help managers to predict the significance of types & causes of variations and claims? Where, 94.1 % of the clients think that The survey questions will help managers to predict the significance types & causes of variations and claims, For the consultants 83.7 % think that it will help, finally for the contractors 93.8 think that it will help positively.
The responses to the questionnaire, which is shown in Table 20 below, will assist managers in forecasting and suggesting tactics to prevent or lessen variations and claims. Whereas 76.5% of clients believe that managers would be able to anticipate and provide ways to prevent or lessen variations and claims, Seventy-nine percent of consultants believe it will be helpful, and eighty-seven percent of contractors believe it will be beneficial.
1.1. K-means Analysis
Having explored the various factors influencing variations and claims in construction contracts through initial statistical methods, it’s now the turn to a more nuanced analysis. In this section, we delve into the K-means clustering algorithm, a pivotal tool in data analytics, renowned for its simplicity and efficiency. This method is particularly valuable for the study as it complements the Spearman’s Correlation and Kruskal Wallis tests previously discussed, offering a unique perspective in understanding the dynamics of factors influencing variations and claims in construction contracts. The delineation of clusters representing groups of causes sharing similar characteristics provides a structured and nuanced understanding of the diverse factors contributing to claims, enabling stakeholders to prioritize and address them more effectively.
As per (Ostrovsky, R., and et.al. 2013) K-means clustering stands as a widely embraced and substantiated technique in clustering. It operates on a centroid-oriented principle, aiming to allocate objects into a predefined set of clusters by optimizing the centroids' positions, such as minimizing squared distances to these centroids.
To determine the appropriate number of clusters (k), various methodologies such as the Hubert statistic, Davies Bouldin index, Dunn index, score function, elbow plot, and silhouette plot have been devised (Pai, S. G. and et.al. (2021). In this study, the elbow plot method, known for its reliability, Yuan, C., & Yang, H. (2019), was employed for cluster count determination.
The k-means clustering utilized in this study was instantiated through the programming language Python, widely recognized within the realms of scientific computing, engineering, data science, and machine learning due to its pervasive adoption and robust functionality. The k-means algorithm is characterized by a sequential execution involving three primary steps: initial centroid establishment for cluster initialization, assignment of data points to their closest centroids, and subsequent recalibration of centroids based on updated assignments, accompanied by the computation of discrepancies between the new and former centroids. This iterative process continues until centroid movements reach a level of insignificance below a predetermined threshold, thus signaling convergence,
The primary aim of the k-means algorithm is to minimize cluster inertia or the within-cluster sum-of-squares criterion, as delineated by Equation 3, wherein represents samples and stands for the mean of samples within each cluster. The determination of the suitable number of clusters is validated through the elbow plot, displaying distortion scores for selected number of clusters as per Equation 3. The "elbow" point designates the cluster count at which further additions do not lead to a significant reduction in WCSS. Notably, in this analysis, the optimal number of clusters was identified as four, evident in Figure 5.
The k-means clustering analysis, applied to assess the causes of claims and variations in FIDIC 1999 contracts, effectively categorized these factors into four distinct clusters. Each cluster represents a unique combination of 'Frequency' and 'Impact', revealing the multifaceted nature of the causes influencing project outcomes. This robust statistical approach transcends conventional categorization methods, unveiling intricate relationships and associations between these factors.
Cluster 0 - Selective High Impact Causes: Includes causes T45, T40, T35, T25, and T24. This cluster is characterized by a significant impact with fewer occurrences, demanding focused attention due to their potential substantial effect on projects.
Cluster 1 - Diverse Low Impact Causes: With 17 causes (T1, T49, T44, T42, T41, T27, T50, T20, T18, T26, T51, T6, T5, T4, T3, T15, T14), this cluster represents varied and numerous issues of lower individual impact but requiring broad management strategies due to their collective presence.
Cluster 2 - Frequent Mid Impact Causes: The largest cluster with 26 causes (T47, T48, T34, T2, T7, T39, T38, T37, T8, T46, T43, T33, T31, T17, T19, T13, T21, T22, T32, T12, T10, T9, T28, T29, T30, T11), posing a consistent challenge and requiring regular monitoring.
Cluster 3 - Critical High Impact and High Frequency Causes: Comprising T23, T36, and T16, these issues are both high in impact and frequency, pivotal in the project lifecycle and necessitating strategic management.
Conclusions
The presented interim results and conclusions in the research were derived from observations and analysis of the detailed data collected from designed questionnaire with 80 experts who were intensively involved in variations and claims management. Hence, recommended strategies to project managers on methods to mitigate the avoidable causes of variations and claims as the last stage of research will be shown below.
1.1. Frequent Types of Variations and Claims:
Using the types and causes RII applied in this research, for construction industry workers. 51 types of variations and claims have been identified in section 1-part 2 based on a questionnaire survey of 80 respondents. These 51 significant types have been ranked as per respondent’s perception; the top frequented ten types which are frequent and severe. Thus, these types require managerial attention and focus, in order to avoid their frequencies, consequently, providing positive benefits in managing construction projects, Table 22 and Table 23.
1.1. Concluding Remarks
Based on the presented results, it is recommended that special consideration should be given to contract clauses dealing with such issues. The best way to cope with risk of construction variations and claims is to reduce or avoid them altogether. There are certain fundamental ways and methods of reducing the number of encountered variations and claims, Table 24. The essential steps a client can take to minimize risks and deal with the abovementioned identified causes are to:
- Contract in terms of a standard Form, not a bespoke contract, to mitigate and avoid claims, such as- but not limited- FIDIC FORMS, while it helps contracts parties to have balanced rights and clear procedures for any variations and claims.
- Allow reasonable time for producing clear and complete drawings and specifications by the design team;
- Implement constructability review during the various stages of the project.
- Develop proper procedures for processing and evaluating variations.
- Develop proper procedures for processing and evaluating claims.
- The use of Critical Path Method (CPM) scheduling, cost control, and productivity analysis to control and monitor progress and productivity.
However, there is no guarantee that variations and claims can be avoided entirely. Avoiding variations and claims requires understanding their causes, understanding contractual terms and obligations, and early and continued communication. Therefore, it is expected that the findings of this research will assist all parties to a contract to reduce liability by resolving variations and claims through reference to existing records of fact and clear interpretation of contract terms. It will also help them avoid the main causes of variations and claims and; hence, minimize delays and cost overruns in construction projects. The author believes the suggested comments are essential for proper project management, which is far more advantageous and profitable than seeking advice of a construction claim consultants after the dispute is entrenched. The latter course often takes place too late and is too costly.
Declarations
6.1. Author Contributions
Conceptualization, Ahmed Mohamed Abdelalim; Data curation, Ahmed Mohamed Abdelalim, Mohammed Ramadan , AlJawharah A.AL Nasser and Mohamed Tantawy ; Formal analysis, Ahmed Mohamed Abdelalim, Mohammed Ramadan , AlJawharah A.AL Nasser and Mohamed Tantawy ; Funding acquisition, AlJawharah A.AL Nasser, Ahmed Mohammed Abdelalim ; Investigation, Ahmed Mohamed Abdelalim, Mohammed Ramadan , AlJawharah A.AL Nasser and Mohamed Tantawy ; Methodology, Ahmed Mohamed Abdelalim, Mohammed Ramadan , AlJawharah A.AL Nasser and Mohamed Tantawy ; Project administration, Ahmed Mohamed Abdelalim; Resources, Ahmed Mohamed Abdelalim, Mohammed Ramadan and AlJawharah A.AL Nasser ; Software, Ahmed Mohamed Abdelalim, Mohammed Ramadan and Mohamed Tantawy ; Supervision, Ahmed Mohamed Abdelalim; Validation, Ahmed Mohamed Abdelalim, Mohammed Ramadan , AlJawharah A.AL Nasser , Rawan Alwahaibi and Mohamed Tantawy ; Visualization, Ahmed Mohamed Abdelalim and Mohamed Tantawy ; Writing – original draft, Ahmed Mohamed Abdelalim and Mohammed Ramadan ; Writing – review & editing, Ahmed Mohamed Abdelalim, AlJawharah A.AL Nasser and Mohamed Tantawy .. All authors have read and agreed to the published version of the manuscript.
6.1. Data Availability Statement
The data presented in this study are available on request from the corresponding author.
6.1. Funding
The authors extend their appreciation to the Researchers Supporting Project number (RSPD2024R590), King Saud University, Riyadh, Saudi Arabia.
6.1. Conflicts of Interest:
The authors declare no conflict of interest.
References
- Abd El-Hamid, S.M, Farag, S., Abdelalim, A.M., 2023, “Construction Contracts’ Pricing according to Contractual Provisions and Risk Allocation”, International Journal of Civil and Structural Engineering Research ISSN 2348-7607, Vol.11, Issue.1, pp.11-38. [CrossRef]
- El-Karim, M.S.B.A.A.; El Nawawy, O.A.M.; Abdel-Alim, A.M. Identification and assessment of risk factors affecting construction projects. HBRC J. 2017, 13, 202–216. [Google Scholar] [CrossRef]
- Abdelalim, A.M. and Said, S.O.M., 2021, “Dynamic Labour Tracking System in Construction Project Using BIM Technology”, International Journal of Civil and Structural Engineering Research ISSN 2348-7607 (Online) Vol. 9, Issue 1, pp.: 10-20.
- Abdelalim, A.M. , 2018, “IRVQM, Integrated Approach for Risk, Value and Quality Management in Construction Projects; Methodology and Practice”, the 2nd International Conference of Sustainable Construction and Project Management, Sustainable Infrastructure and Transportation for Future cities, ICSCPM-18, 16-18 December, 2018, Aswan, Egypt.
- Abdelalim, A. M. (2019). Risks Affecting the Delivery of Construction Projects in Egypt: Identifying, Assessing and Response. In Project Management and BIM for Sustainable Modern Cities: Proceedings of the 2nd GeoMEast International Congress and Exhibition on Sustainable Civil Infrastructures, Egypt 2018–The Official International Congress of the Soil-Structure Interaction Group in Egypt (SSIGE) (pp. 125-154). Springer International publishing. [CrossRef]
- Abdelalim, A.M. , El Nawawy, O.A. and Bassiony, M.S., 2016. ’Decision Supporting System for Risk Assessment in Construction Projects: AHP-Simulation Based. IPASJ International Journal of Computer Science (IIJCS), 4(5), pp.22-36. [CrossRef]
- Abdelalim, A.M. and Abo. Elsaud, Y., 2019. Integrating BIM-based simulation technique for sustainable building design. In Project Management and BIM for Sustainable Modern Cities: Proceedings of the 2nd GeoMEast International Congress and Exhibition on Sustainable Civil Infrastructures, Egypt 2018–The Official International Congress of the Soil-Structure Interaction Group in Egypt (SSIGE) (pp. 209-238). Springer International Publishing. [CrossRef]
- Abdelalim, A.M.; Elbeltagi, E.; Mekky, A. Factors affecting productivity and improvement in building construction sites. Int. J. Prod. Qual. Manag. 2019, 27, 464. [Google Scholar] [CrossRef]
- Abdelalim, A. M. , Khalil, E. B., & Saif, A. A. The Effect of Using the Value Engineering Approach in Enhancing the Role of Consulting Firms in the Construction Industry in Egypt. International Journal of Advanced Research in Science, Engineering and Technology, ISSN: 2350-0328 Vol. 8, Issue 2, pp. 16531-16539.
- Abdelalim, A. M. , & Eldesouky, M. A. (2021). Evaluating Contracting Companies According to Quality Management System Requirements in Construction Projects, International Journal of Engineering, Management and Humanities (IJEMH) Volume 2, Issue 3, pp. 158-169.
- Abd-Elhamed, A. , Amin, H. E., & Abdelalim, A. M. Integration of Design Optimality and Design Quality of RC buildings from the perspective of Value Engineering, 2020, International Journal of Civil and Structural Engineering Research ISSN 2348-7607 (Online) Vol. 8, Issue 1, pp.:105-116.
- Abdul-Malak, M., A. , El-Saadi, M., M. and Abou-Zeid, M., G., 2002. Process Model for Administrating Construction Claims. Journal of Management in Engineering, 18 (2), 84-94.
- Rizk Elimam, A. Y., Abdelkhalek, H.A, Abdelalim, A.M., 2022, “Project Risk Management during Construction Stage According to International contract (FIDIC)”, International Journal of Civil and Structural Engineering Research ISSN 2348-7607 (Online) Vol. 10, Issue 2, pp: (76-93), Month: October 2022 - March 2023, pp.76-93. [CrossRef]
- Amin Sherif, Abdelalim, A.M., 2023, “Delay Analysis Techniques and Claim Assessment in Construction Projects”, International Journal of Engineering, Management and Humanities (IJEMH), Vol.10, Issue.2, 316-325. [CrossRef]
- Amr Afifi, El-Samadony, A and Abdelalim, A.M., 2020, “A Proposed Methodology for Managing Risks in Construction Industry in EGYPT”, International Journal of Civil and Structural Engineering Research ISSN 2348-7607 (Online) Vol. 8, Issue 1, pp.: 63-78.
- Mohamed, N.A.; Abdel-Alim, A.M.; Ghith, H.H.; Sherif, A.G. Assessment and Prediction Planning of R.C Structures Using BIM Technology. Eng. Res. J. 2020, 167, 394–403. [Google Scholar] [CrossRef]
- Amr Afifi, El-Samadony, A and Abdelalim, A.M., 2020, “Risk Response Planning for Top Risks Affecting Schedule and Cost of Mega Construction Projects in Egypt”, International Journal of Civil and Structural Engineering Research ISSN 2348-7607 (Online) Vol. 8, Issue 1, pp.: 79-93.
- Yuan, C.; Yang, H. Research on K-Value Selection Method of K-Means Clustering Algorithm. J. 2019, 2, 226–235. [Google Scholar] [CrossRef]
- El-Samadony, A. And Abdelalim, A.M. and Alaa Al-Harouny, 2016, “Risk Assessment and Mitigation for Construction Projects in Egypt”, the 1st International Conference of Sustainable Construction and Project Management, ICSCPM-16, 29-31March, 2016, Cairo, Egypt.
- FIDIC, 1999, ISBN 2-88432-022-9. Conditions of Contract for Construction for Building and Engineering Works Designed by the Employer.
- Hassanen, M. A. H. & Abdelalim, A. M. (2022). Risk Identification and Assessment of Mega Industrial Projects in Egypt. International Journal of Management and Commerce Innovation (IJMCI), 10(1), 187-199. [CrossRef]
- Hassanen, M. A. H. , & Abdelalim, A. M., 2022, A Proposed Approach for a Balanced Construction Contract for Mega Industrial Projects in Egypt, International Journal of Management and Commerce Innovations ISSN 2348-7585, Vol.10, Issue.1, pp: 217-229. [CrossRef]
- Ho, S.P.; Liu, L.Y. ; Analytical Model for Analyzing Construction Claims and Opportunistic Bidding. J. Constr. Eng. Manag. 2004, 130, 94–104. [Google Scholar] [CrossRef]
- Abdelalim, A.M.; Sherif, A.; Abdelalkhaleq, H. Criteria of selecting appropriate Delay Analysis Methods (DAM) for mega construction projects. J. Eng. Manag. Competitiveness 2023, 13, 79–93. [Google Scholar] [CrossRef]
- Khedr, R. and Abdelalim, A.M., 2021, “Predictors for the Success and Survival of Construction Firms in Egypt”, International Journal of Management and Commerce Innovations ISSN 2348-7585 (Online), Vol. 9, Issue 2, pp.: (192-201).
- Khedr, R. and Abdelalim, A.M., 2021, “The Impact of Strategic Management on Projects Performance of Construction Firms in Egypt”, International Journal of Management and Commerce Innovations ISSN 2348-7585 (Online) Vol. 9, Issue 2, pp.: (202-211).
- Kumaraswamy, M., M. , 1997. Conflicts, Claims and Disputes in Construction Engineering, Construction and Architectural Management, 4 (2), 95-111.
- Medhat, W. Abdelkhalek, H., & Abdelalim, A. M. (2023). A Comparative Study of the International Construction Contract (FIDIC Red Book 1999) and the Domestic Contract in Egypt (the Administrative Law 182 for the year 2018). [CrossRef]
- Ostrovsky, R.; Rabani, Y.; Schulman, L.J.; Swamy, C. The effectiveness of lloyd-type methods for the k-means problem. J. ACM 2012, 59, 1–22. [Google Scholar] [CrossRef]
- Pai, S.G.S.; Sanayei, M.; Smith, I.F.C. Model-Class Selection Using Clustering and Classification for Structural Identification and Prediction. J. Comput. Civ. Eng. 2021, 35, 04020051. [Google Scholar] [CrossRef]
- Van Eck, N. , & Waltman, L. (2010). Software survey: VOS-viewer, a computer program for bibliometric mapping. Scientometrics, 84(2), 523-538.
- Yousri, E.; Sayed, A.E.B.; Farag, M.A.M.; Abdelalim, A.M. Risk Identification of Building Construction Projects in Egypt. Buildings 2023, 13, 1084. [Google Scholar] [CrossRef]
Figure 1.
Research Methodology.
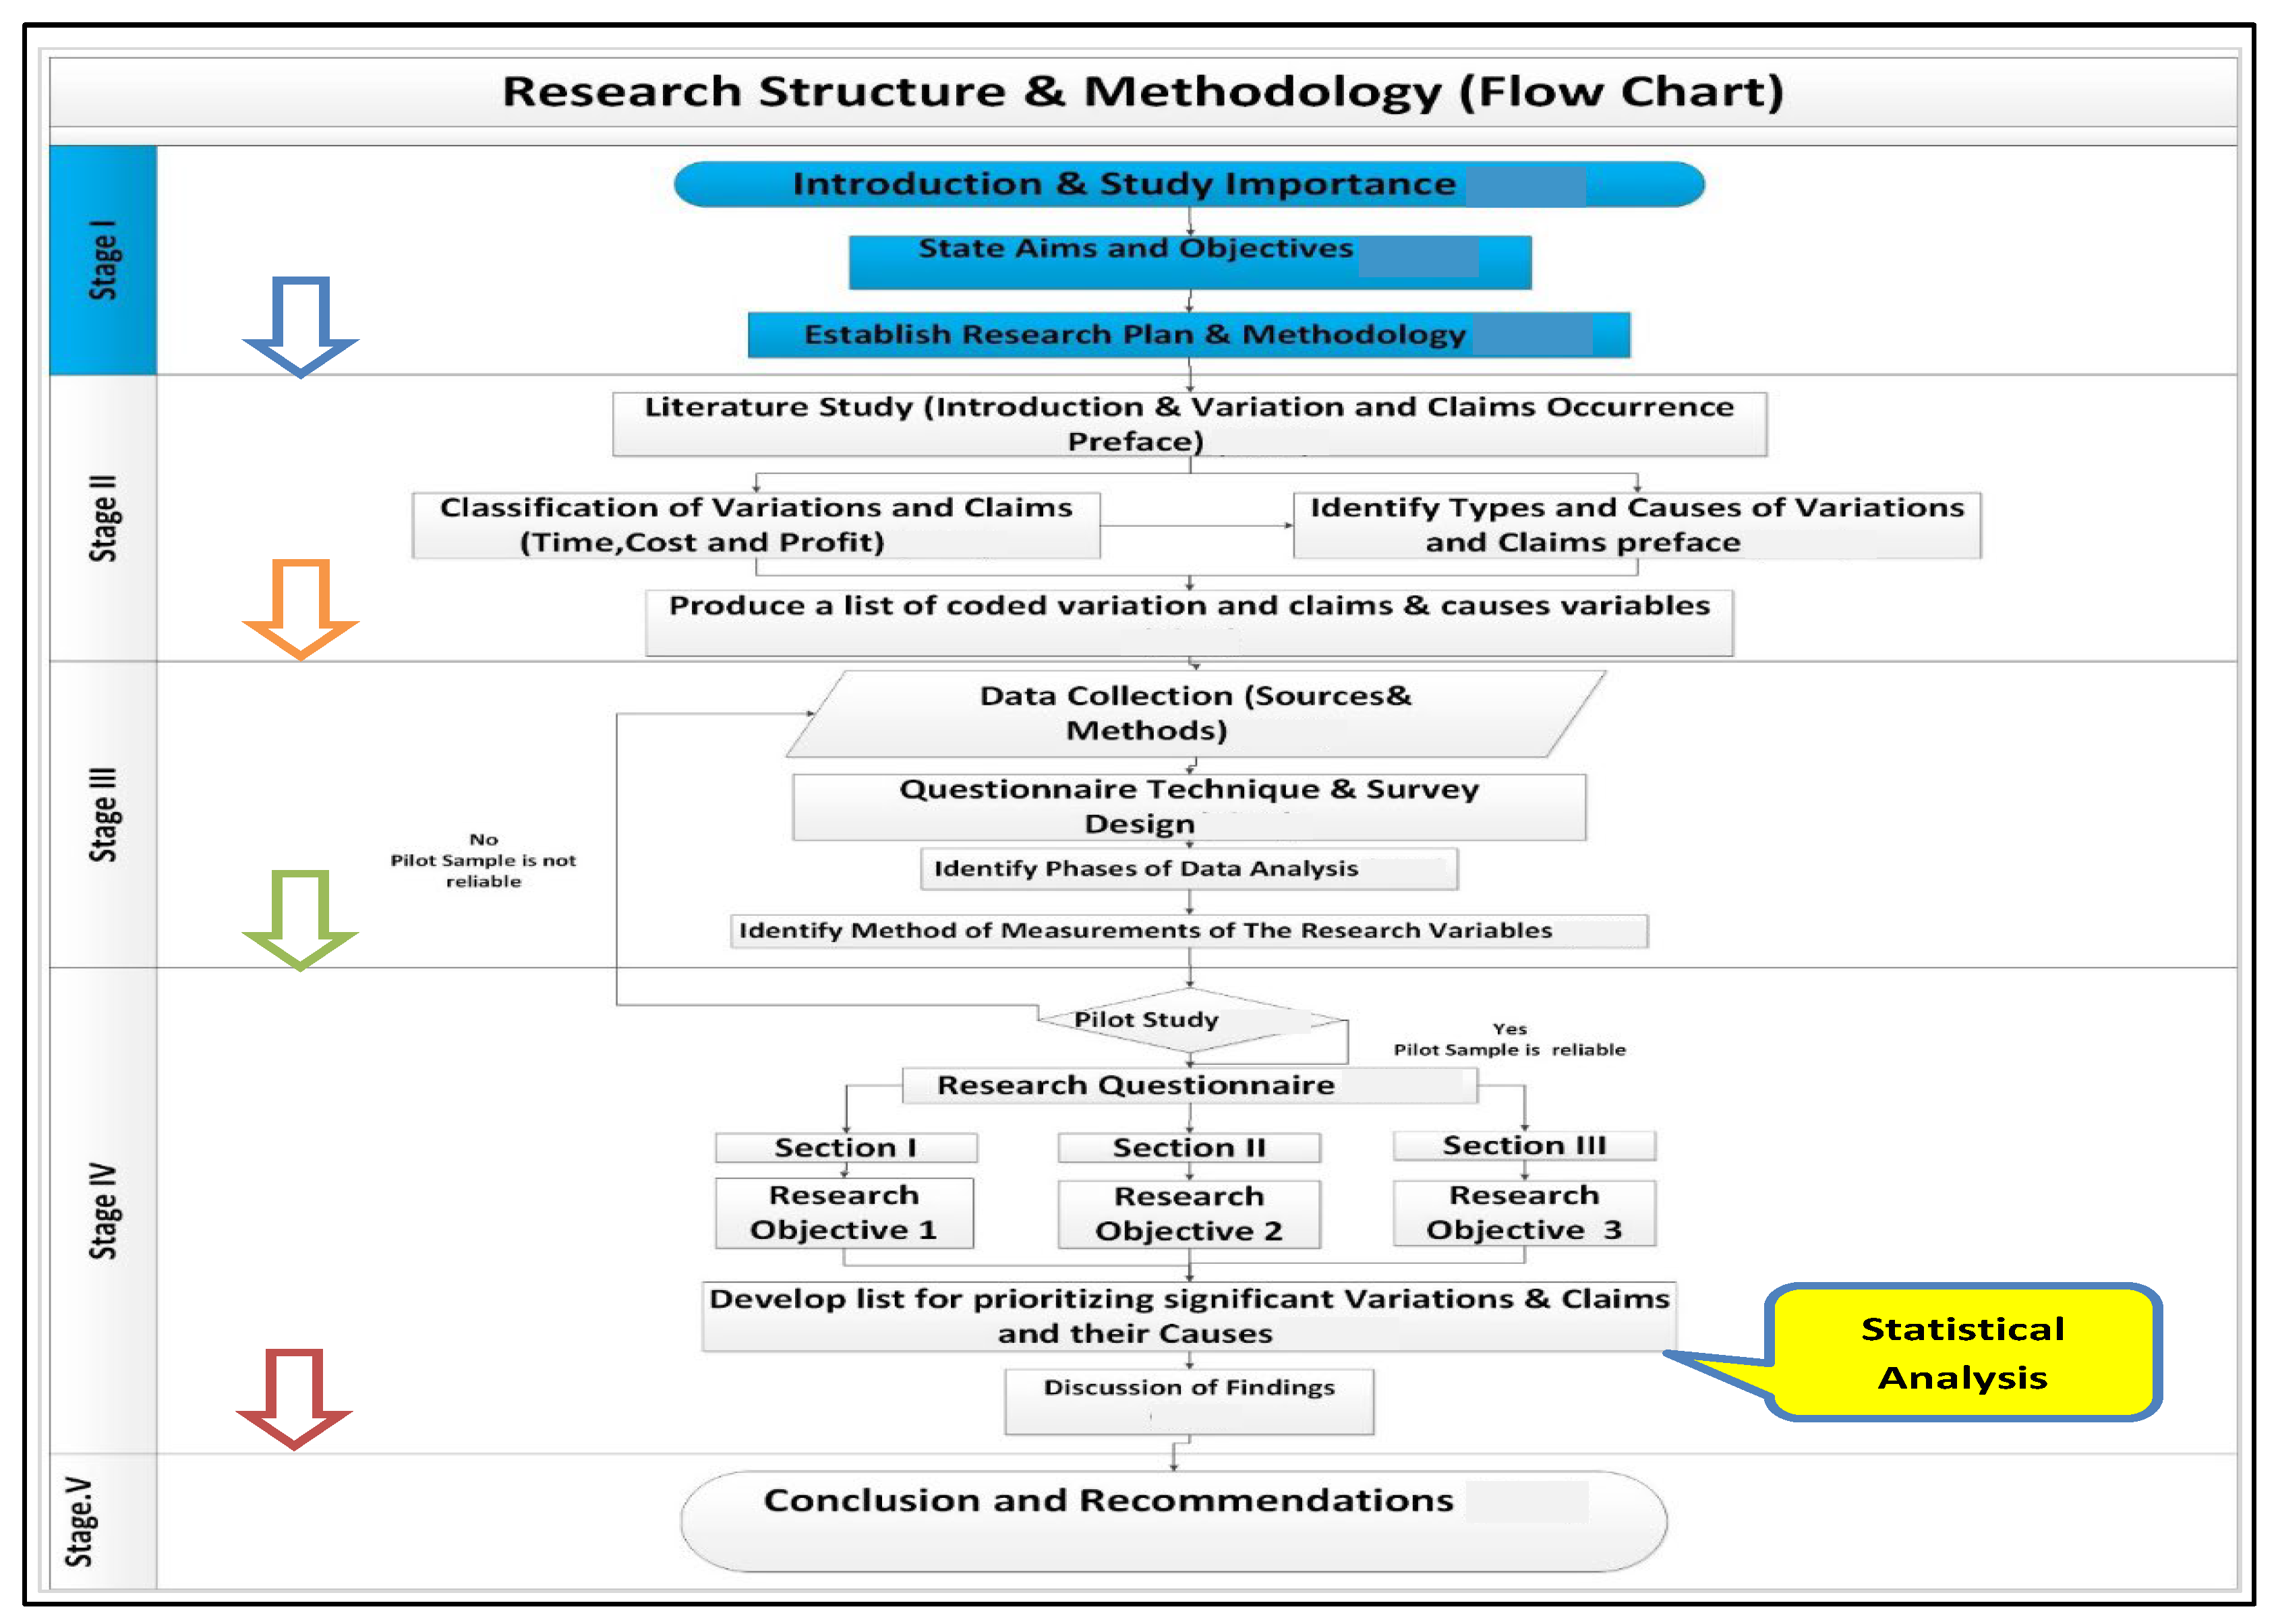
Figure 2.
Co-occurrence of the top keywords.
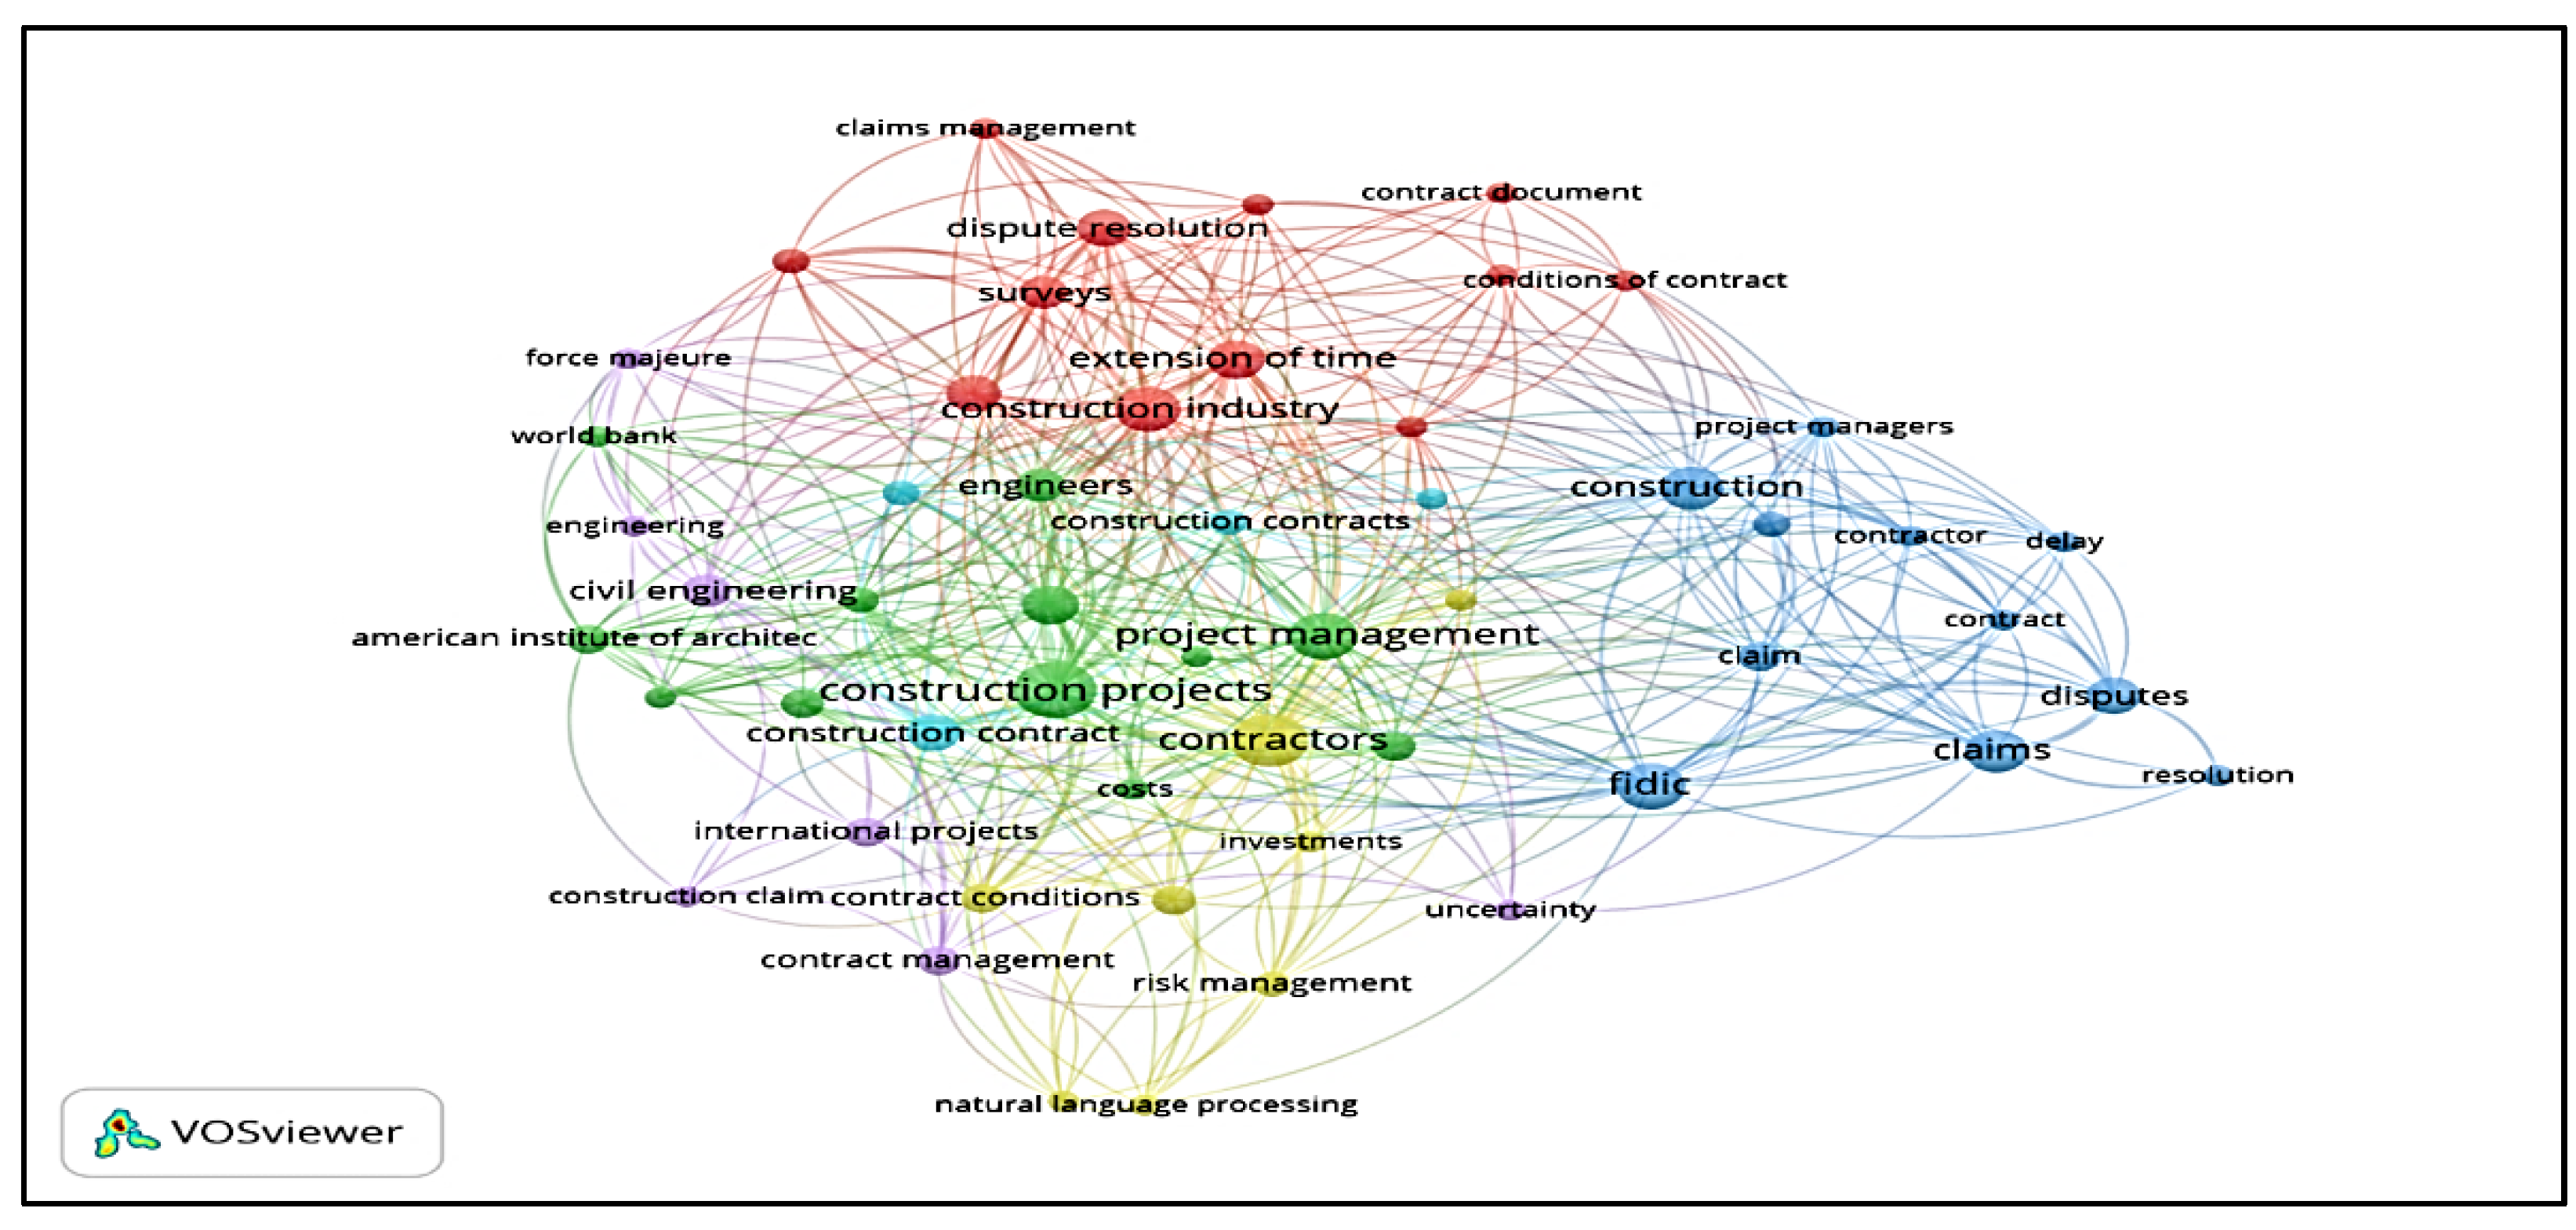
Figure 3.
Respondent's Profile (Groups PC01, PC02, PC03).
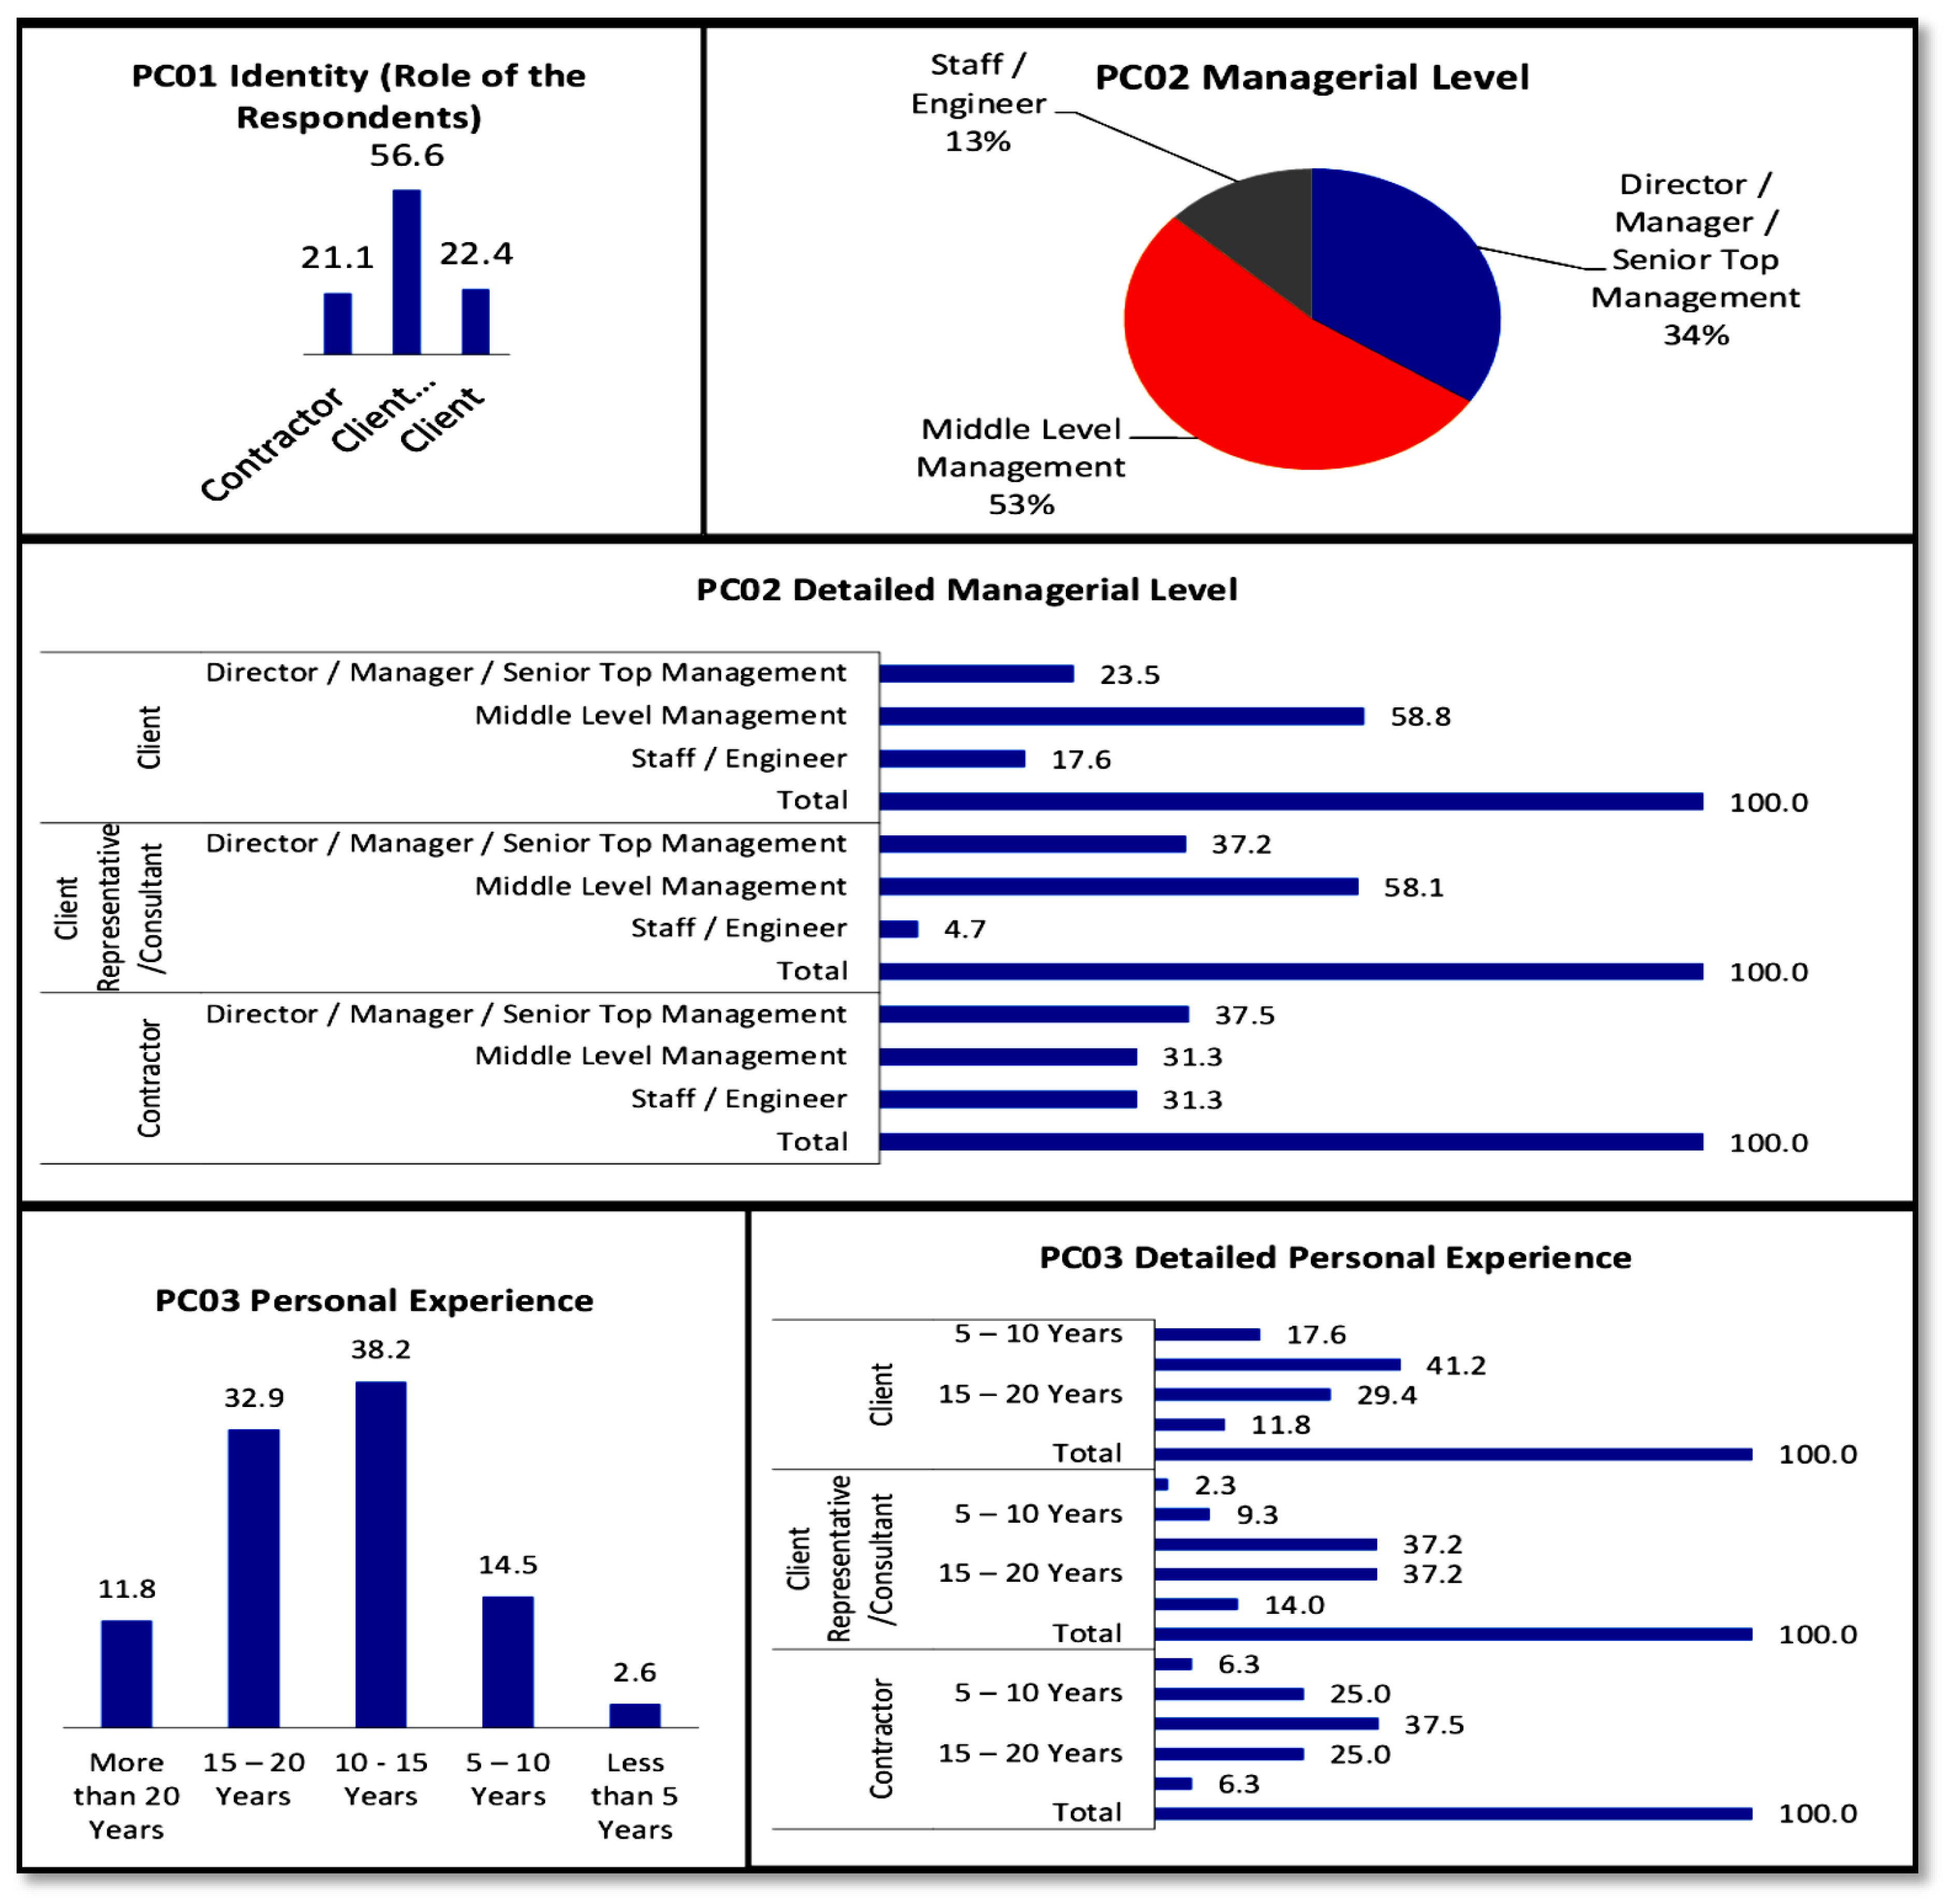
Figure 4.
Respondent's Profile (Groups PC04, PC05, PC06).
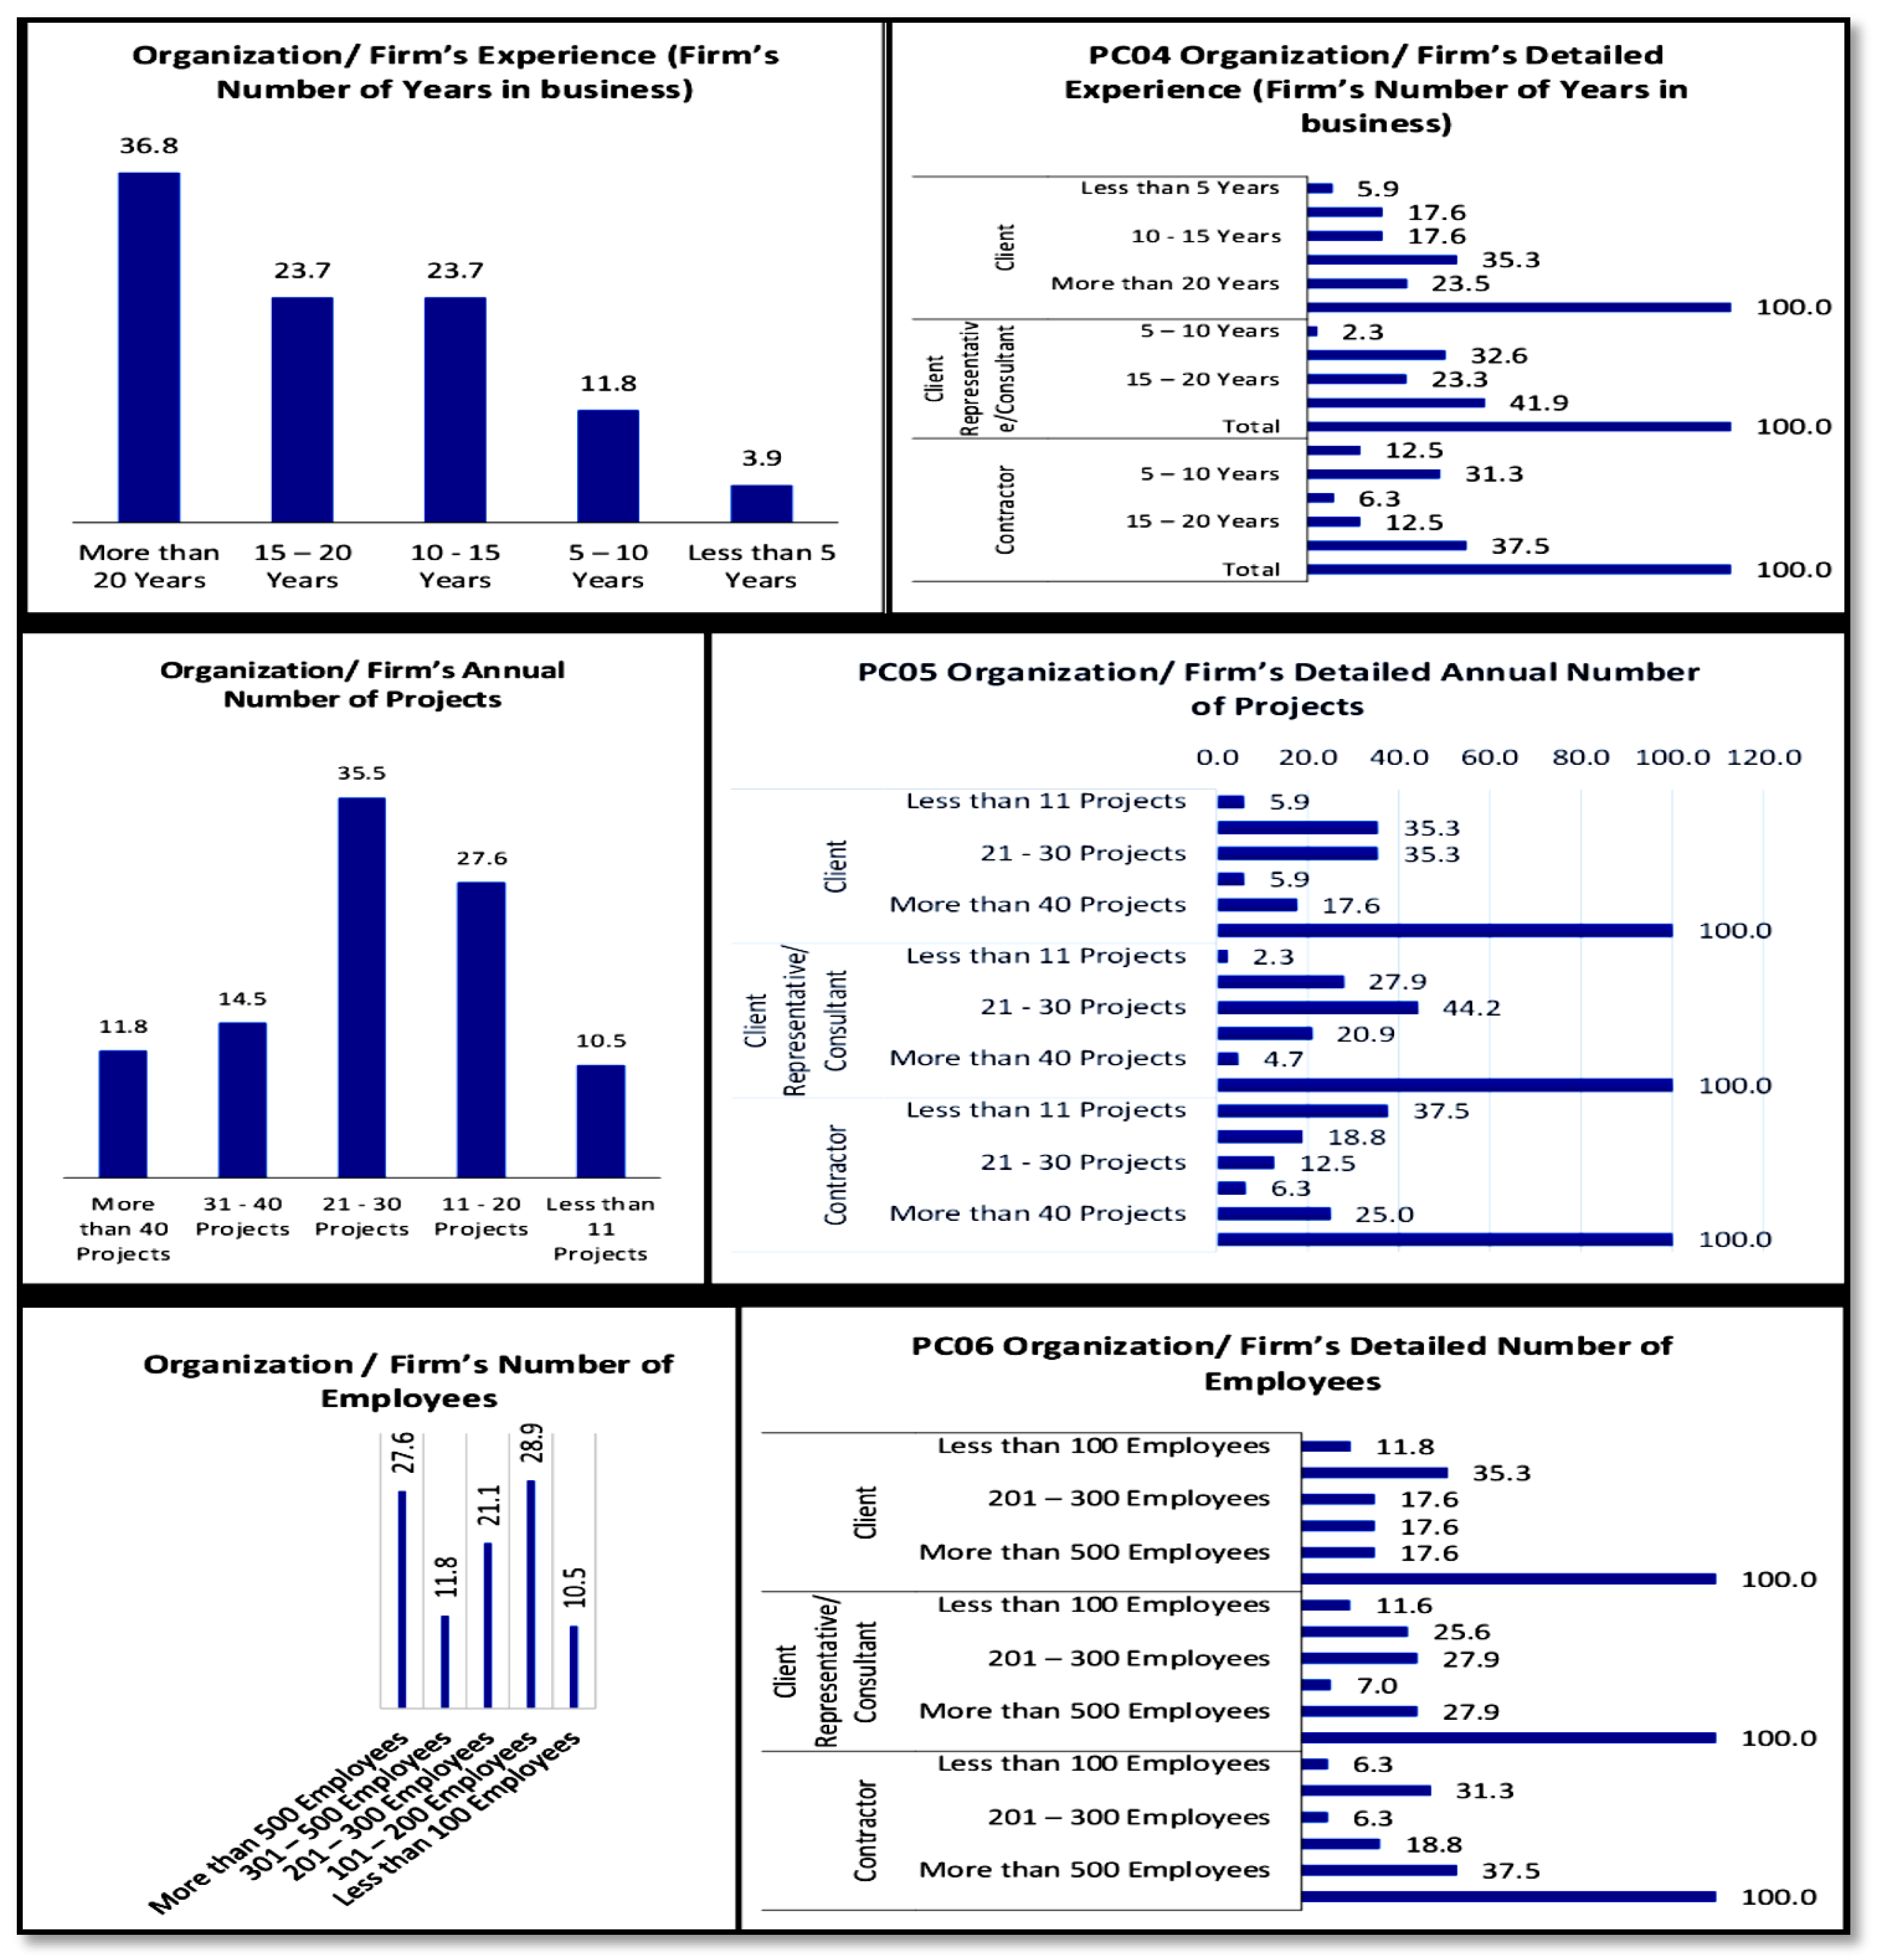
Figure 5.
Elbow Plot for the Distortion Score for the Number of Clusters.
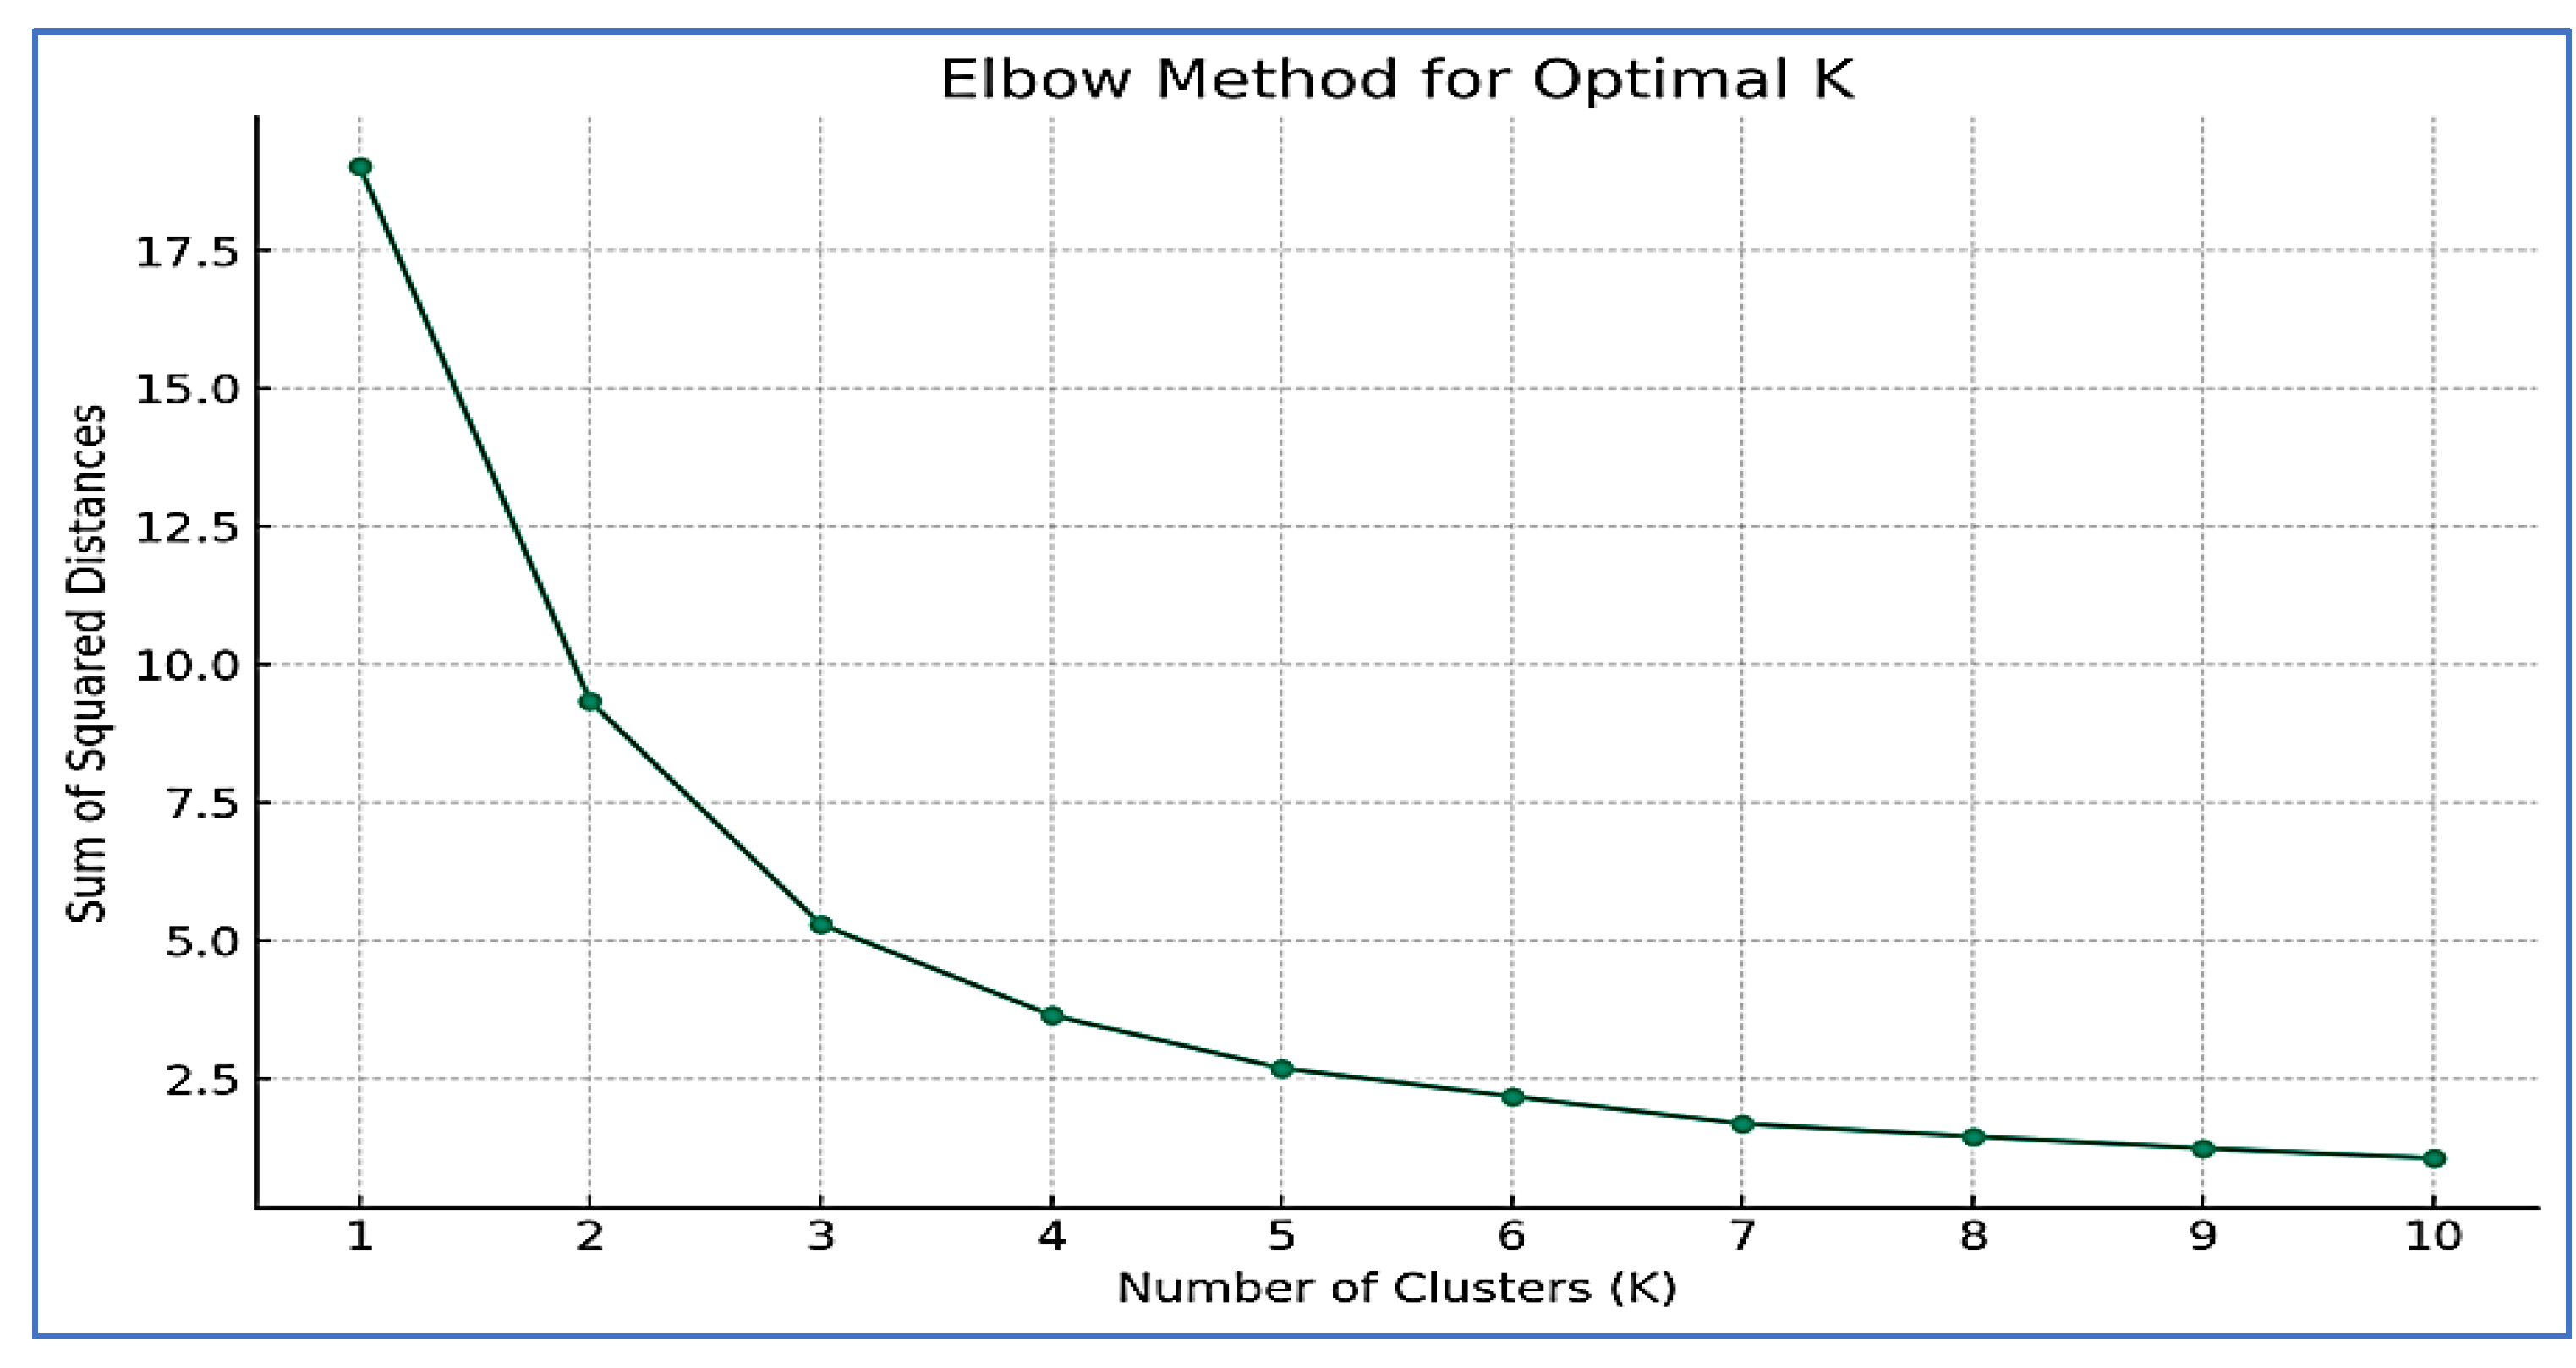
Figure 6.
K-Means Clustering for Causes of Claims.
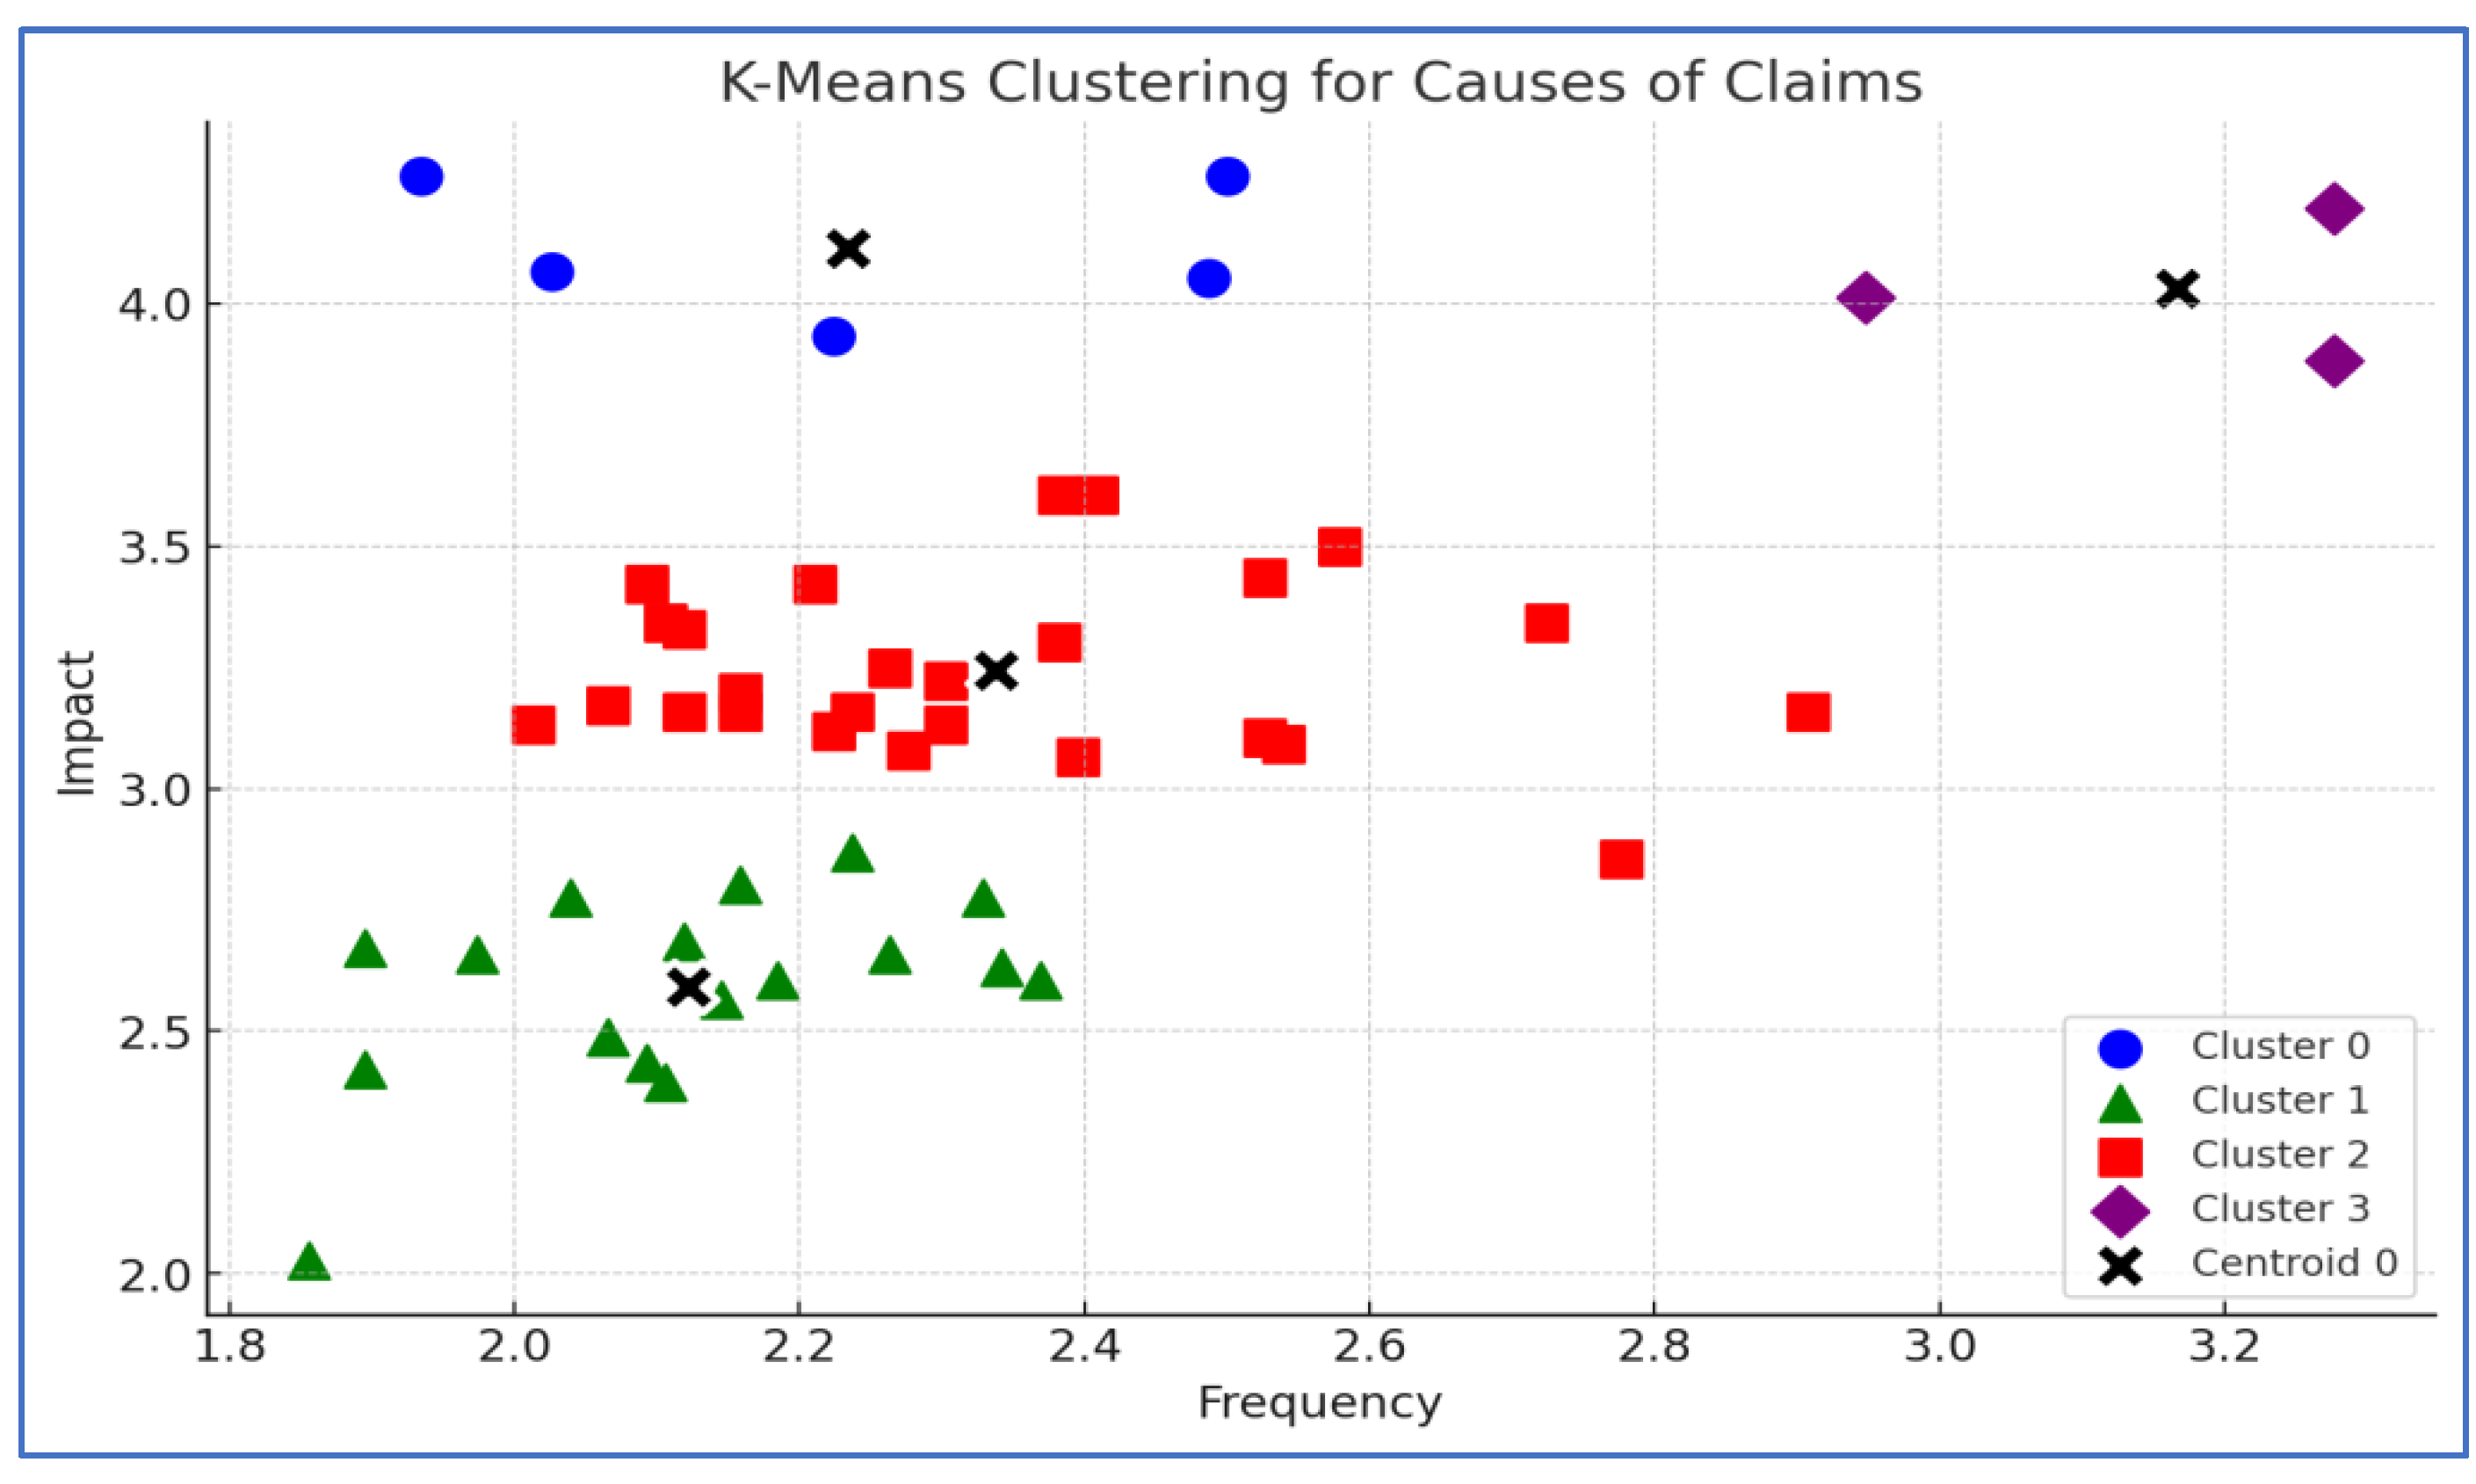
Figure 7.
Assigned Causes of Claims for the Four Analyzed K-Means Clusters.
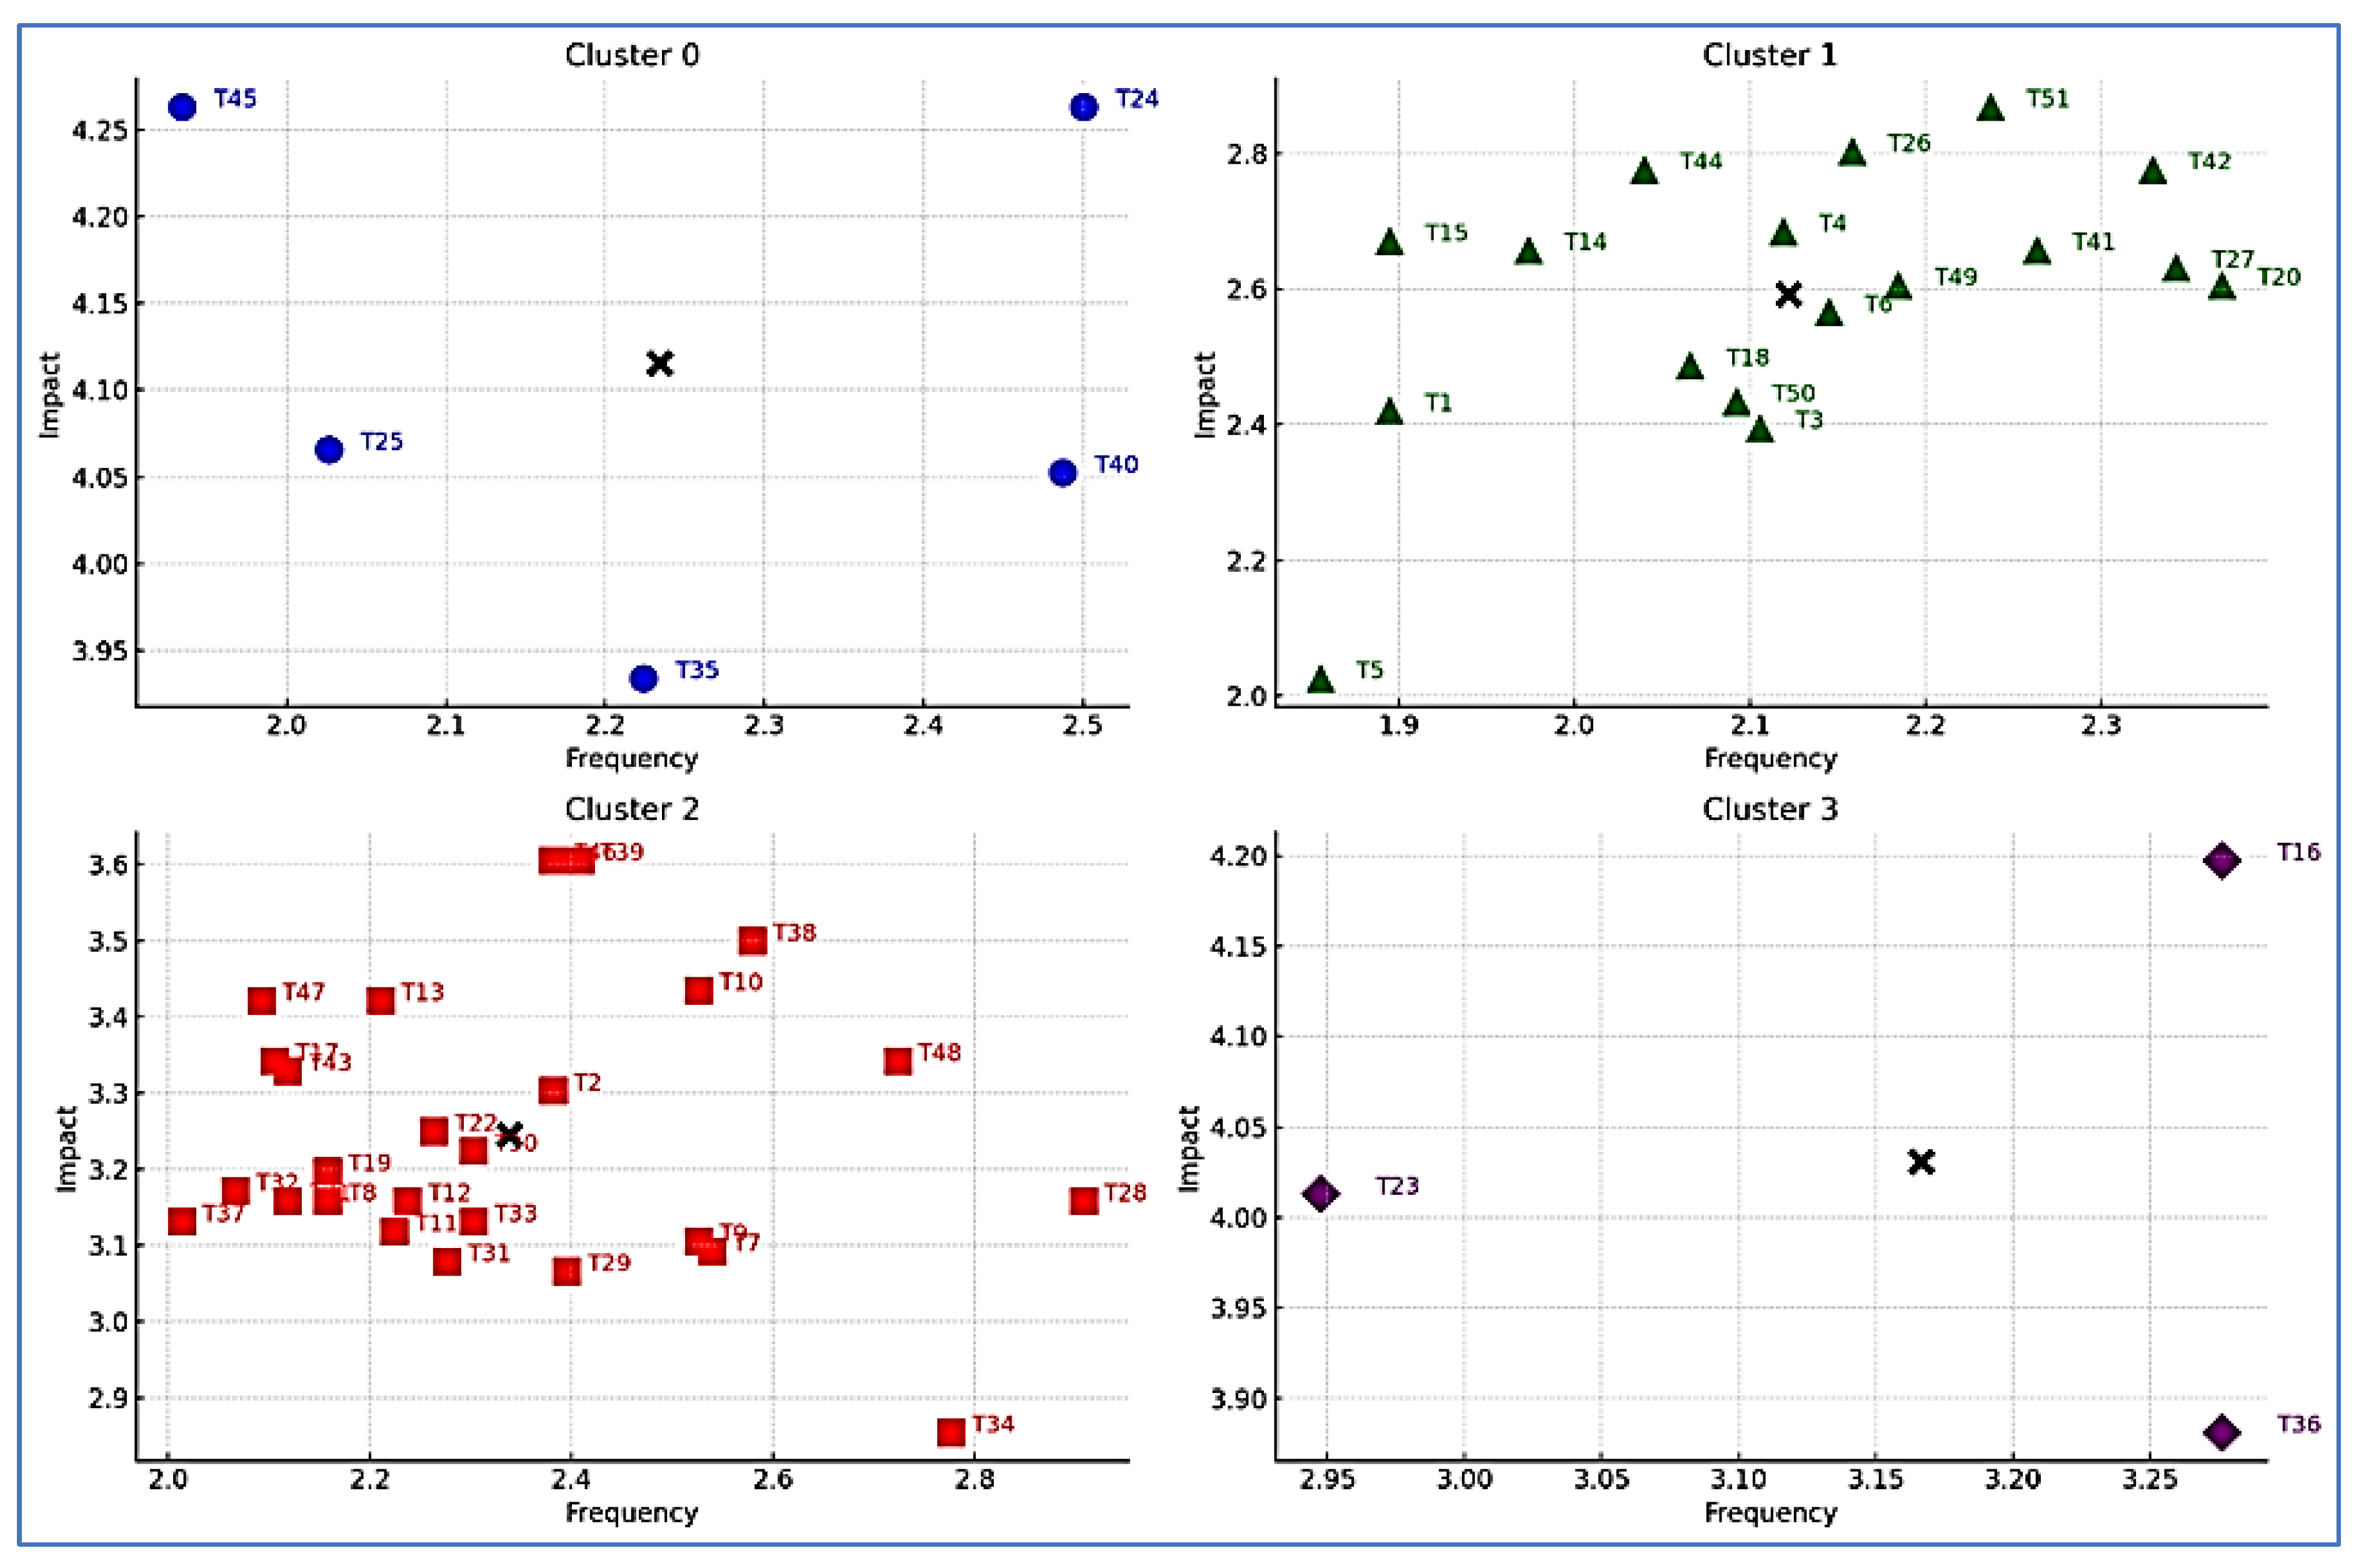

Table 1.
Classification of Claims according to FIDIC 1999.
| No. | FIDIC Sub-Clause | Claim Description | Claim Party | Sort of Claim (Additional) | |||
|---|---|---|---|---|---|---|---|
| Employer (E) |
Contractor (C) | Cost (C) |
Profit (P) | Time (T) |
|||
| 1 | 4.2.a | Failure to extend validity of the performance security | E | C | |||
| 2 | 4.2.b | Failure to pay agreed amount due. | E | C | |||
| 3 | 4.14 | Avoidance of Interference | E | C | |||
| 4 | 4.16 | Damages, losses and expenses resulting from Transport | E | C | |||
| 5 | 4.19 | Payment of electricity, water or gas | E | C | |||
| 6 | 4.2 | Employer's equipment or free-issue materials | E | C | |||
| 7 | 7.5 | Rejection of defective plant and / or materials | E | C | |||
| 8 | 7.6 | Contractor's failure to remedy defects | E | C | |||
| 9 | 8.6 | Revised methods of working due to poor rate of progress | E | C | |||
| 10 | 8.7 | Delay damages | E | C | |||
| 11 | 9.4 | Failed tests on completion | E | C | |||
| 12 | 11.4 | A failure to rectify defects | E | C | |||
| 13 | 15.4 | Termination by employer | E | C | |||
| 14 | 18.1 | Contractor's failure to insure | E | C | |||
| 15 | 18.2 | Contractor's inability to insure | E | C | |||
| 16 | 1.9 | Delayed drawings or instructions | C | C | P | T | |
| 17 | 2.1 | Right of access to, or possession of the site | C | C | P | T | |
| 18 | 4.2 | Delay of performance security payment after performance certificate issuing | C | C | P | T | |
| 19 | 4.7 | Errors in setting out information | C | C | P | T | |
| 20 | 4.12 | Unforeseen physical conditions | C | C | T | ||
| 21 | 4.24 | Fossils, ancient artifacts, archaeological or geological items | C | C | T | ||
| 22 | 7.4 | Additional tests instructed by the engineer | C | C | P | T | |
| 23 | 8.4.a | A variation or significant change to the quantities | C | T | |||
| 24 | 8.4.c | Unusual bad weather | C | T | |||
| 25 | 8.4.d | Shortage of personnel or goods | C | T | |||
| 26 | 8.4.e | Employer's delay or impediment | C | T | |||
| 27 | 8.5 | Delays caused by authorities | C | T | |||
| 28 | 8.9 | Suspension and/or resuming work after suspension | C | C | T | ||
| 29 | 10.2 | The Employer using part of the works | C | C | P | ||
| 30 | 10.3 | Prevention from undertaking tests on completion | C | C | P | T | |
| 31 | 12.4 | An omission of works | C | C | T | ||
| 32 | 13.2 | An adopted value engineering proposal | C | C | P | ||
| 33 | 13.7 | Changes in legislation | C | C | T | ||
| 34 | 14.8 | Delayed payment | C | C | |||
| 35 | 16.1 | Suspension initiated by the contractor | C | C | P | T | |
| 36 | 16.4 | Termination initiated by the contractor | C | C | P | ||
| 37 | 17.1 | Damage or injury caused by Employer's personnel agents | C | C | |||
| 38 | 17.4 | Ambiguity in Documents | C | C | P | T | |
| 39 | 17.4 | Loss or damage to the works caused by Employer's Risks (poor design etc.) | C | C | P | T | |
| 40 | 18.1 | Insurances supplied by the Employer's | C | C | |||
| 41 | 19.4 | Force Majeure | C | C | P | T | |
| 42 | 19.6 | Optional payment and release due to termination | C | C | P | ||
| 43 | 5.2 | Refusal of contractor objection to nomination | C | C | P | T | |
| 44 | 11.8 | An instruction to search for defect | C | C | P | T | |
| 45 | 8.3 | Acceleration of Works | C | C | P | T | |
| 46 | 8.10 | Payment for plant and material in event of suspension | C | C | |||
| 47 | 16.2 | Client’s Breach of Contract | C | C | P | ||
| 48 | 16.2 | Inflation / Price Escalation | C | C | P | ||
| 49 | 16.2 | Currency Fluctuation | C | C | P | ||
| 50 | 5.2 | Default of Nominated Subcontractor or Suppliers | C | C | P | T | |
| 51 | 19.6 | Rectification of Damage Due to Unexpected Risk | C | C | P | T | |
Table 2.
Causes of Claims according to FIDIC 1999.
| No. | List of Causes | No. | List of Causes |
|---|---|---|---|
| 01 | Inadequate/ Inaccurate Design Information | 16 | Inappropriate/ Unexpected Cost Control (Target) |
| 02 | Inadequate Design Documentation | 17 | Inappropriate/ Unexpected Quality Control (Target) |
| 03 | Inadequate Brief | 18 | Poor Communications Among Project Participants |
| 04 | Unclear & Inadequate Specifications | 19 | Lack of Information for Decision Making; (Decisiveness) |
| 05 | Inappropriate Contract Type (Strategy) | 20 | Slow Client Response |
| 06 | Inappropriate Contract Form | 21 | Changes by Client |
| 07 | Inadequate Contract Administration | 22 | Lack of Competence of Project Participants |
| 08 | Inadequate Contract Documentation | 23 | Poor Workmanship |
| 09 | Incomplete Tender Information | 24 | Inadequate Site Investigation |
| 10 | Inappropriate Contractor Selection | 25 | Unrealistic Information Expectations ( By Contractor) |
| 11 | Unrealistic Tender Pricing | 26 | Lack of Team Spirit Among Participants |
| 12 | Unrealistic Client Expectations | 27 | Personality Clashes Among Project Participants |
| 13 | Inappropriate Payment Method | 28 | Poor Management By One or More Project Participants |
| 14 | Inappropriate Document Control | 29 | Adversarial Culture Among project Participants |
| 15 | Inappropriate/ Unexpected Time Control | 30 | Uncontrollable External Events |
| 31 | Exaggerated Claims |
Table 3.
Classification of Claims according to Respondents.
| Code# | Type | Type Frequency | Type Frequency Index | |||||||
|---|---|---|---|---|---|---|---|---|---|---|
| Very Low | Low | Average | High | Very High | Mean | RII | Rank | |||
| T16 | Delayed drawings or instructions | 1 | 5 | 48 | 16 | 6 | 3.28 | 65.53 | 1 | |
| T23 | A variation or significant change to the quantities | 3 | 4 | 44 | 19 | 6 | 3.28 | 65.53 | 2 | |
| T38 | Ambiguity in Documents | 5 | 13 | 43 | 11 | 4 | 2.95 | 58.95 | 3 | |
| T45 | Acceleration of Works | 3 | 10 | 54 | 9 | 0 | 2.91 | 58.16 | 4 | |
| T31 | An omission of work forming | 3 | 18 | 48 | 7 | 0 | 2.78 | 55.53 | 5 | |
| T34 | Delayed payment | 2 | 25 | 43 | 4 | 2 | 2.72 | 54.47 | 6 | |
| T25 | Shortage of personnel or goods | 2 | 38 | 29 | 4 | 3 | 2.58 | 51.58 | 7 | |
| T07 | Rejection of defective plant and / or materials | 3 | 36 | 30 | 7 | 0 | 2.54 | 50.79 | 8 | |
| T09 | Revised methods of working due to slow progress | 3 | 38 | 28 | 6 | 1 | 2.53 | 50.53 | 9 | |
| T10 | Delay damages | 3 | 36 | 33 | 2 | 2 | 2.53 | 50.53 | 10 | |
Table 4.
Causes of Claims according to Respondents.
| Code# | Type | Type Impact | Type Impact Index | ||||||
|---|---|---|---|---|---|---|---|---|---|
| Very Low | Low | Average | High | Very High | Mean | RII | Rank | ||
| T39 | Loss or damage to the works caused Employer's Risks (War, riots, munitions, poor design .. | 6 | 2 | 4 | 18 | 46 | 4.26 | 85.26 | 1 |
| T47 | Client’s Breach of Contract | 4 | 5 | 2 | 21 | 44 | 4.26 | 85.26 | 2 |
| T16 | Delayed drawings or instructions | 1 | 3 | 7 | 34 | 31 | 4.20 | 83.95 | 3 |
| T41 | Force Majeure | 3 | 7 | 7 | 24 | 35 | 4.07 | 81.32 | 4 |
| T27 | Delays caused by authorities | 2 | 4 | 3 | 46 | 21 | 4.05 | 81.05 | 5 |
| T38 | Ambiguity in Documents | 1 | 4 | 7 | 42 | 22 | 4.05 | 81.05 | 6 |
| T33 | Changes in legislation | 7 | 3 | 2 | 40 | 24 | 3.93 | 78.68 | 7 |
| T23 | A variation or change of the quantities | 2 | 1 | 16 | 42 | 15 | 3.88 | 77.63 | 8 |
| T26 | Employer's delay or impediment | 4 | 1 | 23 | 41 | 7 | 3.61 | 72.11 | 9 |
| T48 | Inflation / Price Escalation | 3 | 2 | 27 | 34 | 10 | 3.61 | 72.11 | 10 |
Table 5.
Causes of Claims Assessment according to Respondents.
| Code | Cause Description | Clients | Consultants | Contractors | Overall |
|---|---|---|---|---|---|
| C01 | Inadequate/ Inaccurate Design Information | 100.00% | 100.00% | 93.80% |
98.68% |
| C21 | Changes by Client | 100.00% |
97.70% |
87.50% |
96.05% |
| C19 | Lack of Information for Decision Making; (Decisiveness) | 100.00% |
93.00% |
93.80% |
94.74% |
| C23 | Poor Workmanship | 100.00% |
90.70% |
100.00% |
94.74% |
| C30 | Uncontrollable External Events | 100.00% |
93.00% |
93.80% |
94.74% |
| C02 | Inadequate Design Documentation | 94.10% |
95.30% |
87.50% |
93.42% |
| C04 | Unclear & Inadequate Specifications | 94.10% |
97.70% |
81.30% |
93.42% |
| C16 | Inappropriate/ Unexpected Cost Control (Target) | 100.00% |
93.00% |
87.50% |
93.42% |
| C09 | Incomplete Tender Information | 88.20% |
95.30% |
87.50% |
92.11% |
| C15 | Inappropriate/ Unexpected Time Control (Target) | 100.00% |
93.00% |
81.30% |
92.11% |
| C22 | Lack of Competence of Project Participants | 94.10% |
93.00% |
81.30% |
92.11% |
| C05 | Inappropriate Contract Type (Strategy) | 88.20% |
95.30% |
81.30% |
90.79% |
| C08 | Inadequate Contract Documentation | 94.10% |
93.00% |
81.30% |
90.79% |
| C18 | Poor Communications Among Project Participants | 100.00% |
90.70% |
81.30% |
90.79% |
| C20 | Slow Client Response | 100.00% |
90.70% |
81.30% |
90.79% |
| C31 | Exaggerated Claims | 100.00% |
93.00% |
75.00% |
90.79% |
| C07 | Inadequate Contract Administration | 88.20% |
95.30% |
75.00% |
89.47% |
| C11 | Unrealistic Tender Pricing | 100.00% |
86.00% |
87.50% |
89.47% |
| C14 | Inappropriate Document Control | 100.00% |
86.00% |
87.50% |
89.47% |
| C24 | Inadequate Site Investigation | 94.10% |
88.40% |
87.50% |
89.47% |
| C03 | Inadequate Brief | 94.10% |
88.40% |
81.30% |
88.16% |
| C12 | Unrealistic Client Expectations | 100.00% |
86.00% |
81.30% |
88.16% |
| C17 | Inappropriate/ Unexpected Quality Control (Target) | 100.00% |
81.40% |
93.80% |
88.16% |
| C26 | Lack of Team Spirit Among Participants | 94.1% | 90.70% | 75.00% |
88.16% |
| C28 | Poor Management By One or More Project Participants | 94.1% | 86.00% |
87.50% |
88.16% |
| C10 | Inappropriate Contractor Selection | 94.1% | 88.40% |
75.00% |
86.84% |
| C06 | Inappropriate Contract Form | 88.20% |
88.40% |
75.00% |
85.53% |
| C25 | Unrealistic Information Expectations ( By the Contractor) | 94.10% | 86.00% |
75.00% |
85.53% |
| C27 | Personality Clashes Among Project Participants | 94.10% |
86.00% |
75.00% |
85.53% |
| C29 | Adversarial (industry) Culture Among project Participants | 94.10% |
86.00% |
75.00% |
85.53% |
| C13 | Inappropriate Payment Method | 94.10% |
86.00% |
68.80% |
84.21% |
Table 6.
Assessment of Claims Significance according to Respondents (Top Ten).
| Code # |
Cause Description |
Cause Significance | Cause Significance Index | ||||||
|---|---|---|---|---|---|---|---|---|---|
| Very Low | Low | Average | High | Very High | Mean | RII | Rank | ||
| C15 | Inappropriate/ Unexpected Time Control (Target) | 3 | 3 | 7 | 16 | 47 | 4.33 | 86.58 | 1 |
| C10 | Inappropriate Contractor Selection | 1 | 3 | 8 | 23 | 41 | 4.32 | 86.32 | 2 |
| C05 | Inappropriate Contract Type | 4 | 3 | 8 | 12 | 49 | 4.30 | 86.05 | 3 |
| C16 | Inappropriate/ Unexpected Cost Control (Target) | 3 | 4 | 7 | 15 | 47 | 4.30 | 86.05 | 3 |
| C21 | Changes by Client | 3 | 3 | 6 | 20 | 44 | 4.30 | 86.05 | 3 |
| C19 | Lack of (Decisiveness) | 2 | 6 | 5 | 18 | 45 | 4.29 | 85.79 | 4 |
| C20 | Slow Client Response | 2 | 5 | 5 | 28 | 36 | 4.20 | 83.95 | 5 |
| C17 | Inappropriate/ Unexpected QC | 5 | 2 | 10 | 22 | 37 | 4.11 | 82.11 | 6 |
| C01 | Inadequate/ Inaccurate Design | 2 | 3 | 7 | 38 | 26 | 4.09 | 81.84 | 7 |
| C06 | Inappropriate Contract Form | 5 | 4 | 6 | 25 | 36 | 4.09 | 81.84 | 7 |
Table 7.
The Top Ten Avoidable Causes of Variations and Claims.
| Code # |
Cause Description |
Cause Avoid-ability | Cause Avoid-ability Index | ||||||
|---|---|---|---|---|---|---|---|---|---|
| Very Low | Low | Average | High | Very High | Mean | RII | Rank | ||
| C10 | Inappropriate Contractor Selection | 2 | 5 | 23 | 41 | 5 | 3.55 | 71.05 | 1 |
| C13 | Inappropriate Payment Method | 4 | 3 | 20 | 47 | 2 | 3.53 | 70.53 | 2 |
| C06 | Inappropriate Contract Form | 3 | 7 | 25 | 31 | 10 | 3.50 | 70.00 | 3 |
| C05 | Inappropriate Contract Type (Strategy) | 3 | 6 | 31 | 24 | 12 | 3.47 | 69.47 | 4 |
| C01 | Inadequate/ Inaccurate Design Information | 2 | 5 | 34 | 31 | 4 | 3.39 | 67.89 | 5 |
| C24 | Inadequate Site Investigation | 1 | 5 | 39 | 26 | 5 | 3.38 | 67.63 | 6 |
| C04 | Unclear & Inadequate Specifications | 1 | 7 | 40 | 25 | 3 | 3.29 | 65.79 | 7 |
| C02 | Inadequate Design Documentation | 1 | 8 | 44 | 19 | 4 | 3.22 | 64.47 | 8 |
| C08 | Inadequate Contract Documentation | 1 | 10 | 42 | 21 | 2 | 3.17 | 63.42 | 9 |
| C07 | Inadequate Contract Administration | 4 | 4 | 51 | 15 | 2 | 3.09 | 61.84 | 10 |
| C09 | Incomplete Tender Information | 1 | 8 | 53 | 11 | 3 | 3.09 | 61.84 | 10 |
Table 8.
Kruskal Wallis Test & P-Value (Types of Variations and Claims – in terms of Frequency).
| Code |
Type |
Role of the Respondents (PC01) |
Managerial Level (PC02) |
Personal Experience (PC03) |
Organization/ Firm’s Experience (Years) (PC04) |
Organization/ Firm’s Annual Number of Projects (PC05) | Organization/ Firm’s Number of Employees (PC06) | |||||||
|---|---|---|---|---|---|---|---|---|---|---|---|---|---|---|
| Kruskal- Wallis H |
(P-Value) | Kruskal- Wallis H |
(P-Value) | Kruskal- Wallis H |
(P-Value) | Kruskal- Wallis H |
(P-Value) |
Kruskal- Wallis H |
(P-Value) | Kruskal- Wallis H |
(P-Value) | |||
| T12 | A failure to rectify defects | 3.757 | 0.153 | 0.880 | 0.644 | 10.716 | 0.030 | .0.27 | 0.866 | 1.495 | 0.828 | 1.233 | 0.873 | |
| T14 | Contractor's failure to insure | 0.389 | 0.823 | 1.935 | 0.380 | 4.351 | 0.361 | 12.058 | 0.017 | 6.596 | 0.159 | 2.853 | 0.583 | |
| T16 | Delayed drawings or instructions | 0.741 | 0.690 | 2.696 | 0.260 | 1.402 | 0.844 | 13.614 | 0.009 | 6.451 | 0.168 | 1.103 | 0.894 | |
| T36 | Termination initiated by the contractor | 5.676 | 0.059 | 2.776 | 0.250 | 3.372 | 0.498 | 10.077 | 0.039 | 2.345 | 0.673 | 15.413 | 0.004 | |
| T39 | Loss or damage to the works caused Employer's Risks | 1.232 | 0.540 | 0.949 | 0.622 | 6.340 | 0.175 | 7.578 | 0.108 | 14.220 | 0.007 | 6.147 | 0.188 | |
Table 9.
Kruskal Wallis Test & P-Value (Types of Variations and Claims – in terms of Impact).
| Code |
Type |
Role of the Respondents (PC01) | Managerial Level (PC02) | Personal Experience (PC03) | Firm’s Experience in business) (PC04) |
Firm’s Annual Number of Projects (PC05) | Firm’s Number of Employees (PC06) | |||||||
|---|---|---|---|---|---|---|---|---|---|---|---|---|---|---|
| Kruskal-Wallis H | (P-Value) | Kruskal-Wallis H | (P-Value) | Kruskal-Wallis H | (P-Value) | Kruskal-Wallis H | (P-Value) | Kruskal-Wallis H | (P-Value) | Kruskal-Wallis H | (P-Value) | |||
| T02 | Failure to pay agreed amount due. | 9.810 | 0.007 | 0.853 | 0.653 | 5.711 | 0.222 | 12.868 | 0.012 | 1.668 | 0.797 | 0.941 | 0.919 | |
| T11 | Failed tests on completions | 12.143 | 0.002 | 0.980 | 0.613 | 1.286 | 0.864 | 11.567 | 0.021 | 4.106 | 0.392 | 1.291 | 0.863 | |
| T16 | Delayed drawings or instructions | 4.236 | 0.120 | 1.286 | 0.526 | 6.177 | 0.186 | 5.823 | 0.213 | 13.615 | 0.009 | 10.538 | 0.032 | |
| T21 | Fossils, archaeological or geological | 6.722 | 0.035 | 0.806 | 0.668 | 0.793 | 0.939 | 7.127 | 0.129 | 1.836 | 0.766 | 4.559 | 0.336 | |
| T22 | Additional tests by the engineer | 4.437 | 0.109 | 6.532 | 0.038 | 4.671 | 0.323 | 1.841 | 0.765 | 3.470 | 0.482 | 1.201 | 0.878 | |
| T25 | Shortage of personnel or goods | 4.334 | 0.115 | 6.174 | 0.046 | 6.841 | 0.145 | 2.121 | 0.713 | 2.726 | 0.605 | 1.870 | 0.760 | |
| T26 | Employer's delay or impediment | 2.120 | 0.346 | 4.185 | 0.123 | 0.414 | 0.981 | 1.632 | 0.803 | 2.038 | 0.729 | 10.035 | 0.040 | |
| T27 | Delays caused by authorities | 6.376 | 0.041 | 1.003 | 0.606 | 1.882 | 0.757 | 4.640 | 0.326 | 11.746 | 0.019 | 5.343 | 0.254 | |
| T29 | Employer using works partially | 0.105 | 0.949 | 7.149 | 0.028 | 3.864 | 0.425 | 4.435 | 0.350 | 5.405 | 0.248 | 2.994 | 0.559 | |
| T32 | Adopt value engineering proposal | 2.326 | 0.312 | 7.327 | 0.026 | 0.248 | 0.993 | 2.123 | 0.713 | 3.247 | 0.517 | 0.491 | 0.974 | |
| T38 | Ambiguity in Documents | 6.357 | 0.042 | 0.663 | 0.718 | 2.917 | 0.572 | 1.028 | 0.906 | 0.964 | 0.915 | 4.404 | 0.354 | |
| T39 | Loss or damage to the works caused Employer's Risks | 3.103 | 0.212 | 2.344 | 0.310 | 5.551 | 0.235 | 3.117 | 0.538 | 12.596 | 0.013 | 9.185 | 0.057 | |
| T43 | Refusal of contractor objection to nomination | 6.020 | 0.049 | 2.210 | 0.331 | 6.101 | 0.192 | 3.929 | 0.416 | 2.498 | 0.645 | 1.374 | 0.849 | |
| T45 | Acceleration of Works | 6.446 | 0.040 | 1.929 | 0.381 | 7.492 | 0.112 | 4.239 | 0.375 | 3.131 | 0.536 | 2.153 | 0.708 | |
| T47 | Client’s Breach of Contract | 4.435 | 0.109 | 0.294 | 0.863 | 1.745 | 0.783 | 5.417 | 0.247 | 8.780 | 0.067 | 10.051 | 0.040 | |
| T49 | Currency Fluctuation | 10.413 | 0.005 | 2.801 | 0.246 | 9.776 | 0.044 | 6.154 | 0.188 | 2.455 | 0.653 | 3.481 | 0.481 | |
Table 10.
Kruskal Wallis Test & P-Value (Types of Variations and Claims – in terms of Agreement).
| Code |
Cause |
Role of the Respondents (PC01) | Managerial Level (PC02) | Personal Experience (PC03) | Organization/ Firm’s Experience (PC04) | Organization/ Firm’s Annual Number of Projects (PC05) | Organization/ Firm’s Number of Employees (PC06) | ||||||
|---|---|---|---|---|---|---|---|---|---|---|---|---|---|
| Kruskal-Wallis H | .(P-Value) | Kruskal-Wallis H | (P-Value) | Kruskal-Wallis H | (P-Value) | Kruskal-Wallis H | .(P-Value) | Kruskal-Wallis H | .(P-Value) | Kruskal-Wallis H | .(P-Value) | ||
| C02 | Inadequate Design. | 1.221 | 0.543 | 2.181 | 0.336 | 5.071 | 0.280 | 4.855 | 0.303 | 6.433 | 0.169 | 13.818 | 0.008 |
| C03 | Inadequate Brief | 0.997 | 0.608 | 0.045 | 0.978 | 4.924 | 0.295 | 9.823 | 0.044 | 12.967 | 0.011 | 14.055 | 0.007 |
| C04 | Unclear & Inadequate Specs. | 4.941 | 0.085 | 1.826 | 0.401 | 2.462 | 0.651 | 21.749 | 0.000 | 5.655 | 0.226 | 5.367 | 0.252 |
| C05 | Inappropriate Contract Type | 2.773 | 0.250 | 1.178 | 0.555 | 7.109 | 0.130 | 7.520 | 0.111 | 16.349 | 0.003 | 4.917 | 0.296 |
| C06 | Inappropriate Contract Form | 2.015 | 0.365 | 2.237 | 0.327 | 6.817 | 0.146 | 20.442 | 0.000 | 17.144 | 0.002 | 14.043 | 0.007 |
| C07 | Inadequate Contract Administration | 5.267 | 0.072 | 1.334 | 0.513 | 2.020 | 0.732 | 14.674 | 0.005 | 4.553 | 0.336 | 0.854 | 0.931 |
| C08 | Inadequate Contract Documents | 2.433 | 0.296 | 2.508 | 0.285 | 8.510 | 0.075 | 18.180 | 0.001 | 8.729 | 0.068 | 9.314 | 0.054 |
| C09 | Incomplete Tender Information | 1.577 | 0.455 | 0.046 | 0.977 | 5.389 | 0.250 | 6.898 | 0.141 | 11.187 | 0.025 | 11.288 | 0.024 |
| C10 | Inappropriate Contractor Selection | 2.707 | 0.258 | 3.805 | 0.149 | 10.949 | 0.027 | 15.995 | 0.003 | 7.654 | 0.105 | 6.037 | 0.196 |
| C11 | Unrealistic Tender Pricing | 2.557 | 0.278 | 3.768 | 0.152 | 13.541 | 0.009 | 13.012 | 0.011 | 12.290 | 0.015 | 11.334 | 0.023 |
| C12 | Unrealistic Client Expectations | 3.224 | 0.199 | 2.811 | 0.245 | 14.404 | 0.006 | 14.668 | 0.005 | 15.187 | 0.004 | 7.866 | 0.097 |
| C13 | Inappropriate Payment Method | 4.218 | 0.121 | 1.526 | 0.466 | 6.919 | 0.140 | 10.975 | 0.027 | 9.080 | 0.059 | 16.076 | 0.003 |
| C14 | Inappropriate Document Control | 2.581 | 0.275 | 1.700 | 0.427 | 11.051 | 0.026 | 15.091 | 0.005 | 7.038 | 0.134 | 16.094 | 0.003 |
| C16 | Inappropriate/ Unexpected Cost Control (Target) | 2.024 | 0.364 | 1.731 | 0.421 | 7.469 | 0.113 | 5.733 | 0.220 | 5.949 | 0.203 | 13.823 | 0.008 |
| C17 | Inappropriate/ Unexpected Quality Control (Target) | 4.758 | 0.093 | 0.106 | 0.948 | 8.535 | 0.074 | 11.844 | 0.019 | 9.188 | 0.057 | 19.021 | 0.001 |
| C18 | Poor Communications | 3.506 | 0.173 | 0.358 | 0.836 | 6.813 | 0.146 | 4.159 | 0.385 | 2.665 | 0.615 | 13.069 | 0.011 |
| C19 | Lack of (Decisiveness) | 1.221 | 0.543 | 0.804 | 0.669 | 11.500 | 0.021 | 7.138 | 0.129 | 7.686 | 0.104 | 10.905 | 0.028 |
| C20 | Slow Client Response | 3.472 | 0.176 | 4.648 | 0.098 | 11.252 | 0.024 | 11.589 | 0.021 | 8.602 | 0.072 | 13.742 | 0.008 |
| C21 | Changes by Client | 3.959 | 0.138 | 1.537 | 0.464 | 6.285 | 0.179 | 9.489 | 0.050 | 5.426 | 0.246 | 4.777 | 0.311 |
| C24 | Inadequate Site Investigations | 0.464 | 0.793 | 0.011 | 0.995 | 6.324 | 0.176 | 9.965 | 0.041 | 7.853 | 0.097 | 23.056 | 0.000 |
| C25 | Unrealistic Expectations ( By the Contractor) | 2.574 | 0.276 | 0.726 | 0.696 | 6.848 | 0.144 | 10.994 | 0.027 | 11.313 | 0.023 | 19.155 | 0.001 |
| C27 | Personality Clashes of Participants | 2.463 | 0.292 | 0.866 | 0.648 | 5.909 | 0.206 | 9.581 | 0.048 | 9.259 | 0.055 | 25.707 | 0.000 |
| C28 | Poor Management By Participants | 0.738 | 0.692 | 0.047 | 0.977 | 8.442 | 0.077 | 10.064 | 0.039 | 5.525 | 0.238 | 13.343 | 0.010 |
| C29 | Adversarial Cultural Affairs | 2.141 | 0.343 | 0.640 | 0.726 | 6.980 | 0.137 | 13.252 | 0.010 | 9.925 | 0.042 | 19.660 | 0.001 |
| C30 | Uncontrollable External Events | 1.213 | 0.545 | 0.857 | 0.651 | 11.095 | 0.026 | 7.143 | 0.129 | 3.248 | 0.517 | 10.913 | 0.028 |
| C31 | Exaggerated Claims | 7.108 | 0.029 | 1.228 | 0.541 | 7.047 | 0.133 | 7.527 | 0.111 | 7.732 | 0.102 | 4.664 | 0.324 |
Table 11.
Kruskal Wallis Test & P-Value (Types of Variations and Claims – in terms of Significance).
Table 11.
Kruskal Wallis Test & P-Value (Types of Variations and Claims – in terms of Significance).
| Code |
Cause |
Role of the Respondents (PC01) |
Managerial Level (PC02) |
Personal Experience (PC03) |
Organization/ Firm’s Experience (Firm’s Number of Years) (PC04) | Organization/ Firm’s Annual Number of Projects (PC05) |
Organization/ Firm’s Number of Employees (PC06) |
|||||||
|---|---|---|---|---|---|---|---|---|---|---|---|---|---|---|
| Kruskal-Wallis H |
P-Value |
Kruskal-Wallis H |
P-Value |
Kruskal-Wallis H |
P-Value |
Kruskal-Wallis H |
P-Value |
Kruskal-Wallis H |
P-Value |
Kruskal-Wallis H |
P-Value |
|||
| C01 | Inadequate/ Inaccurate Design | 8.92 | 0.012 | 0.372 | 0.830 | 2.069 | 0.723 | 4.038 | 0.401 | 12.699 | 0.013 | 8.493 | 0.075 | |
| C03 | Inadequate Brief | 9.09 | 0.01 | 1.894 | 0.388 | 7.387 | 0.117 | 7.114 | 0.130 | 3.263 | 0.515 | 6.746 | 0.150 | |
| C04 | Unclear & Inadequate Specifications | 5.04 | 0.080 | 2.802 | 0.246 | 11.111 | 0.025 | 12.551 | 0.014 | 6.064 | 0.194 | 7.515 | 0.111 | |
| C05 | Inappropriate Contract Type | 6.95 | 0.031 | 0.702 | 0.704 | 7.852 | 0.097 | 7.395 | 0.116 | 12.882 | 0.012 | 18.944 | 0.001 | |
| C06 | Inappropriate Contract Form | 3.002 | 0.223 | 2.110 | 0.348 | 5.036 | 0.284 | 3.565 | 0.468 | 9.563 | 0.048 | 11.976 | 0.018 | |
| C07 | Inadequate Contract Administration | 8.91 | 0.012 | 0.579 | 0.749 | 3.059 | 0.548 | 4.436 | 0.350 | 7.796 | 0.099 | 17.400 | 0.002 | |
| C08 | Inadequate Contract Docs. | 1.83 | 0.400 | 2.267 | 0.322 | 4.009 | 0.405 | 4.619 | 0.329 | 4.800 | 0.308 | 12.948 | 0.012 | |
| C09 | Incomplete Tender Information | 6.14 | 0.046 | 2.411 | 0.300 | 6.970 | 0.138 | 7.981 | 0.092 | 3.713 | 0.446 | 4.670 | 0.323 | |
| C10 | Inappropriate Contractor Selection | 2.00 | 0.367 | 2.025 | 0.363 | 10.113 | 0.039 | 8.103 | 0.088 | 13.516 | 0.009 | 16.415 | 0.003 | |
| C11 | Unrealistic Tender Pricing | 6.71 | 0.035 | 0.233 | 0.890 | 8.069 | 0.089 | 11.710 | 0.020 | 2.540 | 0.637 | 8.474 | 0.076 | |
| C12 | Unrealistic Client Expectations | 9.49 | 0.009 | 1.183 | 0.554 | 1.880 | 0.758 | 5.153 | 0.272 | 5.957 | 0.202 | 9.015 | 0.061 | |
| C13 | Inappropriate Payment Method | 4.63 | 0.099 | 0.846 | 0.655 | 3.483 | 0.480 | 2.253 | 0.689 | 7.175 | 0.127 | 12.042 | 0.017 | |
| C14 | Inappropriate Document Control | 1.72 | 0.421 | 0.108 | 0.947 | 4.141 | 0.387 | 1.238 | 0.872 | 5.515 | 0.238 | 4.552 | 0.336 | |
| C15 | Inappropriate/ Unexpected Time Control (Target) | 7.34 | 0.025 | 0.011 | 0.995 | 7.869 | 0.096 | 7.247 | 0.123 | 14.352 | 0.006 | 21.28 | 0.000 | |
| C16 | Inappropriate/ Unexpected Cost Control (Target) | 4.14 | 0.126 | 1.456 | 0.483 | 5.846 | 0.211 | 5.821 | 0.213 | 10.956 | 0.027 | 13.44 | 0.009 | |
| C17 | Inappropriate/ Unexpected Quality Control (Target) | 4.85 | 0.088 | 2.925 | 0.232 | 5.286 | 0.259 | 7.227 | 0.124 | 7.661 | 0.105 | 21.705 | 0.000 | |
| C18 | Poor Communications | 6.59 | 0.037 | 1.379 | 0.502 | 3.132 | 0.536 | 10.064 | 0.039 | 3.327 | 0.505 | 2.739 | 0.602 | |
| C19 | Lack of Decisiveness | 4.63 | 0.099 | 2.345 | 0.310 | 3.896 | 0.420 | 4.594 | 0.332 | 8.482 | 0.075 | 15.25 | 0.004 | |
| C20 | Slow Client Response | 10.96 | 0.004 | 0.819 | 0.664 | 9.864 | 0.043 | 4.353 | 0.360 | 16.149 | 0.003 | 6.914 | 0.140 | |
| C21 | Changes by Client | 4.271 | 0.118 | 1.245 | 0.536 | 6.882 | 0.142 | 7.331 | 0.119 | 13.584 | 0.009 | 15.214 | 0.004 | |
| C23 | Poor Workmanship | 7.948 | 0.019 | 0.668 | 0.716 | 3.692 | 0.449 | 7.843 | 0.098 | 4.764 | 0.312 | 1.142 | 0.888 | |
| C24 | Inadequate Site Investigation | 0.837 | 0.658 | 0.320 | 0.852 | 1.904 | 0.753 | 8.113 | 0.088 | 5.419 | 0.247 | 12.387 | 0.015 | |
| C28 | Poor Management | 6.953 | 0.031 | 0.240 | 0.887 | 8.590 | 0.072 | 3.515 | 0.476 | 2.022 | 0.732 | 6.483 | 0.166 | |
| C29 | Adversarial Cultural Affairs | 15.06 | 0.001 | 0.075 | 0.963 | 4.051 | 0.399 | 7.528 | 0.110 | 10.968 | 0.027 | 10.025 | 0.040 | |
Table 12.
Kruskal Wallis Test & P-Value (Types of Variations and Claims – in terms of Avoid ability).
Table 12.
Kruskal Wallis Test & P-Value (Types of Variations and Claims – in terms of Avoid ability).
| Code |
Cause |
Role of the Respondents (PC01) |
Managerial Level (PC02) |
Personal Experience (PC03) |
Organization/ Firm’s Experience (Firm’s Number of Years) (PC04) |
Organization/ Firm’s Annual Number of Projects (PC05) |
Organization/ Firm’s Number of Employees (PC06) | |||||||
|---|---|---|---|---|---|---|---|---|---|---|---|---|---|---|
| Kruskal-Wallis H | (P-Value) | Kruskal-Wallis H | (P-Value) | Kruskal-Wallis H | (P-Value) | Kruskal-Wallis H | (P-Value) | Kruskal-Wallis H | (P-Value) | Kruskal-Wallis H | (P-Value) | |||
| C02 | Inadequate Design | 0.336 | 0.845 | 0.989 | 0.610 | 3.995 | 0.407 | 10.590 | 0.032 | 9.109 | 0.058 | 2.490 | 0.646 | |
| C06 | Inappropriate Contract Form | 9.055 | 0.011 | 5.086 | 0.079 | 5.691 | 0.223 | 11.693 | 0.020 | 6.923 | 0.140 | 6.264 | 0.180 | |
| C08 | Inadequate Contract Documents | 8.158 | 0.017 | 1.232 | 0.540 | 3.889 | 0.421 | 1.588 | 0.811 | 2.193 | 0.700 | 5.175 | 0.270 | |
| C09 | Incomplete Tender Information | 2.093 | 0.351 | 2.717 | 0.257 | 13.175 | 0.010 | 4.111 | 0.391 | 1.753 | 0.781 | 2.316 | 0.678 | |
| C10 | Inappropriate Contractor Selection | 2.769 | 0.250 | 2.121 | 0.346 | 9.798 | 0.044 | 1.463 | 0.833 | 3.212 | 0.523 | 2.881 | 0.578 | |
| C13 | Inappropriate Payment Method | 1.031 | 0.597 | 0.153 | 0.927 | 5.576 | 0.233 | 10.797 | 0.029 | 7.427 | 0.115 | 13.673 | 0.008 | |
| C21 | Changes by Client | 6.743 | 0.034 | 4.693 | 0.096 | 1.210 | 0.876 | 1.191 | 0.880 | 2.101 | 0.717 | 5.204 | 0.267 | |
| C30 | Uncontrollable External Events | 0.378 | 0.828 | 1.468 | 0.480 | 10.300 | 0.036 | 2.847 | 0.584 | 2.727 | 0.604 | 3.585 | 0.465 | |
Table 13.
Spearman’s Coefficient & Sig. values between the Most Frequented: types of variations/claims & causes.
Table 13.
Spearman’s Coefficient & Sig. values between the Most Frequented: types of variations/claims & causes.
| TYPE (Frequency) | T16 | T23 | T38 | T45 | T31 | T34 | T25 | T07 | T09 | T10 | ||
|---|---|---|---|---|---|---|---|---|---|---|---|---|
| CAUSE (SIGNIFICANCE) |
Correlation ( Coefficients) |
Delayed drawings or instructions | A variation or significant change to the quantities | Ambiguity in Documents | Acceleration of Works | An omission of work forming | Delayed payments | Shortage of personnel or goods | Rejection of defective plant and / or materials | Revised methods of working due to slow progress | Delay damages | |
| C21 | Changes by Client | Correlation | .397** | .242* | .280* | .148 | .366** | .046 | .033 | .054 | -.025 | .114 |
| Sig. (2-tailed) | .000 | .035 | .014 | .202 | .001 | .694 | .780 | .644 | .830 | .325 | ||
| C10 | Significance Inappropriate Contractor Selection | Correlation | .346** | .279* | .236* | .126 | .411** | .018 | .070 | -.002 | -.005 | .179 |
| Sig. (2-tailed) | .002 | .015 | .041 | .277 | .000 | .880 | .546 | .984 | .969 | .122 | ||
| C05 | Significance Inappropriate Contract Type (Strategy) | Correlation | .291* | .328** | .251* | .102 | .460** | .034 | -.038 | .066 | .049 | .140 |
| Sig. (2-tailed) | .011 | .004 | .028 | .382 | .000 | .768 | .742 | .574 | .674 | .227 | ||
| C15 | Significance Inappropriate/ Unexpected Time Control | Correlation | .229* | .258* | .146 | .135 | .320** | .037 | -.005 | .140 | .093 | .187 |
| Sig. (2-tailed) | .046 | .025 | .209 | .244 | .005 | .748 | .968 | .229 | .423 | .106 | ||
| C16 | Significance Inappropriate/ Unexpected Cost Control | Correlation | .268* | .306** | .133 | .220 | .426** | .157 | .084 | .200 | .204 | .240* |
| Sig. (2-tailed) | .019 | .007 | .253 | .056 | .000 | .175 | .472 | .083 | .078 | .037 | ||
| C19 | Significance Lack of Decisiveness | Correlation | .320** | .333** | .179 | .266* | .426** | .019 | -.036 | .125 | .147 | .119 |
| Sig. (2-tailed) | .005 | .003 | .123 | .020 | .000 | .868 | .760 | .281 | .206 | .306 | ||
| C17 | Significance Inappropriate/ Unexpected QC (Target) | Correlation | .304** | .250* | .142 | .077 | .297** | .021 | -.085 | .051 | .039 | .096 |
| Sig. (2-tailed) | .008 | .029 | .223 | .507 | .009 | .855 | .463 | .662 | .736 | .408 | ||
| C20 | Significance Slow Client Response | Correlation | .389** | .321** | .334** | .099 | .457** | .211 | .132 | .142 | -.016 | .196 |
| Sig. (2-tailed) | .001 | .005 | .003 | .393 | .000 | .067 | .256 | .222 | .890 | .089 | ||
| C01 | Significance Inadequate/ Inaccurate Design Information | Correlation | .297** | .192 | .237* | .062 | .317** | .177 | .168 | .236* | .240* | .207 |
| Sig. (2-tailed) | .009 | .096 | .039 | .595 | .005 | .127 | .146 | .040 | .037 | .073 | ||
| C06 | Significance Inappropriate Contract Form | Correlation | .263* | .291* | .265* | .197 | .440** | .259* | .004 | -.015 | -.025 | .246* |
| Sig. (2-tailed) | .022 | .011 | .021 | .088 | .000 | .024 | .975 | .897 | .827 | .032 | ||
Table 14.
Spearman’s Coefficient & Significant Value between Frequented: Types of Variations/ Claims and Causes.
Table 14.
Spearman’s Coefficient & Significant Value between Frequented: Types of Variations/ Claims and Causes.
| TYPE (Impact) | T39 | T47 | T16 | T41 | T27 | T38 | T33 | T23 | T26 | T48 | ||
|---|---|---|---|---|---|---|---|---|---|---|---|---|
| CAUSE (SIGNIFICANCE) |
Correlation ( Coefficients) |
Loss or damage to the works caused Employer's Risks | Client’s Breach of Contract | Delayed drawings or instructions | Force Majeure | Delays caused by authorities | Ambiguity in Documents | Changes in legislation | A variation or change of quantities | Employer's delay or impediment | Inflation / Price Escalation |
|
| C21 | Changes by Client | Correlation | .447** | .424** | .470** | .389** | .548** | .468** | .529** | .252* | .392** | .136 |
| Sig. (2-tailed) | .000 | 0.000 | .000 | .001 | .000 | .000 | .000 | .028 | .000 | .240 | ||
| C10 | Inappropriate Contractor Selection | Correlation | .559** | .417** | .385** | .462** | .595** | .490** | .432** | .174 | .479** | .189 |
| Sig. (2-tailed) | .000 | .000 | .001 | .000 | .000 | .000 | .000 | .133 | .000 | .102 | ||
| C05 | Inappropriate Contract Type | Correlation | .501** | .481** | .433** | .438** | .560** | .507** | .542** | .295** | .457** | .276* |
| Sig. (2-tailed) | .000 | .000 | .000 | .000 | .000 | .000 | .000 | .010 | .000 | .016 | ||
| C15 | Inappropriate/ Unexpected Time Control | Correlation | .461** | .492** | .487** | .398** | .581** | .391** | .410** | .256* | .383** | .313** |
| Sig. (2-tailed) | .000 | .000 | .000 | .000 | .000 | .000 | .000 | .026 | .001 | .006 | ||
| C16 | Inappropriate/ Unexpected Cost Control | Correlation | .438** | .453** | .453** | .390** | .539** | .469** | .519** | .345** | .357** | .136 |
| Sig. (2-tailed) | .000 | .000 | .000 | .000 | .000 | .000 | .000 | .002 | .002 | .243 | ||
| C19 | Lack of Information for (Decisiveness) | Correlation | .556** | .561** | .377** | .309** | .538** | .448** | .486** | .207 | .462** | .336** |
| Sig. (2-tailed) | .000 | .000 | .001 | .007 | .000 | .000 | .000 | .073 | .000 | .003 | ||
| C17 | Inappropriate/ Unexpected QC | Correlation | .447** | .413** | .489** | .412** | .455** | .457** | .474** | .287* | .404** | .098 |
| Sig. (2-tailed) | .000 | .000 | .000 | .000 | .000 | .000 | .000 | .012 | .000 | .402 | ||
| C20 | Slow Client Response | Correlation | .360** | .398** | .438** | .331** | .539** | .503** | .445** | .280* | .451** | .162 |
| Sig. (2-tailed) | .001 | .000 | .000 | .004 | .000 | .000 | .000 | .014 | .000 | .162 | ||
| C01 | Inadequate/ Inaccurate Design Information | Correlation | .402** | .473** | .312** | .420** | .486** | .355** | .418** | .273* | .417** | .224 |
| Sig. (2-tailed) | .000 | .000 | .006 | .000 | .000 | .002 | .000 | .017 | .000 | .052 | ||
| C06 | Inappropriate Contract Form | Correlation | .566** | .414** | .443** | .304** | .557** | .585** | .499** | .182 | .455** | .115 |
| Sig. (2-tailed) | .000 | .000 | .000 | .008 | .000 | .000 | .000 | .116 | .000 | .324 | ||
Table 15.
Spearman’s Coefficient & Sig. value between the Most Frequented: Types of Variations / Claims & Causes.
Table 15.
Spearman’s Coefficient & Sig. value between the Most Frequented: Types of Variations / Claims & Causes.
| TYPE (Frequency) | T16 | T23 | T38 | T45 | T31 | T34 | T25 | T07 | T09 | T10 | ||
|---|---|---|---|---|---|---|---|---|---|---|---|---|
| CAUSE AVOIDABILITY |
CORRELATION ( Coefficients) |
Delayed drawings or instructions | A variation or significant change to the quantities | Ambiguity in Documents | Acceleration of Works | An omission of work forming | Delayed payment | Shortage of personnel or goods | Rejection of defective plant and / or materials | Revised methods of working due to poor progress |
Delay damages |
|
| C10 | Inappropriate Contractor Selection | Correlation | .066 | .231* | .283* | .064 | .100 | -.075 | -.034 | .141 | .127 | .114 |
| Sig. (2-tailed) | .570 | .045 | .013 | .584 | .390 | .521 | .772 | .225 | .273 | .325 | ||
| C13 | Inappropriate Payment Method | Correlation | .096 | .084 | .268* | .334** | .405** | -.022 | .208 | .101 | .133 | .136 |
| Sig. (2-tailed) | .411 | .473 | .019 | .003 | .000 | .852 | .072 | .385 | .251 | .243 | ||
| C06 | Inappropriate Contract Form | Correlation | .229* | .318** | .294** | .142 | .458** | .083 | -.010 | .082 | .173 | .286* |
| Sig. (2-tailed) | .046 | .005 | .010 | .221 | .000 | .478 | .933 | .479 | .135 | .012 | ||
| C05 | Inappropriate Contract Type | Correlation | .333** | .170 | .168 | .157 | .264* | .096 | -.081 | .046 | .348** | .192 |
| Sig. (2-tailed) | .003 | .142 | .147 | .175 | .021 | .412 | .489 | .695 | .002 | .097 | ||
| C01 | Inadequate/ Inaccurate Design | Correlation | -.067 | .020 | .149 | .162 | .109 | .077 | .024 | .198 | .262* | .173 |
| Sig. (2-tailed) | .566 | .863 | .198 | .163 | .348 | .509 | .834 | .086 | .022 | .136 | ||
| C24 | Inadequate Site Investigation | Correlation | .055 | .197 | .250* | .012 | .162 | -.080 | -.076 | .214 | .259* | .212 |
| Sig. (2-tailed) | .635 | .088 | .029 | .920 | .161 | .494 | .513 | .064 | .024 | .066 | ||
| C04 | Unclear & Inadequate Specifications | Correlation | -.041 | .027 | .068 | .035 | -.025 | .012 | -.067 | .117 | .235* | .070 |
| Sig. (2-tailed) | .724 | .814 | .560 | .765 | .831 | .915 | .567 | .313 | .041 | .546 | ||
| C02 | Inadequate/ Inaccurate Design Information | Correlation | .148 | .175 | .290* | .091 | .181 | .109 | .032 | .393** | .361** | .373** |
| Sig. (2-tailed) | .202 | .131 | .011 | .432 | .117 | .350 | .782 | .000 | .001 | .001 | ||
| C08 | Inadequate Contract Documentation | Correlation | .139 | .162 | .227* | .276* | .176 | .170 | .008 | .211 | .397** | .335** |
| Sig. (2-tailed) | .230 | .163 | .048 | .016 | .129 | .141 | .945 | .068 | .000 | .003 | ||
| C07 | Inadequate Contract Administration | Correlation | .055 | -.163 | .148 | -.062 | .201 | .010 | .022 | .169 | .094 | -.032 |
| Sig. (2-tailed) | .639 | .158 | .203 | .597 | .082 | .930 | .852 | .145 | .421 | .782 | ||
| C09 | Incomplete Tender Information | Correlation | .101 | .216 | .051 | .192 | .180 | .022 | .056 | .164 | .329** | .167 |
| Sig. (2-tailed) | .387 | .060 | .664 | .096 | .120 | .851 | .629 | .156 | .004 | .150 | ||
** indicates the statistically highly positive correlation.
Table 16.
Spearman’s Coefficient & Significant value between the Most Impacted Types of Variations/ Claims & Most Avoid ability Causes.
Table 16.
Spearman’s Coefficient & Significant value between the Most Impacted Types of Variations/ Claims & Most Avoid ability Causes.
| CAUSE AVOIDABILITY | TYPE (IMPACT) | T39 | T47 | T16 | T41 | T27 | T38 | T33 | T23 | T26 | T48 | |
|---|---|---|---|---|---|---|---|---|---|---|---|---|
| CORRELATION | Loss of works caused Employer's Risks | Client’s Breach of Contract | Delayed drawings or instructions | Force Majeure | Delays caused by authorities | Ambiguity in Documents | Changes in legislation | A variation or significant change to the quantities | Employer's delay or impediment | Inflation / Price Escalation | ||
| C10 | Inappropriate Contractor Selection | Correlation Coefficient | .222 | .307** | .305** | .244* | .308** | .185 | .359** | .227* | .179 | .294** |
| Sig. (2-tailed) | .054 | .007 | .007 | .034 | .007 | .109 | .001 | .048 | .121 | .010 | ||
| C13 | Inappropriate Payment Method | Correlation Coefficient | .143 | .370** | .206 | .240* | .271* | .360** | .226* | .205 | .190 | .042 |
| Sig. (2-tailed) | .216 | .001 | .074 | .037 | .018 | .001 | .050 | .076 | .099 | .717 | ||
| C06 | Inappropriate Contract Form | Correlation Coefficient | .301** | .354** | .330** | .237* | .510** | .520** | .434** | .186 | .459** | .150 |
| Sig. (2-tailed) | .008 | .002 | .004 | .039 | .000 | .000 | .000 | .109 | .000 | .195 | ||
| C05 | Inappropriate Contract Type (Strategy) | Correlation | .251* | .275* | .295** | .183 | .388** | .298** | .352** | .145 | .258* | .198 |
| Sig. (2-tailed) | .029 | .016 | .010 | .113 | .001 | .009 | .002 | .212 | .025 | .087 | ||
| C01 | Inadequate/ Inaccurate Design Information | Correlation | .070 | .295** | .055 | .066 | .073 | .176 | .299** | .132 | .165 | .088 |
| Sig. (2-tailed) | .548 | .010 | .635 | .572 | .533 | .128 | .009 | .256 | .153 | .449 | ||
| C24 | Inadequate Site Investigation | Correlation | .164 | .266* | .222 | .184 | .302** | .254* | .306** | .303** | .248* | .241* |
| Sig. (2-tailed) | .156 | .020 | .054 | .111 | .008 | .027 | .007 | .008 | .030 | .036 | ||
| C04 | Unclear & Inadequate Specifications | Correlation | .043 | .166 | .006 | -.008 | .073 | .064 | .160 | .210 | .063 | .104 |
| Sig. (2-tailed) | .712 | .151 | .957 | .949 | .531 | .580 | .169 | .069 | .590 | .369 | ||
| C02 | Inadequate/ Inaccurate Design Information | Correlation | .178 | .183 | .142 | .325** | .381** | .229* | .415** | .145 | .344** | .116 |
| Sig. (2-tailed) | .125 | .115 | .221 | .004 | .001 | .046 | .000 | .212 | .002 | .318 | ||
| C08 | Inadequate Contract Documentation | Correlation | .219 | .310** | .227* | .191 | .434** | .278* | .483** | .193 | .305** | .342** |
| Sig. (2-tailed) | .058 | .006 | .048 | .099 | .000 | .015 | .000 | .094 | .007 | .003 | ||
| C07 | Inadequate Contract Administration | Correlation | .016 | .190 | .086 | .048 | .152 | .127 | .277* | .071 | .171 | .183 |
| Sig. (2-tailed) | .893 | .099 | .458 | .679 | .190 | .276 | .015 | .540 | .140 | .113 | ||
| C09 | Incomplete Tender Information | Correlation | .097 | .095 | .062 | .176 | .116 | -.033 | .164 | .214 | .135 | .115 |
| Sig. (2-tailed) | .403 | .414 | .592 | .128 | .317 | .779 | .157 | .063 | .247 | .322 | ||
** indicates the statistically highly positive correlation.
Table 17.
Respondents’ Responses regarding the Types of Variations and Claims and its Significance.
| Identity (Role of the Respondents) | Frequency | Percent | Valid % | Cumulative % | |
|---|---|---|---|---|---|
| Client | Not Sure | 1 | 5.9 | 5.9 | 5.9 |
| Yes | 16 | 94.1 | 94.1 | 100.0 | |
| Total | 17 | 100.0 | 100.0 | ||
| Client Representative/Consultant | No | 3 | 7.0 | 7.0 | 7.0 |
| Not Sure | 2 | 4.7 | 4.7 | 11.6 | |
| Yes | 38 | 88.4 | 88.4 | 100.0 | |
| Total | 43 | 100.0 | 100.0 | ||
| Contractor | No | 1 | 6.3 | 6.3 | 6.3 |
| Yes | 15 | 93.8 | 93.8 | 100.0 | |
| Total | 16 | 100.0 | 100.0 | ||
Table 18.
Respondents’ Responses regarding the Causes of Variations and Claims and its Significance.
Table 18.
Respondents’ Responses regarding the Causes of Variations and Claims and its Significance.
| Identity (Role of the Respondents) | Frequency | Percent | Valid % | Cumulative % | |
|---|---|---|---|---|---|
| Client | No | 1 | 5.9 | 5.9 | 5.9 |
| Not Sure | 1 | 5.9 | 5.9 | 11.8 | |
| Yes | 15 | 88.2 | 88.2 | 100.0 | |
| Total | 17 | 100.0 | 100.0 | ||
| Client Representative/Consultant | No | 1 | 2.3 | 2.3 | 2.3 |
| Not Sure | 1 | 2.3 | 2.3 | 4.7 | |
| Yes | 41 | 95.3 | 95.3 | 100.0 | |
| Total | 43 | 100.0 | 100.0 | ||
| Contractor | No | 1 | 6.3 | 6.3 | 6.3 |
| Yes | 15 | 93.8 | 93.8 | 100.0 | |
| Total | 16 | 100.0 | 100.0 | ||
Table 19.
Will Questions Help Managers to Predict the Types & Causes of Variations and Claims?
| Identity (Role of the Respondents) | Frequency | Valid % | Cumulative % | |
|---|---|---|---|---|
| Client | No | 1 | 5.9 | 5.9 |
| Yes | 16 | 94.1 | 100.0 | |
| Total | 17 | 100.0 | ||
| Client Representative/Consultant | No | 1 | 2.3 | 2.3 |
| Not Sure | 6 | 14.0 | 16.3 | |
| Yes | 36 | 83.7 | 100.0 | |
| Total | 43 | 100.0 | ||
| Contractor | Not Sure | 1 | 6.3 | 6.3 |
| Yes | 15 | 93.8 | 100.0 | |
| Total | 16 | 100.0 | ||
Table 20.
Will Questions Help Managers to Predict Strategies to Reduce Variations and Claims?
| Identity (Role of the Respondents) | Frequency | Valid % | Cumulative % | |
|---|---|---|---|---|
| Client | No | 2 | 11.8 | 11.8 |
| Not Sure | 2 | 11.8 | 23.5 | |
| Yes | 13 | 76.5 | 100.0 | |
| Total | 17 | 100.0 | ||
| Client Representative/Consultant | No | 1 | 2.3 | 2.3 |
| Not Sure | 8 | 18.6 | 20.9 | |
| Yes | 34 | 79.1 | 100.0 | |
| Total | 43 | 100.0 | ||
| Contractor | Not Sure | 2 | 12.5 | 12.5 |
| Yes | 14 | 87.5 | 100.0 | |
| Total | 16 | 100.0 | ||
Table 21.
Causes of Claims and/or Variations Assigned to K-means Clusters.
| Cluster | Cause | Count |
|---|---|---|
| 0 | T45, T40, T35, T25, T24 | 5 |
| 1 | T1, T49, T44, T42, T41, T27, T50, T20, T18, T26, T51, T6, T5, T4, T3, T15, T14 | 17 |
| 2 | T47, T48, T34, T2, T7, T39, T38, T37, T8, T46, T43, T33, T31, T17, T19, T13, T21, T22, T32, T12, T10, T9, T28, T29, T30, T11 | 26 |
| 3 | T23, T36, T16 | 3 |
Table 22.
Frequent Types of Variations and Claims.
| No. | Frequent Types of Variations and Claims | No. | List of Causes |
|---|---|---|---|
| 01 | Delayed drawings or instructions | 01 | Loss or damage to the works caused Employer's Risks munitions, poor design etc.) (T39) |
| 02 | A variation or significant change to the quantities | 02 | Client’s Breach of Contract |
| 03 | Ambiguity in documents | 03 | Delayed drawings or instructions |
| 04 | Acceleration of Works | 04 | Force Majeure |
| 05 | Omission of work forming | 05 | Delays caused by authorities |
| 06 | Delayed payment | 06 | Ambiguity in Documents |
| 07 | Shortage of personnel or goods | 07 | Changes in legislation |
| 08 | Rejection of defective plant and / materials |
08 | A variation or significant change to the quantities. |
| 09 | Revised methods of working due to poor rate of progress (T09) | 09 | Employer's delay or impediment |
| 10 | Delay damages | 10 | Inflation / Price Escalation |
Table 23.
Causes of Claims and Variations.
| No. | Significant Causes of Variations and Claims | No. | Avoidable Causes of Variations and Claims |
|---|---|---|---|
| 01 | Changes by Client (C21) | 01 | Inappropriate Contractor Selection (C10) |
| 02 | Inappropriate Contractor Selection (C10) | 02 | Inappropriate Payment Method (C13) |
| 03 | Inappropriate Contract Type (Strategy) (C05) | 03 | Inappropriate Contract Form (C06) |
| 04 | Inappropriate/ Unexpected Time Control (Target) (C15) | 04 | Inappropriate Contract Type (Strategy) (C05) |
| 05 | Inappropriate/ Unexpected Cost Control (Target) (C16) | 05 | Inadequate/ Inaccurate Design Information (C01) |
| 06 | Lack of Information for Decision Making; (Decisiveness) (C19) | 06 | Inadequate Site Investigation (C24) |
| 07 | Inappropriate/ Unexpected Quality Control (Target) (C17) | 07 | Unclear & Inadequate Specifications (C04) |
| 08 | Slow Client Response (C20) | 08 | Inadequate Design Documentation (C02) |
| 09 | Inadequate/ Inaccurate Design Information (C01) | 09 | Inadequate Contract Documentation (C08) |
| 10 | Inappropriate Contract Form (C06) | 10 | Inadequate Contract Administration (C07) |
Table 24.
Guidelines & Techniques to Control Significant and Avoidable Causes of Claims and Variations.
Table 24.
Guidelines & Techniques to Control Significant and Avoidable Causes of Claims and Variations.
| # | Avoidable Causes of Variations and Claims | Recommended Mitigation/ Response Strategy |
|---|---|---|
| 1 | Changes by Client (C21) |
|
| 2 | Inappropriate Contractor Selection (C10) |
|
| 3 | Inappropriate Contract Type/Strategy - C05 |
|
| 4 | Inappropriate/Unexpected Time Control (Target)-(C15) |
|
| 5 | Inappropriate/Unexpected Cost Control (Target)- C16 |
|
| 6 | Lack of Information for Decision-Making;Decisiveness-(C19) |
|
| 7 | Inappropriate/Unexpected Quality Control (Target)-(C17) |
|
| 8 | Slow Client Response- (C20) |
|
| 9 | Inadequate/Inaccurate Design Information- (C01) |
|
| 10 | Inappropriate Contract Form- (C06) |
|
| 11 | Inappropriate Payment Method- (C13) |
|
| 12 | Inadequate Site Investigations- (C24) |
|
| 13 | Unclear & Inadequate Specifications- (C04) |
|
| 14 | Inadequate Design Documentation- (C02) |
|
| 15 | Inadequate Contract Documentation-(C08) |
|
| 16 | Inadequate Contract Administration-(C07) |
|
| 17 | Incomplete Tender Information-(C09) |
|
Disclaimer/Publisher’s Note: The statements, opinions and data contained in all publications are solely those of the individual author(s) and contributor(s) and not of MDPI and/or the editor(s). MDPI and/or the editor(s) disclaim responsibility for any injury to people or property resulting from any ideas, methods, instructions or products referred to in the content. |
© 2024 by the authors. Licensee MDPI, Basel, Switzerland. This article is an open access article distributed under the terms and conditions of the Creative Commons Attribution (CC BY) license (https://creativecommons.org/licenses/by/4.0/).
Copyright: This open access article is published under a Creative Commons CC BY 4.0 license, which permit the free download, distribution, and reuse, provided that the author and preprint are cited in any reuse.