Submitted:
29 April 2024
Posted:
30 April 2024
You are already at the latest version
Abstract
This study explores pressure, miscibility, and pore medium effects on heavy hydrocarbon recovery up to 65 MPa from four rock types: sand, tight sandstone, cavernous limestone, and oil sand. Results reveal MMP at 50 MPa, with peak recovery at 93% (56 MPa). Interestingly, recovery trends counter traditional expectations, notably decreasing in tight sandstone (42-56 MPa) and oil sand (50-65 MPa). Varied recoveries in cavernous limestone (25-56 MPa) highlight porosity and vug influence. Higher pressures hinder recovery due to SC-CO2's density and viscosity, favoring the immiscible process for efficient heavy hydrocarbon extraction.
Keywords:
CO2
; CCSU-EOR
; HHM
; Carbonate.
1. Introduction
The most effective way to prevent the release of large amounts of carbon dioxide into the air from various sources of CO2 emissions is to inject it into underground storages. The combination of CO2 injection into oil reservoirs for enhanced oil recovery (CO2-EOR) followed by CO2 capture and storage (CCS) can significantly extend the life of the field [1]. Thus, it is expected that by 2050 CO2 emissions into the atmosphere will be reduced by 17% [2].
As light oil reserves are depleted, more and more attention is drawn to the extraction of hydrocarbons from unconventional resources such as heavy oil, tight oil, oil shales, and oil sands [3]. Although 95 countries reported heavy oil deposits, there were few projects for such deposits. Significant deposits of oil sands are at various stages of development in Canada, Venezuela, Kazakhstan, Nigeria, Mongolia and other countries [4]. Exploration and development of tight oil and oil shale is mainly concentrated in North America, while interest in such deposits is growing rapidly in China [5]
Attempts to extend the criteria for evaluating success stories, obtained from the practical experience in one unconventional field to another, have not proved their worth [3]. Many elements of unconventional reservoirs, whether related to the properties of hydrocarbons or reservoir rocks, can cause discrepancies between expectations and results [4]. Hydrocarbon production from unconventional resources is limited by either high oil viscosity or low permeability, or both [6]. Reservoirs containing heavy oil or bitumen are difficult to produce using conventional methods. Because the viscosity of oil is much higher than that of water, the injected water fingers through the reservoir and leaves behind unswept or residual oil. The tight porous space may be inaccessible to water, leaving behind unrecoverable oil.
Simulation studies and experimental laboratory works have shown that various gas compositions, from nitrogen to mixtures of hydrocarbon gases and carbon dioxide in various proportions can have great potential to increase recovery of heavy oil. As a result, a number of hybrid processes have been introduced, including the carbonated water, methane, butane, solvent and steam, steam and CO2, H2S and CO2, and etc. [1,7,8,9]. However, carbon dioxide showed superior solubility with heavy hydrocarbons compared to all other gases and their mixtures, as it has liquid-like viscosity and gas-like penetrating property.
Supercritical carbon dioxide (SC-CO2) substantially reduces oil viscosity of oil with increasing pressure, which also depends on reservoir temperature and oil composition. An increase in oil volume after CO2 injection leads not only to an increase in the internal kinetic energy of crude oil, but also to a significant decrease in capillary and hydrodynamic resistance in the crude oil flow, thereby improving its flow capacity [10] CO2 condenses in oil and makes it lighter (condensing gas drive); oil vaporizes into CO2 and enriches it (vaporizing gas drive) [11].
An extensive literature describes the numerical and analytical studies of the flow of carbon dioxide through porous spaces saturated with crude oil and formation water, intended to sequester carbon dioxide and enhance oil recovery [12,13]. Experimental studies describe the efficiency of oil recovery using SC- CO2, traditionally studied in laboratory experiments by injecting carbon dioxide through oil saturated glass beads or sand [14]. Typically, under supercritical conditions, the viscosity of CO2 gradually increases with the increase in pressure until achievement of miscibility between hydrocarbons and carbon dioxide. When the minimum miscibility pressure (MMP) is reached, the slope of the graph becomes gentle or almost constant depending on the temperature. Conditions below MMP indicate an immiscible state and a miscible state above it. [15]. The curve of crude oil recovery vs. pressure usually mimics a viscosity curve, indicating that miscibility conditions provide significantly higher oil recovery than immiscibility conditions [16]. For HHM and bitumen, however, the applied pressure may not be sufficient to achieve miscibility.
It is believed that miscibility does not depend on both the nature of the porous media and the displacement rate [17]. However, the pore space in naturally compacted rocks, especially in carbonates, is very complex. Carbonate formations may have low porosity and permeability, voids may be poorly interconnected and may include fractures, caverns and vugs. Most heavy oil today is produced from sandstone reservoirs, while large deposits of HHM have been found in complex carbonate formations, most of which are found in the Middle East. Fracture enhanced, low matrix permeability production is dominant and occurs in Oman, Iran, Iraq, Syria, Turkey and Egypt and includes producing fields such as Qarn Alam in Oman and Issaran and Bakr-Amer in Egypt [18].
Complex pore space, in addition to the properties of oil-to-mixed wet rock, typically results in low recovery by water injections. In many carbonate formations, wettability has been found to favor gas injection rather than water injection. Cavernous carbonates with vug porosity have a higher storage capacity, but the voids are poorly connected to each other. Existing CCS are made in sandstone reservoirs, while carbonate rocks with complex porosity have larger storage capacity and can accommodate large quantities of this gas [17].
The storage capacity depends on a number of factors, among which pore-throat size distribution often affects the CO2 distribution and therefore CO2 storage capacity in the heterogeneous medium compared to a homogeneous medium due to dispersed flow paths [2].
In addition, due to the increased acidity of formation water, when carbon dioxide is injected, carbonates are dissolved, which can lead to an increase in porosity and permeability [19].
For example, simulation has shown that the permeability of chalk increases substantially due to chemical reactions [20].
Penetration of CO2 into oil occurs by diffusion and requires a large area of contact between CO2 and oil saturated rock. Several authors have studied the effect of porous media on the ability of carbon dioxide to recover and transport crude oil and have found that the more complex porous structure of carbonates significantly influences recoveries compared to sandstones [21].
The extraction of heavy oil from carbonates can be even more difficult, since a more viscous substance is more difficult to dislodge from the grain surfaces of oil- or mixed-wet rock and transport by any media. In addition, the recovery of heavier hydrocarbons requires a higher pressure than the typical minimum miscibility pressure used with crude oil [22].
Various production schemes with CO2 injections are used, such as carbonated water, immiscible and miscible carbon dioxide flooding. Carbon dioxide flooding (continuous or alternating with water-WAG) is the dominant EOR process in the United States, largely because it has been shown to be economical due to the vast natural resources of CO2 in Wyoming, New Mexico and Colorado [23]. Often, a CO2 huff-and-puff process is implemented that includes three main steps: injection, soaking and production [9]
63 CO2 flooding projects are reported in carbonate formations. However, only 6 CO2 injection projects have been implemented in the world in carbonate reservoirs with heavy and extra heavy oil (Bati Raman, Batu Kozluku, Camurlu and Ikiztepe in Turkey, Nagylengyel in Hungury, Halfmoon and Yates in the USA) [24].
Immiscible CO2 has been successfully applied in heavy oil fields with gas injection from a neighboring field in Turkey. In Bati Raman (Turkey), most of the HHM is contained in the matrix porosity ranging of 10% to 25%, while fissures and vugs contain only a very small fraction of the total oil in place. [24] The contact area was large due to numerous fissures rapidly filled by the injected gas penetrating the matrix containing the heavy oil. Production data of CO2–EOR method applied to Ikiztepe heavy oil field showed that the higher the CO2 gas purity and the injection pressure, the higher the oil recovery due to the increased gas solubility in the reservoir oil [25]. However, miscibility was not achieved because this required a much higher pressure than the allowable operational pressure.
The present study was conducted to investigate the effect of rock type on the recovery of heavy hydrocarbons with SC-CO2 from different rock types. Extraction experiments were carried out using sand saturated with used motor oil, oil sand containing natural bitumen, and tight sandstone and cavernous limestone saturated with heavy hydrocarbon mixture (HHM). In addition, the extraction of HHM alone was carried out in a wide pressure range to determine miscibility condition for comparison with the HHM recovery from rock samples. Since a very high pressure is required for miscibility of HHM and carbon dioxide, extraction experiments were carried out in the range of 25-65 MPa at 70 oC according to the huff-and-puff process. The efficiency of immiscible and miscible processes for extracting heavy hydrocarbons from various rock samples was compared.
2. Materials and Methods
2.1. Materials
Haldor Topsoe A/S Refinery plant, Denmark, provided a residue presented by heavy hydrocarbon mixture (HHM) with the density of 0.8396 g/cm3 (D 4052 test) and viscosity of 12 cP (ASTM D2983) produced after hydrocracking of the crude oil originating from the North Sea oilfields. According to D 6591 test, the mixture contained 11.64 % aromatics. Melting temperature is >30 °C, boiling temperature is >290 °C [26]. This HHM was used as a model of viscous oil in the extraction experiments. Used motor oil (UMO) was provided by a motor-service center of Ribe, Denmark, and used to saturate sand [27]. Oil sand samples were obtained from the Ofoso oil sand deposit, Nigeria [28].
Several pieces of white cavernous limestone were taken from the beach of the North Sea in Esbjerg, Denmark. The area covered by caverns and vugs was estimated as 15%. An example of cavernous limestone used in the experiment is shown in Figure 1. Tight quartz sandstone was acquired from Martin Billeschou Stones ApS, Esbjerg. Strandmollen A/S, Denmark, supplied 99.9% pure carbon dioxide.
2.2. GC-MS Chromatographic Analysis
GC-MS chromatographic analysis was used to determine the composition of HHM presented by heavy hydrocarbon mixture in single carbon number (SCN) groups. To prepare the samples for chromatographic analysis, 1.5 mL of n-pentane was used to dilute 0.5 mL of HHM. The GC-MS system consisted of a GC−CP-3800 gas chromatograph and a MS-ION TRAP 2000 mass spectrometer with the VF-5s30Mx0.25MM capillary column from Varian (Middelburg, The Netherlands). The carrier gas was helium at a pressure of 20 psi. The MS was operated in electron ionization mode at the temperature of 300 °C. The mass ranged from m/z 50 to m/z 600 in scan mode. The total run time was 45 min. In more detail, the procedure is described in [11, 16].
2.3. Rock Sample Preparation
To prepare experimental rock samples corresponding to the dimensions of the extractor, pieces of tight sandstone or cavernous limestone were cut with a stonecutter into smaller pieces of approximately the same weight and surface area. The weight of seven dry samples of limestone varied from 10 to 22 g. The weight of three tight sandstone samples was 72, 80 and 96 g.
Rock samples were placed in an oven heated to 105 oC for a day for drying. The dried samples were placed in deionized water for 24 hours to saturate in an oven heated to 37 oC. The samples were weighed before and after saturation with water to obtain the weight of the water saturated sample and calculate the water porosity. After that, the samples were again dried in an oven at 105 oC for 24 hours.
At room temperature, HHM consists of liquid and solid fractions. To melt the entire mixture, the HHM was preheated in an oven to 37 oC. The rock samples were placed in HHM and kept in an oven for 5 days to achieve proper saturation. The samples were then weighed to obtain the weight of the sample saturated with HHM and calculate the HHM porosity. Before measuring the weight of saturated rock samples, excess HHM was removed from the surface of the samples with a towel and weighed to obtain surface-dry rock weight.
2.4. Experimental Procedure
The extraction experiments were carried out using commercial high-pressure extractor Spe-ed SFE, following the procedure described in [16, 26-28]. The CO2 injected from storage tank must be cooled to about 2 oC for about an hour before gas can be injected in the extractor. A 100 ml extractor containing a rock sample saturated with HHM was placed vertically in an oven heated to 70 oC. The rock sample was set on a cotton ball in the center of extractor to prevent direct gas injection into the sample from below and to ensure open contact with SC-CO2 from all sides.
The temperature of 70 oC was selected because the greatest recovery of HHM of 93% was obtained at this temperature in the previous experiment [26].
To start the experiment, the inlet valve of the system was opened and CO2 was continuously pumped through a pipe at the bottom of the extractor until the required pressure was reached. After 30 minutes of interaction of carbon dioxide with the sample in static mode, outlet and vent valves were opened to collect the extracted oil in test tubes in dynamic mode. The collection of the flowing liquid occurred within 10 minutes. After that, the inlet valve was closed and outlet valves were opened to release CO2 from the extractor. The sample was removed from the extractor for weighing, the extractor was cleaned, and the next sample of rock saturated with HHM was placed in it for the next test.
A time of 30 minutes in static mode was chosen for the experiments because in our previous tests with natural oil-saturated chalk, which also has a very complex pore space, we found that longer period of 90 minutes did not improve oil recovery [29].
In the first experiment, 10 samples of HHM each weighing 42 g, were used at a pressure of 15 to 60 MPa. The second experiment was carried out on samples of tight sandstone saturated with HHM at 43, 50 and 56 MPa. The third experiment was carried out on seven samples of cavernous limestone saturated with HHM at a pressure of 25 to 56 MPa.
The fourth experiment was performed on an oil sand sample (Ofoso deposit, Nigeria) at 50, 60 and 65 MPa. This extraction took place in three runs, which means that the SC-CO2 was injected into the extractor with the same oil sand sample three times. The oil sand samples were weighed before the start of the extraction and after the third run. The 50 g oil sand samples were preheated at 120 oC in the oven for a period of 2 h to induce melting. The temperature in the oven of the extractor was set at 110 oC to prevent bitumen solidification, which occurred at lower temperature, as described in [30].
2.5. Calculations of Void Index, Liquid Content and Porosity
Dry rock samples and surface-dry rock samples saturated with water and HHM were weighed. Liquid-to-rock ratios were calculated as void index, liquid content, and porosity using the following equations.
The weight of liquid (water or HHM) absorbed by each rock sample was calculated as the difference between the weight of the saturated-surface-dry rock sample ) and the weight of the dry sample ):
Void index was calculated as the ratio of the weight of the liquid to the weight of the dry rock sample:
Liquid content was calculated as the ratio of the weight of the liquid over the weight of the saturated rock sample:
Pore volume occupied by the liquid (water or HHM) was calculated as the ratio of the weight of the liquid to its density (1 g/cm3 for water and 0.8369 g/cm3 for HHM):
Rock volume was calculated as the ratio of the weight of the dry rock to the density of limestone 2.72 g/cm3 or sandstone 2.65 g/cm3.
Porosity () (for water or HHM) was calculated as the ratio of pore volume to total volume of the saturated rock, which is the sum of pore volume and rock volume :
2.6. Calculations of HHM Recovery
The amount of HHM in the liquid phase recovered at specific pressure using SC-CO2 in each experiment was calculated as the difference in weight of the test tubes after and before the oil was collected:
The recovery of HHM collected in the liquid phase or the liquid recovery was calculated as the ratio of the weight of HHM collected in the test tube to the weight of HHM adsorbed by the sample:
Total recovery ( of HHM was calculated as the difference between the weight of the sample saturated with HHM and its weight after extraction to the weight of HHM adsorbed in the sample :
Outgassing losses or vapor recovery of HHM was calculated as the difference between total recovery and liquid recovery :
3. Results and Discussion
3.1. Comparison of Porosity, Liquid Content, and Void Index
The limit of porosity or permeability imposes restrictions on the oil mobility (“cut-off”), when the oil is not displaced by the injected fluid. Although supercritical carbon dioxide has excellent solubility, its depth of penetration into the rock and removal of hydrocarbons from the rock can be hindered by complexity of the pore space. Two different rock types and two different types of pore geometry were chosen for the study: tight sandstone with intergranular porosity as a model of a tight oil reservoir and cavernous limestone with vug and intergranular porosity. Like permeability, the pore space in the rock accessible to a particular fluid depends on the type of fluid, since denser fluids cannot penetrate smaller pores. Typically, porosity is determined using water as the saturating fluid. If another fluid is used, its porosity may differ from that of water. By definition, porosity is a volumetric parameter as it is derived using the ratio of volumes, as shown by Eq. 6. If the volume is not being measured, the density must be known to calculate it, which may be missing. Because the densities of limestone, sandstone, and liquids used such as water and HHM were known, the porosity was derived using Eq. 6. To obtain other parameters that also characterize the proportions of liquid and rock in the sample, such as liquid content and void index, only measured parameters are used, such as weights, as described in the Eq. 2 and 3. In Figure 2, the liquid content and void indexes are linearly linear correlated with the corresponding porosity of water and HHM.
The values of porosity, liquid content and void index of rock samples are compared for water and HHM in Figure 3. The dashed line shows equal values. Water porosity ranged from 13 to 23%, HHM porosity - from 20 to 34.5%. Thus, HHM porosity is about 10% higher than water porosity. The water content in limestone rock samples varied from 5.2 to 10% , and the HHM content from 7.1 to 14 % with a difference between them of 1-4%. For water, the void index was 5.5-11%, for oil 7-16%. Thus, the void index and liquid content of the samples with HHM was higher by about 3-4% than those of water. Higher values of the above parameters for oil may be associated with the capture and retention in open caverns and vugs of more viscous HHM, but the water escaped.
The values of the void indexes of both oil and water are no more than 2% higher than the respective liquid contents. The difference between porosities and liquid content is much higher: up to 15% for oil and up to 12% for water.
On the contrary, for three sandstone samples, void index, liquid content and porosity for water are higher than for oil, although the difference between them did not exceed 1%. This also illustrates the effect of pore space, indicating that less viscous water penetrates deeper into the pores than HHM. The porosity, which is from 3 to 5.7%, exceeded the liquid content and void index by no more than 2.2%.
Due to the large differences between the above parameters, the data in the following sections are labeled according to the porosity calculated for HHM by the Eq. 6.
3.2. Extraction of Heavy Hydrocarbon Mixture with SC-CO2
Heavy oil is defined as oil with a density greater than1 g/cm3. However, even bitumen extracted from oil sands can float on the surface of the water, being in a semisolid state due to its lower density than that of water [4]. Another characterization of heavy oil is the viscosity above 10 cP.
Despite the usual crude oil density of 0.8396 g/cm3, the heavy hydrocarbon mixture (HHM) is a semisolid paraffin-like substance at temperature below 30 oC. Therefore, it was used as a model for viscous heavy oil in our experiments on its extraction from two types of rocks.
The composition of investigated heavy hydrocarbon mixture is represented by the relative intensity of carbon number groups (Cn) in Figure 4. The GC-MS chromatogram shows the fold in the range of Cn groups from 17 to 34 with the top at 25.
This heavy hydrocarbon mixture was chosen as a model oil, since its extraction with SC-CO2 has been thoroughly studied in a wide range of pressures (12-60 MPa) and temperatures (50-90 oC) [26]. A wide range of pressures up to 60 MPa was selected to obtain minimum a miscibility pressure (MMP), which is expected to be high because higher density and viscosity of carbon dioxide are required for miscibility with heavy hydrocarbons.
The HHM collected at the outlet differed significantly in phase behavior and in color of effluent HHM under different conditions. At 70 oC, the HHM recovery gradually increased to 47 MPa, following an increase in the density and viscosity of carbon dioxide, but did not exceed even 10% due to cooling and partial freezing of HHM in the extractor (Figure 5). At the breakover point of 50 MPa, the HHM recovery increased sharply to 80%. Hence, 50 MPa is a minimum miscibility pressure. Under this pressure, the extracted dark yellow liquid flowed out smoothly. At 56 MPa, where the maximum recovery of 93 % was achieved, and at 60 MPa, the effluent HHM foamed and boiled with a large number of gas bubbles, which indicates the supersaturation of HHM with carbon dioxide. Upon cooling, HHM collected in test tubes retained a foamy porous structure.
According to binary diagram, the extraction of HHM with supercritical carbon dioxide followed a different path than typical crude [16,31]. On Figure 3, phases are marked with different colors, where liquid L1 is carbon dioxide enriched in hydrocarbons, liquid L2 is hydrocarbons enriched in carbon dioxide, and V is the vapor phase [26]. Typically, the process of SC-CO2 extraction of crude oil follows an L1+V path with a sharp slope in the of range lower pressures corresponding to immiscibility conditions, until the breakover point at MMP, after which the slope becomes gentle or constant [14-16].
The process of HHM extraction follows the path L1 with a gentle slope at lower pressures to meet immiscibility conditions. Partial freezing of the HHM along this path indicates no or low vapor content, which confirms the L1 phase and not L1+V. Further, the process of HHM extraction goes along the path L1 + L2 to the breakover point at 50 MPa, which indicates MMP. The HHM extraction in the range of 50-60 MPa occurs in the L2+V phase.
It can be assumed that the MMP of this HHM should be substantially higher than is usually obtained for crude oil. Due to the lack of data at 70 oC, the MMP of crude oil of Halfdan field and the MMP of HHM were compared at 60 oC [16, 26]. At 60 oC, the MMP was 45 MPa for both crude oil and HHM, indicating that the MMP of HHM need not be much higher.
At 70 oC, the HHM was in the liquid phase, which facilitated its extraction and transportation by SC-CO2. A 93% of recovery at 56 MPa means that the extractor initially nearly half full of HHM was literally clean considering that a few grams of HHM had also degassed. This may be of interest for some applications, such as the removal of waxes deposited in pipes or the recovery of bitumen from tar sands.
3.3. Extraction of HHM from Sandstone Samples
If the extraction of oil from the rock does not affect the oil recovery, then the HHM recovery curve from the rock samples should follow the same curve, as the HHM recovery curve shown in Figure 5 [17].
However, the HHM recovery from tight sandstone samples decreased linearly from 50 to 21 % in the range of 43-56 MPa, regardless of porosity (Figure 6). This line does not match the HHM recovery curve shown in Figure 5. Moreover, this contradicts the well-established trend of increasing recovery with increasing pressure [14-16].
A typical result of liquid, vapor and total recovery is shown in Figure 7 for the recovery of used motor oil (UMO) from sand using SC-CO2 at 70 oC and 35-65 MPa, obtained according to the same experimental procedure [27]. The liquid recovery curve of UMO increased sharply to MMP at 45 MPa, where it changed its slope to a gentler one. Conversely, the vapor recovery decreased with increasing pressure, meaning that vaporization was supressed at higher pressures. The total recovery also increased up to MMP and remained almost constant above it. If the recovery curves of hydrocarbons in the vapor and liquid phases are opposite to each other, then the total recovery usually increases anyway. A unique temperature dependence was observed for crude oil from Gorm oil field. At 40 and 50 oC, the liquid recovery increased with increasing pressure, while the vapor recovery remained constant. Conversely, at 60 and 70 oC , the vapor recovery increased with increasing pressure, while liquid recovery remained constant [11].
In the case of tight sandstone in Figure 6, the outgassing losses were below 2% for all three rock samples, which excludes the influence of the vapor phase and means that the total recovery also decreased sharply, following the liquid recovery line. Hence, the decrease in liquid recovery with the pressure can only be associated with the influence of porous media of rock. The explanation may lie in the increased viscosity of SC-CO2, due to which the ability of carbon dioxide to penetrate into very small pores deteriorated at higher pressures. The fact that water porosity is higher than HHM porosity for this tight sandstone also supports this conclusion.
Meanwhile, the recovery of HHM was as high as 50% at 43 MPa. The highest recovery in our previous experiments using oil sand samples was not higher than 13% after first injection (run) of SC-CO2 at 50, 60 and 65 MPa [28]. The recovery of 12 % was reported from CO2 –EOR of Bati Raman field [18, 24].
3.4. Extraction of Bitumen from Oil Sand Samples
For comparison, total, liquid and vapor recovery of bitumen from the oil sand samples from the Ofoso deposit in Nigeria at 110 oC is shown in Figure 8. The temperature in the oven of the extractor was set to 110 oC, because the bitumen cooled and plugged the pipes at 80 oC, as described in [30]. The extraction took place in three runs, which means that the carbon dioxide was injected and the bitumen was collected three times at the same pressure. Thus, the recovery of the liquid phase is the sum after three runs, while total and vapor recoveries were calculated using the difference in weight between the end and the start of the extraction.
The vapor recovery varied from 11 to 19%, and the total recovery decreased from 44 to 26% in the pressure range from 50 to 65 MPa. It is interesting to note that the vapor recovery obtained using SC-CO2 is significantly higher than the 0.2 % vapor losses after heating of oil sand for 2 hours in an oven [28]. As with the extraction of HHM extraction from tight sandstone, the liquid recovery of bitumen decreased almost linearly with pressure from 28 to 15% at 50-65 MPa. The recovery reduction with pressure can also be associated with a decrease in the penetrating ability of SC-CO2 into the pore space of oil sand due to an increase in the density and viscosity of carbon dioxide.
3.6. Extraction of HHM from Cavernous Limestone Samples
The total liquid and vapor recovery of HHM from limestone samples in the pressure range of 25-56 MPa is shown in Figure 9. Labels indicate porosity determined using HHM. Total recovery ranged from 32 to 50%, liquid recovery from 10 to 28%, and vapor recovery from 17 to 32% over the entire pressure range.
The total recovery did not change significantly between 25 and 38 MPa but decreased at 45 MPa for both samples of 19.9 and 34.5% porosity. The maximum total recovery of 50 % was achieved at 55 MPa using a sample with 22.4 % porosity, which could be associated with the highest HHM recovery at this pressure in Figure 5. However, the total recovery of another sample with 31.3 % HHM porosity at 56 MPa was consistent with other samples. It is important to mention that the HHM in the test tube was cool at 56 MPa compared to all other warm samples. If an increase in total recovery under pressure can be noted, then a very small.
Vapor recovery ranged from 17 to 32 %, averaging 25 % with no clear dependence on pressure. The vapor recovery was high, compared with the results of HHM extraction alone (below 7%) and from the tight sandstone (2% on average).
The liquid recovery generally followed changes in total recovery, but a decrease in liquid recovery with increasing pressure can be seen at 25-45 MPa, which can be associated with slight increase in vapor recovery.
However, the liquid recovery of a sample with a porosity of 31.3% is higher than that of a sample with a porosity of 22.4% at 55 and 56 MPa, while for total recovery, on the contrary, it is higher for a sample with 22.4% porosity than for a samples with 31.3%.
Both the total and liquid recovery of the sample with 34.5% porosity is less than that of the sample with 19.9% porosity at the same pressure of 45 MPa, while the vapor recovery is similar. This shows that vapor recovery did not affect liquid recovery, and deviations in recovery may be affected by other factors.
Visual observations of two limestone samples used at 45 MPa after opening the extractor revealed that their surface was covered with foamy HHM.
In experiments using HHM alone at pressures of 55–60 MPa, carbon dioxide was miscible with the heavy hydrocarbon mixture to such an extent that the mixture began to boil, providing the greatest recovery values. At the same time, it can be assumed that swelling and foaming of HHM could reduce the dislodging of HHM from the rock surface, since it could be more difficult for carbon dioxide to transport the swollen mass, which, as one would expect, led to a decrease in recovery. However, this does not explain the deviation of the sample with 34.5% porosity at 45 MPa, since this pressure is below the level at which HHM began to boil. Thus, it can be deduced that foaming did not lead to a decrease in recovery.
In extraction experiments using HHM alone, the samples were not foamy at 70 oC, but they were foamy at 50 oC along L1 root.
Thus, the liquid recovery curve obtained using limestone samples did not exactly reproduce the recovery curve of HHM in Figure 5 neither in shape nor in magnitude, nor in phase behaviour.
The miscibility achieved using only HHM at 50-60 MPa did not result in the same high recoveries from cavernous limestone samples. Hence, the effect of the vuggy pore space of limestone is that recovery is independent of pressure since it does not change significantly with pressure. This means that it is not necessary to achieve miscibility in heavy oil reservoirs if the immiscible displacement provides similar recoveries. Moreover, high pressure can even lead to worsened recovery, as seen in the experiments with tight sandstone and oil sand.
3.7. Relationship of HHM Recovery and Rock Volume
To determine other factors that may affect liquid recovery, its relationship to rock volume and porosity was studied. Due to some difference in sample weight and size, it can be argued that recovery is higher from larger samples because more liquid is adsorbed and retained by virtue of their larger surface areas. However, the regression coefficient of the correlation between the weight of dry samples and their total or liquid recovery is less than 0.2, which means that these parameters are not dependent. However, as shown in Figure 10, liquid recovery from the largest rock samples, shown in the dotted oval, increased with their volume, but the recovery of these samples is not higher than for other smaller samples. It is interesting to note that for larger samples, the total recovery decreased with the increasing rock volume, in contrast to the increase in liquid recovery. For smaller samples, total recovery followed changes in liquid recovery and there was no relationship between recovery and rock volume or weight.
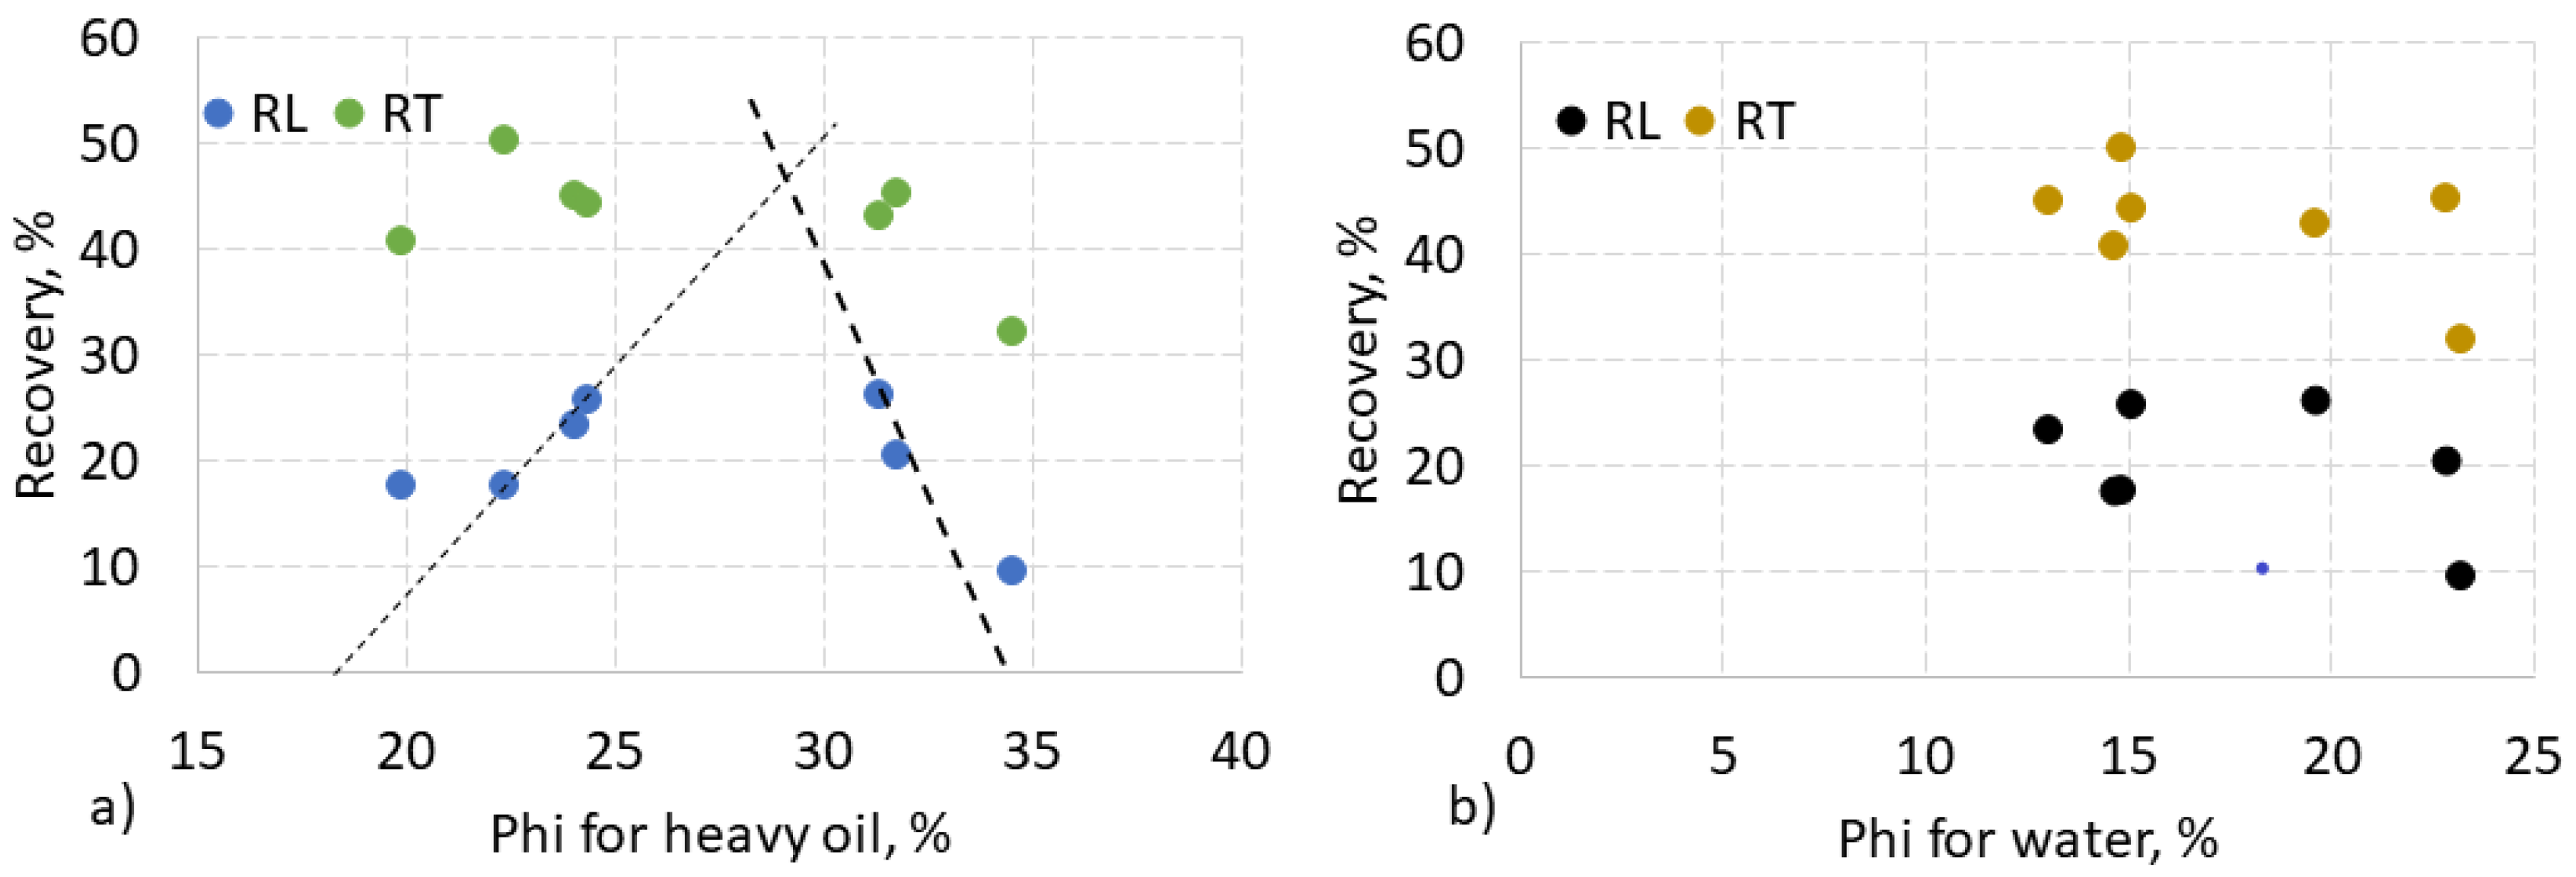
3.8. Relationship of HHM Recovery and HHM Porosity
To determine the effect of porosity, total and liquid recovery was plotted versus HHM and water porosity in Figure 11. It can be seen that the data is divided into two groups, as in Figure 10. However, all three samples with the highest HHM porosities above 30% in Figure 11 are not the three samples shown in the oval in Figure 10.
Samples with lower HHM porosity of 17-29% followed the ascending dashed line, and samples with higher HHM porosities of 29-34% followed a descending line. The point of intersection of the two lines corresponds to an HHM porosity of 29%, defining this value as marginal, corresponding to a recovery of 47% (Figure 11a).
Data for the usually used water porosity are scattered randomly (Figure 11a). This shows that the recovery depends on the distribution of HHM in the porous medium and the content of HHM, while the rock porosity itself cannot reflect such a distribution.
On visual inspection of samples with higher porosities >30%, it was observed that HHM remained unrecovered from larger vugs. The surface area of the cavernous limestone piece, covered with vugs was estimated at an average of only 15%. However, as observed in the cross-sections after cutting into smaller samples, some cavities were up to 3 mm in diameter and up to 7 mm deep. Not only by the depths, but also by the orientation of the vugs could influence the recovery of HHM. The gas leaving the extractor flows only in the vertical direction, while the orientation of the pores and vugs can be in different directions. As a result, some amount of the HHM may become trapped inside larger and deeper caverns. The retention of hydrocarbons in vugs was also observed in experiments with Grosmont carbonates [7]. Vertical permeability in the Bati Raman heavy oil field was also mentioned as one of the main parameters influencing gas diffusion and gas gravity drainage, in addition to diffusion coefficient and matrix block size [32]. Thus, the scatter in recovery data is related to the dependence on the HHM porosity and vertical flow of carbon dioxide during the release, which left unrecovered HHM in deeper and randomly oriented caverns and vugs. This means that the anisotropy of carbonates must be taken into account when evaluating their potential for heavy oil production.
4. Conclusions
1. This investigation compared the recovery of heavy hydrocarbons from four types of rock - sand, tight sandstone, cavernous limestone, and oil sand, and heavy hydrocarbon mixture alone by SC-CO2 at high pressures up to 65 MPa.
2. The liquid recovery of heavy hydrocarbon mixture extracted by SC-CO2 slightly increased in the range of pressure from 15 to 47.5 MPa but did not exceed 10% due to cooling, while it was above 80% at 50-65 MPa due to achievement of miscibility.
3. However, liquid recovery of HHM and bitumen extracted by SC-CO2 from tight sandstone and oil sand linearly decreased with the pressure (from 50 to 21% at 42-56 MPa and from 27 to 15% at 50-65 MPa for oil sand). The liquid recovery of HHM extracted by SC-CO2 from cavernous limestone in the pressure range of 25-56 MPa varied from 9 to 27% without clear dependence on the pressure.
4. These results contradict the well-established recovery increase with pressure, as confirmed by the recovery of used motor oil from the sand. This contradiction is caused by the high viscosity of carbon dioxide at higher pressures, which cannot deeply penetrate into the porous spaces of rocks. In addition, caverns up to 7 mm deep and their orientation hindered the ability of the CO2 to transport HHM by gas flow in vertically oriented extractor from cavernous limestone. Thus, anisotropy of carbonates should be taken into consideration for gas injection projects.
5. This investigation shows that an immiscible process that occurs at lower pressures is more efficient for heavy oil production because, even if miscibility is achieved, it only results in significantly lower recovery from oil sand and tight sandstone, or similar results for cavernous limestone.
References
- N. Mosavat, S. Al-Riyami, P. Pourafshary, Y. Al-Wahaibi, S. Rudyk. Recovery of viscous and heavy oil by CO2-saturated brine. Energy and Climate Change 1 (2020) 100009. [CrossRef]
- Z. Rasheed, A. Raza, R. Gholami, M. Rabiei, A. Ismail, V. Rasouli, A numerical study to assess the effect of heterogeneity on CO2 storage potential of saline aquifers, Energy Geoscience 1 (1–2) (2020) 20-27. [CrossRef]
- B. Katz, L. Gao, J. Little, Y. Zhao, Geology still matters – unconventional petroleum system disappointments and failures, Unconv. Resourc. 1 (2021) 18-38. [CrossRef]
- S. Rudyk, Y. Ongarbayev, P. Spirov, Feature selection in GC-MS, NMR and MALDI-TOF spectra of tar sand bitumen, Unconv. Resourc. 3 (2023) 61-71. [CrossRef]
- Y. Tang, S. Tan, R. Wang, H. Wang, C. Xia, K. Chen, Analysis of tight oil accumulation conditions and prediction of sweet spots in Ordos Basin: A case study. Energy Geoscience 3/4 (2022) 417-426. [CrossRef]
- H. Cander, What Are Unconventional Resources? A Simple Definition Using Viscosity and Permeability. Search Discov. (2012) 80217.
- V. Pathak, T. Babadigli, N. Edmunds, Experimental Investigation of bitumen recovery from Fractures carbonates using hot solvents, J. Canad. Petr. Tec (2013) 289-295. [CrossRef]
- F.N. Tsai, S.H. Huang, H.M. Lin, K.C. Chao, Solubility of methane, ethane, and carbon dioxide in a Mobil Fischer-Tropsch wax and in n-Paraffins, The Chem. Eng. J. 38 (1988) 41-46.
- X. He, L. Zhao, X. Lu, F. Ding, Z. Wang, R.Han, P. Liu, A Critical Review Using CO2 and N2 of Enhanced Heavy-Oil-Recovery Technologies in China. Appl. Sci. 12 (2022) 12585. [CrossRef]
- L. Zhang, H. Liao, M. Cui, Effect of CO2 flooding in an oil reservoir with strong bottom-water drive in the Tahe Oilfield, Tarim Basin, Northwest China, Energy Geoscience, 2022, 100127. [CrossRef]
- S. Rudyk, P., Spirov, P., Samuel, S., Joshi, Vaporization of Crude Oil by Supercritical CO2 at Different Temperatures and Pressures: Example from Gorm Field in the Danish North Sea. Energy&Fuels 31(6), (2017) 6274–6283. [CrossRef]
- C. Doughty, K. Pruess, Modeling supercritical carbon dioxide injection in heterogeneous porous media, Vadose Zone Journal, 3 (2004) 837-847.
- P. Saripalli, P. McGrail, Semi-analytical approaches to modeling deep well injection of CO2 for geological sequestration, Energy Conversion and Management, 43 (2002) 185-198. [CrossRef]
- F.I. Stalkup, Miscible displacement, Henry L. Doherty Memorial Fund of AIME, 1983.
- O. Alomair, A. Malallah, A., Elsharkawy, M. Iqbal, Predicting CO2 minimum misci-bility pressure (MMP) using alternating conditional expectation (ACE) algorithm. Oil Gas Sci. Technol. 70 (6), 967–982, (2015).
- S. Rudyk, Determination of saturation pressures using experimental data of modified SC-CO2 extraction of crude oil by consistency test. J. Sup. Fluids 82 (2013) 63–71. [CrossRef]
- M. Karaei, B. Honarvar, A. Azdarpour, E. Mohammadian, CO2 Storage in Low Permeable Carbonate Reservoirs: Permeability and Interfacial Tension (IFT) Changes During CO2 Injection in an Iranian Carbonate Reservoir. Periodica Polytechnica Chemical Engineering 64(4), 491–504 (2020).
- J. W. Buza, An Overview of Heavy and Extra Heavy Oil Carbonate Reservoirs in the Middle East. Paper presented at the International Petroleum Technology Conference, Kuala Lumpur, Malaysia, December 2008.
- L. André, M. Azaroual, A. Menjoz, Numerical simulations of the thermal impact of supercritical CO2 injection on chemical reactivity in a carbonate saline reservoir, Transp. Por. Med. 82 (2010) 247-274. [CrossRef]
- H. Mahmud, W. Mahmud, A. Al-Rubaye, Modeling interaction between CO2, brine and chalk reservoir rock including temperature effect on petrophysical properties, Energy Geoscience 2 (4) (2021) 337-344. [CrossRef]
- X. Wang, Y. Gu, Oil Recovery and Permeability Reduction of a Tight Sandstone Reservoir in Immiscible and Miscible CO2 Flooding Processes, Ind.& Eng. Chem. Res. 50 (2011) 2388-2399. [CrossRef]
- T. Chartier, E. Delhomme, J.F. Baumard, P. Marteau, P. Subra, R. Tufeu, Solubility in supercritical carbon dioxide of paraffin waxes used as binders for low-pressure injection molding, Ind.&Eng. Chem. Res. 38 (1999) 1904-1910. [CrossRef]
- E. J. Manrique, V. E. Muci, M. E. Gurfinkel. EOR Field Experiences in Carbonate Reservoirs in the United States. SPE Res Eval & Eng 10 (2007) 667–686. [CrossRef]
- S. Kalinin, O. Morozuyk, K. Kosterin, Experimental Study of Heavy Oil Displace-ment by Carbon Dioxide on Carbonated Cores. SPE-201821-MS (2020).
- H. Ishii, H. Sarma, K. Ono, K. Issever, Successful field pilots in a carbonate heavy oil reservoir in the Ikiztepe Field, Turkey, Kenji Ono, Journal of the Japanese Association for Petroleum Technology 62 (2) (1997) 103-111.
- S. Rudyk, P. Spirov, Three-dimensional scheme of supercritical carbon dioxide extraction of heavy hydrocarbon mixture in (pressure; temperature; recovery) coordinates. Energy&Fuels 27(10) (2013) 5996–6001. [CrossRef]
- S. Rudyk, P. Spirov, Temperature effect on extraction and purification of used motor oil by supercritical carbon dioxide. J. Sup. Fluids 128 (2017) 291–299. [CrossRef]
- S. Rudyk, P. Spirov, I. Jimoh, G. Vakili-Nezhaad, The Bitumen Upgrading of Nigerian Oil Sand by Supercritical Carbon Dioxide Modified with Alcohols. Energy Fuels 28 (2014) 4714−4724. [CrossRef]
- S. Rudyk, P. Spirov, E. Sogaard, 3D Model of Extraction of Oil from North Sea Fields by Supercritical Carbon Dioxide, Chemical Engineering Transactions 32 (2013) 283-288.
- P. Spirov, S. Rudyk, A. Tyrovolas, I. Jimoh. The Bitumen Extraction from Nigerian Tar Sand Using Dense Carbon Dioxide, Chemical Engineering Transactions 24 (2011) 703-708.
- A.A. Dehghan, R. Kharrat, M.H. Ghazanfari, Visualization and Quantification of Asphaltinic-Heavy Oil Displacement by Co-Solvents at Different Wettability Conditions, Petroleum Science and Technology 28 (2010) 176-189. [CrossRef]
- S. Sahin, U. Kalfa, D. Celebioglu, Bati Raman Field Immiscible CO2 Application--Status Quo and Future Plan. SPE Reservoir Evaluation & Engineering 11(4) (2008) 778-791. [CrossRef]
Figure 1.
Example of cavernous limestone piece used to prepare rock samples experiments of SC-CO2 extraction of heavy hydrocarbon mixture (HHM). The size of this piece of rock is 9 x 9 cm.
Figure 1.
Example of cavernous limestone piece used to prepare rock samples experiments of SC-CO2 extraction of heavy hydrocarbon mixture (HHM). The size of this piece of rock is 9 x 9 cm.
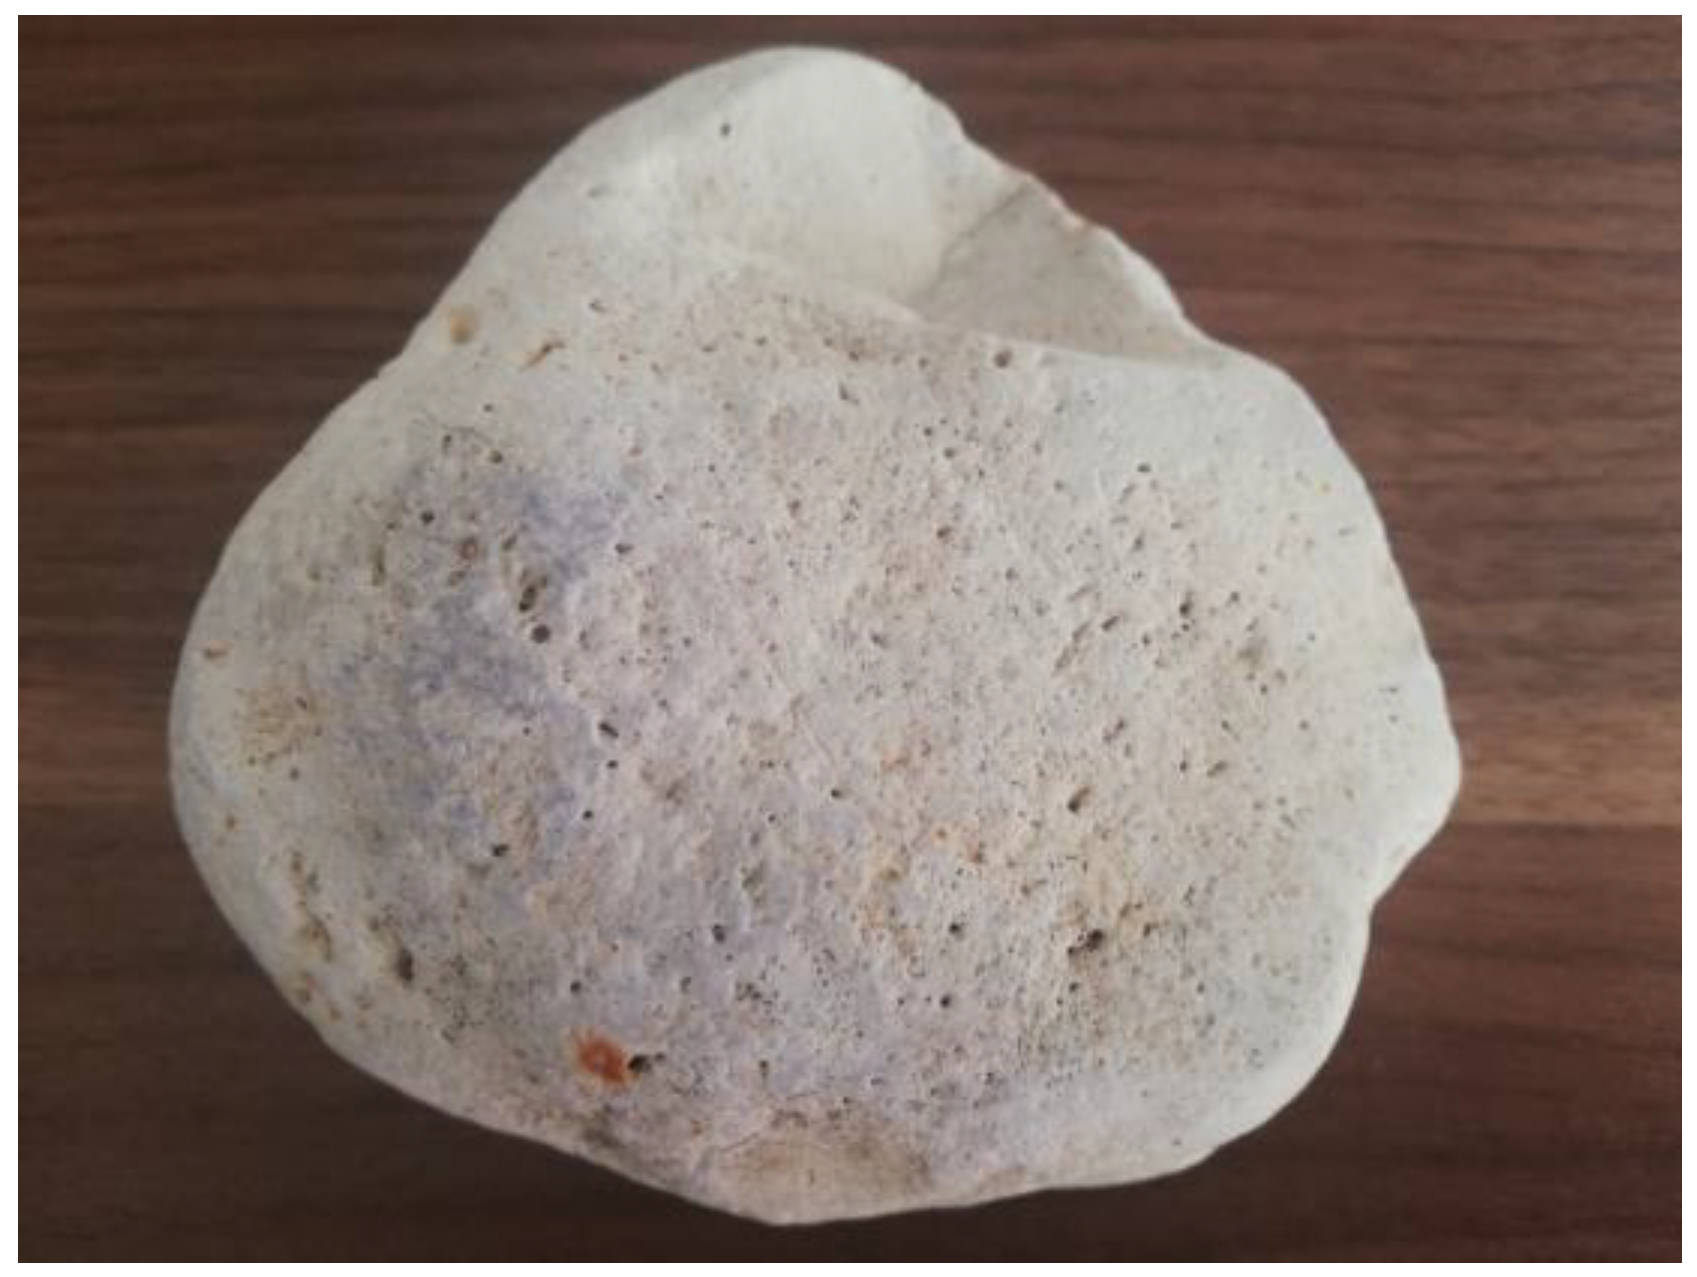
Figure 2.
Correlation between void indexes and liquid content of the limestone rock samples saturated with water and HHM vs. corresponding porosities.
Figure 2.
Correlation between void indexes and liquid content of the limestone rock samples saturated with water and HHM vs. corresponding porosities.
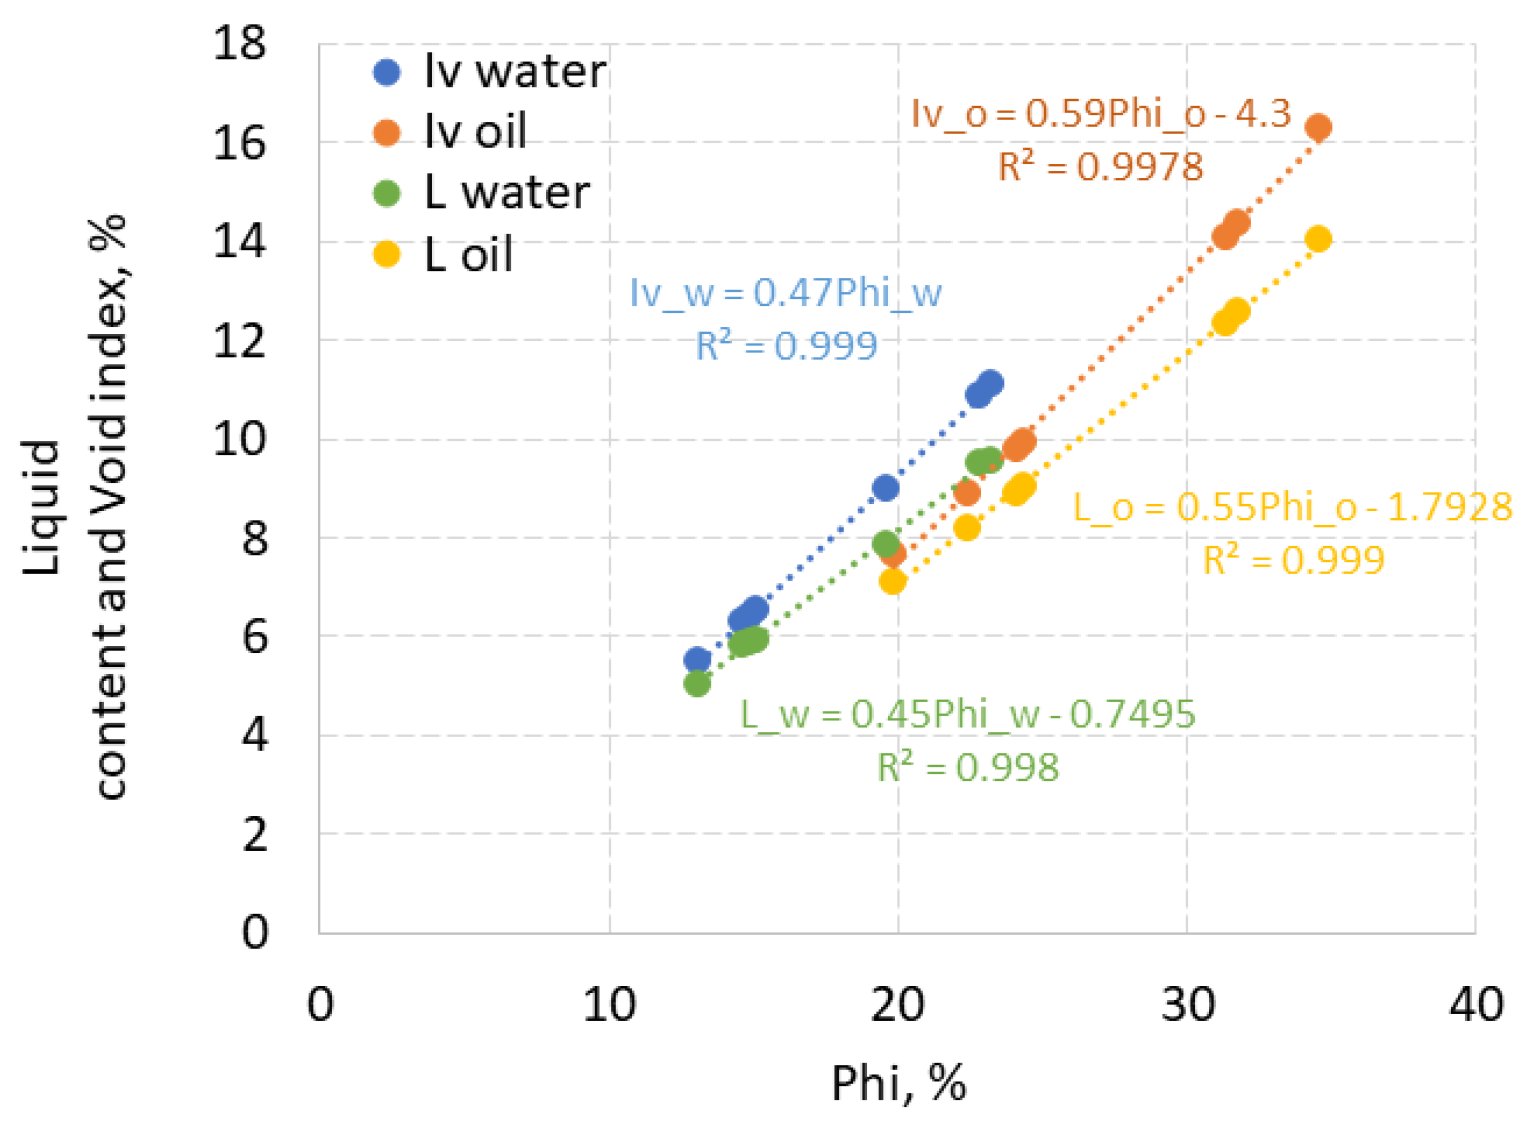
Figure 3.
Comparison of porosity, liquid content and void index measured for samples saturated with deionized water and HHM. The black dashed line indicates equal values.
Figure 3.
Comparison of porosity, liquid content and void index measured for samples saturated with deionized water and HHM. The black dashed line indicates equal values.
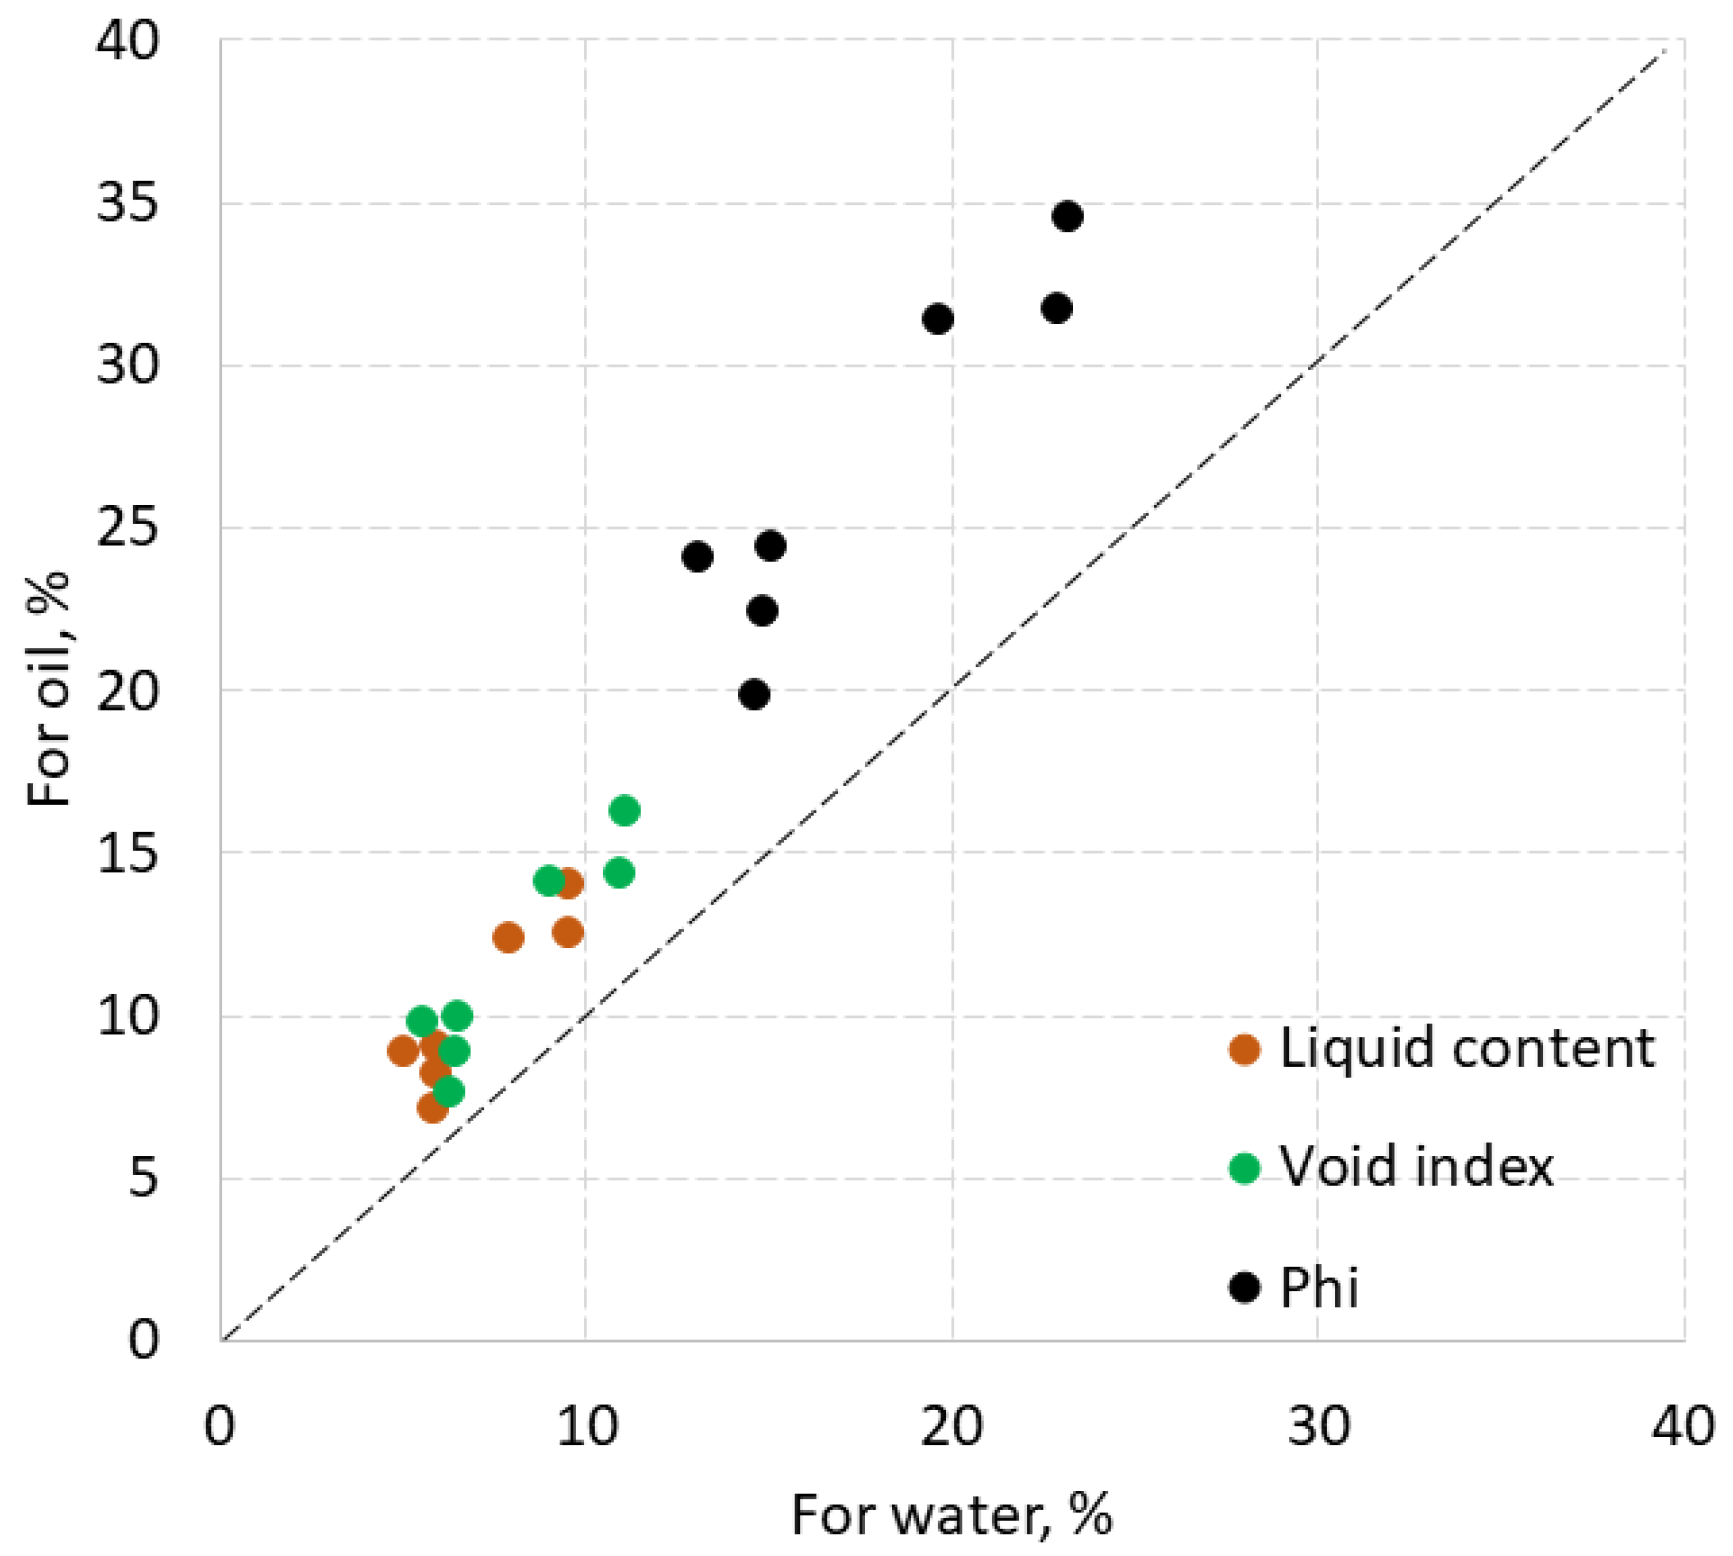
Figure 4.
Composition of experimental HHM represented by relative intensity of carbon number group (Cn).
Figure 4.
Composition of experimental HHM represented by relative intensity of carbon number group (Cn).
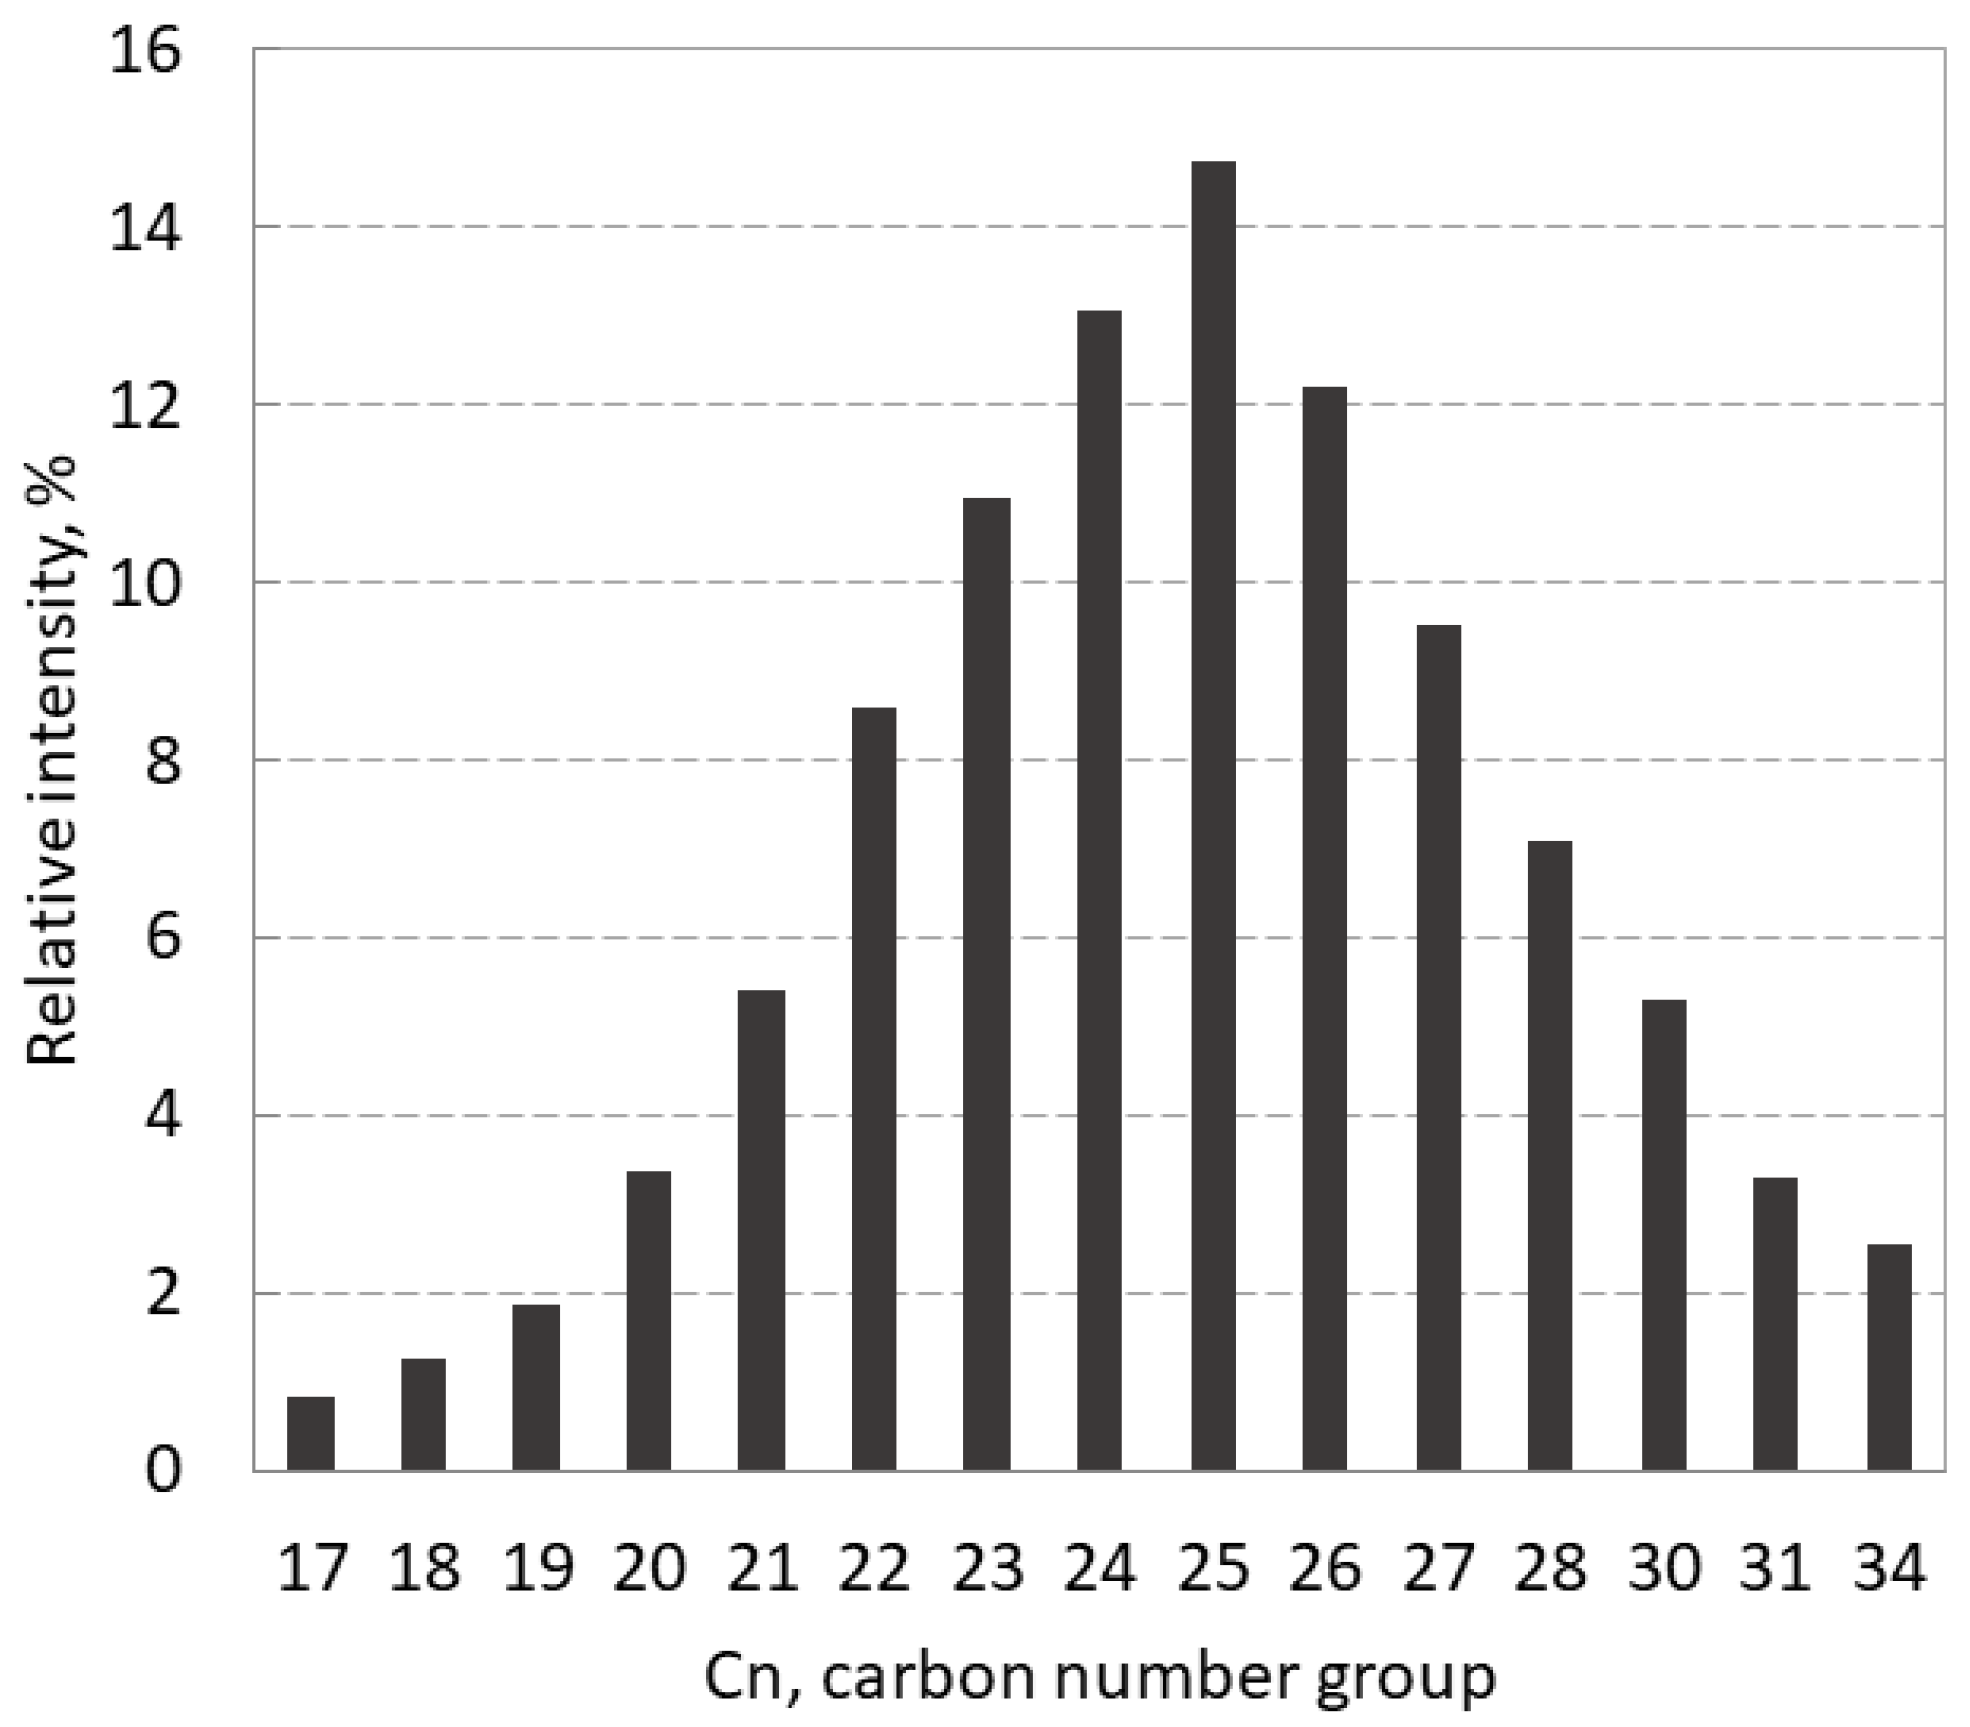
Figure 5.
Liquid recovery of HHM by supercritical carbon dioxide in the range of 15-60 MPa. In the pressure range of 15-47.5 MPa, the recovery is below 10% due to freezing. Phase boundaries are shown in different colors, where liquid L1 is carbon dioxide enriched with hydrocarbons, liquid L2 is hydrocarbons enriched with carbon dioxide, and V is a vapor phase [26].
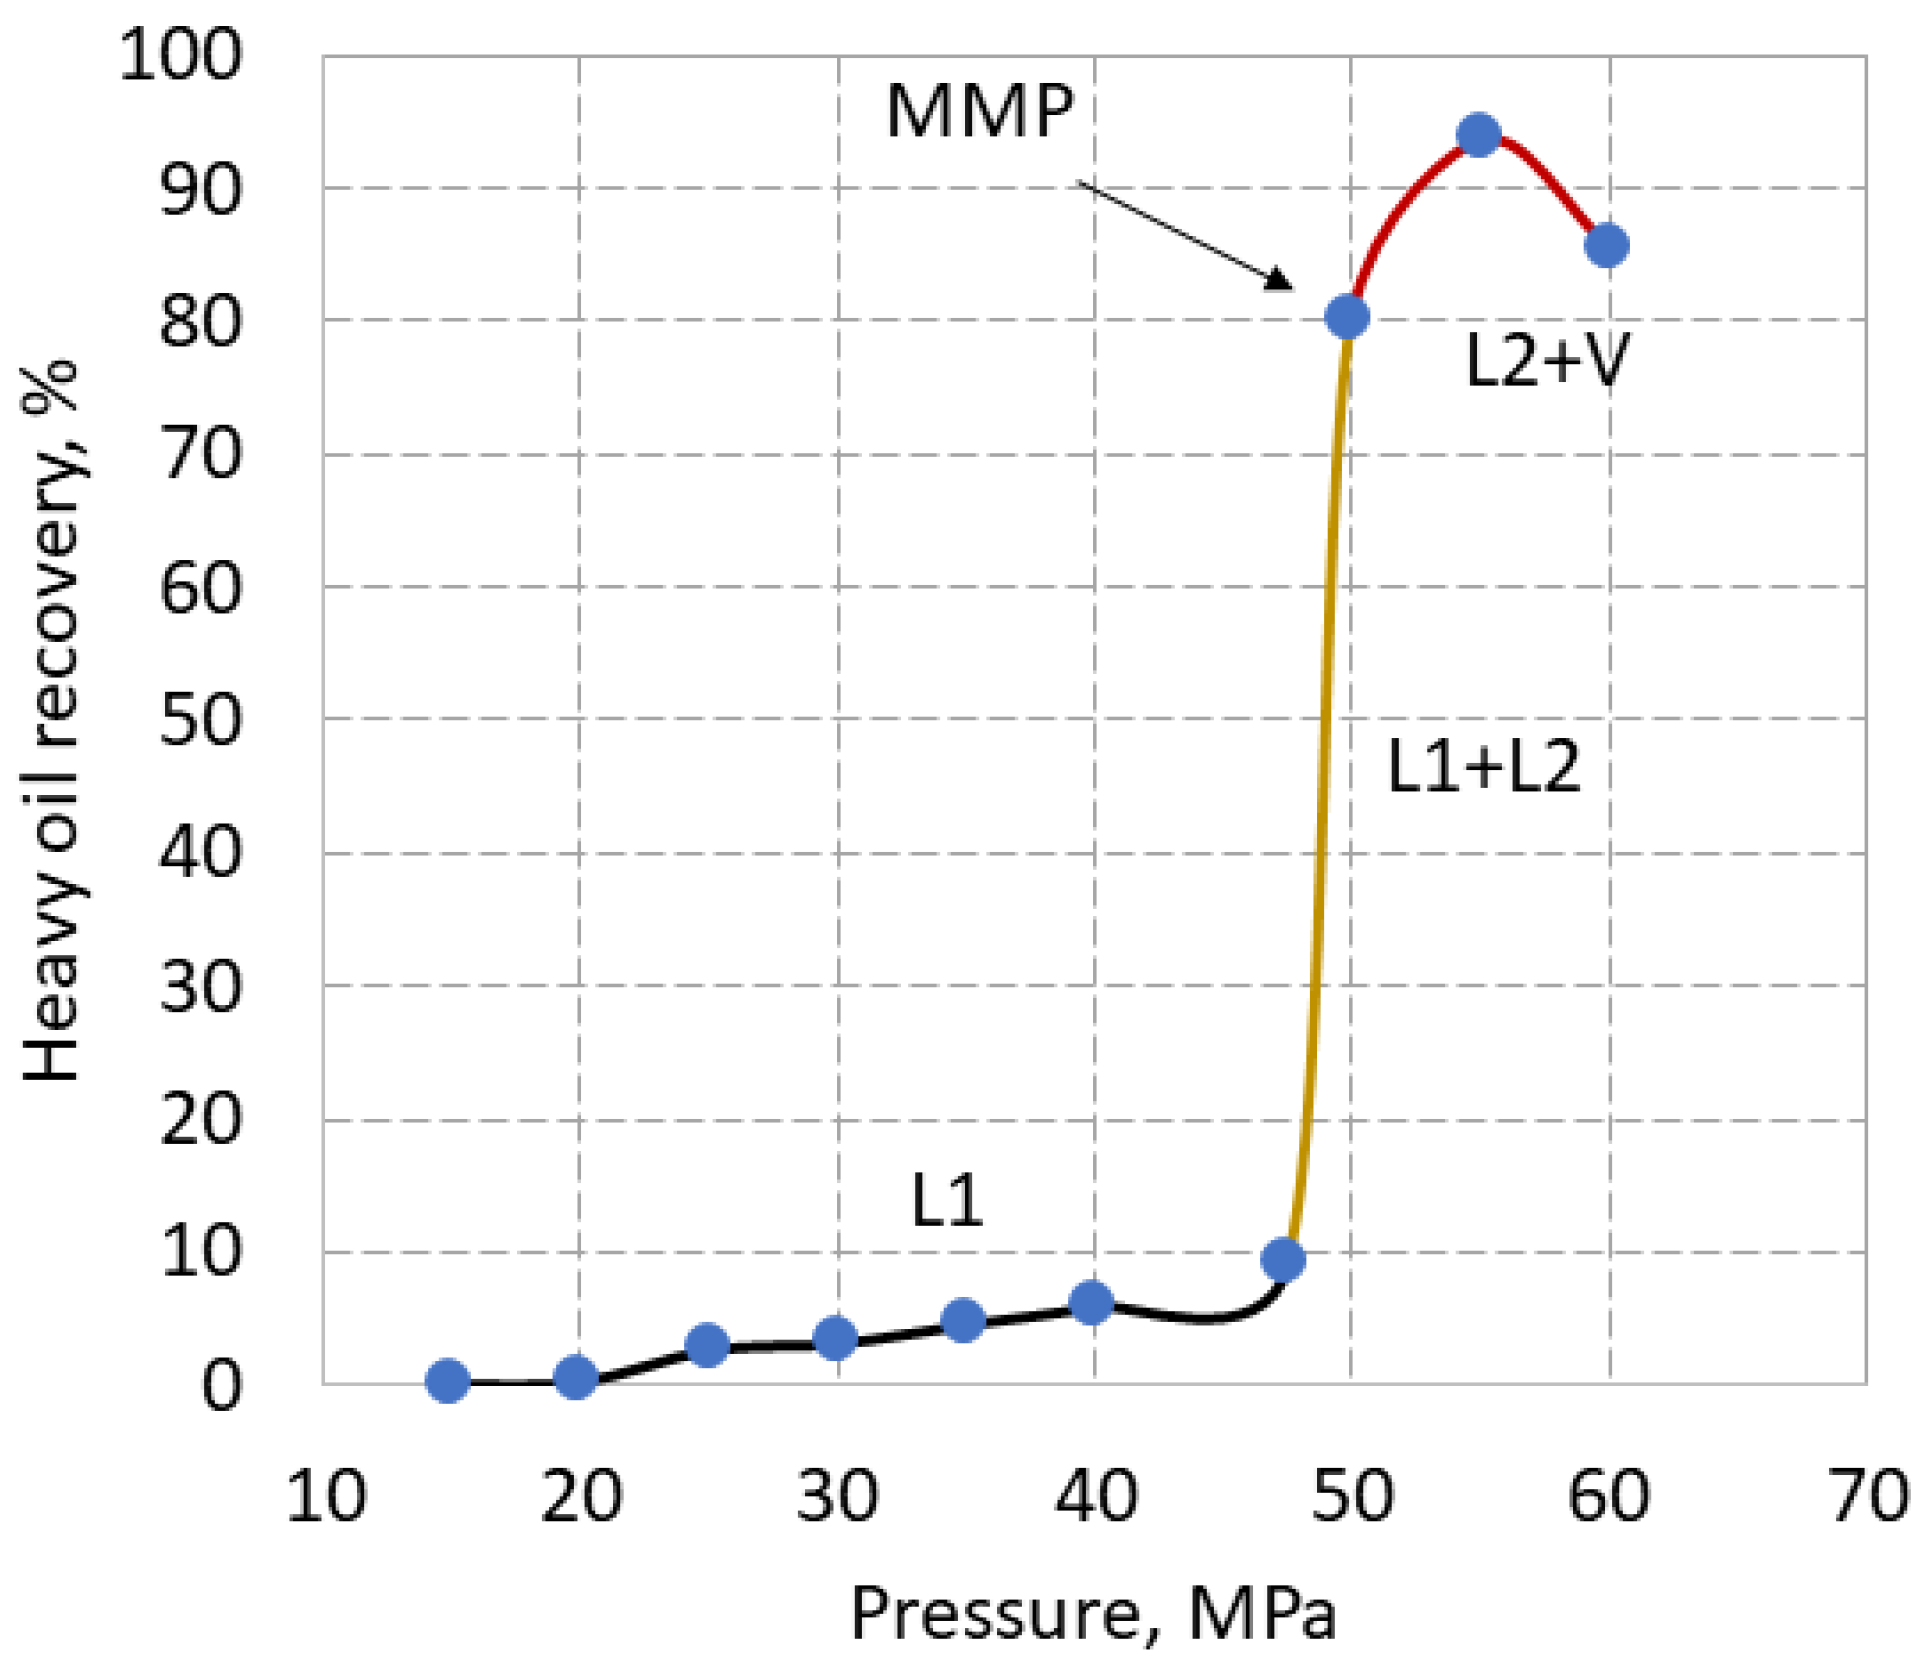
Figure 6.
Liquid recovery of HHM from sandstone by SC-CO2 at 43, 50 and 56 MPa. Labels indicate HHM porosity. Outgassing losses are about 2%.
Figure 6.
Liquid recovery of HHM from sandstone by SC-CO2 at 43, 50 and 56 MPa. Labels indicate HHM porosity. Outgassing losses are about 2%.
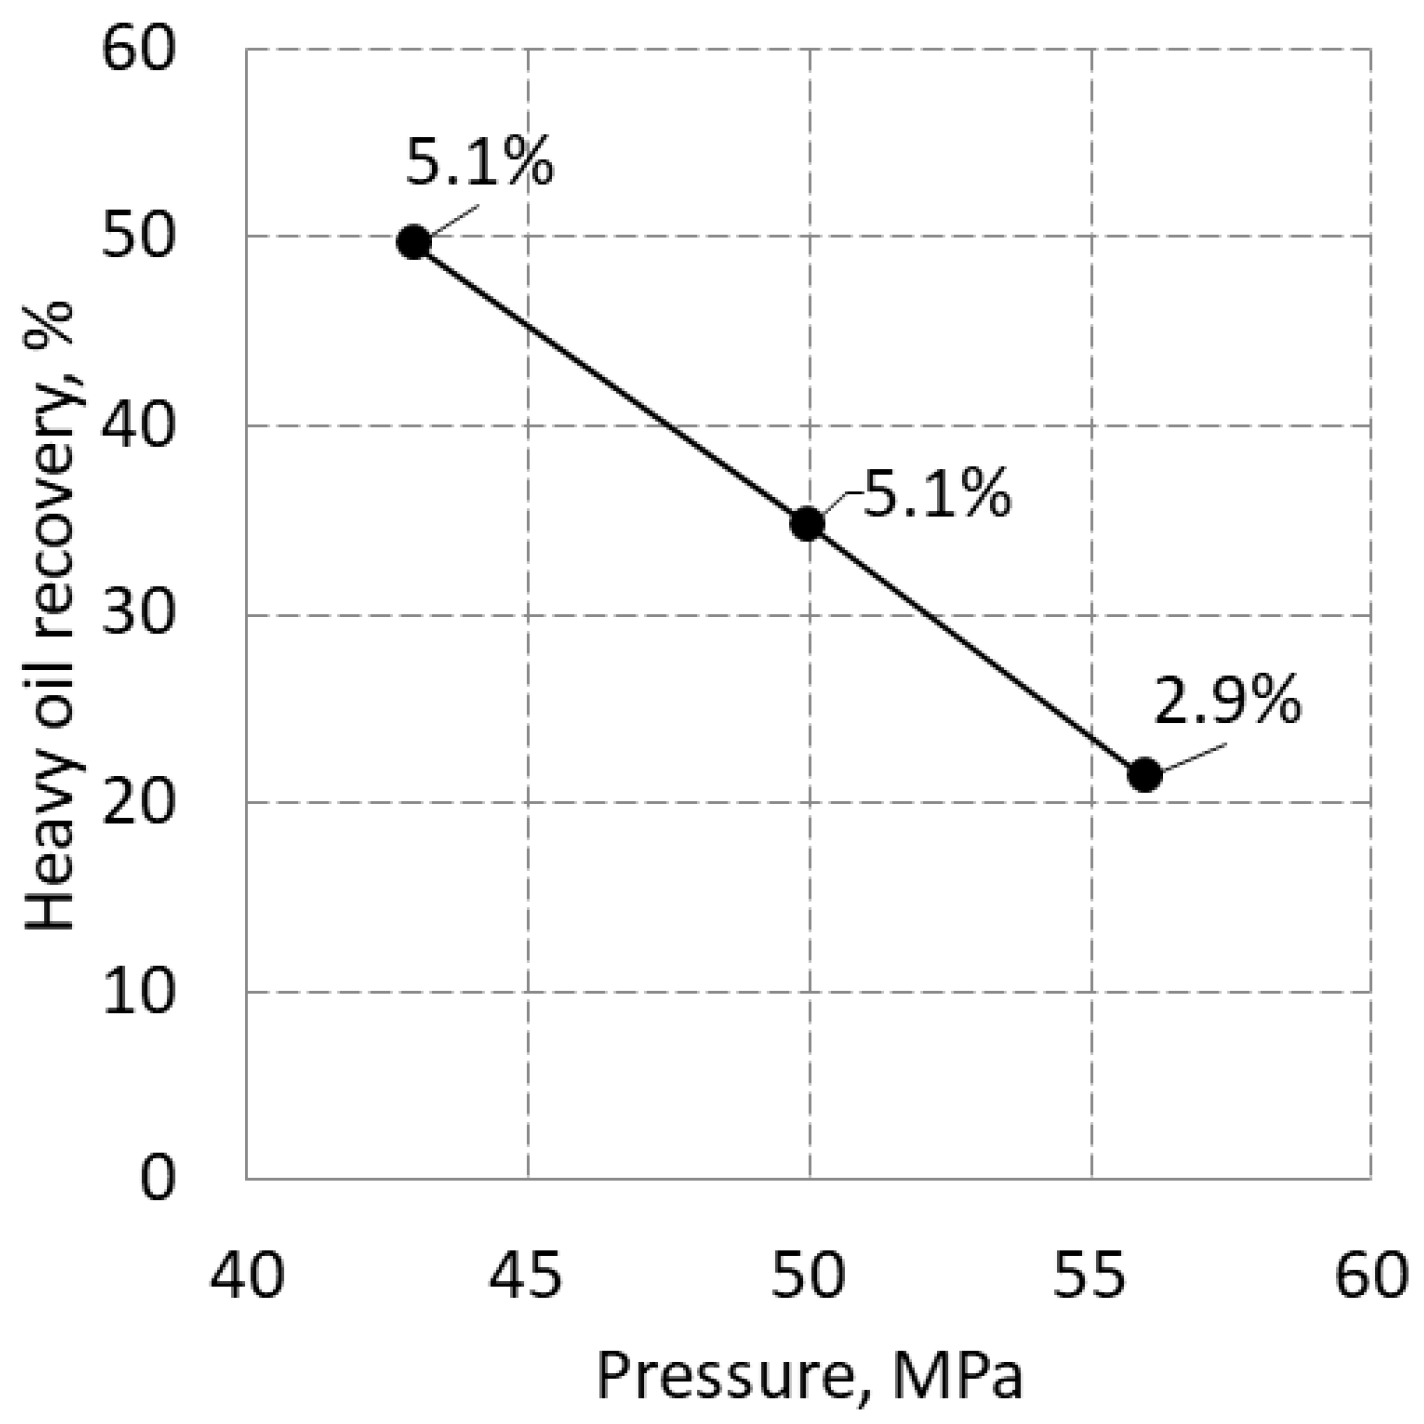
Figure 7.
Total, liquid and vapor recovery of used motor oil by SC-CO2 at 70 oC [31].
Figure 7.
Total, liquid and vapor recovery of used motor oil by SC-CO2 at 70 oC [31].
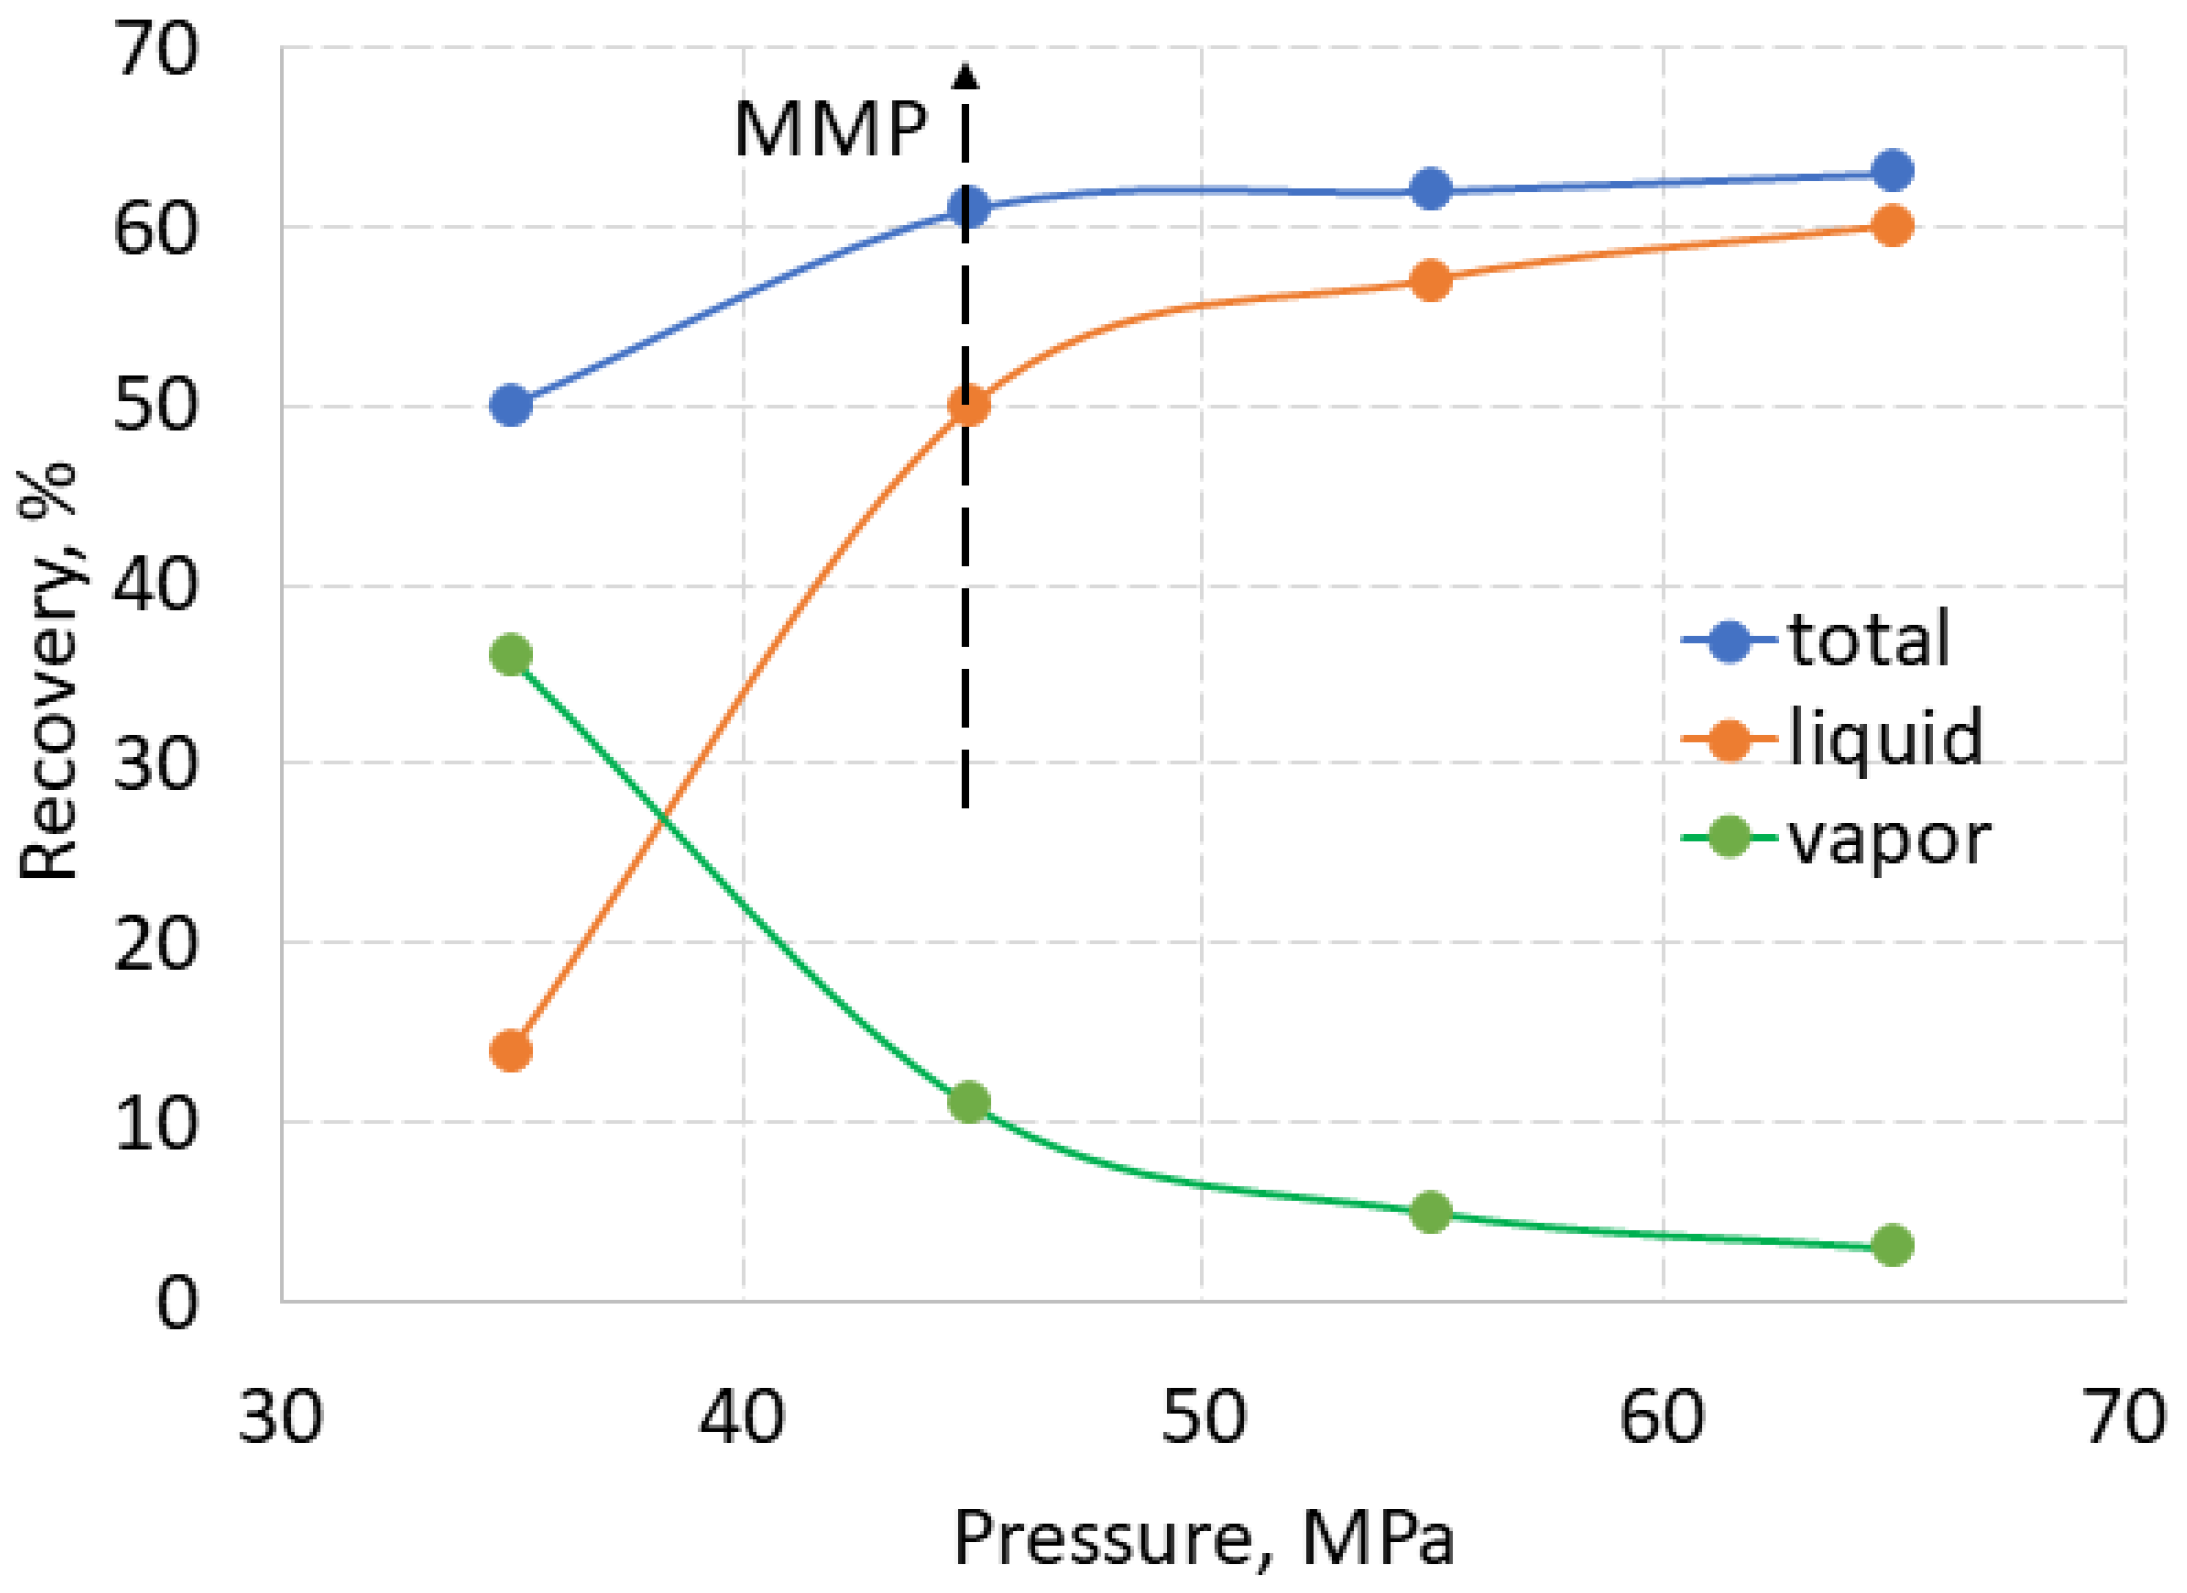
Figure 8.
Recovery of bitumen from oil sand of Ofoso deposit (Nigeria) by SC-CO2 [28].
Figure 8.
Recovery of bitumen from oil sand of Ofoso deposit (Nigeria) by SC-CO2 [28].
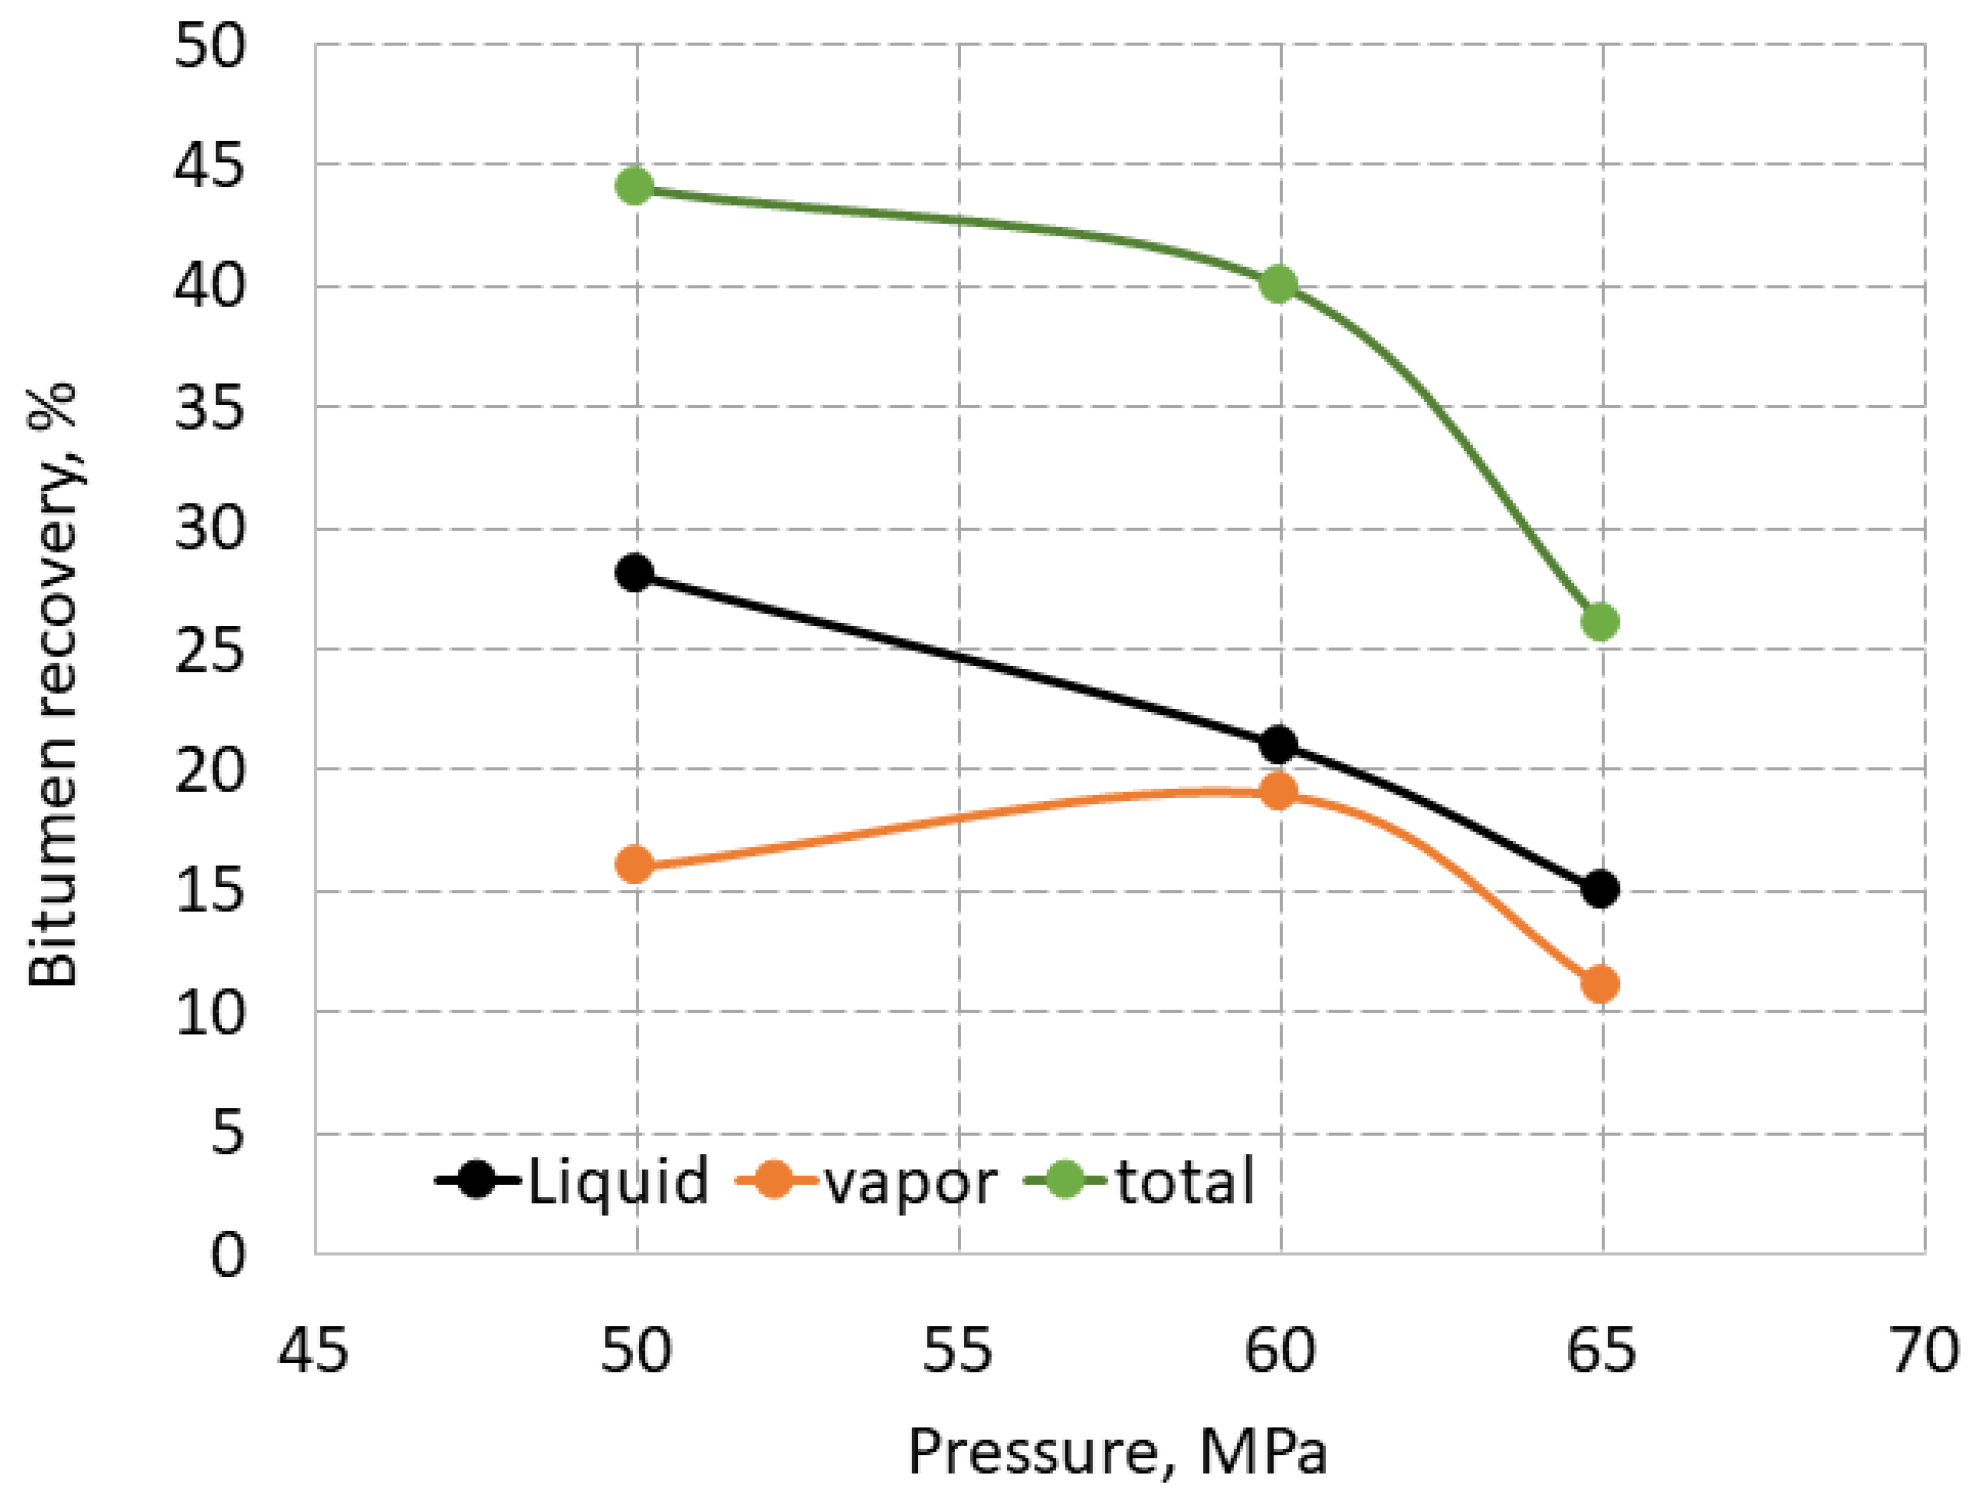
Figure 9.
Recovery of HHM from limestone by SC-CO2 in the range of 25 -56 MPa. Labels on the data of total recovery indicate porosity determined using HHM.
Figure 9.
Recovery of HHM from limestone by SC-CO2 in the range of 25 -56 MPa. Labels on the data of total recovery indicate porosity determined using HHM.
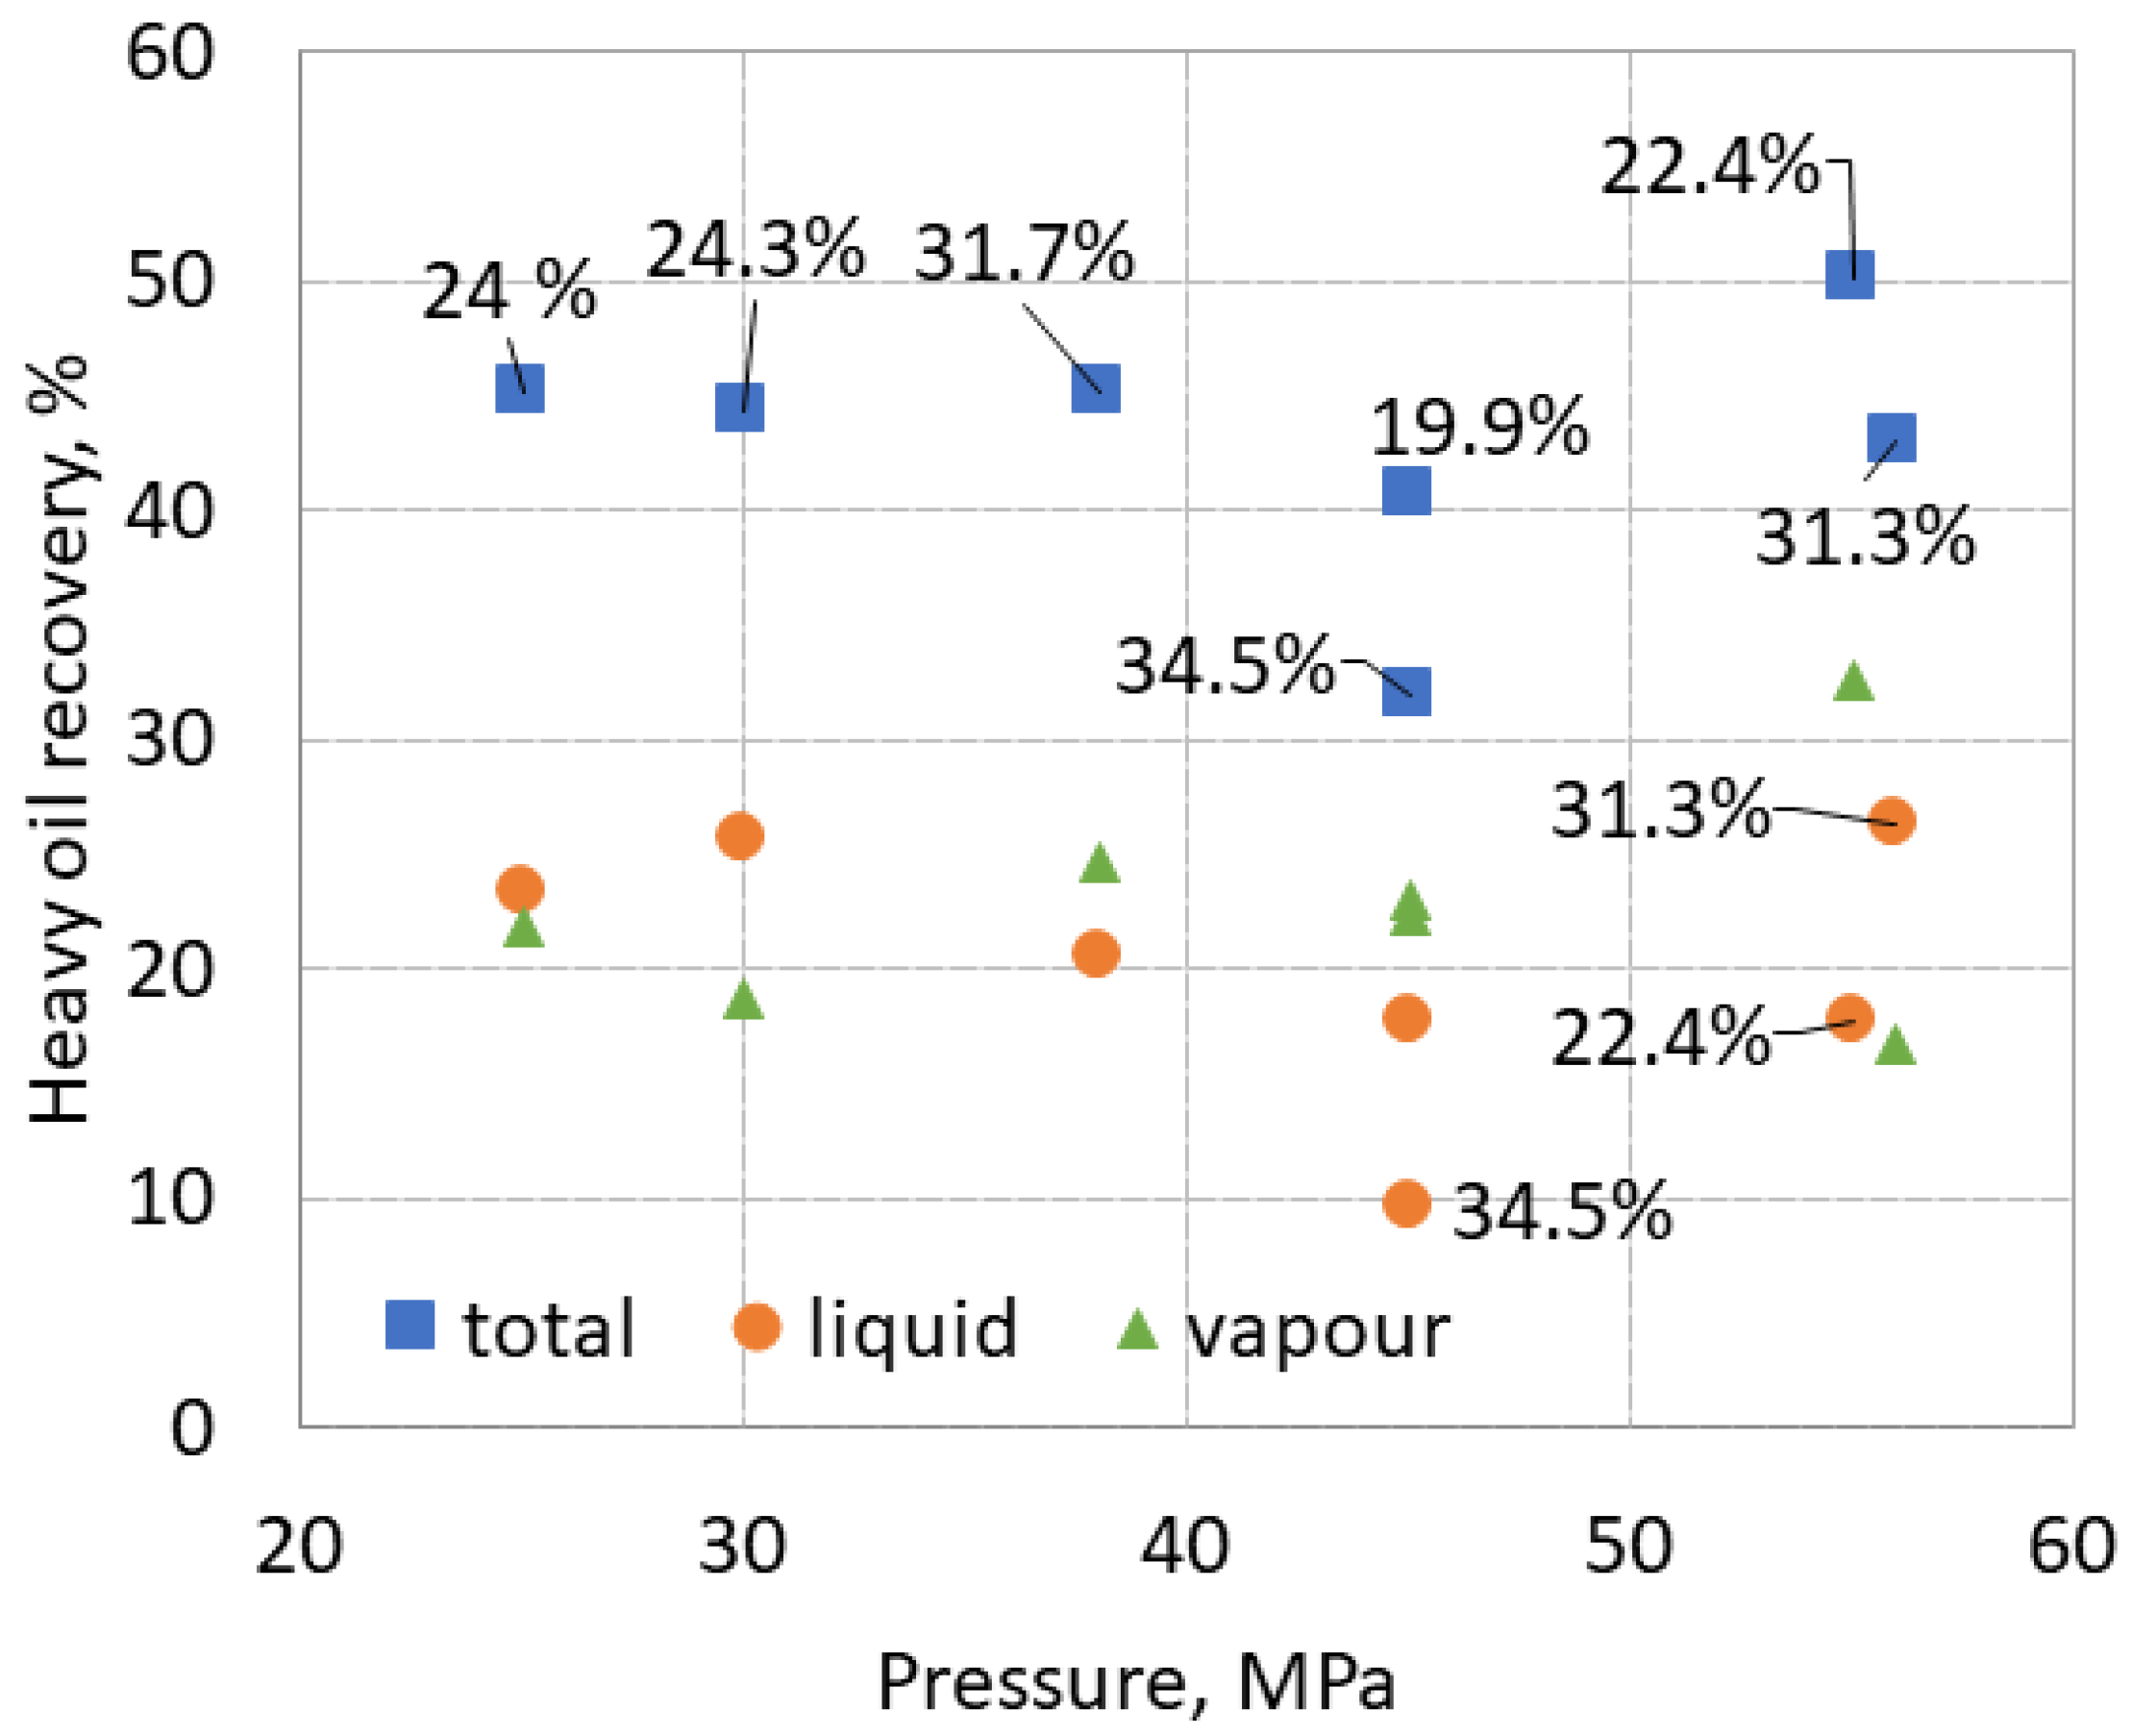
Figure 10.
Total and liquid recovery of HHM vs. rock volume (V rock) of limestone in the range of 25 -56 MPa. The samples of highest weights and surface areas in the dashed oval show increase in liquid recovery.
Figure 10.
Total and liquid recovery of HHM vs. rock volume (V rock) of limestone in the range of 25 -56 MPa. The samples of highest weights and surface areas in the dashed oval show increase in liquid recovery.
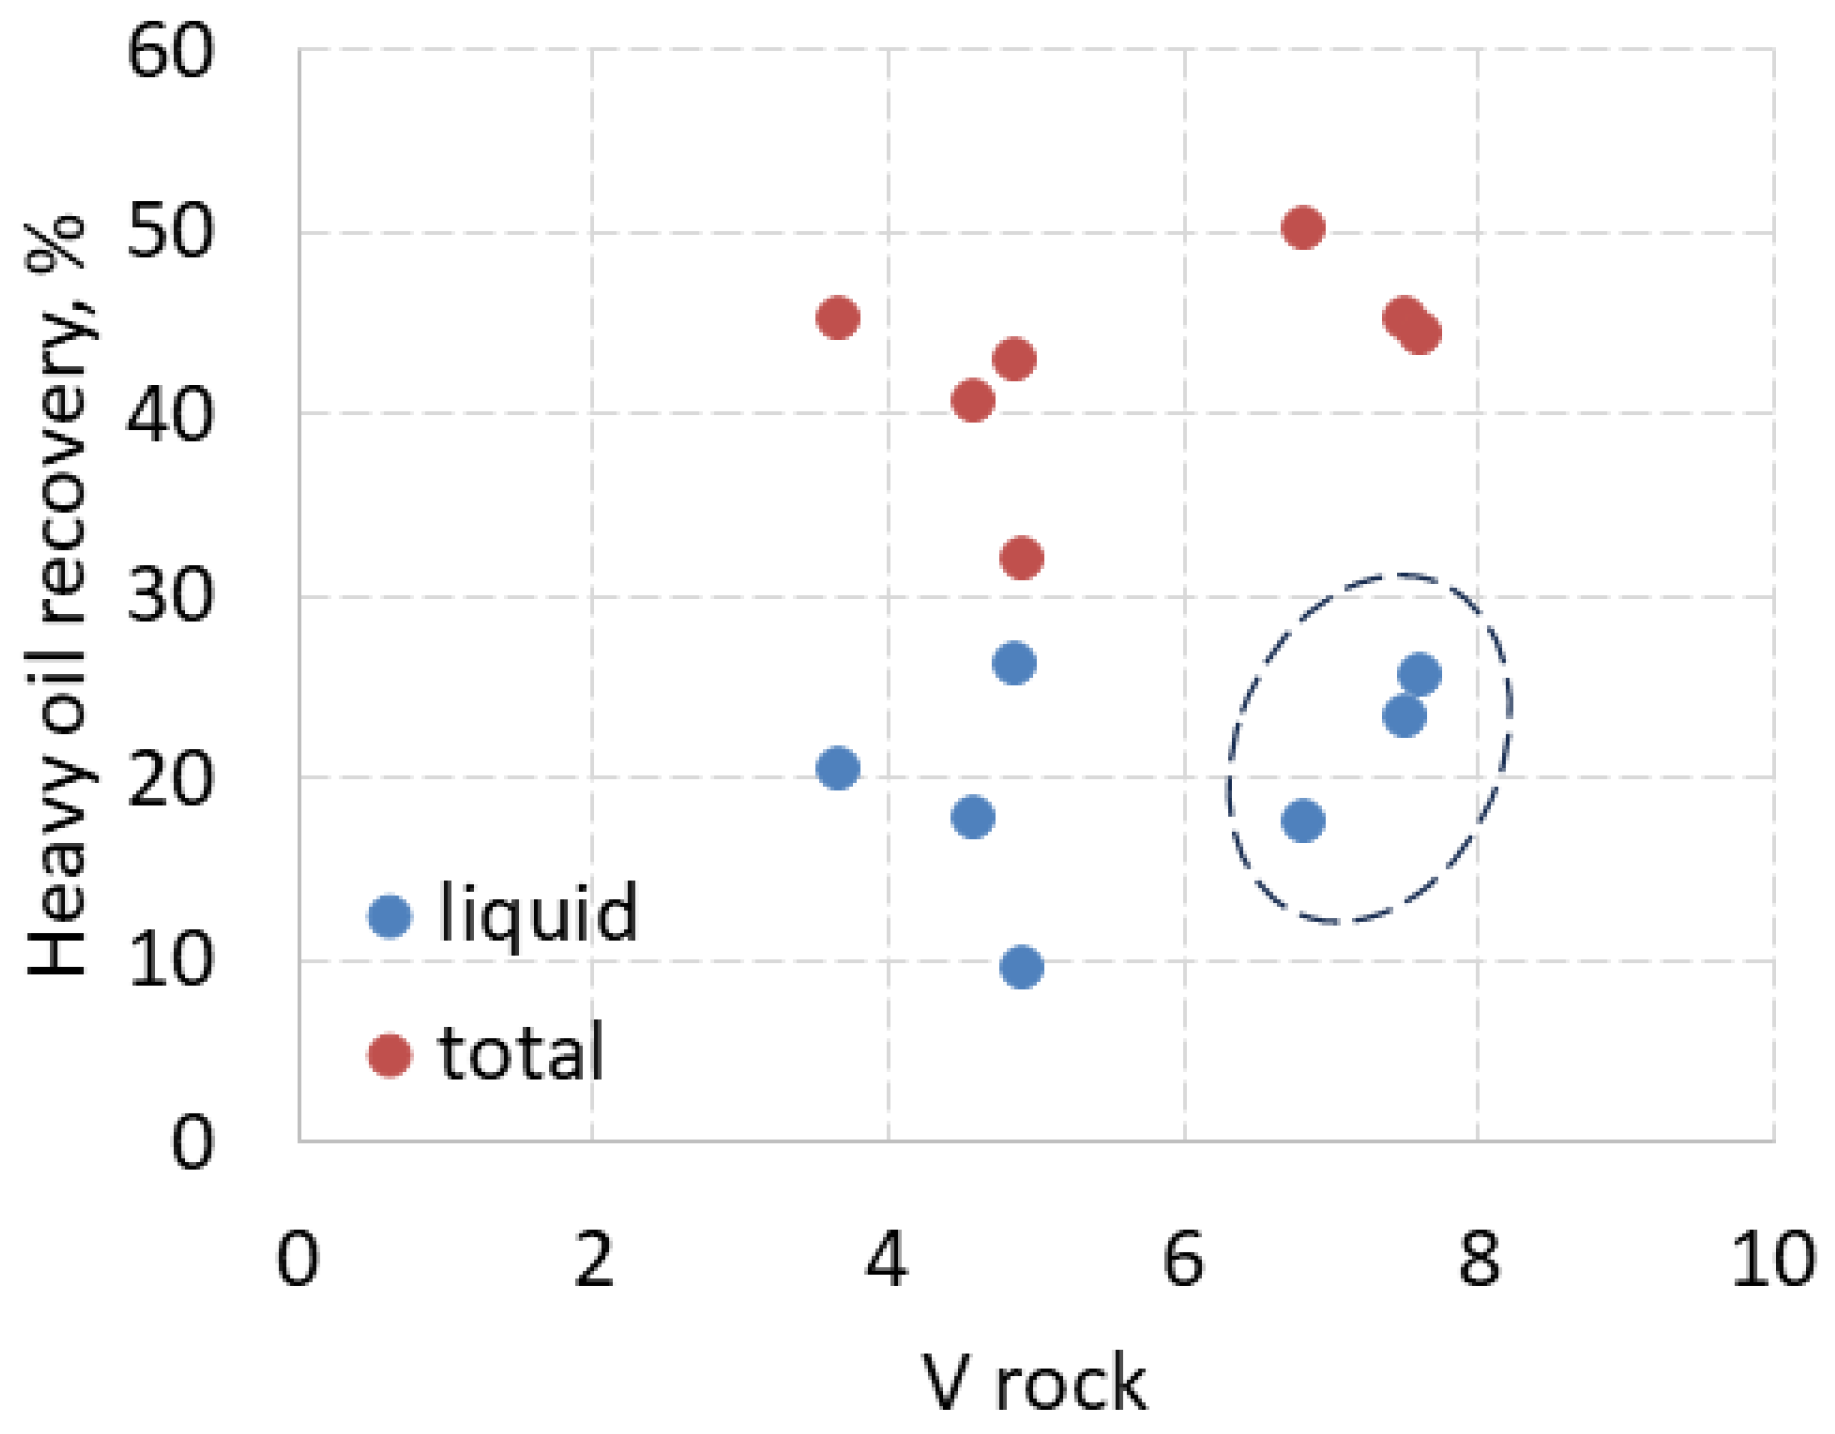
Figure 11.
Total and liquid recovery of HHM of cavernous limestone in the range of 25 -56 MPa as a function of : a) HHM porosity; b) water porosity.
Figure 11.
Total and liquid recovery of HHM of cavernous limestone in the range of 25 -56 MPa as a function of : a) HHM porosity; b) water porosity.
Disclaimer/Publisher’s Note: The statements, opinions and data contained in all publications are solely those of the individual author(s) and contributor(s) and not of MDPI and/or the editor(s). MDPI and/or the editor(s) disclaim responsibility for any injury to people or property resulting from any ideas, methods, instructions or products referred to in the content. |
© 2024 by the authors. Licensee MDPI, Basel, Switzerland. This article is an open access article distributed under the terms and conditions of the Creative Commons Attribution (CC BY) license (http://creativecommons.org/licenses/by/4.0/).
Copyright: This open access article is published under a Creative Commons CC BY 4.0 license, which permit the free download, distribution, and reuse, provided that the author and preprint are cited in any reuse.


