

Submitted:
27 April 2024
Posted:
28 April 2024
You are already at the latest version
Abstract
Polarimetry is used to determine the Stokes parameters of a laser beam. Once all four S0,1,2,3 parameters are determined, the state of polarisation is established. Upon reflection of a laser beam with the defined S polarisation state, the directly measured S parameters can be used to determine the optical properties of the surface, which modified the S-state upon reflection. Here, we demonstrate polarimetry for the determination of surface anisotropies related to birefringence and dichroism from different materials, which have a common feature of linear patterns of different alignments and scales. It is shown that polarimetry in the back-reflected light is complementary to ellipsometry and four-polarisation camera imaging.
Keywords:
polarimetry
; anisotropy
; birefringence
; four-polarisation method
1. Introduction
Stokes polarimetry [1] is a powerful optical characterisation technique for determination of the state of light: incoherent and coherent [2]. Linearly and circularly polarised illumination of materials can be used for the identification of chirally active biological and organic materials [3]. Optical activity, dextrorotatory, (+ or D) and levorotatory, (- or L) specific rotation affect the state of polarisation of transmitted light, which is measured by a polarimeter. Once are known, they set a coordinate basis for a convenient presentation of light state on the Poincaré sphere: linear polarisations on the equator and circular on the poles with the arbitrary state at other locations on the surface (can be considered mixture of circular and linear). When incident polarisation is known, i.e., Stokes vector is defined, measuring transmitted or reflected/scattered light is analyzed by polarimetry. If illumination is by natural light, it can also be represented by its polarisation state using Stokes vector [4]. The presence of strong magnetic fields and scattering can be inferred from astronomic polarimetry [5]. The changes in Stokes vector represent light-matter interaction in terms of a change of polarisation due to dichroism, birefringence, or/and scattering [6]. Also, strong transverse (along the r radial coordinate) gradients of refractive index n or permittivity cause transverse alteration of polarisation as along propagation (along z-axis) [7]. This can be utilized in remote sensing using optical detection, nanofabrication by ablation and strucutral modification [8] or light localisation and polymerisation inside nano-gaps [9]. A recent trend is to miniaturize Stokes polarimetry using waveplates, gratings, and metamaterials [10] or 2D materials [11]. For transmission geometry, very simple polarimeters with a high precision detection of polarisation changes were proposed [12,13]. Imaging polarimeters based on splitting the beam into three bases of two linear and circular polarisations without polarisation projection allows the use of all available light intensity for the Stokes polarimetry [14].
Reflection geometry is of the largest practical value due to the simplicity of the experiment and its remote character, e.g., from a satellite on orbit or a drone/plane. Even though the exact properties of materials are not known, due to complex composition and structure, the anisotropy of patterns can be recognized. Importantly, using polarization analysis, those anisotropies can be recognized at the resolution, which is up to twenty times below the diffraction limit of the used focusing optics as was demonstrated for IR transmittance [15]. It was shown that reflection from gold half-mirrors at degree of incidence, which is typical in optical microscopy, has to be measured by polarimetry for a reliable description of the polarisation state of the reflected light rather than relying on analytical solutions based on real and imaginary parts of refractive index , which affect the phase of reflected light [16]. Reflection from gold half-mirror was preserving the degree of polarisation of the incident light [16], however the phase of reflected light was dependent on the complex refractive index at the wavelength of incidence.
Here, we show the determination of optical anisotropy related to the phase delay in back-reflection geometry using laser polarimetry. The principle is shown using a microscope, however, its generic principle implies that measurements in industrial and remote sensing settings with illumination-detection are possible. Different patterns of dielectric and conductive materials with linear alignment at range of feature sizes and complexities were used to test polarimetry in reflection. Four-polarisation (4-pol.) camera imaging at four angles is compared with four angles polarimetry measurements from a single point of illumination.
2. Methods and Materials
2.1. Polarimetry Method
Three Stokes parameters and the degree of polarization p were directly measured by polarimeter (PAX1000, Thorlabs), which works on the principle of rotating waveplate and a fixed linear polariser in front of the detector; is the incident intensity. Convenient visualisation of Stokes vector is Poincaré sphere, which is linked to the in-plane presentation of polarisation ellipsis (Figure 1). The orientation (azimuth) angle () and the ellipticity angle () are calculated respectively by (for normalised case ) [2]:
By introduction of an auxiliary angle () defined in the principle -plane (-polarizations) , a set of equations is used to determine and phase retardance from the determined and [2]:
The pair of can be solved from the measured Stokes vector, hence, from .
Analytical expressions are also available as well as follows from an equivalent to Poincaré sphere presentation. Namely, the observable polarisation sphere (OPS) upon conversion of coordinates into ; see OPS inset in Figure 1. Since and , we obtain (). This provides direct analytical access to from the measured Stokes vector. With few steps, expressions Eqns. 3 and 4 yields (). These analytical expressions were used for determination and . We used a linearly polarised laser beam, which is useful for fast assessment of the Stokes parameters in reflected beam. Namely, from and expressions, once (horizontal x-pol.), is expected since the product of and defines . This rule was observed in experiments.
2.2. Imaging
Imaging of samples and polarisation of reflected light was analysed using 4-pol. camera (CS505MUP1, Thorlabs). For the linear polarisation of incidence, it can only be used for the determination of and (this study). With prepared circular polarised incidence, all components of the Stokes vector become accessible [17]. The 4-pol. camera and polarimeter were setup on Olympus BX51 microscope for simultaneous operation (Figure 1); Xe-lamp condensor was used for a white light top-illumination of the sample. Importantly, circular broad band polarisers used in front of imaging cameras in modern microscopes have to be removed to use 4-pol. camera and it was done in this study (one quadrant of 4-pol. camera image should be dark upon linearly polarised illumination). It was used for the alignment of 4-pol. camera by setting equal intensities of quadrants on the histogram. Side-port was used to introduce a 405 nm laser beam in the reflection geometry.
For structural surface characterization, a field-emission scanning electron microscopy (SEM) was used (Raith150TWO).
2.3. Samples
Samples for study were selected with linear patterns: carbon fiber reinforced polymer (CFRP) and polymerised micro-grating. Abbreviated as CFRP samples were commercial plates of polyetheretherketone (PEEK) composites strengthened with carbon fibers weighing 66% (denoted as CF66 PEEK) featuring a unidirectional alignment of fibers, with a thickness of m. The reason behind the extensive use of carbon fibers as reinforcing material in PEEK-based composites is the robust interaction at the interface between the carbon fibers and the PEEK matrix [18]. The laser polymerised micrometers wide and tall rods form a grating on a cover glass substrate. The polymer sample was Au-coated.
Samples with complex azimuthally oriented sub-wavelength scale patterns were made on Si by fs-laser ablation and nanofabricated on a membrane of polycrystalline diamond.
3. Results and Discussion
Polarimetry as a single-point measurement at normal incidence was used in this study. The experimentally measured Stokes vector was then used for the determination of , hence, the ratio of , which is equivalent to in s,p-polarisations defined in the plane of incidence. Noteworthy, is the reflectance of s- and p-pol. at normal incidence is the same for the E-field components from uniform material. However, anisotropy of light scattering can be present from uneven surfaces for the two perpendicular orientations of the incident E-field. This is explored in the current study. If only anisotropy in scattering or absorbance within the skin depth is present, the polarisation ellipsis should be in the principle axis plane (), i.e., . Here the is the absorption coefficient [cm−1] and k is the imaginary part of the complex refractive index ).
Similarly, the or phase retardance due to birefringence within the skin depth or normal/anomalous dispersion regions around the absorption line (at fixed wavelength) as well as depolarization due to scattering can appear as retardance due to birefringence : . As for usual transmittance measurements, birefringence causes the opening of the ellipsis (a larger ellipticity angle ) and its orientation ; for a circular polarisation is obtained, the ellipsis becomes a circle (Figure 1). Left or right circular polarisation depends on the sign of with positive being LHC or anti-clockwise (looking into the beam) and RHC for the clockwise case.
When the short wavelength is used, scattering is strong and skin depth is shallow . We used nm cw-laser to determine Stokes vectors from normal reflection from different materials of industrial relevance: carbon fiber reinforced polymer (CFRP), laser polymerised grating patterns. Experiments were carried out at four sample orientation angles using polarimeter. The same four angles are used to reveal the orientation and anisotropy using linear polarizers in 4-pol. camera (Figure 1a).
3.1. Linear Patterns at Different Degrees of Alignment
Figure 3 and Figure 4 show and calculated from Stokes vector in reflection. The common feature is that the linear structures are 7-15 m in diameter while the focal spot is considerably smaller m for focusing. The CFRP sample has a black appearance with carbon fibers aligned preferentially in one direction. The polymerised SZ2080TM resist grating of period m was coated by nm Au film by sputtering. When measured from the Au side, the reflected polarisation was the same as that of the incident beam almost regardless of orientation, same was observed for flat Au mirror or Si wafer surface. Figure 4 shows results were laser was irradiating the sample from the uncoated glass side. In both cases of samples, the reflected Stokes parameters had a qualitatively similar behavior. When the delay was high and approaching , which would correspond to the birefringence defining a -waveplate condition, the auxiliary angle , which corresponds to negligible component. Thus, no circular polarisation was formed in reflection, i.e., the same linear polarisation as that of incidence () only phase delayed upon reflectance. When light back-reflects from interface with higher refractive index material (impinging from air ), the phase change of occurs. Interestingly, reflection from optically flat absorbing materials such as 100-m-thick kapton or cm epoxy puck, there was a recognisable ellipticity angle . This can be attributed to light the scattering and depolarisation at subsurface regions.
Figure 2.
Polarimetry of CFRP at 405 nm. (a) Normalised Stokes vector at different sample orientation angles measured for 40 s. (b) Azimuth and ellipticity of the polarisation ellipsis over measured time. Laser power 55 mW.
Figure 2.
Polarimetry of CFRP at 405 nm. (a) Normalised Stokes vector at different sample orientation angles measured for 40 s. (b) Azimuth and ellipticity of the polarisation ellipsis over measured time. Laser power 55 mW.
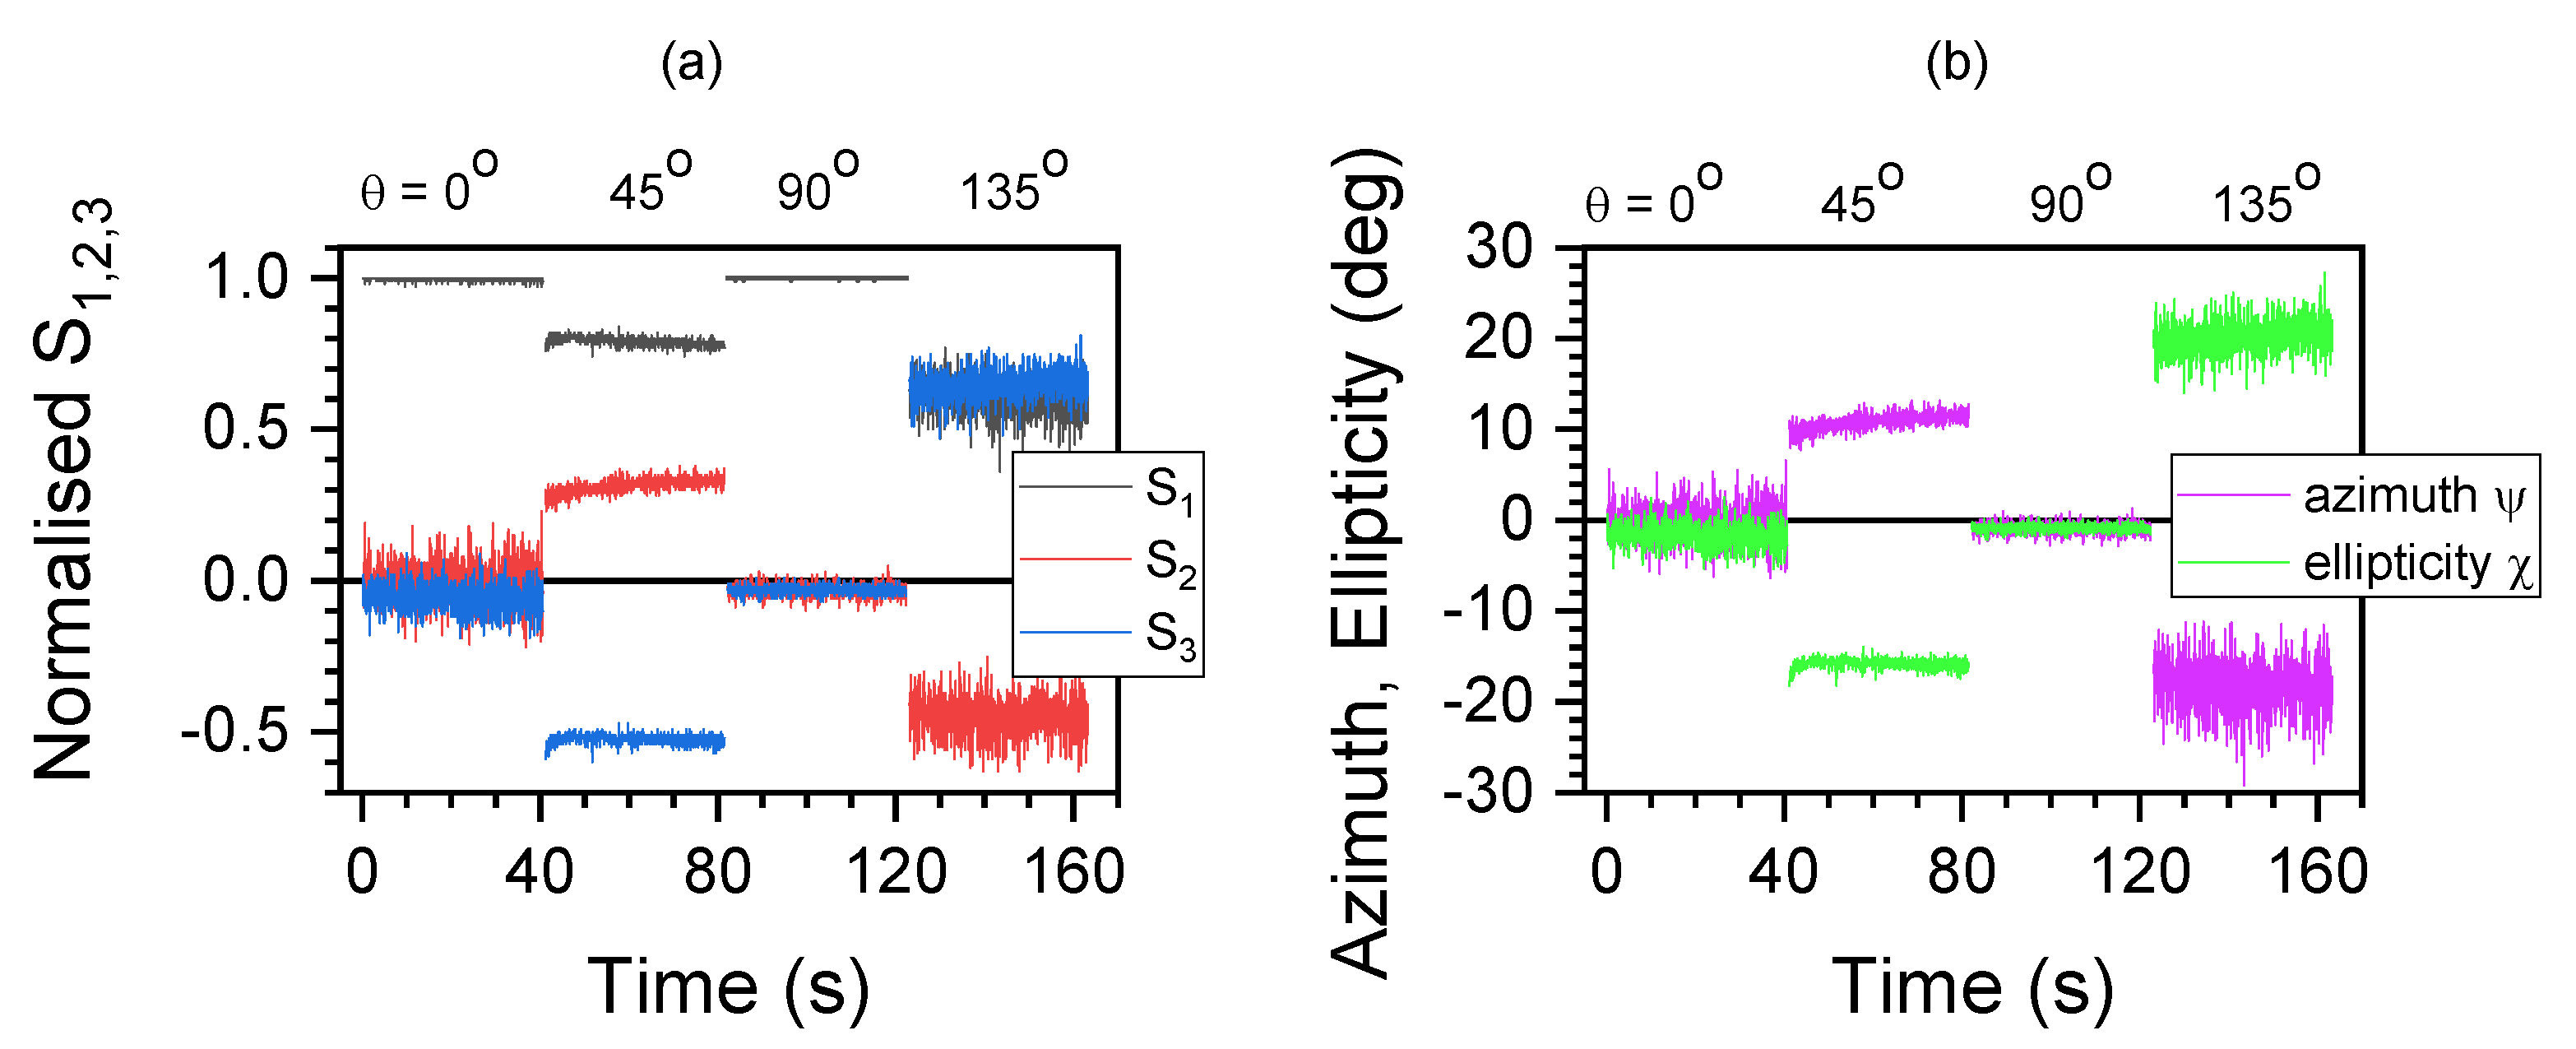
Figure 3.
(a) Microscopy image in reflection of carbon fiber reinforced polymer (CFRP) with apparent prevalent horizontal alignment of fibers. (b) The averaged azimuth and ellipticity angles , respectively, calculated from the measured Stokes vector at different orientation angles of the sample; corresponds to horizontal x-axis (see raw data in Figure 2). (c) The delay and auxiliary angle vs ; the trend of fit by is plotted, where and , . Illumination with cw-laser at 405 nm.
Figure 3.
(a) Microscopy image in reflection of carbon fiber reinforced polymer (CFRP) with apparent prevalent horizontal alignment of fibers. (b) The averaged azimuth and ellipticity angles , respectively, calculated from the measured Stokes vector at different orientation angles of the sample; corresponds to horizontal x-axis (see raw data in Figure 2). (c) The delay and auxiliary angle vs ; the trend of fit by is plotted, where and , . Illumination with cw-laser at 405 nm.
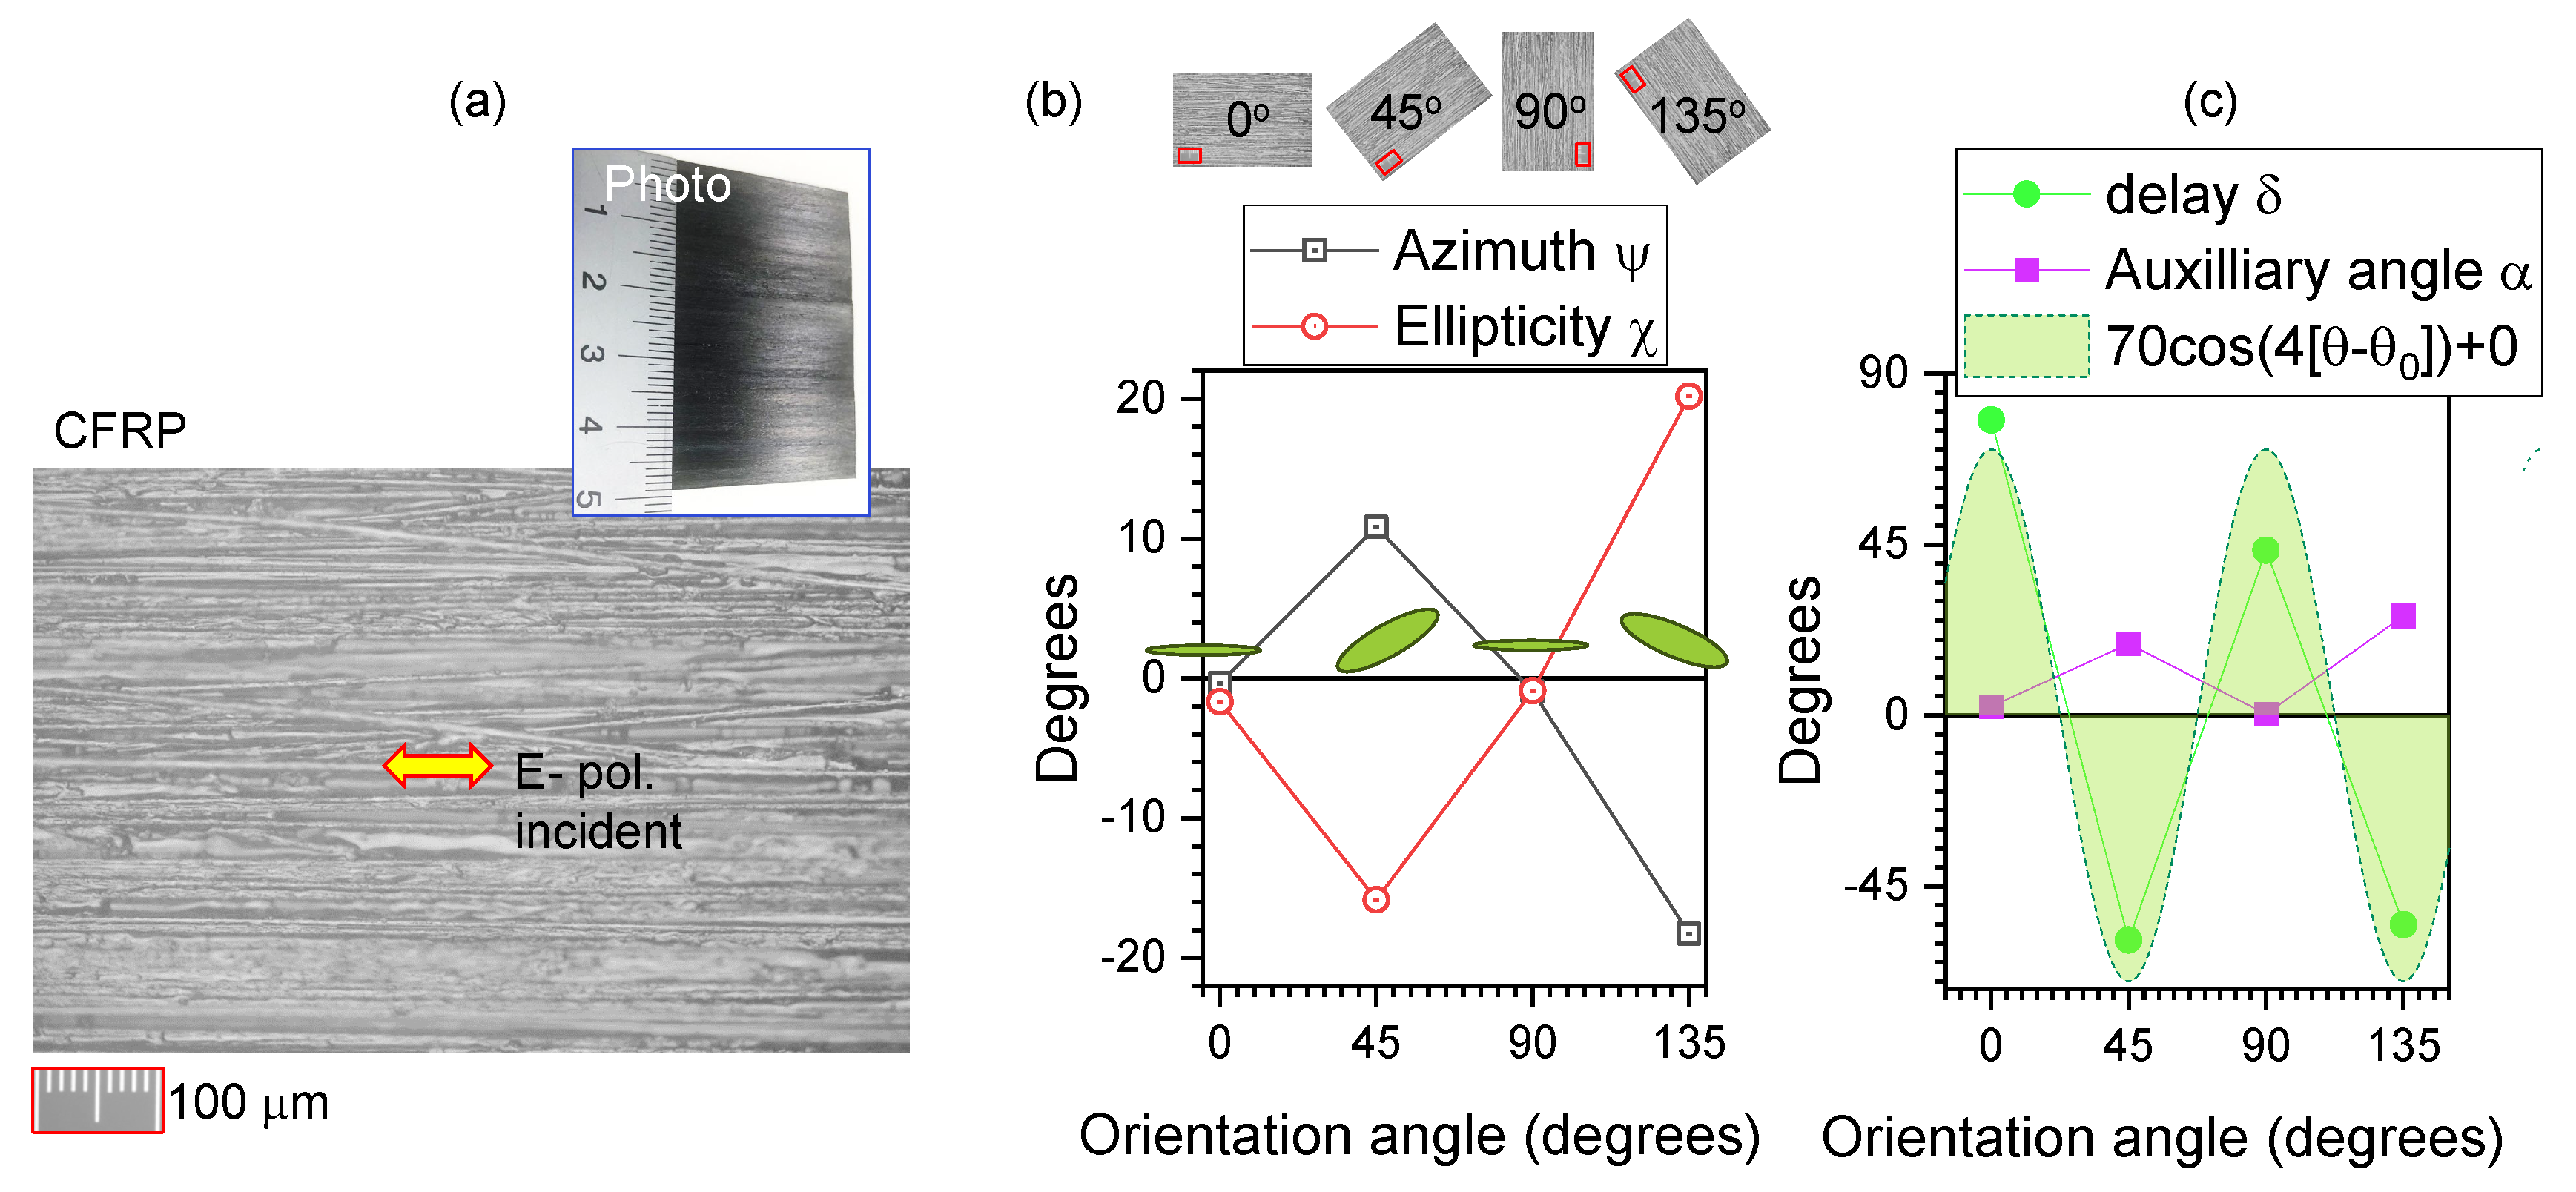
Figure 4.
(a) Microscopy image in reflection of SZ2080TM resist grating polymerised by fs-laser direct write. The schematic drawing shows sample’s structure: polymerised rods protruding for m out of cover glass (m thickness) and coated with nm of Au. (b) The azimuth and ellipticity angles , respectively, calculated from the measured Stokes vector at different orientation angles ; corresponds to horizontal x-axis. (c) The delay and auxiliary angle vs ; the trend of fit by is plotted, where and , . Illumination with cw-laser at 405 nm.
Figure 4.
(a) Microscopy image in reflection of SZ2080TM resist grating polymerised by fs-laser direct write. The schematic drawing shows sample’s structure: polymerised rods protruding for m out of cover glass (m thickness) and coated with nm of Au. (b) The azimuth and ellipticity angles , respectively, calculated from the measured Stokes vector at different orientation angles ; corresponds to horizontal x-axis. (c) The delay and auxiliary angle vs ; the trend of fit by is plotted, where and , . Illumination with cw-laser at 405 nm.
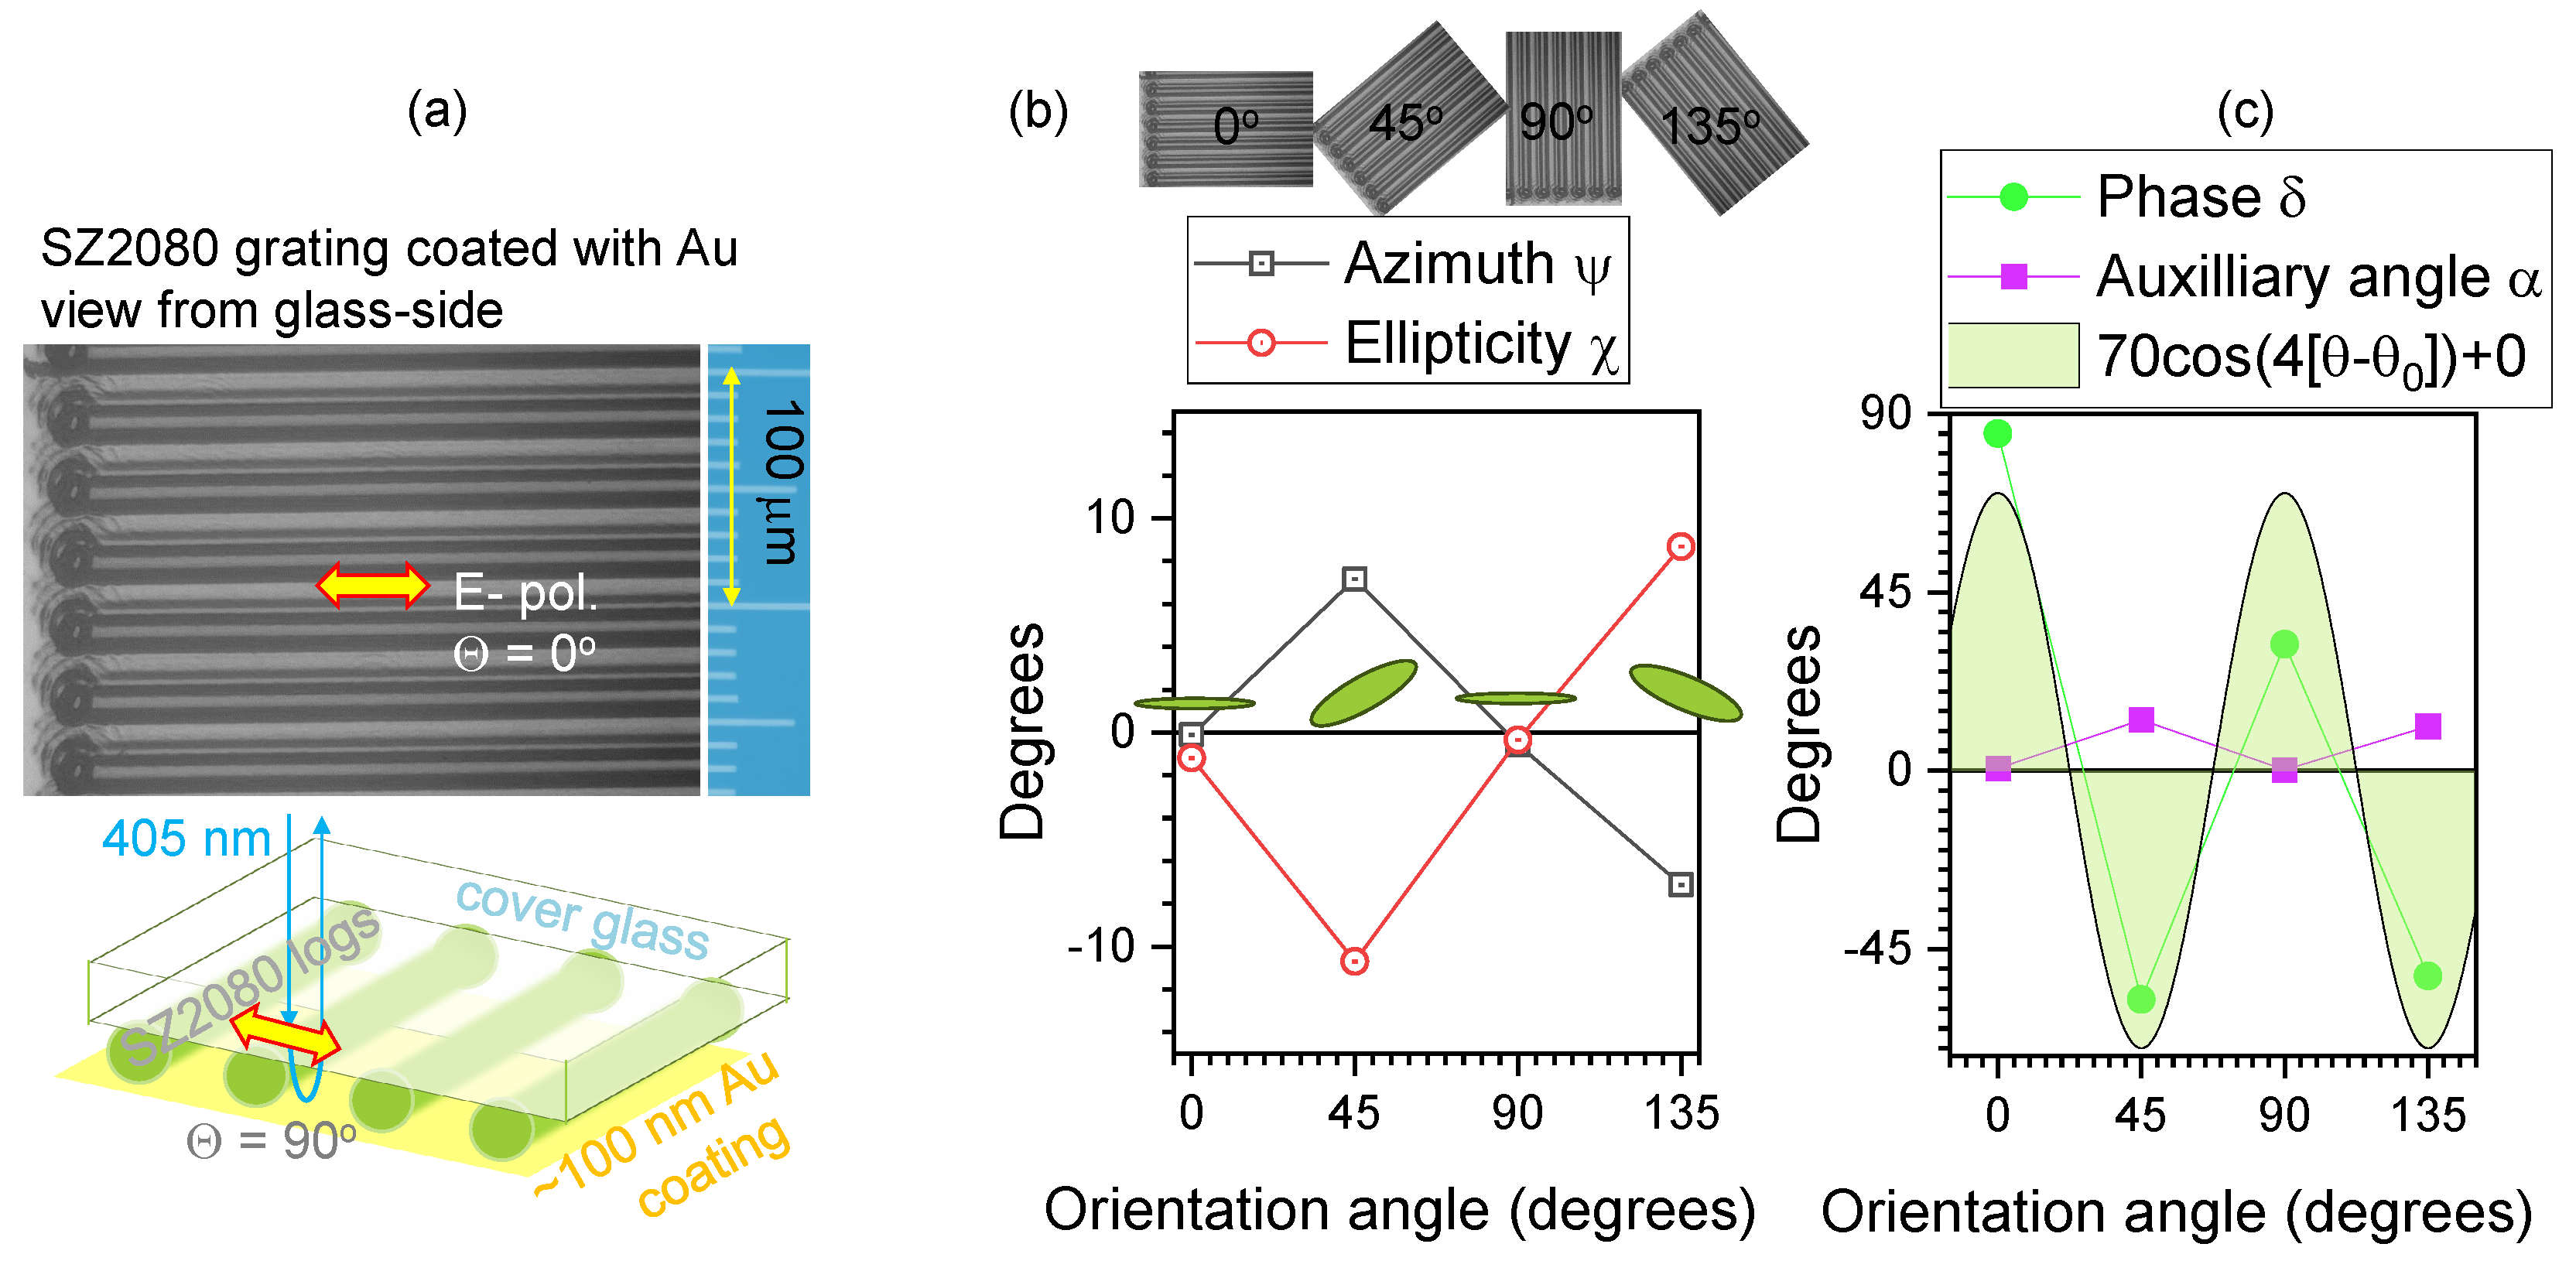
Figure 5 shows ellipsometry spectra for complex refractive index . At selected absorbance peak of 304 nm, the angular dependence of was fitted by function. It has a twice lower angular frequency (typical for absorbance with folding at in transmission) as compared with the polarimetry fit at 405 nm which had dependence (typical for birefringence in transmission). The phase difference/delay can result from reflection from the surface which has anisotropic features and complex composition (e.g., carbon fibers and polymer composite matrix). Upon reflection there is phase shift when light travels from low-to-high index n material and reflects back (typical for incidence from air). For absorbing surfaces, it can be different when the real part of permittivity (epsilon) becomes less than 1 (as of air’s). In Figure 5 such spectral region is at m region where . No phase change upon reflection would occur in this region called epsilon-near-zero (ENZ), especially for the sample orientation when polarisation of incident light is aligned to the carbon fibers at .
From ellipsometry data on CFRP at visible-IR range -anisoptropy typical for absorbance is dominating. At the used 405 nm illumination in reflection at the normal incidence, the CFRP has low-k and large-n, hence and will define the phase change upon reflection (Figure 3). This phase change has -dependence typical for the phase delay . Light scattering is dominating for the polarimetry measurement, since scattering is related to n, hence to , rather absorbance and its dichroism, which is related to k.
Reflected laser beam from electrically conductive mirror surfaces was maintaining its linear polarisation as expected [16]. For metals described with Drude model, permittivity [2], here is used to make distinction from the above used k when definition of refractive index is . According to the Drude model , where is conductivity, is the cyclic frequency. Hence, from the real and imaginary parts of the permitivity: and . Depending on the wavelength , the actual phase change upon reflection from the surface is defined by the real part of the effective permittivity .
3.2. Azimuthaly Changing Orientation: Laser Ablated Ripples
Linear grating-like patterns investigated by polariscopy in Sec. Section 3.1 were larger than the focal diameter. Here, we analyse the orientation of a grating-like laser ablated ripples on the surface of Si (Figure 6) [19]; such ripples with changing orientation can also be inscribed inside transparent materials [20]. Ripples have periods comparable or smaller than the focal diameter. Ripples were made by laser ablation with J energy pulses. They were focused using a cylindrical lens mm at position 180 mm before the objective lens of numerical aperture (Mitutoyo). The vertical line of 1 mm width at (long axis) and m wide (short axis) focal region was formed. Ablation width was m (Figure 6); the ablation threshold fluence of Si is J/cm2. Ablation was carried out at 100 kHz repetition rate with 10 pulses per micron along the scan at speed mm/s. Different rotation speeds of -waveplate were used along the scan resulting in different lengths of patter for full rotation for (Figure 6a). The period of ripples on Si was [21] as expected for conductive non-transparent samples (Figure 6b); it has the highest intensity in FFT map. Such azimuthally patterned gratings are used to discriminate left-hand from right-hand circular polarised light upon reflection. Here we use them to study polarisation changes upon reflection of linearly polarised incident 405 nm laser light.
Stokes vector was determined from reflection of 405 nm laser light linearly scanned along the central cross-section of the rotating ripples pattern (Figure 7). At this wavelength, Si has a high refractive index since it is close to the absorbance peak at 376 nm for the direct transitions in Si where . The angles of azimuth and ellipticity were found qualitatively following different angular dependence of the orientation angles of ripples . The azimuth was close to dependence (expected for dichroism) while ellipticity (expected for birefringence). Also the original orientation phase was perpendicular to each other for the and . Interestingly, only high- conditions were satisfactory for collecting polarimetry data. This might be related to the larger collection angle important for the acquisition of anisotropic scattering. High refractive index of Si facilitated strong reflection, however, equally a strong scattering. At the region of ripples pattern, which are dark in cross-polarised view, the as was observed with the linear structures of CFRP and polymer grating. Similar to the cases analyzed above for linear patterns (Sec. Section 3.1), the phase was the largest and approaching when (d). Such conditions correspond to the linearly polarised reflected light.
When the the focal spot is smaller than the period of ripples on surface of the sample, the form birefringence ( is the refractive index of the extraordinary beam (or the fast axis) polarised perpendicular to the grooves and is for the ordinary beam (slow axis) along the grooves ), which is negative by definition and contributes to the reflected phase [21]. The form birefringence corresponds to the uniaxial crystal with permittivity in respect to the optical axis. For the depth of the structure d, the phase retardance is (a double path length due to reflection).
Apart from the form-birefringence and anisotropic scattering, strong refractive index changes are taking place at the vicinity of the absorption bands with negative and positive dispersion regions, hence, at the neighboring wavelengths of the absorption spectral region. This affects the phase of the reflected light assessed from the Stokes polarimetry. Since we used 405 nm wavelength, absorption is usually present in transparent materials such as glasses and polymers. For the Lorenzian absorption spectral lineshape, the absorption and dispersion are related to the k and n, respectively; here is the relaxation time (linked to the bandwidth of the line), is the cyclic frequency of the spectral position of the absorption line. Strong phase changes in polarimetric measurements due to the dispersion changes will appear as birefringence near the absorption band with a sign dependent on the normal or anomalous side from the absorption line [23].
3.3. Diamond: A Transparent Sample with Grating-Pattern
The previous section analysed ripples on Si at the wavelength, which is strongly absorbed and for the focal spot, which is comparable to or larger than the periodicity of the grating-like pattern. Next, we analyse nano-gratings defined by the electron beam lithography (EBL) in a 5-m-thick poly-crystalline diamond membrane [24]. The structure is an optical spin-orbit converter - the q-plate - where the optical slow-axis is rotating with azimuth angle according to . Such an optical element will generate an optical vortex beam with topological charge , i.e., the number of rotations along propagation of a single wavelength. The most efficient spin-orbit conversion upon illumination with circularly polarised light occurs at a longitudinal phase retardance of between E-field components along the grating pattern ‖ (extraordinary e-beam) and perpendicular ⊥ to it (ordinary o-beam). For such condition, for the height h of the structure. The form-birefringence is defining the phase retardance and is dependent on the refractive index of the host material (here diamond with at visible wavelengths) and a fill-factor of the grating pattern.
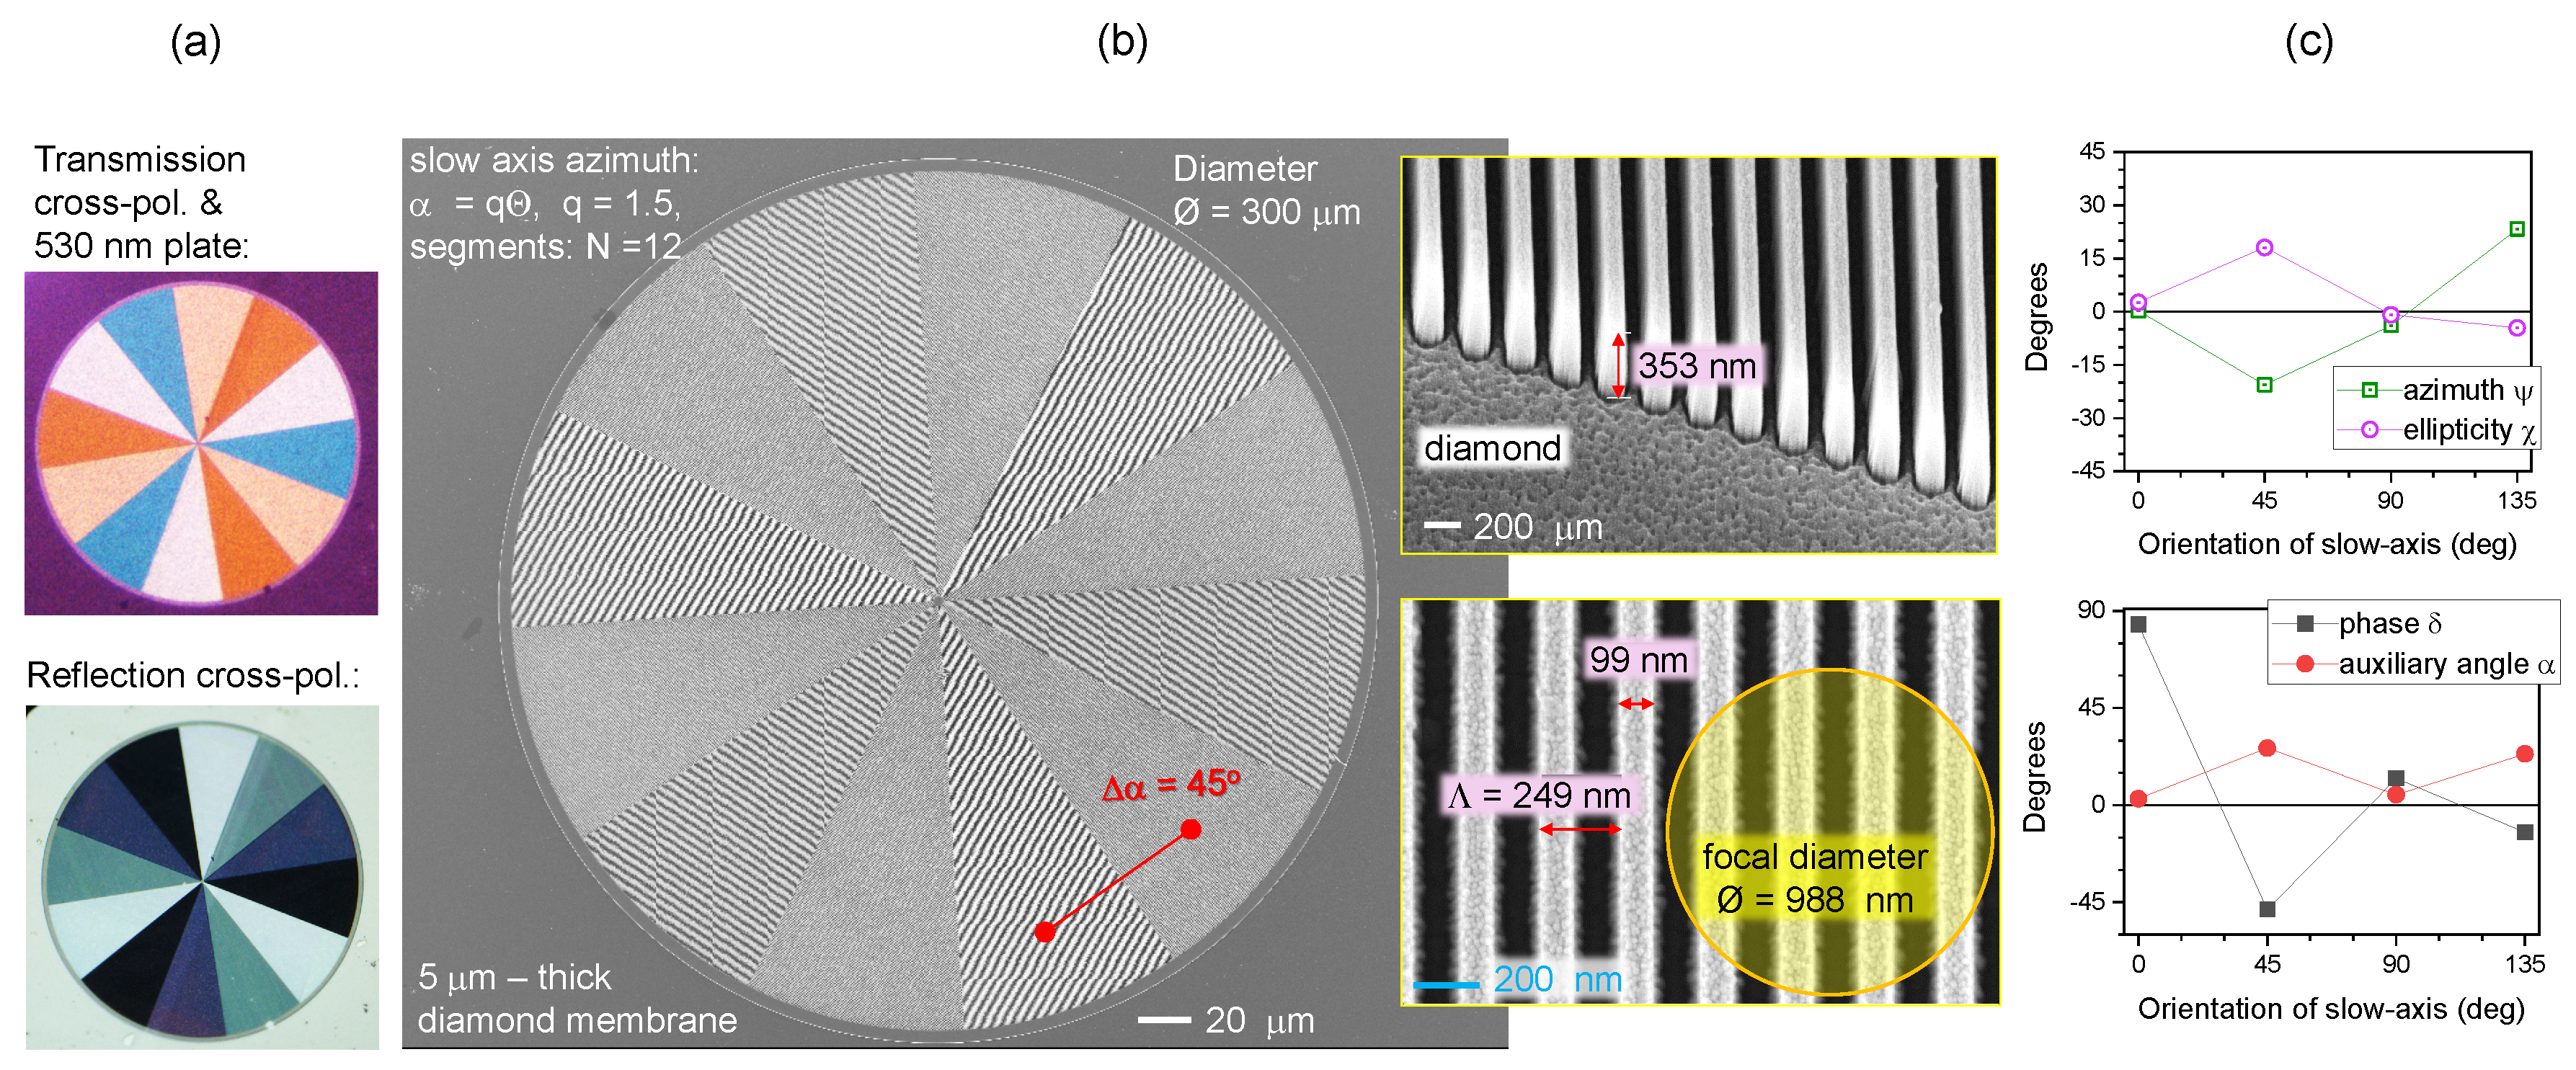
Figure 8 shows data of the q-plate. Optical reflectance image shows distinct patterns in cross-polarised image. The actual structure is shown in SEM images. The focal spot was approximately 3 times larger than the period of the grating. The ellipticity and azimuth as well as phase and auxiliary angles (c) were following the same trend as for the case of reflective larger scale patterns on CFRP and Au-coated polymerised grating. In the case of the micro-membrane of patterned diamond q-plates, sample was transparent. A large range of is suitable for detecting changes via polarimetry.
4. Conclusion and Outlook
Polariscopy analysis of a back-reflected laser beam (at a normal angle of incidence) is shown to be sensitive to surface anisotropy. From Stokes vector it is possible to calculate the delay phase , which is linked to the real part of refractive index anisotropy and the auxiliary angle which defines the ratio of E-fields in s- and p-pol. The latter is related to absorption dichroism in the principle plane - or -plane. The back-scattered laser light had orientational dependence following angular dependence. Polarimetry provides a complimentary insight into surface anisotropy as compared to ellipsometry.
Such analysis of back-scattered/reflected signal using polarimetry is advantageous in industrial and engineering applications due to simplicity as compared with ellipsometry, which needs a lab-based setup as well as relies on a model of sample composition and structure (e.g., layer thicknesses). For polarimetry, rotation of polarisation is realised simpler as a rotation of sample. Linear polarisation is rotated by -plate (or linearly polarised laser itself in some cases) to access the orientation -dependence of the Stokes parameters. Remote sensing applications can be beneficiaries of the presented analysis of complex surfaces such as CFRP tested in this study. The four-polarisation camera can be used for anisotropy imaging and determination of the Stokes vector while the polarimeter provides a single-point measure from the reflected surface.
Author Contributions
Conceptualization, S.J., M.R., J.M.; methodology, M.R., S.K.; software, S.K., M.R.; validation, S.K, Z.K, M.R.; formal analysis, S.K..; investigation, Z.K., N.H.A.L., S.H.N., R.B., G.S., V.A.; resources, J.M.,S.J.; data curation, S.K., M.R.; writing—original draft preparation, S.J.; writing—review and editing, all the authors; visualization, S.K., S.J.; supervision, S.J., M.R., J.M. All authors have read and agreed to the published version of the manuscript.
Funding
This research received no external funding S.J. was supported by the DP240103231 and LP220100153 grants from Australian Research Council. Z.K. is supported by the Aerostructures Innovation Research (AIR) Hub at Swinburne University of Technology for this research project and for PhD scholarship. M.R. and J.M. were partially supported by JST CREST Grant Number JPMJCR19I3, Japan.
Acknowledgments
We thank Etienne Brasselet for the design of q-plates. S.J. was supported via the IdEx International Chair project at Bordeaux University, France.
Conflicts of Interest
The authors declare no conflicts of interest.
References
- Singh, K.; Tabebordbar, N.; Forbes, A.; Dudley, A. Digital Stokes polarimetry and its application to structured light: tutorial. J. Opt. Soc. Am. A 2020, 37, C33–C44. [Google Scholar] [CrossRef] [PubMed]
- Collett, E. Field guide to Polarisation; SPIE Press, Bellingham, Washington USA, 2005.
- Kvittingen, L.; Sjursnes, B.J. Demonstrating Basic Properties and Application of Polarimetry Using a Self-Constructed Polarimeter. Journal of Chemical Education 2020, 97, 2196–2202. [Google Scholar] [CrossRef] [PubMed]
- North, J.A.; Duggin, M.J. Stokes vector imaging of the polarized sky-dome. Appl. Opt. 1997, 36, 723–730. [Google Scholar] [CrossRef] [PubMed]
- Stenflo, J. Solar magnetic fields as revealed by Stokes polarimetry. Astron Astrophys Rev 2013, 21, 66. [Google Scholar] [CrossRef]
- Borovkova, M.; Bykov, A.; Popov, A.; Meglinski, I. Role of scattering and birefringence in phase retardation revealed by locus of Stokes vector on Poincaré sphere. J. Biomed. Opt. 2020, 25, 1–13. [Google Scholar] [CrossRef] [PubMed]
- Gamaly, E.G.; Rode, A.V. Ultrafast re-structuring of the electronic landscape of transparent dielectrics: new material states (Die-Met). Appl. Phys. A 2018, 124, 278. [Google Scholar] [CrossRef]
- Li, Z.Z.; Fan, H.; Wang, L.; Zhang, X.; Zhao, X.J.; Yu, Y.H.; Xu, Y.S.; Wang, Y.; Wang, X.J.; Juodkazis, S.; Chen, Q.D.; Sun, H.B. Super stealth dicing of transparent solids with nanometric precision. arXiv 2024, arXiv:2308.02352, p. [Google Scholar]
- Murazawa, N.; Ueno, K.; Mizeikis, V.; Juodkazis, S.; Misawa, H. Spatially selective non-linear photopolymerization induced by the near-field of surface plasmons localized on rectangular gold nanorods. J. Phys. Chem. C 2009, 113, 1147–1149. [Google Scholar] [CrossRef]
- Gong, S.; Meng, Y.; Wang, C.; Chen, Y.; Meng, X.; Wu, W.; Cai, W.; Ren, M.; Xu, J. Full-Stokes polarimetry based on rotating metasurfaces. Applied Physics Letters 2022, 120, 051110. [Google Scholar] [CrossRef]
- Fang, C.; Li, J.; Zhou, B.; Li, D. Self-Powered Filterless On-Chip Full-Stokes Polarimeter. Nano Letters 2021, 21, 6156–6162. [Google Scholar] [CrossRef]
- Harvie, A.; Phillips, T.; deMello, J. A high-resolution polarimeter formed from inexpensive optical parts. Sci Rep 2020, 10, 5448. [Google Scholar] [CrossRef] [PubMed]
- Wilkinson, T.A.; Maurer, C.E.; Flood, C.J.; Lander, G.; Chafin, S.; Flagg, E.B. Complete Stokes vector analysis with a compact, portable rotating waveplate polarimeter. Review of Scientific Instruments 2021, 92, 093101. [Google Scholar] [CrossRef] [PubMed]
- Arbabi, E.; Kamali, S.M.; Arbabi, A.; Faraon, A. Full-Stokes Imaging Polarimetry Using Dielectric Metasurfaces. ACS Photonics 2018, 5, 3132–3140. [Google Scholar] [CrossRef]
- Honda, R.; Ryu, M.; Moritake, M.; Balčytis, A.; Mizeikis, V.; Vongsvivut, J.; Tobin, M.J.; Appadoo, D.; Li, J.L.; Ng, S.H.; Juodkazis, S.; Morikawa, J. Infrared Polariscopy Imaging of Linear Polymeric Patterns with a Focal Plane Array. Nanomaterials 2019, 9. [Google Scholar] [CrossRef] [PubMed]
- Gramatikov, B.I. A Mueller matrix approach to flat gold mirror analysis and polarization balancing for use in retinal birefringence scanning systems. Optik 2020, 207, 164474. [Google Scholar] [CrossRef]
- Kamegaki, S.; Ryu, M.; Ng, S.H.; Mizeikis, V.; Blamires, S.J.; Juodkazis, S.; Morikawa, J. Determination of Stokes Vector from a Single Image Acquisition. Annalen der Physik, 2300. [Google Scholar] [CrossRef]
- Molazemhosseini, A.; Tourani, H.; Khavandi, A.; Yekta, B.E. Tribological performance of PEEK based hybrid composites reinforced with short carbon fibers and nano-silica. Wear 2013, 303, 397–404. [Google Scholar] [CrossRef]
- Wang, L.; Chen, Q.D.; Cao, X.W.; Buividas, R.; Wang, X.; Juodkazis, S.; Sun, H.B. Plasmonic nano-printing: large-area nanoscale energy deposition for efficient surface texturing. Light: Sci.& Aool. 2017, 6, e17112. [Google Scholar]
- Lu, J.; Teng, L.; Zhai, Q.; Wang, C.; Lancry, M.; Dai, Y.; Zeng, X. Space variant fiber nanogratings induced by femtosecond laser direct writing. Applied Surface Science 2024, 646, 158787. [Google Scholar] [CrossRef]
- Buividas, R.; Mikutis, M.; Juodkazis, S. Surface and bulk structuring of materials by ripples with long and short laser pulses: Recent advances. Progress in Quantum Electronics 2014, 38, 119–156. [Google Scholar] [CrossRef]
- Ghadimi Nassiri, M.; Seniutinas, G.; David, C.; Juodkazis, S.; Brasselet, E. Spectral optical vortex modulation from geometric phase diamond metasurface arrays. Applied Physics Letters 2021, 118, 201104–10. [Google Scholar] [CrossRef]
- Grineviciute, L.; Ng, S.H.; Han, M.; Moein, T.; Anand, V.; Katkus, T.; Ryu, M.; Morikawa, J.; Tobin, M.J.; Vongsvivut, J.; Tolenis, T.; Juodkazis, S. Anisotropy of 3D Columnar Coatings in Mid-Infrared Spectral Range. Nanomaterials 2021, 11. [Google Scholar] [CrossRef] [PubMed]
- Seniutinas, G.; Brasselet, E.; Balčytis, A.; David, C.; Juodkazis, S. Diamond: a gem for micro-optics. Materials Today 2018, 21, 798–799. [Google Scholar] [CrossRef]
Figure 1.
(a) Setup used in this study of reflection polarimetry. Four-polarisation camera as imaging device together with polarimeter. Poincaré sphere presntation (b) of Stokes vector and polarisation ellipsis (c). The total incident intensity is I, degree of polarisation p with ; we used linearly polarised (p-pol. or vertical) laser light. The inset (b) shows the equivalent Observable Polarisation Sphere (OPS) presentation.
Figure 1.
(a) Setup used in this study of reflection polarimetry. Four-polarisation camera as imaging device together with polarimeter. Poincaré sphere presntation (b) of Stokes vector and polarisation ellipsis (c). The total incident intensity is I, degree of polarisation p with ; we used linearly polarised (p-pol. or vertical) laser light. The inset (b) shows the equivalent Observable Polarisation Sphere (OPS) presentation.
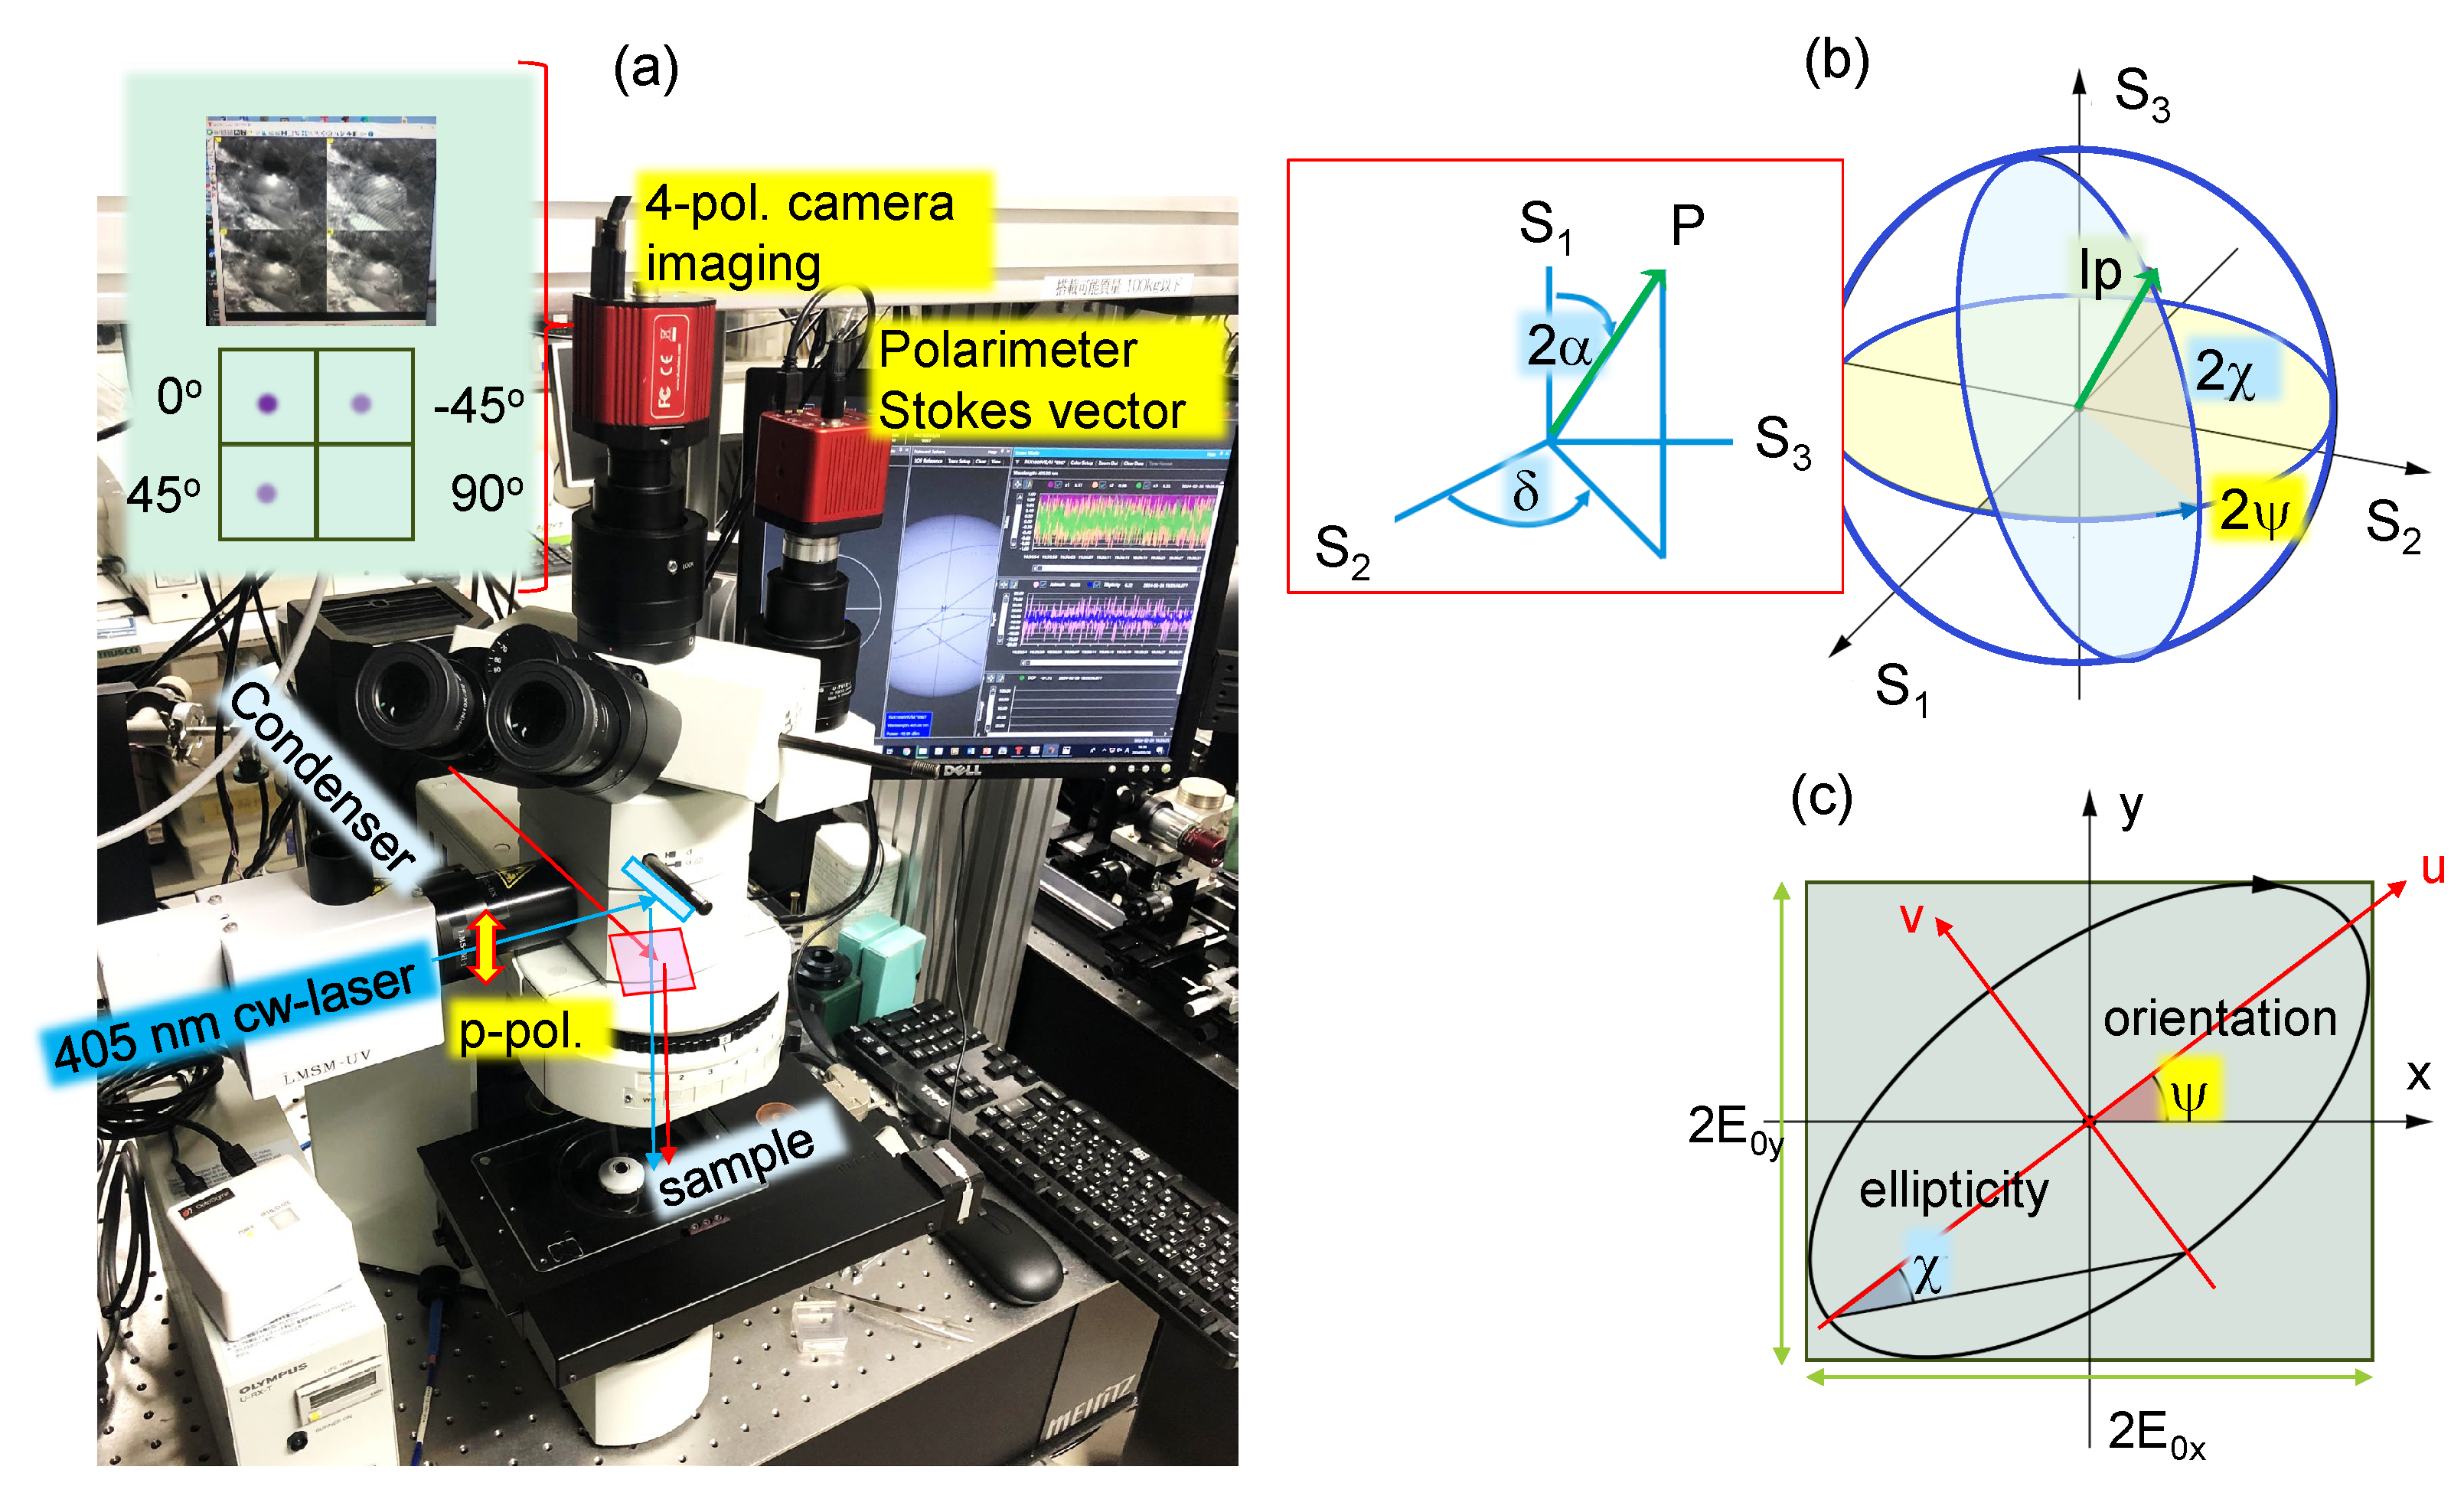
Figure 5.
Ellipsometry based determination of the refractive index spectra at visible-to-IR wavelengths range; angle of incidence was . Top photo shows geometry of measurements. The absorption peak at 304 nm in was selected for fit by . This fit implies a dichroism-based anisotropy.
Figure 5.
Ellipsometry based determination of the refractive index spectra at visible-to-IR wavelengths range; angle of incidence was . Top photo shows geometry of measurements. The absorption peak at 304 nm in was selected for fit by . This fit implies a dichroism-based anisotropy.

Figure 6.
(a) Cross-polarised reflection images of fs-laser 1030 nm/230 fs ablated ripples on Si wafer at different magnifications; the Maltese-cross cross-polarised image is shown in the top-inset. Laser beam was formed using cyllindrical lens and polarisation was rotated along the scan direction using -waveplate. (b) SEM image of azimuthally changing ripples: 1030 nm, 100 kHz, 10 pulses per micrometer, scan mm/s. Focusing: 5-mm-diameter beam, mm cylinder lens at 180 mm from the objective lens with numerical aperture . Polarisation rotated at speed per micrometer of linear scan. Fast Fourier Transform (FFT) image is shown in the inset with main intensity at m with period along the scanning direction slightly smaller than perpendicular to it.
Figure 6.
(a) Cross-polarised reflection images of fs-laser 1030 nm/230 fs ablated ripples on Si wafer at different magnifications; the Maltese-cross cross-polarised image is shown in the top-inset. Laser beam was formed using cyllindrical lens and polarisation was rotated along the scan direction using -waveplate. (b) SEM image of azimuthally changing ripples: 1030 nm, 100 kHz, 10 pulses per micrometer, scan mm/s. Focusing: 5-mm-diameter beam, mm cylinder lens at 180 mm from the objective lens with numerical aperture . Polarisation rotated at speed per micrometer of linear scan. Fast Fourier Transform (FFT) image is shown in the inset with main intensity at m with period along the scanning direction slightly smaller than perpendicular to it.
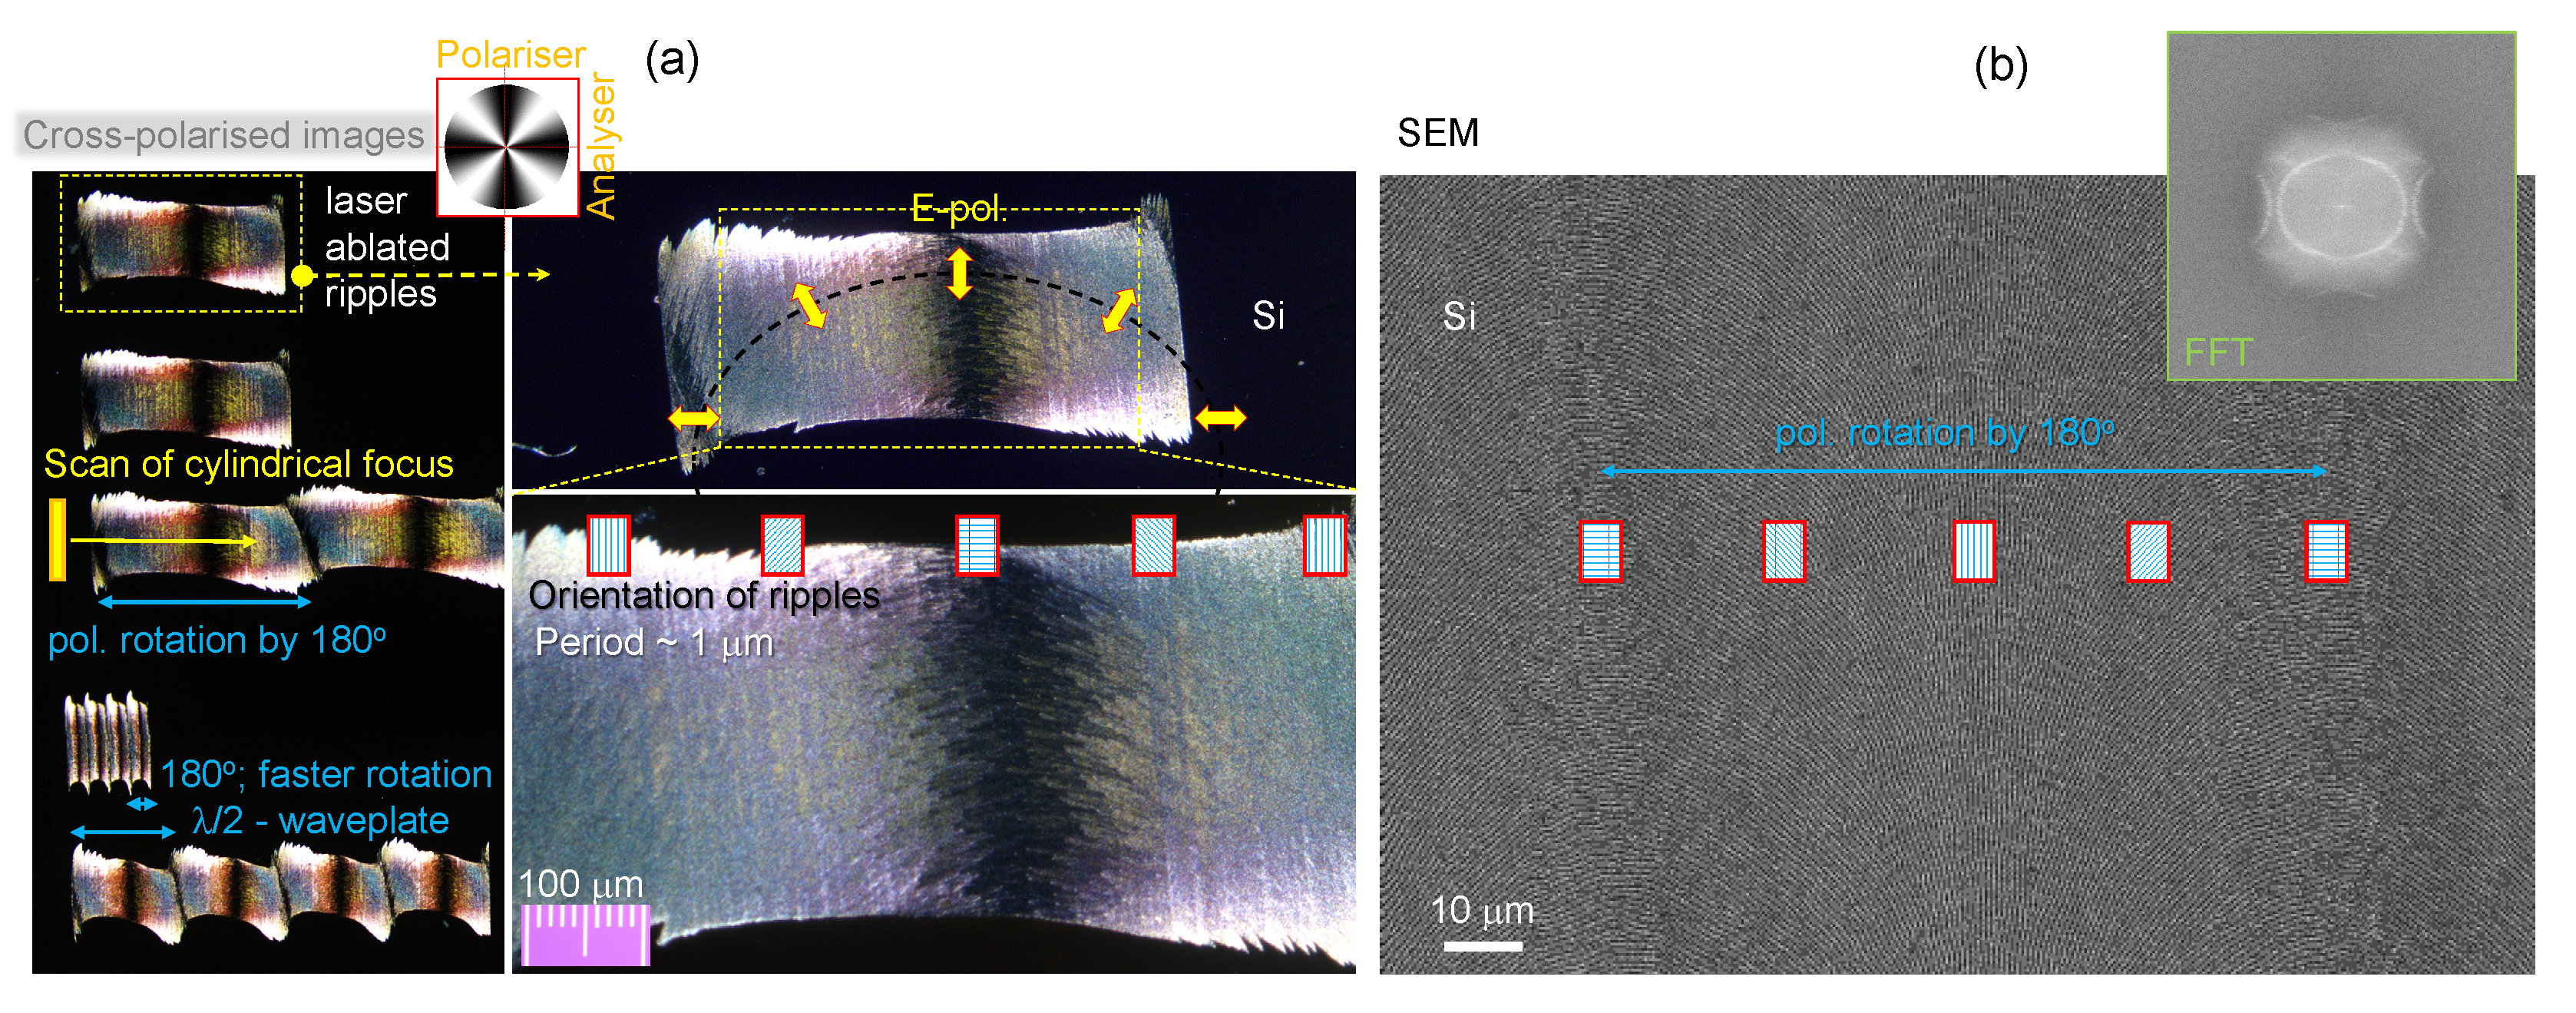
Figure 7.
(a) 4-pol. camera image of the azimuthally rotating pattern of ripples ablated at conditions: per 900 m scan length of elliptical focus m2. Scan along the pattern was carried out with 100 m steps and polarimeter was measuring Stokes vector at 405 nm wavelength. (b) The azimuth and ellipticity angles along the scan at focusing conditions. The guidelines of qualitative fit are shown by and dependences. Inset shows 4-pol. camera image with laser focus on not-ablated part on Si. (c) SEM images of azimuthally rotating ripples on Si show indicative sizes of focal spots at different -focusing estimated as . Fast-rotating polarisation was used for writing ripples. (d) The phase delay and auxiliary angles along the ripple pattern.
Figure 7.
(a) 4-pol. camera image of the azimuthally rotating pattern of ripples ablated at conditions: per 900 m scan length of elliptical focus m2. Scan along the pattern was carried out with 100 m steps and polarimeter was measuring Stokes vector at 405 nm wavelength. (b) The azimuth and ellipticity angles along the scan at focusing conditions. The guidelines of qualitative fit are shown by and dependences. Inset shows 4-pol. camera image with laser focus on not-ablated part on Si. (c) SEM images of azimuthally rotating ripples on Si show indicative sizes of focal spots at different -focusing estimated as . Fast-rotating polarisation was used for writing ripples. (d) The phase delay and auxiliary angles along the ripple pattern.
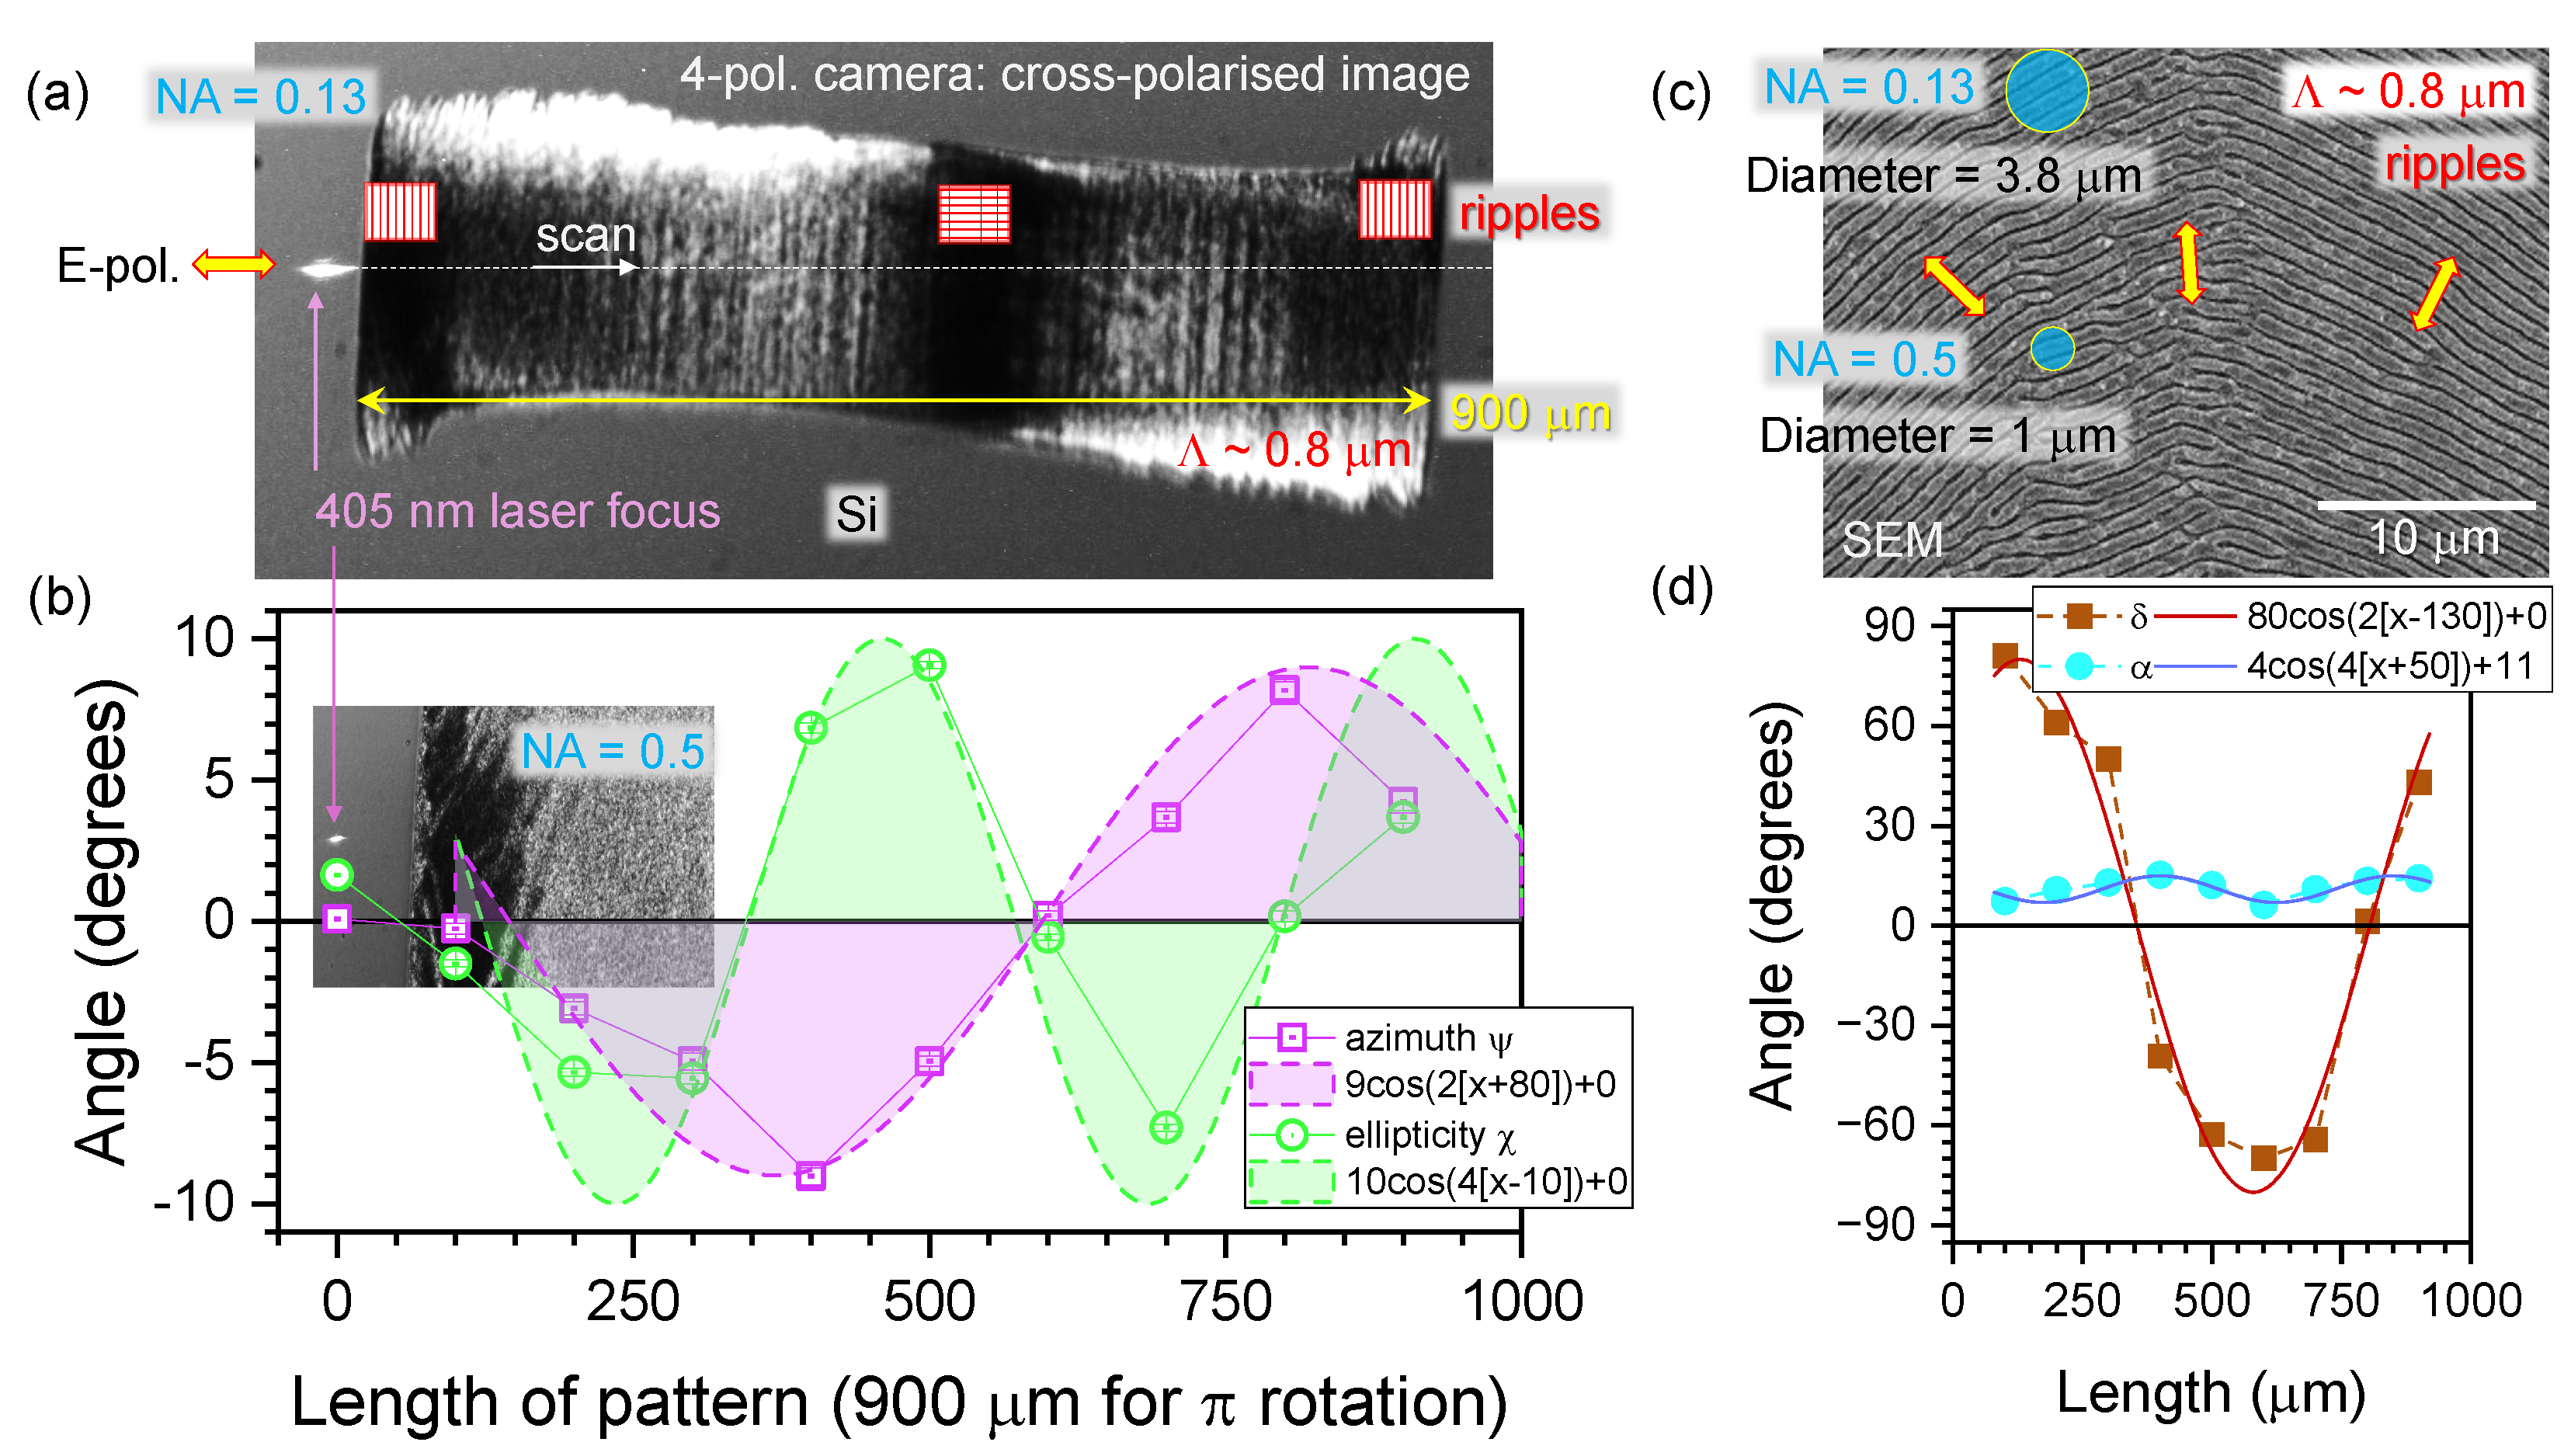
Figure 8.
(a) Optical cross-polarised images of a q-plate in transmission and reflection modes. The optical slow-axis follows azimuth angle as with segments ( difference of a grating orientation between the neighboring regions). (b) SEM images of the q-plate showing period nm and 100 nm width of the diamond grating ridges; poly-crystalline diamond membrane of m thickness was Cr-coated, mask-patterned by EBL, developed and plasma etched (see processing details in ref. [22]). (c) The and dependencies from four segments in sequence measured in reflection using polarimeter. Polarimetry was carried out under focusing at nm wavelength.
Figure 8.
(a) Optical cross-polarised images of a q-plate in transmission and reflection modes. The optical slow-axis follows azimuth angle as with segments ( difference of a grating orientation between the neighboring regions). (b) SEM images of the q-plate showing period nm and 100 nm width of the diamond grating ridges; poly-crystalline diamond membrane of m thickness was Cr-coated, mask-patterned by EBL, developed and plasma etched (see processing details in ref. [22]). (c) The and dependencies from four segments in sequence measured in reflection using polarimeter. Polarimetry was carried out under focusing at nm wavelength.
Disclaimer/Publisher’s Note: The statements, opinions and data contained in all publications are solely those of the individual author(s) and contributor(s) and not of MDPI and/or the editor(s). MDPI and/or the editor(s) disclaim responsibility for any injury to people or property resulting from any ideas, methods, instructions or products referred to in the content. |
© 2024 by the authors. Licensee MDPI, Basel, Switzerland. This article is an open access article distributed under the terms and conditions of the Creative Commons Attribution (CC BY) license (https://creativecommons.org/licenses/by/4.0/).
Copyright: This open access article is published under a Creative Commons CC BY 4.0 license, which permit the free download, distribution, and reuse, provided that the author and preprint are cited in any reuse.


