Submitted:
26 April 2024
Posted:
28 April 2024
You are already at the latest version
Abstract
In this study, we present data on the effects of condensed (CTs) and hydrolysable (HTs) tannins, polyphenols extracted from plants, at different concentrations on zebrafish development to identify the range of concentrations with toxic effects. Zebrafish embryos were exposed to CTs and HTs at two different concentration ranges (5.0, 10.0, 20.0 μgL-1 and 5.0, 10.0, 20.0 mgL-1) for 72 h. The toxicity parameters were observed up to 72 h of treatment. The uptake of CTs and HTs by zebrafish larvae was assessed by HPLC analysis. The qRT-PCR analysis was performed to evaluate gene expression of cd63, zhe1 and klf4, involved in the hatching process of zebrafish. CTs and HTs at 5.0, 10.0, and 20.0 μgL-1 were not toxic. On the contrary, at 5.0, 10.0, and 20.0 mgL-1 HTs induced a delayed in hatching starting from 48 h of treatment, while CTs showed a delayed in hatching mainly at 48h. The analysis of gene expression showed a down-regulation in the group exposed to HTs confirming the hatching data. We believe that this study is important to define the optimal doses of CTs and HTs, to be employed in different application fields such as chemical and animal feed industry, and medical science.
Keywords:
condensed tannins
; hydrolysable tannins
; zebrafish
; embryos
; metabolites
1. Introduction
Polyphenols are a broad class of plant secondary metabolites [1,2]. Thanks to their antioxidant and anti-inflammatory activity, polyphenols are widely used in nutraceuticals and pharmaceutical industry [3], and as diet supplementation in functional feed [4,5,6]. As polyphenols are natural product, they are usually considered safe, but this is not always true depending on phenolic compounds and their metabolites, amount consumed and time of exposure. Therefore, scientific world is increasingly interested in investigating and assess the limits between safety and toxicity of phenolic compounds [7].
Tannins are water-soluble polyphenols widely used for several purposes ranging from different industry sectors (leather, mineral, wine, oil) to animal nutrition and biomedical use [8]. Thanks to their ability to complex proteins they provide numerous benefits to human health, including a lower risk of developing cardiovascular diseases, diabetes, cancer, and inflammation [9,10,11]. In addition, due to their antioxidant and antimicrobial activities, tannins are used as natural food preservatives to extend the shelf life of foods and to stabilize their taste, as in the case of meat, beer, and wine [12,13]. However, several studies have showed that tannins also have anti-nutritional effects due to their capability to interact negatively with food proteins or neutralize enzymes [14]. In fact, they are metal chelators, binding metal ions such as Fe3+, Al3+, and Cu2+, and reducing their absorption across the gastrointestinal barrier [15].
Based on their chemical structure, tannins are classified into condensed tannins (CTs) and hydrolysable tannins (HTs). CTs, also called proanthocyanidins, are oligomers and polymers of flavonoids without a sugar core, while HTs have central core composed by a carbohydrate, mainly D-glucose, which is esterified with gallic acid or ellagic acid, forming gallotannins or ellagitannins [8,14]. Due to the ester bonds, the HTs are more susceptible to hydrolysis than CTs, which give rise to the main metabolites gallic acid or ellagic acid or other similar species [16]. Despite major differences in chemical structure, which usually result in distinct bioactive properties, CTs and HTs often produce similar pro-oxidant or antioxidant effects, most likely depending on the concentration employed [17,18]. Moreover, Yin and collaborators showed that in vitro tannins supplementation affects the embryonic development in pigs in a dose-dependent manner [19].
Zebrafish (Danio rerio) has become the most notable alternative animal model used for toxicological and physiopathological studies due to its small-size, rapid reproduction and development, eggs transparency, and the homology with higher vertebrates [20,21,22,23]. It represents an appropriate model for the screening of plant extracts bioactivity, toxicity, and side effects since it does not require invasive exposure procedures and give the possibility to perform quickly reproducible dose-dependent toxicological studies dissolving the compound directly in the growth medium [24,25,26]. Moreover, the zebrafish model also gives the possibility to evaluate the off-target side effects, constituting a substantial pre-filter for the choice of the safest compound and it’s no toxic dose [27].
Several studies have been carried out on the effect of natural extracts using zebrafish larvae and embryos [28,29,30]. During zebrafish development the early stages are particularly sensitive and the exposure to a plant extract can affect different tissues and organs depending on its content, on the concentration used, and period of exposure [31]. The most observed alterations of embryo development are related to hatching rate, such as delay or premature hatching, survival, heart beat rate, and body malformations [31]. Interestingly, the effect of natural extracts at high concentrations on zebrafish can be assimilated to the effect of heavy metal water contamination and pollution on physiological processes [32]. This may be due to the accumulation of these natural ingredients or their metabolites in various tissues and organs affecting their structure and function [32].
In this context, the main objective of this study was to investigate and compare the potential toxic effects of commercial highly purified condensed tannins extracted from Quebracho wood (Schinopsis lorentzii), and hydrolysable tannins extracted from Chinese gallnuts (Rhus semialata), at different concentration ranges using zebrafish embryonic model.
2. Results
2.1. Survival, Hatching and Heart Rate
No significant mortality events were recorded during treatment with CTs and HTs at all concentrations tested throughout the exposure period. The data regarding hatching rate reported in Figure 1a, showed that no differences emerged among treated groups (5.0, 10.0, 20.0 µgL-1 of CTs and HTs) and control group both at 48 h and 72 h of treatment.
Figure 1b shows the hatching data for the concentrations 5.0, 10.0, 20.0 mgL-1 of CTs and HTs. At 48 h of treatment there was a delay in the hatching process in all concentration tested of CTs compared with the control. In detail, at 5.0 mgL-1 of CTs hatching rate was 46.0%, at 10.0 mgL-1 of CTs was 85.3% while at 20.0 mgL-1 of CTs hatching rate decreased to 21.3%, compared to control group. Regarding HTs after 48 h of treatment, hatching rate decreased at 5.0, 10.0, 20.0 mgL-1 compared to the control, reaching 0%, 11.8% and 9.33% respectively. After 72 h of CTs treatment at 5.0 and 10.0 mgL-1 the hatching rate was comparable to the control while at 20.0 mgL-1 hatching rate was 78.6%. In HTs at 5.0, 10.0, 20.0 mgL-1 the hatching rate was 48.0%, 32.5% and 17.1% respectively compared to the control.
The heart rate was recorded at 72 h of treatment. The groups exposed to CTs and HTs at 5.0, 10.0, 20.0 µgL-1 and 5.0, 10.0, 20.0 mgL-1 showed no alterations in heart rate compared with the control (Figure 2a,b).
2.2. Uptake of HTs and CTs
Uptake by zebrafish larvae of HTs and CTs was assessed by HPLC analysis. Figure 3a shows the chromatographic profile of HTs administered to zebrafish larvae. The HTs used in this study are highly purified gallotannins (GTs) (Tan’Active GTC/E, Silvateam S.p.A., Italy); in fact, in its chromatographic profile, two peaks corresponding to the metabolites of GTs, namely pyrogallol (PY, RT 3.5 min) and gallic acid (GA, RT 11.5 min) were identified together with two other peaks (Figure 3a, asterisks) that show a UV-Vis spectrum typical of compounds belonging to the gallotannin family [33]. The chromatographic profiles of the extracts of the larvae exposed for 72 h to the HTs (Figure 3c-f) show several peaks among which we find those corresponding to PY and GA which are two metabolites of HTs. These peaks are absent in the extract of unexposed larvae (Figure 3b, CTRL).
The uptake of HTs increases with the exposure concentration (Figure 4). In particular, the highest percentage of uptake was reported in the group of larvae exposed to 5.0 mgL-1. In larvae exposed to 10.0 and 20.0 µgL-1 the uptake was similar and the lowest uptake was reported in larvae exposed to the lowest concentration (5.0 µgL-1).
Furthermore, as reported in Table 1, both GA and PY concentrations are significantly higher in the extract of larvae exposed to the highest concentration of HTs (5.0 mgL-1).
Figure 5a shows the chromatographic profile of CTs administered to zebrafish larvae. The CTs used in this study are 100% super refined profisetinidine tannins (Tan’Active QS-SOL); the representative peak corresponding to profisetidine (PF, RT 11.0 min) is shown in the chromatogram. The chromatographic profiles of the extracts of the larvae exposed to the CTs for 72 h (Figure 5c–f) show several peaks among which it is possible to identify GA and PY. These peaks are absent in the extract of unexposed larvae (Figure 5b, CTRL).
The uptake of CTs is directly proportional to the exposure concentration. In fact, the uptake percentage (Figure 6) gradually increases as the exposure concentration increases (from 5.0 µgL-1 to 5.0 mgL-1).
Furthermore, as reported in Table 2, despite increasing the concentration of exposure to CTs, the PY peak remains constant in the larval extracts while that of GA is significantly higher in the larvae exposed to the lowest concentration of CTs (5.0 μgL-1).
2.3. Analysis of Gene Expression
The qRT-PCR was conducted to evaluate the gene expression. The concentration of 5.0 mgL-1 was chosen because it gave a higher hatching rate at 72 h of treatment for HTs. Thus, a comparison was made between CTs and HTs at the same concentration, because 100% hatching was recorded in CTs at 5.0 mgL-1. The analysis of cd63, zhe1 and klf4 (Figure 7) showed a down-regulation in the groups exposed to HTs at 5.0 mgL-1 compared to the control group. Regarding group exposed to CTs at 5.0 mgL-1 there was an up-regulation only for the cd63 gene.
3. Discussion
Among polyphenols tannins have always attract great interest due to their widely distribution in the plant kingdom and their innumerable properties such as antioxidant, antimicrobial, and anticancer activities and their ability to interact with proteins [18,34,35]. However, they and their metabolites are not free from adverse effects and the extent of the toxic effects depends mainly on the on the type of tannin used and amount consumed [14,36]. Even if both, CTs and HTs, have been repeatedly investigated further research is needed to define the diversity of utilization of tannins. The data obtained in this study showed that low concentrations of CTs and HTs (5.0, 10.0, and 20.0 µgL-1) do not cause toxicity during the early stages of zebrafish development. No mortality events, hatching and heartbeat alterations were observed. It has been reported that CTs and HTs at 5.0 µgL-1 prevent lipid peroxidation in rat liver mitochondria [37]. This property is related to their chemical structure due to their capacity to bind a wide range of molecules such as proteins, enzymes, and ions [38,39]. Previously published studies have shown how some polyphenols, such as tannins and their metabolites (i.e. Gallic acid) counteract the toxic action of several substances or pollutants [40,41].
Our data showed that HTs at concentrations of 5.0, 10.0, and 20.0 mgL-1 were toxic to zebrafish embryonic development. Under normal conditions, hatching of zebrafish embryos occurs between 48 and 72 hours post fertilization (hpf) [42]. When embryos were treated with HTs, a delay in embryo hatching was observed at both 48 h and 72 h after treatment (54 and 78 hpf, respectively) for all concentrations tested. This could depend on the different metabolization or accumulation of HTs by embryos exposed to different concentrations. In fact, the uptake of HTs increased with increasing exposure concentration and it is noteworthy to observe that the greatest uptake was reported in the group exposed to the dose of HTs 5.0 mgL-1 respect to the lower doses (5.0, 10.0, and 20.0 µgL-1). This reflected the increased peak areas present in chromatographic profile of the larvae exposed to 5.0 mgL-1 compared to the other groups, including the peaks of the two basic metabolites, GA and PY.
It is known that dietary polyphenols are metabolized to simpler bioactive molecules. The HTs used in this study are highly purified GTs. The degradation of GTs consists of a series of enzyme-catalyzed reactions that ultimately leads to the production of GA following hydrolysis of the ester bond. Then, decarboxylation would occur on GA to form PY [43].
GA is widely distributed in edible plants, possesses potent antioxidant activity and low bioavailability due to rapid absorption and metabolism [44]. However, higher concentrations of GA are toxic [45]. GA contains multiple hydroxyl groups which significantly increase ROS production. Several studies suggest that high doses of GA can trigger the induction of ROS formation and subsequent apoptosis, and that ROS-induced apoptosis leads to abnormal development during embryogenesis affecting hatching [28]. Likewise, PY promotes free radicals leading to oxidative stress and toxicity [46].
Probably, the synergistic effect of GA, PY and other GT metabolites would lead to problems in hatching by interfering with the physiological processes of embryonic development. [31] indicated that exposure of zebrafish embryos for 72 h to high concentrations (1-2 mgL-1) of natural plant extracts would results in delayed hatching or non-hatching, failure in spine development, low heart rate, delayed growth, limited movement, or death. In fact, the even higher concentrations of 10.0 and 20.0 mgL-1 were not evaluated due to the failure to hatch probably due to their high toxicity.
CTs are more widespread in nature than HTs and so are dominating the tannins market world [47,48]. However, showing a different chemical structure can produce different effects with respect to HTs. Regarding CTs, the hatching rate showed a decrease mainly at 48 h of treatment while at 72 h of treatment only the concentration of 20.0 mgL-1 caused a delay in hatching. Moreover, the uptake of CTs at 72 h also increased with increasing exposure concentration, but in a gradual manner without major differences between the experimental groups. Likewise, the peak areas in the chromatographic profiles did not vary considerably between the experimental groups. The CTs used in this study are highly purified profisetidine tannins. Profisetinidins belong to the class of proanthocyanidins and have a powerful scavenging activity against free radicals [49]. They contain gallocatechin basic units therefore GA and PY are present among their metabolites. However, the concentrations of the latter are much lower than those found for HTs therefore they probably do not reach toxic concentrations, rather, they act in synergy with the PF metabolites exerting an antioxidant effect.
Our results are in agreement with the literature which reports that different types of plants extract rich in polyphenols cause a delay in hatching on zebrafish embryos [50,51,52] reported that the reduction in hatching rate could result from an accumulation of polyphenols in the embryo subsequently to their penetration into the chorion, reaching a concentration that induces toxicity [52].
The differences found in hatching between 48 h and 72 h of CTs exposure could be explained by the change in pores size during development [53]. It could be hypothesized that around 48 h the chorion protects the embryo, slowing the passage of CTs [54] that could accumulate by clogging the pores and preventing exchanges with the external environment. At 72 h, pores change size [53], so that tannins can enter and no longer occlude the pores. In this way, development continues, and hatching occurs. Another hypothesis that would explain the slowing of hatching in presence of tannins could be related to the ability of tannins to chelate metal ions [15]. In this case CTs and HTs could retain zinc, which is necessary for the development of the hatching gland [55], delaying the hatching process.
The delay in the hatching process observed with HTs at 5.0 mgL-1 was confirmed by gene expression analysis at 72 h after exposure. In fact, a down-regulation of cd63, zhe1 and klf4 genes were observed in larvae treated with HTs. The delay in the hatching process in presence of plant extracts has already been related to an alteration in the hatching enzyme zhe1 [29], which is involved in weakening of the chorion [56]. The klf4 is a zinc-finger transcription factor, belonging to the Krüppel-like factor family, characterized by a DNA-binding domain at the C-terminal end. This gene is involved in the formation of the hatching gland and its vasculature [57,58]. The down-regulation of klf4 confirmed the reduction of hatching in presence of HTs. The cd63 gene belongs to the tetraspanin family, highly conserved transmembrane proteins [59] expressed during development of pre-polster, a tissue implicated in the hatching gland formation [60]. From our results, cd63 was down-regulated, confirming an alteration in hatching gland development. The differences between CTs and HTs in gene expression analysis are in accordance with the hatching data. In fact, in the group exposed to 5.0 mgL-1 of HTs at 72 h of treatment, hatching was delayed, in contrast with 5.0 mgL-1 of CTs treatment, in which the hatching rate was comparable to the control. In the group exposed to CTs, zhe1 and klf4 are comparable to control group, while cd63 results up-regulated probably because a resumption of the hatching process occurs.
Overall, data obtained by zebrafish embryo exposure to HTs and CTs high concentration showed how they differentially affect zebrafish development at the same concentration. It is conceivable that the different structure of these tannins affects their activity with HTs rapidly metabolized producing PY and GA which can act synergistically to induce toxic effects. As reported by [61], GA is readily absorbed, and this absorbed gallate induces antinutritional effects [62]. On the contrary, CTs having more complex structure and higher molecular weight with respect to HTs show a lower bioavailability and absorbability [63] and are safer at higher concentrations.
4. Materials and Methods
4.1. Preparation of Solutions
Condensed tannins (Tan’Activ GTC/E - Silvateam) and hydrolysable tannins (Tan’Activ QS-SOL - Silvateam) were dissolved in E3 medium (5 mM NaCl, 0.17 mM KCl, 0.33 mM CaCl2⋅2H2O, 0.33 mM MgSO4) to obtain the concentration to be tested on embryos. The concentrations used were chosen based on those already found in the literature on Danio rerio and other model organisms [64,65,66].
4.2. Zebrafish Breeding
Eggs were obtained from 15 adult zebrafish that were housed in the Facility of the Department of Biology, University of Naples Federico II, in glass tanks, with a 14h:10h light/dark photoperiod, water temperature of 28.0 °C, and pH of 7.5. Zebrafish were fed with a commercial diet (TetraMin Tropical Flake Fish®) supplemented with Artemia sp. nauplii [67]. Experimental procedure was according to National (Italian D.lgs 26/2014) and European (2010/63/EU) guidelines on the welfare of animals used for research purposes. Fertilized eggs were selected by a stereomicroscope (Leica Zoom 2000) and transferred into E3 medium.
4.3. Embryos Treatment
At 6 hpf, zebrafish embryos were exposed to 5.0, 10.0, 20.0 µgL-1 and 5.0, 10.0, 20.0 mgL-1 of CTs and HTs tannins for 72 h. A group with only E3 medium was set up as a control (Ctrl). The treatments were carried out in 6-well plates at 28.0 °C with 10 embryos per well adding 10 mL of solution that was renewed every day [68]. A total of 20 embryos were used for each group [69] and the experiments were all triplicated according to the principle of 3Rs (Replacement, Reduction and Refinement) (3Rs principles) [70], to limit the overuse of animals.
4.4. Analysis of Development
Survival and hatching were followed up to 72 h of treatment (78 hpf). The number of dead embryos was determined over the total number of embryos while the number of hatched larvae was determined relative to the total number live embryos and larvae.
4.5. Extraction of Tannins from Zebrafish Larvae
Tannins were extracted from a pool of 30 larvae with 80% (v/v) methanol. In particular, the pool of larvae was homogenized in 500 μl of 80% (v/v) methanol using a manual potter homogenizer. Then it was vortexed for 30 seconds and held for 30 min at room temperature; this step was repeated three times. It was subsequently centrifuged at 13,000 xg for 10 minutes and the supernatant was transferred to a sterile vial for HPLC analysis.
4.6. HPLC Analysis
HPLC analysis was performed as reported by [6], using an LC-4000 Series Integrated HPLC Systems (JASCO, Japan) consisting of an oven column (model CO-2060 plus), a UV/Vis Photodiode Array Detector (model MD-2018 plus), an Intelligent Fluorescence Detector (model PF-2020 plus), a liquid chromatography pump (model PU-2089 plus), an autosampler (AS-2059 plus), and a ChromNAV software program (JASCO, Japan). A C18 Luna column, 5-μm particle size, 25 cm×3.00mm I.D. was used (Phenomenex, Torrance, CA, USA).
The mobile phase consisted of 0,2% (v/v) phosphoric acid (solvent A) and 82% (v/v) acetonitrile containing 0,04% (v/v) phosphoric acid (solvent B). The temperature was maintained at 30°C. The flow rate was 1 ml/min. The injection volume was 20 μl. HPLC run conditions were as follows: 0–15 min, 15% B; 15-40 min, 16% B; 40-45 min, 17% B; 45-48 min, 43% B; 48-49 min, 52% B; 49-56 min, 52% B; 56-57 min, 43% B; 57-58 min, 17% B; 58-60 min, 0% B.
Peaks were detected at 280 nm and identified by comparison to the retention times and UV-Vis spectra of HTssand CTs,s pyrogallol, gallic acid and profisetinidin pure standards (purchased from Sigma, Italy). Their concentrations were calculated using a standard curve.
4.7. Quantitative Real-Time PCR
The quantitative Real-Time PCR (qRT-PCR) was carried out to analyse the expression gene of cd63, zhe1, and klf4 in the groups of control, CTs and HTs at 5.0 mgL-1. Total RNA from 10 zebrafish larvae per group was extracted using Direct-zolTM RNA Miniprep Plus Kit (ZYMO RESEARCH, Irvine, CA, USA). The concentration and purity of RNA were measured through Nanodrop® spectrophotometer 2000 (Thermo Scientific Inc., Waltham, MA USA). Then, cDNA was synthesized from 1000 ng of total RNA using All-In-One 5X RT MasterMix (Applied Biological Materials, Richmond, BC, Canada). For qRT-PCR, a reaction with 2 µL of cDNA, 0.5 µL of each primer (Table 3) (Eurofins Genomics, Ebersberg, Germany) at 10.0 µM was conducted using BlastTaqTM 2X qPCR MasterMix (Applied Biological Materials, Richmond, BC, Canada). The thermocycling conditions were: one cycle for enzyme activation (95 °C for 3 min), 40 cycles for denaturation and annealing/extension (95 °C for 15 s, 60 °C for 1 min) and melting curve analysis in according to the instructions of StepOnePlus Real Time PCR System (Thermo Fisher Scientific, Waltham, MA, USA). The expression gene was normalized to β-actin gene and analysed through the Ct value, using the REST software (Relative Expression Software Tool, Weihenstephan, Germany, version 1.9.12) based on Pfaffl's method [73,74]. The experiment was conducted in triplicate.
4.8. Statistical Analyses
All experiments were repeated in triplicate and data were expressed as mean ± SD. Statistical analyses were performed using GraphPad Prism Software (version 8.02 for Windows, GraphPad Software, La Jolla, CA, USA). One-way analysis of variance (ANOVA) method followed by Tukey's test was used to compare all experimental groups with each other. Student's t-test was used to compare the expression of individual genes between CTs and HTs. The minimum acceptable level of significance was set at P < 0.05.
5. Conclusions
This work focused on studying the comparative effect of CTs and HTs, at two different concentration ranges, on the development of zebrafish embryo. The data obtained show how two different types of tannins produce opposite effects at high concentrations, with HTs producing toxic effects compared to CTs which are safe at the same doses. Interestingly, these effects could be due to the different absorption of CTs and HTs and to their metabolites. These findings could open the way to a new kind of approach to study the dose-dependent effects of different tannins with particular attention to their metabolism and find the best tannin type and dose to be used in different application fields such as chemical and animal feed industry, and medical science.
Author Contributions
Conceptualization, A.L.P., R.I., I.F., M.P.; methodology, A.L.P., R.I., E.C, T.M.; software, A.L.P., R.I., E.C.; validation, A.L.P., R.I., E.C., I.F., M.P.; formal analysis, A.L.P., R.I., E.C., T.M.; investigation, I.F., M.P.; data curation A.L.P., R.I., E.C., T.M.; writing—original draft preparation, A.L.P., R.I., E.C., T.M.; writing—review and editing, I.F., M.P.; visualization, I.F., M.P.; supervision, I.F., M.P.; project administration, I.F., M.P.
Institutional Review Board Statement
The animal study protocol was in according to National (Italian D.lgs 26/2014) and European (2010/63/EU) guidelines.
Informed Consent Statement
Not applicable.
Data Availability Statement
Data are available from the corresponding author upon reasonable request.
Conflicts of Interest
The authors declare no conflicts of interest.
References
- Otegui, M.S. Imaging polyphenolic compounds in plant tissues. Recent advances in polyphenol research 2021, 7, 281–295. [Google Scholar] [CrossRef]
- Rahman, M.M.; Rahaman, M.S.; Islam, M.R.; Rahman, F.; Mithi, F.M.; Alqahtani, T.; Almikhlafi, M.A.; Alghamdi, S.Q.; Alruwaili, A.S.; Hossain, M.S.; et al. Role of phenolic compounds in human disease: Current knowledge and future prospects. Molecules 2021, 27, 233. [Google Scholar] [CrossRef]
- Aatif, M. Current Understanding of Polyphenols to Enhance Bioavailability for Better Therapies. Biomedicines 2023, 11, 2078. [Google Scholar] [CrossRef] [PubMed]
- Orso, G.; Solovyev, M.M.; Facchiano, S.; Tyrikova, E.; Sateriale, D.; Kashinskaya, E.; Pagliarulo, C.; Hoseinifar, H.S.; Simonov, E.; Varricchio, E.; et al. Chestnut shell tannins: Effects on intestinal inflammation and dysbiosis in Zebrafish. Animals 2021, 11, 1538. [Google Scholar] [CrossRef] [PubMed]
- Imperatore, R.; Fronte, B.; Scicchitano, D.; Orso, G.; Marchese, M.; Mero, S.; Licitra, R.; Coccia, E.; Candela, M.; Paolucci, M. Dietary Supplementation with a Blend of Hydrolyzable and Condensed Tannins Ameliorates Diet-Induced Intestinal Inflammation in Zebrafish (Danio rerio). Animals. 2021, 13, 167. [Google Scholar] [CrossRef] [PubMed]
- Imperatore, R.; Orso, G.; Facchiano, S.; Scarano, P.P.; Hoseinifar, S.H.; Ashouri, G.; Guarino, C.; Paolucci, M. Anti-inflammatory and immunostimulant effect of different timing-related administration of dietary polyphenols on intestinal inflammation in zebrafish, Danio rerio. Aquac. 2023, 563, 738878. [Google Scholar] [CrossRef]
- Ali, A.; Kiloni, S.M.; Cáceres-Vélez, P.R.; Jusuf, P.R.; Cottrell, J.J.; Dunshea, F.R. Phytochemicals, Antioxidant Activities, and Toxicological Screening of Native Australian Fruits Using Zebrafish Embryonic Model. Foods 2022, 11, 4038. [Google Scholar] [CrossRef] [PubMed]
- Das, A.K.; Islam, M.N.; Faruk, M.O.; Ashaduzzaman, M.; Dungani, R. Review on tannins: Extraction processes, applications and possibilities. S. Afr. J. Bot. 2020, 135, 58–70. [Google Scholar] [CrossRef]
- Kumari, M.; Jain, S. Tannins: An antinutrient with positive effect to manage diabetes. Res. J. Recent Sci. 2012, 2277, 2502. [Google Scholar]
- He, M.; Tian, H.; Luo, X.; Qi, X.; Chen, X. Molecular progress in research on fruit astringency. Molecules 2015, 20, 1434–1451. [Google Scholar] [CrossRef]
- Bharadwaj, M.; Mondal, B.; Lata, M. Scope of utilization of tannin & saponin to improve animal performance. J. Entomol. Zool. Stud. 2021, 9, 2168–2179. [Google Scholar]
- De Francesco, G.; Bravi, E.; Sanarica, E.; Marconi, O.; Cappelletti, F.; Perretti, G. Effect of addition of different phenolic-rich extracts on beer flavour stability. Foods 2020, 9, 1638. [Google Scholar] [CrossRef] [PubMed]
- Raitanen, J.E.; Järvenpää, E.; Korpinen, R.; Mäkinen, S.; Hellström, J.; Kilpeläinen, P.; Liimatainen, J.; Ora, A.; Tupasela, T.; Jyske, T. Tannins of conifer bark as nordic piquancy—Sustainable preservative and aroma? Molecules 2020, 25, 567. [Google Scholar] [CrossRef]
- de Melo, L.F.M.; de Queiroz Aquino-Martins, V.G.; da Silva, A.P.; Rocha, H.A.O.; Scortecci, K.C. Biological and pharmacological aspects of tannins and potential biotechnological applications. Food Chem. 2023, 414, 135645. [Google Scholar] [CrossRef] [PubMed]
- Zhang, L.; Guan, Q.; Jiang, J.; Khan, M.S. Tannin complexation with metal ions and its implication on human health, environment and industry: An overview. Int. J. Biol. Macromol. 2023, 253, 127485. [Google Scholar] [CrossRef] [PubMed]
- Haslam, E. Practical Polyphenolics: From Structure to Molecular Recognition and Physiological Function; Cambridge University Press: Cambridge, UK, 2005. [Google Scholar]
- Sharma, K.; Kumar, V.; Kaur, J.; Tanwar, B.; Goyal, A.; Sharma, R.; Gat, Y.; Kumar, A. Health effects, sources, utilization and safety of tannins: A critical review. Toxin Rev. 2021, 40, 432–444. [Google Scholar] [CrossRef]
- Pizzi, A. Tannins medical/pharmacological and related applications: A critical review. Sustain. Chem. Pharm. 2021, 22, 100481. [Google Scholar] [CrossRef]
- Yin, Z.; Sun, J.T.; Cui, H.D.; Jiang, C.Q.; Zhang, Y.T.; Lee, S.; Liu, Z.H.; Jin, J.X. Tannin Supplementation Improves Oocyte Cytoplasmic Maturation and Subsequent Embryo Development in Pigs. Antioxidants 2021, 10, 1594. [Google Scholar] [CrossRef]
- Santoriello, C.; Zon, L.I. Hooked! Modeling human disease in zebrafish. J. Clin. Invest. 2012, 122, 2337–2343. [Google Scholar] [CrossRef]
- Horzmann, K.A.; Freeman, J.L. Making Waves: New Developments in Toxicology with the Zebrafish. Toxicol. Sci. 2018, 163, 5–12. [Google Scholar] [CrossRef]
- Tal, T.; Yaghoobi, B.; Lein, P.J. Translational toxicology in zebrafish. Curr. Opin. Toxicol. 2020, 23, 56–66. [Google Scholar] [CrossRef]
- Capriello, T.; Di Meglio, G.; De Maio, A.; Scudiero, R.; Bianchi, A.R.; Trifuoggi, M.; Toscanesi, M.; Giarra, A.; Ferrandino, I. Aluminium exposure leads to neurodegeneration and alters the expression of marker genes involved to parkinsonism in zebrafish brain. Chemosphere 2022, 307, 135752. [Google Scholar] [CrossRef] [PubMed]
- Truong, L.; Harper, S.L.; Tanguay, R.L. Evaluation of embryotoxicity using the zebrafish model. Methods Mol. Biol. 2011, 691, 271–279. [Google Scholar] [CrossRef]
- Howe, K.; Clark, M.D.; Torroja, C.F.; Torrance, J.; Berthelot, C.; Muffato, M.; Collins, J.E.; Humphray, S.; McLaren, K.; Matthews, L. The zebrafish reference genome sequence and its relationship to the human genome. Nature 2013, 496, 498–503. [Google Scholar] [CrossRef] [PubMed]
- Mektrirat, R.; Yano, T.; Okonogi, S.; Katip, W.; Pikulkaew, S. Phytochemical and safety evaluations of volatile terpenoids from Zingiber cassumunar Roxb. on mature carp peripheral blood mononuclear cells and embryonic zebrafish. Molecules 2020, 25, 613. [Google Scholar] [CrossRef] [PubMed]
- Garcia, G.R.; Noyes, P.D.; Tanguay, R.L. Advancements in zebrafish applications for 21st century toxicology. Pharmacol. Ther. 2016, 161, 11–21. [Google Scholar] [CrossRef] [PubMed]
- Baran, A.; Köktürk, M.; Atamanalp, M.; Ceyhun, S.B. Determination of developmental toxicity of zebrafish exposed to propyl gallate dosed lower than ADI (Acceptable Daily Intake). Regul. Toxicol. Pharmacol. 2018, 94, 16–21. [Google Scholar] [CrossRef] [PubMed]
- Veeren, B.; Ghaddar, B.; Bringart, M.; Khazaal, S.; Gonthier, M.P.; Meilhac, O.; Diotel, N.; Bascands, J.L. Phenolic profile of herbal infusion and polyphenol-rich extract from leaves of the medicinal plant antirhea borbonica: Toxicity assay determination in zebrafish embryos and larvae. Molecules 2020, 25, 4482. [Google Scholar] [CrossRef]
- Annona, G.; Tarallo, A.; Nittoli, V.; Varricchio, E.; Sordino, P.; D’Aniello, S.; Paolucci, M. Short-term exposure to the simple polyphenolic compound gallic acid induces neuronal hyperactivity in zebrafish larvae. Euro. J. Neurosci. 2021, 53, 1367–1377. [Google Scholar] [CrossRef]
- Raharjeng, A.R.P.; Kusumaningtyas, A.A.; Widatama, D.A.; Zarah, S.; Pratama, S.F.; Dani, H.B. The effects of the plant extract on embryonic development of zebrafish (Danio rerio). Trop. Genet. 2021, 1, 6–11. [Google Scholar]
- Jezierska, B.; Witeska, M. Metal Toxicity to Fish, 2001. University of Podlasie Publisher, Siedlce, p 318.
- Sorolla, S.; Flores, A.; Canals, T.; Cantero, R.; Font, J.; Ollé, L.; Bacardit, A. Study of the Qualitative and Semi-quantitative Analysis of Grape Seed Extract by HPLC. J. Am. Leather Chem. Assoc. 2018, 113, 88–93. [Google Scholar]
- Campos-Vega, R.; Oomah, B.D.; Hernández-Arriaga, A.M.; Salazar-López, N.J.; Vázquez-Sánchez, K. Tannins. Phenolic Compounds in Food 2018, pp. 211–258.
- Hussain, G.; Huang, J.; Rasul, A.; Anwar, H.; Imran, A.; Maqbool, J.; Razzaq, A.; Aziz, N.; Makhdoom, E.H.; Konuk, M.; et al. Putative roles of plant-derived tannins in neurodegenerative and neuropsychiatry disorders: An updated review. Molecules 2019, 24, 2213. [Google Scholar] [CrossRef] [PubMed]
- Smeriglio, A.; Barreca, D.; Bellocco, E.; Trombetta, D. Proanthocyanidins and hydrolysable tannins: Occurrence, dietary intake and pharmacological effects. Br. J. Pharmacol. 2017, 174, 1244–1262. [Google Scholar] [CrossRef] [PubMed]
- Okuda, T.; Kimura, Y.; Yoshida, T.; Hatano, T.; Okuda, H.; Arichi, S. Studies on the activities of tannins and related compounds from medicinal plants and drugs. I. Inhibitory effects on lipid peroxidation in mitochondria and microsomes of liver. Chem. Pharm. Bull. 1983, 31, 1625–1631. [Google Scholar] [CrossRef] [PubMed]
- Vuolo, M.M.; Lima, V.S.; Junior, M.R.M. Phenolic compounds: Structure, classification, and antioxidant power. Bioactive compounds 2018, 33–50. [Google Scholar] [CrossRef]
- De Hoyos-Martínez, P.L.; Merle, J.; Labidi, J.; Charrier–El Bouhtoury, F. Tannins extraction: A key point for their valorization and cleaner production. J. Clean. Prod. 2019, 206, 1138–1155. [Google Scholar] [CrossRef]
- Wätjen, W.; Michels, G.; Steffan, B.; Niering, P.; Chovolou, Y.; Kampkötter, A.; Tran-Thi, Q.H.; Proksch, P.; Kahl, R. Low concentrations of flavonoids are protective in rat H4IIE cells whereas high concentrations cause DNA damage and apoptosis. J. Nutr. 2005, 135, 525–531. [Google Scholar] [CrossRef]
- Żwierełło, W.; Maruszewska, A.; Skórka-Majewicz, M.; Goschorska, M.; Baranowska-Bosiacka, I.; Dec, K.; Styburski, D.; Nowakowska, A.; Gutowska, I. The influence of polyphenols on metabolic disorders caused by compounds released from plastics-Review. Chemosphere 2020, 240, 124901. [Google Scholar] [CrossRef] [PubMed]
- Kimmel, C.B.; Ballard, W.W.; Kimmel, S.R.; Ullmann, B.; Schilling, T.F. Stages of embryonic development of the zebrafish. Dev. dynam. 1995, 203, 253–310. [Google Scholar] [CrossRef] [PubMed]
- He, H.F. Recognition of Gallotannins and the Physiological Activities: From Chemical View. Front. Nutr. 2022, 9, 888892. [Google Scholar] [CrossRef]
- Xiang, Z.; Guan, H.; Zhao, X.; Xie, Q.; Xie, Z.; Cai, F.; Dang, R.; Li, M.; Wang, C. Dietary gallic acid as an antioxidant: A review of its food industry applications, health benefits, bioavailability, nano-delivery systems, and drug interactions. Int. Food Res. 2024, 114068. [Google Scholar] [CrossRef]
- Bai, J.; Zhang, Y.; Tang, C.; Hou, Y.; Ai, X.; Chen, X.; Zhang, L.; Wang, X.; Meng, X. Gallic acid: Pharmacological activities and molecular mechanisms involved in inflammation-related diseases. Biomed. Pharmacother. 2021, 133, 110985. [Google Scholar] [CrossRef] [PubMed]
- Hamed, M.; Soliman, H.A.; Said, R.E.; Martyniuk, C.J.; Osman, A.G.; Sayed, A.E.D.H. Oxidative stress, antioxidant defense responses, and histopathology: Biomarkers for monitoring exposure to pyrogallol in Clarias gariepinus. J. Environ. Manag. 2024, 351, 119845. [Google Scholar] [CrossRef]
- Filgueira, D.; Moldes, D.; Fuentealba, C.; García, D.E. Condensed tannins from pine bark: A novel wood surface modifier assisted by laccase. Ind. Crops Prod. 2017, 103, 185–194. [Google Scholar] [CrossRef]
- Pizzi, A. Tannins: Major sources, properties and applications. Monomers, polymers and composites from renewable resources 2008, 179-199. [CrossRef]
- Fruet, A.P.B.; Giotto, F.M.; Fonseca, M.A.; Nörnberg, J.L.; de Mello, A.S. Effects of the Incorporation of Tannin Extract from Quebracho Colorado Wood on Color Parameters, Lipid Oxidation, and Sensory Attributes of Beef Patties. Foods 2020, 9, 667. [Google Scholar] [CrossRef] [PubMed]
- Kundap, U.; Jaiswal, Y.; Sarawade, R.; Williams, L.; Shaikh, M.F. Effect of Pelargonidin isolated from Ficus benghalensis L. on phenotypic changes in zebrafish (Danio rerio) embryos. Saudi Pharm. J. 2017, 25, 249–257. [Google Scholar] [CrossRef] [PubMed]
- Castro, T.F.D.; Carneiro, W.F.; Reichel, T.; Fabem, S.L.; Machado, M.R.F.; de Souza, K.K.C.; Resende, L.V.; Murgas, L.D.S. The toxicological effects of Eryngium foetidum extracts on zebrafish embryos and larvae depend on the type of extract, dose, and exposure time. Toxicol. Res. 2022, 11, 891–899. [Google Scholar] [CrossRef] [PubMed]
- Alafiatayo, A.A.; Lai, K.S.; Syahida, A.; Mahmood, M.; Shaharuddin, N.A. Phytochemical evaluation, embryotoxicity, and teratogenic effects of Curcuma longa extract on zebrafish (Danio rerio). J. Evid. Based Complementary Altern. Med. 2019. [CrossRef] [PubMed]
- Ali, M.K.; Saber, S.P.; Taite, D.R.; Emadi, S.; Irving, R. The protective layer of zebrafish embryo changes continuously with advancing age of embryo development (AGED). J. Toxicol. Pharmacol. 2017, 1. [Google Scholar]
- Ismail, H.F.; Hashim, Z.; Soon, W.T.; Ab Rahman, N.S.; Zainudin, A.N.; Majid, F.A.A. Comparative study of herbal plants on the phenolic and flavonoid content, antioxidant activities and toxicity on cells and zebrafish embryo. J. Tradit. Complement. Med. 2017, 7, 452–465. [Google Scholar] [CrossRef]
- Muraina, I.A.; Maret, W.; Bury, N.R.; Hogstrand, C. Hatching gland development and hatching in zebrafish embryos: A role for zinc and its transporters Zip10 and Znt1a. Biochem. Biophys. Res. Commun. 2020, 528, 698–705. [Google Scholar] [CrossRef]
- Sano, K.; Inohaya, K.; Kawaguchi, M.; Yoshizaki, N.; Iuchi, I.; Yasumasu, S. Purification and characterization of zebrafish hatching enzyme–an evolutionary aspect of the mechanism of egg envelope digestion. FEBS J. 2008, 275, 5934–5946. [Google Scholar] [CrossRef]
- Amatruda, J.F.; Zon, L.I. Dissecting hematopoiesis and disease using the zebrafish. Dev. Biol. 1999, 216, 1–15. [Google Scholar] [CrossRef] [PubMed]
- Gardiner, M.R.; Daggett, D.F.; Zon, L.I.; Perkins, A.C. Zebrafish KLF4 is essential for anterior mesendoderm/pre-polster differentiation and hatching. Dev. Dynam. 2005, 234, 992–996. [Google Scholar] [CrossRef] [PubMed]
- Trikić, M.Z.; Monk, P.; Roehl, H.; Partridge, L.J. Regulation of zebrafish hatching by tetraspanin cd63. PLoS ONE 2011, 6, e19683. [Google Scholar] [CrossRef] [PubMed]
- Gritsman, K.; Talbot, W.S.; Schier, A.F. Nodal signaling patterns the organizer. Dev. 2000, 127, 921–932. [Google Scholar] [CrossRef] [PubMed]
- Coccia, E.; Siano, F.; Volpe, M.G.; Varricchio, E.; Eroldogan, O.T.; Paolucci, M. Chestnut Shell Extract Modulates Immune Parameters in the Rainbow Trout Oncorhynchus mykiss. Fishes 2019, 4, 18. [Google Scholar] [CrossRef]
- Butler, L.G. Antinutritional effects of condensed and hydrolyzable tannins. Basic Life Sci. 1992, 59, 693–698. [Google Scholar] [CrossRef] [PubMed]
- Choi, J.; Kim, W.K. Dietary Application of Tannins as a Potential Mitigation Strategy for Current Challenges in Poultry Production: A Review. Animals 2020, 10, 2389. [Google Scholar] [CrossRef] [PubMed]
- Earl, J.E.; Semlitsch, R.D. Effects of tannin source and concentration from tree leaves on two species of tadpoles. Environ. Toxicol. Chem. 2015, 34, 120–126. [Google Scholar] [CrossRef] [PubMed]
- Techer, D.; Milla, S.; Fontaine, P.; Viot, S.; Thomas, M. Acute toxicity and sublethal effects of gallic and pelargonic acids on the zebrafish Danio rerio. Environ. Sci. Pollut. Res. 2015, 22, 5020–5029. [Google Scholar] [CrossRef]
- Xiong, X.; Luo, S.; Wu, B.; Wang, J. Comparative developmental toxicity and stress protein responses of dimethyl sulfoxide to rare minnow and zebrafish embryos/larvae. Zebrafish 2017, 14, 60–68. [Google Scholar] [CrossRef]
- Westerfield, M. The zebrafish book: A guide for the laboratory use of zebrafish (Danio Rerio), 2000. http://zfin. org/zf_info/zfbook/zfbk.
- Capriello, T.; Monteiro, S.M.; Félix, L.M.; Donizetti, A.; Aliperti, V.; Ferrandino, I. Apoptosis, oxidative stress and genotoxicity in developing zebrafish after aluminium exposure. Aquat. Toxicol. 2021, 236, 105872. [Google Scholar] [CrossRef]
- La Pietra, A.; Fasciolo, G.; Lucariello, D.; Motta, C.M.; Venditti, P.; Ferrandino, I. Polystyrene microplastics effects on zebrafish embryological development: Comparison of two different sizes. Environ. Toxicol. Pharmacol. 2024, 106, 104371. [Google Scholar] [CrossRef] [PubMed]
- Tannenbaum, J.; Bennett, B.T. Russell and Burch's 3Rs then and now: The need for clarity in definition and purpose. J. Am. Assoc. Lab. Anim. Sci. 2015, 54, 120–132. [Google Scholar]
- Monaco, A.; Grimaldi, M.C.; Ferrandino, I. Aluminium chloride-induced toxicity in zebrafish larvae. J. Fish Dis. 2017, 40, 629–635. [Google Scholar] [CrossRef] [PubMed]
- Wang, H.; Wang, Y.; Wang, Q.; Lv, M.; Zhao, X.; Ji, Y.; Han, X.; Wang, X.; Chen, L. The combined toxic effects of polyvinyl chloride microplastics and di (2-ethylhexyl) phthalate on the juvenile zebrafish (Danio rerio). J. Hazard. Mater. 2022, 440, 129711. [Google Scholar] [CrossRef] [PubMed]
- Pfaffl, M.W. A new mathematical model for relative quantification in real-time RT–PCR. Nucleic Acids Res. 2001, 29, e45. [Google Scholar] [CrossRef]
- Pfaffl, M.W.; Horgan, G.W.; Dempfle, L. Relative expression software tool (REST©) for group-wise comparison and statistical analysis of relative expression results in real-time PCR. Nucleic Acids Res. 2002, 30, e36. [Google Scholar] [CrossRef]
- Babich, R.; Van Beneden, R.J. Effect of arsenic exposure on early eye development in zebrafish (Danio rerio). J. Appl. Toxicol. 2019, 39, 824–831. [Google Scholar] [CrossRef]
- Jung, S.; Kim, M.J.; Sellaththurai, S.; Kim, S.; Lee, S.; Lee, J. Generation of cd63-deficient zebrafish to analyze the role of cd63 in viral infection. Fish Shellfish Immunol. 2021, 111, 152–159. [Google Scholar] [CrossRef]
- Priyam, A.; Singh, P.P.; Afonso, L.O.; Schultz, A.G. Exposure to biogenic phosphorus nano-agromaterials promotes early hatching and causes no acute toxicity in zebrafish embryos. Environ. Sci. Nano 2022, 9, 1364–1380. [Google Scholar] [CrossRef]
- Vesterlund, L.; Jiao, H.; Unneberg, P.; Hovatta, O.; Kere, J. The zebrafish transcriptome during early development. BMC Dev. Biol. 2011, 11, 1–18. [Google Scholar] [CrossRef] [PubMed]
Figure 1.
(a) Hatching at 48 h and 72 h of exposure with CTs and HTs at 5.0, 10.0, and 20.0 µgL-1. (b) Hatching at 48 h and 72 h of exposure with CTs and HTs at 5.0, 10.0, and 20.0 mgL-1. Tukey’s test: significant differences between the groups are indicated by different letters; same letters indicate no significant differences.
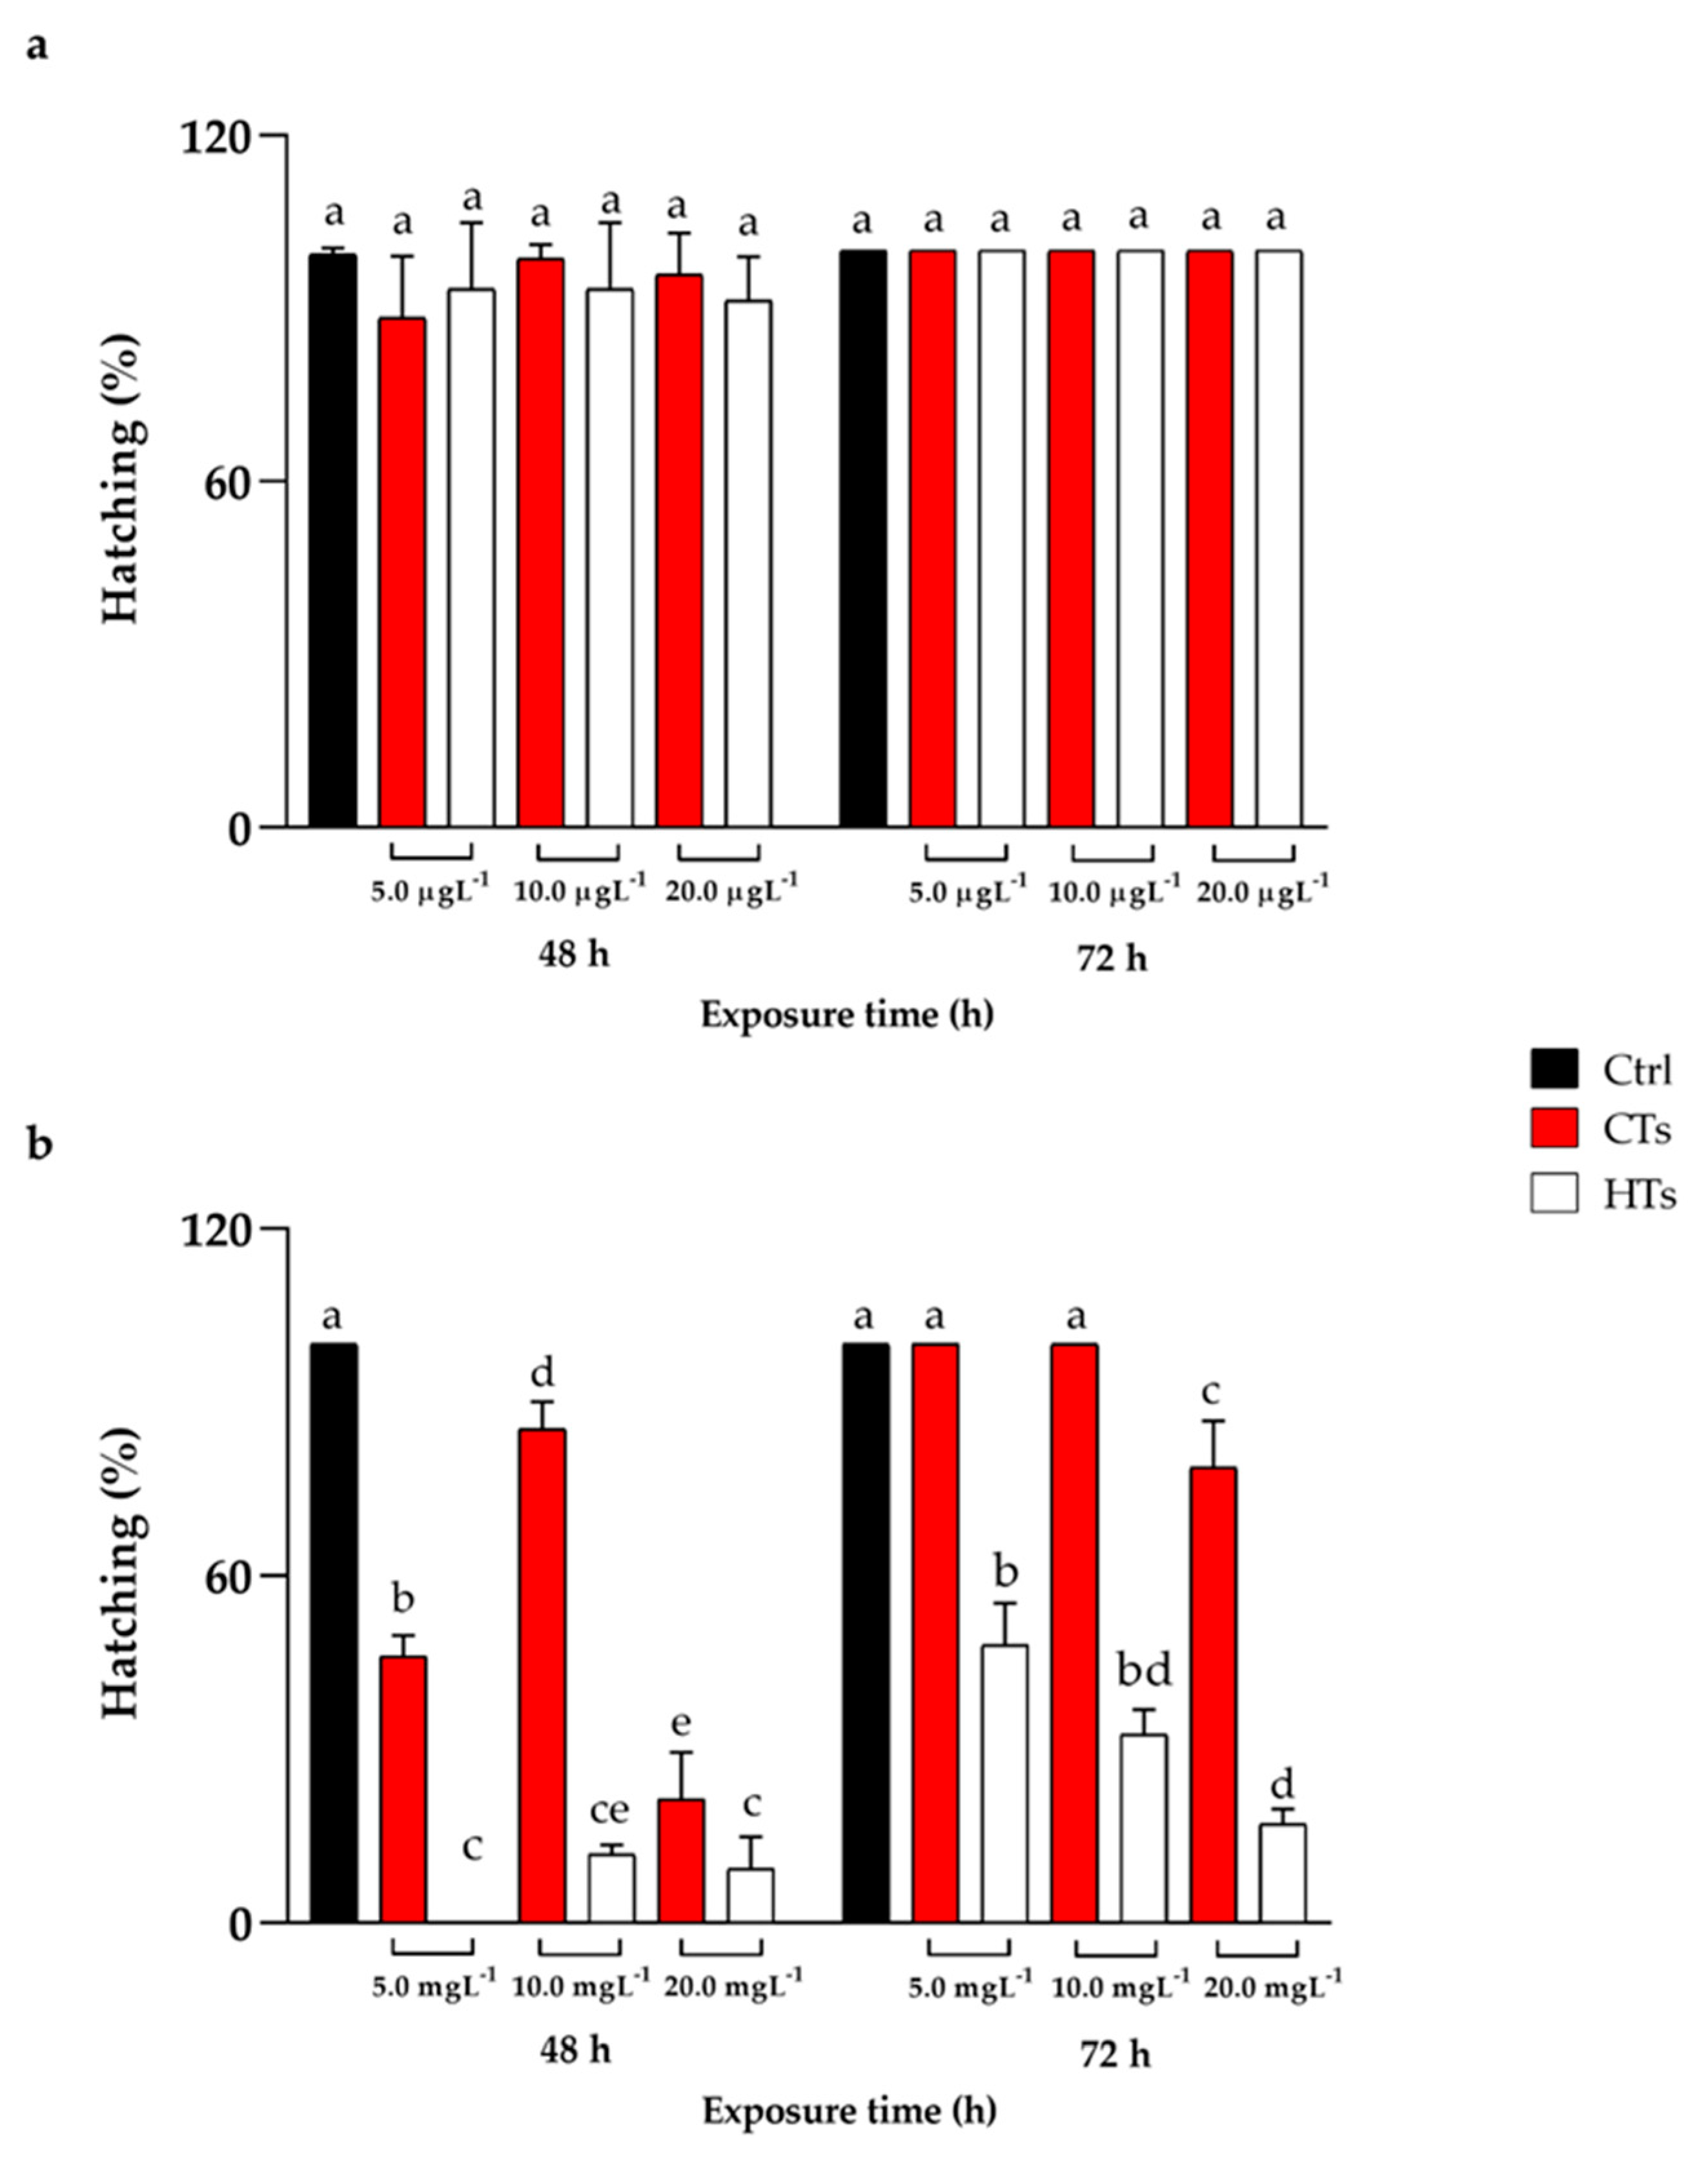
Figure 2.
(a) Heart rate at 72 h of exposure with CTs and HTs at 5.0, 10.0, and 20.0 µgL-1. (b) Heart rate at 72 h of exposure with CTs and HTs at 5.0, 10.0, and 20.0 mgL-1. Tukey’s test: same letters indicate no significant differences.
Figure 2.
(a) Heart rate at 72 h of exposure with CTs and HTs at 5.0, 10.0, and 20.0 µgL-1. (b) Heart rate at 72 h of exposure with CTs and HTs at 5.0, 10.0, and 20.0 mgL-1. Tukey’s test: same letters indicate no significant differences.
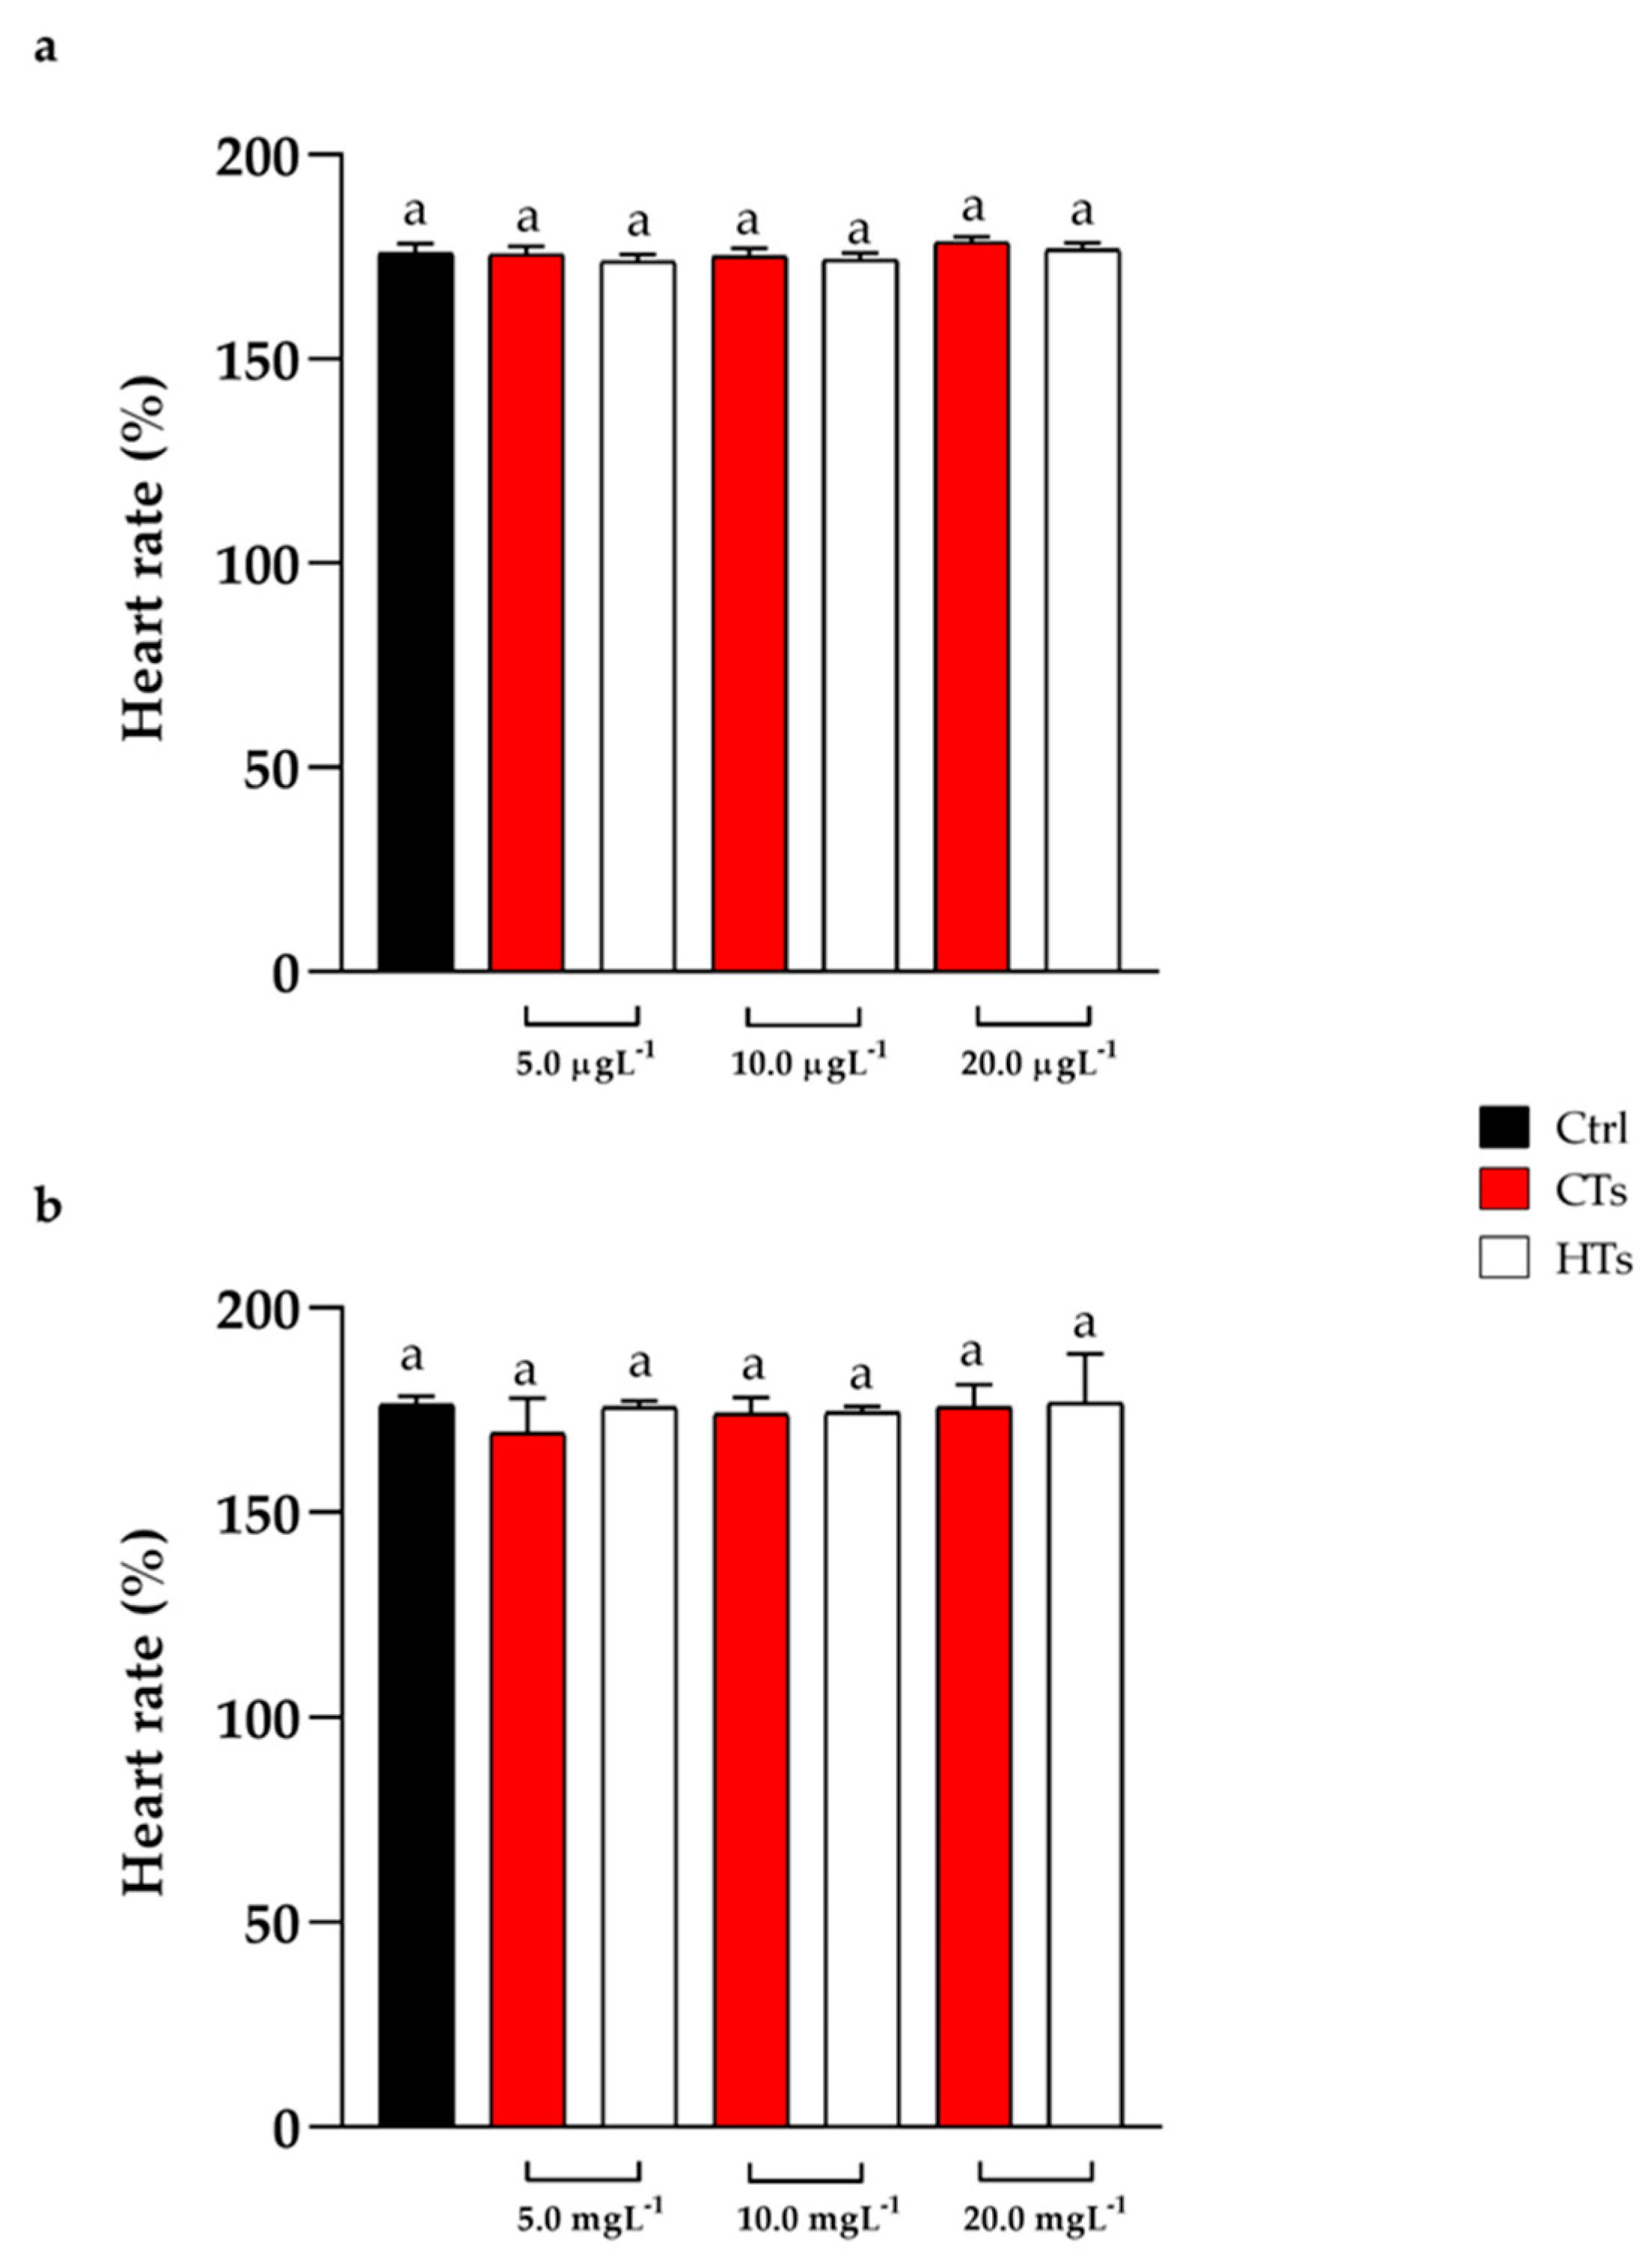
Figure 3.
Representative HPLC profiles of (a) HT standards, extracts of zebrafish larvae at 72 h of exposure with HTs at (b) 0.0, (b) 5.0, (c) 10.0 and (d) 20.0 µgL-1 and (e) 5.0 mgL-1. (PY, pyrogallol; GA, gallic acid; *compounds with UV-Vis typical of GTs).
Figure 3.
Representative HPLC profiles of (a) HT standards, extracts of zebrafish larvae at 72 h of exposure with HTs at (b) 0.0, (b) 5.0, (c) 10.0 and (d) 20.0 µgL-1 and (e) 5.0 mgL-1. (PY, pyrogallol; GA, gallic acid; *compounds with UV-Vis typical of GTs).

Figure 4.
Zebrafish larvae uptake after 72 h of exposure with HTs at 5.0, 10.0, and 20.0 µgL-1 and 5.0 mgL-1. Uptake is calculated as the percentage sum of the areas of all peaks present in the chromatogram. Data represent means ± standard deviation (SD) of three independent experiments. Different letters indicate statistically significant differences (P < 0.05).
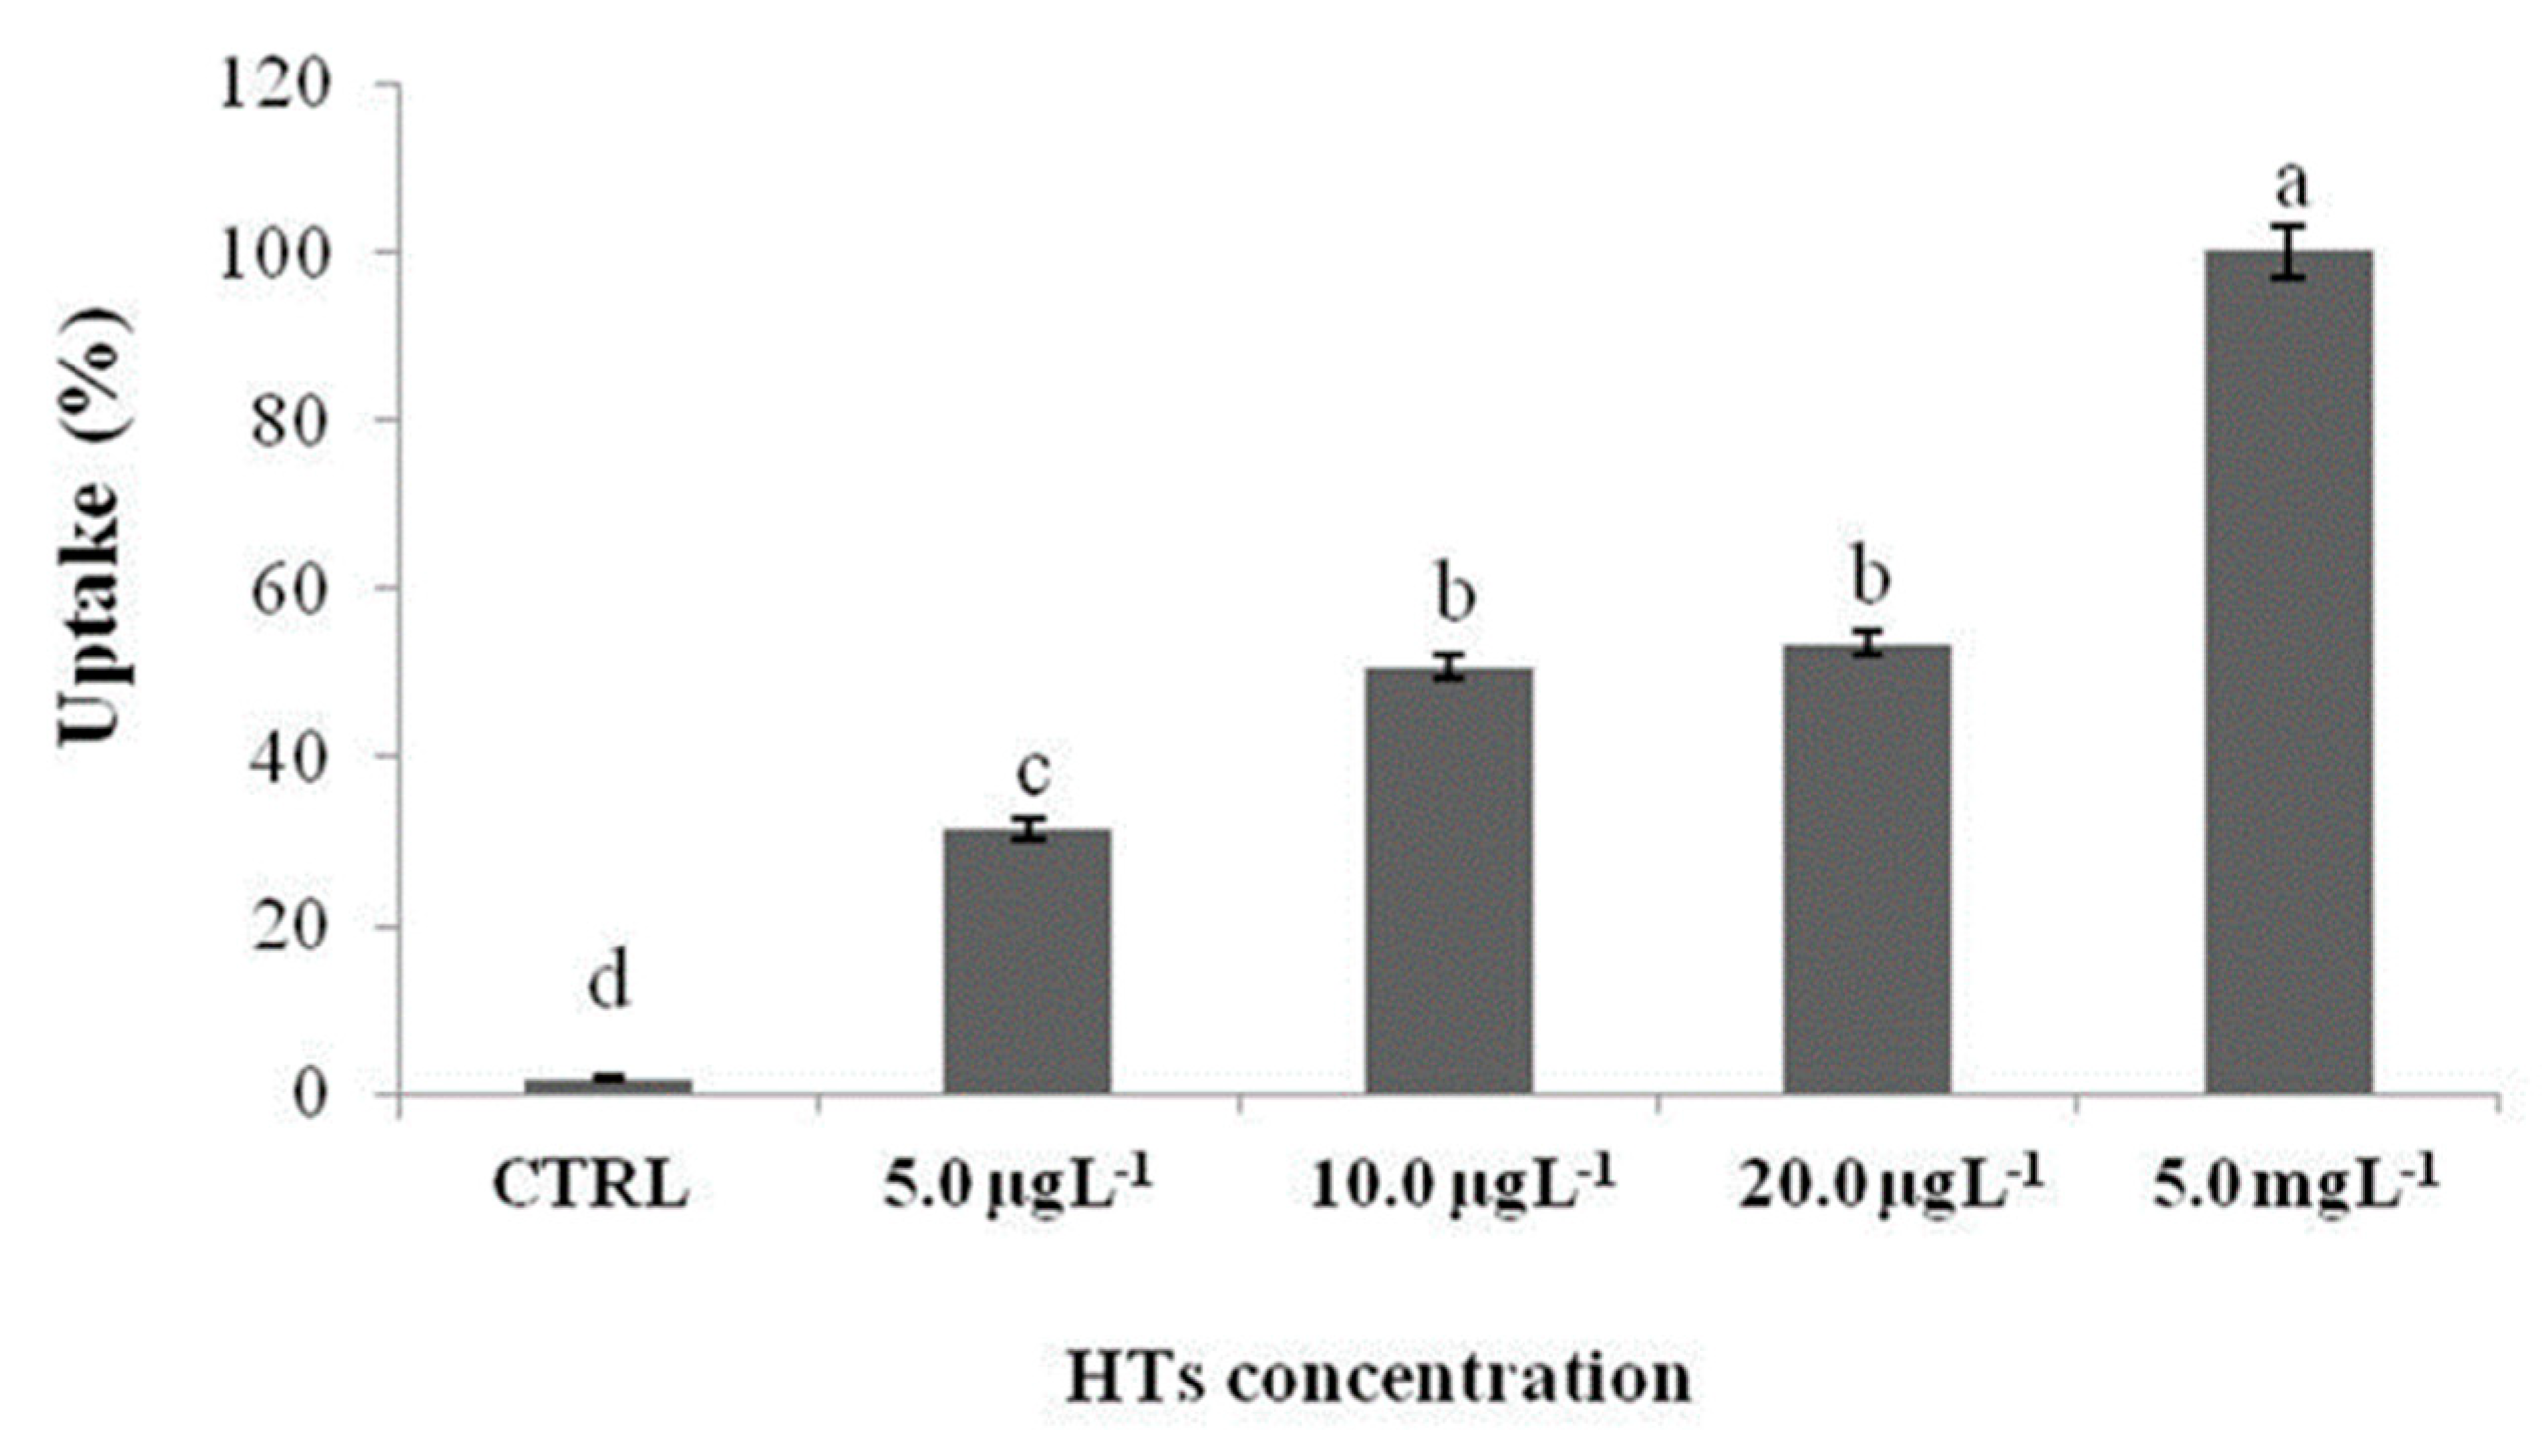
Figure 5.
Representative HPLC profiles of (a) CT standards, extracts of zebrafish larvae at 72 h of exposure with CTs at (b) 0.0, (b) 5.0, (c) 10.0 and (d) 20.0 µgL-1 and (e) 5.0 mgL-1. (PF, profisetinidin).
Figure 5.
Representative HPLC profiles of (a) CT standards, extracts of zebrafish larvae at 72 h of exposure with CTs at (b) 0.0, (b) 5.0, (c) 10.0 and (d) 20.0 µgL-1 and (e) 5.0 mgL-1. (PF, profisetinidin).
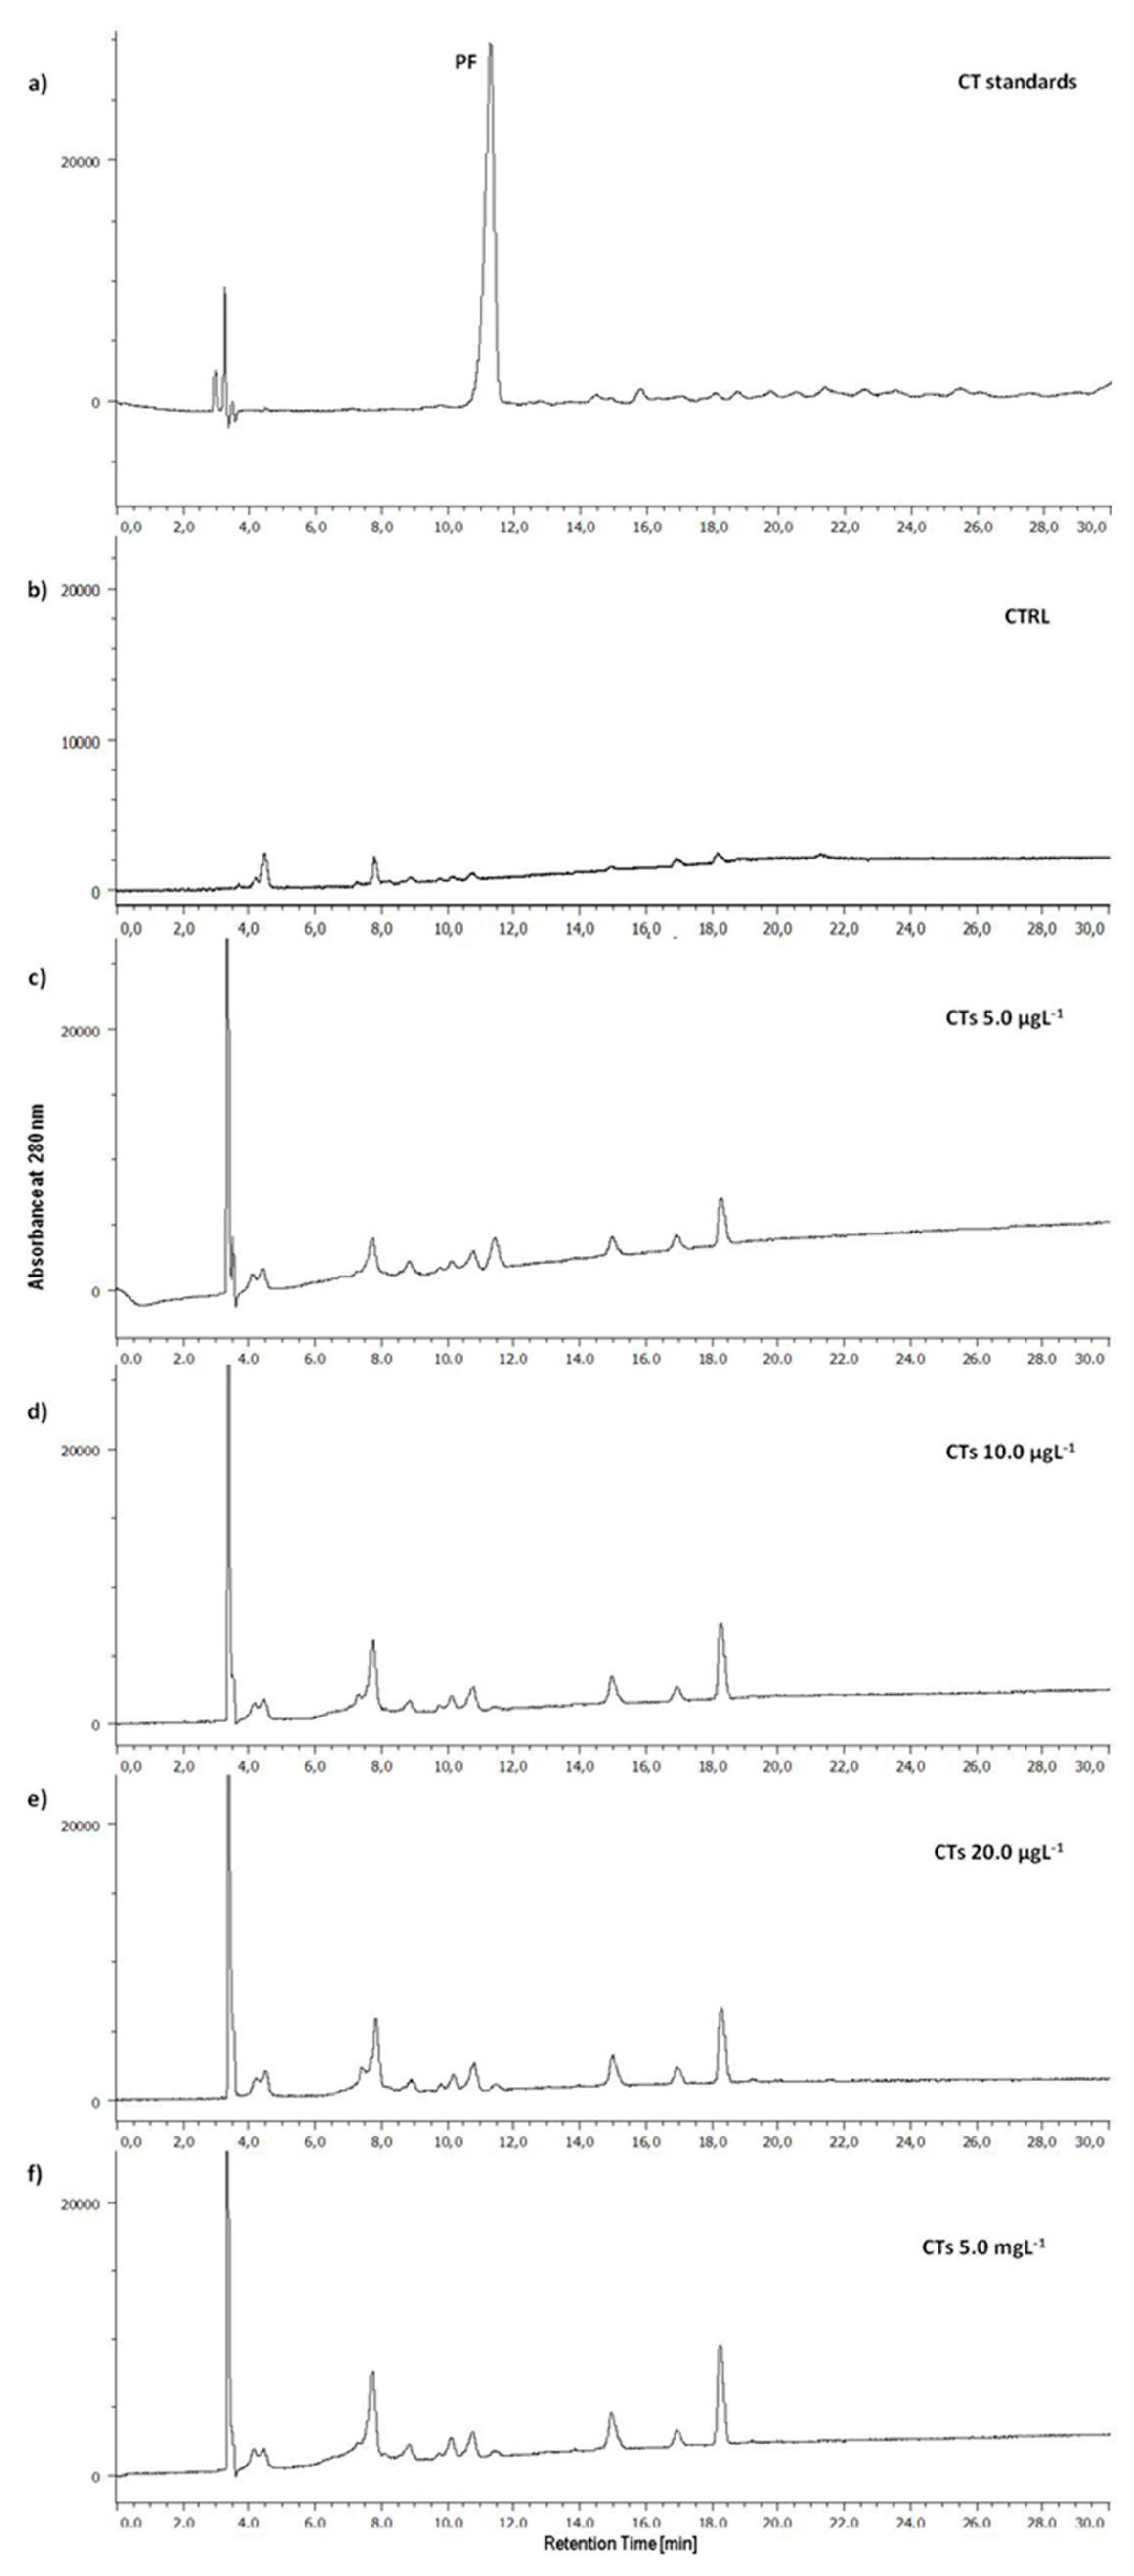
Figure 6.
Zebrafish larvae uptake after 72 h of exposure with CTs at 5.0, 10.0, and 20.0 µgL-1 and 5.0 mgL-1. Uptake is calculated as the percentage sum of the areas of all peaks present in the chromatogram. Data represent means ± standard deviation (SD) of three independent experiments. Different letters indicate statistically significant differences (P < 0.05).
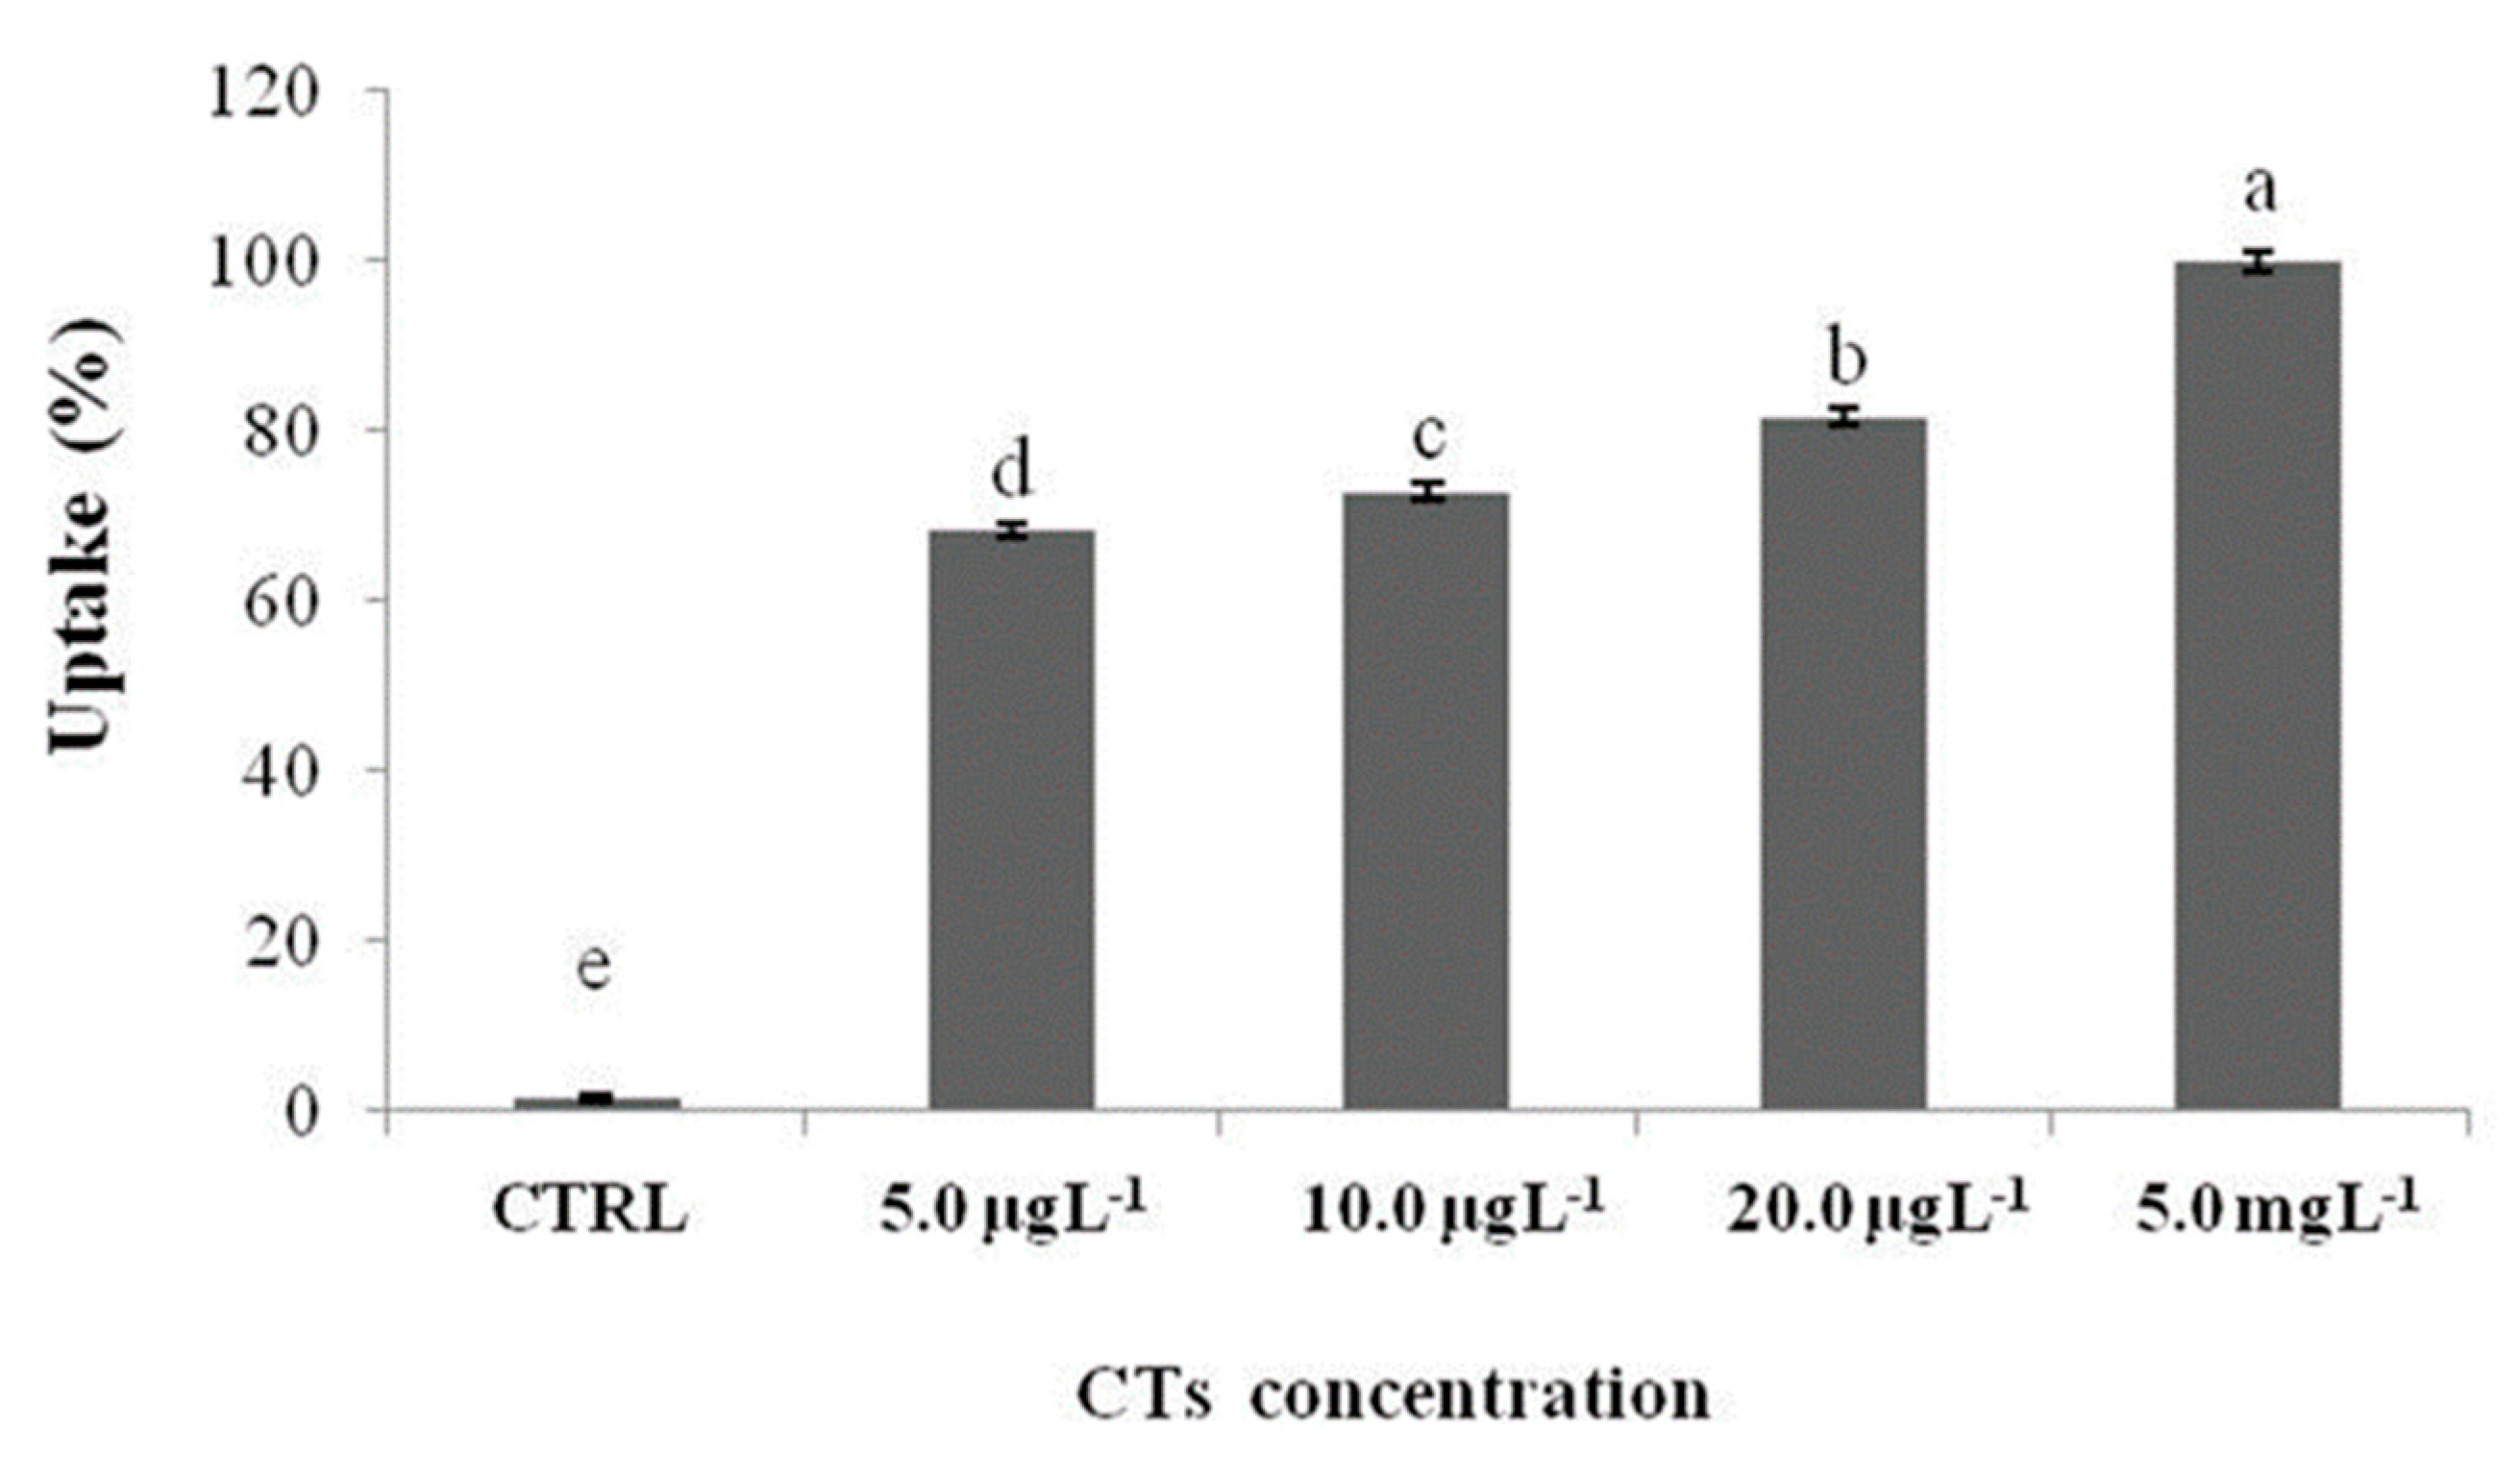
Figure 7.
Cd63, zhe1 and klf4 gene expression analysis. Fold changes are calculated using the formula: fold change = 2-ΔΔCt. Blue lines indicate fold change thresholds of 2 and 0.5 respectively. Values greater than 2 and lesser than 0.5 were considered significant compared to control. CTs vs HTs for each gene by t-test (* P < 0.05; ** P < 0.01; *** P < 0.001).
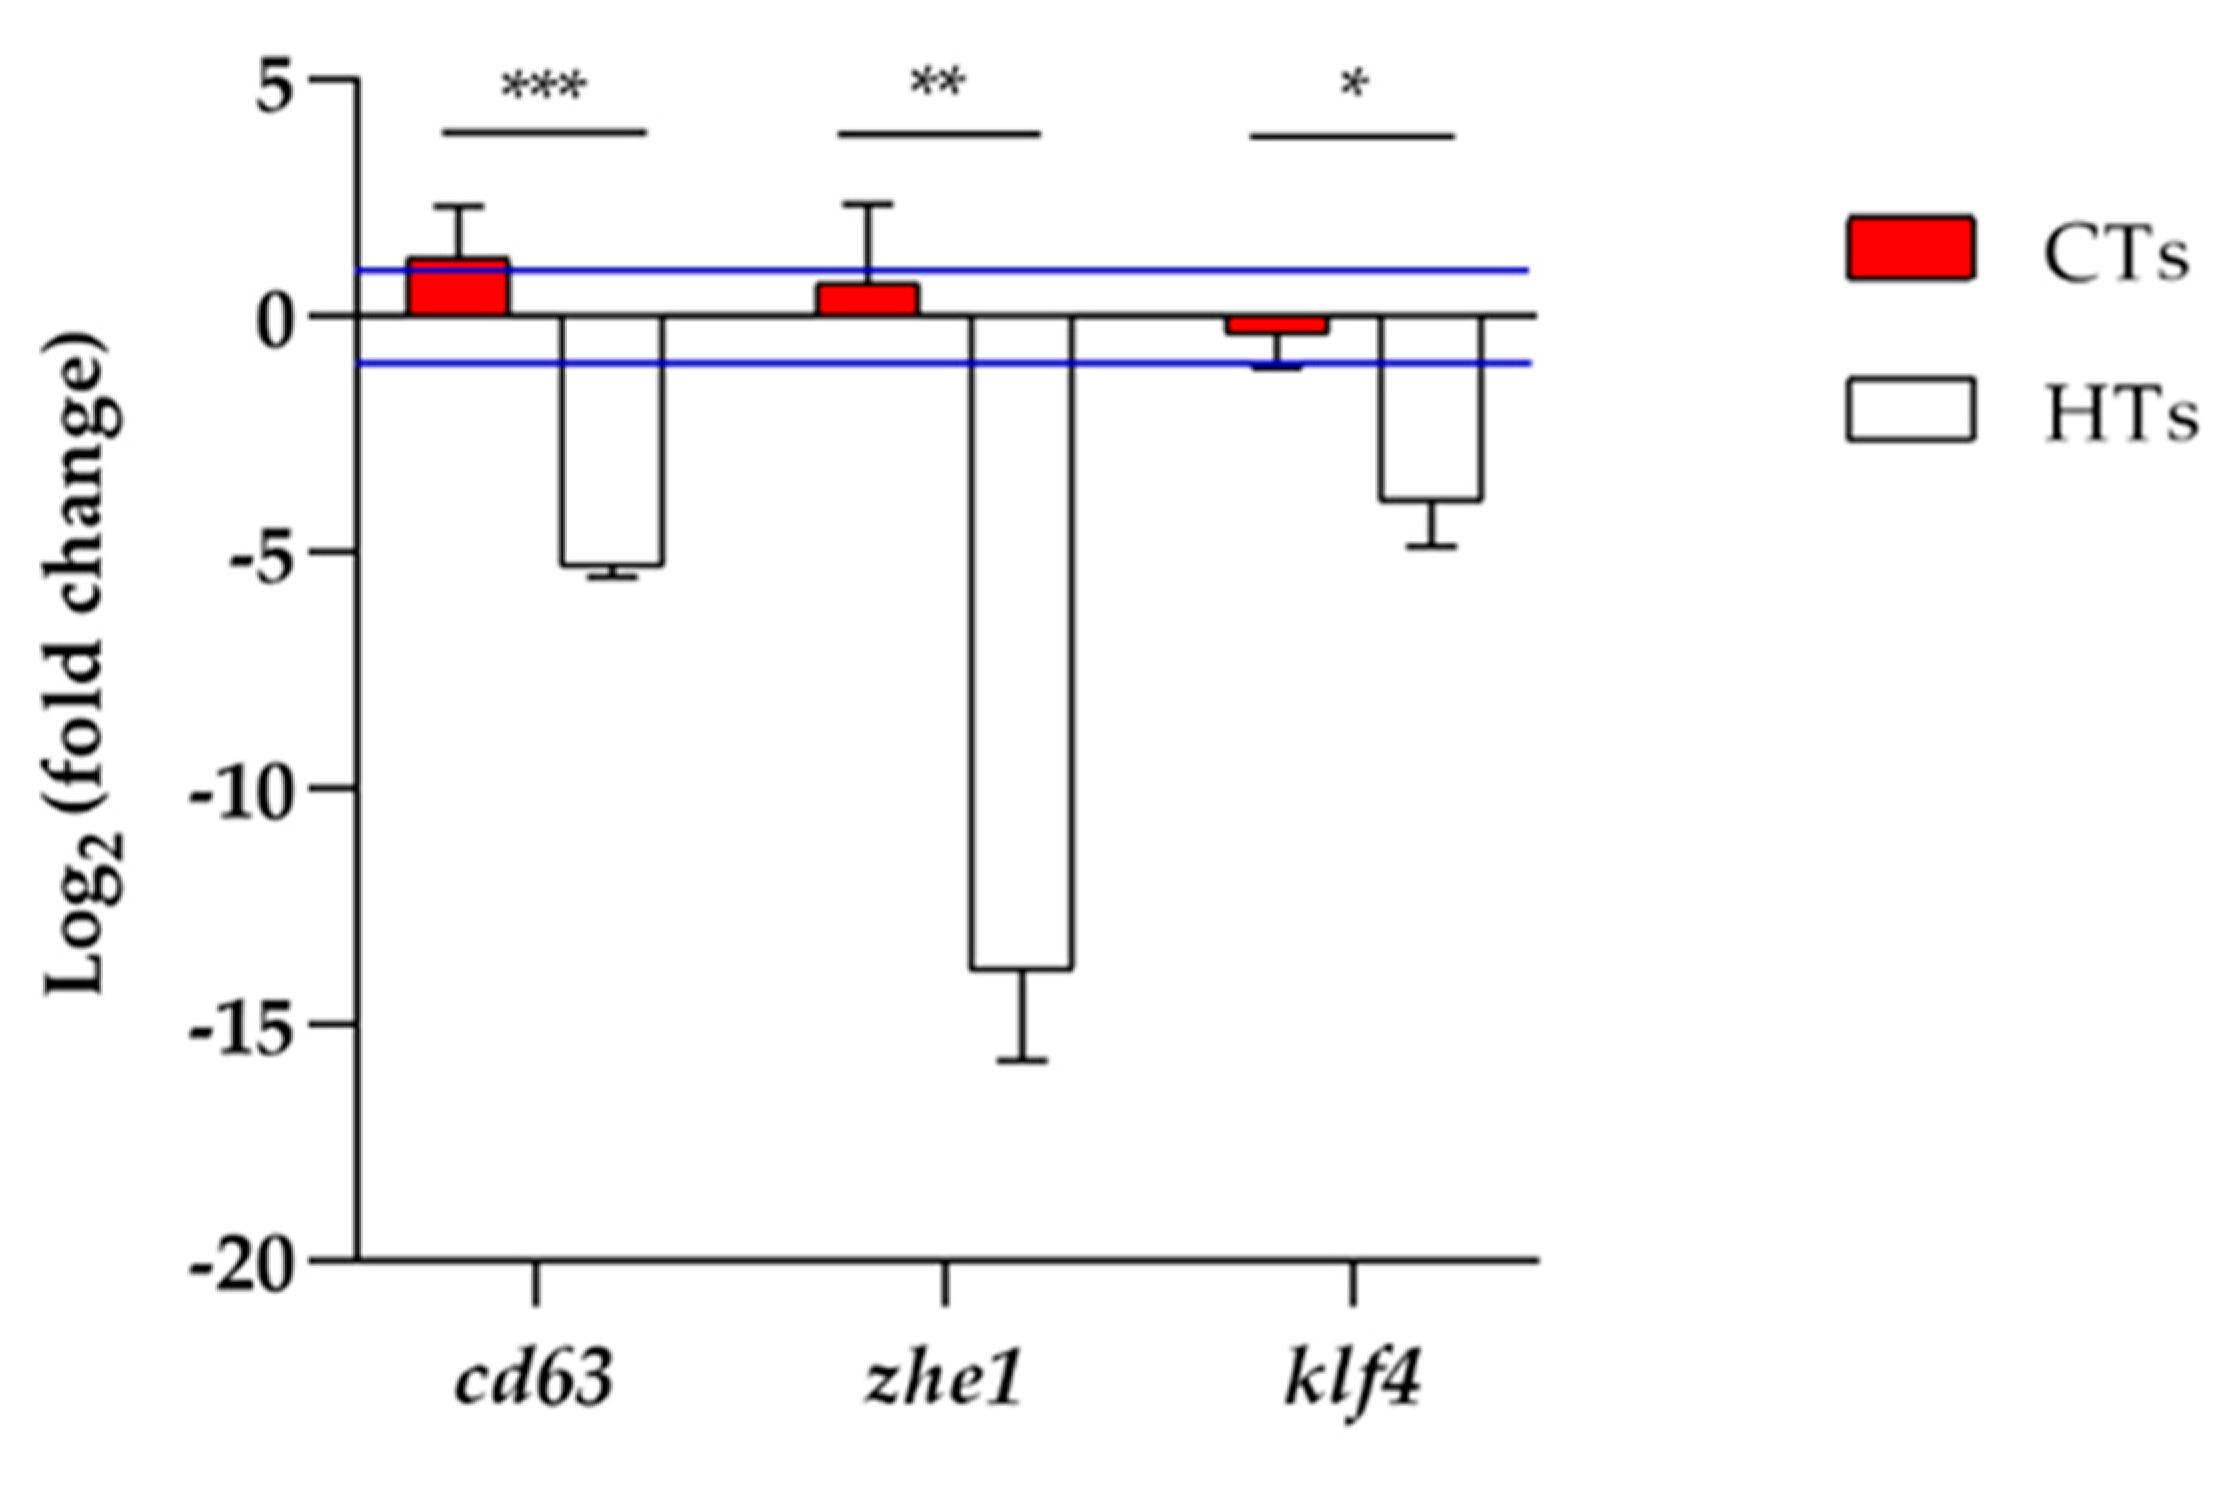

Table 1.
Concentration of PY and GA detected in the chromatographic profiles of the extracts of larvae exposed to different concentrations of HTs for 72 h. PY and GA concentrations are expressed as ng/larva. The concentrations of PY and GA were determined by calculating the area of their peaks in the HPLC profile and referring to standard curves. Data represent means ± standard deviation (SD) of three independent experiments. Values with different letters are significantly different (P < 0.05).
| HTs | PY concentration (ng/larva) | GA concentration (ng/larva) |
|---|---|---|
| CTRL | - | - |
| 5.0 μgL-1 | 40.7 ± 3.1 b | 11.7 ± 1.3 b |
| 10.0 μgL-1 | 38.5 ± 2.9 b | 2.8 ± 0.7 c |
| 20.0 μgL-1 | 43.9 ± 2.3 b | 4.7 ± 0.8 c |
| 5.0 mgL-1 | 594.6 ± 7.3 a | 45.9 ± 1.2 a |
Table 2.
Concentration of GA and its metabolite PY detected in the chromatographic profiles of the extracts of larvae exposed to different concentrations of CTs for 72 h. CT concentrations are expressed as ng/larva. The concentrations of PY and GA were determined by calculating the area of their peaks in the HPLC profile and referring to standard curves. Data represent means ± standard deviation (SD) of three independent experiments. Values with different letters are significantly different (P < 0.05).
| CTs | PY concentration (ng/larva) | GA concentration (ng/larva) |
|---|---|---|
| CTRL | - | - |
| 5.0 μgL-1 | 386.2 ± 5.2 a | 16.9 ± 0.9 a |
| 10.0μgL-1 | 382.7 ± 4.9 a | 4.3 ± 1.5 b |
| 20.0μgL-1 | 383.3 ± 5.1 a | 7.8 ± 1.8 b |
| 5.0 mgL-1 | 380.3 ± 6.2 a | 8.3 ± 1.6 b |
Table 3.
Primer sequences of β-actin, cd63, zhe1 and klf4: F (forward); R (reverse).
| Gene | Primers | Reference | |
|---|---|---|---|
| β-actin | F | CGAGCAGGAGATGGGAACC | [75] |
| R | CAACGGAAACGCTCATTGC | ||
| cd63 | F | GGAAACTCCTCTAGTGATTGGGTG | [76] |
| R | CGGTGGGTTTCGTCATAGCTC | ||
| zhe1 | F | GCCCGGTCTGGAAACCA | [77] |
| R | GTCCGATCTGCACGTTTTCA | ||
| klf4 | F | TTAAGCCCAGAAGACAGCAAG | [78] |
| R | GCATGTGCGCTTTCAAAT | ||
Disclaimer/Publisher’s Note: The statements, opinions and data contained in all publications are solely those of the individual author(s) and contributor(s) and not of MDPI and/or the editor(s). MDPI and/or the editor(s) disclaim responsibility for any injury to people or property resulting from any ideas, methods, instructions or products referred to in the content. |
© 2024 by the authors. Licensee MDPI, Basel, Switzerland. This article is an open access article distributed under the terms and conditions of the Creative Commons Attribution (CC BY) license (http://creativecommons.org/licenses/by/4.0/).
Copyright: This open access article is published under a Creative Commons CC BY 4.0 license, which permit the free download, distribution, and reuse, provided that the author and preprint are cited in any reuse.


