
Submitted:
20 August 2025
Posted:
21 August 2025
You are already at the latest version
Abstract
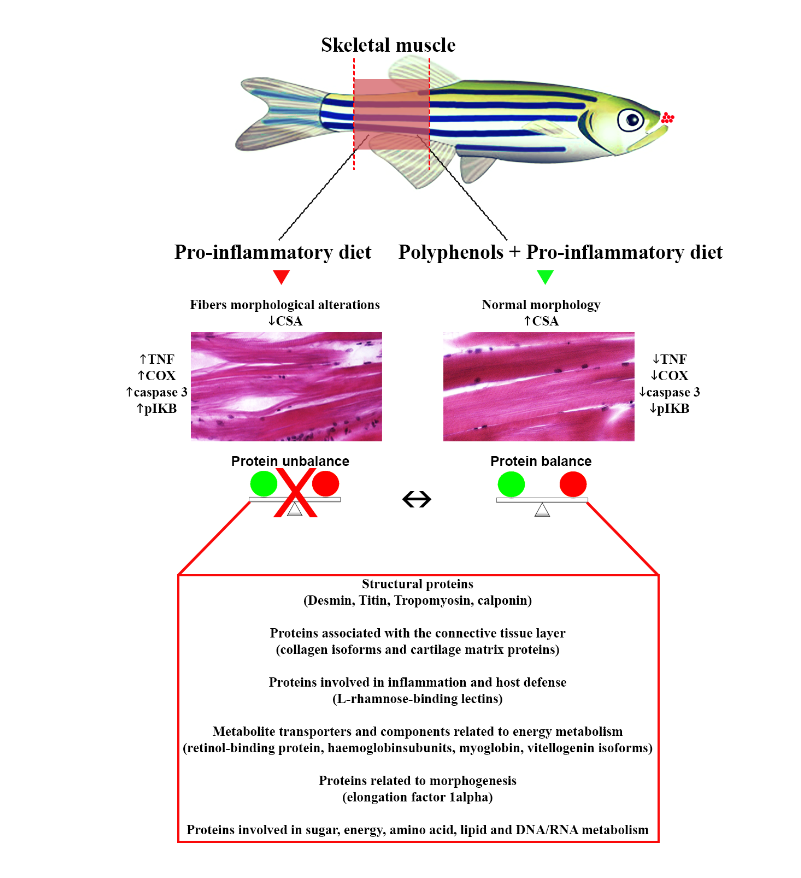
Diet-induced inflammation is one main factor contributing to muscle degeneration in fish. Due to their anti-inflammatory and antioxidant properties, polyphenols have recently received great attention as feed additives in aquaculture. We used a combined immunohistochemical, western blotting (WB) and proteomic approach to evaluate the hypothesis that a pro-inflammatory diet in zebrafish (Danio rerio) results in skeletal muscle inflammation and morphological degeneration, and that dietary polyphenols may prevent and/or revert such conditions. Experimental groups were fed with a supplement mixture of polyphenols (tannins from chestnut shell of Castanea sativa and apigenin from Verbascum macrurum) before (PVpreI), during (PVwithI) and after (PVpostI) the pro-inflammatory diet. Diet-induced inflammation was characterized by muscle fibers morphological degeneration, ample intercellular space, and increased immunoexpression of TNF-α, cyclooxygenase 2 (COX2), and caspase 3. Polyphenols supplementation prevented and/or partially counteracted muscle morphological alterations and decreased TNF-α, COX2, and caspase 3 immunoexpression. WB analysis showed changes of IκBα phosphorylation, desmin and titin in inflamed muscle, which were fully/partially reverted in PVpreI and PVwithI groups. Proteomic analysis showed quantitative variations in structural and tissue regeneration proteins and their regulators, components of the connective tissue layer, molecules involved in inflammation and defense, and metabolite transporters, aligning with the observed morphological and molecular changes and their recovery depending on polyphenols treatments. In conclusion, polyphenol pre-treatment appeared effective in counteracting skeletal muscle inflammation, followed for efficacy by co-treatment and post-treatment, which only partially reverted diet-induced inflammation effects. These results strongly support the use of dietary polyphenols supplementation to prevent and/or counteract diet-induced muscle inflammation preserving muscle integrity and fish health.
Keywords:
skeletal muscle
; zebrafish
; polyphenols
; inflammation
; proteomics
1. Introduction
Inflammation is key to skeletal muscle loss or atrophy [1]. Some of the cellular processes that contribute to this are: i) release of pro-inflammatory cytokines like interleukin-1β (IL-1β), IL-6, and tumor necrosis factor-α (TNF-α), which inhibit synthesis and accelerate degradation of proteins by modulating signaling pathways such as JAK/STAT3, ERK, and PI3K/Akt; ii) activation of protein breakdown via calpains, ubiquitin-proteasome system, and caspase 3; iii) enhanced lysosomal autophagy through p38/MAPK pathway activation; iv) increased TGF-β activity; v) mTOR pathway downregulation [2,3]. In skeletal muscle, inflammation triggers ROS production, apoptosis, mitochondrial dysfunction, and reduced antioxidant defenses [4,5,6]. These mechanisms disrupt the balance between protein synthesis and degradation, leading to atrophy [7]. Inflamed muscle in mice shows up-regulation of embryonic myosin forms, altered actin-myosin interactions, and reduced contractility [8,9]. Desmin, another muscle-related protein, is upregulated during atrophy [9].
Although studies in fish are limited, similar mechanisms to those in mammals are observed. In vitro IL-1β stimulation of Atlantic salmon (Salmo salar) myocytes led to overexpression of immune and catabolic genes, lipid mobilization, and reduced proliferation [10]. In rainbow trout (Oncorhynchus mykiss), proteomic analysis of atrophic muscle revealed decreased levels of enzymes involved in anaerobic respiration and protein biosynthesis, and activation of MAPK/ERK and NF-κB pathways [11].
Aquaculture provides large quantities of high-quality protein with low environmental impact [12]. However, intensive practices expose fish to a vast array of stressors like infections, inflammation, and oxidative stress. Moreover, artificial diet can be proinflammatory and linked to impaired muscle development, oxidative stress, and immune dysfunctions [13,14,15]. Feeding juvenile grass carp (Ctenopharyngodon idella) various grasses improved muscle growth, collagen production, reduced fat, and better flesh quality than conventional feeds [13]. Chlorella vulgaris improved muscle in crucian carp (Carassius auratus) [14], and reduced inflammation and apoptosis in largemouth bass (Micropterus salmoides) [15]. However, many carnivorous species react negatively to plant-based ingredients, suffering oxidative stress and intestinal inflammation, jeopardizing health, growth, and product quality [16].
Due to the critical link between diet, inflammation, and muscle health, research focuses on optimizing fish nutrition [17]. A promising approach is using natural compounds that regulate the balance of pro-/anti-inflammatory factors and muscle protein turnover [17]. Polyphenols are especially relevant for their anti-inflammatory and antioxidant properties [18]. Lipophilic curcumin, for example, counteracted muscle atrophy in an LPS-induced mouse model by inhibiting p38/MAPK, reducing inflammation and oxidative stress [19]. Resveratrol alleviated muscle atrophy in mouse models of diabetes, cancer, and denervation by inhibiting NF-κB [20,21]. Quercetin supplementation prevented inflammation and atrophy caused by high-fat diets in mice by downregulating TNF-α [22]. Although polyphenols have positively affected oxidative status and growth in various fish species [23,24,25], their impact on fish muscle health remains underexplored.
Zebrafish (Danio rerio) have become a valuable model for studying inflammation in vertebrates, including applications in aquaculture, aligning with EU "Three Rs" guidelines: replacement, reduction, and refinement [26]. Given the limited knowledge about polyphenols' role in diet-induced muscle atrophy, we used immunohistochemistry (IHC), western blotting (WB), and proteomics to test whether a pro-inflammatory diet induces muscle atrophy and if a polyphenol-enriched diet can reverse it. This approach has successfully identified physiologically relevant molecules and biomarkers in zebrafish [27].
2. Materials and Methods
2.1. Zebrafish Rearing and Experimental Diets
The zebrafish muscle samples analyzed in this work were part of a trial already reported [28]; thus, the experimental conditions will be only briefly reported here. Male adult zebrafish (Danio rerio), about 400 ± 100 mg (mean ± SD), were bred at the Vakili Ornamental fish production complex, with the permission of the Department of Fisheries, Gorgan University of Agricultural Sciences and Natural Resources (GUASNR), Gorgan, Iran. The GUASNR guidelines for animal husbandry were followed during the animal experiments. Measurements were taken to reduce fish suffering. Before or during the experimentation, no medical treatment was provided. No deaths occurred.
Animals were fed once daily at 2 % of the body weight. The zebrafish were divided into six dietary groups (n = 18 fish per group): i) animals fed once a day with peeled Artemia salina cysts (22 % fat, 44 % proteins, 16 % carbohydrates; Aqua Schwarz); control group (CT); ii) animals fed once a day for 10 days with A. salina added with 0.1 % w/w k-carrageenan, inflamed group (I); iii) animals fed once a day for 10 days with A. salina added with polyphenols extracts followed by 10 days of inflammatory diet, polyphenols pre-treated inflamed group (PVpreI); iv) animals fed once a day for 10 days with inflammatory diet and polyphenols extracts, polyphenols co-treated inflamed group (PVwithI); v) animals fed once a day for 10 days with inflammatory diet followed by A. salina added with polyphenols extracts for 10 days, polyphenols post-treated inflamed group (PVpostI); vi) animals fed once a day for 10 days with A. salina added with polyphenols extracts, poliphenols treated control group (PV) [28]. The polyphenols were extracted from chestnut (Castanea sativa) shell coming from Montella (a geographical area in the Province of Avellino, Italy) and Verbascum macrurum harvested in Pietraroia (an area in the Province of Benevento, Italy) (3 µg total polyphenols/day/zebrafish). Total phenolic content and HPLC profile of the chestnut shell and Verbascum macrurum extract were determined in previous work [28,29]. After the feeding trial, zebrafish were fasted overnight and sacrificed. The skeletal muscle tissue for western blot and proteomics analysis was rapidly dissected on ice, frozen in nitrogen liquid and stored at - 80 °C until use.
2.2. Histological and Immunohistochemical Analysis
Histological and Immunohistochemical analysis were performed using the method reported in previous work [28]. Six adult zebrafish samples were collected for histological analysis from each group, fixed in 4% formalin, dehydrated in alcohol, clarified in xylene, embedded in paraffin, sliced into 5 µm sections, and stained with Hematoxylin-Eosin (H&E) or with primary antibodies anti-TNF-α (1:200; #NBP1-19532, Novus Biologicals, USA), COX2 (1:200; #160126, Cayman), and caspase 3(1:200; code ab13847, Abcam, Cambridge, UK), respectively. A light microscope Leica DMI6000 equipped with digital CCD camera Leica DFC340 (Leica Microsystems) was used to capture microscopic images (20X and 40X magnification) and analyze morphological and immunohistological changes in skeletal muscle tissues. Micrographs were adjusted for light and contrast using Adobe Photoshop 6.01 (Adobe Systems, San Jose, CA) and then assembled on plates. The number of caspase 3-positive cells was defined following method previously reported [30]. To measure the average muscle fiber cross-sectional area (CSA), three randomly selected images per muscle from three representative fields of tissue for each animal per experimental condition (n = 6 animals per group) were analyzed using ImageJ software Version 1.52n, which was equipped with cross-sectional analyzer plugin. The CSA value was evaluated only for muscle fibers (120 in number) contained entirely within the image. A blind independent operator performed histological analyses. All the morphological observations were adapted to those reported in previous studies on other fish models [31,32].
2.3. Western Blotting
WB experiments were carried out on the skeletal muscle of each zebrafish group (n = 6 zebrafish per group) by following protocol used in previous work [28]. Total muscle proteins were extracted by using ice-cold RIPA lysis buffer enriched with protease and phosphatase inhibitors. Proteins were quantified by using the Bradford Protein Assay Kit (Thermo Scientific, USA), separated by SDS-PAGE (10 %) and membranes containing the electrotransferred proteins were immunoblotted with primary antibodies (Table S1). WB signals were quantified by using the Image Lab (Bio-Rad) software.
2.4. Proteomics
Skeletal muscle samples of zebrafish (n = 6 individuals per group) were sampled at the same location from two different fillets, pooled in equal amounts to obtain one replicate, and frozen in liquid N2. Frozen muscle samples (40 mg) were homogenized with a polytron in 0.25–1 mL of 8.3 M urea, 2 M thiourea, 2 % (w/v) CHAPS and 1 % (w/v) DTT, and resulting extracts were shaken for 30 min, at 4 ºC, and centrifuged at 10,000 x g for 30 min. Hundred μg of proteins for each zebrafish group were reduced, alkylated with iodoacetamide, precipitated and digested with trypsin as previously reported [33]. Peptides obtained from each protein sample were labelled with the TMT Label Reagent Set (Thermo-Fisher Scientific, USA) according to the matching CT-TMT6-126, I-TMT6-127, PV-TMT6-128, PVpreI-TMT6-129, PVwithI-TMT6-130, PVpostI-TMT6-131. Labeled peptide mixtures were prepared, pooled and fractionated as already described [33]. Eight fractions of TMT-labelled peptides were collected and analyzed with an UltiMate 3000 HPLC RSLC nano system (Dionex, USA) linked to a Q-ExactivePlus mass spectrometer, as previously reported [33]. Technical triplicates were analyzed for all samples.
All MS raw data files were merged in ProteomeDiscoverervs 2.4 software (Thermo Scientific) for identification and relative quantification of proteins, allowing database searching via Mascot algorithm v. 2.4.2 (Matrix Science, UK) of a UniProtKB protein database (Danio rerio, 96007 protein sequences, 12/2022) also including the most common protein contaminants. Additional database searching parameters were already reported [33]. Protein candidates assigned based on at least two sequenced peptides and an individual Mascot Score greater than or equal to 25 were considered confidently identified. To calculate fold changes between samples, ratios of TMT reporter ion intensities in the MS/MS spectra from raw datasets were used. The results were filtered to obtain a false positive rate of 1%.
2.5. Statistical Analysis
Statistical analysis for histology and immunohistochemistry was performed using a one-way analysis of variance (ANOVA) coupled with Bonferroni's post-hoc test to identify differences between groups. Non-normally distributed data, such as that obtained by WB, were evaluated by Kruskal–Wallis ANOVA non-parametric test followed by Dunn’s post-hoc test. GraphPad Prism 6 software v. 6.05 (GraphPad, Inc.) was used to perform statistical analyses; all the quantitative data were expressed as mean ± SD or mean ± SE. The significance level was set at p < 0.05.
3. Results
3.1. Polyphenol Effects on the White Muscle Tissue Morphology
Muscle from the CT group showed normal morphology, with peripheral oval nuclei and compact fibers displaying apparent striations (Figure 1A). Inflammation caused notable alterations, including wavy, degenerated fibers lacking striations, broken myofibrils, some circular nuclei, and enlarged interstitial areas with occasional infiltrated cells (Figure 1B). In the PVpreI group, most fibers appeared normal, though some degenerated ones without striations were seen (Figure 1C). PVwithI muscle showed wavy, degenerated fibers with missing striations, occasional circular nuclei, broken myofibrils, and rare interstitial enlargements with infiltrating cells (Figure 1D). PVpostI muscle displayed pronounced changes, including enlarged interstitial areas with cell infiltration, more connective tissue, wavy fibers—often without striations—and circular or central nuclei (Figure 1E). The PV group showed muscle morphology comparable to control (Figure 1F).
Analysis of transverse sections and CSA revealed enlarged inter-fiber spaces in the I group and a significant decrease in mean CSA compared to CT (Figure 1G; p < 0.0001). PVpreI showed minimal interstitial space, and a significant CSA increase versus the I group (p < 0.0001), similar to CT. PVwithI had occasional interstitial enlargements and a CSA value significantly above the I group (p < 0.0001), but below CT (p < 0.0001) (Figure 1G). PVpostI also showed enlarged interstitial spaces and a reduced CSA compared to CT (p < 0.0001), although still higher than the I group (p < 0.0001). The PV group showed a slight but significant CSA increase versus CT (p < 0.05).
3.2. Polyphenol Effects on TNF-α, COX2 and Caspase 3 Immunoexpression in the White Muscle Tissue
TNF-α immunohistochemical staining of longitudinal skeletal muscle sections in the CT group showed absent or sporadic expression (Figure 2A). In contrast, the I group displayed strong TNF-α positivity in muscle fiber nuclei and infiltrated cells (Figure 2B). In the PVpreI group, weak TNF-α immunosignal appeared in a few muscle fiber nuclei (Figure 2C), while the signal was more pronounced in PVpostI and PVwithI groups (Figure 2D, E). The PV group showed nearly absent TNF-α expression, similar to CT (Figure 2F).
COX2 staining revealed a weak nuclear immunosignal in CT muscle fibers (Figure 3A), while the I group showed strong COX2 positivity in both fibers and nuclei (Figure 3B). No COX2 signal was detected in PVpreI fibers (Figure 3C), whereas some nuclear signals were observed in PVpostI (Figure 3D) and muscle fibers of PVwithI (Figure 3E). The PV group showed nearly absent COX2 expression (Figure 3F).
Caspase 3 immunostaining showed weak signal in CT muscle (Figure 4A), but strong nuclear expression in I group fibers (Figure 4B). PVpreI had limited nuclear positivity (Figure 4C), while PVpostI and PVwithI showed increased nuclear caspase 3 signal (Figure 4D, E). The PV group had nearly no caspase 3 expression. Notably, the number of caspase 3-positive nuclei was significantly higher in I (p < 0.05) and PVwithI (p < 0.0001) groups than in CT. PVpreI and PVpostI had significantly fewer positive nuclei than I group (p < 0.05), and levels comparable to CT.
3.3. Polyphenol Effects on NF-κB and p38 MAPK, ERK 1/2 Signaling Pathway in the White Muscle Tissue
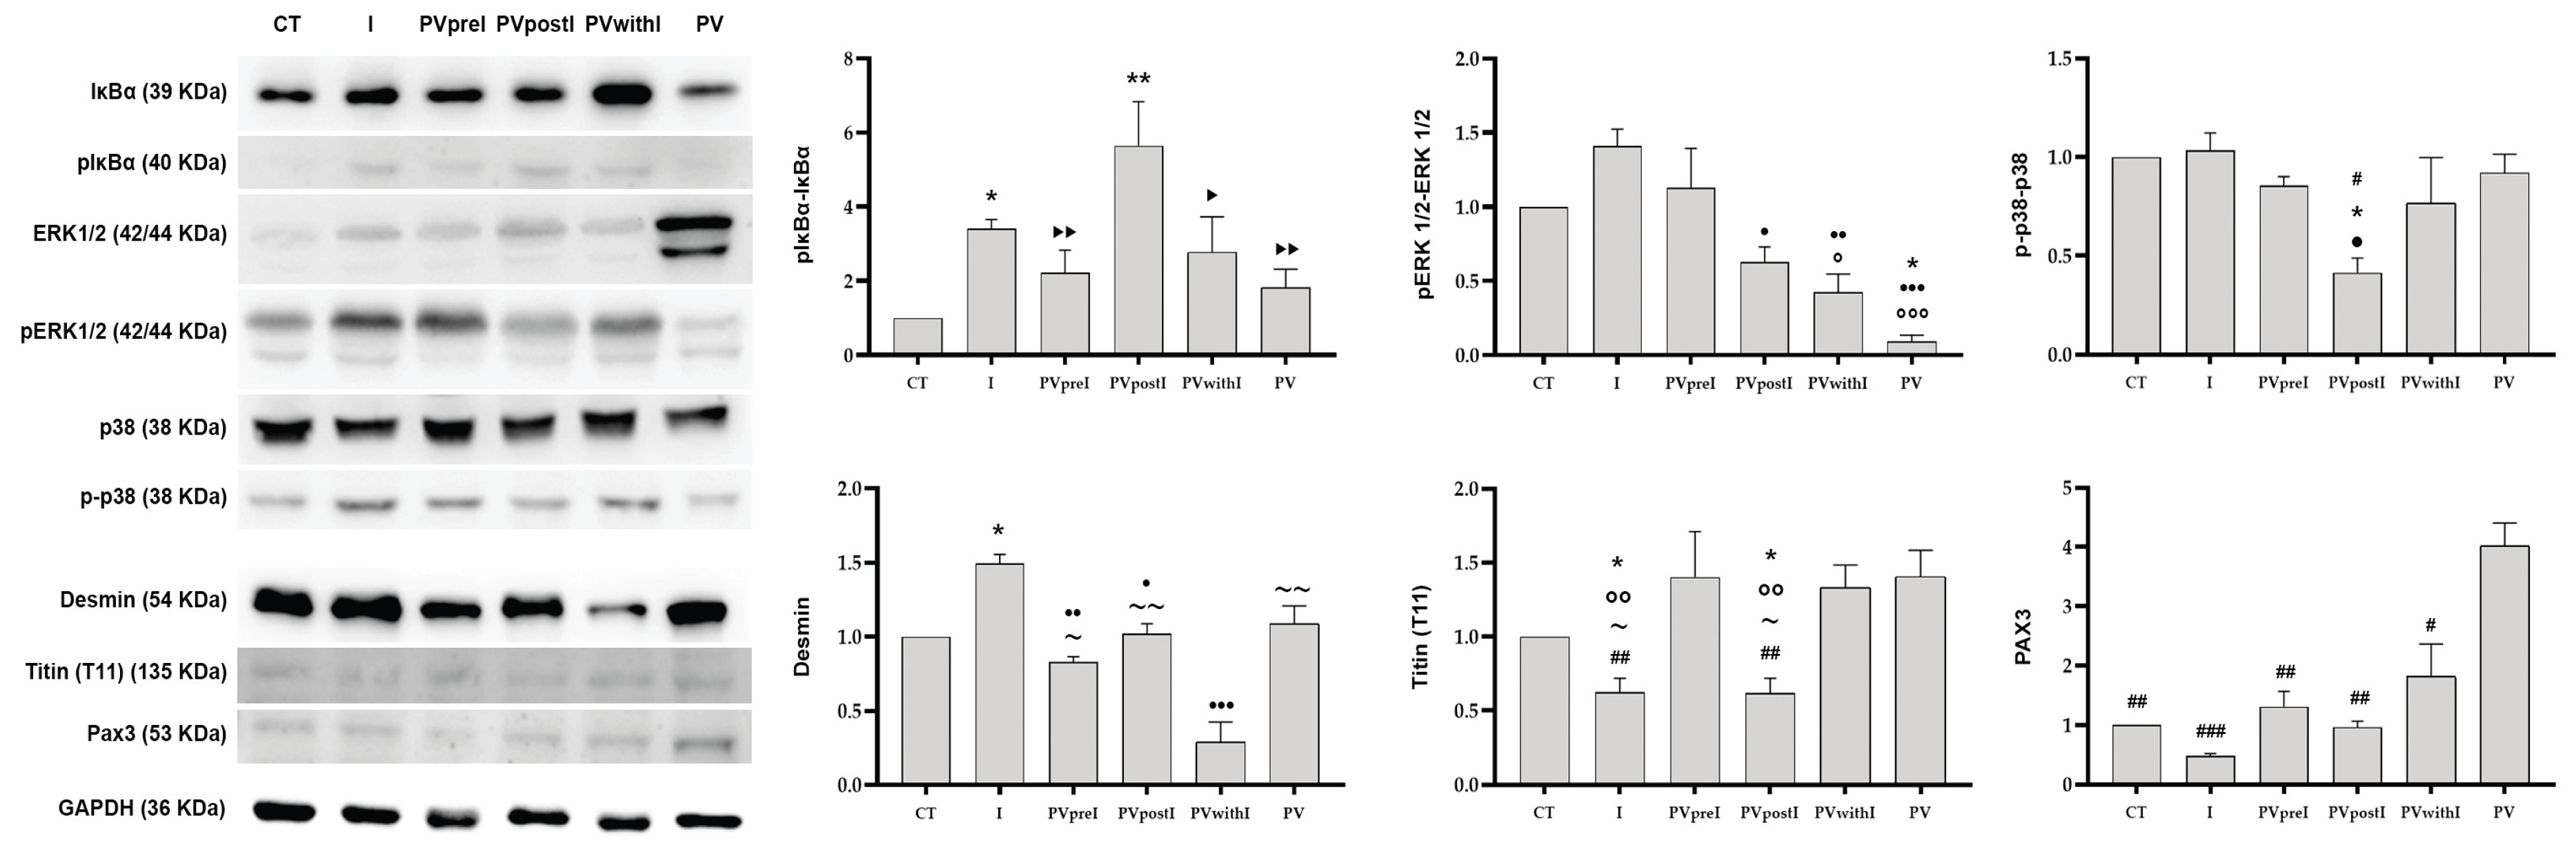
IκBα phosphorylation was assessed in skeletal muscle extracts from all experimental groups (Figure 5). Inflammation (p < 0.05) and the PVpostI condition (p < 0.001) significantly increased the pIκBα/IκBα ratio compared to CT. In contrast, PVpreI (p < 0.001) and PVwithI (p < 0.05) significantly reduced pIκBα levels versus PVpostI, with no differences from CT.
For MAPK signaling, PVwithI (p < 0.001) and PVpostI (p < 0.05) showed significantly reduced ERK 1/2 phosphorylation compared to the I group. The PV group exhibited the lowest ERK 1/2 phosphorylation. No increase in p38/MAPK phosphorylation was observed in I vs. CT (Figure 5), and only PVpostI showed significantly lower p38/MAPK levels compared to I (p < 0.05).
3.4. Polyphenol Effects on Desmin, Titin and PAX3 in the White Muscle Tissue
As shown in Figure 5, desmin levels were significantly higher in the I group compared to CT (p < 0.05). In PVpreI, PVpostI, and PVwithI groups, desmin levels were similar to CT, except for PVwithI, which showed the lowest amount. Titin (segment T11) levels were significantly reduced in I and PVpostI compared to CT (p < 0.05), while PVpreI, PVwithI, and PV showed levels comparable to CT (Figure 5). PAX3 expression remained unchanged in I and all polyphenol-treated groups (PVpreI, PVpostI, PVwithI) but significantly increased in the PV group (Figure 5).
3.5. Polyphenol Effects on the White Muscle Proteomic Repertoire
Tissue protein extracts from CT, I, PVpreI, PVpostI, PVwithI, and PV groups were independently pooled and analyzed via TMT-label quantitative proteomics combined with nLC-ESI-Q-Orbitrap-MS/MS, defining the proteomic signature of each diet (Figure S1). This high-resolution approach identified and quantified 2477 unique proteins in zebrafish white muscle. Proteomic data were filtered for a fold change of 0.66–1.5 and p-value < 0.05 in pairwise comparisons, identifying differentially represented proteins (DRPs). A total of 251 DRPs were found in the following comparisons: i) I vs. CT (39 over- and 15 down-represented; Figure S2A); ii) PV vs. CT (33 over-, 47 down-represented; Figure S2B); iii) PVpostI vs. I (40 over-, 72 down-represented; Figure S2C); iv) PVpreI vs. I (30 over-, 84 down-represented; Figure S2D); v) PVwithI vs. I (24 over-, 127 down-represented; Figure S2E). Table S2 lists all DRPs with related annotations, peptides, post-translational modifications, and quantitation data.
To explore DRP relationships, a protein-protein interaction analysis via STRING [34] revealed an extensive interconnected network of 208 DRPs, alongside smaller subnetworks of 2–5 proteins (Figure S3), suggesting strong functional links. Gene Ontology enrichment analysis (Figures S4 and S5) using Metascape and EnrichR indicated DRP involvement in muscle functions (e.g., structure development), inflammation, immune response, oxygen/metabolite transport, and metabolic processes.
Further filtering excluded DRPs unique to single comparisons, resulting in 127 proteins showing changes across multiple comparisons: 41 in two, 48 in three, 27 in four, and 11 in all five (Figures S6 and S7). These included structural proteins and regulators (20%), inflammation and host defense proteins (19%), metabolite transporters (13%), connective tissue components (9%), morphogenesis/development-related proteins (6%), proteases and inhibitors (5%), energy metabolism components (5%), glycolytic enzymes (3%), signaling proteins (3%), DNA/RNA processing proteins (3%), and those involved in amino acid (3%) or lipid metabolism (2%), chaperones (2%), unknown function (5%), and others (2%). Many proteins showed consistent changes in PVpreI, PVwithI, and PVpostI vs. I, with opposite trends in I vs. CT (Figures S6 and S7).
4. Discussion
This study reports the reversing effects of polyphenols administered before, during, and after a pro-inflammatory diet on zebrafish skeletal muscle morphology and protein expression. The polyphenol mix used included condensed tannins (epigallocatechin and catechin/epicatechin) from chestnut shell [29,35], and flavonoids (mainly apigenin) from V. macrurum [28].
In inflamed zebrafish, muscle morphology was notably altered. Fibers appeared disassembled or broken, with absent striations and enlarged interstitial areas with cell infiltration, hallmarks of atrophic muscle [36]. These changes were linked to alterations in structural muscle proteins. Proteomic data revealed reduced levels of calponin, connectin b, EF-hand Ca²⁺-binding protein 6, PDZ and LIM domain 3b, and specific tropomyosin isoforms, while microfibril-associated glycoprotein 4-like isoforms and histidine phosphatase were increased (I vs. CT). Polyphenol pre-treatment prevented most morphological and proteomic changes, while co- and post-treatments were partially effective.
Focusing on titin, a key contractile protein spanning the sarcomere, WB analysis showed reduced titin segment T11 in inflamed muscle, indicating partial degradation. Pre- and co-treatments mitigated this reduction, unlike post-treatment. Proteomic data also showed that connectin b, a titin a-derived fragment involved in elasticity [37,38,39], decreased in the I group and increased following all polyphenol treatments. These findings suggest that polyphenols influence titin turnover, although more research is needed to clarify their exact role.
Tropomyosin isoforms decreased in the I group and were restored mainly by pre-treatment. Tropomyosin stabilizes actin filaments and regulates their dynamics [40]. Interestingly, green tea polyphenols have been shown to modify tropomyosin conformation in shrimp [41], but such a possibility remains unexplored in vertebrates.
Though not differing between I and CT groups, polyphenol treatments affected the abundance of other muscle proteins: actinin 2, Ca²⁺-transporting ATPase, dynein light chain, formimidoyltransferase-cyclodeaminase, tubulin, triadin, parvalbumin isoforms, myozenin 2, vimentin-like protein, troponins, and various myosin isoforms. These proteins regulate actomyosin function, contraction, and cytoskeletal integrity [42] and have been shown to respond to flavonoids such as apigenin, epigallocatechin, and quercetin [43].
WB analysis also revealed desmin overexpression in inflamed muscle, which was reversed by all polyphenol treatments. Desmin connects myofibrils and anchors them to membranes and organelles [44]. Its overexpression is linked to ageing and inflammation, resulting in pathological protein aggregates [44,45].
The reduction in CSA and appearance of large inter-fiber spaces in inflamed muscle reflected muscle atrophy [46]. In zebrafish and other animals, these spaces are typically filled by collagen-rich extracellular matrix [46]. Polyphenol treatments prevented and partially reversed CSA reduction. Consistently, flavonoid-rich soy improved muscle CSA in obese rats [47].
The muscle is covered by layers of connective tissue called epimysium, perimysium, and endomysium [48]. Inflammation affects collagen expression variably across models [49,50]. Proteomics showed that polyphenol treatments led to over-representation of multiple collagen isoforms, aligning with green tea polyphenols enhancing collagen synthesis in murine cardiac tissue [51]. Cartilage oligomeric matrix protein and cartilage matrix protein isoform X1 were increased in polyphenol-treated inflamed zebrafish, while ependymin-like 1 and some keratins decreased. Cartilage oligomeric matrix protein has been linked to polyphenol-rich diets in murine arthritis models [52].
Inflammation, key to muscle regeneration, involves TNF-α, produced by immune and muscle cells, which regulates regeneration via p38 activation [53]. TNF-α expression rose in inflamed zebrafish but decreased after pre-treatment, although p38 activation was not observed. Similarly, COX2, an enzyme driving prostaglandin-mediated inflammation [54], was elevated in inflamed muscle and reduced by polyphenol treatment. Curcumin and other polyphenols inhibit NF-κB signaling and decrease pro-inflammatory cytokines [55,56,57]. WB data showed reduced IκBα phosphorylation in pre- and co-treated groups, aligning with studies on caffeic acid and resveratrol [56,57].
TNF-α and COX2 expression changes paralleled proteomic shifts in immune-related proteins in I vs. CT: α-2-macroglobulin-like precursor, β-2-microglobulin, CD59, lysozyme g, microfibril-associated glycoproteins, pentaxins, LSM14, saxitoxin/tetrodotoxin-binding proteins, rhamnose-binding lectins, and vitellogenins—all reverted by polyphenol treatment. These proteins modulate inflammation, immunity, and phagocytosis, confirming polyphenols’ immunomodulatory potential. Rhamnose-binding lectins, found in various teleosts including zebrafish, are key regulators of innate immunity [58,59,60].
ERK, crucial for muscle stem cell proliferation [61], was upregulated in inflamed muscle but reduced after pre- and post-treatment. Quercetin was previously shown to reduce ERK, p38, and NF-κB activation in obese mice with muscle atrophy [62]. Related to regeneration, PDZ-LIM domain 3b was reduced in I, while elongation factor 1α and DDX6 increased; these effects were reversed by pre- and co-treatment. Both proteins are involved in proliferation and development, with elongation factor 1α playing a key role in zebrafish tissue regeneration [63].
Metabolite transporters shape immune cell activity [64,65]. Inflamed zebrafish showed over-representation of hemoglobin subunits, prostaglandin D synthase-like isoforms, retinol-binding protein, transcobalamin-2, and vitellogenins, reversed by polyphenol treatment. Changes in retinol-binding protein agree with findings from green tea polyphenol-fed insulin-resistant rats [66].
No significant enzyme deregulation in sugar, energy, or amino acid metabolism was seen in I vs. CT, suggesting minimal metabolic disruption. However, polyphenol treatments did modulate proteins such as cytochrome b-c1 complex subunit 8, cytochrome c oxidase subunit 4, and ATPase subunits—supporting a role in mitochondrial regulation [67]. Polyphenol-treated groups also showed lower aspartate aminotransferase levels, consistent with previous rat studies [68]. Only a few lipid and nucleic acid metabolism-related proteins, including prostaglandin D2 synthase b, DDX6, and LSM14, changed with inflammation but were normalized by polyphenol treatments. Others—acyl-CoA-binding protein, nucleoside diphosphate kinase, and purine nucleoside phosphorylase—responded independently to polyphenol treatments. Effects on metabolic pathways were less pronounced than those on structural or immune proteins, likely due to polyphenols’ modulatory roles [69].
5. Conclusion
In conclusion, this study shows that a pro-inflammatory diet significantly alters zebrafish muscle structure, inflammation, and proteome, while dietary polyphenols (tannins + apigenin) prevented or mitigated these effects. Polyphenols influence protein synthesis/degradation, immune response, and regeneration pathways. These findings support dietary polyphenol supplementation as a potential strategy to improve muscle health in aquaculture. Proper administration timing is critical to prevent or ameliorate diet-induced muscle damage.
Supplementary Materials
The following supporting information can be downloaded at the website of this paper posted on Preprints.org, Table S1: Western Blotting primary antibodies; Figure S1: Scheme of the TMT-label based proteomic approach for quantitative analysis of DRPs; Figure S2: Volcano Plot of DRPs revealed by analysis with Proteome Discoverer software; Table S2: DRPs identified in each comparison; Figure S3: STRING analysis of DRPs; Figure S4: Protein enrichment analysis of DRPs deduced by the Metascape tool; Figure S5: Protein enrichment analysis of DRPs deduced by the EnrichR tool; Figure S6: Differentially represented proteins assigned in at least two of the analyzed comparison; Figure S7: Differentially represented proteins assigned in at least two of the analyzed comparisons.
Author Contributions
Conceptualization, Marina Paolucci and Roberta Imperatore; Data curation, Graziella Orso, Monica Matuozzo, Chiara D'Ambrosio and Roberta Imperatore; Formal analysis, Graziella Orso and Chiara D'Ambrosio; Investigation, Graziella Orso, Monica Matuozzo, Seyed Hossein Hoseinifar, Ghasem Ashouri, Chiara D'Ambrosio and Roberta Imperatore; Methodology, Graziella Orso, Mariapina Rocco, Ghasem Ashouri, Chiara D'Ambrosio and Roberta Imperatore; Supervision, Andrea Scaloni, Marina Paolucci and Roberta Imperatore; Validation, Marina Paolucci and Roberta Imperatore; Writing – original draft, Andrea Scaloni, Marina Paolucci, Chiara D'Ambrosio and Roberta Imperatore; Writing – review & editing, Andrea Scaloni, Marina Paolucci and Roberta Imperatore. All authors have read and agreed to the published version of the manuscript.
Funding
This research received no external funding. This study was supported by Fondi Ricerca di Ateneo (FRA), University of Sannio.
Institutional Review Board Statement
The authors confirm that the ethical considerations were met. This study has been done under Iran National Research Council's guidelines for the care and use of laboratory animals. The research board of GUASNR approved the main project on zebrafish as well as ethical considerations, No: 96-374-63.
Data Availability Statement
The datasets produced and analyzed during the current study are included in the article/Supplementary Materials. Further inquiries can be directed at the corresponding author.
Conflicts of Interest
The authors declare no conflicts of interest.
References
- Ji, Y.; Li, M.; Chang, M.; Liu, R.; Qiu, J.; Wang, K.; Deng, C.; Shen, Y.; Zhu, J.; Wang, W.; Xu, L.; Sun, H. Inflammation: Roles in Skeletal Muscle Atrophy. Antioxidants (Basel). 2022, 11, 1686. [Google Scholar] [CrossRef]
- Zhang, P.; Chen, X.; Fan, M. Signaling mechanisms involved in disuse muscle atrophy. Medical hypotheses. 2007, 69, 310–321. [Google Scholar] [CrossRef]
- Yin, L.; Li, N.; Jia, W.; Wang, N.; Liang, M.; Yang, X.; Du, G. Skeletal muscle atrophy: From mechanisms to treatments. Pharmacol Research. 2021, 72, 105807. [Google Scholar] [CrossRef] [PubMed]
- Powers, S.K.; Kavazis, A.N.; DeRuisseau, K.C. Mechanisms of disuse muscle atrophy: role of oxidative stress. American Journal of Physiology-Regulatory, Integrative and Comparative Physiology. 2005, 288, R337–R344. [Google Scholar] [CrossRef]
- Marzetti, E.; Leeuwenburgh, C. Skeletal muscle apoptosis, sarcopenia and frailty at old age. Exp Gerontol. 2006, 41, 1234–1238. [Google Scholar] [CrossRef] [PubMed]
- Gaffney, C.J.; Pollard, A.; Barratt, T.F.; Constantin-Teodosiu, D.; Greenhaff, P.L.; Szewczyk, N.J. Greater loss of mitochondrial function with ageing is associated with earlier onset of sarcopenia in C. elegans. Aging. 2018, 10, 3382–3396. [Google Scholar] [CrossRef]
- Sartori, R.; Romanello, V.; Sandri, M. Mechanisms of muscle atrophy and hypertrophy: implications in health and disease. Nat Commun. 2021, 12, 330. [Google Scholar] [CrossRef]
- Prochniewicz, E.; Thompson, L.V.; Thomas, D.D. Age-related decline in actomyosin structure and function. Exp Gerontol. 2007, 42, 931–938. [Google Scholar] [CrossRef]
- Lin, I.H.; Chang, J.L.; Hua, K.; Huang, W.C.; Hsu, M.T.; Chen, Y.F. Skeletal muscle in aged mice reveals extensive transformation of muscle gene expression. BMC Genet. 2018, 19, 55. [Google Scholar] [CrossRef]
- Pooley, N.J.; Tacchi, L.; Secombes, C.J.; Martin, S.A.M. Inflammatory responses in primary muscle cell cultures in Atlantic salmon (Salmo salar). BMC Genomics. 2013, 14. [Google Scholar] [CrossRef]
- Salem, M.; Kenney, P.B.; Rexroad, C.E.; Yao, J. Proteomic signature of muscle atrophy in rainbow trout. J Proteomics. 2010, 73, 778–789. [Google Scholar] [CrossRef]
- Froehlich, H.E.; Runge, C.A.; Gentry, R.R.; Gaines, S.D.; Halpern, B.S. Comparative terrestrial feed and land use of an aquaculture-dominant world. Proc Natl Acad Sci U S A 2018, 115, 5295–5300. [Google Scholar] [CrossRef] [PubMed]
- Zhao, H.; Xia, J.; Zhang, X.; He, X.; Li, L.; Tang, R.; Chi, W.; Li, D. Diet affects muscle quality and growth traits of grass carp (Ctenopharyngodon idellus): A comparison between grass and artificial feed. Front Physiol. 2018, 9, 283. [Google Scholar] [CrossRef]
- Shi, X.; Luo, Z.; Chen, F.; Wei, C.; Wu, K.; Zhu, X.; Liu, X. Effect of fish meal replacement by Chlorella meal with dietary cellulase addition on growth performance, digestive enzymatic activities, histology and myogenic genes’ expression for crucian carp Carassius auratus. Aquac Res. 2017, 48, 3244–3256. [Google Scholar] [CrossRef]
- Yu, H.; Liang, H.; Ge, X.; Zhu, J.; Wang, Y.; Ren, M.; Chen, X. Dietary chlorella (Chlorella vulgaris) supplementation effectively improves body color, alleviates muscle inflammation and inhibits apoptosis in largemouth bass (Micropterus salmoides). Fish Shellfish Immunol. 2022, 127, 140–147. [Google Scholar] [CrossRef] [PubMed]
- Médale, F.; Boucher, R.L.; Dupont-Nivet, M.; Quillet, E.; Aubin, J.; Panserat, S. Plant based diets for farmed fish. INRA Prod Anim. 2013, 26, 303–315. [Google Scholar] [CrossRef]
- Shen, Y.; Zhang, C.; Dai, C.; Zhang, Y.; Wang, K.; Gao, Z.; Chen, X.; Yang, X.; Sun, H.; Yao, X.; Xu, L.; Liu, H. Nutritional Strategies for Muscle Atrophy: Current Evidence and Underlying Mechanisms. Mol. Nutr. Food Res. 2024, 68, e2300347. [Google Scholar] [CrossRef] [PubMed]
- Salucci, S.; Falcieri, E. Polyphenols and their potential role in preventing skeletal muscle atrophy. Nutr Res. 2020, 74, 10–22. [Google Scholar] [CrossRef]
- Jin, B.; Li, Y.P. Curcumin prevents lipopolysaccharide-induced atrogin-1/MAFbx upregulation and muscle mass loss. J Cell Biochem. 2007, 100, 960–969. [Google Scholar] [CrossRef]
- Hirasaka, K.; Saito, S.; Yamaguchi, S.; Miyazaki, R.; Wang, Y.; Haruna, M.; Taniyama, S.; Higashitani, A.; Terao, J.; Nikawa, T.; Tachibana, K. Dietary Supplementation with Isoflavones Prevents Muscle Wasting in Tumor-Bearing Mice. J Nutr Sci Vitaminol. 2016, 62, 178–184. [Google Scholar] [CrossRef]
- Tabata, S.; Aizawa, M.; Kinoshita, M.; Ito, Y.; Kawamura, Y.; Takebe, M.; Pan, W.; Sakuma, K. The influence of isoflavone for denervation-induced muscle atrophy. Eur J Nutr. 2019, 58, 291–300. [Google Scholar] [CrossRef]
- Shen, Y.; Zhang, Q.; Huang, Z.; Zhu, J.; Qiu, J.; Ma, W.; Yang, X.; Ding, F.; Sun, H. Isoquercitrin Delays Denervated Soleus Muscle Atrophy by Inhibiting Oxidative Stress and Inflammation. Front Physiol. 2020, 11, 988. [Google Scholar] [CrossRef]
- Jahazi, M.; Hoseinifar, S.H.; Jafari, V.; Hajimoradloo, A.; Doan, H.V.; Paolucci, M. Dietary supplementation of polyphenols positively affects the innate immune response, oxidative status, and growth performance of common carp, Cyprinus carpio L. Aquaculture 2020, 517, 734709. [Google Scholar] [CrossRef]
- Hoseinifar, S.H.; Jahazi, M.; Nikdehghan, N.; Doan, H.V.; Volpe, M.G.; Paolucci, M. Effects of dietary polyphenols from agricultural by-products on mucosal and humoral immune and antioxidant responses of convict cichlid (Amatitlania nigrofasciata). Aquaculture. 2020, 517, 734790. [Google Scholar] [CrossRef]
- Safari, R.; Hoseinifar, S.H.; Imanpour, M.R.; Mazandarani, M.; Sanchouli, H.; Paolucci, M. Effects of dietary polyphenols on mucosal and humoral immune responses, antioxidant defense and growth gene expression in beluga sturgeon (Huso huso). Aquaculture. 2020, 528, 735494. [Google Scholar] [CrossRef]
- Mastrogiovanni, M.; Martínez-Navarro, F.J.; Bowman, T.V.; Cayuela, M.L. Inflammation in Development and Aging: Insights from the Zebrafish Model. Int J Mol Sci. 2024, 25, 2145. [Google Scholar] [CrossRef]
- Jaiswal, S.; Rasal, K.D.; Chandra, T.; Prabha, R.; Iquebal, M.A.; Rai, A.; Kumar, D. Proteomics in fish health and aquaculture productivity management: Status and future perspectives. Aquaculture. 2023, 566, 739159. [Google Scholar] [CrossRef]
- Imperatore, R.; Orso, G.; Facchiano, S.; Scarano, P.P.; Hoseinifar, S.H.; Ashouri, G.; Guarino, C.; Paolucci, M. Anti-inflammatory and immunostimulant effect of different timing-related administration of dietary polyphenols on intestinal inflammation in zebrafish, Danio rerio. Aquaculture. 2023, 563, 738878. [Google Scholar] [CrossRef]
- Orso, G.; Solovyev, M.M.; Facchiano, S.; Tyrikova, E.; Sateriale, D.; Kashinskaya, E.; Pagliarulo, C.; Hoseinifar, H.S.; Simonov, E.; Varricchio, E.; Paolucci, M.; Imperatore, R. Chestnut shell tannins: Effects on intestinal inflammation and dysbiosis in Zebrafish. Animals. 2021, 11, 1538. [Google Scholar] [CrossRef]
- Imperatore, R.; Tunisi, L.; Mavaro, I.; D'Angelo, L.; Attanasio, C.; Safari, O.; Motlagh, H.A.; De Girolamo, P.; Cristino, L.; Varricchio, E.; Paolucci, M. Immunohistochemical Analysis of Intestinal and Central Nervous System Morphology in an Obese Animal Model (Danio rerio) Treated with 3,5-T2: A Possible Farm Management Practice? Animals (Basel). 2020, 10, 1131. [Google Scholar] [CrossRef]
- Sayed, A.E.; Mekkawy, I.A.; Mahmoud, U.M.; Nagiub, M. Histopathological and histochemical effects of silver nanoparticles on the gills and muscles of African catfish (Clarias garepinus). Scientific African. 2020, 7, e00230. [Google Scholar] [CrossRef]
- Wen, W.; Sun, C.; Chen, Z.; Yang, D.; Zhou, Z.; Peng, X.; Tang, C. Alcohol Induces Zebrafish Skeletal Muscle Atrophy through HMGB1/TLR4/NF-κB Signaling. Life (Basel, Switzerland). 2022, 12, 1211. [Google Scholar] [CrossRef] [PubMed]
- Manai, M.; Fiorillo, A.; Matuozzo, M.; Li, M.; D'Ambrosio, C.; Franco, L.; Scaloni, A.; Fogliano, V.; Camoni, L.; Marra, M. Phenotypical and biochemical characterization of tomato plants treated with triacontanol. Sci Rep. 2024, 14, 12096. [Google Scholar] [CrossRef]
- Szklarczyk, D.; Kirsch, R.; Koutrouli, M.; Nastou, K.; Mehryary, F.; Hachilif, R.; Gable, A.L.; Fang, T.; Doncheva, N.T.; Pyysalo, S.; Bork, P.; Jensen, L.J.; von Mering, C. The STRING database in 2023: protein–protein association networks and functional enrichment analyses for any sequenced genome of interest. Nucleic Acids Res. 2023, 51, D638–646. [Google Scholar] [CrossRef] [PubMed]
- Sorice, A.; Siano, F.; Capone, F.; Guerriero, E.; Picariello, G.; Budillon, A.; Ciliberto, G.; Paolucci, M.; Costantini, S.; Volpe, M.G. Potential anticancer effects of polyphenols from chestnut shell extracts: Modulation of cell growth, and cytokinomic and metabolomic profiles. Molecules. 2016, 21, 1411. [Google Scholar] [CrossRef]
- ELbialy, Z.I.; Atef, E.; Al-Hawary, I.I.; Salah, A.S.; Aboshosha, A.A.; Abualreesh, M.H.; Assar, D.H. Myostatin-mediated regulation of skeletal muscle damage post-acute Aeromonas hydrophila infection in Nile tilapia (Oreochromis niloticus L.). Fish Physiol Biochem. 2023, 49, 1–17. [Google Scholar] [CrossRef] [PubMed]
- Fürst, D.O.; Osborn, M.; Nave, R.; Weber, K. The organization of titin filaments in the half-sarcomere revealed by monoclonal antibodies in immunoelectron microscopy: a map of ten nonrepetitive epitopes starting at the Z line extends close to the M line. J Cell Biol. 1988, 106, 1563–72. [Google Scholar] [CrossRef]
- Tatsumi, R.; Maeda, K.; Hattori, A.; Takahashi, K. Calcium binding to an elastic portion of connectin/titin filaments. J. Muscle Res. Cell Motil. 2001, 22, 149–162. [Google Scholar] [CrossRef]
- Tatham, A.S.; Shewry, P.R. Elastomeric proteins: biological roles, structures and mechanisms. Trends in Biochemical Sciences. 2000, 25, 567–571. [Google Scholar] [CrossRef]
- Khaitlina, S.Y. Tropomyosin as a Regulator of Actin Dynamics. International Review of Cell and Molecular Biology. 2015, 318, 255–291. [Google Scholar] [CrossRef]
- Lv, L.; Qu, X.; Yang, N.; Liu, Z.; Wu, X. Changes in structure and allergenicity of shrimp tropomyosin by dietary polyphenols treatment. Food Res. Int. 2020, 140, 109997. [Google Scholar] [CrossRef]
- Murphy, S.; Dowling, P.; Ohlendieck, K. Comparative Skeletal Muscle Proteomics Using Two-Dimensional Gel Electrophoresis. Proteomes. 2016, 4, 27. [Google Scholar] [CrossRef]
- Nikawa, T.; Ulla, A.; Sakakibara, I. Polyphenols and their effects on muscle atrophy and muscle health. Molecules. 2021, 26, 4887. [Google Scholar] [CrossRef]
- Agnetti, G.; Herrmann, H.; Cohen, S. New roles for desmin in the maintenance of muscle homeostasis. FEBS J. 2022, 289, 2755–2770. [Google Scholar] [CrossRef]
- Hnia, K.; Ramspacher, C.; Vermot, J.; Laporte, J. Desmin in muscle and associated diseases: beyond the structural function. Cell Tissue Res 2015, 360, 591–608. [Google Scholar] [CrossRef]
- Csapo, R.; Gumpenberger, M.; Wessner, B. Skeletal Muscle Extracellular Matrix - What Do We Know About Its Composition, Regulation, and Physiological Roles? A Narrative Review. Front Physiol. 2020, 11, 253. [Google Scholar] [CrossRef]
- Khairallah, R.J.; O’Shea, K.M.; Ward, C.W.; Butteiger, D.N.; Mukherjea, R.; Krul, E.S. Chronic dietary supplementation with soy protein improves muscle function in rats. PLoS ONE. 2017, 12, e0189246. [Google Scholar] [CrossRef]
- Purslow, P.P. The Structure and Role of Intramuscular Connective Tissue in Muscle Function. Front. Physiol. 2020, 11, 495. [Google Scholar] [CrossRef]
- Narayanan, A.S.; Engel, L.D.; Page, R.C. The effect of chronic inflammation on the composition of collagen types in human connective tissue. Coll Relat Res. 1983, 3, 323–334. [Google Scholar] [CrossRef] [PubMed]
- Zhang, X.; Adachi, S.; Ura, K.; Takagi, Y. Properties of collagen extracted from Amur sturgeon Acipenser schrenckii and assessment of collagen fibrils in vitro. Int J Biol Macromol. 2019, 137, 809–820. [Google Scholar] [CrossRef] [PubMed]
- Cai, Y.; He, S.Q.; Hong, H.Q.; Cai, Y.P.; Zhao, L.; Zhang, M. High doses of (-)-epigallocatechin-3-gallate from green tea induces cardiac fibrosis in mice. Biotechnol. Lett. 2015, 37, 2371–2377. [Google Scholar] [CrossRef]
- Castejón, M.L.; Alarcón-de-la-Lastra, C.; Rosillo, M.Á.; Montoya, T.; Fernández-Bolaños, J.G.; González-Benjumea, A.; Sánchez-Hidalgo, M. A new peracetylated oleuropein derivative ameliorates joint inflammation and destruction in a murine collagen-induced arthritis model via activation of the Nrf-2/Ho-1 antioxidant pathway and suppression of MAPKs and NF-κB activation. Nutrients. 2021, 13, 311. [Google Scholar] [CrossRef]
- Ji, Y.; Li, M.; Chang, M.; Liu, R.; Qiu, J.; Wang, K.; Deng, C.; Shen, Y.; Zhu, J.; Wang, W.; et al. Inflammation: Roles in Skeletal Muscle Atrophy. Antioxidants 2022, 11, 1686. [Google Scholar] [CrossRef]
- Kaur, B.; Singh, P. Inflammation: Biochemistry, cellular targets, anti-inflammatory agents and challenges with special emphasis on cyclooxygenase-2. Bioorganic Chem. 2022, 121. [Google Scholar] [CrossRef] [PubMed]
- Ono, T.; Takada, S.; Kinugawa, S.; Tsutsui, H. Curcumin ameliorates skeletal muscle atrophy in type 1 diabetic mice by inhibiting protein ubiquitination. Exp. Physiol. 2015, 100, 1052–1063. [Google Scholar] [CrossRef]
- Shen, Y.C.; Yen, J.C.; Liou, K.T. Ameliorative effects of caffeic acid phenethyl ester on an eccentric exercise-induced skeletal muscle injury by down-regulating NF-κB mediated inflammation. Pharmacol. 2013, 91, 219–228. [Google Scholar] [CrossRef] [PubMed]
- Dugdale, H.F.; Hughes, D.C.; Allan, R.; Deane, C.S.; Coxon, C.R.; Morton, J.P.; Stewart, C.E.; Sharples, A.P. The role of resveratrol on skeletal muscle cell differentiation and myotube hypertrophy during glucose restriction. Mol. Cell. Biochem. 2018, 444, 109–123. [Google Scholar] [CrossRef]
- Vasta, G.R.; Nita-Lazar, M.; Giomarelli, B.; Ahmed, H.; Du, S.; Cammarata, M.; Parrinello, N.; Bianchet, M.A.; Amzel, L.M. Structural and functional diversity of the lectin repertoire in teleost fish: Relevance to innate and adaptive immunity. Dev. Comp. Immunol. 2011, 35, 1388–1399. [Google Scholar] [CrossRef] [PubMed]
- Tateno, H.; Ogawa, T.; Muramoto, K.; Kamiya, H.; Hirai, T.; Saneyoshi, M. A novel rhamnose-binding lectin family from eggs of steelhead trout (Oncorhynchus mykiss) with different structures and tissue distribution. Biosci. Biotechnol. Biochem. 2001, 65, 1328–1338. [Google Scholar] [CrossRef]
- Cammarata, M.; Parisi, M.G.; Benenati, G.; Vasta, G.R.; Parrinello, N. A rhamnose-binding lectin from sea bass (Dicentrarchus labrax) plasma agglutinates and opsonizes pathogenic bacteria. Dev. Comp. Immunol. 2014, 44, 332–340. [Google Scholar] [CrossRef]
- Levin, J.B.; Borodinsky, L.N. Injury-induced Erk1/2 signaling tissue-specifically interacts with Ca2+ activity and is necessary for regeneration of spinal cord and skeletal muscle. Cell Calcium. 2022, 102, 102540. [Google Scholar] [CrossRef]
- Le, N.H.; Kim, C.S.; Park, T.; Park, J.H.; Sung, M.K.; Lee, D.G.; Hong, S.M.; Choe, S.Y.; Goto, T.; Kawada, T.; Yu, R. Quercetin protects against obesity-induced skeletal muscle inflammation and atrophy. Mediators Inflamm. 2014, 2014, 834294. [Google Scholar] [CrossRef]
- Moon, H.Y.; Kim, O.H.; Kim, H.T.; Choi, J.H.; Yeo, S.Y.; Kim, N.S.; Park, D.S.; Oh, H.W.; You, K.H.; De Zoysa, M.; Kim, C.H. Establishment of a transgenic zebrafish EF1α: Kaede for monitoring cell proliferation during regeneration. Fish Shellfish Immunol. 2013, 34, 1390–1394. [Google Scholar] [CrossRef]
- Hsu, C.L.; Dzhagalov, I.L. Metabolite Transporters—The Gatekeepers for T Cell Metabolism. Immunometabolism. 2019, 1, e190012. [Google Scholar] [CrossRef]
- O’Neill, L.A.J.; Kishton, R.J.; Rathmell, J. A guide to immunometabolism for immunologists. Nat. Rev. Immunol. 2016, 16, 553–565. [Google Scholar] [CrossRef]
- Qin, B.; Polansky, M.M.; Harry, D.; Anderson, R.A. Green tea polyphenols improve cardiac muscle mRNA and protein levels of signal pathways related to insulin and lipid metabolism and inflammation in insulin-resistant rats. Mol. Nutr. Food Res. 2010, 54, S14–S23. [Google Scholar] [CrossRef]
- Yoshida, Y.; Tamura, Y.; Kouzaki, K.; Nakazato, K. Dietary apple polyphenols enhance mitochondrial turnover and respiratory chain enzymes. Exp. Physiol. 2023, 108, 1295–1307. [Google Scholar] [CrossRef]
- Wu, G.; Wang, M.; Du, Z.; Li, Z.; Han, T.; Xie, Z.; Gu, W. Tea polyphenol EGCG enhances the improvements of calorie restriction on hepatic steatosis and obesity while reducing its adverse outcomes in obese rats. Phytomedicine. 2025, 141, 156744. [Google Scholar] [CrossRef] [PubMed]
- Obrenovich, M.; Li, Y.; Tayahi, M.; Reddy, V.P. Polyphenols and Small Phenolic Acids as Cellular Metabolic Regulators. Curr Issues Mol Biol. 2022, 44, 4152–4166. [Google Scholar] [CrossRef] [PubMed]
Figure 1.
Representative images of white muscle tissue stained with hematoxylin-eosin. The images show muscle longitudinal and transversal sections of (A, A1) control (CT), (B, B1) inflamed (I), (C, C1) chestnut shell and V. macrurum polyphenols extract pre-treated (PVpreI), or (D, D1) co-treated (PVwithI), or (E, E1) post-treated (PVpostI), and (F, F1) positive control (PV) zebrafish (D. rerio). Black arrowheads show circular nuclei; asterisks show degenerated and/or wavy fibers; black arrows show interstitial areas with cell infiltration; red arrows show broken myofibrillas; hash sign show increase in connective tissue spaces. Scale bar: 100 µm. (G) Mean muscle fibers cross-sectional area (CSA) (µm2) for each experimental group. Data are expressed as mean ± SE. ***p < 0.0001 and *p < 0.05 compared to the CT group; ###p < 0.0001 compared to the I group.
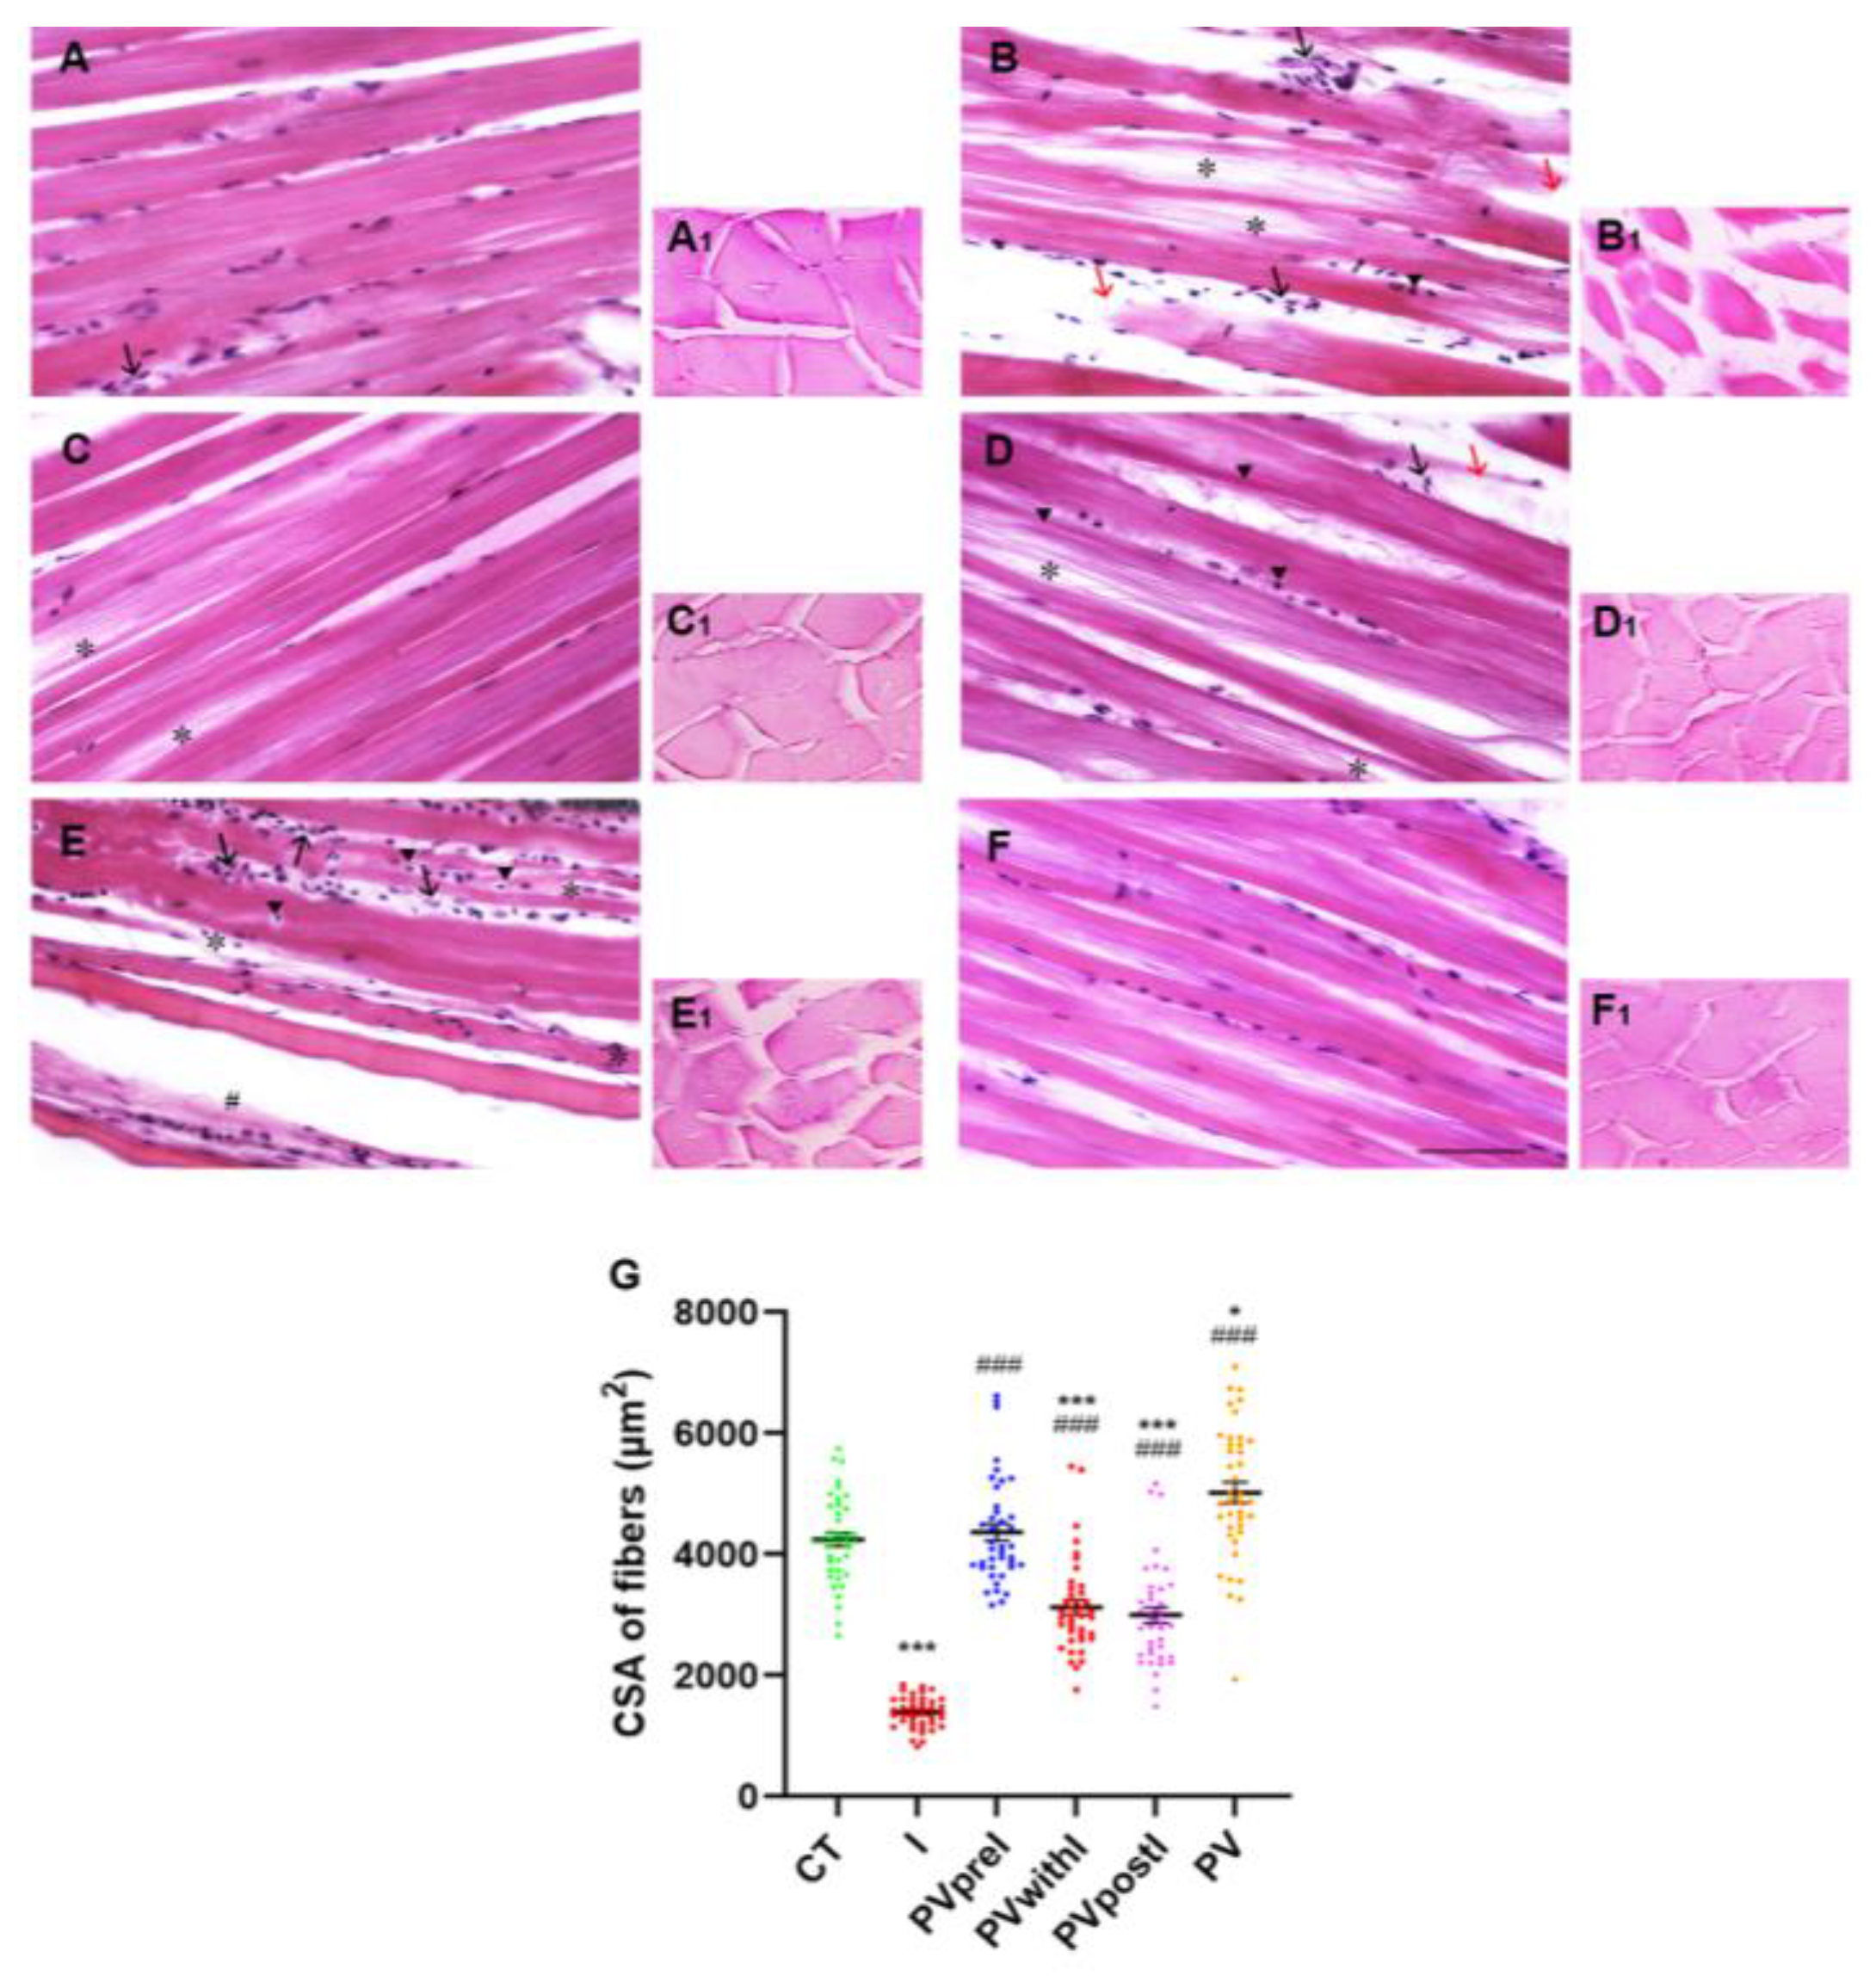
Figure 2.
Representative images of TNF-α immunoexpression in the white muscle tissue. The images show TNF-α immunosignal in muscle longitudinal sections of (A, A1) control (CT), (B, B1) inflamed (I), (C, C1) chestnut shell and V. macrurum polyphenols extract pre-treated (PVpreI), or (D, D1) post-treated (PVpostI), or (E, E1) co-treated (PVwithI), and (F, F1) positive control (PV) zebrafish (D. rerio). Arrows show immunopositive nuclei of muscle cells; asterisks show immunopositive inflammatory infiltrated cells, and arrowheads show immunopositive muscle fibers. Scale bar: 50 µm.
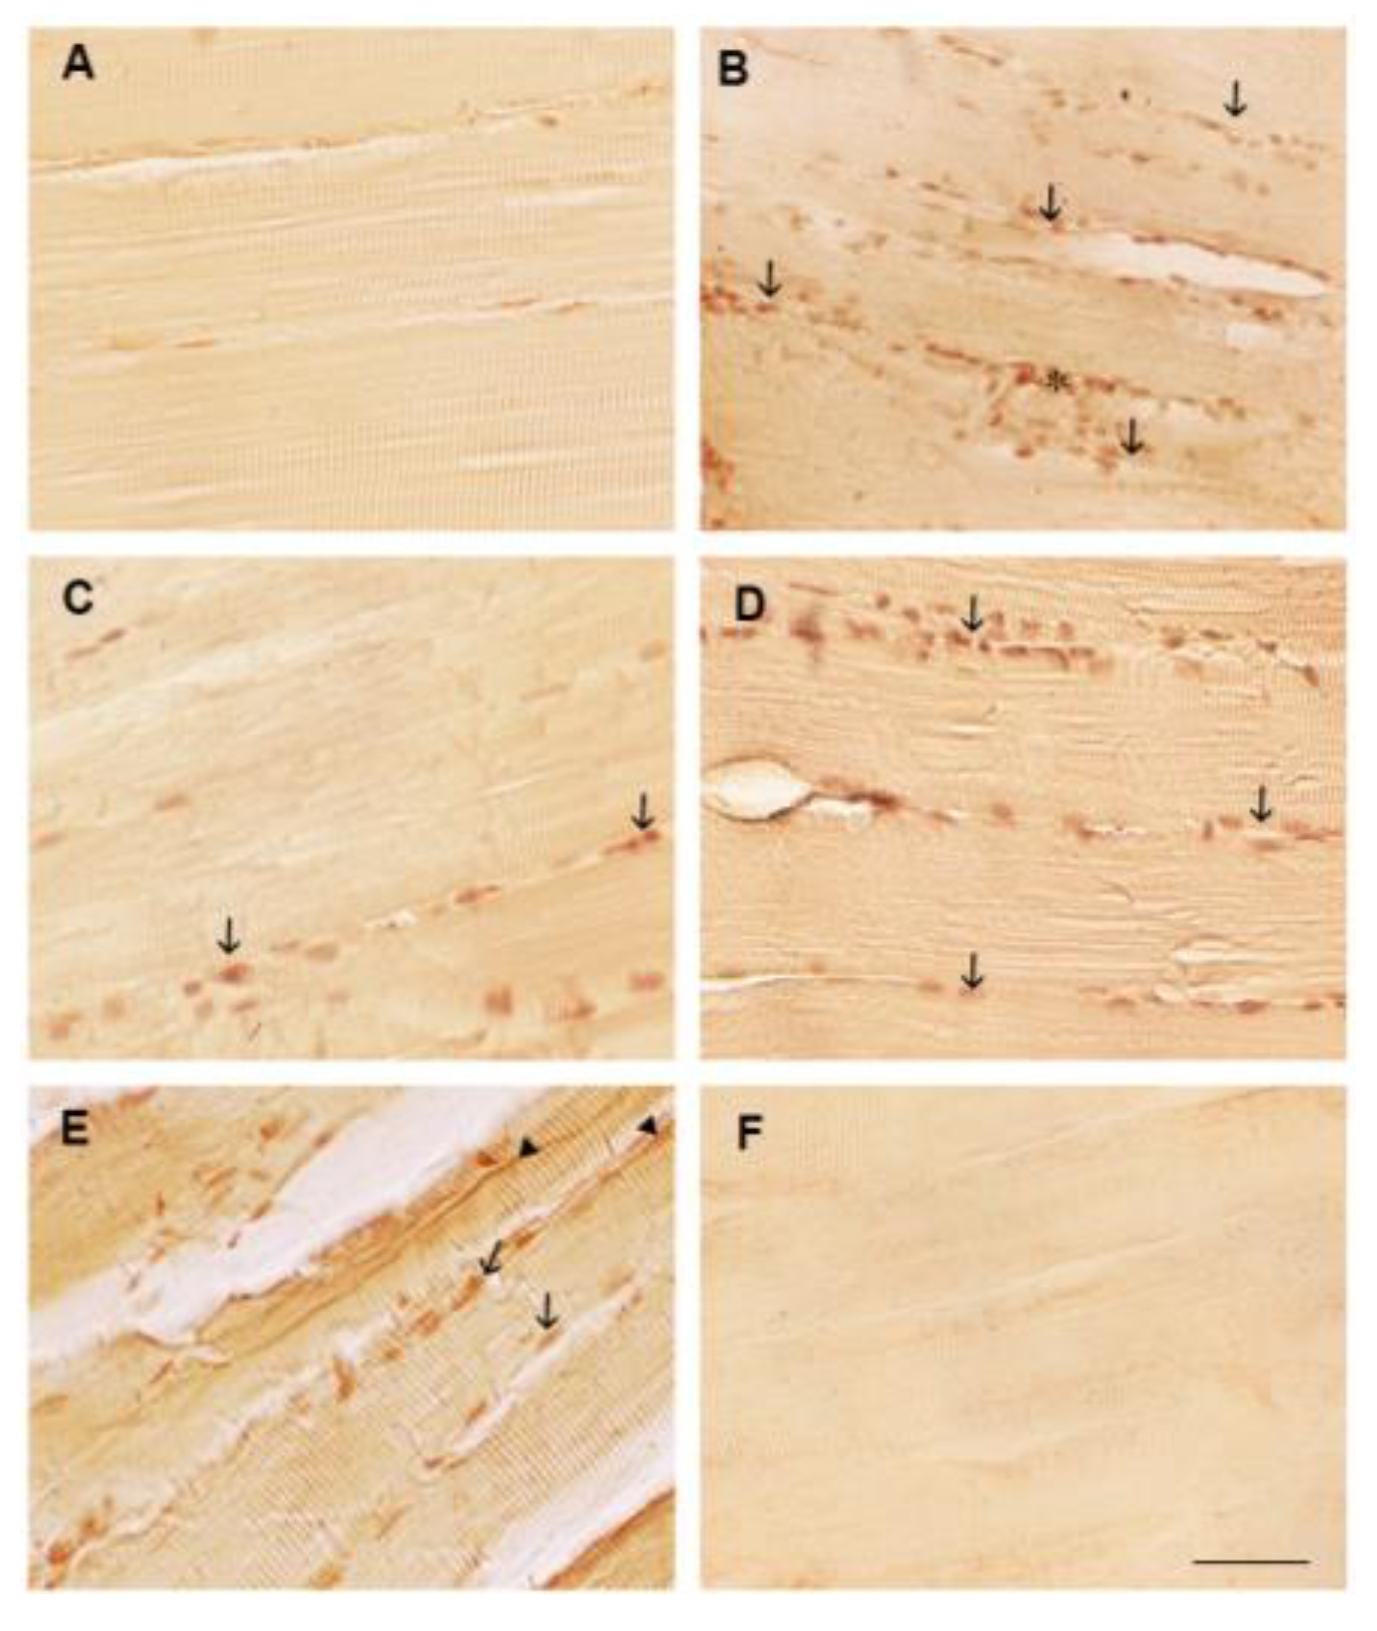
Figure 3.
Representative images of COX2 immunoexpression in the white muscle tissue. The images show COX2 immunosignal in muscle longitudinal sections of (A, A1) control (CT), (B, B1) inflamed (I), (C, C1) chestnut shell and V. macrurum polyphenols extract pre-treated (PVpreI), or (D, D1) post-treated (PVpostI), or (E, E1) co-treated (PVwithI), and (F, F1) positive control (PV) zebrafish (D. rerio). Black arrows show immunopositive muscle cell nuclei; asterisks show immunopositive muscle fibers. Scale bar: 50 µm.
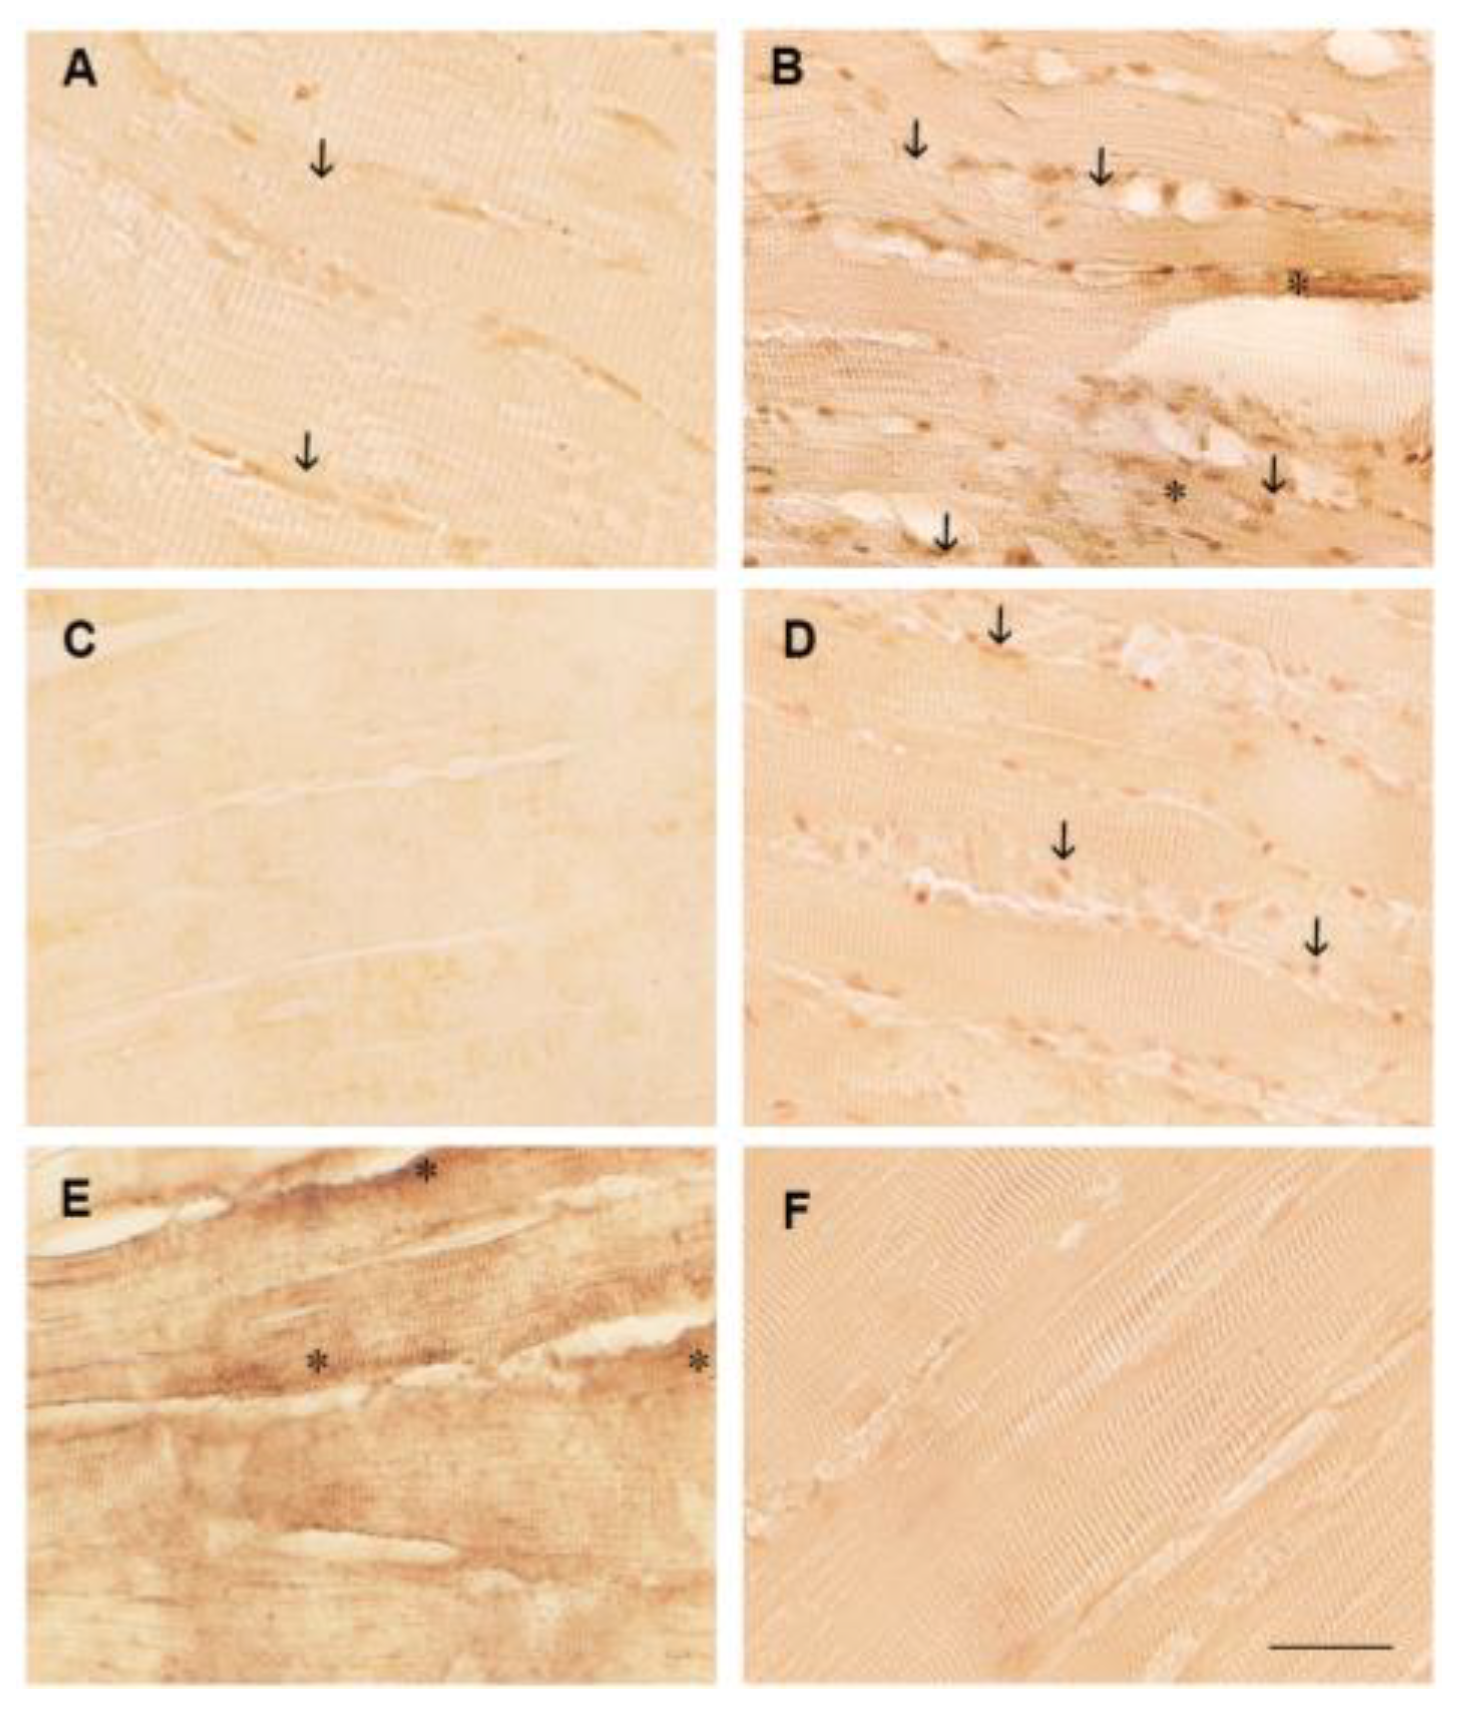
Figure 4.
Representative images of caspase-3 immunoexpression in the white muscle tissue. The images show caspase-3 immunosignal in muscle longitudinal sections of (A, A1) control (CT), (B, B1) inflamed (I), (C, C1) chestnut shell and V. macrurum polyphenols extract pre-treated (PVpreI), or (D, D1) post-treated (PVpostI), or (E, E1) co-treated (PVwithI), and (F, F1) positive control (PV) zebrafish (D. rerio). Arrows show immunopositive nuclei of muscle cells. Scale bar: 50 µm. (G) Mean number of caspase-3-positive cells/mm2 of muscle tissue of each group. Data are expressed as mean ± SE. ***p < 0.0001, *p < 0.05 compared to the CT group; °p < 0.05 compared to the I group.
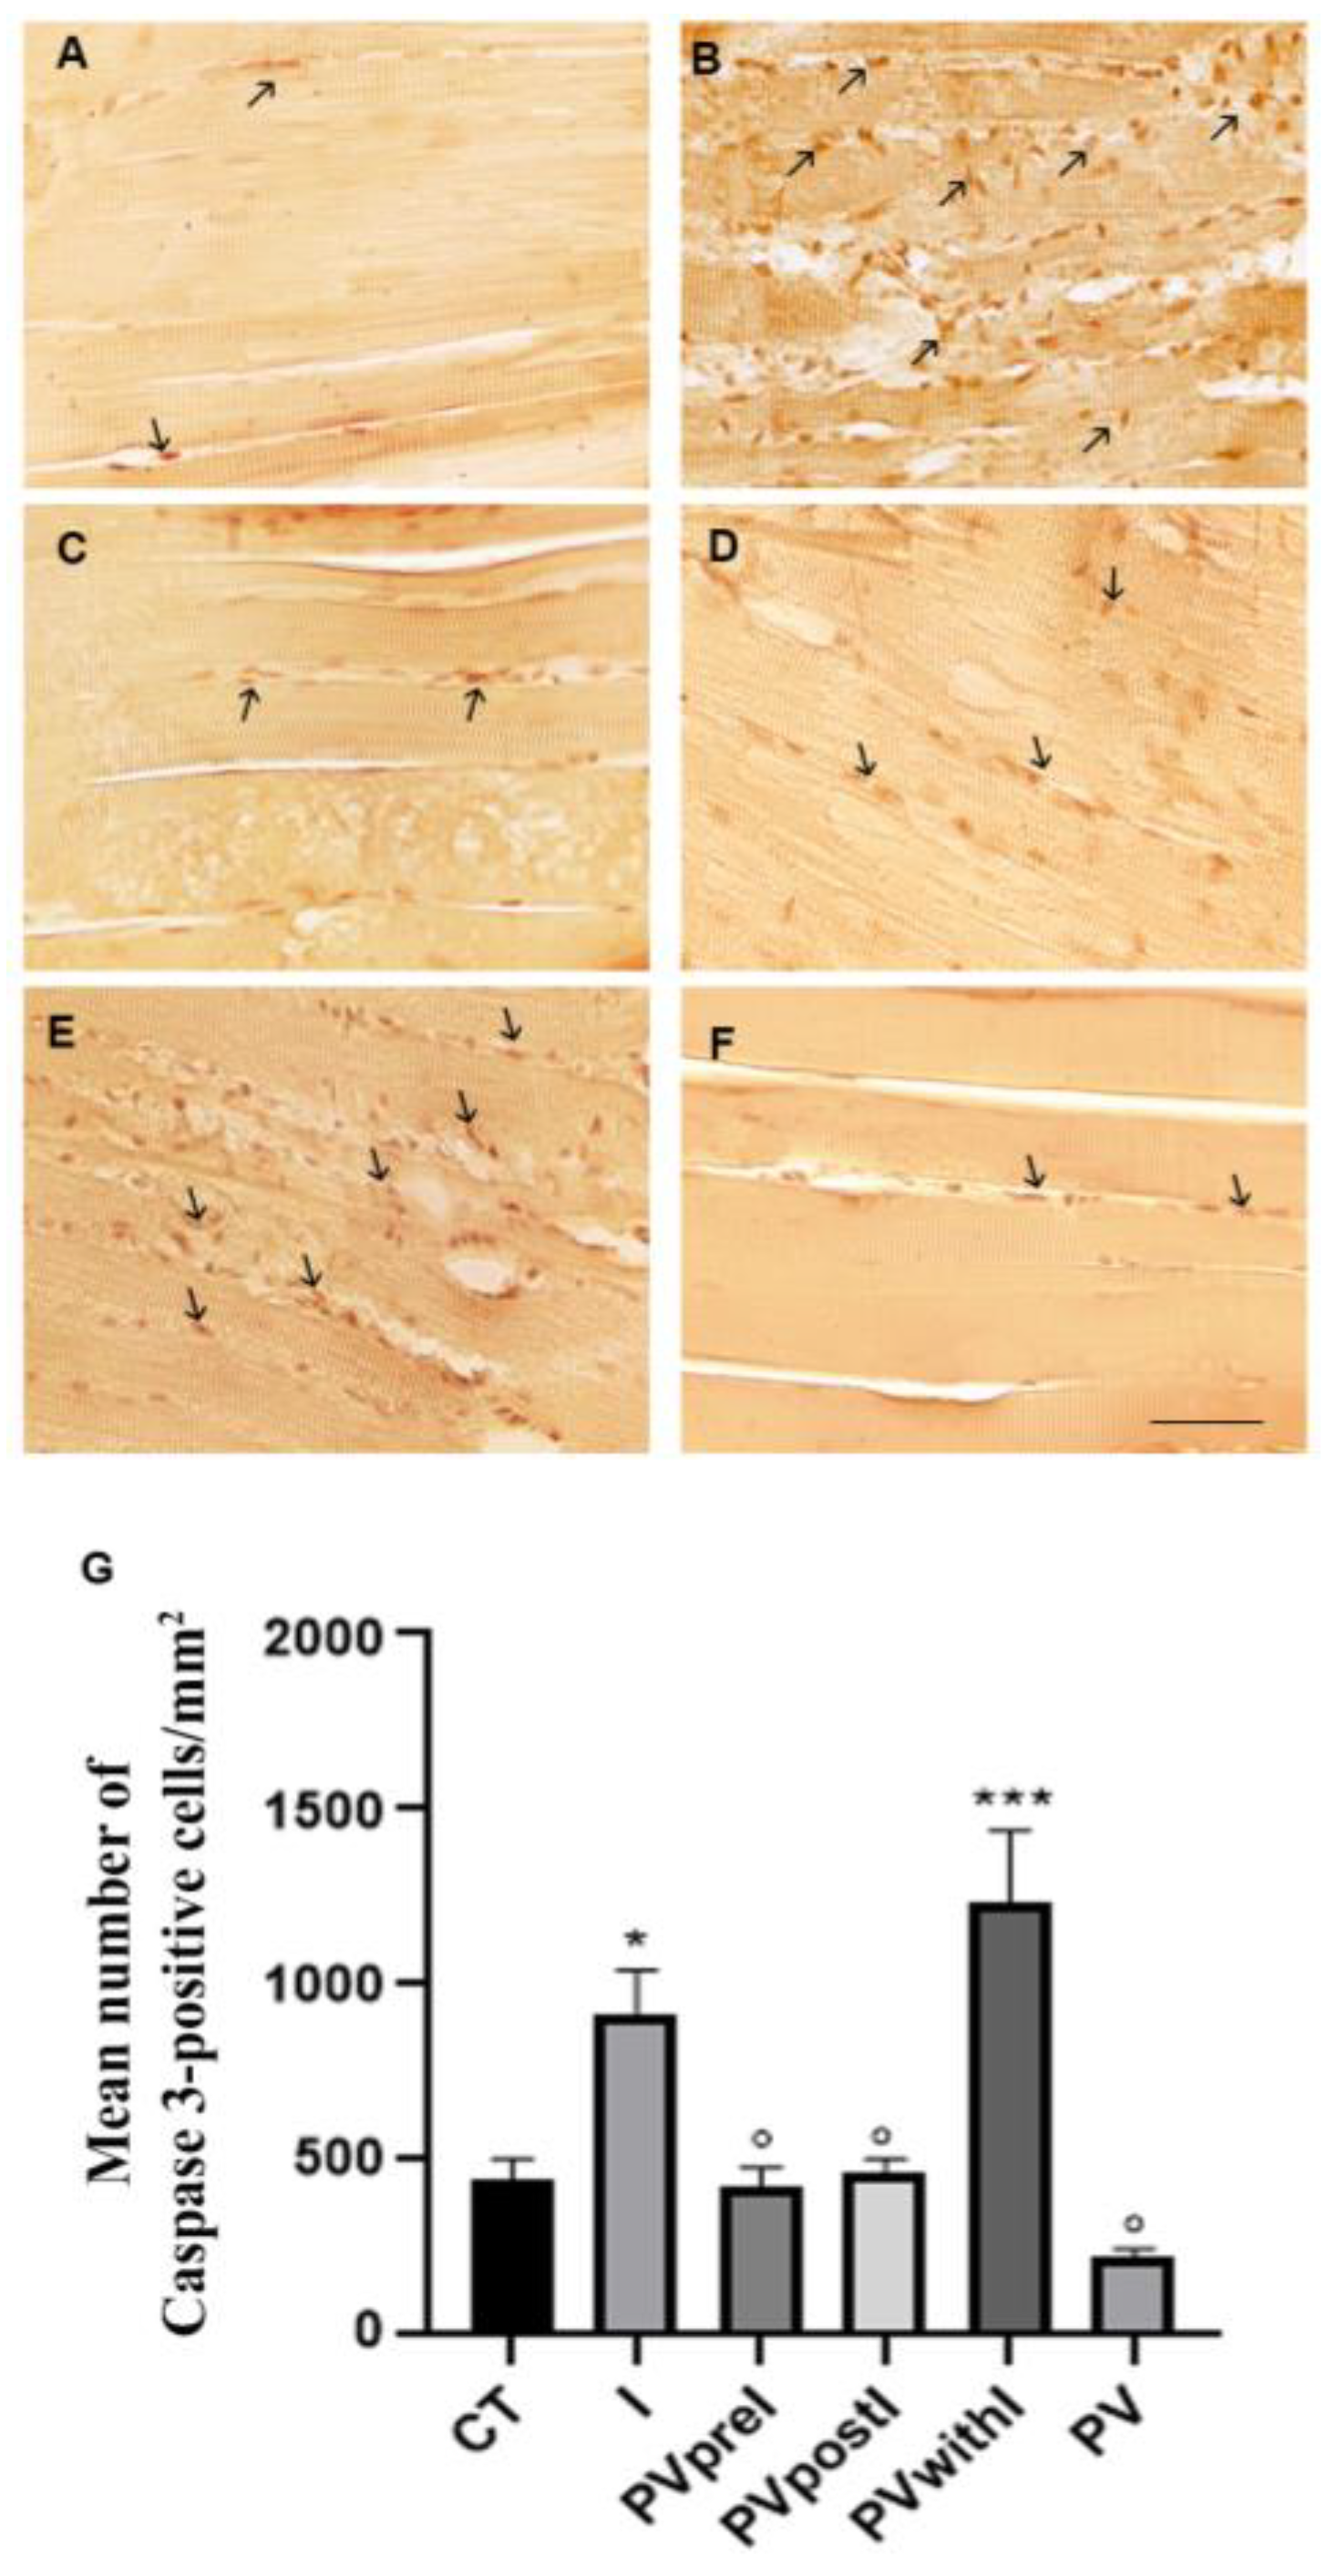
Figure 5.
Representative immunoblots of IκBα (39 KDa), phospho-IκBα (40 KDa), ERK ½ (42/44 KDa), phospho-ERK ½ (42/44 KDa), p38 (38 KDa), phospho-p38 (38 KDa), desmin (54 KDa), titin (T11) (135 KDa), and PAX3 (53 KDa) expression. Fold data of relative optical density are expressed as the ratio between phospho-IκBα - IκBα, phospho-ERK 1/2 - ERK 1/2, phospho-p38 – p38, and optical density of desmin, titin (T11) and PAX3 total protein signals in the white muscle tissue of control (CT), inflamed (I), chestnut shell and V. macrurum polyphenols extract pre-treated (PVpreI), or post-treated (PVpostI), or co-treated (PVwithI), and positive control (PV) zebrafish (D. rerio). The relative amount of each protein was compared with that of GAPDH (36 KDa). Fold data are presented as the mean ± SD from n=3 zebrafish per group, normalized to the CT group. **p < 0.001 and *p < 0.05 compared to the CT group; •••p < 0.0001, ••p < 0.001 and •p < 0.05, compared to the I group; ‣‣p < 0.001 and ‣p < 0.05, compared to the PVpostI group; ᵒᵒᵒp < 0.0001, ᵒᵒp < 0.001 and ᵒᵒp < 0.05, compared to the PVpreI group; ~~p < 0.001 and ~p < 0.05, compared to the PVwithI group; ###p < 0.0001, ##p < 0.001, #p < 0.05 compared to the PV group.
Disclaimer/Publisher’s Note: The statements, opinions and data contained in all publications are solely those of the individual author(s) and contributor(s) and not of MDPI and/or the editor(s). MDPI and/or the editor(s) disclaim responsibility for any injury to people or property resulting from any ideas, methods, instructions or products referred to in the content. |
© 2025 by the authors. Licensee MDPI, Basel, Switzerland. This article is an open access article distributed under the terms and conditions of the Creative Commons Attribution (CC BY) license (http://creativecommons.org/licenses/by/4.0/).
Copyright: This open access article is published under a Creative Commons CC BY 4.0 license, which permit the free download, distribution, and reuse, provided that the author and preprint are cited in any reuse.


