
Submitted:
21 April 2024
Posted:
23 April 2024
You are already at the latest version
Abstract
As a result of increased energy consumption, global trade has surged, and serious environmental problems have arisen. The problem is made more complicated by the fact that either environmental damage or economic advancement cannot be compromised. The elements contributing to environmental contamination must be identified and dealt with accordingly if we are to have a healthier future. In this study, what causes CO₂ emissions in Malaysia are examined using the Autoregressive distributed lag (ARDL) model using time series data from 1995 to 2020. The paper also examines the impact of energy use and economic complexity on CO2 emissions. Firstly, it is noted that the Environmental Kuznets Curve (EKC) theory holds in Malaysia. Furthermore, energy consumption has a detrimental impact on reducing CO2 emissions. Furthermore, it has been noted that a greater degree of economic complexity leads to an elevated amount of CO2 emissions over an extended period. The findings suggest significant environmental policy implications for reducing CO2 emissions in Malaysia.
Keywords:
Economic Complexity
; Energy Consumption
; Carbon Emissions
; Environmental Kuznets Curve
1. Introduction
Greater energy efficiency, better environmental results, and faster economic growth are the goals of any nation [1]. Most carbon emissions, according to recent studies, are caused by developing nations’ rapid economic progress. Since the beginning of industrialization in the 1970s, energy consumption has skyrocketed, resulting in a surge in global trade and serious environmental problems. Making matters more complicated is that neither environmental harm nor economic advancement can be compromised. For a healthier future, it is vital to identify the elements contributing to environmental contamination and act accordingly. Important macroeconomic variables that influence environmental deterioration include economic development and the consumption of fossil fuels. More fossil fuel use is associated with worsening environmental quality, according to multiple research [2,3].
Economic development and environmental pollution indicators, such as carbon dioxide emissions (CO2,), Sulphur dioxide emissions (SO2) and suspended particles (SP) were found to have a curvilinear relationship that followed an inverted U-shaped pattern by [4]. In the early phases of economic growth, environmental pollution grows with income levels according to EKC, but after a certain threshold, it drops [5]. This idea states that as the economy grows, pollution will rise until a certain point, after which it will begin to fall. Malaysia committed at COP26 in Glasgow to reduce emissions intensity by 45 per cent by 2030 and achieve net-zero emissions by 2050. Figure 1 and Figure 2 display the energy consumption (EC), and CO₂ emissions per capita for Malaysia from the years 1995 to 2020.
CO2 emissions are worsened because the Malaysian economy is highly dependent on non-renewable energy sources (Figure 3). Few studies have examined how the economic complexity index (ECI) affects CO2. The intricacy of a nation’s exports determines its economic complexity. One definition of a "complex" country exports a wide variety of products, including those with a high level of complexity. As a proxy for a nation’s level of economic development, the ECI assesses the complexity and diversity of its export basket. To determine the ECI, [6] consider the "diversity" (i.e., the variety of products) and "ubiquity" (i.e., the number of nations that can make those products) of a country.
The two factors of diversity and ubiquity, which complement and balance one another, are used to determine economic complexity. The economic complexity of Malaysia jumped from 0.0085 in 1997 to 1.06 in 2020, putting it at the 25th spot among the world’s most complex economies. Figure 4 shows the total exports in Malaysia in 2022. $378B worth of goods and services were exported by Malaysia in 2022, making it the 22nd largest exporter in the world. Over the last five years, Malaysia has increased its exports by $119B, from $259B in 2017 to $378B in 2022. Exports of Integrated Circuits were the top export ($78.9B), followed by Refined Petroleum ($38.5B), Petroleum Gas ($19.5B), Palm Oil ($17.7B), and Crude Petroleum ($10.2B). The fact that Malaysia is climbing the complexity ladder at a faster rate than other countries shows that it can produce a more diverse assortment of high-tech items. Minimal environmental impacts are achieved by basic economies through the production of agricultural and mineral products. High quantities of pollution are produced by advanced economies with various manufacturing sectors [7]. Environmental strain is affected by economic complexity index, growth, and the utilization of fossil fuels. To our knowledge, no other research has examined the relationships between ECI, EC, gross domestic product (GDP) and CO2 emissions. By looking at the Malaysian case from 1997 to 2020, our research aims to fill this void in the literature. The ARDL model developed by [8] Shin et al. in 2013 was employed to investigate the matter in this work. To assess the reliability of the ARDL model, the study employs “Augmented Dickey-Fuller (ADF)” [9] and "Phillips-Perron (PP)" unit root tests [10]. To help monitor the environmental and economic problems of developing nations like Malaysia, this article provides a plethora of policy suggestions based on statistical research. The rest of the article is below: the second part of the paper examines the previous research and theories that have been proposed. The third section gives a detailed account of the methods and materials utilized (Data, empirical model, and estimation methodology Data). Section 4 presents the study’s results and discussion, Section 5 suggests policy recommendations, and Section 6 presents a conclusion.
2. Literature Review
2.1. Economic Growth and Environmental Pollution
As economic development progresses through its stages, environmental degradation always follows [11]. According to [12], the form of the environmental degradation curve is affected by the requirement for additional economic expansion, and this in turn alters as countries grow. Consequently, the environment will be endangered if economic expansion is the only goal ever pursued. [4] looked at how economic growth and environmental degradation are interconnected. For nations with low per capita incomes, economic inequality compounds [13]. Despite this, economic disparity decreases as per capita income rises beyond a particular level (the greatest point). One can observe an inverted U-shaped curve in the Kuznets curve. Similarly, the EKC theory stated that, at least in the early stages of economic growth, environmental conditions would worsen. The quality of a country’s environment, however, will begin to improve once the income level reaches a peak.
Ref. [11] argue that this means that environmental degradation and economic growth are interdependent and can fix themselves through the EKC theory. The greatest way for a country to stop its environmental degradation is for its economy to thrive. The EKC has been the subject of multiple international investigations that have all found it to be accurate. Among these, [14] confirm the EKC hypothesis for four environmental degradation indicators: total greenhouse gas (GHG) emissions plus CO2, nitrous oxide (N2O), and methane gas (CH4). In their study of the emerging seven countries from 1995 to 2018, [15] investigated the N-shaped EKC. However, they don’t find evidence of an N-shaped EKC; instead, they show that the countries in question have an inverted U-shaped EKC. In the meantime, [16] analyzed the EKC for deforestation in ten nations that together possess two-thirds of the world’s wooded land that was analyzed from 2000 to 2015. The deforestation-driven EKC hypothesis is supported by their data. In addition, the EKC hypothesis has been discussed in the literature on both developing and established nations, to determine whether it is valid. One of them is [17], who draws interesting findings from analyzing the EKC for CO2 emissions in nations with low, medium, and high incomes. He also stated that in comparison to economies with low or high incomes, middle-income countries see a more favourable effect of economic growth on environmental degradation. Typically, high-income nations are found on the right side of the EKC, which is a measure of the negative association between income and environmental degradation. And yet, the EKC theory is unconvincing when applied to developing countries. New research disproves this idea and establishes the EKC for CO₂ emissions in both poor and rich countries [18,19,20]. Consequently, research testing the EKC theory in both developed and developing countries has shown contradictory results.
2.2. Economic Complexity and Environmental Pollution
Recent research has explored the connection between ECI and environmental pollution. [21] analyzed carbon emissions in France from 1964 to 2014 to investigate the EKC theory. They discovered a negative correlation between CO₂ emissions and the ECI, indicating that ECI levels over a specific threshold result in decreased CO₂ pollution. Using panel quantile regression, [22] examined 55 countries’ ECI and CO₂ emissions from 1971 to 2014. The findings of this study provide credence to the EKC. There is a strong negative correlation between economic complexity and environmental consequences throughout the study period. Despite successful CO2 emission reductions in high-income nations, the study found that lower- and middle-income economies have worsened environmental deterioration because of economic complexities.
To examine the correlation between economic complexity and environmental quality, [23] used panel data techniques to examine data from 27 nations spanning from 1995 to 2017. CO2 emissions, ECI, GDP per capita, density of urban areas, and urban population are some of the variables that are utilized. There is a positive non-linear link between environmental pollution and economic complexity, which turns negative as complexity increases, according to the results. The results show that to solve the problem of economic expansion at the expense of the environment, industrial policy and green innovation need to be given more attention.
Ref. [24] looked at the ten most complicated economies in the world from 1998 to 2017 and how electricity usage and the economic complexity index affected them. A Panel Vector Error Correction Model, Fully Modified Ordinary Least Squares, and Panel Autoregressive Distributed Lag were all employed. In addition to considering environmental impacts, other macroeconomic factors were also considered. Among the sectors examined were trade, real GDP per capita, ECI, power use, environmental impact, and electricity usage. They prove that, over time, the use of electricity added to the carbon footprints. Trade openness and the economic complexity index also contribute to better environmental performance in the long run.
By applying the Fourier Autoregressive Distributed Lag model (ARDL), [25] investigated the impact of Turkey’s economically complex economy on environmental sustainability from 1995 to 2020. The study considered factors including GDP, energy consumption, ECI, and CO2 emissions. Economic complexity in Turkey helps to slow environmental degradation, according to the results, although rising energy use and GDP both contribute to worsening environmental conditions. If Turkey’s economy continues to rely on fossil fuels, it will have a more difficult time reaching its objective of zero net emissions by 2053. The paper recommends that lawmakers widen energy, environmental, and economic policies by providing financial incentives and technical assistance programs to encourage green technology research and information sharing. Additionally, the government can decide to impose stringent environmental regulations.
2.3. Energy Consumption and Environmental Pollution
Ref. [26] used the ARDL Method to examine the impact of trade, non-renewable energy (non-RE) and renewable energy (RE) use on environmental deterioration using data collected from Turkey during the period from 1965 to 2016. GDP, use of RE, trade openness, and utilization of non-RE energy sources were included in the study. The research shows that emissions have increased over time due to trade and non-renewable energy consumption, even while renewable energy adoption reduces emissions in the short and long terms. Both the short-term effects of trading and the longer-term effects of using non-RE energy sources were linked to increased carbon dioxide emissions. The research recommends strengthening current laws, creating new rules and incentives to encourage the use of hydropower, and boosting the adoption of renewable energy sources to reduce pollution.
Using ARDL analysis, [27] looked at the correlation between pollution levels from 1971 to 2017 and factors like energy (aggregated and disaggregated), economic growth, urbanization, and political institutional quality. It covers topics such as energy consumption, the quality of political institutions, the number of people living in urban areas, emissions of carbon dioxide gas, net generation of nuclear power, renewable energy, and fossil fuel energy. The results show that a country’s ability to handle the economic, social, and governance impacts of climate change is highly dependent on its well-functioning political institutions. According to the report, the government should try to foster a political climate that is supportive of employing clean, modernized energy sources and push for decarburization regulations if they want to improve environmental quality. While studying the 28 countries with the utmost economic choice from 1996 to 2017, [28] took several factors into account, including financial development, environmental degradation, innovation, economic independence, and real GDP per capita. The researchers found that using RE was associated with innovation and conservation of natural resources favorably, and with economic freedom and real GDP per capita adversely, using ARDL panel autoregressive distributed lag and panel unit tests. A concerning trend that the paper highlights is the decreasing usage of renewable energy sources as economies develop. As a result, the study emphasizes that the sample group should focus on strengthening methods that promote renewable energy efforts if they want to keep their economies vibrant in the long run.
Using the dynamic common correlated effect model, [29] investigated the relationship between renewable energy use in the Nordic countries, worldwide commerce, and environmental quality from 2001 to 2018. Environmental management, regulatory pressure, renewable energy, trade openness, and carbon emissions were all factors in the investigation. The study’s favourable correlations between renewable energy, international trade, and environmental quality lend credence to the idea that governments should prioritize renewable energy development for the sake of both the economy and the environment, both in the near and far future. A study conducted by [30] using Quantile Autoregressive Distributed Lag data from 1980 to 2018 found that environmental deterioration in Pakistan has decreased due to renewable energy, technological innovation, and globalization. Innovation in technology, renewable energy, GDP, carbon emissions, and globalization were all vital. There is a negative correlation between renewable energy, technological progress, and environmental effects in the study. According to the research, renewable energy and technology should be Pakistan’s top priorities for both the environment and the economy. Based on the factors mentioned before, this study proposes:
Null Hypothesis (H0):
Economic complexity and energy consumption do not influence CO2 emissions in Malaysia.
Alternative hypothesis (Ha):
Economic complexity and energy consumption do have a crucial influence on CO2 emissions in Malaysia.
3. Data, Empirical Model, and Estimation Methodology Data
3.1. Data
For the years 1995–2021, CO₂ emissions in Malaysia (in metric tons per capita) are utilized as the dependent variable. We include energy consumption per capita (kilogram of oil equivalent per capita), economic complexity index, GDP per capita (in constant $ prices) and squared real GDP per head (in constant 2010 $ prices) as independent variables in our regressions. The logarithmic form is used for all these variables, and all relevant annual data collected from the World Bank’s World Development Indicators (WDI). For the economic complexity index, [6] drew their data from the Atlas of Economic Complexity database.
3.2. Empirical Model and Estimation Methodology
This article employs a popular EKC model, which includes GDP, GDP squared, and energy consumption (EC) as factors influencing the level of CO2 emissions [21]. This article suggests that ECI also could play a crucial role in determining CO2 emissions, in addition to GDP and energy usage. Hence, the empirical model for the EKC hypothesis can be expressed as:
The function in Equation (1) can be written in the following logarithmic form:
In Equation (2), is the emissions in log form at time t; and are the log forms of GDP and square root of GDP at time t, is the log form of energy consumption at time t and is the log form of economic complexity index at time t. Lastly, represents the error term. Following the EKC theory, it is hypothesized that and . In addition, EC is positively correlated with increases in CO2 emissions [31]. On the other hand, when the economic complexity of industrialized nations like Malaysia increases, their export baskets become more complex, leading to a decline in CO2 emissions. Hence, it is also hypothesized that β4 >0 and .
The unit root testing was done to check whether the variables were stationary or not. No matter if the data was integrated at I (0) or I(1), we used ADF and PP unit root tests to evaluate the stationarity characteristics of all the variables. Cointegration testing must be conducted before the "ARDL" technique is used to guarantee that the variables under this study have a long-run relationship. First, we need to show that the variables in Equation (2) are linked over the long run using the "ARDL bounds test". The ARDL F-bounds test’s null hypothesis is that no variables cointegrate. The alternative hypothesis, on the other hand, defines the presence of cointegration. If the F-statistic is greater than the critical values, the long-run association might be established. There can be no long-term link between the variables if the lower limit value is greater than the expected F-statistics. According to [32], if the computed F-statistics fall somewhere in the middle of the upper and lower bounds, then the conclusion cannot be drawn with certainty.” To assess the long-term relationship between the given variables, the following ARDL bounds test equation is given, which is based on the cointegration assumptions:
The dependent variable must have a precisely integrated order of 1 and cointegration among the variables must be established using bound testing for this methodology to be successfully applied. Alternatively, the remaining series can display a combination of 0 and 1 integrating orders [33]. If it is proved that there is long-run relationship between the variables, an error correction model will be applied, and it is as follows.
where ECT is an error correction term and δ is its coefficient. The rate at which the dependent variable regains its initial equilibrium after a shock to the system is shown by this coefficient. This research also uses a battery of diagnostic tests. For instance, the normality of the residual is checked using the "Jarque-Bera test" and serial correlation using the "Breusch-Godfrey Lagrange Multiplier (LM)" test. By utilizing the "Breusch-Pagan-Godfrey" tests, heteroscedasticity was identified. The stability of the model was evaluated using the "Ramsey reset" test at the end to see if it was adequate.
4. Results and Discussion
Table 1 displays the results of the descriptive statistics and the correlation matrices. The findings show that, owing to its small standard deviation, GDP exhibits the least amount of variability across all data points when contrasted with the other variables. Among all data indicators, GDP2 demonstrates the biggest volatility due to its significant standard deviation. Examining skewness and kurtosis further confirms that the variables do not adhere to a normal distribution. In addition, the results reveal that CO2 exhibits slightly negative skewness and ECI exhibits a moderate skewness, whereas GDP, GDP2 and CE exhibit positive skewness. According to the correlation matrices in Table 1, multicollinearity is not an issue. Meeting this criterion is necessary to proceed with the regression analysis.
The results of the ADF and PP unit root tests are shown in Table 2; which indicates that all the selected variables are non-stationary at level except lnCO2 and lnECI. It is observed that lnGDP; lnGDP2 and lnEC display stationarity with an integration degree (I) of 1 after the initial discrepancies. We can now move forward with implementing the ARDL regression model. Verifying the existence of a long-term link between the dependent and explanatory variables is crucial before proceeding to the last phase of ARDL method implementation. To identify long-run cointegration; the ARDL bounds testing method is employed [32]. The outcomes of the co-integration analysis are displayed in Table 3. The value of F statistics is significant at 1% level of significance; which confirms the long-run cointegration of CO2; GDP; GDP2; ECI; and EC.
The results of the ARDL model, which show interesting trends, are presented in Table 4. More specifically, the coefficient of GDP is positive and statistically significant at a 1% level of significance in both the long and short run. The coefficient of per capita GDP square is negative and statistically significant at a 1% level of significance in both the short and long run. Hence, the result of the study supports the EKC theory in Malaysia during the study period. The results of this study are in line with those of [34,35,36], all of which have confirmed the EKC theory in Malaysia during their study period. Furthermore, in line with the guiding principles of the EKC theory, Malaysia’s economic growth strategy prioritizes sustainability, allowing the country to work towards cleaner growth goals.
The findings of the ARDL model also indicate that EC causes a 0.98% increase in CO2 in the long run and a 0.43% increase in CO2 in the short run, demonstrating a positive relationship between carbon emissions and EC. Also, the coefficient of ECI is discovered to be positive and statistically significant, indicating that a 1% rise in ECI increases CO2 by 0.18% in the short run and 0.22% in the long run. In addition to that both coefficients for EC and ECI are inelastic. The finding that the coefficient of energy consumption is inelastic concerning CO₂ emissions, for instance, may imply that a rise in energy consumption may result in a less proportional increase in CO₂ emissions. In a similar vein, an inelastic coefficient for ECI suggests that CO₂ emissions rise at a slower rate than ECI itself as the system gets more complicated. Understanding inelastic coefficients is critical for policymakers as they reveal the degree to which variables respond to changes in other variables. In this instance, it implies that lowering CO2 emissions might necessitate more substantial actions than just making the economy more complicated or cutting energy usage.
Some analyses also show a positive association between economic complexity and environmental degradation. In their analysis of 55 countries divided into three incomes (high, middle, and lower middle). [22] found that economic complexity deteriorates the environment. Among EU member states with low or medium incomes, a comparable pattern was noted by [37]. As nations reorganize their production systems in pursuit of industrialization, these results imply that environmental quality may decrease throughout the early to middle stages of development. In contrast, [21] found that higher-quality manufactured items could be environmentally beneficial. With R2 and adjusted R2 values of 0.997 and 0.9973, respectively, the ARDL model demonstrates a high level of fitness. It means that changes in the dependent variable account for 99% of the variance in the independent variables. A negative coefficient of about 0.67% suggests a correction in reaction to shocks from the previous year, and ECT was also statistically significant at the 1% level.
Several diagnostic checks, including the cointegration test, are carried out in this study to assess the model’s performance. Diagnostic tests are executed utilizing the log transformation of the time series data shown in Table 4 to investigate the estimates’ accuracy. The results of the Lagrange multiplier test suggest that the data are unconnected due to the lack of serial correlation. Jarque-Bera finds that the series followed a normal distribution, while Breusch-Pagan-Godfrey finds no evidence of regression errors in their test of heteroscedasticity. In addition, there are not any specification errors in the regression, according to the Ramsey RESET test. Consequently, the model did not contain any instances of improper specification. The logarithmic version of the variables contained time series data that does not exhibit serial correlation or heteroscedasticity, according to the diagnostic tests. Since the residual followed a normal distribution, the stability test was successful in passing the model. The model’s representation of a linear relationship was also statistically significant, as shown by the fact that the F-statistical probability was 0.0000. In addition, the CUSUM and CUSUMSQ tests were utilized in this investigation to ascertain the presence of a stable link over an extended duration. The regression coefficients and residuals were examined using those tests. At the 5% level of significance, the blue line is inside the red lines in Figure 5 and Figure 6, which shows that the parameters of the models were stable.
5. Policy Implications
This article confirms the EKC theory by showing that GDP, EC, and ECI are important factors influencing emissions in Malaysia. With a bigger coefficient than all other variables combined, GDP stands out as the one most impacting CO2 emissions. The data shows that CO₂ emissions rise in direct proportion to GDP, reach the maximum point, and then decline over the long run, forming an inverted U-shaped GDP as the output variable. Energy consumption and CO₂ emissions are positively correlated with one another over time, which is consistent with other earlier studies in Malaysia [38,39]. In addition, the study uncovered an unrecorded occurrence in the literature: increasing CO2 emissions in Malaysia over the long run are a result of increased economic complexity, as seen in the export basket’s inclusion of more sophisticated commodities. This research provides evidence for using past levels of ECI, per capita energy use, and per capita income to predict future CO₂ emissions.
The results of this study have significant environmental policy implications for CO2 reduction. First, the EKC theory was confirmed in Malaysia from 1997 to 2020. The quick economic shift from an agricultural to a service and manufacturing sector has improved the country’s standard of life, consumption, and per capita income. EKC theory suggests that early development can promote pollution and environmental degradation. Malaysia has enacted environmental laws to address these issues. Nature protection, pollution control technology investments, and stricter environmental legislation are examples. Malaysia’s booming income will increasingly go towards environmental conservation, improving future air and water quality. Technical advances are vital. With its recent investments in renewable energy and better technology, Malaysia can lessen its environmental effects. These technologies will become more accessible and affordable, encouraging industries to adopt greener manufacturing techniques and reduce pollution.
This structural adjustment could improve environmental quality by redirecting economic focus from resource-intensive sectors. Being a party to both the Paris Agreement and the UN Environment Program puts pressure on Malaysia to do something about the environment. There may be outside pressure on government authorities to do something about pollution and climate change. Furthermore, given Malaysia’s reliance on energy imports, the country’s government should prioritise renewable energy. Possible benefits include tax incentives and investments in renewable energy technology. Although Malaysia has been working to diversify its energy mix, the bulk of its electricity still originates from coal and natural gas. The utilization of these fuels results in increased energy consumption and carbon dioxide emissions. Coal and natural gas are the primary fuels for Malaysia’s power generation.
Despite the increased usage of natural gas as a power plant fuel, coal-fired power plants continue to play an important role, especially during peak demand periods. Fossil fuel combustion increases emissions of greenhouse gases due to the release of carbon dioxide into the environment. In 2021, renewable energy sources accounted for a significantly smaller percentage of Malaysia’s total energy consumption (4%), according to the World Bank’s 2020 report. There is an immediate need for the government of Malaysia to address the environmental impacts of fossil fuel consumption by prioritizing energy efficiency and the transition to renewable energy sources. The use of renewable energy sources and state-of-the-art energy-saving technologies might be part of the solution to diversify the energy mix and lessen dependence on fossil fuels. The third point is that research shows that CO₂ emissions in Malaysia are much higher in economically complex economies. According to [6], the ECI outperforms the more conventional measures of governance, human capital, and competitiveness when it comes to predicting rising income per capita.
In addition, the empirical data demonstrate that the ECI is vital for the management of environmental toxins in Malaysia. A total of RM593.5 billion, or 38.3% of Malaysia’s exports in 2022, were E&E items. A lot of energy is typically consumed during the manufacturing processes of electronic components and gadgets, which include smelting, refining, and chemical synthesis. Carbon dioxide is released into the atmosphere because of the combustion of fossil fuels, such as coal or natural gas, which provide enormous amounts of power for these operations. To produce heat and power, many electric and electronic industrial operations rely on fossil fuels. If fossil fuels are used as a backup or when demand is strong, carbon dioxide emissions could still happen even if some of the energy comes from renewable sources. To make electrical devices, it is usual to use components sourced from all over the globe, linking them to intricate global supply chains. There can be significant emissions from the transportation of raw materials, components, and finished goods, especially when these items are transported over great distances in vehicles or ships powered by fossil fuels.
Malaysia may promote greener manufacturing practices and technologies to reduce their environmental impact. The implementation and enforcement of stringent environmental laws is another way to guarantee compliance with pollution control standards. To further mitigate the effects of overexploitation, the government might promote long-term plans for managing natural resources. Businesses in Malaysia that deal primarily in exports, such as electronics and palm oil, may be contributing to climate change, deforestation, and biodiversity loss. Hence, Malaysia may promote sustainable sourcing practices in supply chains to reduce societal and environmental impacts. They might impose stricter regulations and certification programs to ensure the ethical sourcing and distribution of goods like palm oil.
6. Conclusion
Among the most critical problems facing the globe today is climate change, and the severity of environmental deterioration is strongly related to it. The amount of CO2 emissions is the gold standard for evaluating environmental measures for their impact on global warming. To that end, ECI is added to our research to determine what factors contribute to environmental degradation. Therefore, this article aims to evaluate the legitimacy of the EKC theory by surveying data from 1997 to 2020 in Malaysia. Here again, energy consumption is taken into consideration by the empirical models. The article’s conclusions are as follows. When it comes to Malaysia, the EKC theory is valid. Energy use increases carbon dioxide emissions, according to the second discovery. The third finding—that increasing economic complexity is linked to higher levels of CO₂ emissions over the long term—is our paper’s distinctive contribution to the research area related to EKC theory. It can be concluded that growing economic complexity is a plausible indicator of increasing CO2 emissions. Using time series analysis, researchers can examine several developed and emerging economies such as MENA, OPEC, OECD, and N11 to see how economic complexity impacts CO₂ emissions.
Author Contributions
Conceptualization, R.A, and M.M.; methodology, R.A M.S.; software, R.A.; validation, H.A. and M.S.; formal analysis, MM&M.S.; investigation, R.A and M.M; resources, YM. and H.A.; data curation, R.A., MB and M.M.; writing—original draft preparation, R.A, YM; writing—review and editing, M.S and H.A.; visualization, R.A and H.A.; funding acquisition, H.A. All authors have read and agreed to the published version of the manuscript.
Funding
This research was funded by Princess Nourah bint Abdulrahman University Researchers Supporting Project number (PNURSP2024R548), Princess Nourah bint Abdulrahman University, Riyadh, Saudi Arabia.
Institutional Review Board Statement
Not applicable.
Informed Consent Statement
Not applicable.
Data Availability Statement
The data that support the findings of this study are openly available on request and was downloaded from https://databank.worldbank.org/source/world-developmentindicators.
Conflicts of Interest
The authors declare that they have no known competing financial interests or personal relationships that could have appeared to influence the work reported in this paper. The authors declare that they have no conflict of interest.
References
- Hatmanu, M., Cautisanu, C., & Iacobuta, A. O. On the relationships between CO2 emissions and their determinants in Romania and Bulgaria. An ARDL approach. Applied Economics 2022, 54, 2582–2595.
- Bölük, G., & Mert, M. Fossil & renewable energy consumption, GHGs (greenhouse gases) and economic growth: Evidence from a panel of EU (European Union) countries. Energy 2014, 74, 439–446.
- Saboori, B., & Sulaiman, J. (2013). CO2 emissions, energy consumption and economic growth in Association of Southeast Asian Nations (ASEAN) countries: A cointegration approach. Energy, 55, 813-822.
- Grossman, G. M., & Krueger, A. B. (1991). Environmental impacts of a North American free trade agreement.
- Panayotou, T. (1993). Empirical tests and policy analysis of environmental degradation at different stages of economic development.
- Hausmann, R., C. A. Hidalgo, C., Bustos, A., Coscia, M., Chung, S., Jimenez, J., . . . Yildirim, M. (2011). The Atlas of Economic Complexity. Cambridge: Puritan Press.
- Swart, J., & Brinkmann, L. (2020). Economic complexity and the environment: evidence from Brazil. In Universities and sustainable communities: meeting the goals of the agenda 2030 (pp. 3-45). Springer International Publishing.
- Shin et al. in 2013.
- Dickey, D. A., & Fuller, W. A. Distribution of the estimators for autoregressive time series with a unit root. Journal of the American statistical association 1979, 74, 427–431.
- Phillips, P. C., & Perron, P. Testing for a unit root in time series regression. Biometrika 1988, 75, 335–346.
- Jiang, Y., Tian, S., Xu, Z., Gao, L., Xiao, L., Chen, S., ... & Shi, Z. (2022). Decoupling environmental impact from economic growth to achieve Sustainable Development Goals in China. Journal of Environmental Management, 312, 114978.
- Bissoon, O. (2018). A modified EKC for sustainability assessment in Sub-Saharan Africa: a panel data analysis. Икoнoмическа мисъл, (2), 69-83.
- Kuznets, S. (1955). International differences in capital formation and financing. In Capital formation and economic growth (pp. 19-111). Princeton University Press.
- Madaleno, M. Madaleno, M., & Moutinho, V. (2021). Analysis of the new kuznets relationship: Considering emissions of carbon, methanol, and nitrous oxide greenhouse gases—Evidence from EU countries. International Journal of Environmental Research and Public Health, 18(6), 2907.
- Gyamfi, B. A., Adedoyin, F. F., Bein, M. A., & Bekun, F. V. (2021). Environmental implications of N-shaped environmental Kuznets curve for E7 countries. Environmental Science and Pollution Research, 28, 33072-33082.
- Gokmenoglu, K. K., Olasehinde-Williams, G. O., & Taspinar, N. (2019). Testing the environmental Kuznets curve hypothesis: the role of deforestation. Energy and environmental strategies in the era of globalization, 61-83.
- Aşıcı, A. A. (2013). Economic growth and its impact on environment: A panel data analysis. Ecological indicators, 24, 324-333.
- Htike, M. M., Shrestha, A., & Kakinaka, M. (2021). Investigating whether the environmental Kuznets curve hypothesis holds for sectoral CO 2 emissions: evidence from developed and developing countries. Environment, Development and Sustainability, 1-28.
- Le, H. P., & Ozturk, I. (). The impacts of globalization, financial development, government expenditures, and institutional quality on CO2 emissions in the presence of environmental Kuznets curve. Environmental Science and Pollution Research 2020, 27, 22680–22697.
- Kong, Y., & Khan, R. To examine environmental pollution by economic growth and their impact in an environmental Kuznets curve (EKC) among developed and developing countries. PloS one 2019, 14, e0209532.
- Can, M., & Gozgor, G. The impact of economic complexity on carbon emissions: evidence from France. Environmental Science and Pollution Research 2017, 24, 16364–16370.
- Doğan, B., Saboori, B., & Can, M. (2019). Does economic complexity matter for environmental degradation? An empirical analysis for different stages of development. Environmental Science and Pollution Research, 26(31), 31900-31912.
- Bucher, F., Scheu, L., & Schröpf, B. (2022). Economic complexity and environmental pollution: Evidence from the former socialist (No. 218). BGPE Discussion Paper.
- Satrovic and Adedoyin (2022).
- Kirikkaleli, D., Sofuoğlu, E., Abbasi, K. R., & Addai, K. (2023). Economic complexity and environmental sustainability in eastern European economy: Evidence from novel Fourier approach. Regional Sustainability, 4(4), 349-358.
- Karasoy.A &Akçay.S. (2018). Effects of renewable energy consumption and trade on environmental pollution: The Turkish case. Management of Environmental Quality An International Journal 30(31). [CrossRef]
- Sarkodie, S. A., & Adams, S. (2018). Renewable energy, nuclear energy, and environmental pollution: accounting for political institutional quality in South Africa. Science of the total environment, 643, 1590-1601.
- Assi, A. F., Isiksal, A. Z., & Tursoy, T. Highlighting the connection between financial development and consumption of energy in countries with the highest economic freedom. Energy Policy 2020, 147, 111897.
- Khan, M. K., Khan, M. I., & Rehan, M. (2020). The relationship between energy consumption, economic growth and carbon dioxide emissions in Pakistan. Financial Innovation, 6(1), 1.
- Chien, F., Hsu, C. C., Zhang, Y., Tran, T. D., & Li, L. Assessing the impact of green fiscal policies and energy poverty on energy efficiency. Environmental Science and Pollution Research 2022, 29, 4363–4374.
- Alam, M.B.; Hossain, M.S. Investigating the connections between China’s economic growth, use of renewable energy, and research and development concerning CO2 emissions: An ARDL Bound Test Approach. Technological Forecasting and Social Change 2024, 201, 123220. [Google Scholar] [CrossRef]
- Pesaran, M. H., Shin, Y., & Smith, R. J. Bounds testing approaches to the analysis of level relationships. Journal of applied econometrics 2001, 16, 289–326.
- Jordan and Philips, 2018.
- Sharif, A., Sofuoglu, E., Kocak, S., & Anwar, A. (2024). Can green finance and energy provide a Glimmer of hope towards sustainable environment in the midst of chaos? An evidence from Malaysia. Renewable Energy, 223, 119982.
- Bi, S., Hu, J., Shao, L., Feng, T., & Appolloni, A. (2024). Can public transportation development improve urban air quality? Evidence from China. Urban Climate, 54, 101825.
- Yang, Z., Cai, J., Lu, Y., & Zhang, B. The impact of economic growth, industrial transition, and energy intensity on carbon dioxide emissions in China. Sustainability 2022, 14, 4884.
- Neagu, O., & Teodoru, M. C. The relationship between economic complexity, energy consumption structure and greenhouse gas emission: Heterogeneous panel evidence from the EU countries. Sustainability 2019, 11, 497.
Figure 1.
Energy consumption per capita in Malaysia.
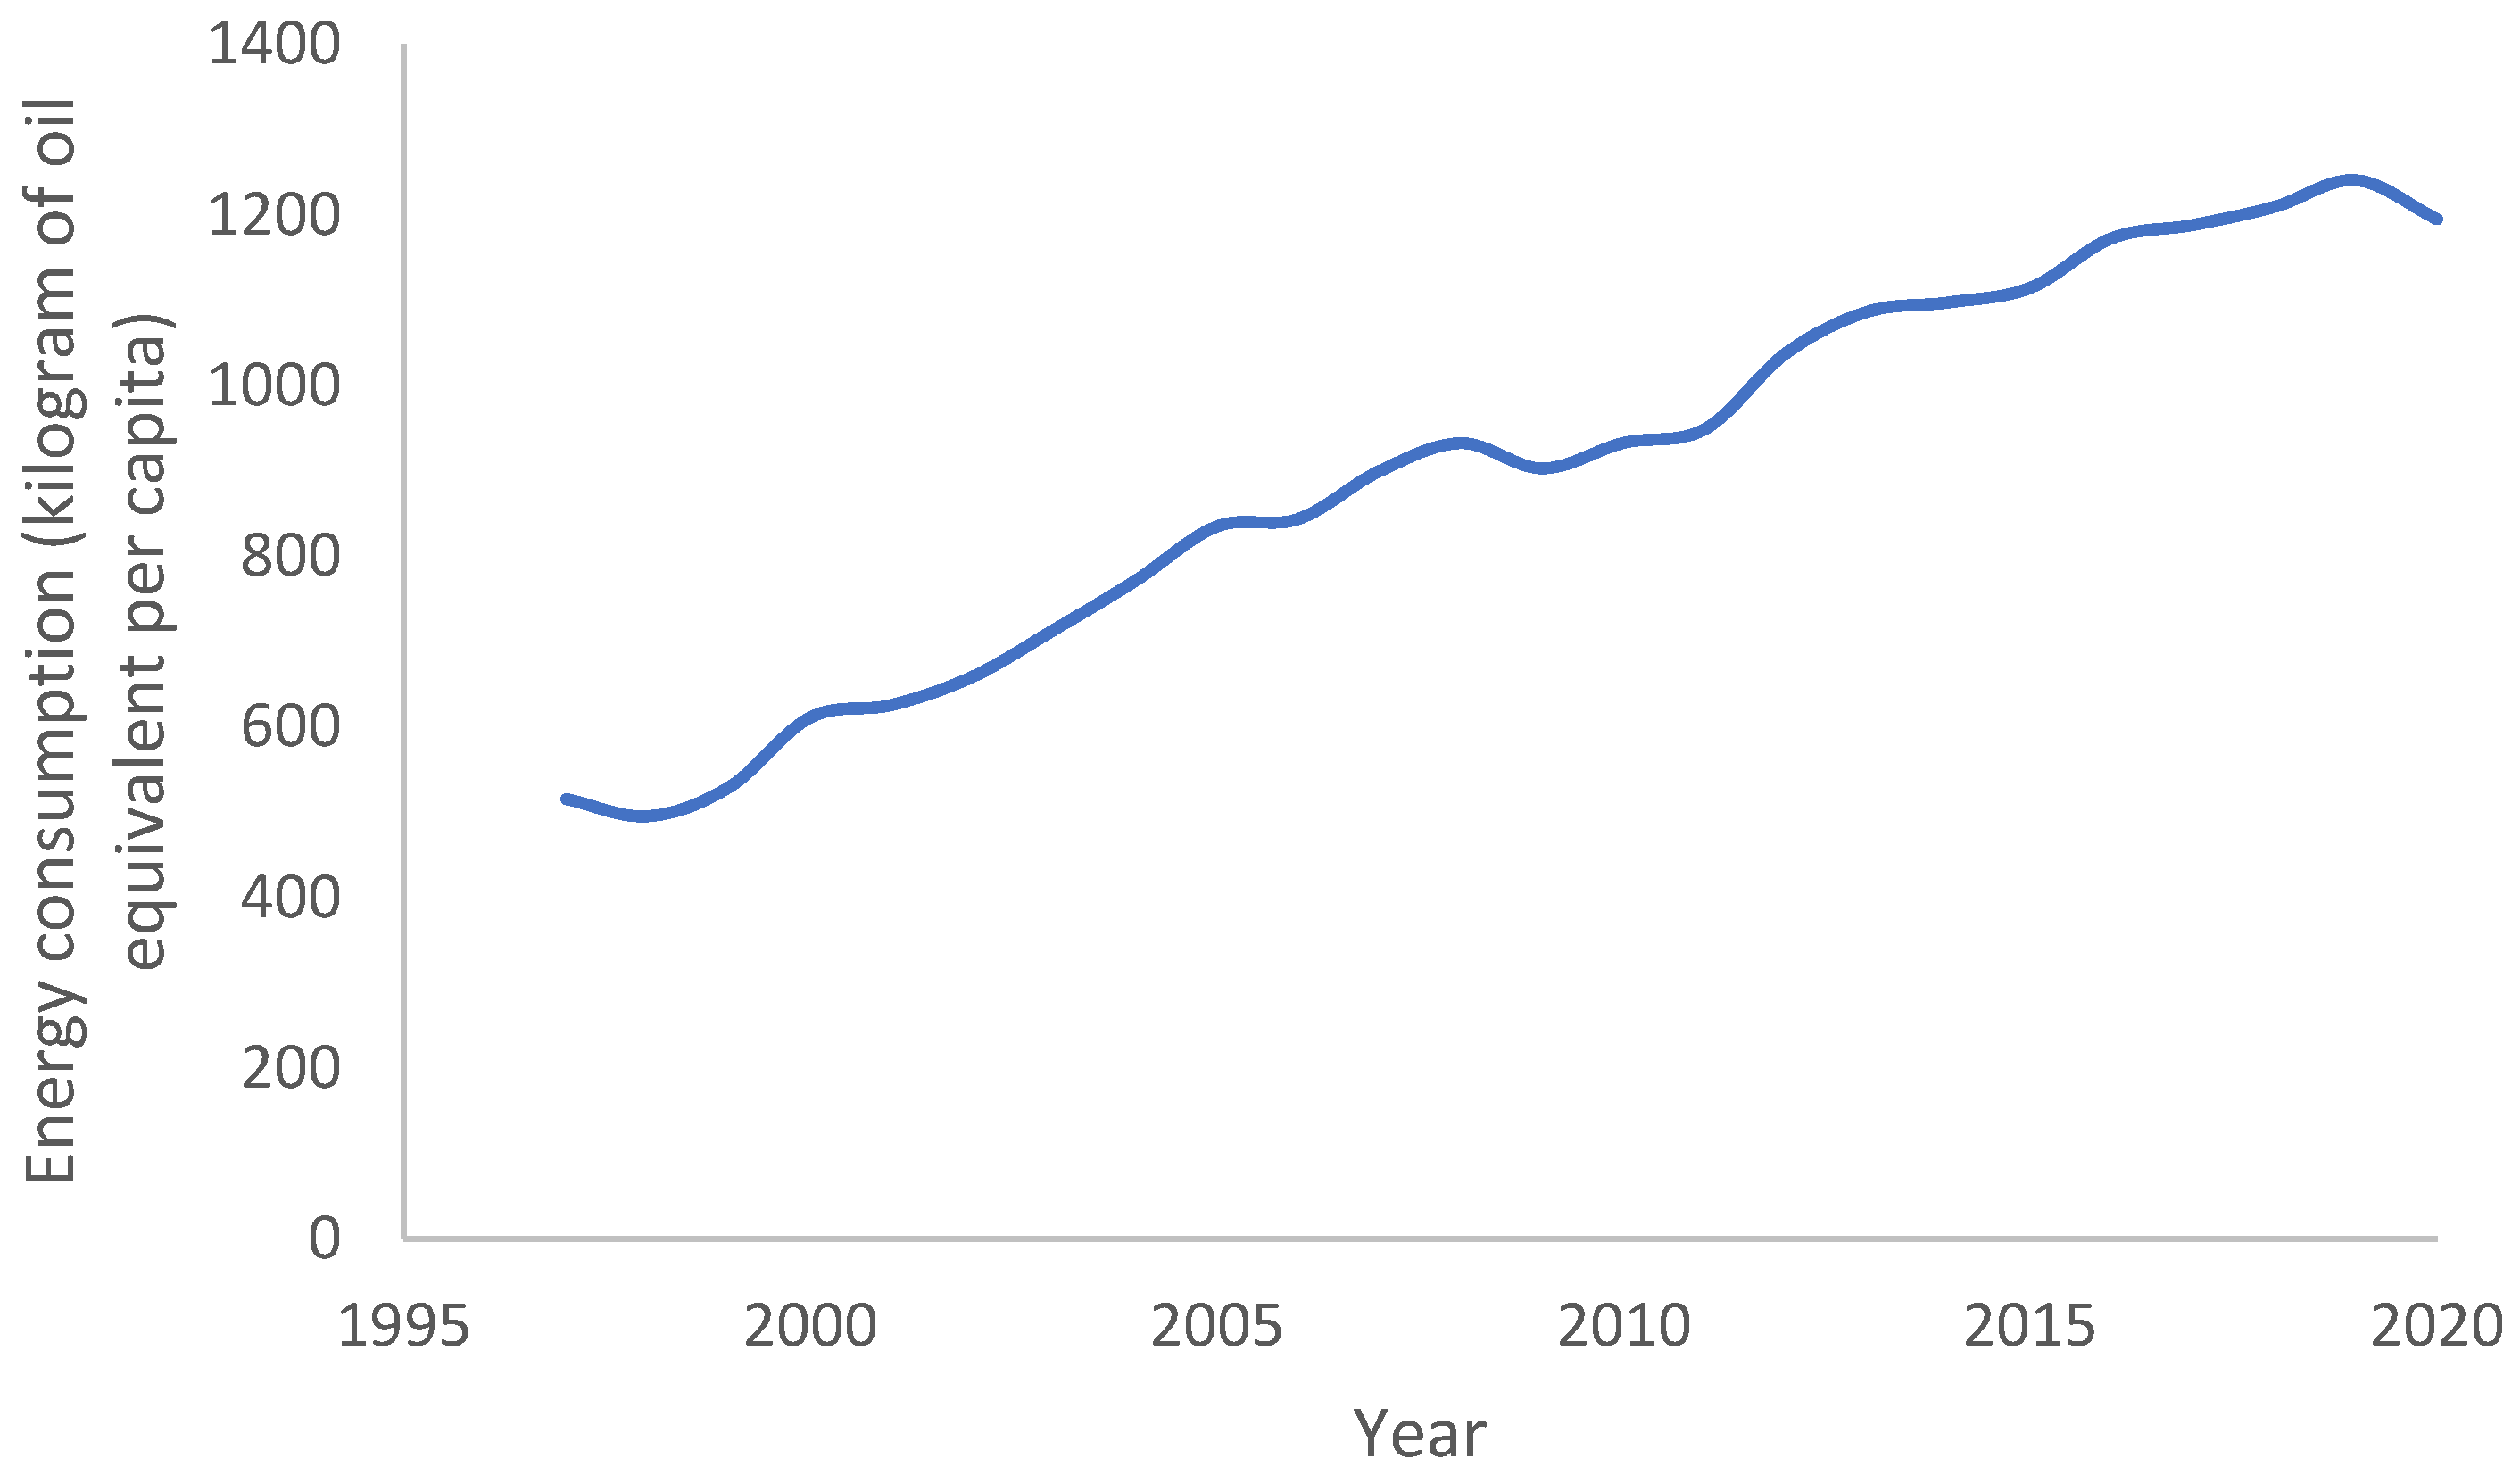
Figure 2.
CO2 emissions per capita in Malaysia.
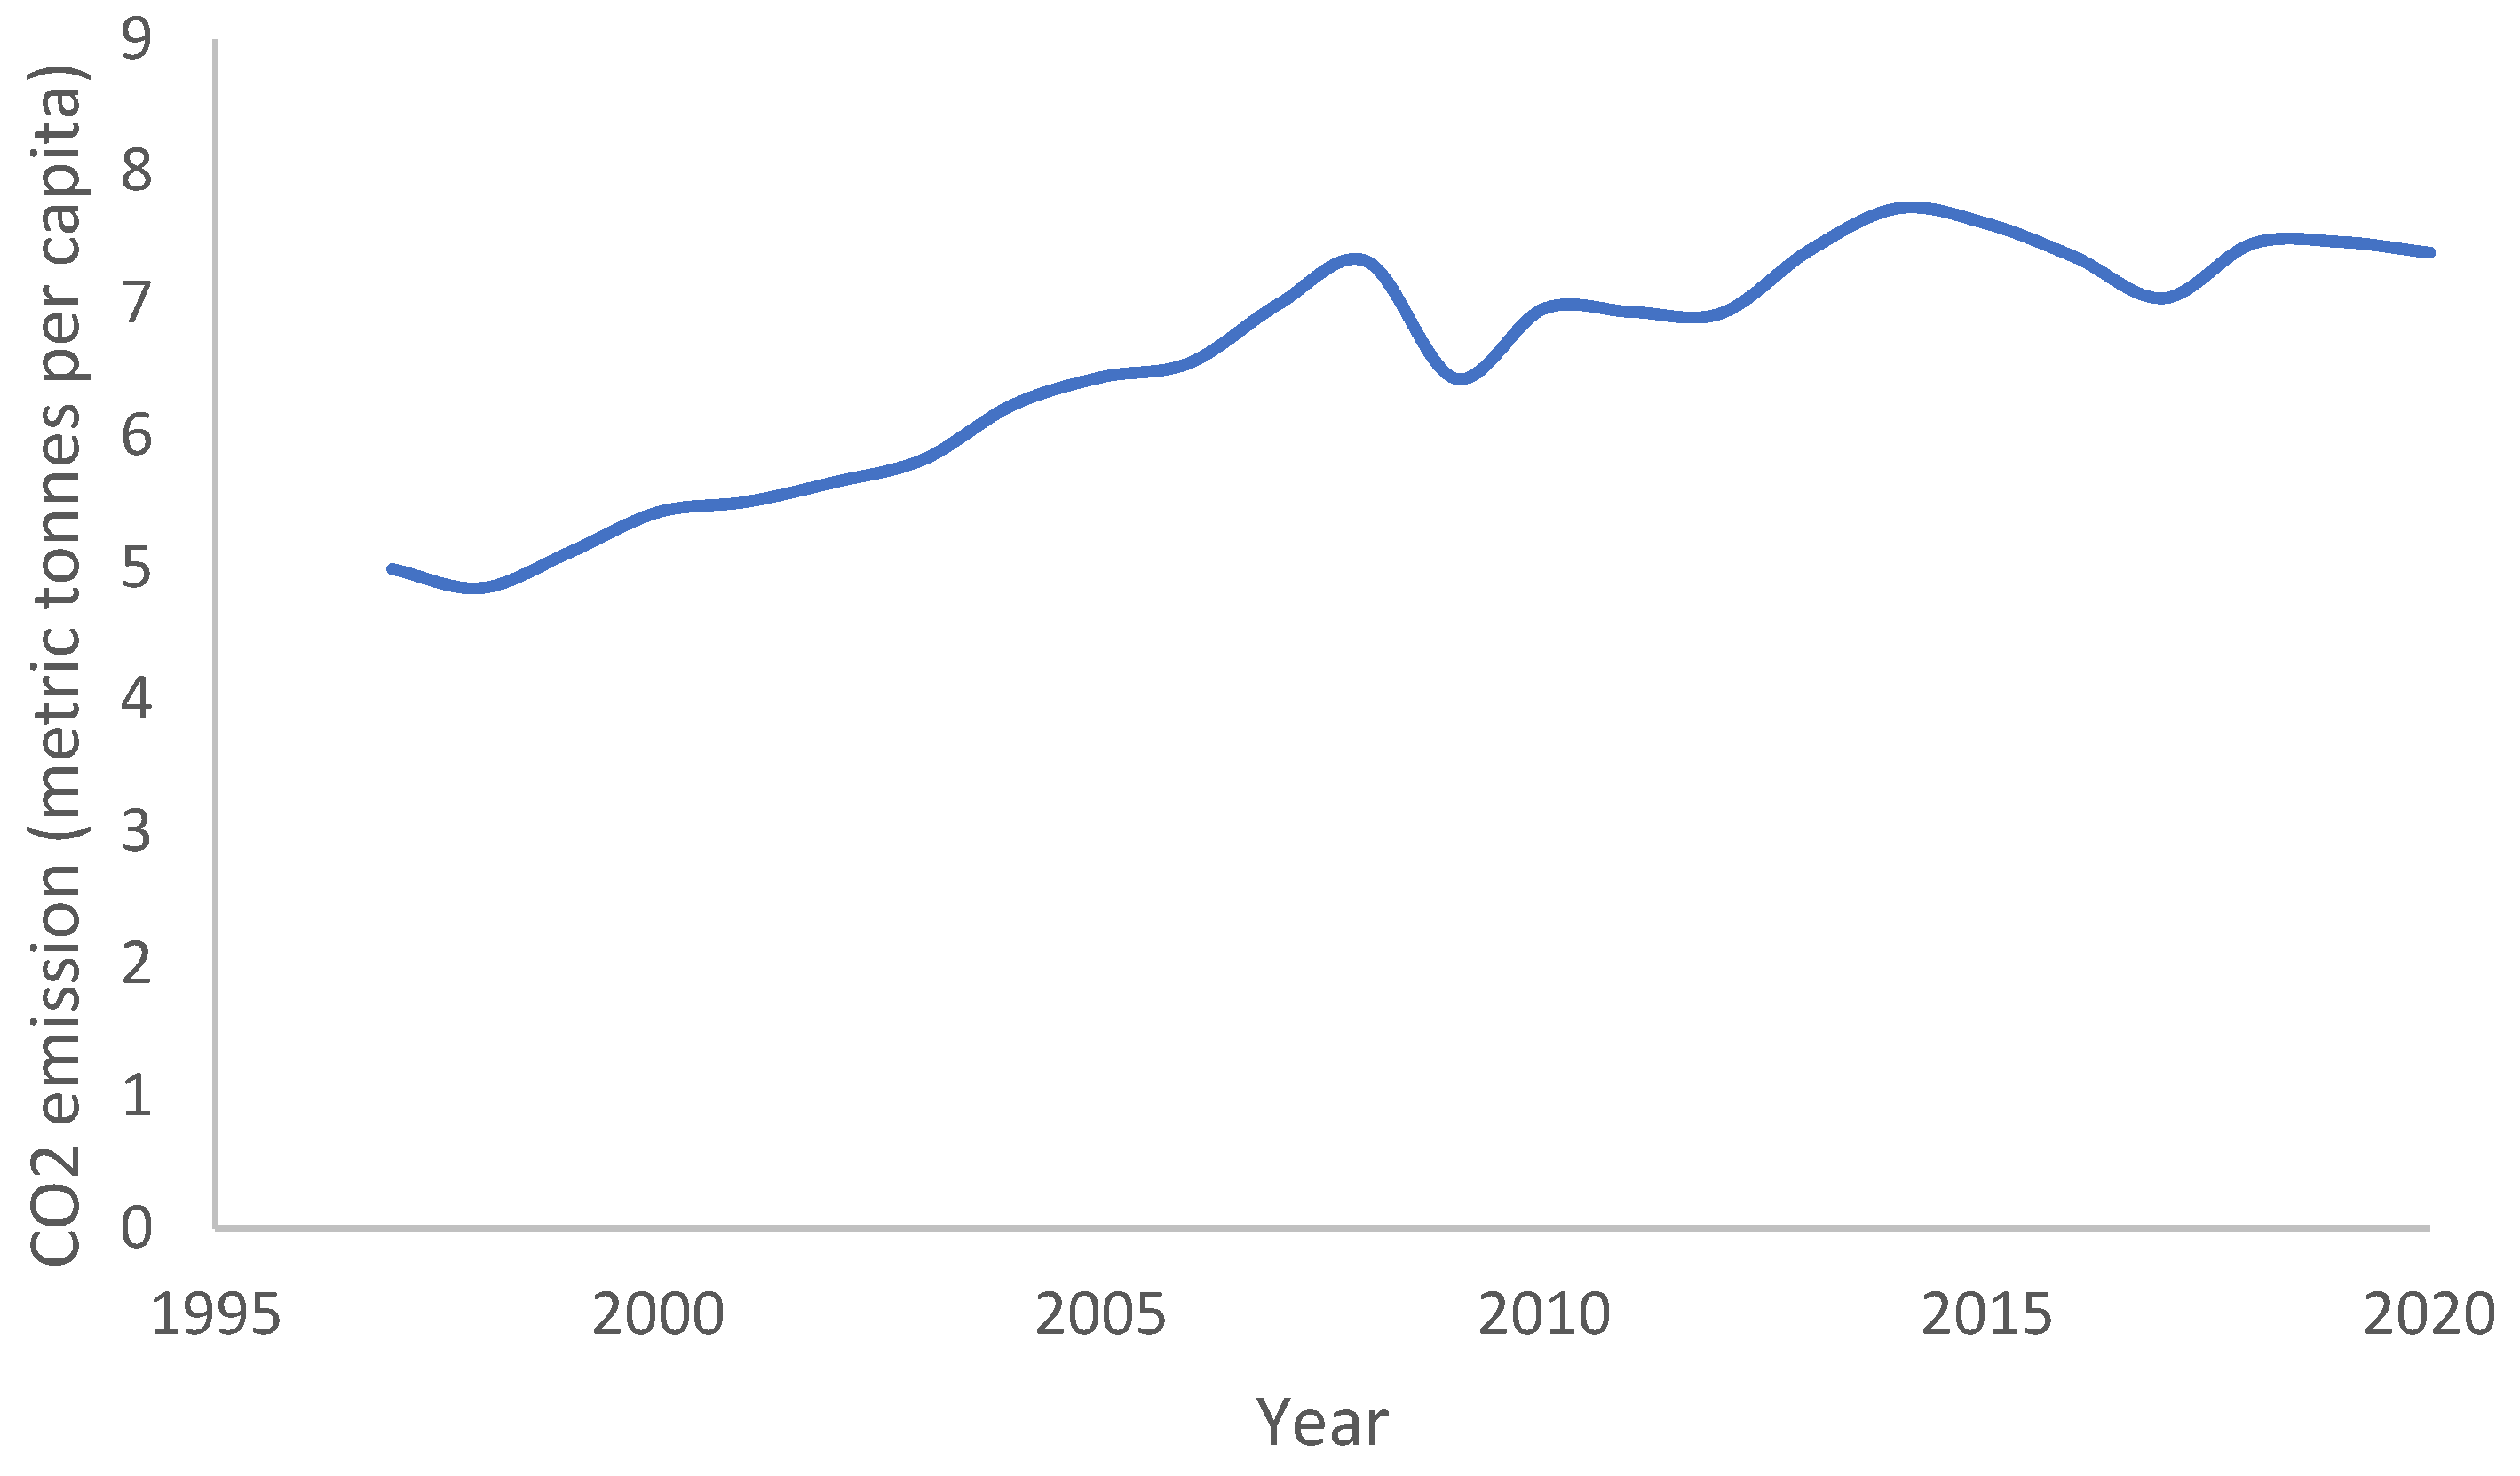
Figure 3.
Fossil Fuel Consumption per Capita in Malaysia.
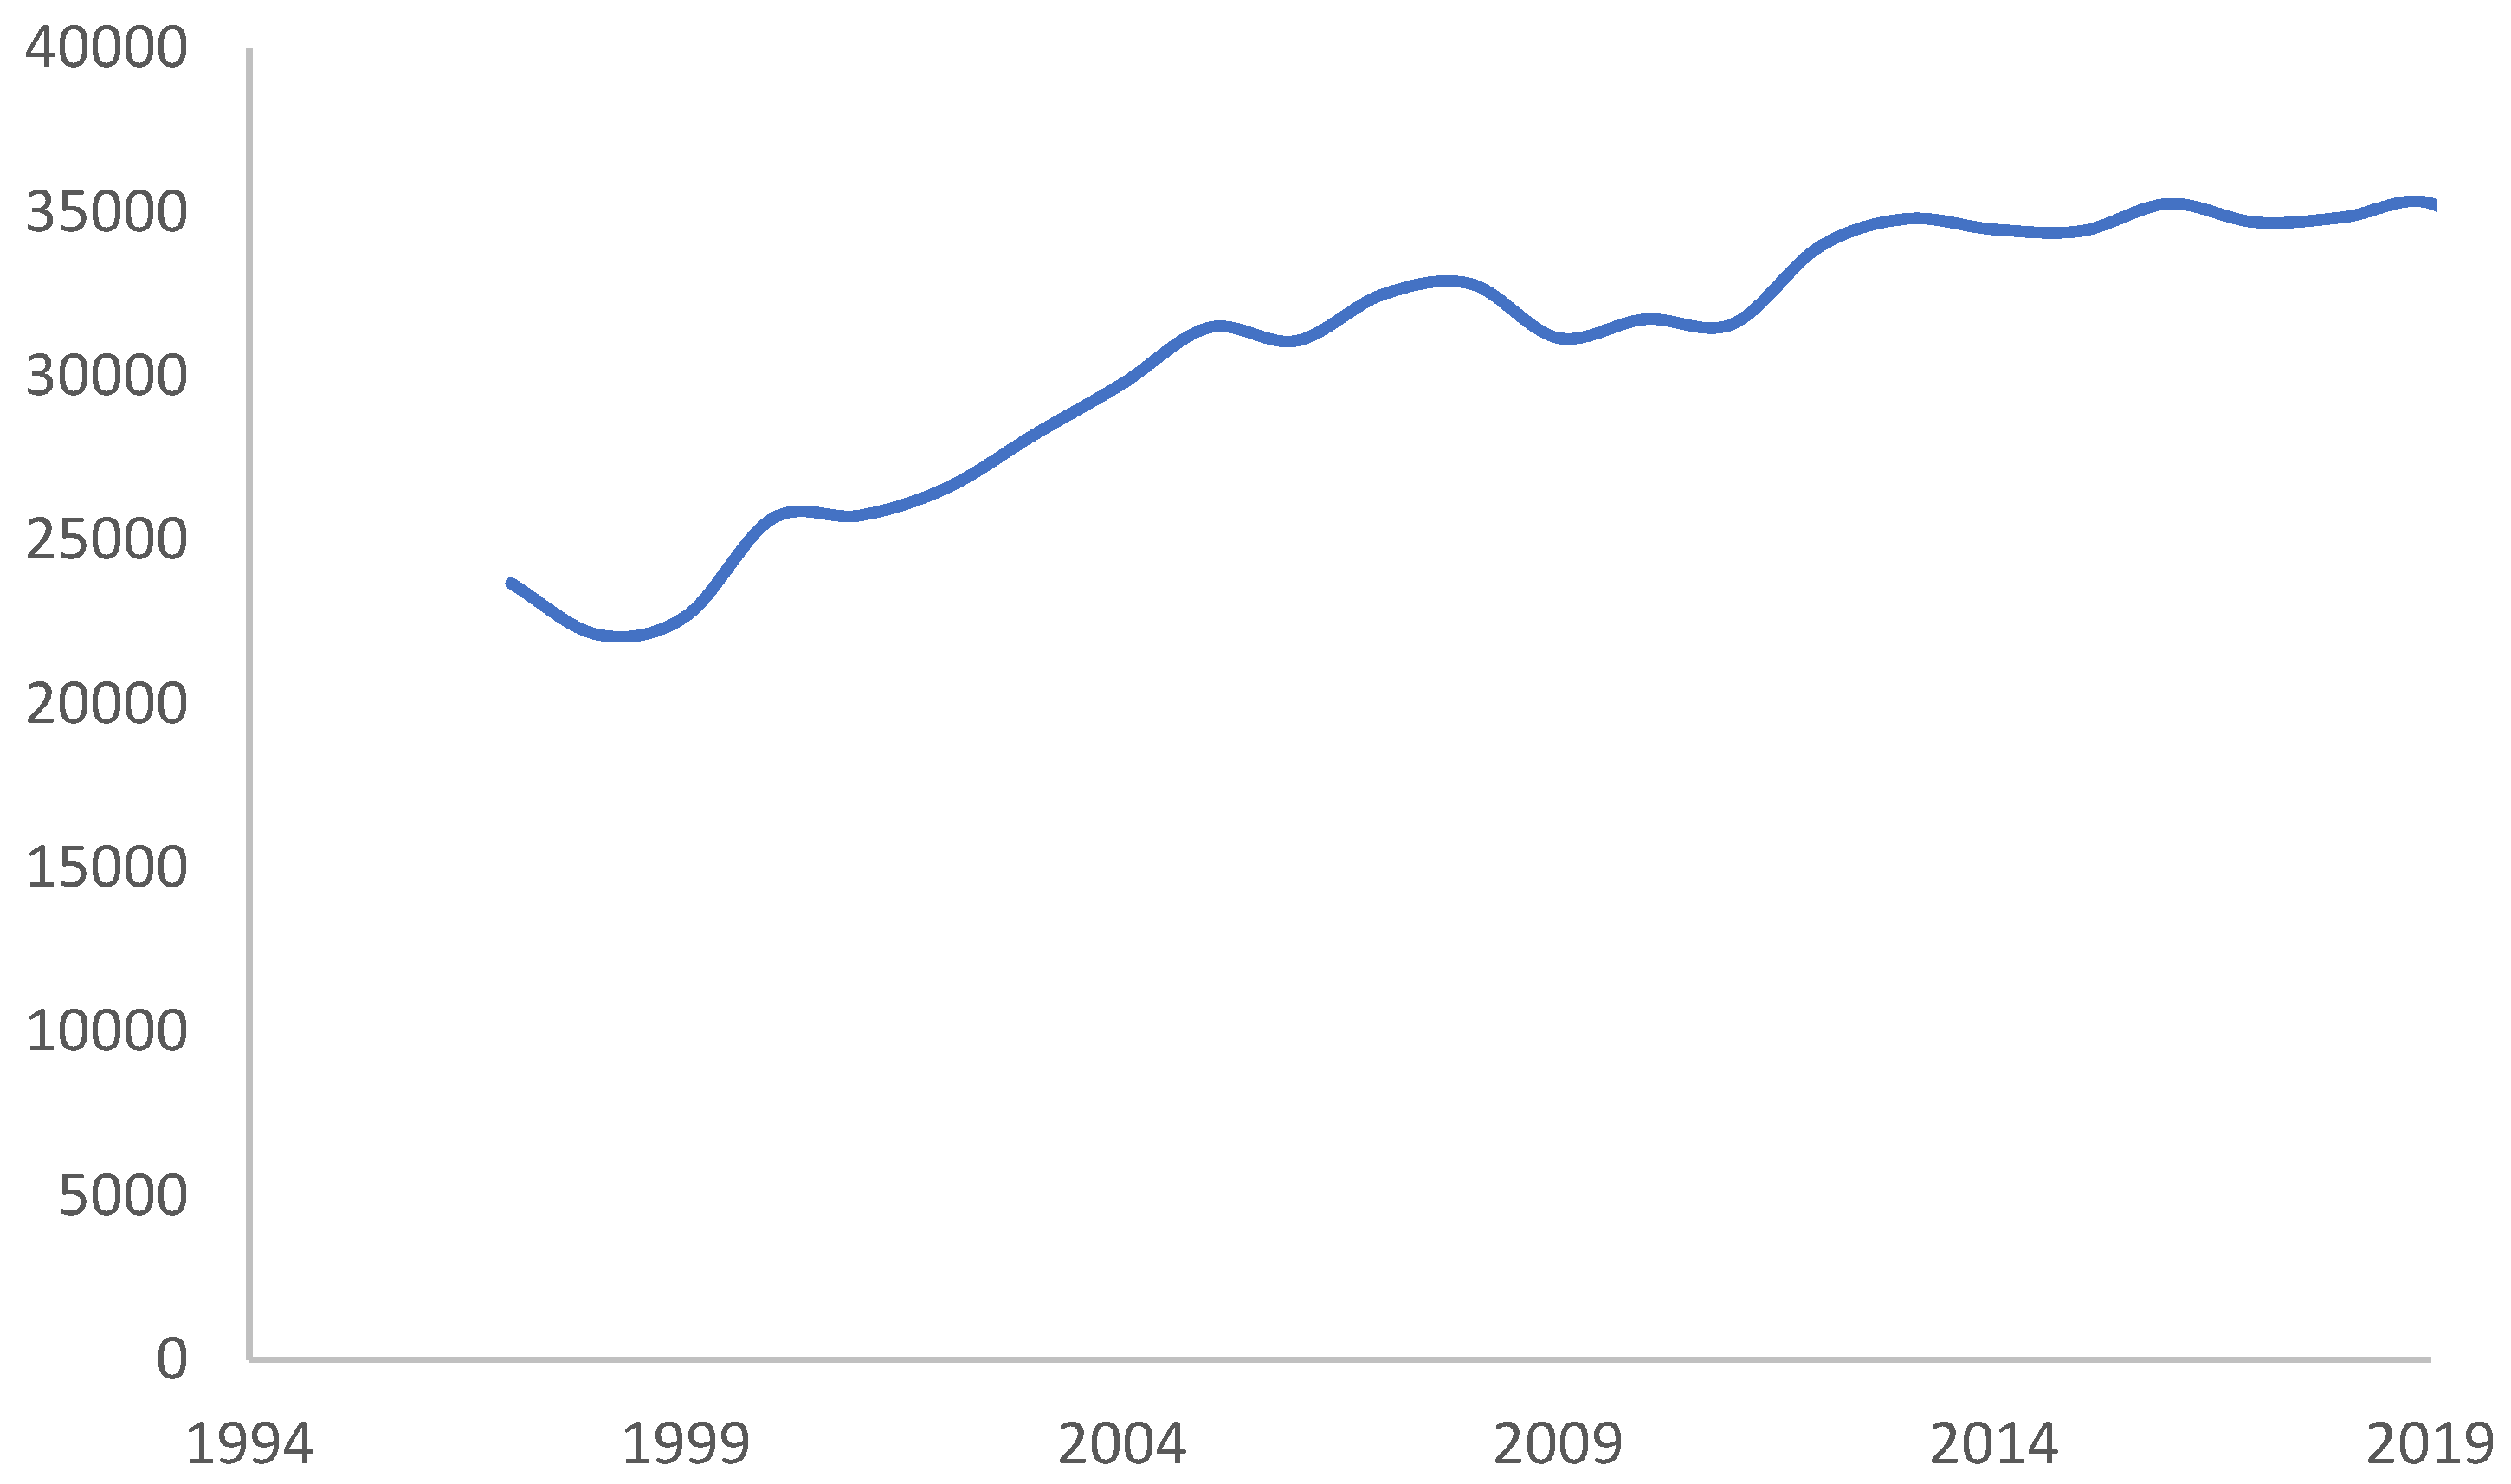
Figure 4.
Total exports in Malaysia in 2022.

Figure 5.
Cumulative sum of recursive residual (CUSUM).
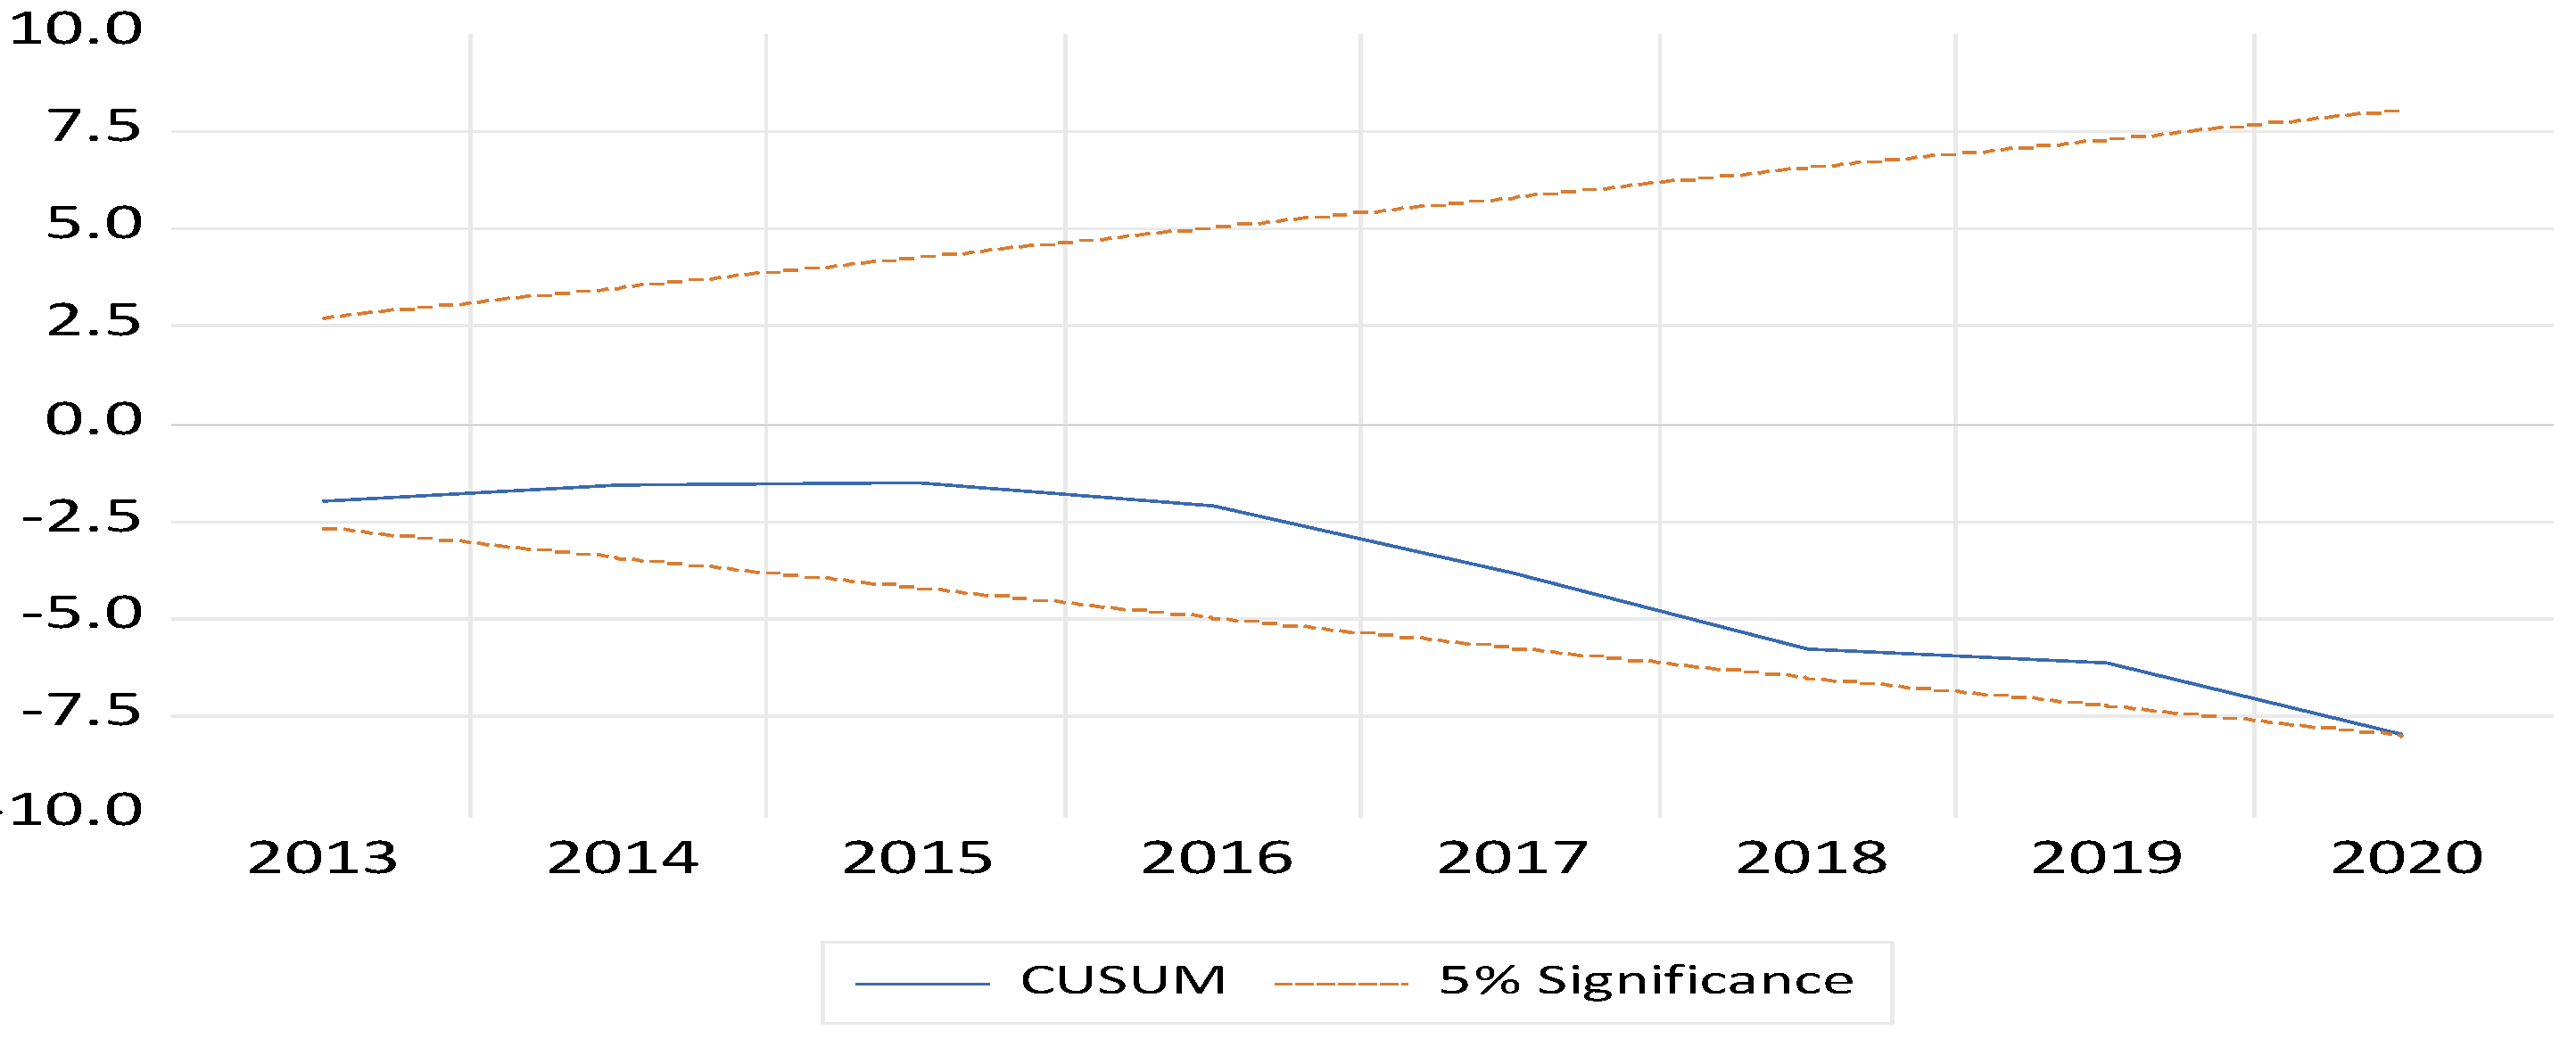
Figure 6.
Cumulative sum of squares of recursive residual (CUSUM square).
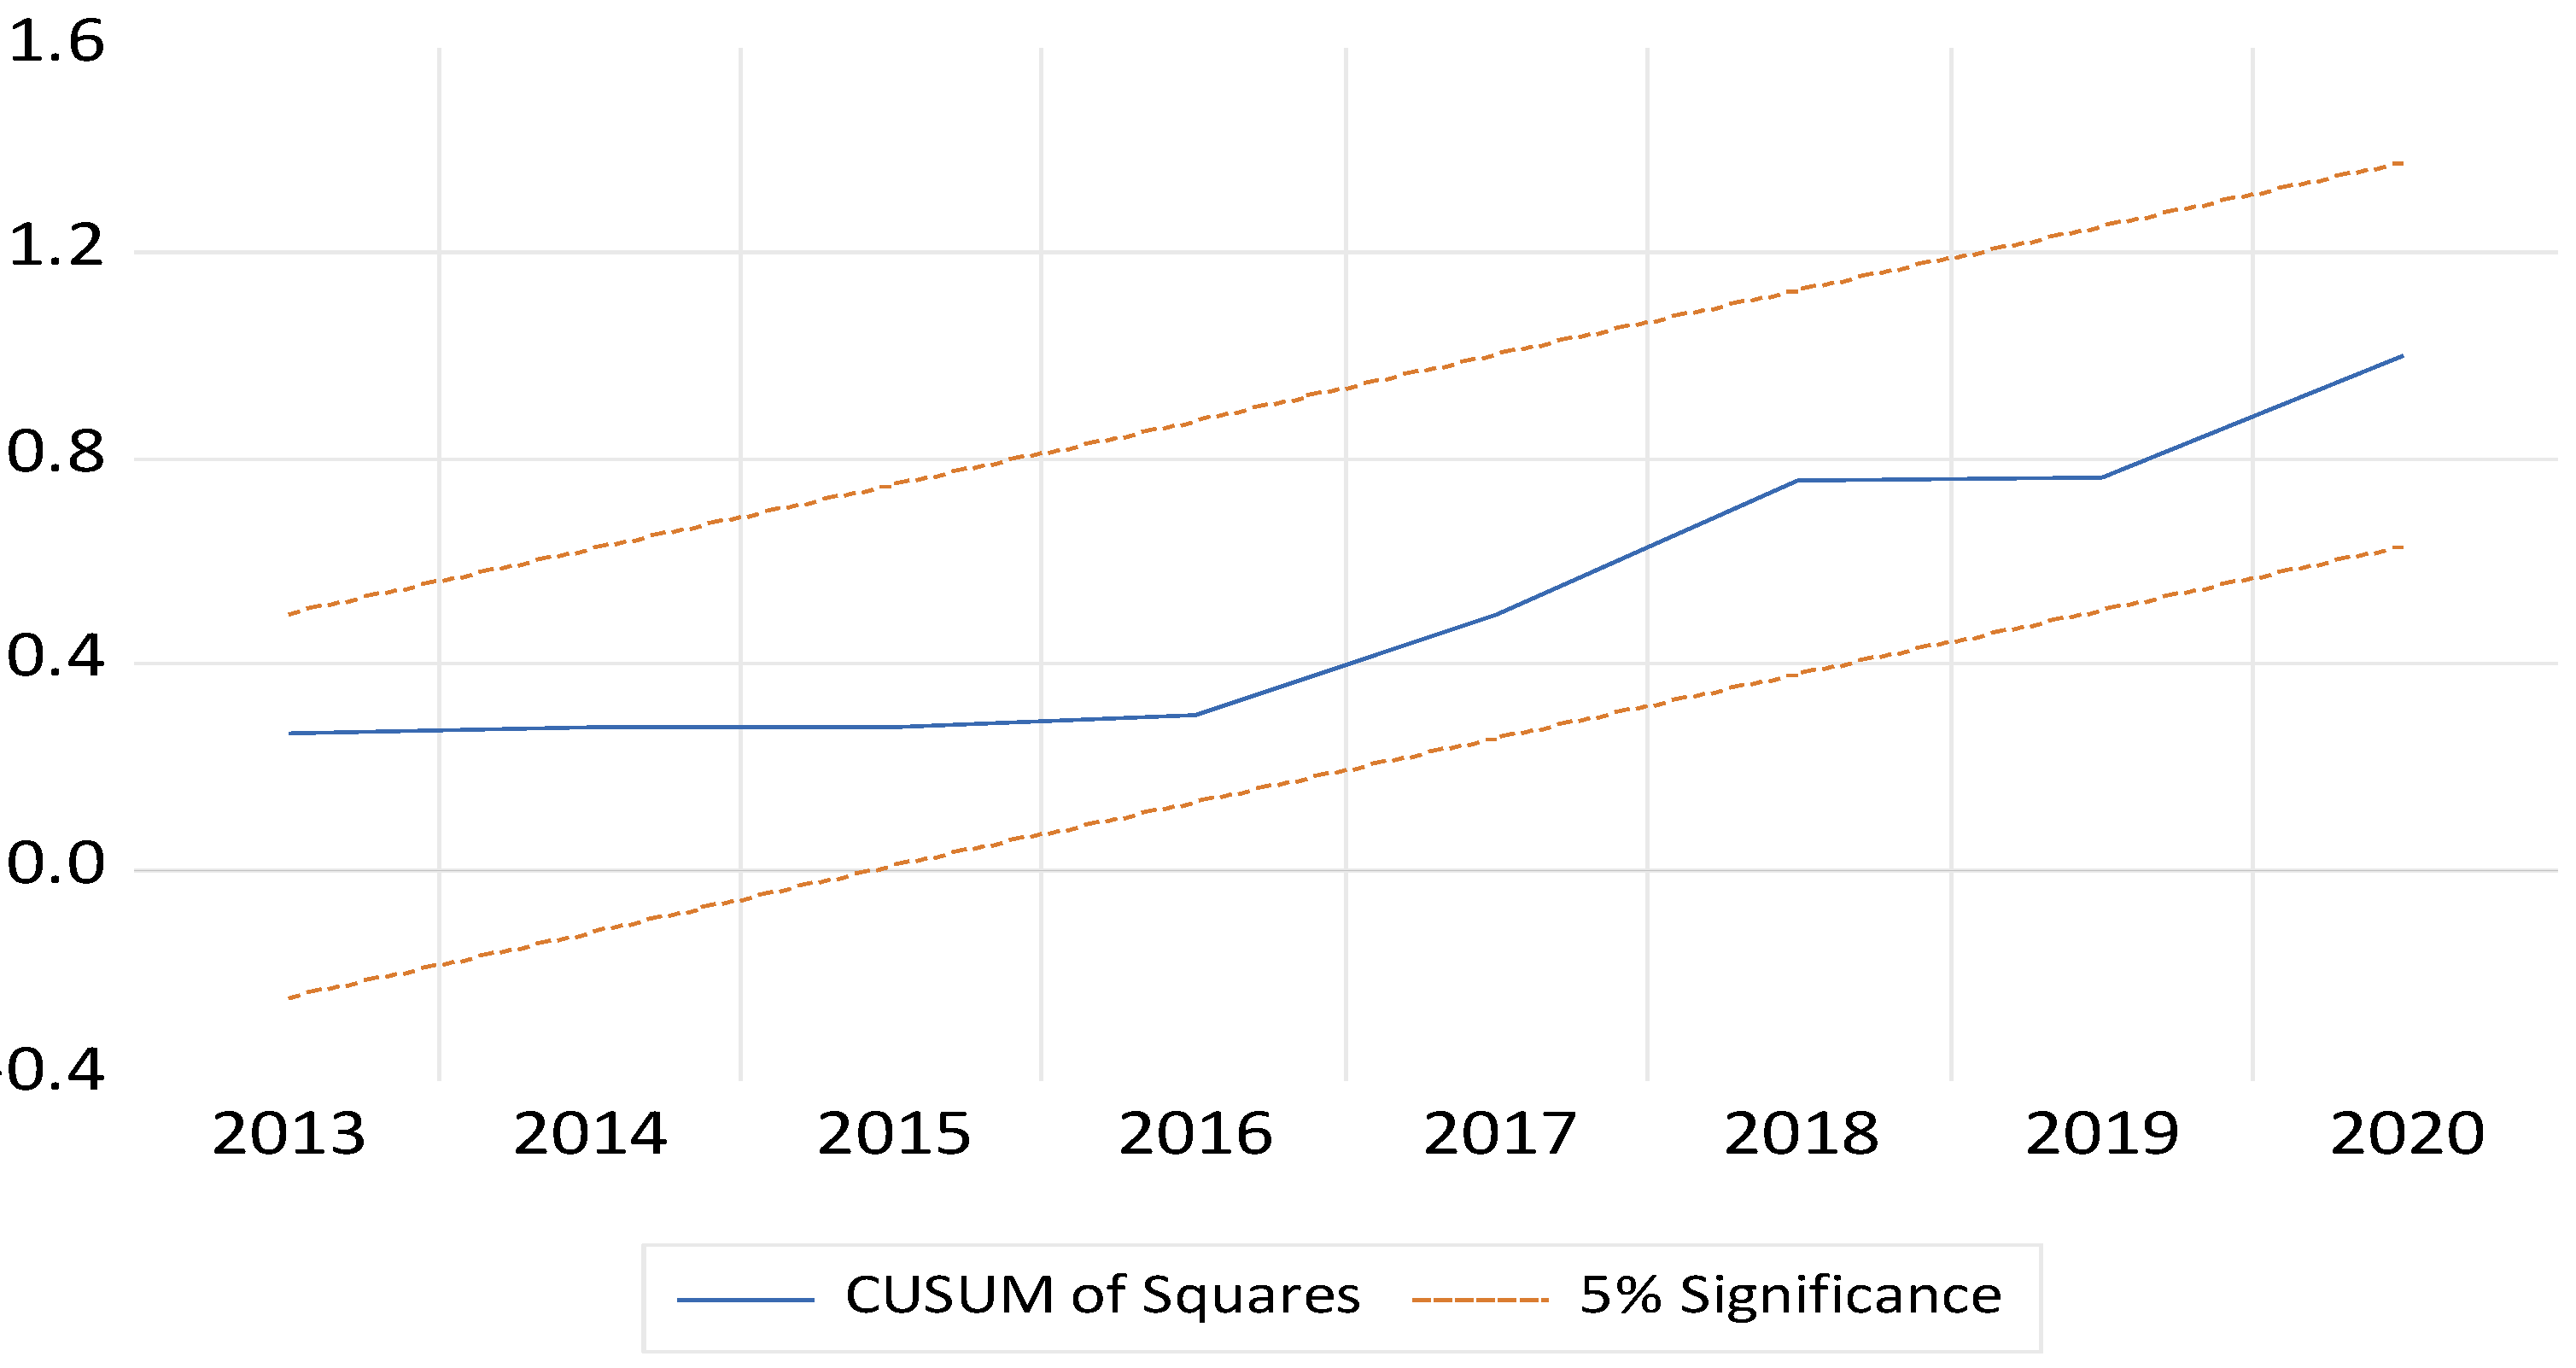

Table 1.
Descriptive statistics of the variables and the correlation matrices.
| lnCO2 | lnECI | lnGDP | lnGDP2 | lnEC | |
| Mean | 8.261292 | -0.344055 | 3.902748 | 15.23844 | 3.027958 |
| Median | 8.284392 | -0.068604 | 3.894598 | 15.16792 | 2.964179 |
| Maximum | 8.430154 | 0.051365 | 4.045892 | 16.36924 | 3.439478 |
| Minimum | 8.016977 | -2.235294 | 3.769658 | 14.21032 | 2.763956 |
| Std. Dev. | 0.129117 | 0.629536 | 0.085415 | 0.667811 | 0.214653 |
| Skewness | -0.420959 | -2.117463 | 0.150924 | 0.174800 | 0.775249 |
| Kurtosis | 1.970976 | 6.463640 | 1.767411 | 1.773412 | 2.275553 |
| Jarque-Bera | 1.767718 | 29.93140 | 1.610389 | 1.626739 | 2.928865 |
| Probability | 0.413185 | 0.000000 | 0.447001 | 0.443362 | 0.231209 |
| Sum | 198.2710 | -8.257320 | 93.66596 | 365.7225 | 72.67099 |
| Sum Sq. Dev. | 0.383440 | 9.115272 | 0.167801 | 10.25736 | 1.059743 |
| Observations | 24 | 24 | 24 | 24 | 24 |
| Correlation matrix | |||||
| lnCO2 | 1.0000 | ||||
| lnECI | 0.7983 | 1.0000 | |||
| lnGDP | 0.9620 | 0.6975 | 1.0000 | ||
| lnGDP2 | 0.9600 | 0.6932 | 1.0000 | 1.0000 | |
| lnEC | 0.7585 | 0.5149 | 0.8762 | 0.8796 | 1.0000 |
Table 2.
Results of unit root tests.
| Variables | ADF test statistic | PP test statistic | ||
| Level | 1st difference | Level | 1st difference | |
| lnCO2 | -2.43** | -6.23** | -0.55 | -5.41 |
| lnGDP | -0.08 | -6.12** | 0.02 | -6.61** |
| lnGDP2 | -0.06 | -5.94** | 0.04 | -6.19** |
| lnEC | -1.44 | -4.26** | -1.43 | -4.28** |
| lnECI | -2.15** | -5.44** | -9.40** | -4.02** |
Table 3.
Results of cointegration Test.
| Empirical model | ||
| Optimum lag length | 2,1,0,0,0 | |
| F-statistics | 9.967*** | |
| Significance level | Lower bound (0) | Upper bound I (1) |
| 1% | 4.4 | 5.72 |
| 2.50% | 3.89 | 5.07 |
| 5% | 3.47 | 4.57 |
| 10% | 3.03 | 4.06 |
*** shows 1% level of significance.
Table 4.
Results of ARDL model.
| Variables | Coefficient | Std Error | t-statistic | Prob |
| LnGDP | 2.071 | 0.446 | 4.634 | 0.007 |
| D(lnGDP) | 59.05 | 16.962 | 3.482 | 0.005 |
| LnGDP2 | -0.215 | 0.064 | -3.429 | 0.001 |
| D(LnGDP2) | -7.458 | 2.164 | -3.445 | 0.005 |
| LnEC | 0.978 | 0.410 | 2.368 | 0.037 |
| D(LnEC) | 0.429 | 0.251 | 1.709 | 0.112 |
| lnECI | 0.182 | 0.054 | 3.393 | 0.006 |
| D(lnECI) | 0.224 | 0.089 | 2.505 | 0.029 |
| ECT(-1) | -0.667 | 0.183 | -6.220 | 0.0001 |
| R2 | 0.991 | Adjusted R2 | 0.983 | |
| Diagnostic test statistics | t-test | p-value | ||
| Lagrange multiplier test | 1.469 | 0.302 | ||
| Jarque–Bera test | 1.19 | 0.546 | ||
| Breusch–Pagan–Godfrey test | 0.713 | 0.726 |
Disclaimer/Publisher’s Note: The statements, opinions and data contained in all publications are solely those of the individual author(s) and contributor(s) and not of MDPI and/or the editor(s). MDPI and/or the editor(s) disclaim responsibility for any injury to people or property resulting from any ideas, methods, instructions or products referred to in the content. |
© 2024 by the authors. Licensee MDPI, Basel, Switzerland. This article is an open access article distributed under the terms and conditions of the Creative Commons Attribution (CC BY) license (https://creativecommons.org/licenses/by/4.0/).
Copyright: This open access article is published under a Creative Commons CC BY 4.0 license, which permit the free download, distribution, and reuse, provided that the author and preprint are cited in any reuse.


