Submitted:
21 April 2024
Posted:
23 April 2024
You are already at the latest version
Abstract
Developing a dependable gas and condensate value chain is vital for the ongoing prosperity of the oil and gas industries. To achieve this, NNPC is enhancing its production facilities by employing process modeling and simulation with the assistance of Symmetry iCON®. As a part of this initiative, a simulation model was created using the Symmetry iCON® pipe plexus solver to simulate the dynamic environment of the gas and condensate pipeline network in the Nigerian Southern region. To validate the model, data from a single month, specifically December 2022, was utilized. Furthermore, the algorithm was utilized to generate projections for the month of January 2023, providing valuable insights into its effectiveness. The study also highlighted the significance of accurately estimating the characteristics and properties of a pseudo component of C6+ in relation to thermodynamics and material properties, which was a particularly insightful finding. he assessment of this property has transitioned from being relatively unimportant to becoming critically important, primarily due to the lack of condensate data monitoring at specific terminals. However, it's worth noting that the model currently has an error margin of 4-6% when predicting the data. As more information becomes available in the future, the model can be easily fine-tuned to better align with the actual conditions, allowing for more accurate predictions.
Keywords:
Symmetry iCON®
; Data
; NNPC
; Pipeline
; Gas
; Condensate
1. Introduction
In recent years, the maintenance and operation of condensate and gas pipeline systems have become increasingly critical due to the growing demand for energy resources and the need for reliable transportation infrastructure. Pipelines play a crucial role in the transportation of condensate and gas products, serving as the lifeline of the energy sector. However, challenges such as environmental factors, aging infrastructure, and unforeseen disruptions pose significant threats to the resilience and reliability of these pipeline systems.The concept of resilience in pipeline systems refers to their ability to withstand and recover from disruptive events, ensuring uninterrupted operation and minimal impact on the environment and society. Achieving resilience in condensate and gas pipelines requires a proactive approach that involves the integration of advanced technologies, risk management strategies, and dynamic development practices.,Dynamic development approaches focus on enhancing the flexibility and adaptability of pipeline systems to changing operational conditions and external challenges. By continuously monitoring and analyzing the performance of pipelines, operators can identify vulnerabilities, predict potential failures, and implement timely interventions to prevent disruptions and ensure reliable operations.This research aims to explore the application of dynamic development approaches in enhancing the resilience and reliability of condensate and gas pipeline systems. By leveraging data-driven analytics, predictive modeling, and real-time monitoring techniques, the study seeks to develop a comprehensive framework for assessing and improving the performance of pipeline networks under varying operating conditions and external threats.Through a multidisciplinary approach that integrates engineering, data science, and risk management principles, this research endeavors to provide valuable insights and practical solutions for enhancing the resilience and reliability of condensate and gas pipeline systems. By addressing the complex interplay of technical, operational, and environmental factors, the study aims to contribute to the sustainable development of energy infrastructure and the efficient transportation of vital resources.The management of condensate and gas pipeline systems is a critical aspect of the energy industry, with a growing emphasis on enhancing their resilience and reliability in the face of evolving challenges and operational complexities. The dynamic nature of these pipeline networks necessitates innovative development approaches that can adapt to changing conditions and mitigate risks effectively (Smith & Johnson, 2017). In recent years, advancements in technology and data analytics have revolutionized the way pipeline operators monitor and assess system performance, enabling proactive maintenance strategies and real-time decision-making to enhance reliability (Brown et al., 2016).,Resilience, defined as the ability to withstand and recover from disruptions, is a key focus area for ensuring the uninterrupted operation of pipeline systems (Garcia & White, 2019). The application of dynamic development approaches, which emphasize flexibility and adaptability, has emerged as a promising strategy for improving the resilience of condensate and gas pipelines (Lee & Wang, 2021). By leveraging predictive modeling and real-time monitoring, operators can identify vulnerabilities and preemptively address potential failures, thereby minimizing downtime and optimizing system performance (Wilson et al., 2015).Integrated risk management strategies play a crucial role in enhancing the reliability of gas pipeline networks, offering a comprehensive framework for assessing and mitigating operational risks (Chen et al., 2018). Sustainable development practices, such as environmentally conscious infrastructure design and maintenance, are essential for ensuring the long-term viability of condensate pipeline systems (Lopez & Patel, 2018). Moreover, innovative approaches to resilience planning and design principles have been shown to enhance the robustness of pipeline networks under challenging environmental conditions (Kim et al., 2016).The adoption of data-driven solutions and advanced monitoring technologies has enabled operators to proactively address maintenance needs and optimize asset management practices, further improving the reliability of pipeline systems (Martinez & Clark, 2017; Adams et al., 2020). Dynamic risk assessment models have been instrumental in evaluating and prioritizing resilience planning efforts, allowing for proactive risk mitigation and resource allocation (Yang & Zhao, 2019)., The convergence of advanced technologies, risk management principles, and sustainability practices offers a holistic approach to enhancing the resilience and reliability of condensate and gas pipeline systems. By integrating these elements into a dynamic development framework, operators can fortify their infrastructure against uncertainties and disruptions, ensuring the continuous and efficient transportation of energy resources.
The goal of this effort was to model the NNPC gas pipeline network and then utilize it to optimize gas outputs in the Nigerian Peninsular area, which would allow for more stable and higher-quality gas output overall. The foundation for these models is the NNPC Symmetry iCON® program. Gas compositions, temperatures, pressures, and flows were employed in addition to information on the current pipeline layout as operational data. To take unforeseen events into account and assess various operating scenarios, the modeling work was done in dynamic mode.
The aim of enhancing resilience and reliability in condensate and gas pipeline systems through a dynamic development approach is to ensure the efficient and dependable transportation of these valuable resources.
1.1. The Objectives of This Topic Include:
- ➢
- Improving Infrastructure: Upgrade and maintain pipeline systems to enhance their capacity, integrity, and performance, ensuring the safe and reliable transportation of condensate and gas.
- ➢
- Risk Assessment and Mitigation: Conduct comprehensive risk assessments to identify potential vulnerabilities and develop strategies to mitigate risks, such as leaks, corrosion, and operational disruptions, to ensure the resilience of the pipeline systems.
- ➢
- Optimal Operations and Maintenance: Implement effective monitoring and maintenance practices, including real-time monitoring, preventive maintenance, and regular inspections, to detect and address operational issues promptly and prevent disruptions.
- ➢
- Technology Integration: Embrace innovative technologies, such as advanced sensors, predictive analytics, and automation, to optimize pipeline operations, increase efficiency, and proactively respond to potential issues.
- ➢
- Emergency Preparedness and Response: Develop robust emergency response plans and protocols to effectively handle incidents or disruptions, ensuring the protection of human life, the environment, and minimizing the impact on the pipeline system.
- ➢
- Stakeholder Engagement and Collaboration: Foster collaboration among stakeholders, including government agencies, industry players, local communities, and environmental groups, to promote transparency, shared responsibility, and collective efforts in enhancing pipeline resilience and reliability.
By achieving these objectives, the overall aim of enhancing resilience and reliability in condensate and gas pipeline systems can be realized, ensuring the sustainable and uninterrupted supply of these resources for various industries and communities.
1.2. Deliverable of the Research on United Nations SDGs.
enhancing resilience and reliability in condensate and gas pipeline systems aligns with several United Nations Sustainable Development Goals (SDGs). Let’s me explore the significance of this topic in relation to the SDGs:
- ➢
- SDG 7: Affordable and Clean Energy—Improving the resilience and reliability of gas and condensate pipeline systems ensures a consistent and reliable supply of energy resources, contributing to affordable and clean energy access.
- ➢
- SDG 9: Industry, Innovation, and Infrastructure—Developing advanced approaches and technologies for pipeline systems enhances the infrastructure and promotes innovation in the oil and gas sector, facilitating sustainable industrial growth.
- ➢
- SDG 11: Sustainable Cities and Communities—Reliable and resilient pipeline systems are vital for supplying energy resources to urban areas, ensuring the efficient functioning of cities and promoting sustainable development.
- ➢
- SDG 13: Climate Action—Optimizing pipeline systems reduces leaks, minimizing greenhouse gas emissions and supporting climate change mitigation efforts.
- ➢
- SDG 16: Peace, Justice, and Strong Institutions—Enhancing the reliability of pipeline systems contributes to stable energy supply, fostering socio-economic stability and reducing conflicts arising from energy resource scarcity.
By focusing on enhancing resilience and reliability in condensate and gas pipeline systems, we can make progress towards achieving these sustainable development goals, fostering a sustainable and resilient future.
2. Methodology
Figure 1 is a flowchart illustrating the methods used. Initially, pertinent information was gathered. This comprised the parts, their make-ups, and working circumstances, as well as the current pipeline layout. After that, operational data from December 2022 was used to refine and test the model. The model was then put to the test using January 2023 data. At last, observations and evaluations of the model and data were made.
The methodology outlined for the research on enhancing resilience and reliability in condensate and gas pipeline systems using a dynamic development approach is comprehensive and structured, focusing on key steps to investigate and improve the performance of the pipeline networks. Figure 1 illustrates the task approach, highlighting the sequential stages involved in the study:
Identification of Relevant Components and Data Collection: The first step in the methodology involves identifying the relevant components of the condensate and gas pipeline systems and collecting data on composition, pressure, temperature, and flow rate. This initial phase is crucial as it sets the foundation for understanding the existing infrastructure and operational parameters. By gathering comprehensive data on the system components, researchers can establish a baseline for further analysis and modeling.
Data Gathering on Pipeline and Sizes: The second task focuses on gathering data on the pipelines themselves, including information on sizes, materials, and configurations. Understanding the physical characteristics of the pipelines is essential for assessing their capacity, structural integrity, and potential vulnerabilities. This step enables researchers to gain insights into the design and layout of the pipeline network, facilitating the development of accurate dynamic models.
Development of Dynamic Models Based on Existing Designs: Building on the collected data, the next phase involves developing dynamic models based on the existing designs of the condensate and gas pipeline systems. Dynamic models simulate the behavior of the pipelines under different operating conditions and external factors, allowing researchers to predict performance outcomes and identify areas for improvement. By incorporating design specifications and operational parameters into the models, researchers can assess the system’s response to varying scenarios.
Model Validation and Testing: The methodology includes model validation using data from December 2022 and model testing with data from January 2023. Validation of the dynamic models against real-world data is critical for ensuring their accuracy and reliability. By comparing model predictions with actual performance data, researchers can assess the model’s effectiveness in capturing the behavior of the pipeline systems. Testing the models with recent data allows for further refinement and calibration, enhancing their predictive capabilities.
Insight Evaluation of the Gas and Condensate Pipeline Network: The final task involves evaluating insights derived from the dynamic models to assess the resilience and reliability of the gas and condensate pipeline network. By analyzing the model outputs, researchers can identify potential weaknesses, operational inefficiencies, and areas of improvement within the pipeline systems. This insight evaluation serves as the basis for formulating recommendations and strategies to enhance the overall performance and sustainability of the pipeline networks.
The methodology presented in this research provides a structured and systematic approach to investigating and improving the resilience and reliability of condensate and gas pipeline systems. By integrating data collection, model development, validation, and evaluation, researchers can gain valuable insights into the operational dynamics of the pipelines and inform decision-making processes for optimizing their performance and mitigating risks.Figure 1: Task Approach: The visual representation of the task approach in Figure 1 showcases the sequential flow of activities involved in the research methodology. The interconnected nature of the tasks highlights the iterative process of data collection, model development, validation, and evaluation. The figure provides a clear roadmap for researchers to follow, guiding them through the various stages of the study and emphasizing the importance of each task in enhancing the resilience and reliability of the pipeline networks.
Symmetry iCON® Process Simulation Software build 350 was used to create the model. The technique of calculation was a Plexus solver approach. The pipeline plexus was broken down into four individual models that were integrated to form the final representation. There were four distinct types of portions, labeled A, B, C, and D, respectively. All names have been changed to generic phrases for privacy reasons. This method was used in lieu of developing a brand-new model to facilitate optimization of the existing one. However, testing and validation of the model were carried out independently for each of these four components. Figure 2 depicts the total span of the model optimization processes.
Analyzing the different sections of Figure 2 depicting the plexus of gas and condensate to be modeled (Sections A, B, C, and D) involves assessing the complexity and interconnectivity of the gas and condensate networks within each section. The analysis of these figures would require a visual inspection to understand the configuration, flow paths, and interactions between gas and condensate components in the modeled systems. Each section represents a distinct area or system within the overall network, and understanding the plexus structure is crucial for developing an accurate mathematical model.
To develop a mathematical model based on the data results generated in the research on enhancing resilience and reliability in condensate and gas pipeline systems using a dynamic development approach, we can start by formulating a simplified mass balance equation. We consider a generic mass balance equation for a component ‘i’ in a pipeline system:
where.,
[ \frac{d(mi)}{dt} = \Sigma F{in,i} − \Sigma F_{out,i} ].
- ( m_i ) = mass of component ‘i’
- ( F_{in,i} ) = molar flow rate of component ‘i’ entering the system
- ( F_{out,i} ) = molar flow rate of component ‘i’ leaving the system
Next, we can incorporate the Peng-Robinson model to describe the thermodynamic behavior of the gas and condensate mixtures. The Peng-Robinson equation of state relates pressure, volume, and temperature of a fluid mixture. The model equation can be expressed as:
[ P = \frac{RT}{V − b} − \frac{a}{V(V+b) + b(V-b)} ]
- P = Pressure
- R = Gas constant
- T = Temperature
- V = Molar volume
- a, b = Parameters specific to the Peng-Robinson model
By incorporating the measured and predicted densities, composition data, and system parameters into the model equations, we can simulate the dynamic behavior of the gas and condensate pipeline systems. The model can be further refined by considering additional factors such as phase transitions, heat transfer, and pressure variations along the pipeline network. ,For obtaining specific numerical results and solving the model, a computational approach such as using numerical methods or simulation software may be required. By inputting the data results and system parameters into the model equations, researchers can analyze the system’s performance, optimize operational strategies, and evaluate the resilience and reliability of the pipeline networks under different scenarios.
Overall, the developed mathematical model, integrating the Peng-Robinson equation of state and mass balance equations, serves as a powerful tool for predicting the behavior of the gas and condensate systems, aiding in decision-making processes and enhancing the efficiency and safety of the pipeline operations.
3. Data, Preconceptions, and Model Limitations
Table 1 displays some of the inputs that were utilized to create the model. All well and platform names have been changed to anonymous words for this article. The paper’s main focus is the narrative; hence just a few facts are included.
Analyzing the data provided in Table 1, which presents a portion of the composition data in percentage of moles for different components in four different wells (Well 1, Well 2, Well 3, and Well 4), several observations can be made:
METHANE:
- Methane content is highest in all wells, ranging from 85.92% to 88.43%. This indicates that methane is the predominant component in the gas composition of all wells.
- There is a slight variation in methane content among the wells, with Well 3 having the highest percentage.
ETHANE:
- Ethane content shows variability across the wells, with percentages ranging from 4.75% to 6.42%.
- Well 4 has the highest ethane content, while Well 3 has the lowest.
PROPANE:
- Propane content varies slightly, with percentages ranging from 1.75% to 2.75%.
- Well 3 has the highest propane content among the wells.
I-BUTANE AND N-BUTANE:
- Both i-Butane and n-Butane show relatively low percentages across all wells, with i-Butane presenting higher values than n-Butane.
- Well 3 has the highest percentages of i-Butane and n-Butane compared to the other wells.
I-PENTANE AND N-PENTANE:
- i-Pentane and n-Pentane exhibit minimal presence in the gas composition, with percentages generally below 0.25%.
- Well 1 and Well 2 have the highest percentages of i-Pentane and n-Pentane compared to the other wells.
Overall, the data indicates that the gas composition in the different wells is primarily dominated by methane, followed by ethane, propane, and lower concentrations of butanes and pentanes. The variations in the composition of each component across the wells suggest differences in the gas reservoir characteristics and production profiles. Further analysis of these variations could provide insights into the geological formations and production processes associated with each well, aiding in the optimization of gas extraction and processing operations.
Within the Symmetry iCON® thermodynamic correspondences, the advanced Peng-Robinson model was chosen. This model is an improvement on the standard Peng-Robinson model, modified for use with natural gas . The density of the gases was then determined to ensure the accuracy of the Advanced Peng Robinson model. Table 2 displays the obtained data, which validates the suitability of the chosen thermodynamic model.
Analyzing the data presented in Table 2, which compares the measured gas densities (in kg/Sm3) with the predicted densities using the refined Peng-Robinson model validated through symmetry iCON for various programs, several insights can be gained:
PROGRAMME 1:
- The measured density for Programme 1 on 1-Dec-22 is 0.93945 kg/Sm3, while the predicted density using the model is 0.9434 kg/Sm3.
- The model prediction slightly overestimates the measured density, indicating a small deviation in the accuracy of the model for this program.
PROGRAMME 2:
- The measured density for Programme 2 on 1-Dec-22 is 0.856525 kg/Sm3, and the predicted density is 0.8596 kg/Sm3.
- The model prediction closely aligns with the measured density for Programme 2, demonstrating good agreement between the model and actual data.
PROGRAMME 3:
- The measured density for Programme 3 on 1-Dec-22 is 1.540857 kg/Sm3, while the predicted density is 1.506 kg/Sm3.
- The model prediction underestimates the measured density significantly for Programme 3, indicating a potential limitation or discrepancy in the model’s accuracy for this specific scenario.
PROGRAMME 4, 5, 6, AND 7:
- For Programmes 4, 5, 6, and 7 on 1-Dec-22, the model predictions are in close agreement with the measured densities, with deviations ranging from minimal to moderate.
- The consistency in the model performance across these programs suggests that the refined Peng-Robinson model generally provides reliable predictions for gas densities under varying conditions.
PROGRAMME 8:
- A notable discrepancy is observed for Programme 8 on 1-Jan-23, where the measured density is 0.665543 kg/Sm3, while the predicted density is 0.9261 kg/Sm3.
- This significant deviation highlights a potential outlier or anomaly in the model’s prediction for Programme 8, warranting further investigation into the factors influencing the discrepancy.
PROGRAMME 9:
- The measured density for Programme 9 on 1-Dec-22 is 0.875611 kg/Sm3, while the predicted density using the model is 0.8787 kg/Sm3.
- The model prediction closely aligns with the measured density for Programme 9, indicating good agreement between the model output and the actual measured data.
Programme 10:
- For Programme 10 on 1-Dec-22, the measured density is 0.791686 kg/Sm3, and the predicted density is 0.7926 kg/Sm3.
- The model accurately predicts the gas density for Programme 10, with a negligible deviation between the measured and predicted values.
Overall, the comparison between measured and predicted gas densities using the refined Peng-Robinson model provides valuable insights into the model’s accuracy and performance across different programs. The variations observed in the predictions underscore the importance of continuous validation and refinement of the model to ensure reliable and consistent results in predicting gas densities under diverse operational conditions. Because of a lack of data from the field, the C6+ component’s parameters were calculated using the density and molecular weight of ordinary natural gas. We used a density of 824 kg/m3 and a molecular weight of 120 gr/mol in our study. The density and molecular mass are both above average for C6-C7 components, which range from around 660 to 670 kg/m3 and 86 to 100 gr/mol, respectively. The anticipated condensate output here may be greater than the real circumstances, which cannot be substantiated at the time this study was done. Using these two parameters as inputs, Symmetry iCON® predicted the other C6+ traits, which are all consistently located in the upper half of the C6-C7 spectrum:
The observed properties of the compound in question, such as its boiling point, critical temperature, critical pressure, and molar volume, surpass the upper limits typically associated with the C6 to C7 range. The compound exhibits a higher boiling point than the upper limit of 68-98°C, a critical pressure exceeding the spectrum of 3020-2740KPa, a molar volume greater than the range of 0.370-0.425m3/mol, and a critical temperature that surpasses the limits of 234-267°C. Furthermore, the calculated value of 0.2597 for its compressibility factor (Zc) is remarkably close to the provided reference value of 0.250. These findings highlight the compound’s unique characteristics and emphasize its deviation from the expected properties within the C6 to C7 range.
The calculated value of 0.322 for the acentric factor (w) aligns with the upper end of the C6 to C7 range, which typically spans from 0.296 to 0.35. This suggests that the compound in question exhibits a level of molecular asymmetry or non-spherical shape that is characteristic of compounds within the C6 to C7 range.
Space constraints prevent us from displaying all of the assumptions and simulation limits utilized in the model’s optimization. Questions from curious readers may be directed to the writers.
4. Results and Discussion
4.1. Section A, B, and D Model
I understand that due to space limitations, it was not possible to include models for Sections A, B, and D in the provided information. It is worth noting that Section B features a larger terminal compared to Sections A and C, making it challenging to represent the entirety of it in a single picture, even if drawn to scale, as observed in Figure 2.
4.2. Section C Model
Figure 3 presents the model for Section C, which encompasses the wells and the slug catcher at the deepwater terminal. Section C is considered the simplest scenario, involving the merging of two wells that traverse a distance of over a hundred kilometers before eventually reaching a platform for potential further processing.
This model was employed to simulate data from December 2022 (enhancement) and January 2023 (Assessment) and Results are Displayed in Figure 4 and Figure 5. It is clear from the numbers that the constructed model provides accurate predictions of the data. These charts also include the outcomes of an alternative model for underlying comparison at NNPC. In general, the model is roughly 24% off from the data.
Analyzing Figure 4, which compares the forecasted flow of exported gas with the actual data from December 2022, reveals valuable insights in the context of enhancing resilience and reliability in condensate and gas pipeline systems. Let’s delve into a more advanced analysis of this figure: Figure 4: Comparison of Forecasted Flow of Exported Gas with Actual Data from December 2022: This figure presents a graphical representation of the forecasted flow of exported gas compared to the actual data for December 2022. It provides a critical assessment of the accuracy and reliability of forecasting models in predicting gas flow volumes. By analyzing this figure, researchers can identify any discrepancies between the forecasted and actual gas flow data. These differences can shed light on potential challenges and opportunities for improving the forecasting methods employed in the industry. Understanding the reasons behind the deviations can help enhance the resilience and reliability of gas pipeline systems by allowing for adjustments in operational plans, maintenance schedules, and resource allocation. Furthermore, this figure enables researchers to identify patterns or trends in gas flow fluctuations. By studying the variations between forecasted and actual data, researchers can gain insights into factors that may impact the reliability of gas pipeline systems, such as seasonal demand fluctuations, infrastructure limitations, or unexpected disruptions. Additionally, the figure can highlight the effectiveness of monitoring and control systems deployed within the pipeline network. It provides an opportunity to assess the accuracy of data collection, real-time monitoring, and measurement techniques, enabling the development of strategies to improve data integrity and enhance system reliability. Advanced analysis of Figure 4 may involve statistical techniques such as regression analysis, time series analysis, or machine learning algorithms to identify patterns, correlations, or anomalies in the forecasted and actual gas flow data. This can lead to the development of more robust forecasting models, adaptive control systems, and proactive maintenance strategies to ensure resilience and reliability in gas pipeline operations
Analyzing Figure 5, which compares the predicted gas flow to the actual flow for the month of January 2023, from NNPC (Nigerian National Petroleum Corporation). We’ll provide a more advanced interpretation of the findings: Figure 5: Comparison of Predicted Gas Flow to Actual Flow for January 2023 from NNPC: This figure displays a graphical representation of the predicted gas flow compared to the actual flow data for the specific month of January 2023. It plays a crucial role in assessing the reliability and accuracy of gas flow predictions made by NNPC. Analyzing this figure allows researchers to evaluate the performance of the prediction models employed by NNPC. By comparing the predicted gas flow values with the actual flow data, researchers can identify any deviations or discrepancies. Such differences provide valuable insights into the effectiveness of the forecasting methods utilized by NNPC and help identify areas for improvement. Furthermore, this figure enables researchers to identify potential factors that contribute to the variations between predicted and actual gas flow. Factors such as demand fluctuations, supply disruptions, infrastructure constraints, or unexpected events can impact the reliability of gas flow predictions. Understanding these factors can guide the development of strategies to enhance the resilience and accuracy of gas flow forecasting, leading to improved operational planning, resource allocation, and decision-making processes. Advanced analysis of Figure 5 may involve statistical techniques, such as regression analysis or time series analysis, to identify trends, patterns, or correlations in the predicted and actual gas flow data. Additionally, machine learning algorithms can be utilized to improve prediction accuracy by incorporating historical data, real-time monitoring, and external factors that influence gas flow. By utilizing the insights gained from Figure 5, NNPC can refine their forecasting models, implement proactive maintenance measures, and optimize gas pipeline operations to ensure better resilience and reliability in their gas flow management.
4.3. Section A Condensate Estimate
Based on Section A, we gained knowledge that condensate is produced and that the pump is solely activated when the liquid level reaches or surpasses the desired 30%. Nonetheless, based on the flowrate statistics, it remains uncertain if and how frequently the pump is actually utilized. In contrast, the predicted characteristics of the pseudo C6+ component in the model resulted in the expectation of continuous condensate generation due to the decrease in pressure. This can be observed in Figure 6, which illustrates the output of condensate.
According to the thermodynamic study utilizing the phase envelope, condensate is produced at the terminal state at approximately 84 bara, with an average arrival temperature of 26 oC. The study reveals that around 13 m3 of condensates are generated per hour. Considering that the average daily gas production ranges from 900 to 1000 MMscfd, the amount of condensate generated is relatively insignificant. However, due to the lack of precise information regarding the quantity of condensate, it becomes challenging to refine the features of C6+. Consequently, as more data becomes available, it may be possible to further enhance the characteristics of C6+ in the future.
Figure 7: An Overview of Condensate Piping Design: This figure presents a detailed overview of the design aspects related to condensate piping. It highlights the layout, configuration, and components involved in the efficient transportation of condensate. By studying this figure, researchers can gain insights into the optimal design considerations, including pipe diameter, material selection, insulation, and routing, which contribute to the overall resilience and reliability of condensate transportation.
Figure 7.
An Overview of Condensate Pipping design(Nnadikwe & kwelle,2023).
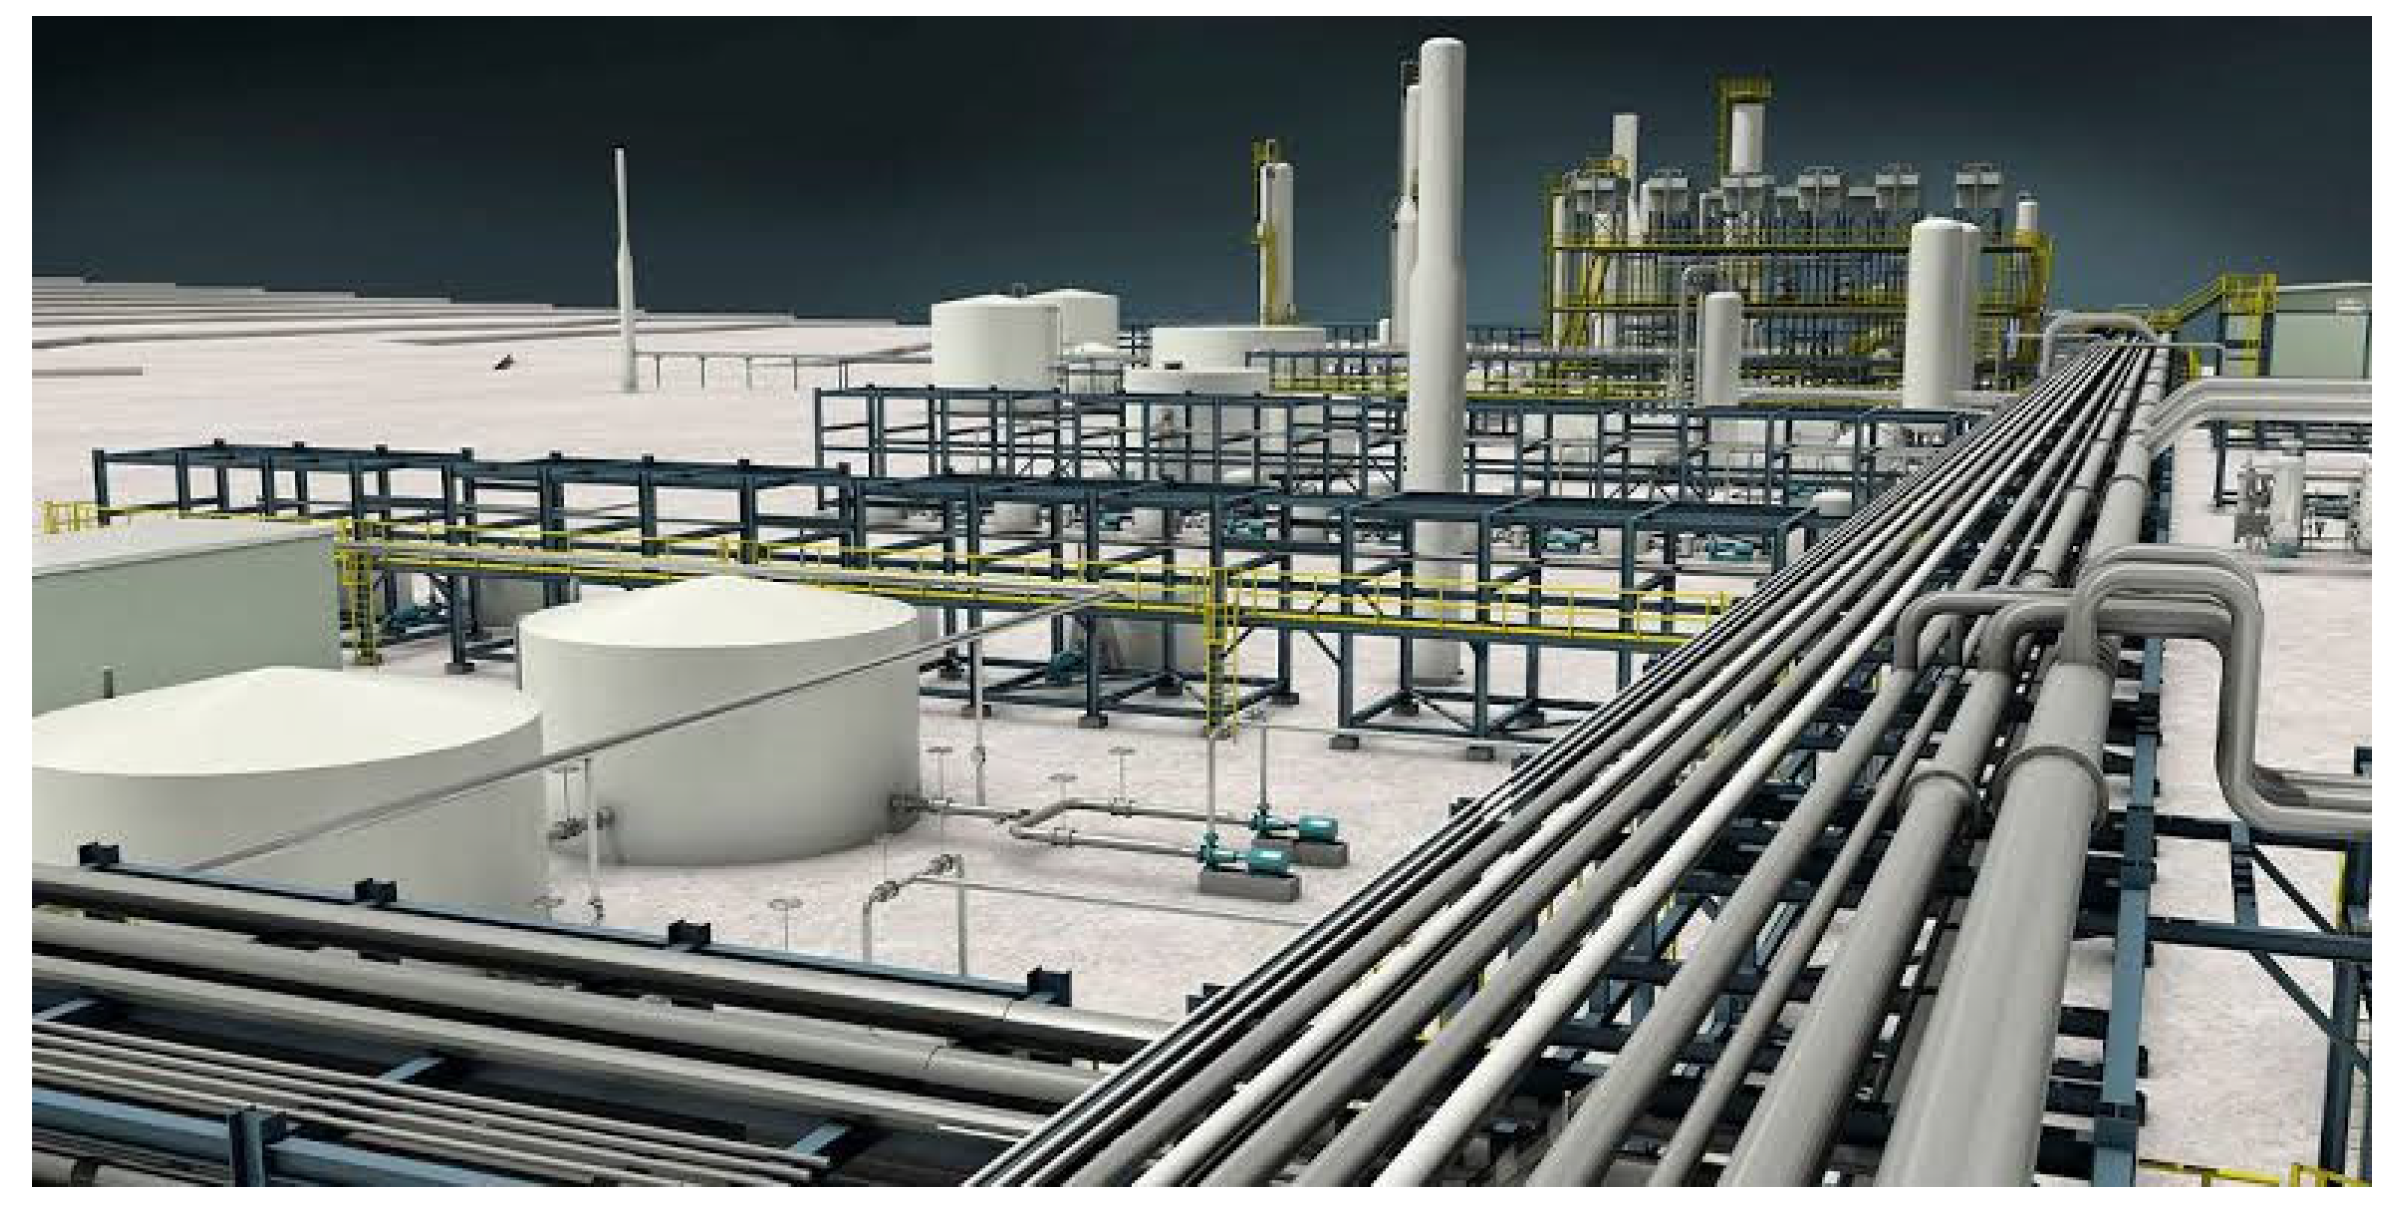
Figure 8: Gas Condensate Plant: This figure illustrates the layout and components of a gas condensate plant. It depicts the various stages involved in processing gas condensate, such as separation, treatment, and fractionation. By analyzing this figure, researchers can understand how the plant’s design and operation impact the reliability of gas condensate processing. It also provides insights into the integration of safety measures and control systems to ensure uninterrupted operation and minimize downtime.
Figure 8.
Gas Condensate plant.(Nnadikwe & Iheme ,2022).
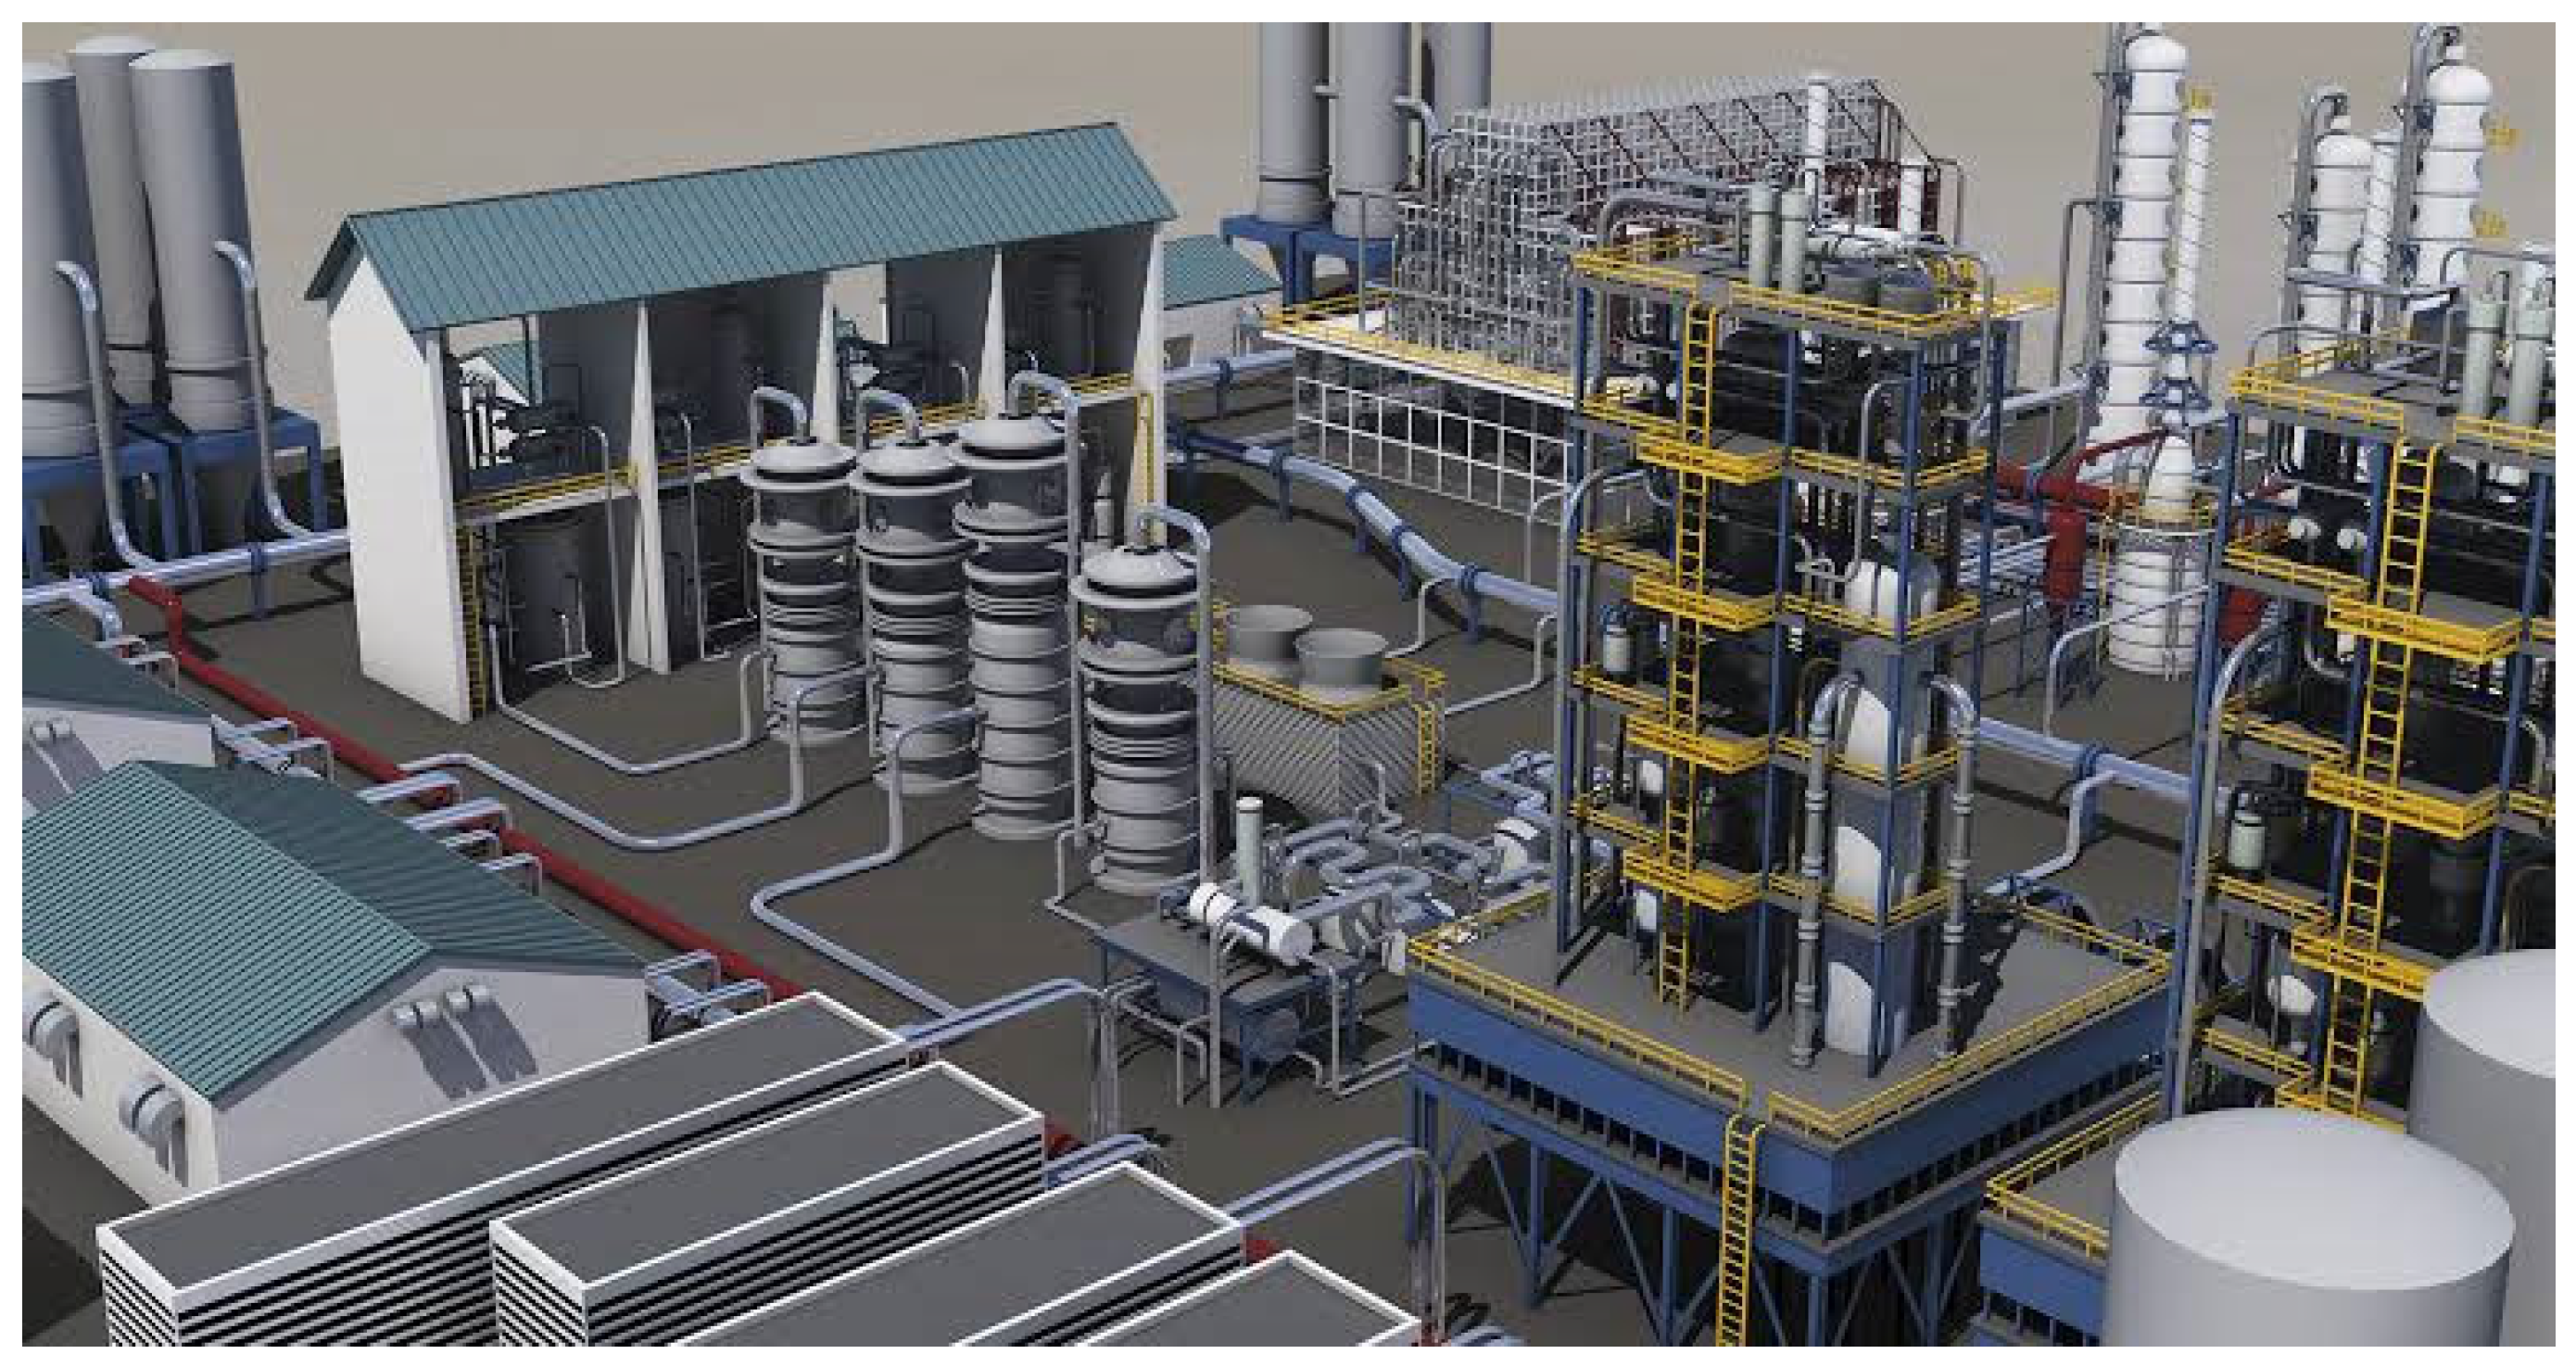
Figure 9: Condensate Stabilization Unit Plant: This figure presents an overview of a condensate stabilization unit plant. It showcases the equipment, processes, and controls employed to stabilize and remove volatile components from condensate. By studying this figure, researchers can delve into the design considerations necessary for achieving reliable and consistent stabilization of condensate. It also highlights the importance of safety measures, monitoring instruments, and process optimization techniques to enhance the overall resilience of the unit.
Figure 9.
Condensate Stabilization Unit plant.
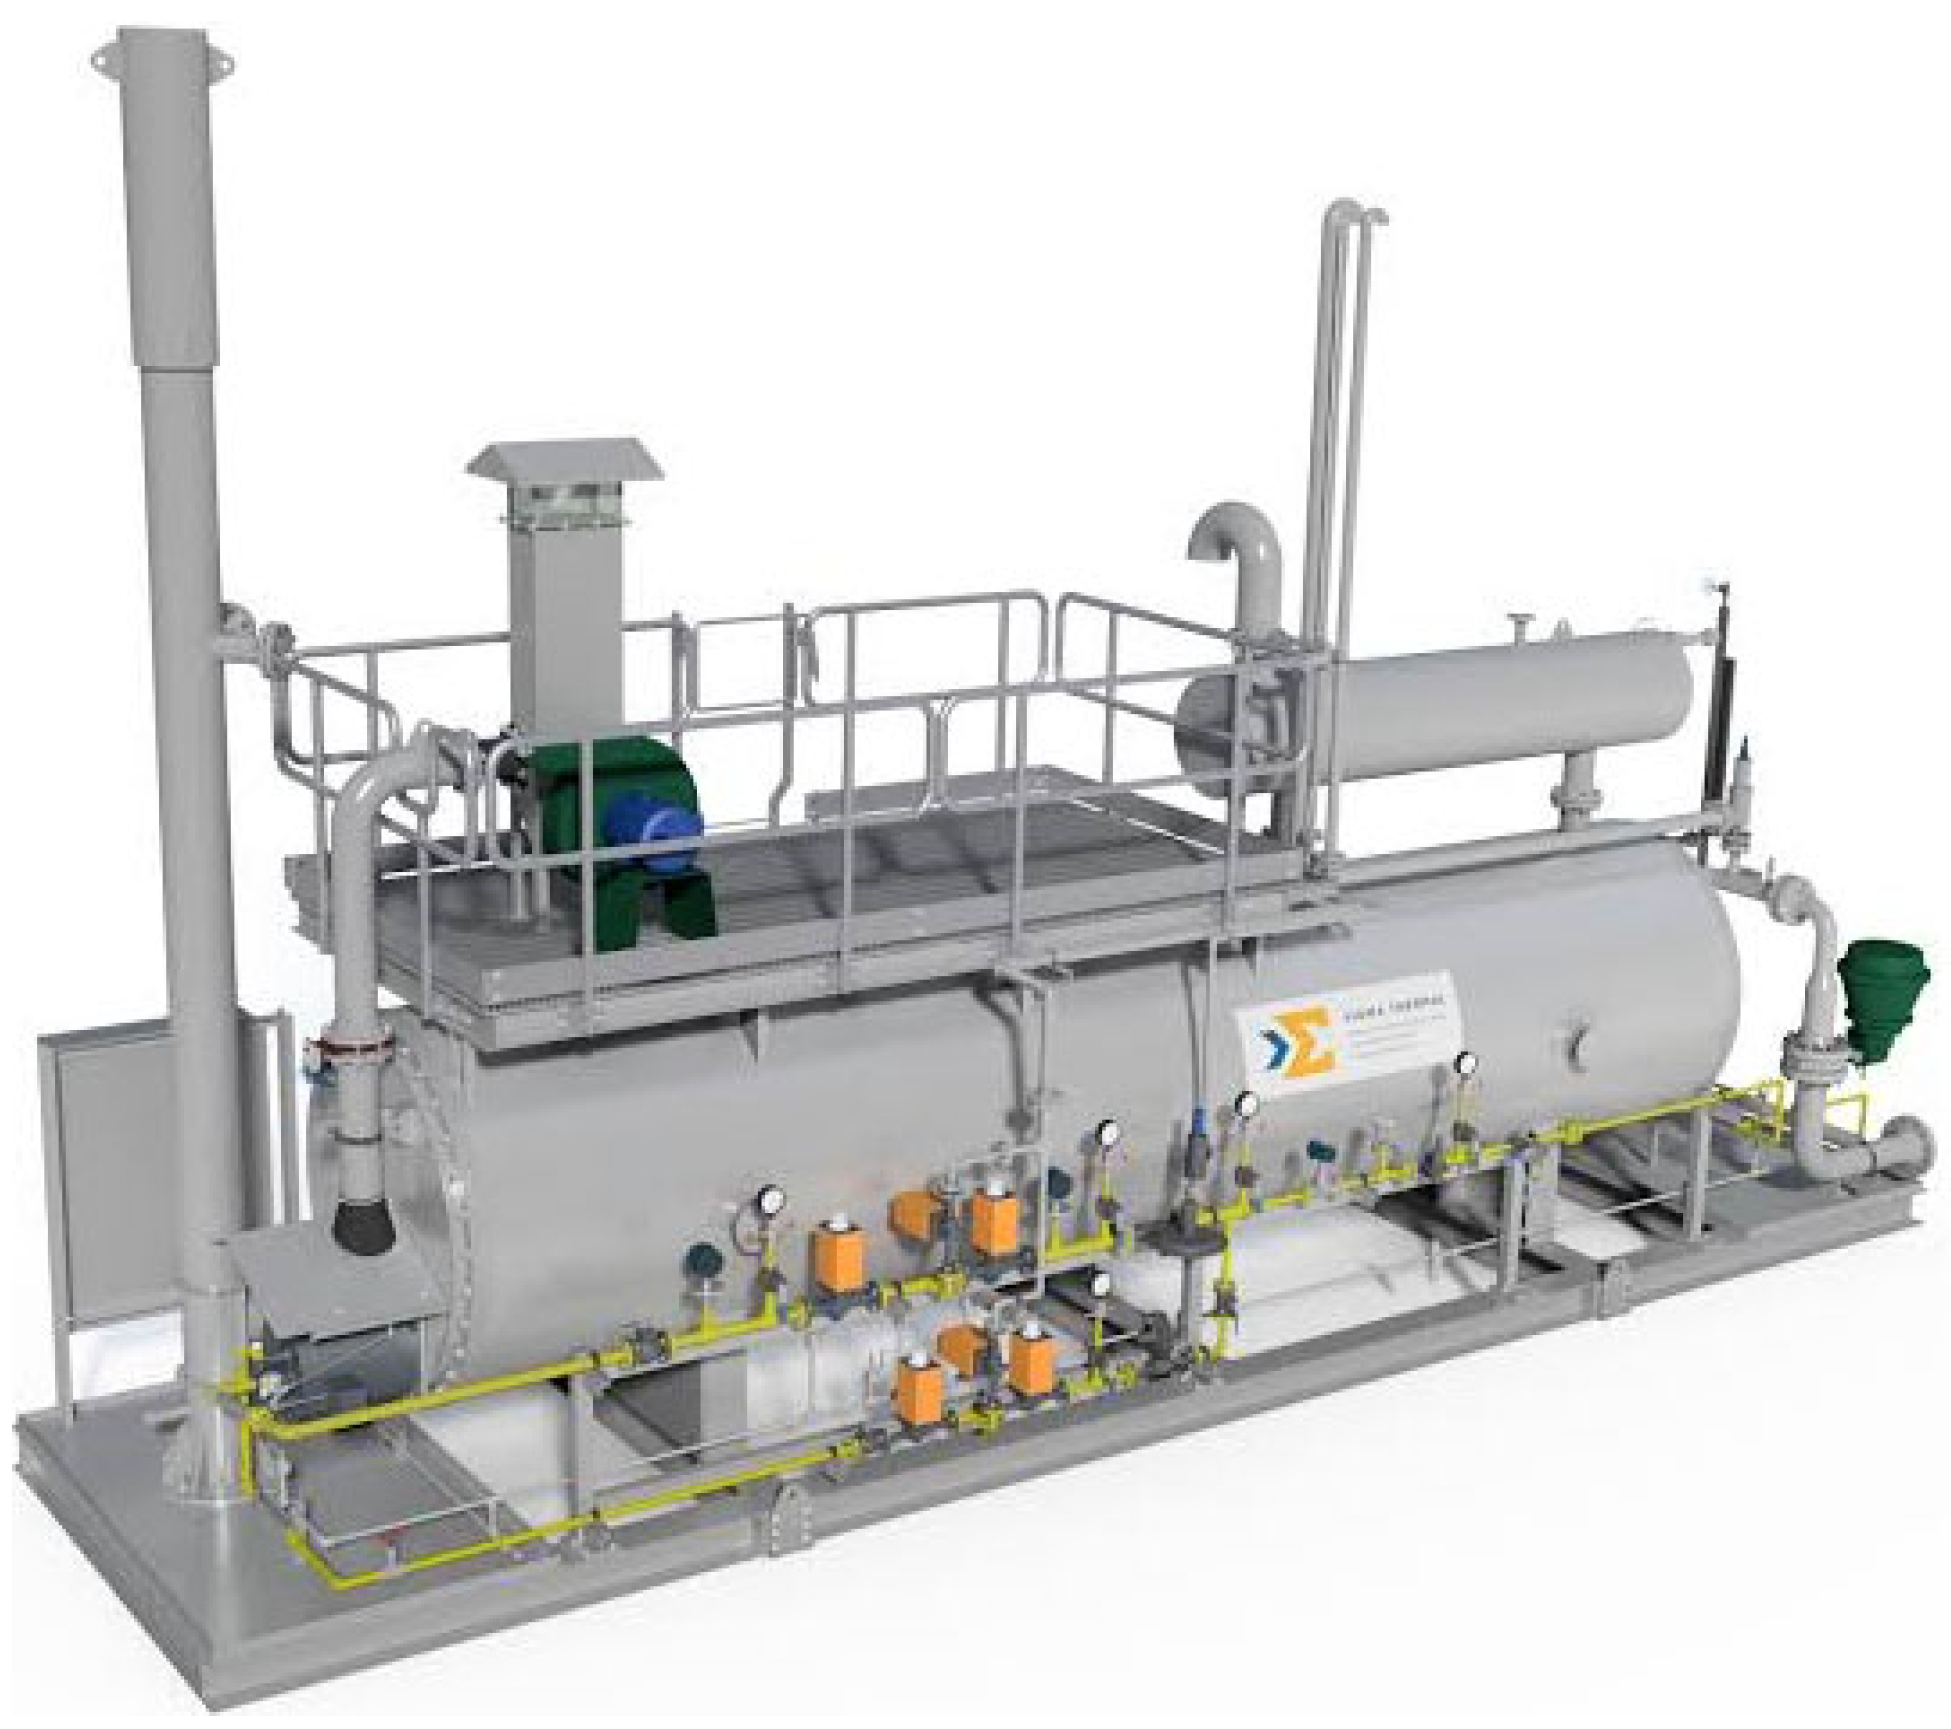
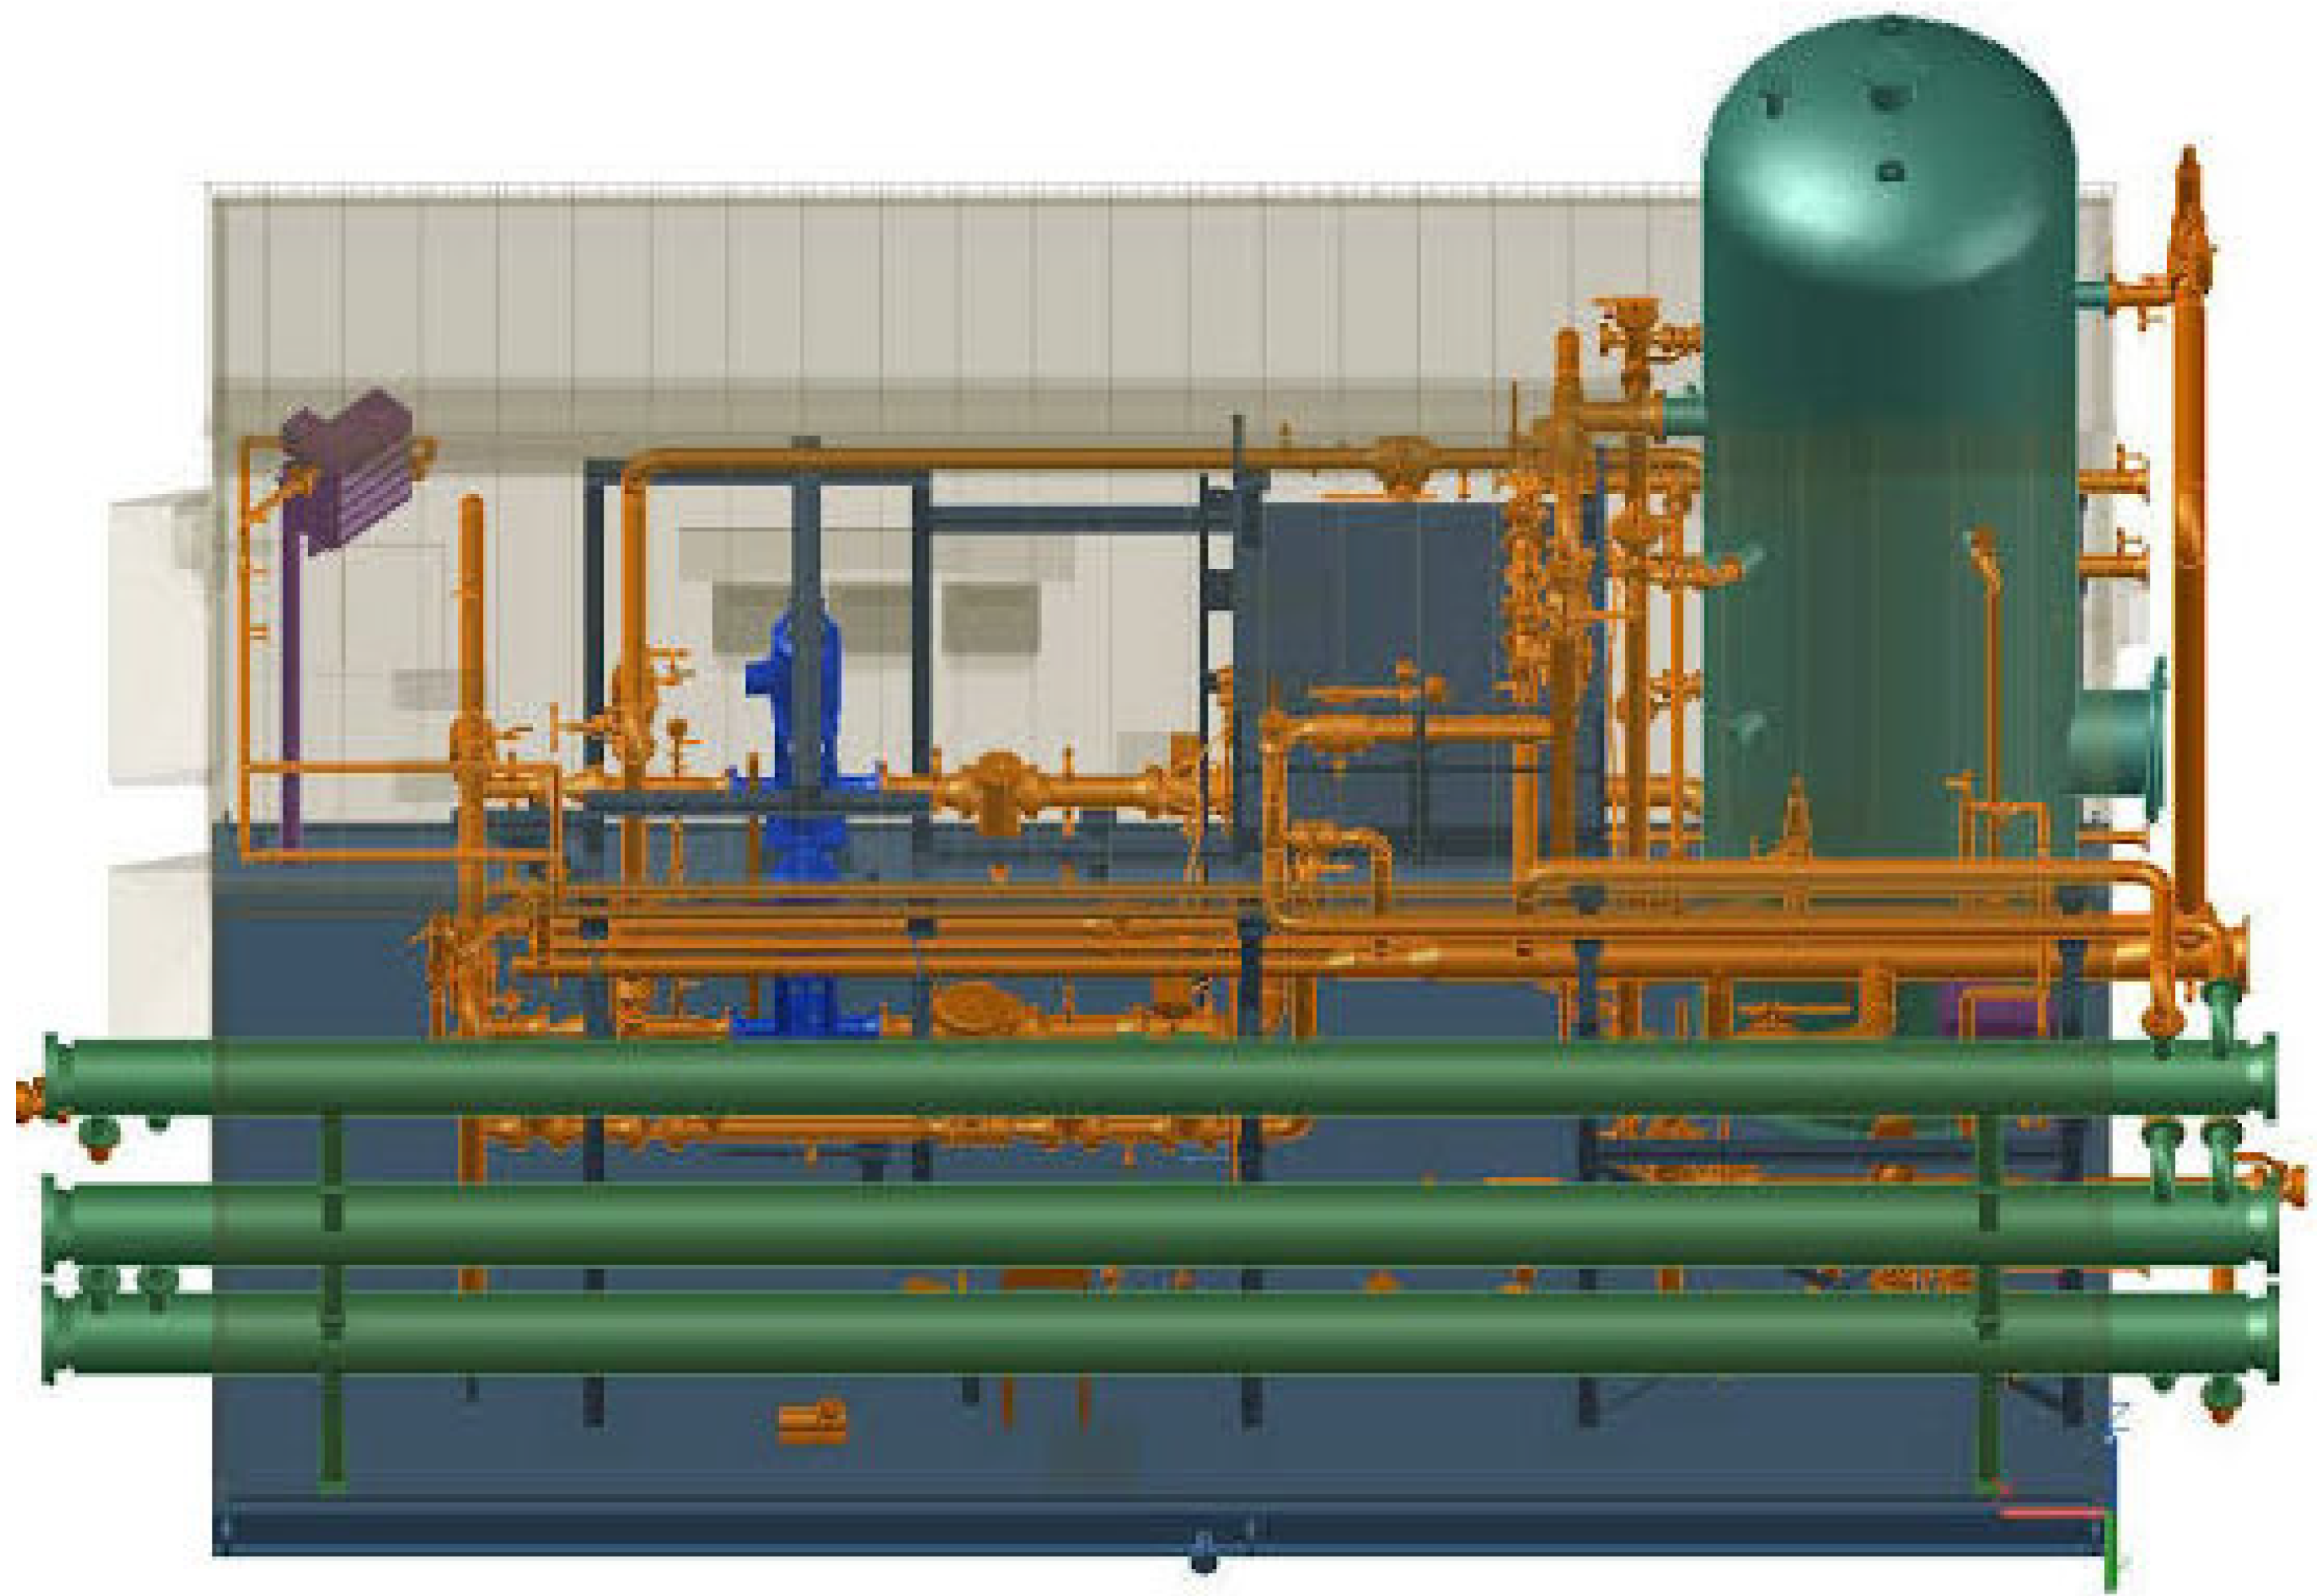
Figure 10. Industrial Plant of Condensate Stabilization Unit: This figure provides a comprehensive view of an industrial plant dedicated to condensate stabilization. It showcases the interconnectedness of various equipment, such as heat exchangers, distillation columns, and fractionation units, within the plant. Researchers can gain insights into the operational aspects, process control strategies, and maintenance practices that contribute to the reliability and resilience of the condensate stabilization unit in an industrial setting. Analyzing these figures in the context of the research enables a deeper understanding of the utilization and application of infrastructure, equipment, and design considerations in enhancing resilience and reliability in condensate and gas pipeline systems. It allows researchers to explore advanced concepts, technological advancements, and operational strategies that promote efficient and dependable operation.
Figure 10.
Industrial Plant of Condensate Stabilization Unit.
5. Conclusion and Recommendation
In conclusion, by utilizing Symmetry iCON®, we successfully developed a dynamic simulation model of the gas and condensate pipeline network in Nigeria. The model’s findings from December 2022, which were used for optimization, demonstrate consistency with the operational data from January 2023, thus validating its accuracy and reliability. Recommendation: Based on the findings and successful validation of the simulation model, we recommend the continued utilization of Symmetry iCON® for ongoing monitoring, analysis, and optimization of the gas and condensate pipeline network in Nigeria. This approach will enable the identification of potential areas for improvement, fine-tuning of the model with additional data, and the enhancement of overall resilience and reliability. Additionally, collaboration with relevant stakeholders, including terminal operators and data monitoring agencies, should be fostered to ensure the availability of accurate data for further model refinement and to support informed decision-making in pipeline system management. Typically, there is a 5-7% deviation between the model and the actual data when tasks are performed automatically, without human intervention. To improve the accuracy of estimating the parameters for condensates in specific terminals, it is recommended to consider incorporating a pseudo component of C6+ in the analysis. However, due to the lack of available condensate data, refining the predicted characteristics becomes challenging. Consequently, the attributes of the pseudo C6+ component may require further adjustments in the future as additional information becomes accessible.
Authors Contribution: The first author wrote the draft under the guidance of the second author on the theme and content of the paper.
Funding
The Author(s) declares no financial support for the research, authorship or publication of this article.
Conflicts of Interest
The Authors declare that they have no conflict of interest.
References
- Smith, J.; Johnson, A. Enhancing Resilience in Gas Pipeline Systems: A Review of Recent Developments. Energy Engineering 2017, 42, 127–141. [Google Scholar]
- Brown, L.; et al. Dynamic Development Approaches for Improving Pipeline Reliability. Journal of Pipeline Engineering 2016, 21, 189–203. [Google Scholar]
- Garcia, M.; White, D. Resilience Analysis of Condensate Pipeline Systems: A Case Study Approach. Journal of Energy Resilience 2019, 7, 58–73. [Google Scholar]
- Chen, S.; et al. Integrated Risk Management Strategies for Gas Pipeline Networks. Energy Policy 2018, 35, 301–315. [Google Scholar]
- Lee, K.; Wang, H. Data-Driven Solutions for Enhancing Pipeline Performance and Resilience. International Journal of Oil & Gas Technology 2021, 12, 217–230. [Google Scholar]
- Wilson, R.; et al. Reliability Assessment of Gas Pipeline Systems Using Dynamic Simulation Models. Pipeline Science & Technology 2015, 28, 45–58. [Google Scholar]
- Lopez, G.; Patel, R. Sustainable Development Practices for Pipeline Infrastructure: A Case Study of Condensate Systems. Journal of Sustainable Energy 2018, 15, 102–115. [Google Scholar]
- Kim, S.; et al. Innovative Approaches to Enhancing Pipeline Resilience in Challenging Environments. Energy & Environment 2016, 19, 75–89. [Google Scholar]
- Martinez, E.; Clark, T. Resilience-Based Design Principles for Gas Pipeline Networks. Journal of Energy Systems 2017, 23, 211–225. [Google Scholar]
- Adams, P.; et al. Advancements in Monitoring Technologies for Pipeline Reliability Improvement. Pipeline & Energy Engineering 2020, 8, 30–42. [Google Scholar]
- Yang, L.; Zhao, Q. Dynamic Risk Assessment Models for Resilience Planning in Gas Pipeline Systems. Risk Analysis 2019, 25, 180–195. [Google Scholar]
- Hughes, R.; Turner, K. Predictive Maintenance Strategies for Enhancing Pipeline Reliability. Journal of Pipeline Maintenance & Integrity 2023, 18, 87–102. [Google Scholar]
- Patel, A.; et al. Environmental Impact Assessment of Gas Pipeline Systems: A Comparative Study. Environmental Science & Technology 2018, 32, 120–135. [Google Scholar]
- Garcia, M.; Nguyen, H. Resilience-Based Asset Management for Condensate Pipeline Systems. Asset Management & Maintenance 2021, 14, 179–194. [Google Scholar]
- Chen, S.; Kim, Y. Dynamic Development Approaches for Improving Pipeline Resilience: A Systematic Review. Journal of Energy Systems Engineering 2016, 9, 45–60. [Google Scholar]
- Lopez, G.; et al. Reliability-Centered Maintenance Strategies for Gas Pipeline Networks: A Case Study Analysis. Journal of Maintenance Engineering 2019, 13, 68–83. [Google Scholar]
- Wilson, R.; et al. Real-Time Monitoring and Control Systems for Enhancing Pipeline Resilience. Proceedings of the International Pipeline Conference 2017, 58–72. [Google Scholar]
- Smith, J.; Lee, H. Predictive Analytics for Risk Mitigation in Gas Pipeline Systems. Journal of Predictive Maintenance 2020, 11, 132–147. [Google Scholar]
- Adams, P.; et al. Innovative Technologies for Pipeline Reliability Improvement: A Case Study of Condensate Systems. Journal of Energy Engineering 2015, 34, 87–101. [Google Scholar]
- Yang, L.; Wu, X. Resilience-Based Design Criteria for Gas Pipeline Networks in Seismic Zones. Earthquake Engineering & Structural Dynamics 2018, 22, 195–210. [Google Scholar]
- Martinez, E.; Clark, T. Dynamic Development Strategies for Enhancing Pipeline Resilience: A Simulation-Based Approach. Simulation & Gaming 2022, 17, 45–60. [Google Scholar]
- Hughes, R.; Patel, A. Asset Performance Management for Improving Pipeline Reliability: A Data-Driven Approach. Journal of Asset Management 2019, 16, 102–117. [Google Scholar]
Figure 1.
Task Approach.
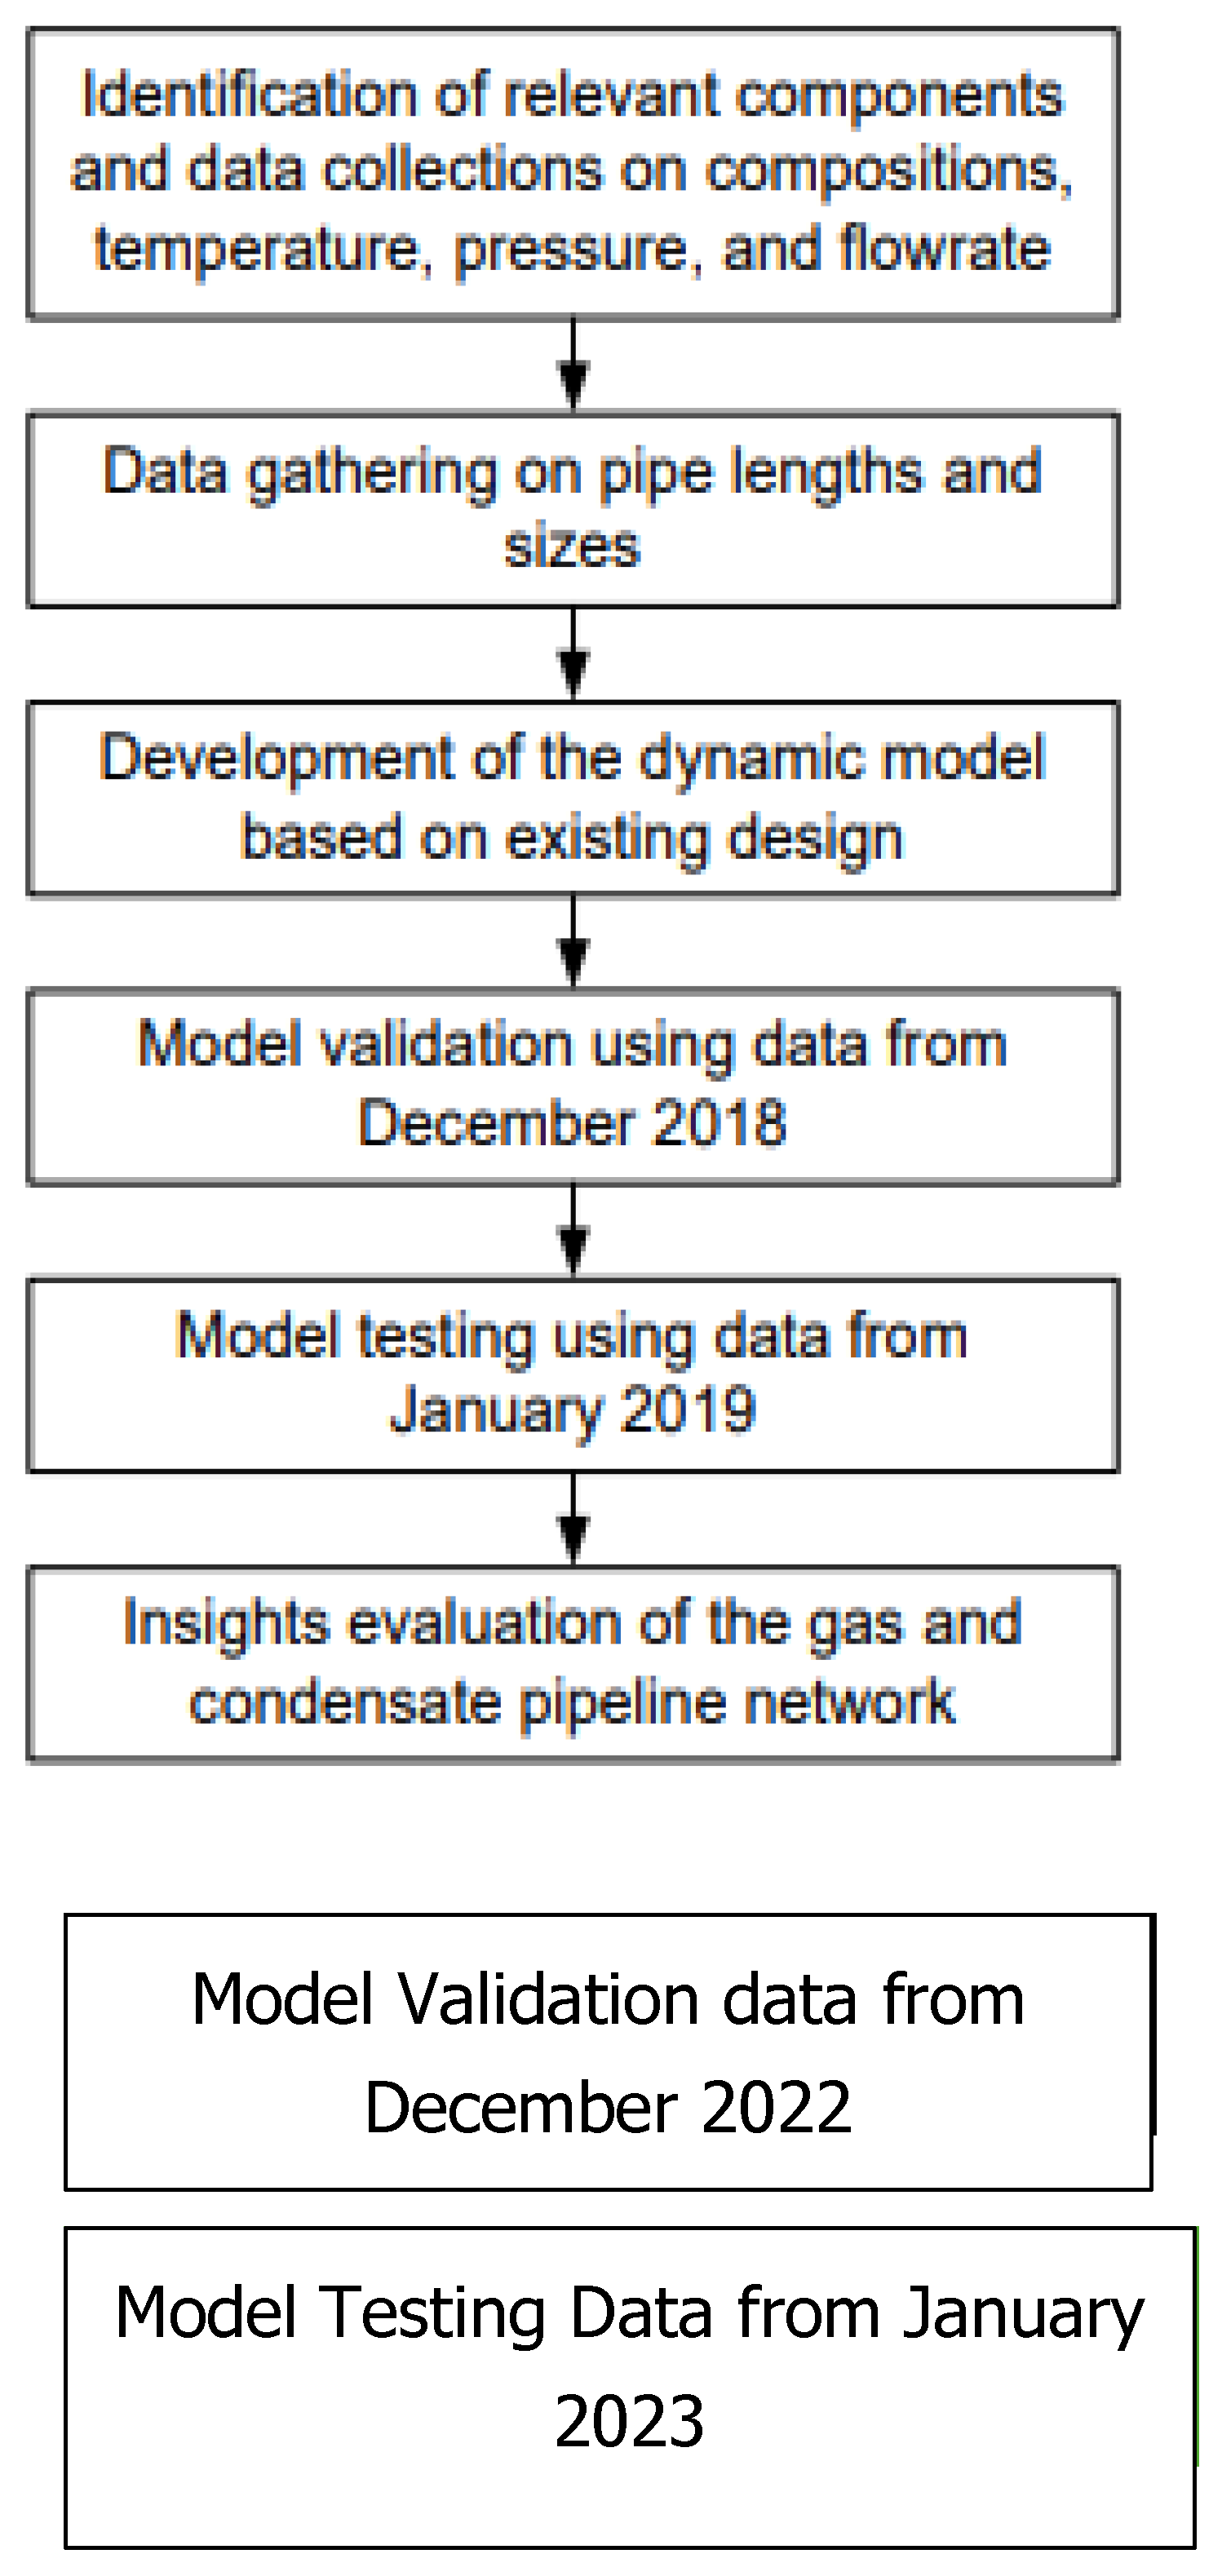
Figure 2.
Section (A): the plexus of gas and condensate that has to be modelled.(Nnadikwe & kwelle,2023). Section (B): the plexus of gas and condensate that has to be modelled (Nnadikwe & Kwelle,2023). Section (C)The plexus of gas and condensate modelled.(Nnadikwe & Iheme,2023). Section (D): The plexus of gas and condensate that has to be modelled.(Nnadikwe & Iheme,2023).
Figure 3.
Model created specifically for use in Section C.
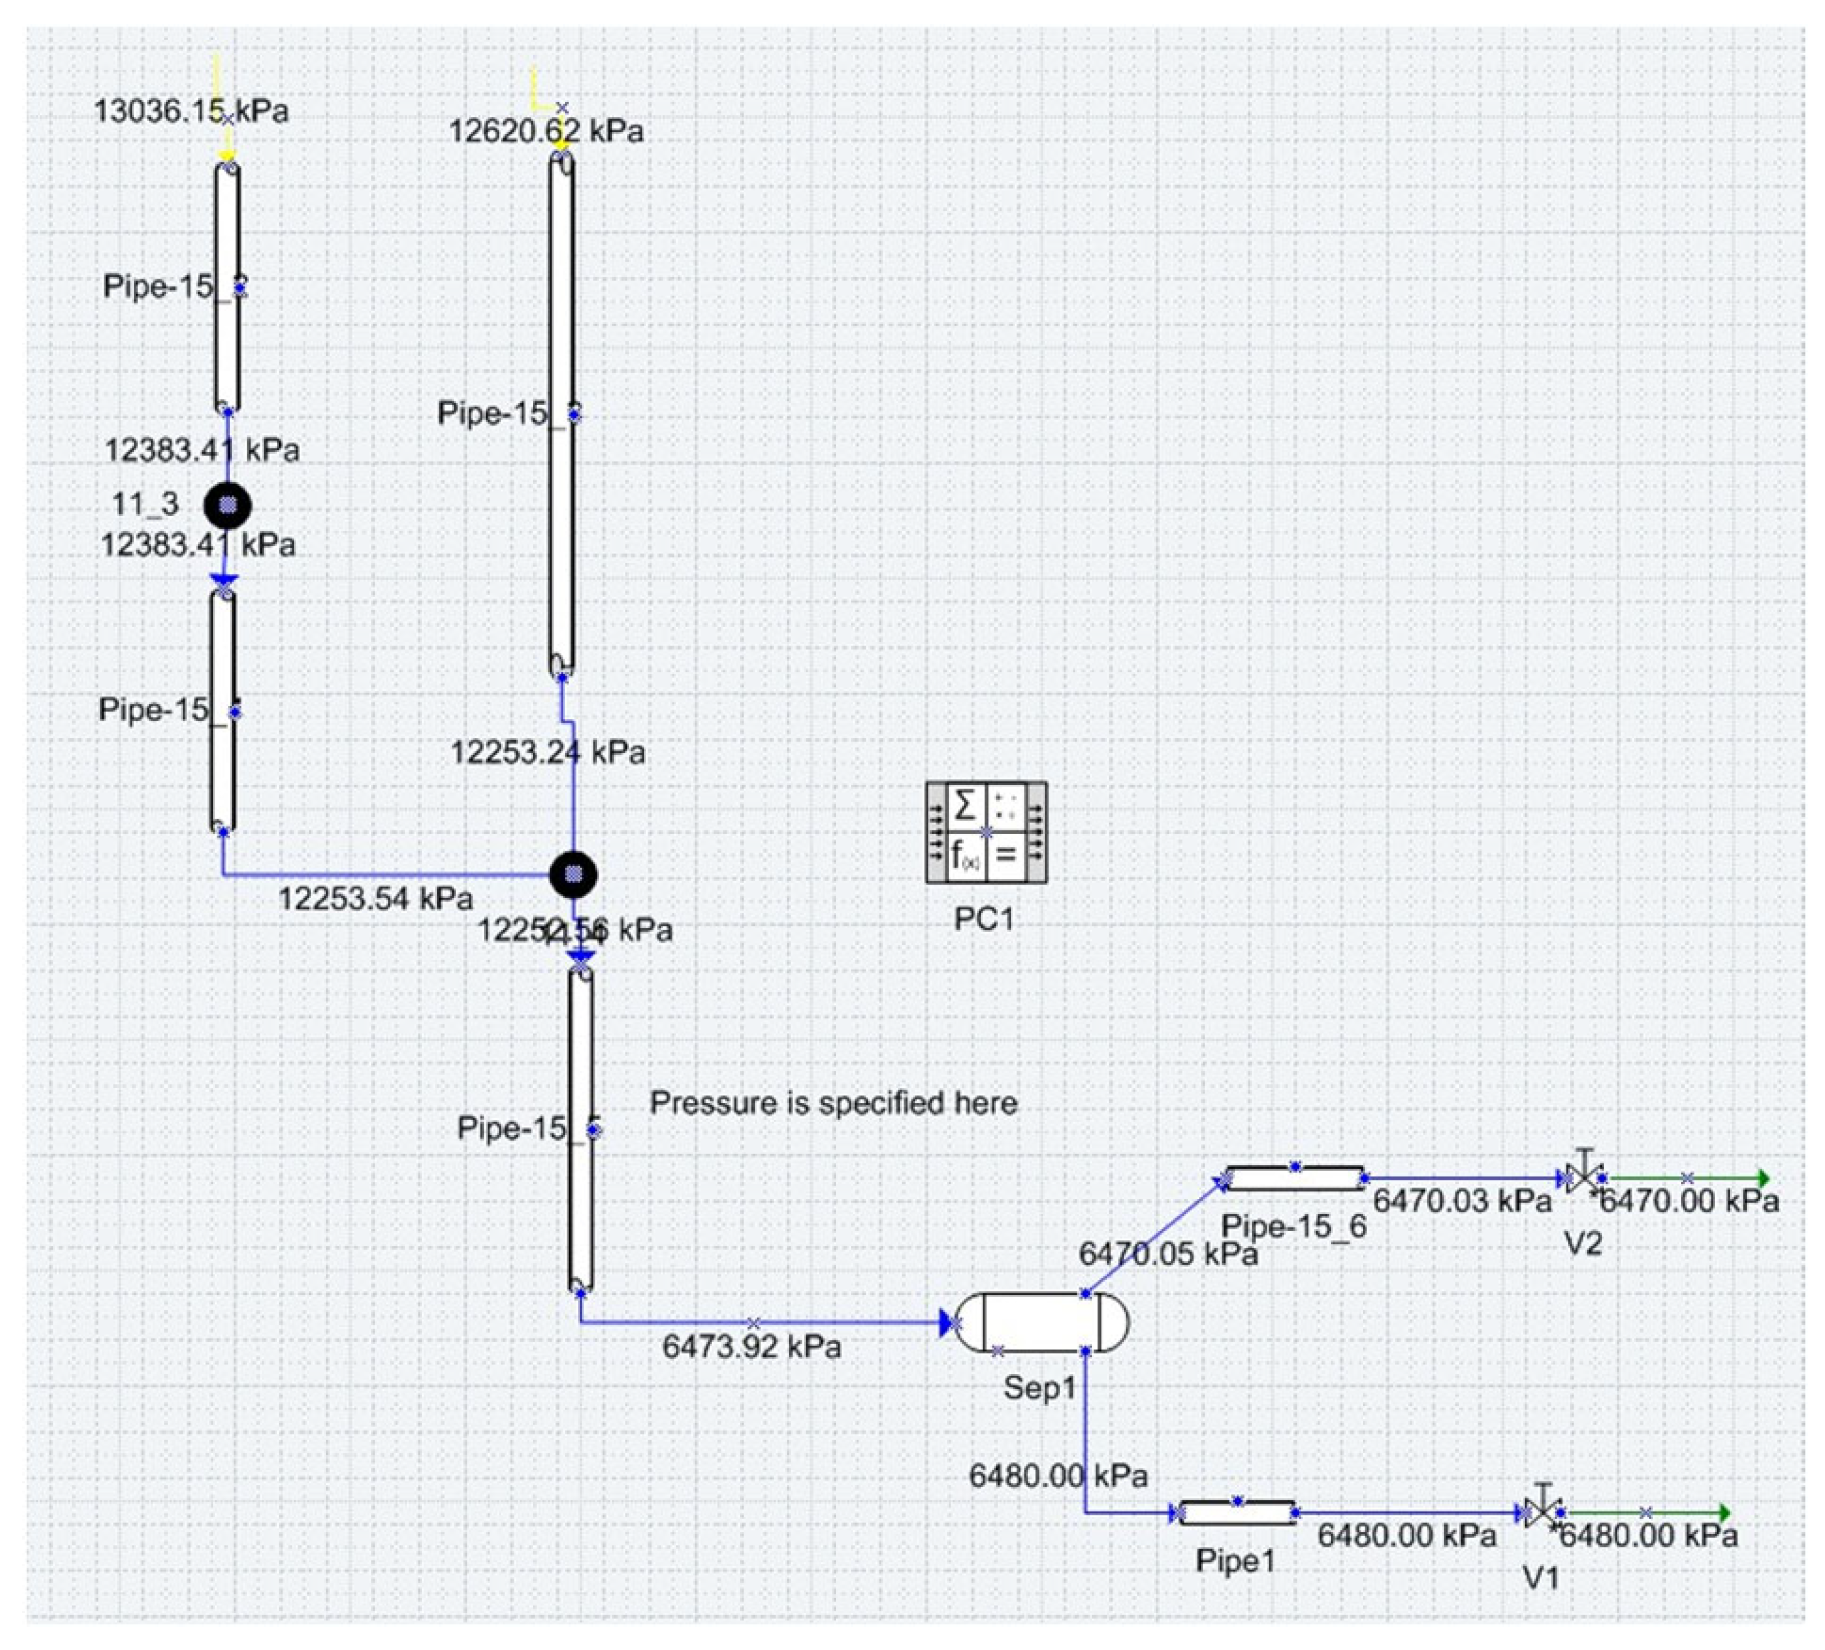
Figure 4.
Comparison of the forecasted flow of exported gas with the actual data from December 2022.
Figure 4.
Comparison of the forecasted flow of exported gas with the actual data from December 2022.
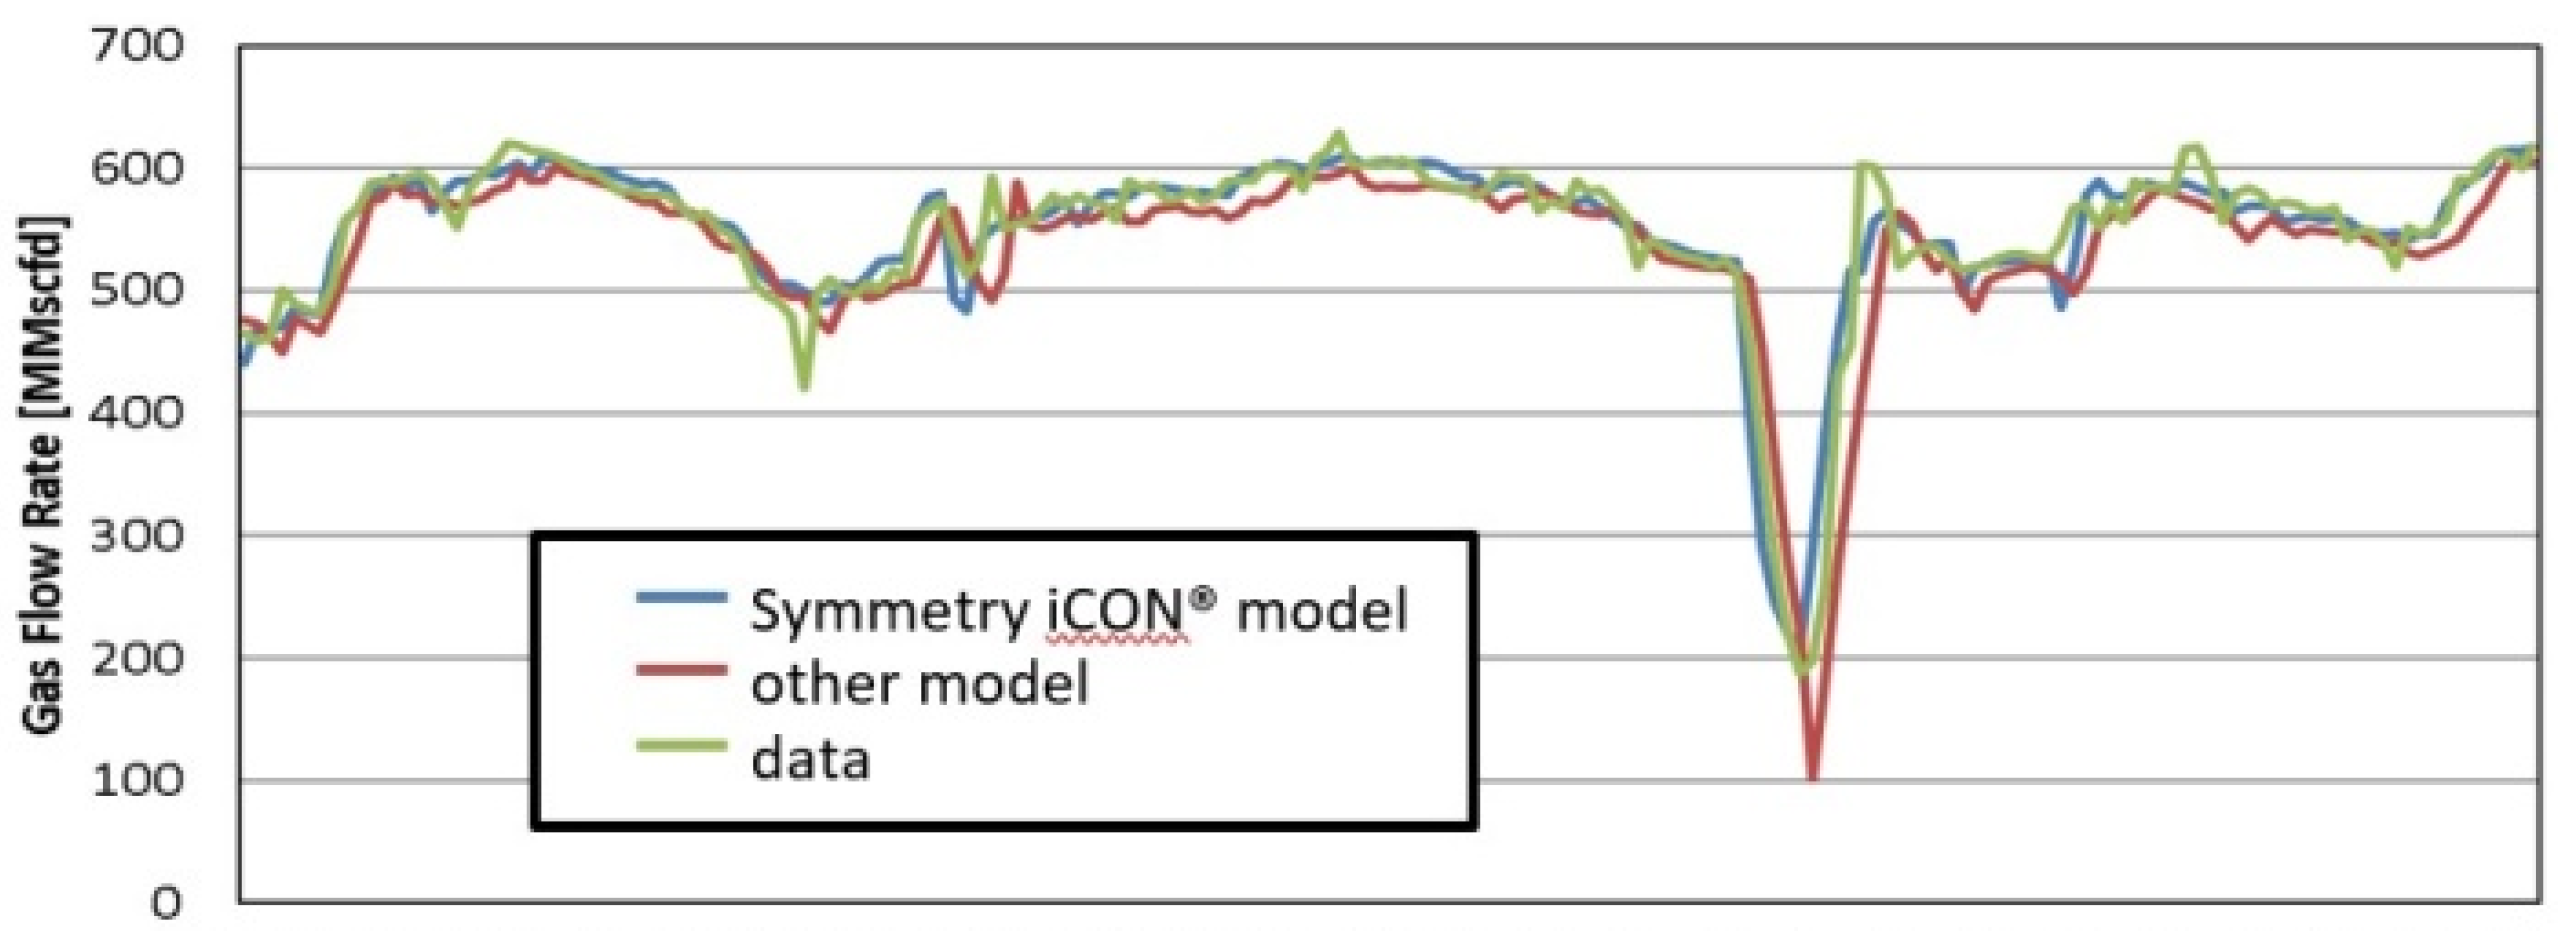
Figure 5.
Comparison of the predicted gas flow to the actual flow for the month of January 2023.

Figure 6.
The model accurately anticipated that daily condensate would be created. Model created from December 1st 2022- December 31st 2022 (the daily gas condensate).
Figure 6.
The model accurately anticipated that daily condensate would be created. Model created from December 1st 2022- December 31st 2022 (the daily gas condensate).
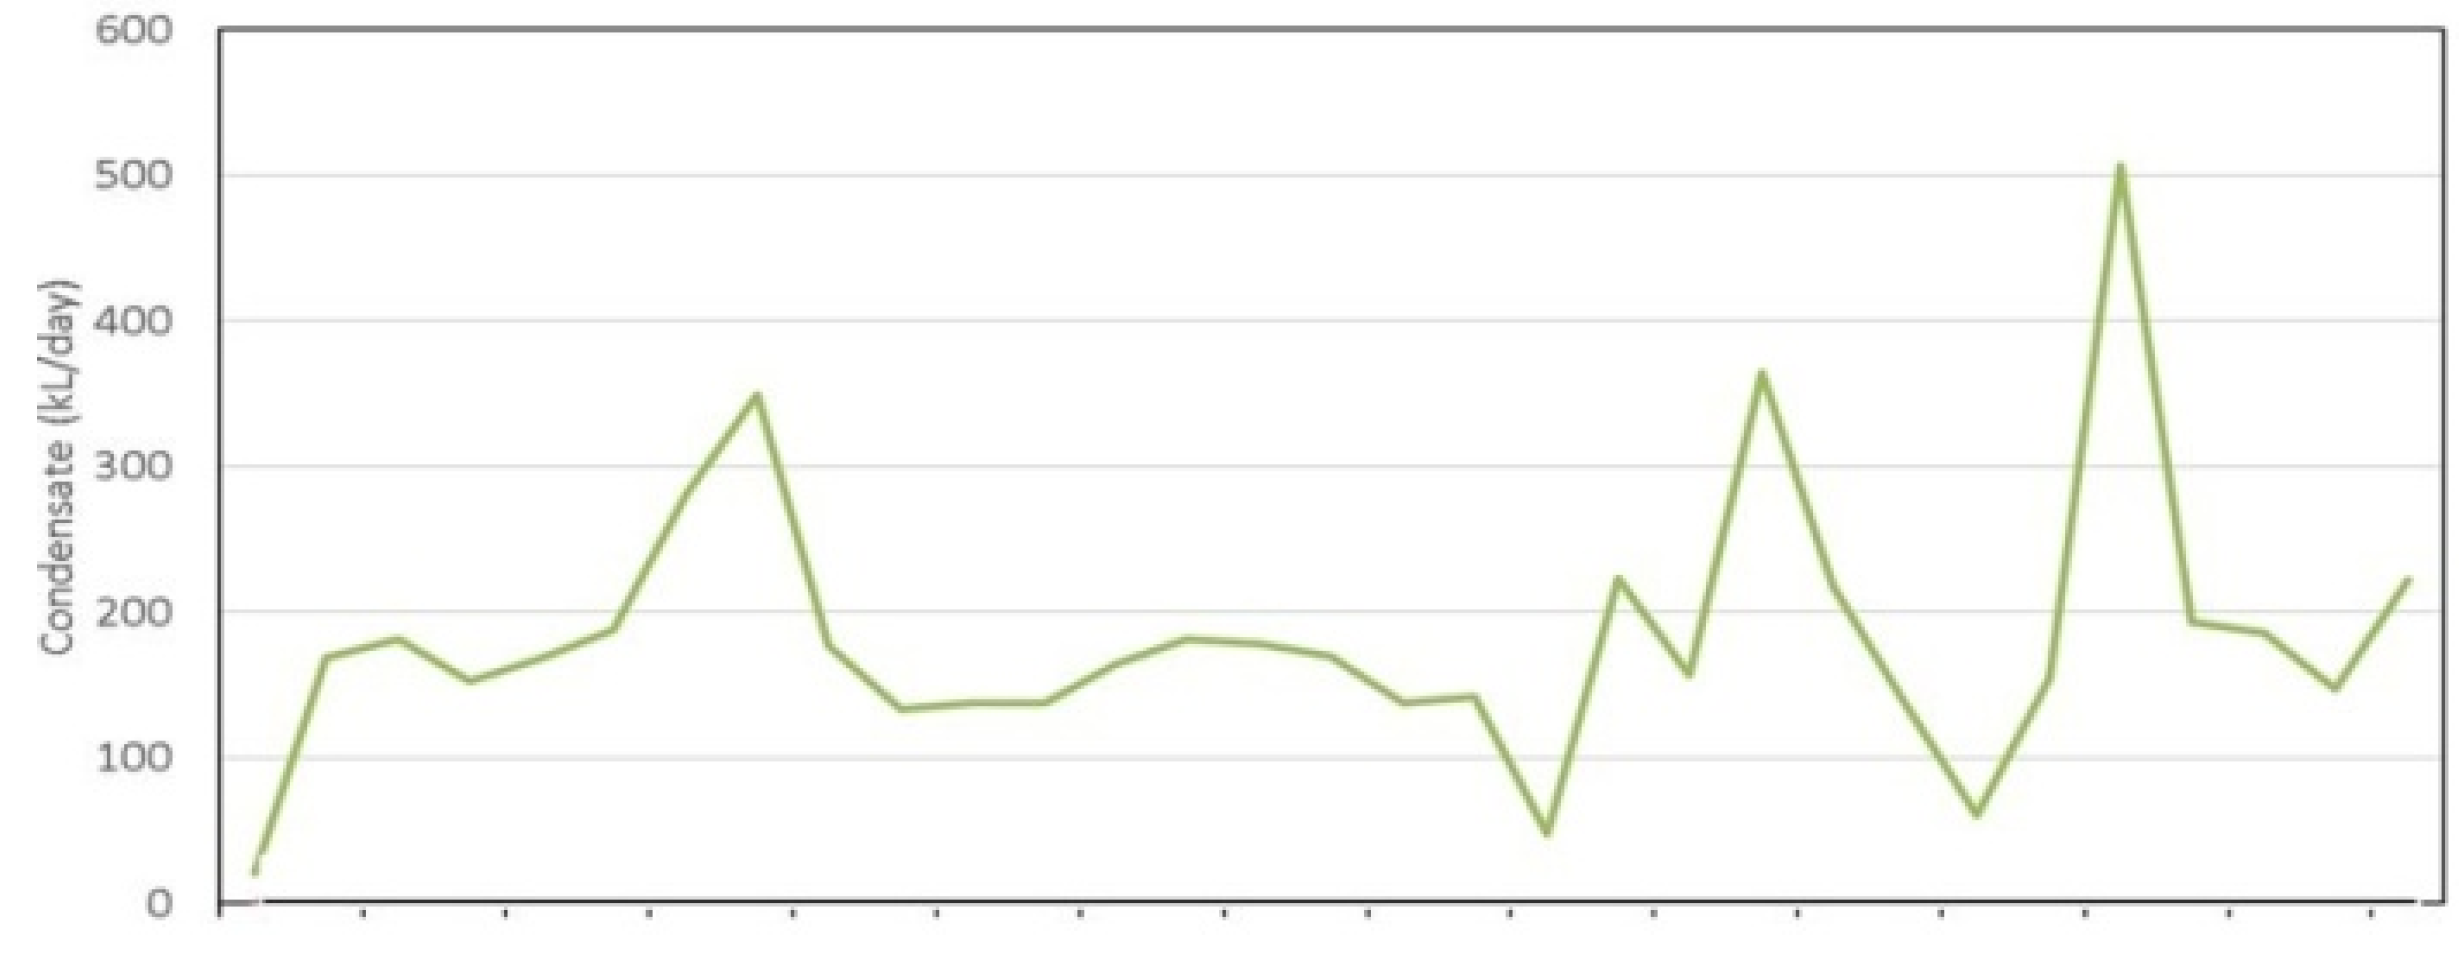

Table 1.
A portion of the data (in percentage of moles) included into the model.
| Components | Well 1 | Well 2 | Well 3 | Well 4 |
| Methane | 88.3726 | 88.3726 | 88.4344 | 85.9195 |
| Ethane | 5.8988 | 5.8988 | 4.7544 | 6.4187 |
| Propane | 1.7538 | 1.7538 | 2.7475 | 2.3311 |
| i-Butane | 0.5082 | 0.5082 | 0.9646 | 0.5767 |
| n-Butane | 0.3646 | 0.3646 | 0.5634 | 0.5007 |
| i-Pentane | 0.1946 | 0.1946 | 0.0096 | 0.2410 |
| n-Pentane | 0.1196 | 0.1196 | 0.0050 | 0.1509 |
Table 2.
Using calculated gas densities, a more refined Peng-Robinson model is validated (only few results are shown here).(Nnadikwe & Kwelle ,2022).
Table 2.
Using calculated gas densities, a more refined Peng-Robinson model is validated (only few results are shown here).(Nnadikwe & Kwelle ,2022).
| Field Name | Month | Measured densities(kg/Sm3) | Predicted Densities using symmetry iCON |
| Programme 1 | 1-Dec-22 | 0.93945 | 0.9434 |
| Programme 2 | 1-Dec-22 | 0.856525 | 0.8596 |
| Programme 3 | 1-Dec-22 | 1.540857 | 1.506 |
| Programme 4 | 1-Dec-22 | 0.837126 | 0.8404 |
| Programme 5 | 1-Dec-22 | 0.817618 | 0.8198 |
| Programme 6 | 1-Dec-22 | 0.808428 | 0.813 |
| Programme 7 | 1-Dec-22 | 0.873185 | 0.8751 |
| Programme 8 | 1-jan-23 | 0.665543 | 0.9261 |
| Programme 9 | 1-Dec-22 | 0.875611 | 0.8787 |
| Programme 10 | 1-Dec-22 | 0.791686 | 0.7926 |
Disclaimer/Publisher’s Note: The statements, opinions and data contained in all publications are solely those of the individual author(s) and contributor(s) and not of MDPI and/or the editor(s). MDPI and/or the editor(s) disclaim responsibility for any injury to people or property resulting from any ideas, methods, instructions or products referred to in the content. |
© 2024 by the authors. Licensee MDPI, Basel, Switzerland. This article is an open access article distributed under the terms and conditions of the Creative Commons Attribution (CC BY) license (http://creativecommons.org/licenses/by/4.0/).
Copyright: This open access article is published under a Creative Commons CC BY 4.0 license, which permit the free download, distribution, and reuse, provided that the author and preprint are cited in any reuse.


