Submitted:
19 April 2024
Posted:
23 April 2024
Read the latest preprint version here
Abstract
The G-protein-coupled estrogen receptor (GPER; G protein-coupled estrogen receptor 30, also known as GPR30) is a novel estrogen receptor and has emerged as a promising target for ovarian cancer. GPER, a seven-transmembrane receptor, suppresses cellular viability and migration in studied ovarian cancer cells. However, its impact on the fallopian tube, which is the potential origin of high-grade serous (HGSC) ovarian cancer, has not been addressed. This study was conducted to evaluate the relationship of GPER, ovarian cancer subtypes, i.e., high-grade serous cell lines (OV90 and OVCAR420), as well as potential HGSC ovarian cancer origin (i.e., the fallopian tube cell line FT190). The selective ligand assessed here is the agonist G-1, which was utilized in an in vitro study to characterize its effects on cellular viability and migration. As a result, this study has addressed the effect of a specific GPER antagonist in combination with an agonist on cell viability, providing a better understanding of the effects of these compounds on our diverse group of studied cell lines. Strikingly, attenuated cell proliferation and migration behaviors were observed in the presence of G-1. Thus, our in vitro study reveals the impact of the origin of HGSC ovarian cancers and highlights the GPER agonist G-1 as a potential therapy for ovarian cancer.
Keywords:
GPER receptor
; Therapeutic
; Fallopian Tubes
; Ovarian Cancer
1. Background
The most lethal gynecologic carcinoma is ovarian cancer. This cancer has a 5-year survival rate of ~45%, making it the fourth most common cancer with regards to mortality among Western nations [1,2,3]. The identification of molecular targets could aid in developing pharmacologic therapies to improve the prognosis for ovarian cancer [4]. GPER expression is known to be significantly lower in ovarian cancer tissue compared to benign and low-malignant ovarian tumors, indicating its potential role as a biomarker for disease progression and a potential molecular target for ovarian cancer [5]. The novel GPER is a 7-transmembrane G protein-coupled receptor [6]. Until the discovery of GPER agonists and antagonists, it was challenging to determine the mechanisms through which GPER mediates its estrogen activity because estrogens are ligands for both GPER and estrogen receptors (ERs) [7,8,9]. Selective GPER agonists and antagonists have recently been discovered to differentiate GPER-mediated estrogen activity from that of ER [10,11,12]. Consequently, G-1 1-[4-(6-bromobenzo[1,3]dioxol-5yl)-3A, 4,5, 9B, tetrahydro-3H cyclopenta[c] quinolin-8-yl]-ethanone has been recently demonstrated to be a GPER agonist [10]. Previous studies have shown that G-1 is a high-affinity, non-steroidal, and selective GPER agonist [10,11]. The G-1 agonist is substantially selective for GPER, but not ER α or ER β, making it feasible to investigate GPER’s mechanism of action in various cancers [10,11].
Hence, the discovery of the novel GPER-specific ligand G-1 has opened up new avenues for exploring the effects of GPER on the proliferation and migration of ovarian cancer cells [9,13]. Researchers have previously utilized G-1, a selective agonist of GPER, to investigate its effects on proliferation in OVCAR3 (a high-grade serous cancer, HGSC) and SKOV3 (a non-high-grade serous cancer, non-HGSC) cells [5,14]. These findings revealed that G-1 could effectively suppress proliferation in OVCAR3 and SKOV3 cells via inhibiting cell cycle progression at the G2/M phase and by promoting caspase-dependent apoptosis [5,14]. In another study, IGROV-1 and SKOV-3, non-HGSC cell lines, were used to investigate the effects of G-1 on ovarian cancer cells [9]. The results illustrated that G-1 was able to suppress proliferation and induce apoptosis in these cells by blocking tubulin polymerization, a process crucial for cell division [9]. Additionally, the G-1 agonist has previously been suggested to have anti-proliferative activity by interfering with microtubules via targeting the colchicine-binding region of tubulin [15]. This result suggests that G-1 may hold promise as a potential therapeutic agent for ovarian cancer treatment by targeting tubulin dynamics [9]. In a recent study, it was also observed that treatment with G-1 (1 μM) led to increased levels of H3K4me3 and p-ERK1/2 and resulted in attenuated cell proliferation and migration in Caov3 and Caov4 cells (HGSOC cell lines) [13,16]. These effects were attributed to the activation of GPER by G-1, indicating a potential regulatory role of GPER in modulating cell behavior in ovarian cancer cells [13]. The effects of different dosages (0.01, 0.1 and 1 μM) of G-1 agonist on GPER in high-grade serous ovarian cancer (HGSOC) cell lines (OV90 and OVCAR420) and particularly Fallopian tube cell line (FT190) remain unclear. Previous studies have identified HGSC ovarian cancer cell lines that are most suitable as in vitro models, such as OV90 and OVCAR420 models, based on the genomic profiles that closely resemble HGSOC tumor [17,18,19]. In this study, we comprehensively investigated a range of G-1 concentrations on HGSOC and fallopian tube cell lines in an attempt to understand the impacts of GPER on migration and proliferation. Therefore, our study aims to assess dose responses of G-1 and its effects on HGSOC and fallopian tube cell lines on migration, which has not been thoroughly examined previously.
2. Results
2.1. Effect of DMSO Concentrations on Cell Viability
To assess for any inhibitory effect due to the percentage (%) of DMSO (0%, 2%, 1%, 0.5%), cell viability was determined using the OV90, OVCAR420 and FT190 cell lines along with the Cell Titer-Glo assay, as depicted in Figure 1. Treatment of OV90, OVCAR420 and FT190 with DMSO concentrations of 2% and 1% percent treatment resulted in decreased cell viability while 0.5% had no effect on cell viability.
2.2. Inhibitory Effect of the G-1 Agonist on Cell Viability
To assess the potential for any inhibitory effect due to dosing with the G-1 agonist, cell viability was determined using the OV90, OVCAR420 and FT190 cell lines along with the Cell Titer-Glo assay, as depicted in Figure 2. G-1 agonist treatment of OV90, OVCAR420 and FT190 with the G-1 agonist resulted in decreased cell viability, with varying median effective (IC50) concentrations observed. OV90, OVCAR420 and FT190 IC50 were: 1.06, 2.58 and 6.97 µM, respectively. As can be noted by their respective IC50, OV90 and OVCAR420 were more sensitive to the G-1 agonist as compared with FT190.
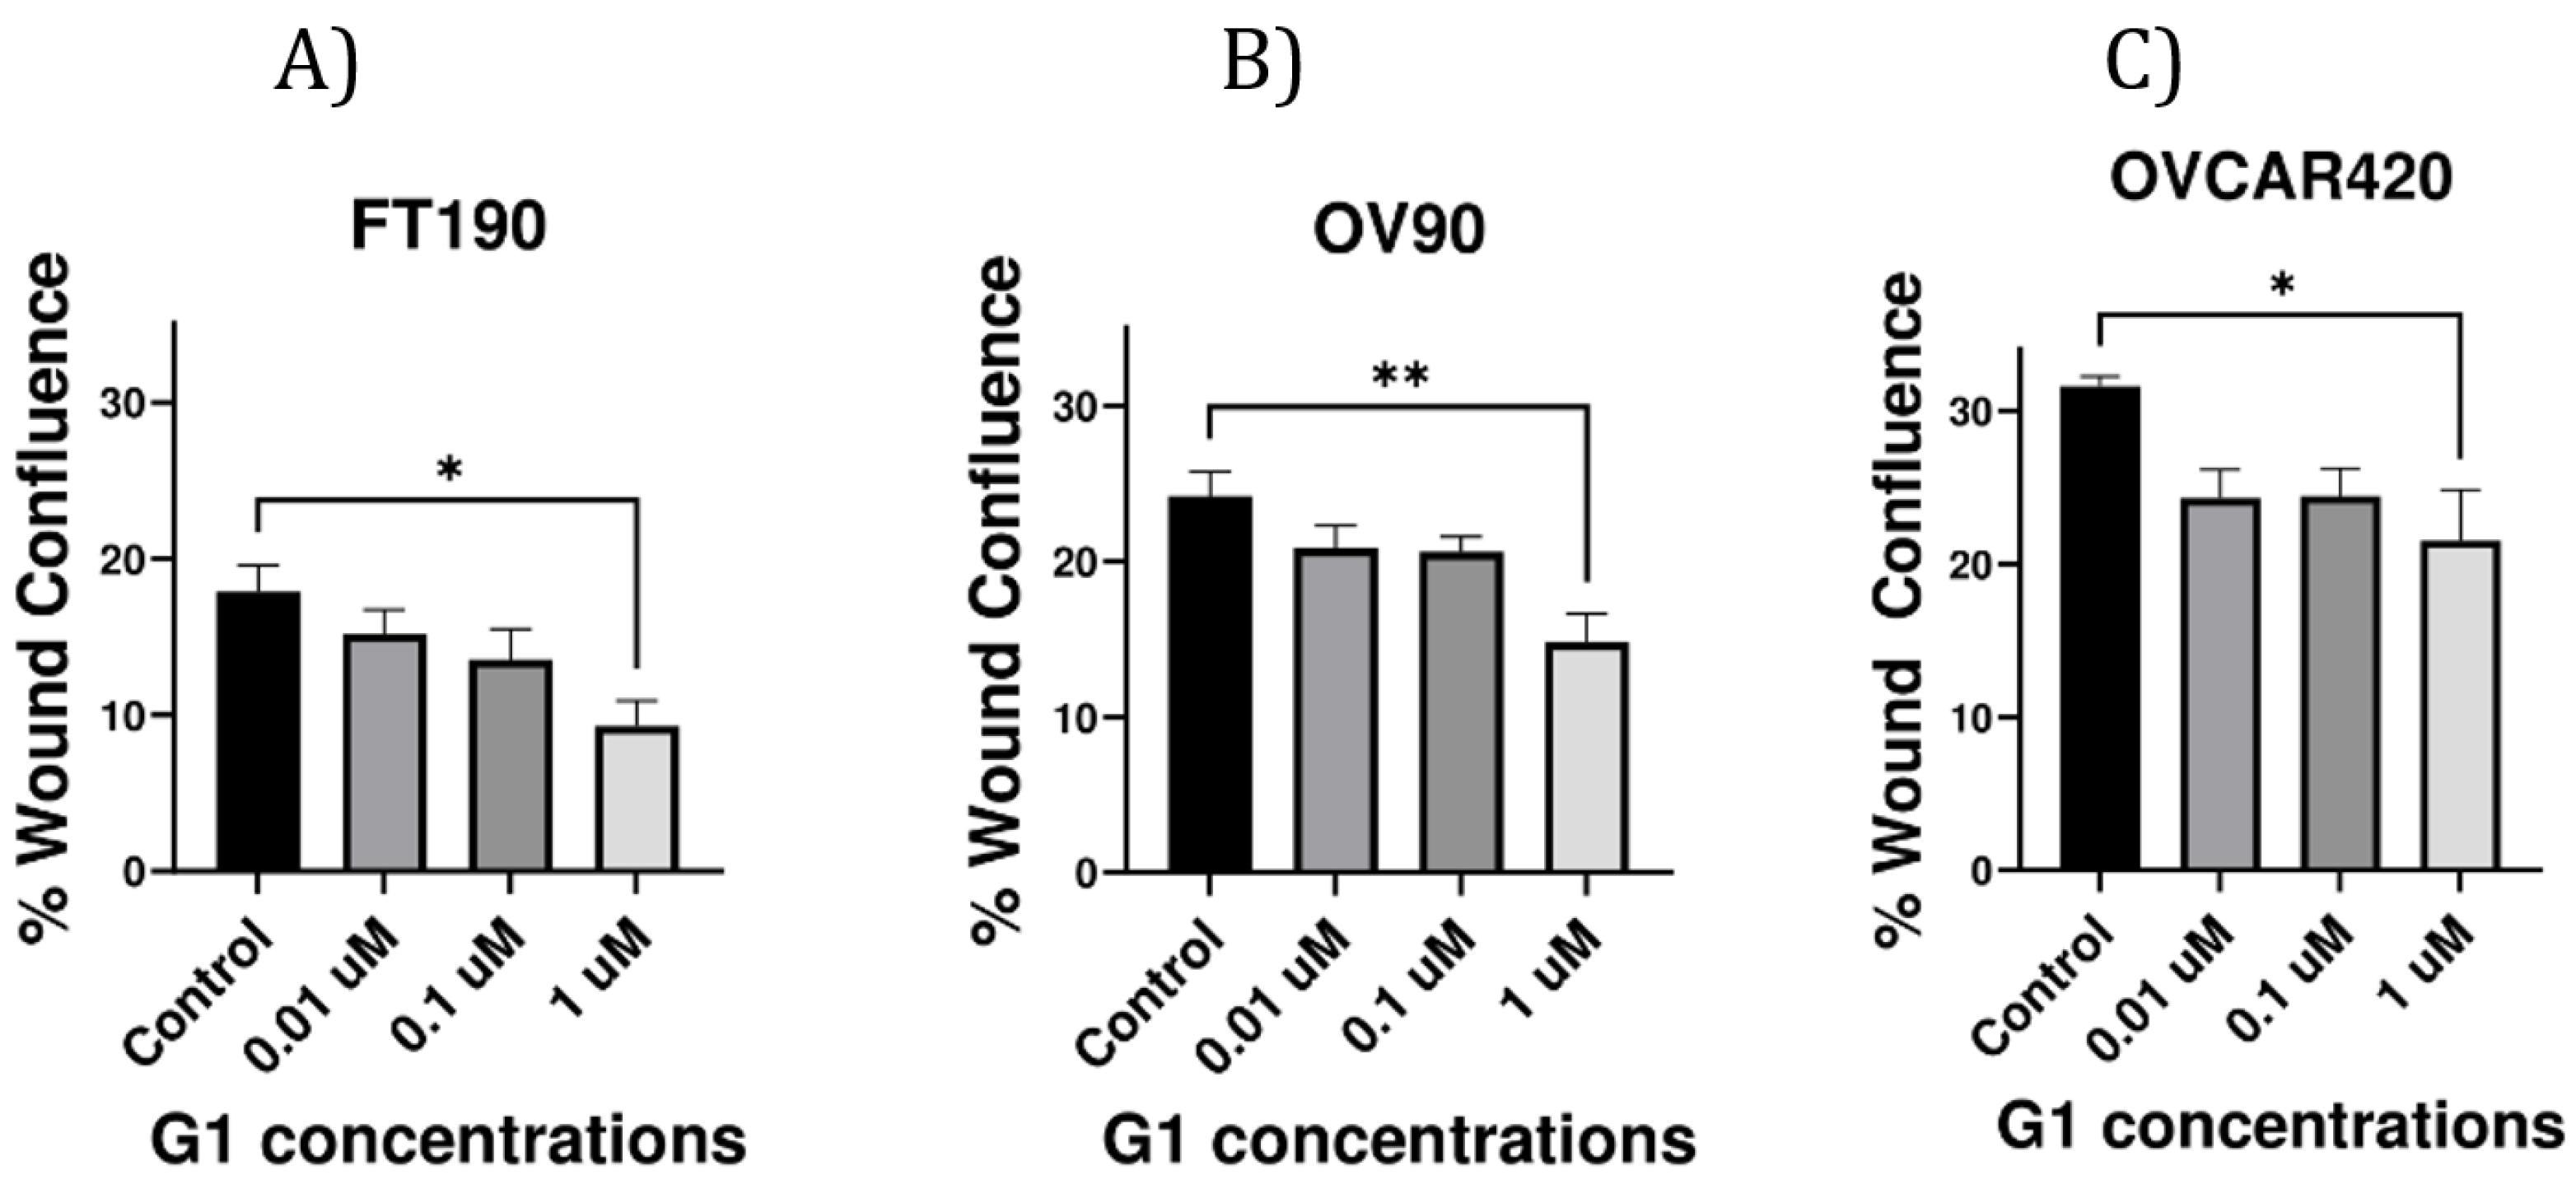
2.3. Inhibitory Effect of G-1 Agonist on Cell Migration
Cell migration is a critical step in the metastatic progression of ovarian cancer. Thus, the impact of G-1-induced activation of GPER on cell migration in the studied cell lines was assessed using the wound healing assay. A “Wound Healing” assay (also known as a “Scratch Assay”) was conducted to better characterize the role of GPER in cell migration (Figure 3). Untreated FT190 and OV90 cells exhibited a much slower wound-healing rate as compared with untreated OVCAR420 cells. The wound healing assay revealed a substantial reduction in cell migration at 1 µM G-1 in all of the examined cell lines. Moreover, G-1 agonist at 0.01, 0.1 or 1 µM all inhibited migration in all of the studied cell lines. Thus, a 12-hr treatment with 1 μM G-1 significantly decreases cell migration in FT190, OV90 and OVCAR420 cells.
3. Methods and Methods
3.1. Cell Culture and Reagents
Human ovarian cancer cell lines (OVCAR420, OV90) and immortalized fallopian tube (FT190) were obtained from the Drapkin lab at University of Pennsylvania, American Type Culture Collection ((ATCC) and Dana-Farber Cancer Institute (DFCI), respectively. The cells were incubated (37°C) in a humid atmosphere with 5% CO2 and cultured using the recommended medium by the suppliers: Dulbecco’s modified Eagle’s medium/F12 (DMEM/F12; purchased from Hyclone) for OVCAR420, OV90 and FT190. The culture media were enriched with 10% fetal bovine serum (FBS) and an antibiotic-antimycotic solution, which consisted of penicillin (10,000 units/mL), streptomycin (10,000 µg/mL) and Amphotericin B (25 µg/mL). Antibiotic-antimycotic and FBS were purchased from Corning and Gibco, respectively. The day prior to the experiments, the medium was substituted with phenol-red free DMEM (Corning), supplemented with charcoal stripped FBS (Thermo Scientific) and antibiotic-antimycotic. G-1 (catalog# 3577; purchased from Tocris). All chemicals (agonist and antagonist) were dissolved in dimethylsulfoxide (DMSO).
3.2. Cell Viability Assay
Cells were seeded in phenol-red free DMEM (Corning) supplemented with charcoal stripped FBS and incubated for 24 h. Then, the next day cells were treated with each compound (final DMSO concentration was 0.5%) for 48 h and incubated (37°C). Finally, cell viability was evaluated using the Cell Titer-Glo Luminescent Cell Viability Assay (Promega). This assay was employed to quantify the number of viable cells in culture. It measures the presence of adenosine triphosphate (ATP), which serves as an indicator of metabolically active cells. The Cell Titer-Glo Substrate and Cell Titer-Glo Buffer were mixed in equal proportions, and 100 μL of the resulting mixture was added to each well containing 100 μL of growth medium containing cells. Cell lysis was initiated by placing the plates on an orbital shaker for 2 min, followed by a 10-min incubation period for the lysis reactions. Subsequently, ATP levels were quantified using a plate reading luminometer.
3.3. Migration Assay (Also Known as a “Wound Healing Assay”)
Cells were seeded in 96-well plates in phenol-red free DMEM (Corning) supplemented with charcoal stripped FBS and incubated for 24 h at 37°C with 5% CO2. Next, a linear wound was created in the cellular monolayer using the IncuCyte Wound Maker tool, followed by incubation with either treatment or control solution containing 0.5% DMSO for 12 h. The IncuCyte live cell imaging system was used to capture images of the cells after the wound was created, and imaging was conducted over a total duration of 12 h at a magnification of 10×. The IncuCyte®S3 program, Scratch Wound analysis pipeline was utilized to calculate the relative wound closure. Percent (%) wound confluence was calculated by means of the following equation [20]:
T0 refers to the initial open wound area immediately after creating the wound, while T12 represents the open wound area measured 12 h later.
3.4. Statistical Analysis
The mean ± SEM values of at least three separate experiments were performed. GraphPad Prism 9 software was used for data analysis. Differences between groups were analyzed using one-way analysis of variance (ANOVA) with Dunnett’s multiple comparison test by utilizing the GraphPad Prism 9 software (GraphPad Software, Inc., San Diego, CA).
4. Discussion
In the present study, our investigation focused on studying the impact of GPER on cell viability and migration in high-grade serous ovarian cancer cell lines, as well as in a cell line originating from the fallopian tube. This was achieved through a series of experimental methods and techniques. To investigate whether GPER/GPER activity might affect the viability of ovarian cancer cells, OV90, OVCAR420 and FT190 cells were incubated with increasing concentrations of the GPER-specific agonist G-1 for 48 h. Previous studies have demonstrated that the G-1 agonist can induce cell cycle arrest at 48 h, as measured via flow cytometry [5,13]. As a result, cell viability decreases, allowing for IC50 values to be determined [5,13]. However, the impact of G-1 activation of GPER on OV90, OVCAR420 and particularly FT190, a potential origin of HSGC, has not been studied previously. Here, our assessments of cell viability (at 48 h) in the presence of varying concentrations of G-1 (0.5% DMSO final concentration was utilized due to lack of effect on cell viability in studied cell lines such as that of various cancer cell lines such as the lung cancer cell line A549 [21] and human leukemia U937 cells [22]) allowed us to determine IC50 values of: 1.06, 6.95 and 2.58 μM for OV90, OVCAR420 and FT190, respectively. Likewise, earlier studies have suggested that activating GPER inhibits the proliferation of various human cancer cell lines [such as in breast [23], prostate [24] and colorectal cancer [25]]. For example, sustained activation of ERK1/2 through GPER activation has the potential to suppress the growth of colorectal cancer cells in vivo [25]. Using the prostate cancer cell line PC-3, a similar outcome was observed where GPER activation led to the sustained phosphorylation of ERK1/2 levels, ultimately leading to growth arrest [13].
However, the role of GPER in ovarian carcinogenesis remains a matter of controversy [26,27,28]. A previous in vitro study using the ovarian cancer cell lines Caov3 and Caov4 revealed that G-1 treatment led to a significant inhibition of proliferation [13]. Furthermore, activation of GPER through G-1 treatment resulted in sustained levels of p-ERK1/2 and increased H3K4me3 proteins in the Caov3 and Caov4 cells [13]. Sustained activation of ERK1/2 stimulates AP-1 proteins, which in turn triggers the expression of p21. This signaling cascade ultimately results in cell cycle arrest at the G2 checkpoint and, consequently, leads to inhibited cell growth [29].
Further, researchers found that treatment with the G-1 agonist activated GPER and resulted in the suppression of proliferation in another set of ovarian cancer cell lines (SKOV3 and OVCAR3 cells) [5]. The selective GPER agonist G-1 has been shown to suppress the proliferation of SKOV3 and OVCAR3 cells by inhibiting cell cycle progression. The blockade in cell cycle progression has been linked to the increased expression of cyclin B1 and Cdc2, as well as phosphorylation of histone 3. Furthermore, GPER stimulation leads to a perturbation of mitotic progression, resulting in increased mitotic duration, which triggers caspase-3 cleavage and ultimately leads to cell apoptosis [5]. In ovarian cancer cell lines (IGROV-1 and SKOV-3), G-1 has been found to block tubulin polymerization, which interrupts microtubule assembly and leads to cell cycle arrest in the prophase of mitosis. This results in the suppression of ovarian cancer cell proliferation and apoptosis [9]. These findings suggest that GPER activation via G-1 agonist could inhibit proliferation in cases of ovarian cancer [5,13].
Our findings further indicate that G-1 has inhibitory effects on the proliferation of the FT190, OV90, and OVCAR420 cell lines and are consistent with previous studies conducted using ovarian cancer models that also reported on an inhibition of proliferation [5,13]. Nevertheless, our results are inconsistent with other studies that have reported GPER promotes growth in the SKOV3 [27] and OVCAR5 [28] cell lines. However, these varying results could be attributable to the utilization of agonists and/or antagonists with distinct specificities, such as estrogen and 1,3-bis(4-hydroxyphenyl)-4-methyl-5-[4-(2-piperidinylethoxy)phenol]-1H-pyrazole dihydrochloride (MPP), in the other studies, and as opposed to our utilization of the specific G-1 agonist [13]. In contrast, the G-1 agonist has been identified as a crucial tool for researchers in studying the effects of GPER, owing to its selectivity for this receptor [9,13]. By specifically targeting GPER, the G-1 agonist has provided insights into the impact of GPER on cellular behavior [9,13]. Another recent study demonstrated that G-1 treatment inhibited proliferation and induced apoptosis in KGN cells (a human ovarian granulosa cell tumor cell line) in a GPER-independent manner [26]. However, as these results were obtained from a single ovarian cancer cell line, they may not be entirely representative and further investigations will likely be required.
To investigate whether GPER could influence the migration of the ovarian cancer cell lines OV90, OVCAR420 and FT190, cells were incubated with increasing concentrations of the GPER-specific agonist G-1 for 12 h. Similar studies conducted using in vitro experimental models have also determined that G-1 treatment effectively decreases the migration of the ovarian cancer cell lines Caov3 and Caov4 via activation GPER [13]. Additionally, earlier studies indicate that the activation of GPER inhibits proliferation and migration in diverse human cancer cell lines, including breast [23], prostate [24] and colorectal cancer [25].
5. Conclusion
In conclusion, based on the findings presented in this study, it can be concluded that the GPER agonist G-1 can inhibit cellular proliferation and migration in both the studied fallopian tube and ovarian cancer cell lines. These results indicate that G-1 may have the potential to be developed as an anti-cancer drug.
Author Contributions
The experiments were designed and analyzed by DH, RUO, KSK. DH conducted the experiments. The manuscript was written by DH with the contribution of all the authors. All authors approved the final manuscript.
Funding
This work was supported by R01-MD017405 (DH, KSK) from the NIH National Institutes of Health (NIH) Director’s Transformative Research Award and a RCMI-U54 RCHDR, 1U54MD012392, (DH, RUO, KSK) from the National Institute of Minority Health Disparities (NIMHD).
Data Availability Statement
The raw data supporting the conclusions of this article will be made available by the authors without undue reservation.
Acknowledgments
We thank the Drapkin Lab at the University of Pennsylvania and Dana-Farber Cancer Institute (DFCI) for providing the OVCAR420 and FT190 cell lines, respectively.
Conflicts of Interest
The authors declare that the research was conducted in the absence of any commercial or financial relationships that could be construed as a potential conflict of interest.
References
- Greenlee, R.T., et al., Cancer statistics, 2000. CA Cancer J Clin, 2000. 50(1): p. 7-33.
- Boente, M.P., et al., The biology of ovarian cancer. Curr Opin Oncol, 1993. 5(5): p. 900-7. [CrossRef]
- Marth, C., et al., Real-life data on treatment and outcomes in advanced ovarian cancer: An observational, multinational cohort study (RESPONSE trial). Cancer, 2022. 128(16): p. 3080-3089.
- Albanito, L., et al., G protein-coupled receptor 30 (GPR30) mediates gene expression changes and growth response to 17beta-estradiol and selective GPR30 ligand G-1 in ovarian cancer cells. Cancer Res, 2007. 67(4): p. 1859-66.
- Ignatov, T., et al., GPER-1 acts as a tumor suppressor in ovarian cancer. Journal of Ovarian Research, 2013. 6(1): p. 51. [CrossRef]
- Sharma, G., F. Mauvais-Jarvis, and E.R. Prossnitz, Roles of G protein-coupled estrogen receptor GPER in metabolic regulation. The Journal of Steroid Biochemistry and Molecular Biology, 2018. 176: p. 31-37. [CrossRef]
- Deroo, B.J. and K.S. Korach, Estrogen receptors and human disease. J Clin Invest, 2006. 116(3): p. 561-70. [CrossRef]
- Prossnitz, E.R. and M. Barton, The G-protein-coupled estrogen receptor GPER in health and disease. Nat Rev Endocrinol, 2011. 7(12): p. 715-26. [CrossRef]
- Wang, C., et al., The G-protein-coupled estrogen receptor agonist G-1 suppresses proliferation of ovarian cancer cells by blocking tubulin polymerization. Cell Death & Disease, 2013. 4. [CrossRef]
- Bologa, C.G., et al., Virtual and biomolecular screening converge on a selective agonist for GPR30. Nat Chem Biol, 2006. 2(4): p. 207-12. [CrossRef]
- Dennis, M.K., et al., In vivo effects of a GPR30 antagonist. Nature Chemical Biology, 2009. [CrossRef]
- Dennis, M.K., et al., Identification of a GPER/GPR30 antagonist with improved estrogen receptor counterselectivity. The Journal of steroid biochemistry and molecular biology, 2011. 127(3-5): p. 358-366. [CrossRef]
- Han, N., et al., The G-Protein-Coupled Estrogen Receptor (GPER) Regulates Trimethylation of Histone H3 at Lysine 4 and Represses Migration and Proliferation of Ovarian Cancer Cells In Vitro. Cells, 2021. 10(3). [CrossRef]
- De Haven Brandon, A., et al., Identification of ovarian high-grade serous carcinoma cell lines that show estrogen-sensitive growth as xenografts in immunocompromised mice. Scientific Reports, 2020. 10(1): p. 10799. [CrossRef]
- Lv, X., et al., G-1 Inhibits Breast Cancer Cell Growth via Targeting Colchicine-Binding Site of Tubulin to Interfere with Microtubule Assembly. Mol Cancer Ther, 2017. 16(6): p. 1080-1091. [CrossRef]
- Bourgeois, D.L., et al., High-grade serous ovarian cancer cell lines exhibit heterogeneous responses to growth factor stimulation. Cancer Cell International, 2015. 15(1): p. 112. [CrossRef]
- Domcke, S., et al., Evaluating cell lines as tumor models by comparison of genomic profiles. Nature communications, 2013. 4: p. 2126.
- Vishnu, P., et al., RhoB mediates antitumor synergy of combined ixabepilone and sunitinib in human ovarian serous cancer. Gynecol Oncol, 2012. 124(3): p. 589-97. [CrossRef]
- Duvaud, S., et al., Expasy, the Swiss Bioinformatics Resource Portal, as designed by its users. Nucleic Acids Research, 2021. 49(W1): p. W216-W227. [CrossRef]
- Buachan, P., L. Chularojmontri, and S. Wattanapitayakul, Selected Activities of Citrus Maxima Merr. Fruits on Human Endothelial Cells: Enhancing Cell Migration and Delaying Cellular Aging. Nutrients, 2014. 6: p. 1618-34. [CrossRef]
- Li, Y., et al., Curcumin inhibits human non-small cell lung cancer A549 cell proliferation through regulation of Bcl-2/Bax and cytochrome C. Asian Pac J Cancer Prev, 2013. 14(8): p. 4599-602.
- Hajighasemi, F. and S. Tajic, Assessment of Cytotoxicity of Dimethyl Sulfoxide in Human Hematopoietic Tumor Cell Lines. Iranian Journal of Blood and Cancer, 2017. 9: p. 48-53.
- Chen, Z.-J., et al., Activation of GPER suppresses epithelial mesenchymal transition of triple negative breast cancer cells via NF-κB signals. Molecular Oncology, 2016. 10(6): p. 775-788.
- Chan, Q.K.Y., et al., Activation of GPR30 inhibits the growth of prostate cancer cells through sustained activation of Erk1/2, c-jun/c-fos-dependent upregulation of p21, and induction of G2 cell-cycle arrest. Cell Death & Differentiation, 2010. 17(9): p. 1511-1523.
- Liu, Q., et al., Epigenetic down regulation of G protein-coupled estrogen receptor (GPER) functions as a tumor suppressor in colorectal cancer. Molecular Cancer, 2017. 16(1): p. 87. [CrossRef]
- Wang, C., et al., The putative G-protein coupled estrogen receptor agonist G-1 suppresses proliferation of ovarian and breast cancer cells in a GPER-independent manner. American journal of translational research, 2012. 4(4): p. 390.
- Yan, Y., et al., Role of GPER on proliferation, migration and invasion in ligand-independent manner in human ovarian cancer cell line SKOV3. Cell Biochemistry and Function, 2015. 33(8): p. 552-559.
- Yan, Y., et al., The novel estrogen receptor GPER regulates the migration and invasion of ovarian cancer cells. Mol Cell Biochem, 2013. 378(1-2): p. 1-7. [CrossRef]
- Lau, K.-M. and K.-F. To, Importance of Estrogenic Signaling and Its Mediated Receptors in Prostate Cancer. International Journal of Molecular Sciences, 2016. 17: p. 1434. [CrossRef]
Figure 1.
DMSO tolerance. FT190 (A), OV90 (B) and OVCAR420 (C) were examined against the indicated DMSO concentrations.
Figure 1.
DMSO tolerance. FT190 (A), OV90 (B) and OVCAR420 (C) were examined against the indicated DMSO concentrations.
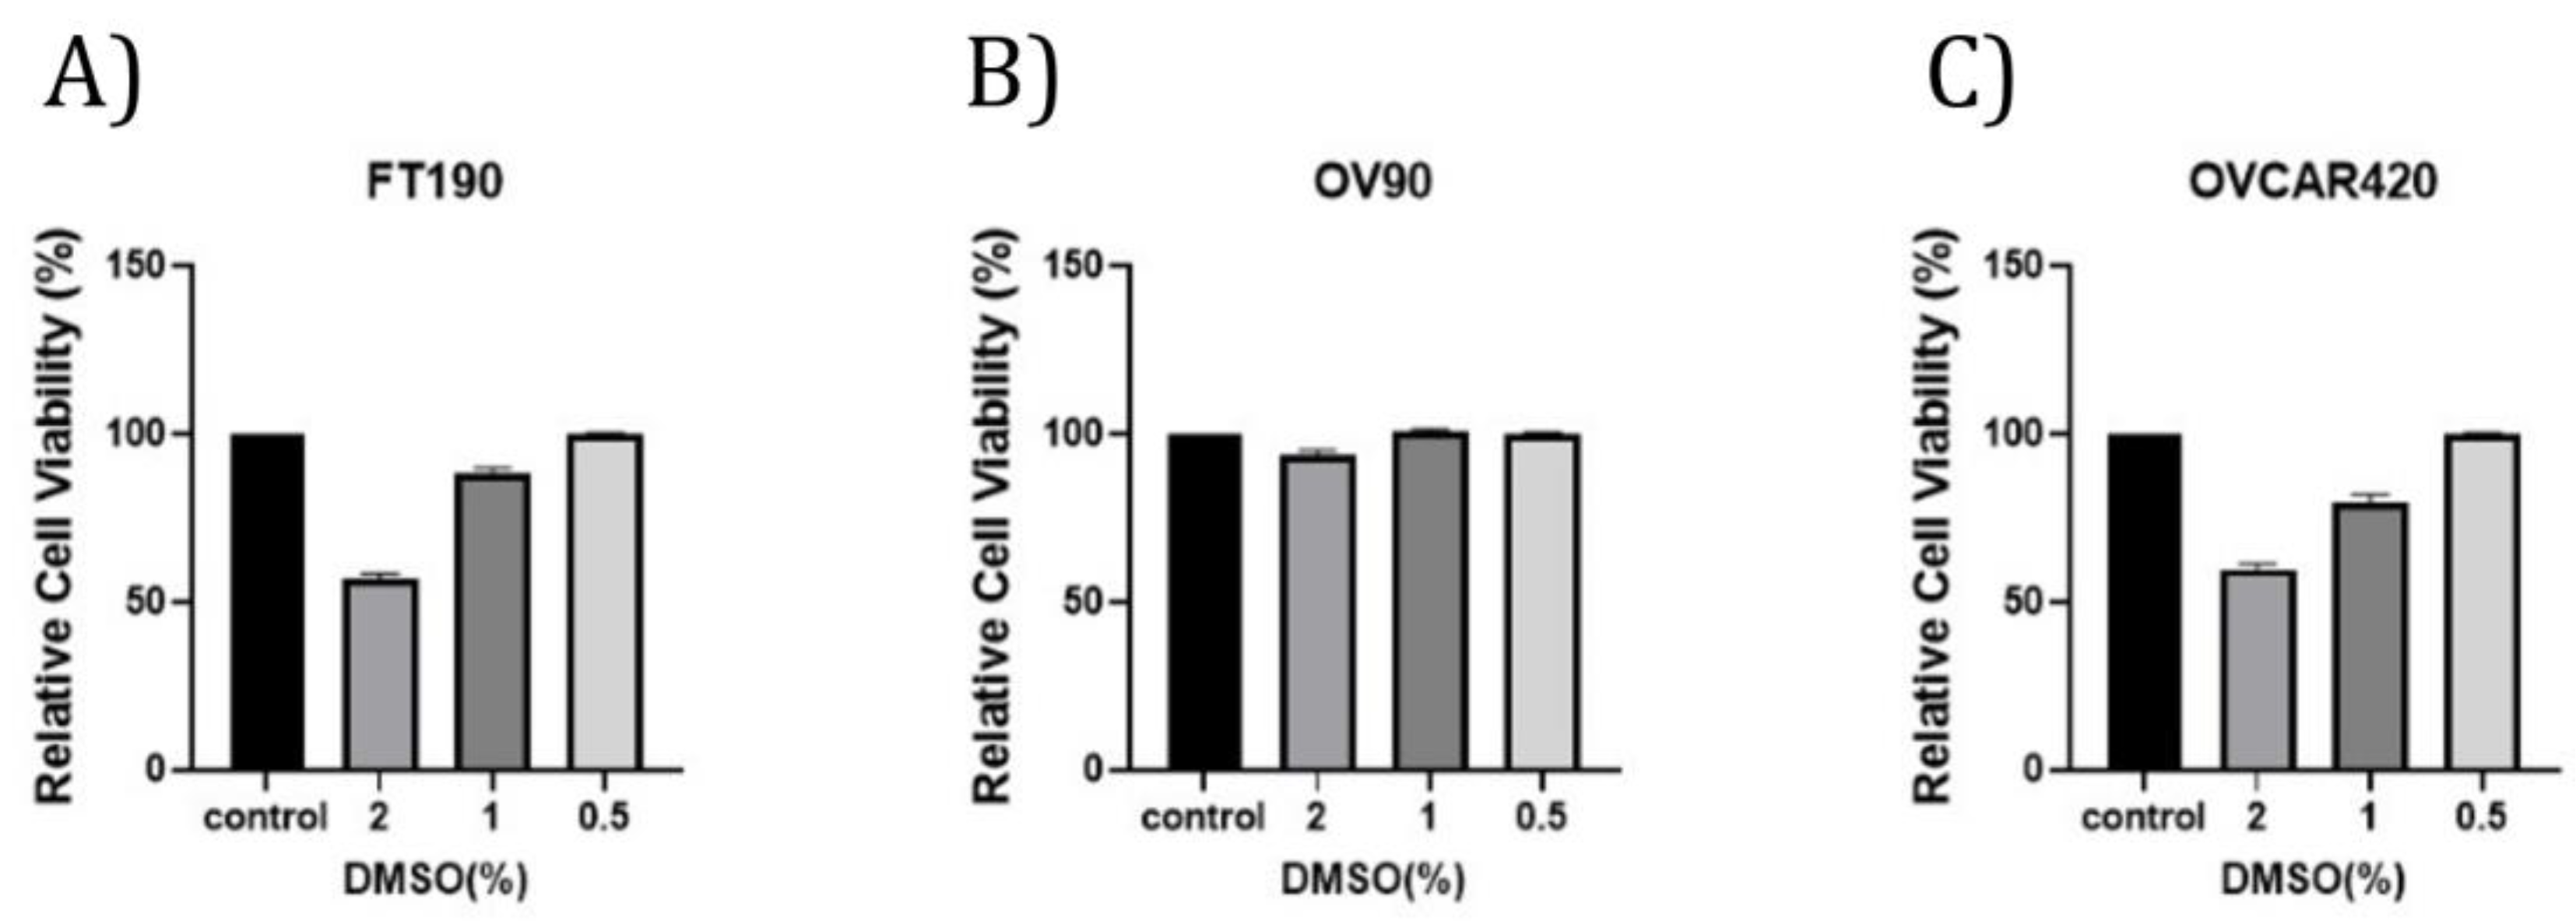
Figure 2.
G-1 Dose response curves. G-1 concentration-response curves for FT190 (A), OV90 (B) and OVCAR420 (C). Estimated IC50 values were 2.58, 1.06 and 6.97 µM for FT190, OV90 and OVCAR420, respectively. Incubation was for 48 h.
Figure 2.
G-1 Dose response curves. G-1 concentration-response curves for FT190 (A), OV90 (B) and OVCAR420 (C). Estimated IC50 values were 2.58, 1.06 and 6.97 µM for FT190, OV90 and OVCAR420, respectively. Incubation was for 48 h.
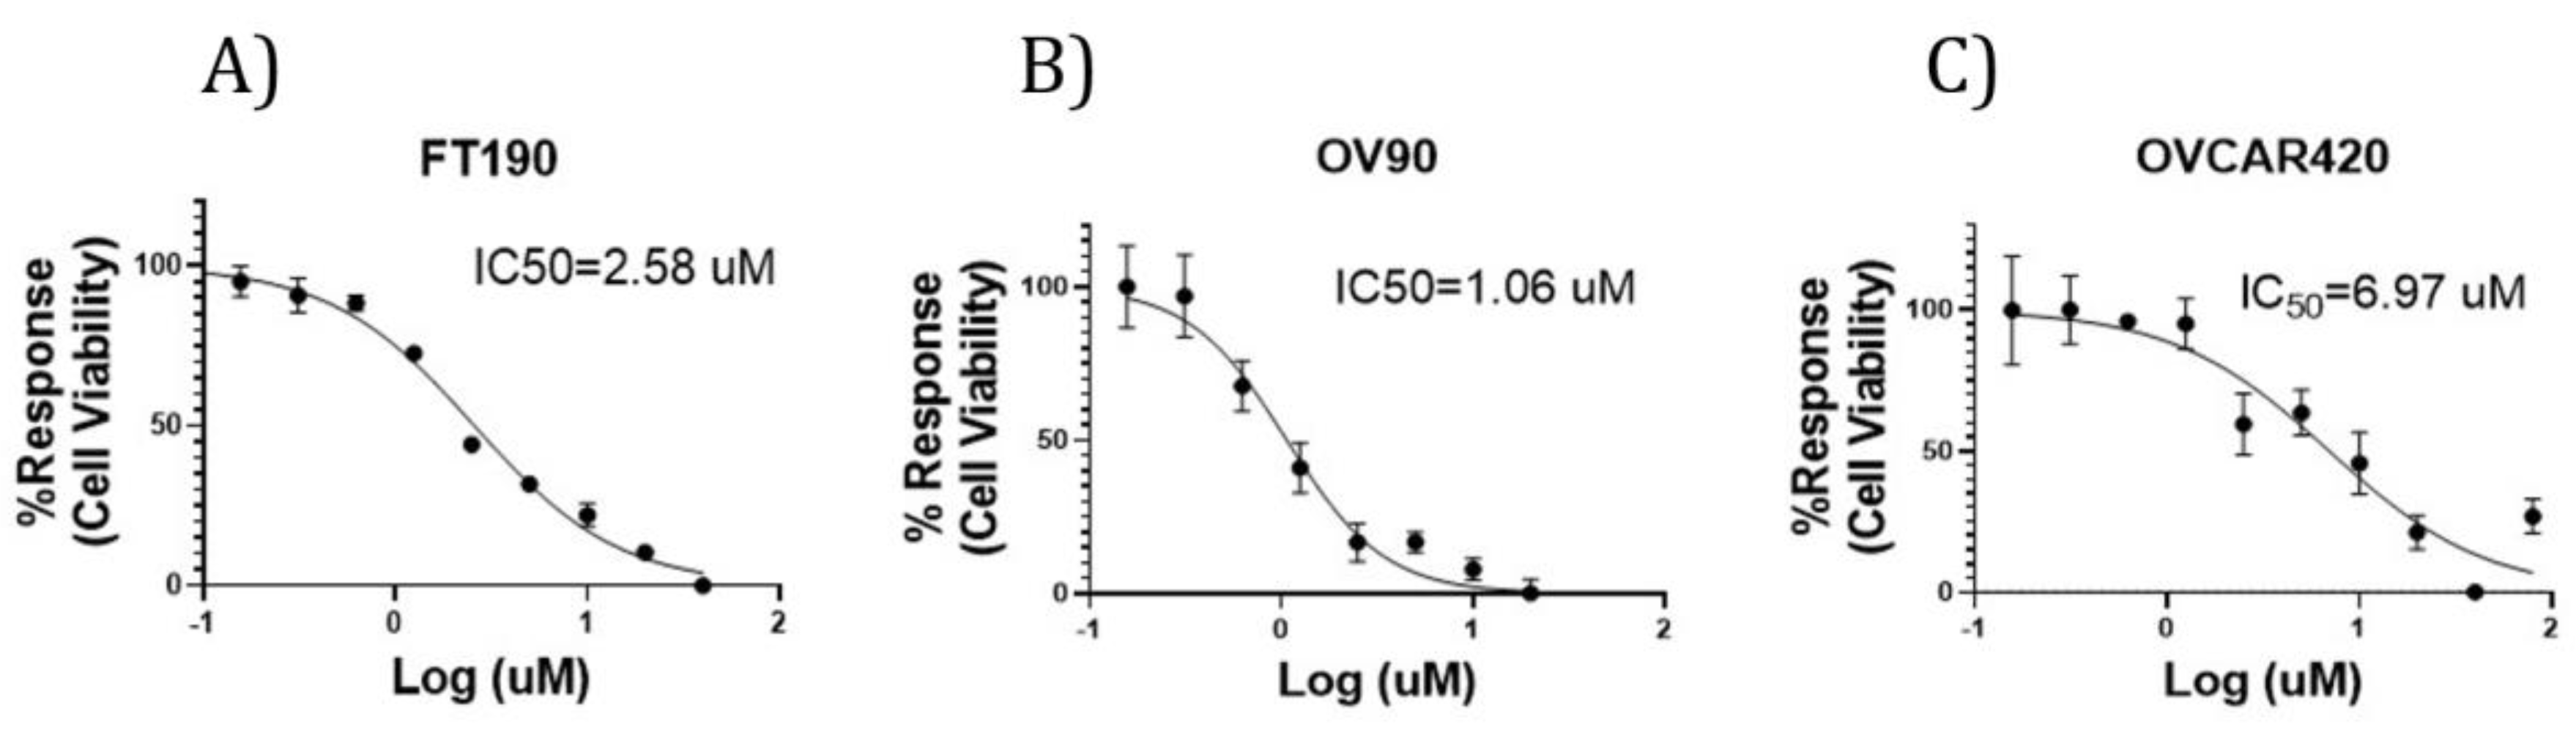
Figure 3.
Effect of GPER on migration. (A–C) Migration assays were performed using FT190, OV90 and OVCAR420 cells treated with the G-1 agonist for 12 hrs. Data are presented as the mean ± SEM for three separate experiments. *p < 0.05 vs. control, **p < 0.005 vs. control and ****p < 0.0001 vs. control. Statistical analyses were performed using ANOVA followed by Dunnett’s post-hoc test.
Disclaimer/Publisher’s Note: The statements, opinions and data contained in all publications are solely those of the individual author(s) and contributor(s) and not of MDPI and/or the editor(s). MDPI and/or the editor(s) disclaim responsibility for any injury to people or property resulting from any ideas, methods, instructions or products referred to in the content. |
© 2024 by the authors. Licensee MDPI, Basel, Switzerland. This article is an open access article distributed under the terms and conditions of the Creative Commons Attribution (CC BY) license (http://creativecommons.org/licenses/by/4.0/).
Copyright: This open access article is published under a Creative Commons CC BY 4.0 license, which permit the free download, distribution, and reuse, provided that the author and preprint are cited in any reuse.


