
Submitted:
18 April 2024
Posted:
18 April 2024
You are already at the latest version
Abstract
Tunnel-interchange connecting sections pose significant safety challenges on mountainous expressways due to their high incidence of accidents. Improving road safety necessitates a comprehensive understanding of driver behavior in such areas. This study explores the influences of road characteristics, signage information volume, and traffic conditions on drivers' car-following and lane-changing behavior in tunnel-interchange diverging areas. Utilizing driving data from 25 subjects of 72 simulated road models, driving performance is assessed using Friedman rank test and multivariate variance analysis. The results highlight the significant influence of both connection distance and signage information load on driving behavior. In tunnel-interchange scenarios, the reduction of velocity increased by 62.61%, and speed variability surged by 61.11%, indicating potential adverse effects on driving stability due to the environmental transitions. Decreased connection distances are associated with reduced lane-changing durations, larger steering angles, and increased failure rates. Furthermore, every two units increase in signage information leads to a 13.16% rise in maximum deceleration and a 5% increase in time headway. Notably, the signage information volume shows a significant interaction with connection distance (F=1.60, P=0.045) for most car-following indicators. Hence, the study recommends a maximum connection distance of 700 m and signage information not exceeding nine units for optimal safety and stability.
Keywords:
Tunnel-interchange sections
; Signage information volume
; Car following
; Lane changing
; Driving stability
; Road safety
1. Introduction
Tunnel-interchange connection sections, increasingly prevalent due to geographical constraints, present significant challenges to driving safety and stability. These sections, characterized by their small spacing and rapid environmental changes, often lead to complex traffic flow patterns and frequent vehicle interweaving. This unique environment critically affects two key driving behaviors: car-following (CF) and lane-changing (LC) [1]. Influenced by road infrastructure, the driving environment, and driver characteristics, these behaviors govern vehicles’ longitudinal and lateral movements, thereby impacting traffic flow efficiency and safety [2,3,4].
Drivers traveling on these connection sections must swiftly adapt to shifts in environmental lighting, interpret sign information, and detect LC opportunities within limited time frames [5,6], which may alter drivers’ decision-making processes and cognitive responses [7,8]. Nevertheless, due to the multitude of involved variables and the complexity of conducting empirical experiments, the driving behavior characteristics on these sections remain largely unconfirmed.
Understanding the combined effects of tunnel and interchange divergences on driving behavior is therefore crucial. While numerous studies have investigated driving characteristics in either scenario, their cumulative impact remains less explored. In tunnel sections, the drastic change in illuminance is a key factor affecting drivers’ perception of distance and speed [9,10,11]. Empirical data indicates that drivers respond more effectively when the lighting contrast between inside and outside the tunnel is minimal and the tunnel length is short. Otherwise, it may lead to increased velocity fluctuations and affect the reaction time [12]. Other factors such as visibility distance, visual bias, and tunnel length may also alter drivers’ perception, decision-making, and speed fluctuations [13,14,15,16].
Drivers aiming to exit the main line have to shift from the inner lane to the outer lane, resulting in frequent and concentrated forced diverging behaviors. This purposeful LC process is so-called mandatory lane changing (MLC) [17,18]. Multifarious factors influence MLC behavior in divergent areas. For example, research by Jetto [19] indicates that increased traffic density and a higher probability of braking substantially decrease the LC durations and accepted gap of drivers. Fatema and Hassan [20] posit that the closer a vehicle is to the end of the auxiliary lane, the more likely the driver is to diverge. Moreover, factors like roadway design [21,22], traffic control facilities [23], traffic flow [24], and interaction with surrounding vehicles [25] significantly dictate driving characteristics in divergence areas.
Additionally, drivers in diverging areas tend to focus their visual attention on obtaining directional information, often at the expense of monitoring traffic conditions ahead. This shift in focus is a notable contributor to traffic accidents [26]. In situations with an abundance of directional signs, the overload of information can increase drivers’ cognitive load, possibly leading to errors [27]. An excessive amount of signage has been associated with driver distraction, lane deviations, and speed variations [28]. While well-designed traffic facilities can improve drivers’ perception abilities, the placement of signs in connection sections is distinctly different from typical roadways due to the spatial constraints in tunnels [29]. Hence, the impact of connection section sign information on driving behavior warrants further exploration.
Previous research has made notable progress in exploring how visual contrasts, sign information, and divergent environments affect driver behavior. However, the added psychological strain faced by drivers near tunnel and interchange exits could impair their ability to process information and make decisions [6,11]. This issue is compounded in tunnels where lane changes are prohibited, forcing drivers to quickly interpret signage and identify opportunities for diverging lane changes under limited time and spatial conditions. These factors highlight the importance of re-examining and validating the existing findings in these specific roadway segments.
Regarding research methods, driving simulation tests are a primary research method for studying driving behavior under complex scenarios [30]. The driving simulation platform allows for the adjustment of test variables and comprehensive comparison and evaluation of different environment combinations and design schemes [31,32]. Detailed and synchronous driving behavior data obtained from simulations provide a foundation for in-depth analysis of behavioral indicators under various environmental stimuli [33].In combination with statistical tests, significant differences in driving behavior under complex scenarios can be further clarified.
Based on the analysis above, this study aims to investigate the driving behaviors in diverging areas of tunnel-interchange connection sections, taking into account vital environmental variables such as connection distance, volume of signage information, traffic conditions and tunnel length. Utilizing a high-precision driving simulation platform, this research accurately replicate tunnel-interchange scenarios, providing detailed behavioral data for comprehensive analysis. The findings can help identify factors that significantly influence driving behavior in these roadway sections, understand the main and interaction effects between environmental variables and different driving indicators, and uncovering the behavioral mechanisms influenced by these combined factors. The insights garnered from this research hold considerable implications for safety measures in small spacing sections of tunnel-interchanges, particularly the optimization of sign design.
2. Materials and Methods
A thorough and effective experimental dataset is essential for the evaluation of driving performance. In this study, driving simulation method are used to evaluate the influence of roadway environment on driving behavior. The connection sections of tunnel and interchange are selected as the simulation scenarios to collect the CF and LC characteristic in diversion areas, and compared with the general diversion sections (GDS). The simulation scenarios and facilities are designed with reference to the field cases of 11 expressway in Shaanxi, Jiangsu, Yunnan and Fujian provinces of China (Table 1).
2.1. Simulation Platform and Participants
The experiments utilized a six-degree-of-freedom (6-dof) vehicle motion simulation platform, complete with UC-win/Road 13.0 software (as shown in Figure 1). This platform includes a vehicle cockpit, steering wheel, brake and accelerator pedals, and automatic transmission, creating a realistic driving experience through visual, auditory, and kinematic feedback. The visual system incorporates three high-definition screens, offering a 130° horizontal and 40° vertical field of view. The auditory system simulates road and vehicle exhaust sounds, while the motion system delivers spatial 6-dof movement, allowing drivers to feel acceleration, turning, sideslip, and mimicking the sensation of vehicle vibration and road bumps.
Participants were selected based on the following criteria: 1) Good physical health; 2) Vision of 5.0 or better, corrected or uncorrected, with no eye diseases; 3) Possession of a valid Chinese driver’s license for over 3 years. A total of twenty-five drivers, comprising 14 males and 11 females, participated in the simulation. Their ages ranged from 25 to 33 years old (M = 27.38, SD = 1.78), with driving experience varied from 3 to 7 years (M = 4.97, SD = 1.01). The subjects were neither color blind nor color weak, and they had no physiological or psychological diseases. All drivers had not experienced similar simulation experiments and did not know the purpose of the experiment.
2.2. Simulation Scenario Design
To analyze driver behavior in tunnel-interchange connection sections under various factors, this study relies on field investigation data (refer to Table 1) to design simulated road models. The simulation scenarios are controlled by four variables: Connection Distance (CD), Information Volume (IV) of signage, Traffic Conditions (TC), and Tunnel Length (TL), while keeping other parameters constant. The simulation road layout and facility designs are detailed in Figure 2.
2.2.1. Sign Design
The IV of directional signs significantly impacts driver information processing in interchange sections. The traditional method to calculate information quantity, proposed by Shannon, involves assessing the number and types of bytes in the information [34]. However, due to the differences in character units and word formation between English and Chinese, this approach may not be entirely suitable for determining the IV of Chinese signs. Some researchers opt to use Chinese character blocks, such as road names, as the calculation standard for sign information load, while others base their calculations on the content conveyed by the sign [35,36]. This study combines these methods, considering the types of information transmitted by guide signs (including location, direction, etc.) as individual information units and establishing specific rules for calculating information on highway guide signs.
Previous research indicates that when information units exceed seven, it can impact driver cognition [28]. Thus, this study employs guide signs with 5, 7, 9, 11, and 13 information units in the simulation. The layout, font size, and positioning of these signs comply with G5 expressway standards in Shaanxi Province. To prevent driving adaptation, exit names are altered across different simulation scenarios. The detailed sign design is shown in Figure 3.
2.2.2. Scenario Design
The test scenarios feature a standard single-direction, two-lane road with a speed limit of 80 km/h. As depicted in Figure 2, the road models are categorized into three types based on CD: small spacing sections (CD no more than 500m), large spacing sections (CD of 700m and 1000m), and the GDS serving as the control group. These categories will be referred to by their abbreviations in the subsequent text.
Specifically, LC are prohibited in the tunnel, marked by the white solid line. All road sections in the diversion area employ parallel deceleration lanes that link with ramp. The total length of the deceleration lane is 250m, comprised of a 100m transition section and a 150m deceleration section. Given the spatial constraints within tunnels, the setting of guide signs is often restricted to 1~2 locations in the connection sections. Specific scenario design and variable control principles are shown in Table 2.
2.3. Experimental Procedure
The driving simulations were carried out in two daily sessions, from 8:00 to 11:30 and 14:00 to 17:30, with three rotating participants per session to ensure optimal individual driving condition. Participants were advised to comply with signs, lane markings, and traffic regulations, and to avoid any non-driving-related activities. The specific steps of the experiment were as follows:
(1) Participants’ familiarization: participants were introduced to the driving tasks and the simulator’s functionalities via a practice drive in a non-experimental environment.
(2) Scenario selection and simulation environment setup: the research team randomly selected test road sections and configured the traffic environment. The test vehicle was positioned in the left lane, and participants were informed of the destination.
(3) Experiment commencement and data collection: the formal experiment began, and the related data were recorded.
(4) Post-test Breaks: following the completion of each testing round, participants were allowed to take short breaks.
This procedure was replicated across various experimental scenarios. After approximately 20-30 minutes, or five scenarios, participants took a break while the next participant was tested. Each participant completed tests on 72 road scenarios, and data was collected for the 1000m range before each diverging point. Total of 1800 driving samples were collected, 1500 of which were tunnel-interchange samples and 300 were GDS samples. Among these, 1712 samples involved successful diverging, while the remaining 88 samples, which involved crashes or failure to enter the ramp, were categorized as failure samples. These will be subject to separate analysis in Section 3.4.
2.4. Selection of Driving Behavior Indicators
To comprehensively portray driving behavior in tunnel-interchange environments, several indicators related to CF, and LC behaviors are selected. Definitions and clarifications for each indicator are delineated within this section.
2.4.2. CF Characteristics
The assessment of a driver’s CF behavior is effectively conducted using speed and headway metrics, which together offer a detailed evaluation of longitudinal driving comfort and CF stability.
Speed metrics, specifically average velocity (V mean), speed standard deviation (V std), the reduction of velocity (RV), and maximum deceleration (DCC max), are key to assessing driving safety and braking responsiveness [37]. V mean and V std (km/h) is calculated using speed data within a 600m section preceding the diverging point. RV (km/h) represents the largest absolute difference between peaks and troughs on the speed curve, while DCC max (m/s²) signifies the journey’s highest deceleration. Additionally, for a detailed analysis of driver behavior, speed profiles are extracted, and the position corresponding to the maximum deceleration is identified for micro-speed characteristic analysis.
Parallel to speed metrics, headway metrics elucidate the spatiotemporal dynamics of CF behavior [38]. Drivers aim to maintain an optimal headway distance (DH) and a suitable time headway (TH), reflecting the physical and temporal distances between consecutive vehicles. This study analyzes the average DH and TH throughout the journey, providing insights into longitudinal interactions and the impact of various factors on CF behavior.
2.4.2. LC Characteristics
In tunnel-interchange connection sections, vehicles execute two types of lane-changing (LC) maneuvers after exiting a tunnel: Mandatory Lane Change (MLC) and Diverging Lane Change (DLC). These lateral motion maneuvers are crucial in shaping driving decisions and stability. To characterize LC behavior in these sections, various metrics are utilized, including the LC position relative to the diverging point (PMLC for MLC, PDLC for DLC), LC duration (MLCD, DLCD), LC length (MLCL, DLCL), LC angle (MLCA, DLCA), and the accepted gap.
The initiation and completion of LC are determined by shifts in lateral vehicle speed, with 0.1m/s as the threshold [39]. LC duration (LCD) and length (LCL) are calculated using the time and distance differences between these two points. LC angle (LCA) is derived as the mean steering wheel angle during the LC. Particularly, PMLC and PDLC are assessed based on the vehicle’s lateral position at lane crossing.
The accepted gap, a unique metric in lane-changing behavior, measures the distance between the front and rear vehicles in the target lane at the onset of the LC. Given that DLCs often occur with a single front vehicle in the deceleration lane, our focus is mainly on the accepted gap during MLCs. Furthermore, the Ashworth method [40] estimates the critical accepted gap under various traffic and road conditions, representing the minimum gap that drivers can accept, which reflects the driving demand for LC space under different scenarios. This method is based on the assumption that both the critical gap and the accepted vehicle gap adhere to a normal distribution across different traffic volumes. The critical accepted gap is thereby calculated using the following formula:
where, denotes the critical accepted gap (s); denotes the mean accepted gap (s);q refers to the traffic flow rate (veh/s); is the variance of the accepted gap.
2.5. Statistical Tests
To investigate the behavioral differences under varying CD, IV, TC, and TL, and to comprehend their interaction effects, this study employs three distinct statistical tests:
(1) Friedman Test: Employed as a non-parametric method, the Friedman test [41] is utilized to detect significant differences across related groups. It is particularly useful in assessing the impact of independent variables on CF and LC characteristics.
(2) Multivariate Analysis of Variance (MANOVA): Applied when dependent variables display consistent variance, MANOVA [42] detects significant differences among these variables and explores their interactions and combined effects on behavioral indicators.
(3) Dunn’s test: Utilized for pairwise comparisons, this test assesses significant variations among dependent variables in different environmental scenarios, effectively highlighting specific differences arising from diverse environmental combinations.
These statistical approaches provide a comprehensive framework to thoroughly evaluate the effects of diverse independent variables on CF and LC behaviors, establishing a solid basis for in-depth analysis.
3. Results and Analysis
3.1. General Analysis
Table 3 offers a comparison of driving indicators between GDS and tunnel-interchange scenarios, which underscores noticeable distinctions in driving parameters between these environments. Particularly in smaller spacing scenarios, a notable trend emerges: a reduction in average speed and an escalation in speed variability. This trend accompanies a decrease in both the duration and length of lane-changing maneuvers. Significantly, the study observes a 62.61% increase in RV (S.E.=0.217, P=0.011), an 18.60% rise in DCC max (S.E.=0.021, P<0.001), and a 61.11% escalation in V std (S.E.=0.26, P<0.001) within tunnel-interchange samples. These preliminary analyses point to potential detrimental impacts on driving stability and safety due to environmental transitions specific to tunnel-interchange contexts.
Delving into the influence of environmental factors, Table 4 elucidates the correlations among various indicators. CD stands out with strong correlations across most driving metrics, particularly evident in MLCD and MLCA, where coefficients surpass 0.60. This implies a pronounced sensitivity of lane-changing behavior to spatial alterations in tunnel-interchange environments. IV, exhibiting moderate correlations with key speed and CF indicators, suggests signage information’s substantial influence on driver speed selection. In addition, drivers’ gap selection during LC displays the highest correlation with TC, with a coefficient exceeding 0.6. Contrarily, TL does not exhibit significant correlations with other indicators, aligning with findings from prior research [23]. Following analyses will be carried out focusing on combinations of independent and dependent variables with correlation coefficients higher than 0.25 (the bold terms).
3.2. Speed and Car Following Characteristics
In order to verify the impact of environmental variables on CF indicators, both main and interaction effects under various conditions of CD, IV, and TC have been examined in Table 5 using the Friedman and MANOVA tests. Further, Table 6 utilizes Dunn’s test to confirm the intergroup differences under the interactive effects of IV and CD. The subsequent sections will dissect the distribution patterns of CF indicators influenced by significant environmental factors, providing an in-depth exploration of their impacts.
3.2.1. Speed Distribution
Vehicle speed fluctuations provide valuable insight into driving safety, as erratic speed patterns can significantly increase the likelihood of accidents [43,44]. According to the detailed speed profiles, tunnel-interchange sections can be differentiated into distinct areas based on vehicle speed attributes: steady car-following area, speed variation area, and diversion exit area, as depicted in Figure 4. A notable observation across most driving samples is that peak speed fluctuations typically occur within 350m before the transition point, which coincides with the interval of maximum speed reduction. After noise filtering and curve smoothing, Figure 5 demonstrates the speed profiles in this zone under different CD and IV conditions.
Figure 5(a) demonstrates the significant impact of CD on speed control within the diversion area. Shorter CDs are associated with a decrease in average speed and an uptick in speed fluctuations. Specifically, larger spacing sections (≥700m) show a speed distribution akin to the GDS group, maintaining a stable range of 85~95km/h, with an average deviation around 2.33km/h. In contrast, smaller spacing sections (≤500m) lead to a reduction in average speed by approximately 10.16%, alongside an increase in standard deviation to 4.58km/h, thereby adopting a distinct “accelerate-decelerate-steady” pattern. The data also suggests an earlier onset of deceleration in tighter spaces, transitioning from 200m to 100m before the signage.
In relation to signage information density, Figure 5(b) shows that denser signage information increased speed fluctuation and velocity reduction. This trend is particularly evident as drivers encounter more signage information, necessitating a reduction in speed to process the additional data. The average deceleration range widens from 2.58km/h for 5 units of information to 7.53km/h for 13 units, with a marked difference emerging beyond 7 units.
Providing a holistic view, Figure 6 compares driving speeds under various CD and IV combinations. It’s evident that in shorter spaces, drivers respond with greater deceleration to the same informational stimuli compared to more spacious sections, likely due to constrained decision-making time. According to Table 6, all IV groups show significant speed reduction differences in 100m and 300m sections. However, this distinction fades in 500m sections between 5 and 7 information units and becomes prominent again only when the spacing extends beyond 700m and information units increase past 9. This pattern underscores the need for strategic signage placement and design adjustments based on the specific characteristics of each tunnel-interchange connection section.
3.2.2. Maximum Deceleration
DCC max, a measure of braking response during vehicle operation, serves as a common indicator for assessing longitudinal driving safety and comfort [45,46]. Table 5 reveals significant main effects (p<0.034) and interaction effects (p=0.001) between CD and IV with respect to DCC max. This relationship is further visualized in Figure 7, which depicts the distribution of DCC max across different combinations of CD and IV. The legend in Figure 7 (c) categorizes information volumes as low (5 and 7 units), medium (9 units), and high (11 and 13 units) respectively.
The results indicate that reduced spacing and elevated IV significantly amplify the deceleration level within diversion sections, with DCC max ranging between -1.65 and -0.80 m/s². It appears that IV carries a more profound influence on braking responses. Given a consistent spacing, DCC max displays a linear relationship with IV. Each additional two units after an IV of 7 units results in approximately a 13.16% increase in DCC max, implying that drivers tend to drive more cautiously under high information loads.
On the other hand, reduced CD also escalates drivers’ deceleration levels. As the spacing shrinks below a CD of 700m—identified as a turning point in the DCC max distribution—the rate of deceleration intensifies. Specifically, for every 200m reduction in CD, DCC max experiences an average surge of 14.02%. However, this trend is not pronounced in larger spacing and GDS groups (p>0.085).
According to Table 6, the interaction effects between CD and IV significantly shape the distribution of DCC max. Under varying levels of IV, the difference in DCC max between the 100m section and GDS sections ranges from 0.213 to 0.425 m/s2. This indicates that drivers maintain relatively stable deceleration rates over different distances when signage information is low. However, with an increase in sign information, the deceleration in smaller spacing sections markedly exceeds that in the GDS scenarios.
Figure 8 further shows the relative relationship between the location of maximum deceleration and DCC max, with the x-axis distance reference aligned with Figure 6. The intensity of scatter colors reveals the distribution density of samples, with darker hues denoting more concentrated maximum deceleration behavior within a particular interval. The results indicate that, when the CD is no less than 500m, as seen in Figure 8 (c) and (d), the locations of maximum braking are widely distributed, yet primarily situated within 300m of the transition point. When the CD falls below 300m, the maximum deceleration position rapidly clusters within 100m before the sign and the DCC max intensifies. This abrupt deceleration behavior could undermine driving comfort and potentially trigger backward transmission of traffic disturbance waves.
3.2.3. CF Headway
The CF headway is key for understanding vehicle interactions and driver responses on the road. The Friedman test in Table 6 highlights significant differences in average TH and DH under varying CD, IV, and TC (p<0.041). Figure 9, Figure 10, and Figure 11 offer a comparative analysis of these distributions. Broadly, TH is more sensitive to environmental changes than DH, with adjacent CD groups displaying small differences in DH but larger ones in TH. This indicates that complex environments noticeably lower the average vehicle speed (Figure 6), consequently increasing TH variability.
Traffic volume, denoting the average TH of a traffic flow, is a major determinant of CF behaviors. In the 3rd LOS condition, the average TH for vehicles is 2.22s, a reduction of 0.63s and 0.32s compared to the 1st and 2nd LOS conditions, respectively.
Furthermore, when CD decreases and IV increases, there’s an observed rise in both DH and TH. For instance, when compared to the CD of 1000m, drivers under the CD of 100m display an increase of 7.71% in DH and 17.96% in TH. This pattern could stem from increased driving uncertainty due to environmental switch in tunnel-interchanges, suggesting drivers adjust their behavior for safety in changing environments.
Besides, IV has a significant impact on DH and TH distribution, with drivers often decelerating near signs to adjust to environment changes. The study reveals that once the information volume exceeds seven units, each two-unit increase leads to approximately 1.48% and 4.95% rise in DH and TH, respectively.
The interaction effects in Table 6 demonstrate that in sections with small spacing, IV changes more profoundly affect CF behavior. In comparison to GDS samples, the average intergroup differences of DH and TH of small spacing rise by 42.8% and 84.2%, respectively. On the other hand, for large spacing sections, a significant difference in TH (S.E.=0.025, P<0.001) is only observable when the IV exceeds 11 information units. For CDs under 500m, however, this threshold reduces to 9 units.
Maintaining safe following distances is crucial for driving safety. However, longer headways can reduce traffic capacity, particularly under conditions of increasing traffic volume. This can lead to capacity challenges and potentially cause congestion near diversion zones, highlighting a key balance between safety and traffic flow efficiency.
3.3. Lane Changing Characteristics
In order to verify the impact of environmental variables on LC indicators, main and interaction effects have been examined using Friedman and MANOVA tests, as presented in Table 7. Notably, DLC indicators do not exhibit significant differences under varying environmental conditions, a result that aligns with the low correlation (<0.2) found in the correlation analysis (Table 4). Conversely, MLC characteristics demonstrate notable variation under differing CD conditions, and the choice of LC gaps is significantly influenced by traffic volume. Further examination of these differences will be undertaken in this section, focusing on three aspects: LC position, MLC characteristics, and the accepted gap.
3.3.1. Distribution of LC Position
Table 8 details the distribution of LC positions relative to the end of diverging area under various CD. These positions are categorized into three groups at distances of 460m and 250m, corresponding respectively to the diverging influence areas as defined by the Highway Capacity Manual (HCM) [47], and the starting of the deceleration lane. Figure 12 reveals a trend where the PMLC typically occurs later in tunnel-interchange sections, with about 90% of drivers transitioning to the outer lane within these influence areas. Additionally, an increase in IV significantly influences MLC positioning. For instance, increasing IV from 5 to 13 units results in the average LC position being delayed by around 20 meters, suggesting that higher IV shifts the LC position closer to the exit area.
We further extracted LC trajectories within the diverging influence area and applied smoothing and noise reduction to the curves, as depicted in Figure 13. The y-axis denotes the distance from the vehicle’s left side to the road’s left line. As CD decreases, there’s an increase in MLCs near the directional sign. For a CD of 1000m, the average PMLC is at 356m, which shortens to 261m in smaller spacing scenarios, suggesting that limited spacing affects drivers’ sign recognition time and, consequently, their LC decisions.
In terms of PDLC distribution, most vehicles are observed to diverge just after the taper of the deceleration lane, with about 96% diverging in the first half of this lane. However, for CDs of 100m and 300m, the point of divergence initiation is notably delayed.
The LC trajectories showcased in Figure 13 indicate a trend of more urgent MLCs in smaller spacing sections, particularly for CDs of 100m and 300m. This observation points to heightened risks associated with MLC. Interestingly, the trajectories for Diverging Lane Change (DLC) from the mainline to the auxiliary lane display less variation, suggesting a more consistent behavior pattern in DLC regardless of CD.
3.3.2. MLC Characteristics
Expanding on the impact of CD on MLC, Figure 13 reveals that as CD decreases, drivers engage in quicker lane changes over shorter distances, leading to steeper trajectories. This observation is further detailed in Figure 14, which quantitatively analyzes the variations in LCD, LCA, and LCL, providing deeper insights into the specific ways CD influences MLC behavior in constrained environments.
The results indicate that a shorter CD typically leads to a reduced LCD and an increased LCA in most cases. Specifically, at CDs below 300m, vehicles face limited time window for LC, with most LCDs centered around 2.55 seconds and LCA exceeding 18°. In contrast, for CDs greater than 700m, LCAs tend to be within 14°, and LCDs extend to about 3.59 seconds, closely resembling the GDS conditions, and exhibiting a wider distribution. This trend points to a significant improvement in MLC stability as CD increases.
The distribution of MLCL largely mirrors that of MLCD, albeit with more distinct distribution variations. For large spacing sections, there’s noticeable variability in the distance covered during the lane change, with LCL typically ranging between 50 and 180 m. As CD decreases, vehicles must complete the MLC within a restricted distance, leading to a more uniform LCL distribution. For example, at a CD of 100m, the majority of samples maintain the LCL between 50 and 100m.
The results highlight that insufficient spacing between tunnels and interchanges limits drivers’ LC maneuvers, compelling them to adopt a more aggressive strategy. To delve into these dynamics, Figure 15 presents the joint distribution of three indicators and shows clear relations: as expected LCL decreases, drivers opt for larger steering angles within shorter LCD, illustrating the adjustments of drivers under various spacing constraints.
Table 9 lists the intergroup differences of MLC features at a 95% significance level. It shows no significant variances in three indicators between large spacing and GDS samples. However, in small spacing sections, these differences become more pronounced. Combined with the results of Figure 15, for optimal LC stability, the CD should ideally not surpass 700m, slightly above the critical spacing obtained by traffic conflicts [11].
3.3.3. Accepted Gap
Gap acceptance, a key factor in LC modeling, reflects drivers’ safety and smoothness expectations during LC decisions. Statistical tests show significant influence of CD and TC on gap acceptance, with both main (p<0.001) and interactive effects (p<0.001) observed. Figure 16 displays the distribution of accepted and critical gaps, illustrating the impact of CD and TC interaction on gap selection. As CD decreases, drivers tend to choose smaller gaps for LC, indicative of a proactive LC strategy. For instance, in 100m CD scenarios, about 30% of vehicles opt for gaps less than 3 s for LC completion (Figure 16 a). Conversely, at 1000m CD, such choices are much rarer, seen in under 5% of samples. These patterns highlight a heightened urgency for LC in small spacing sections.
Table 10 further examines the variance in the accepted gaps due to changes in CD across different LOS. At the first service level, the accepted gap in different CD is similar, with only a 0.26s difference between the 100m and 1000m samples. In contrast, at the 2nd and 3rd LOS, these differences expand to 0.67s and 0.91s. As traffic volume escalates, intergroup differences for various CDs widen, particularly elevating LC difficulties in shorter spacing sections under heavy traffic.
Figure 17 further details the joint distribution relationship between the accepted gaps and MLC characteristics. When the gap drops below 3s, the average LCA increases to 17.6°, and the average LCD drops to about 3.8s. It can be inferred that drivers on larger spacing sections with low traffic volumes benefit from more time and space to assess and select suitable gaps. Conversely, on shorter spacing sections with high traffic volumes, drivers are compelled to choose smaller gaps and expedite LC completions. This change consequently lowers the actual gap selection to less than 3s, negatively impacting the vehicle’s lateral control.
3.4. Analysis of Failure Samples
In addition to the aforementioned correct diverging samples, this study collected 88 failure samples, comprised of 61 cases that resulted in crashes and 27 instances of vehicles failing to enter the ramp. Figure 18 showcases the relative proportions of error samples under varied CD and IV conditions, and also includes a statistical examination of the crash reasons and location distribution.
As demonstrated in Figure 18 (a), both collision frequency and misdirection rates amplify with decreasing CD, corroborating our earlier analysis. Larger spacing provides drivers with ample time to read signs and choose cut-in gaps, which helps improve LC stability and diminish speed fluctuations. However, the benefits of additional safety margin diminish once the CD extends beyond a certain threshold (about 700m).
Figure 18 (b) displays how increased signage IV corresponds to a rise in collision instances and misdirection rates. The results indicate that when information volume exceeds nine units, there is a marked surge in direction misjudgments. Excessive information can result in cognitive overload, and prevent drivers from identifying expected direction, thus hampering the successful execution of lane changes.
Of all crash samples, 45% can be attributed to improper lane changing and 31% to driver distraction. The term “improper lane changing” includes inadequate gap selection and untimely lane changes, both factors escalating traffic conflicts and driving risks. Furthermore, over 77% of crashes occur within 200m of the transition point (dot line in Figure 18 d), correlating with the majority of vehicles’ MLC location (Figure 13), and maximum deceleration rate area (Figure 8). It means that drivers have to make correct decisions and accurately operate vehicles within this challenging range, which heightens task difficulty and driving risk [35].
4. Discussion
This research aims to examine the driving behavior characteristics and the determining factors influence them within tunnel-interchange connection sections. Drawing upon 11 highway project instances, the study creates 72 road models and 216 corresponding driving simulation scenarios. Comprehensive driving data has been collected and processed, yielding indicators related to CF and LC maneuvers such as driving speed, headway, the duration and angle of LC, and the accepted gaps. These indicators shed light on the behavioral patterns exhibited by drivers under varying road conditions.
The experimental findings highlight noteworthy primary and interaction effects of CD, IV, and TC on driving performance. Particularly, under fluctuating traffic volumes, CD significantly shapes drivers’ decision-making concerning LC gaps. To further clearly quantify these effects, Table 11, informed by Dunn’s test results, summarizes the thresholds of CD and IV’s impacts on various behavior indicators.
The spacing between tunnel and interchange, referred to as CD, is a pivotal factor affecting driving behavior. When CD falls below 700m, certain behavioral indicators notably differ from those observed in GDS. For instance, drivers demonstrate more urgency in LC behaviors within small spacing scenarios, reflected in LCD of 2 to 5.5s and accepted gaps ranging from 2.5 to 4s, which elevates the potential for rear-end risks, indicated by a sharp increase in DCC max and failure rate.
Thresholds from Table 11 suggest that the CD of tunnel-interchanges should be at least 700m to avert negative effects on the majority of drivers’ behavioral performance. Intriguingly, this threshold is consistent with findings from ergonomics and traffic conflict studies [2,48], exceeding the diverging influence areas length recommended by the HCM [47]. According to Shang’s study, the rapid environmental transitions within a limited space and time can exacerbate drivers’ anxiety and competitive pressure, detrimentally affecting driving safety [23].
The volume of information presented in traffic signs is typically considered a significant influence on drivers’ information processing capabilities. Overloaded information may result in delayed LC and can impact driving speed and tailgating control [49]. As depicted in Figure 6, when the IV exceeds 7 units, drivers need to slow down to maintain an adequate sight distance. Furthermore, as CD decreases, the impact of sign information on driving behavior becomes more pronounced. Most drivers cannot ensure adequate time to adapt to the rapid environmental switch in small spacing sections and might get distracted by recognizing directional signs, thereby increasing the failure rates. Conversely, larger CDs allow for more efficient processing of road information, leading to behaviors similar to those in general diverging sections.
The task-capability interface model offers an explanation for this phenomenon [50]. This model proposes that to mitigate task demands, drivers often reduce their speed, freeing up cognitive resources to handle various levels of task requirements. Within the tunnel-interchange scenarios, this implies drivers often moderate their velocity to alleviate task demands, maintaining a certain cognitive capacity to manage multifaceted driving tasks. Consequently, most driving samples tend to slow down and increase the following distance to effectively process navigational information.
While such compensatory behavior ensures driving safety, concentrated deceleration can generate traffic disturbances that propagate backwards, contributing to instability. Similarly, an extended headway can compromise traffic efficiency, especially under high-volume conditions, potentially leading to congestion. Past studies suggest that compared to a tunnel-interchange spacing of 500m, road capacity decreases by approximately 7.6% to 9.67% when the distance shrinks to 300m [11].
Thus, for maintaining driving stability and traffic efficiency, it is recommended that the information volume in the diverging area should not exceed 9 units. If the CD between tunnel-interchange falls below 500m, the information volume should ideally be capped at 7 units. In regions with substantial directional information, clear and concise prompts should be utilized to guide drivers effectively towards the correct choices.
In contrast to other indicators, drivers’ gap acceptance selection is primarily influenced by TC and exhibits significant interaction with CD. This could be attributed to the inverse relationship between the average headway and traffic volume. Under conditions of low-density traffic (1st LOS), the average TH is relatively large (>4s), allowing drivers to identify suitable gaps without speed adjustments. However, with escalating volume, the average TH within the 3rd LOS falls to below 3s. In such circumstances, combined with a short CD (below 500m), drivers are faced with the challenge of rapidly identifying suitable gaps within a limited LC window and promptly transitioning to the outer lane. The critical accepted gap drops significantly from 4s to 2.73s, which is considerably lower than that in general sections.
The distribution of gap acceptance offers additional insights into the distribution of other LC indicators under conditions of reduced spacing. It is worth noting that the traffic conditions examined in this study, based on field surveys, consider a relatively conservative 1st to 3rd LOS. If traffic density continue to increase, gap acceptance behavior could pose an even greater challenge for drivers. However, this hypothesis requires further investigation for validation.
5. Conclusion
This study conducts driving simulation test to examine the effects of roadway characteristics, signage information volume, and traffic circumstances on drivers’ car-following and lane-changing behaviors in tunnel-interchange connection sections. The study reveals the following key insights:
1. Insufficient connection distance negatively impacts driver behavior, leading to lower vehicle speed, increased speed variance, and urgent lane changing maneuvers. Such strong environmental switching from tunnels to interchanges could undermine driving stability and safety, especially when connection distances are shorter than 500m.
2. Increased signage information loads significantly influences drivers’ speed selection, causing the increase in maximum deceleration and following distance. Notably, the velocity reduction amplitude triples when the signage information volume escalates from five to thirteen units.
3. Significant interaction effects are observed between connection distance and signage information volume on car-following behavior. As the connection distance diminishes from 1000m to 100m, the average group differences of time headway induced by increased information volume rise by 84.2%, signifying an heightened influence of signage information on driving behavior.
4. Drivers’ accepted gap demonstrates a negative correlation with traffic volume and a positive correlation with connection distance. An increase in traffic volume results in a more significant discrepancy in the critical gap acceptance between small spacing and general diverging sections.
5. Based on the critical threshold of behavior index and failure rate, this study suggests that the critical distance of tunnel interchange should be 700m and the sign information should be limited to 9 units. For sections with less than 500m spacing, traffic information should be kept within 7 units, complemented by enhanced traffic control in the diverging area.
To bolster driving stability and safety in such scenarios, it’s essential to maintain the tunnel-interchange distance within acceptable limits, define appropriate signage information volume, and adjust connection clearance according to traffic service level. Consideration of drivers’ behavioral traits and traffic conditions is vital in road design and traffic management, contributing to improved road efficiency and safety.
This research clarifies the behavioral uncertainty in tunnel-interchange areas, and underscores the need for targeted preventive measures from the drivers’ perspective. Future work aims to accumulate significant crash samples and traffic conflict data to explore accident mechanisms and latent risks in small spacing sections. Moreover, the growing number of tunnel-interchange project samples paves the way for more extensive on-road driving tests to investigate the impact of dynamic traffic, weather conditions, and other real-world factors on driver workload and behavior.
Author Contributions
Conceptualization: Zhenhua Sun, Chenwei Gu and Wei Zhang; Methodology: Chenwei Gu and Wei Zhang; Software: Zhenhua Sun; Validation: Zhenhua Sun, Tian Xin, and Jinliang Xu; Formal analysis: Tian Xin; Investigation: Chenwei Gu, Wei Zhang, and Tian Xin; Resources: Jinliang Xu; Data Curation: Chenwei Gu and Tian Xin; Writing—Original Draft Preparation: Chenwei Gu; Writing—Review & Editing: Zhenhua Sun and Wei Zhang; Visualization: Zhenhua Sun; Supervision: Jinliang Xu and Wei Zhang; Project Administration: Wei Zhang; Funding Acquisition: Jinliang Xu. All authors have read and agreed to the published version of the manuscript.
Funding
This research was supported by the Fundamental Research Funds for the Central Universities, Chang’an University, grant number: 300102212107.
Institutional Review Board Statement
Not applicable.
Informed Consent Statement
Not applicable.
Data Availability Statement
The data are available upon request.
Acknowledgments
The authors would like to thank the Mr. Yunteng Chen and transportation simulation laboratory of Chang’an University for their support in our study.
Conflicts of Interest
The authors declare no conflicts of interest.
References
- Huang, Y.; Chen, F.; Song, M.; Pan, X.; You, K. Effect evaluation of traffic guidance in urban underground road diverging and merging areas: A simulator study. Accident Analysis & Prevention 2023, 186, 107036. [Google Scholar]
- van Beinum, A.; Farah, H.; Wegman, F.; Hoogendoorn, S. Driving behaviour at motorway ramps and weaving segments based on empirical trajectory data. Transportation Research Part C: Emerging Technologies 2018, 92, 426–441. [Google Scholar] [CrossRef]
- Zhang, X.; Sun, J.; Qi, X.; Sun, J. Simultaneous modeling of car-following and lane-changing behaviors using deep learning. Transportation Research Part C: Emerging Technologies 2019, 104, 287–304. [Google Scholar] [CrossRef]
- Li, L.; Li, Y.; Ni, D. Incorporating human factors into LCM using fuzzy TCI model. Transportmetrica B: Transport Dynamics 2021, 9, 198–218. [Google Scholar] [CrossRef]
- Broeren, P.T.; Hennink, H.; Hoeksma, J. Tunnel Road Design: Junctions In and Near Tunnels in Freeways. In Proceedings of the 4th International Symposium on Highway Geometric DesignPolytechnic University of ValenciaTransportation Research Board; 2010. [Google Scholar]
- Ting, S.; Peng, W.; Boming, T.; Jingrong, B.; Liangyu, Z. Study on lane-changing game behavior of vehicles in small spacing section between tunnel and interchange. China Safety Science Journal 2021, 31, 68–75. [Google Scholar] [CrossRef]
- He, J.; Zhao, Y.; Liu, C.; Wand, J.; Dai, W. Study on Safe Distance between Tunnel Exit and Interchange Exit in Expressway. In CICTP 2020; 2020; pp. 1366–1377.
- Shang, T.; Wu, P.; Lian, G.; Sheng, Q. Influences of Exit Advance Guide Signs on the Trajectory and Speed of Passenger Cars in Highway Tunnels. Journal of Advanced Transportation 2021, 2021, 8453439. [Google Scholar] [CrossRef]
- Miller, E.E.; Boyle, L.N. Driver Behavior in Road Tunnels: Association with Driver Stress and Performance. Transportation Research Record 2015, 2518, 60–67. [Google Scholar] [CrossRef]
- Wang, S.; Du, Z.; Jiao, F.; Zheng, H.; Ni, Y. Drivers’ visual load at different time periods in entrance and exit zones of extra-long tunnel. Traffic Injury Prevention 2020, 21, 539–544. [Google Scholar] [CrossRef]
- Ouyang, P.; Wu, J.; Xu, C.; Bai, L.; Li, X. Traffic safety analysis of inter-tunnel weaving section with conflict prediction models. Journal of Transportation Safety & Security 2022, 14, 630–654. [Google Scholar] [CrossRef]
- Wan, H.; Du, Z.; Ran, B.; Wang, M. Speed Control Method for Highway Tunnel Safety Based on Visual Illusion. Transportation Research Record 2015, 2485, 1–7. [Google Scholar] [CrossRef]
- van Winsum, W. A threshold model for stimulus detection in the peripheral detection task. Transportation Research Part F: Traffic Psychology and Behaviour 2019, 65, 485–502. [Google Scholar] [CrossRef]
- Zhao, X.; Ju, Y.; Li, H.; Zhang, C.; Ma, J. Safety of Raised Pavement Markers in Freeway Tunnels Based on Driving Behavior. Accident Analysis & Prevention 2020, 145, 105708. [Google Scholar]
- Pervez, A.; Huang, H.; Han, C.; Wang, J.; Li, Y. Revisiting freeway single tunnel crash characteristics analysis: A six-zone analytic approach. Accident Analysis & Prevention 2020, 142, 105542. [Google Scholar]
- Xu, J.; Zhang, X.; Liu, H.; Yang, K.; Ma, F.; Li, H.; Sun, Y. Physiological indices and driving performance of drivers at tunnel entrances and exits: A simulated driving study. PLOS ONE 2020, 15, e0243931. [Google Scholar] [CrossRef]
- Lee, C.; Abdel-Aty, M. Two-Level Nested Logit Model to Identify Traffic Flow Parameters Affecting Crash Occurrence on Freeway Ramps. Transportation Research Record 2008, 2083, 145–152. [Google Scholar] [CrossRef]
- Ahammed Mohammad, A.; Hassan, Y.; Sayed Tarek, A. Modeling Driver Behavior and Safety on Freeway Merging Areas. Journal of Transportation Engineering 2008, 134, 370–377. [Google Scholar] [CrossRef]
- Jetto, K.; Ez-Zahraouy, H.; Benyoussef, A. An investigation of merging and diverging cars on a multi-lane road using a cellular automation model. Chinese Physics B 2012, 21, 118901. [Google Scholar] [CrossRef]
- Fatema, T.; Hassan, Y. Probabilistic Design of Freeway Entrance Speed-Change Lanes considering Acceleration and Gap Acceptance Behavior. Transportation Research Record 2013, 2348, 30–37. [Google Scholar] [CrossRef]
- Wang, Q.; Li, Z.; Li, L. Investigation of Discretionary Lane-Change Characteristics Using Next-Generation Simulation Data Sets. Journal of Intelligent Transportation Systems 2014, 18, 246–253. [Google Scholar] [CrossRef]
- Yang, M.; Wang, X.; Quddus, M. Examining lane change gap acceptance, duration and impact using naturalistic driving data. Transportation Research Part C: Emerging Technologies 2019, 104, 317–331. [Google Scholar] [CrossRef]
- Shang, T.; Lian, G.; Zhao, Y.; Liu, X.; Wang, W. Off-Ramp Vehicle Mandatory Lane-Changing Duration in Small Spacing Section of Tunnel-Interchange Section Based on Survival Analysis. Journal of Advanced Transportation 2022, 2022, 9427052. [Google Scholar] [CrossRef]
- Calvi, A.; De Blasiis, M.R. Driver Behavior on Acceleration Lanes: Driving Simulator Study. Transportation Research Record 2011, 2248, 96–103. [Google Scholar] [CrossRef]
- Yang, L.; Li, X.; Guan, W.; Zhang, H.M.; Fan, L. Effect of traffic density on drivers’ lane change and overtaking maneuvers in freeway situation—A driving simulator–based study. Traffic Injury Prevention 2018, 19, 594–600. [Google Scholar] [CrossRef] [PubMed]
- Klauer, S.G.; Dingus, T.A.; Neale, V.L.; Sudweeks, J.D.; Ramsey, D.J. The Impact of Driver Inattention on Near-Crash/Crash Risk: An Analysis Using the 100-Car Naturalistic Driving Study Data. 2006.
- Filtness, A.J.; Larue, G.; Schramm, A.; Fuller, J.; Rakotonirainy, A.; Han, C.; Cairney, P. Safety implications of co-locating road signs: A driving simulator investigation. Transportation Research Part F: Traffic Psychology and Behaviour 2017, 47, 187–198. [Google Scholar] [CrossRef]
- Guo, Z.; Wei, Z.; Wang, H. The Expressway Traffic Sign Information Volume Threshold and AGS Position Based on Driving Behaviour. Transportation Research Procedia 2016, 14, 3801–3810. [Google Scholar] [CrossRef]
- Yang, Y.; Chen, J.; Easa, S.M.; Zheng, X.; Lin, W.; Peng, Y. Driving simulator study of the comparative effectiveness of monolingual and bilingual guide signs on Chinese highways. Transportation Research Part F: Traffic Psychology and Behaviour 2020, 68, 67–78. [Google Scholar] [CrossRef]
- Du, Z.; Wang, S.; Yang, L.; Ni, Y.; Jiao, F. Experimental study on the efficacy of retroreflective rings in the curved freeways tunnels. Tunnelling and Underground Space Technology 2021, 110, 103813. [Google Scholar] [CrossRef]
- Ben-Bassat, T.; Shinar, D.; Caird, J.K.; Dewar, R.E.; Lehtonen, E.; Sinclair, M.; Zakowska, L.; Simmons, S.; Liberman, G.; Pronin, M. Ergonomic Design Improves Cross-Cultural Road Sign Comprehension. Transportation Research Part F: Traffic Psychology and Behaviour 2021, 78, 267–279. [Google Scholar] [CrossRef]
- Calvi, A.; De Blasiis, M.R.; Guattari, C. An Empirical Study of the Effects of Road Tunnel on Driving Performance. Procedia - Social and Behavioral Sciences 2012, 53, 1098–1108. [Google Scholar] [CrossRef]
- Grahn, H.; Kujala, T.; Taipalus, T.; Lee, J.; Lee, J.D. On the relationship between occlusion times and in-car glance durations in simulated driving. Accident Analysis & Prevention 2023, 182, 106955. [Google Scholar]
- Shannon, C.E. A mathematical theory of communication. SIGMOBILE Mob. Comput. Commun. Rev. 2001, 5, 3–55. [Google Scholar] [CrossRef]
- Yang, Y.; Chen, Y.; Wu, C.; Easa, S.M.; Lin, W.; Zheng, X. Effect of highway directional signs on driver mental workload and behavior using eye movement and brain wave. Accident Analysis & Prevention 2020, 146, 105705. [Google Scholar]
- Du, J.; Ren, G.; Liu, W.; Li, H. How is the visual working memory load of driver influenced by information density of traffic signs? Transportation Research Part F: Traffic Psychology and Behaviour 2022, 86, 65–83. [Google Scholar] [CrossRef]
- Lyu, N.; Cao, Y.; Wu, C.; Thomas, A.F.; Wang, X. Driving behavior and safety analysis at OSMS section for merged, one-way freeway based on simulated driving safety analysis of driving behaviour. PLOS ONE 2020, 15, e0228238. [Google Scholar] [CrossRef]
- Bianchi Piccinini, G.F.; Rodrigues, C.M.; Leitão, M.; Simões, A. Driver’s behavioral adaptation to Adaptive Cruise Control (ACC): The case of speed and time headway. Journal of Safety Research 2014, 49, 77.e71-84. [Google Scholar] [CrossRef] [PubMed]
- Ciuffo, B.B. On the assessment of vehicle trajectory data accuracy and application to the Next Generation SIMulation (NGSIM) program data. Transportation Research Part C: Emerging Technologies, 2011. [Google Scholar] [CrossRef]
- Ashworth, R. The analysis and interpretation of gap acceptance data. Transportation Science 1970, 4, 270–280. [Google Scholar] [CrossRef]
- Sheldon, M.R.; Fillyaw, M.J.; Thompson, W.D. The use and interpretation of the Friedman test in the analysis of ordinal-scale data in repeated measures designs. Physiotherapy Research International 1996, 1, 221–228. [Google Scholar] [CrossRef] [PubMed]
- Son, S.-o.; Jeong, J.; Park, S.; Park, J. Effects of advanced warning information systems on secondary crash risk under connected vehicle environment. Accident Analysis & Prevention 2020, 148, 105786. [Google Scholar]
- Apostoleris, K.A.; Sarma, S.N.; Antonios, T.E.; Basil, P. Traffic Speed Variability as an Indicator of the Provided Road Safety Level in Two-Lane Rural Highways. Transportation Research Procedia 2023, 69, 241–248. [Google Scholar] [CrossRef]
- Obeng, D.A.; Tuffour, Y.A.; Poku-Boansi, M.; Amoako, C. The effectiveness of rumble strips installations in speed reduction along major highways in Ghana – The case of N1 highway. Scientific African 2022, 16, e01215. [Google Scholar] [CrossRef]
- Chihara, T.; Sakamoto, J. Generating deceleration behavior of automatic driving by reinforcement learning that reflects passenger discomfort. International Journal of Industrial Ergonomics 2022, 91, 103343. [Google Scholar] [CrossRef]
- Wang, L.; Yang, M.; Li, Y.; Hou, Y. A model of lane-changing intention induced by deceleration frequency in an automatic driving environment. Physica A: Statistical Mechanics and its Applications 2022, 604, 127905. [Google Scholar] [CrossRef]
- NationalResearchCouncil. HCM2010 : highway capacity manual. 5th ed; HCM2010 : highway capacity manual. 5th ed: 2010.
- Li, Y.; Li, L.; Ni, D.; Zhang, Y. Comprehensive survival analysis of lane-changing duration. Measurement 2021, 182, 109707. [Google Scholar] [CrossRef]
- Yao, X.; Zhao, X.; Liu, H.; Huang, L.; Ma, J.; Yin, J. An approach for evaluating the effectiveness of traffic guide signs at intersections. Accident Analysis & Prevention 2019, 129, 7–20. [Google Scholar]
- Fuller, R. The task-capability interface model of the driving process. Recherche - Transports - Sécurité 2000, 66, 47–57. [Google Scholar] [CrossRef]
Figure 1.
6-dof vehicle motion simulation platform.
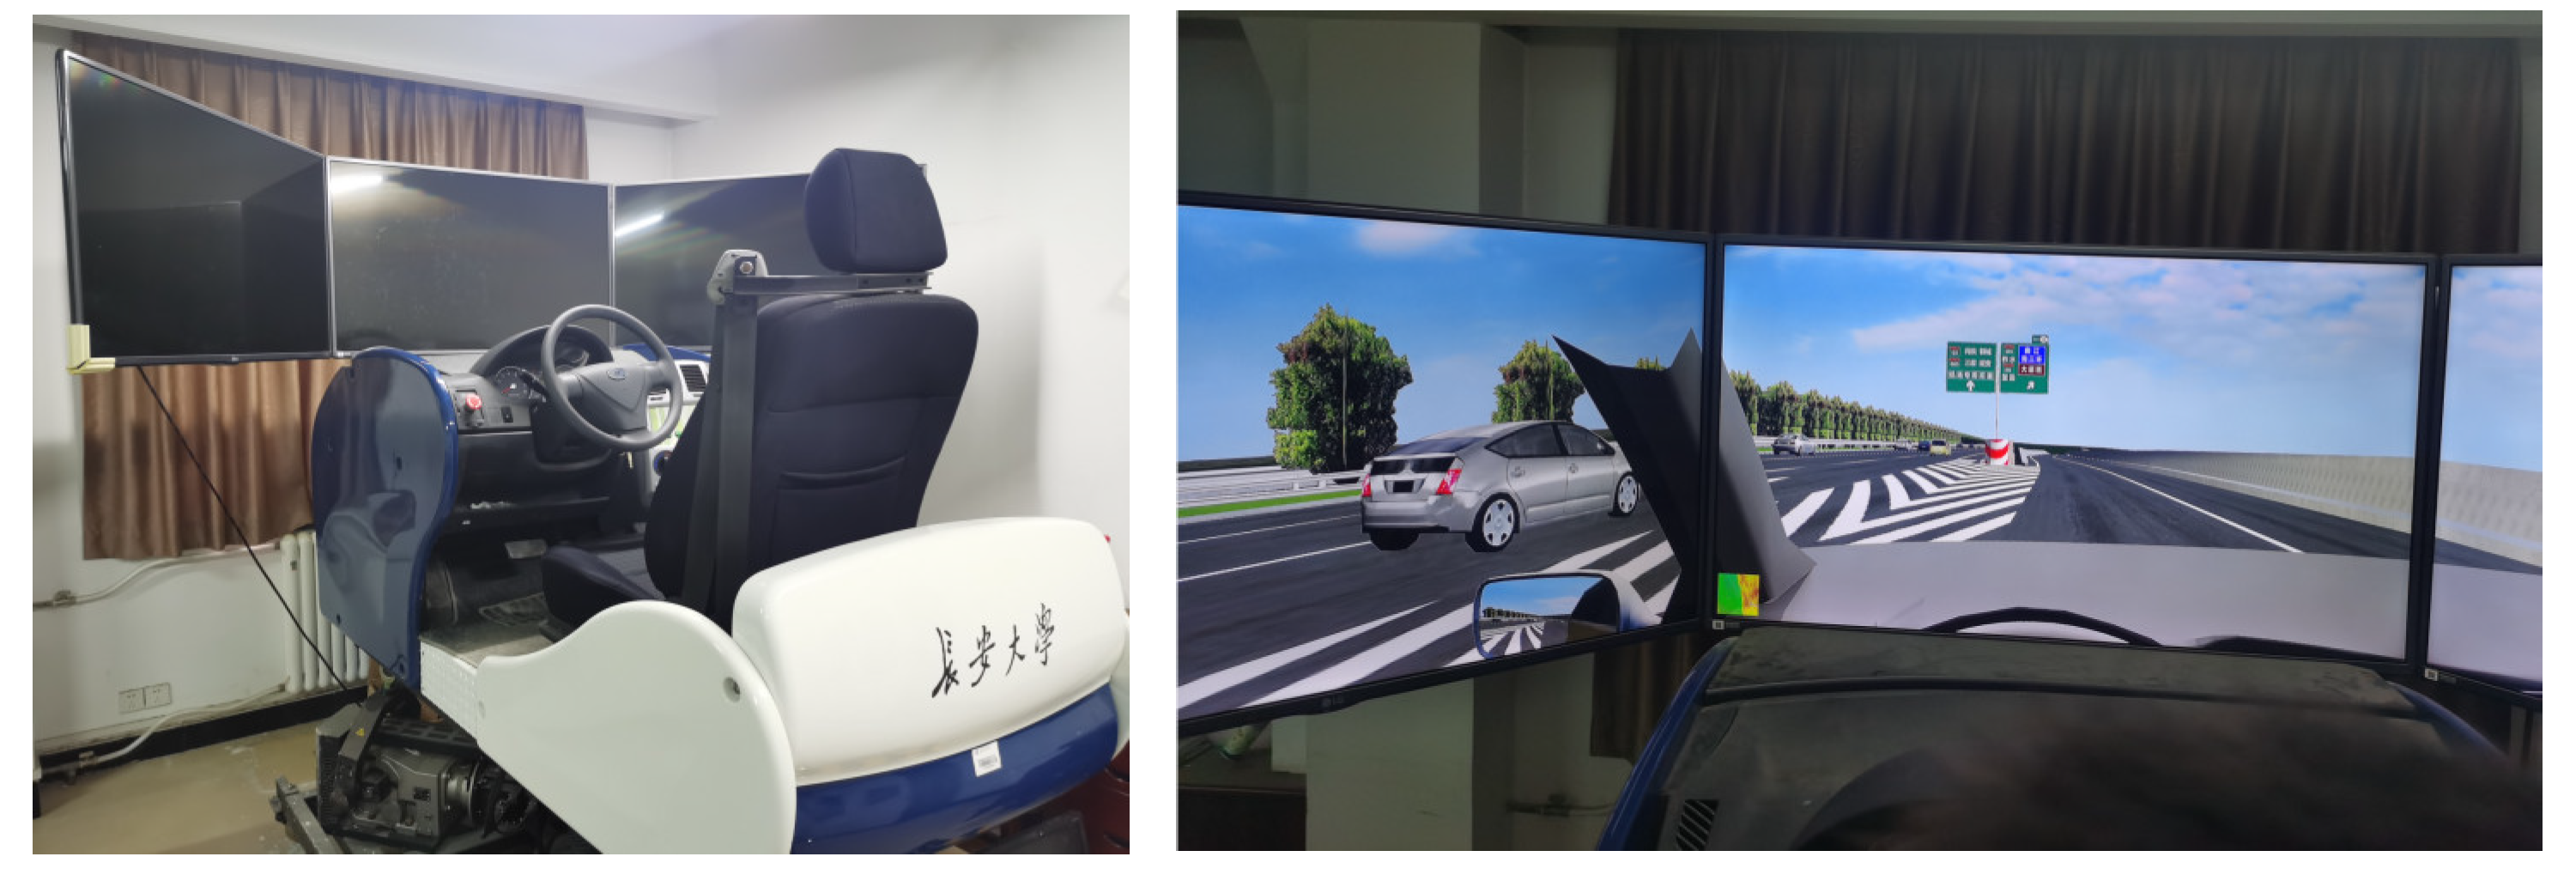
Figure 2.
Roadway design and signs setting under the simulated scenario.
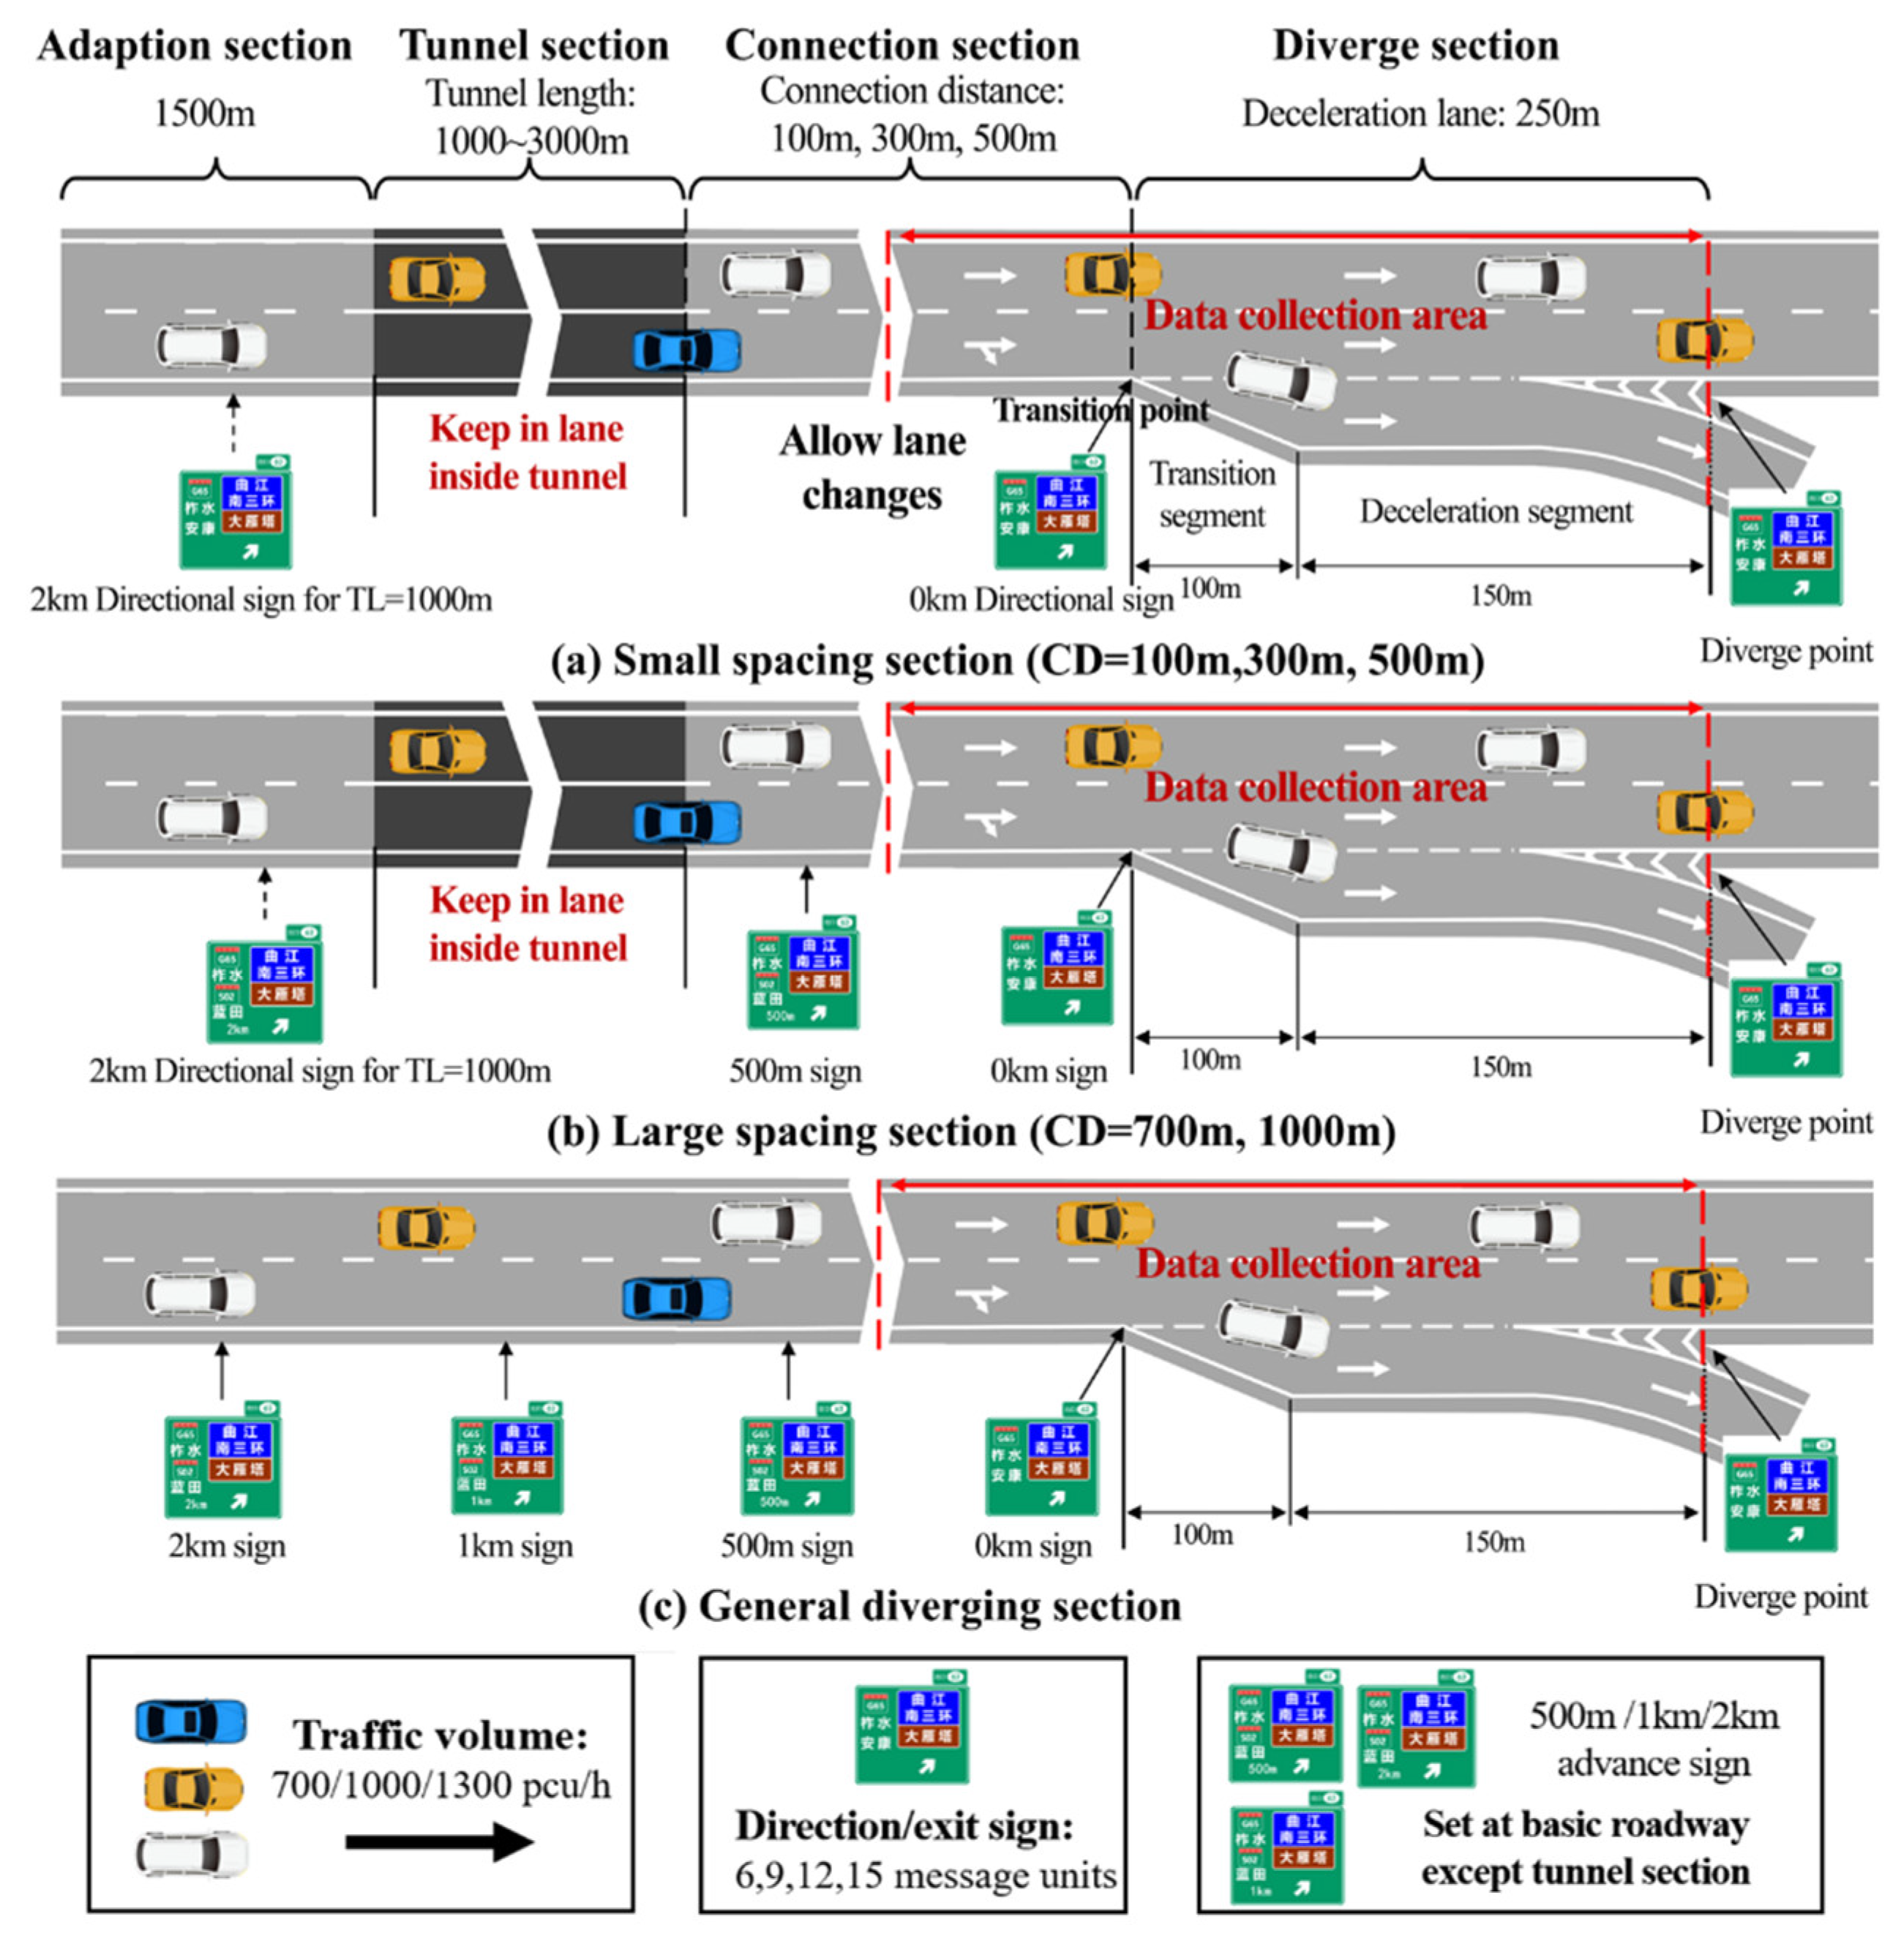
Figure 3.
Sign design.
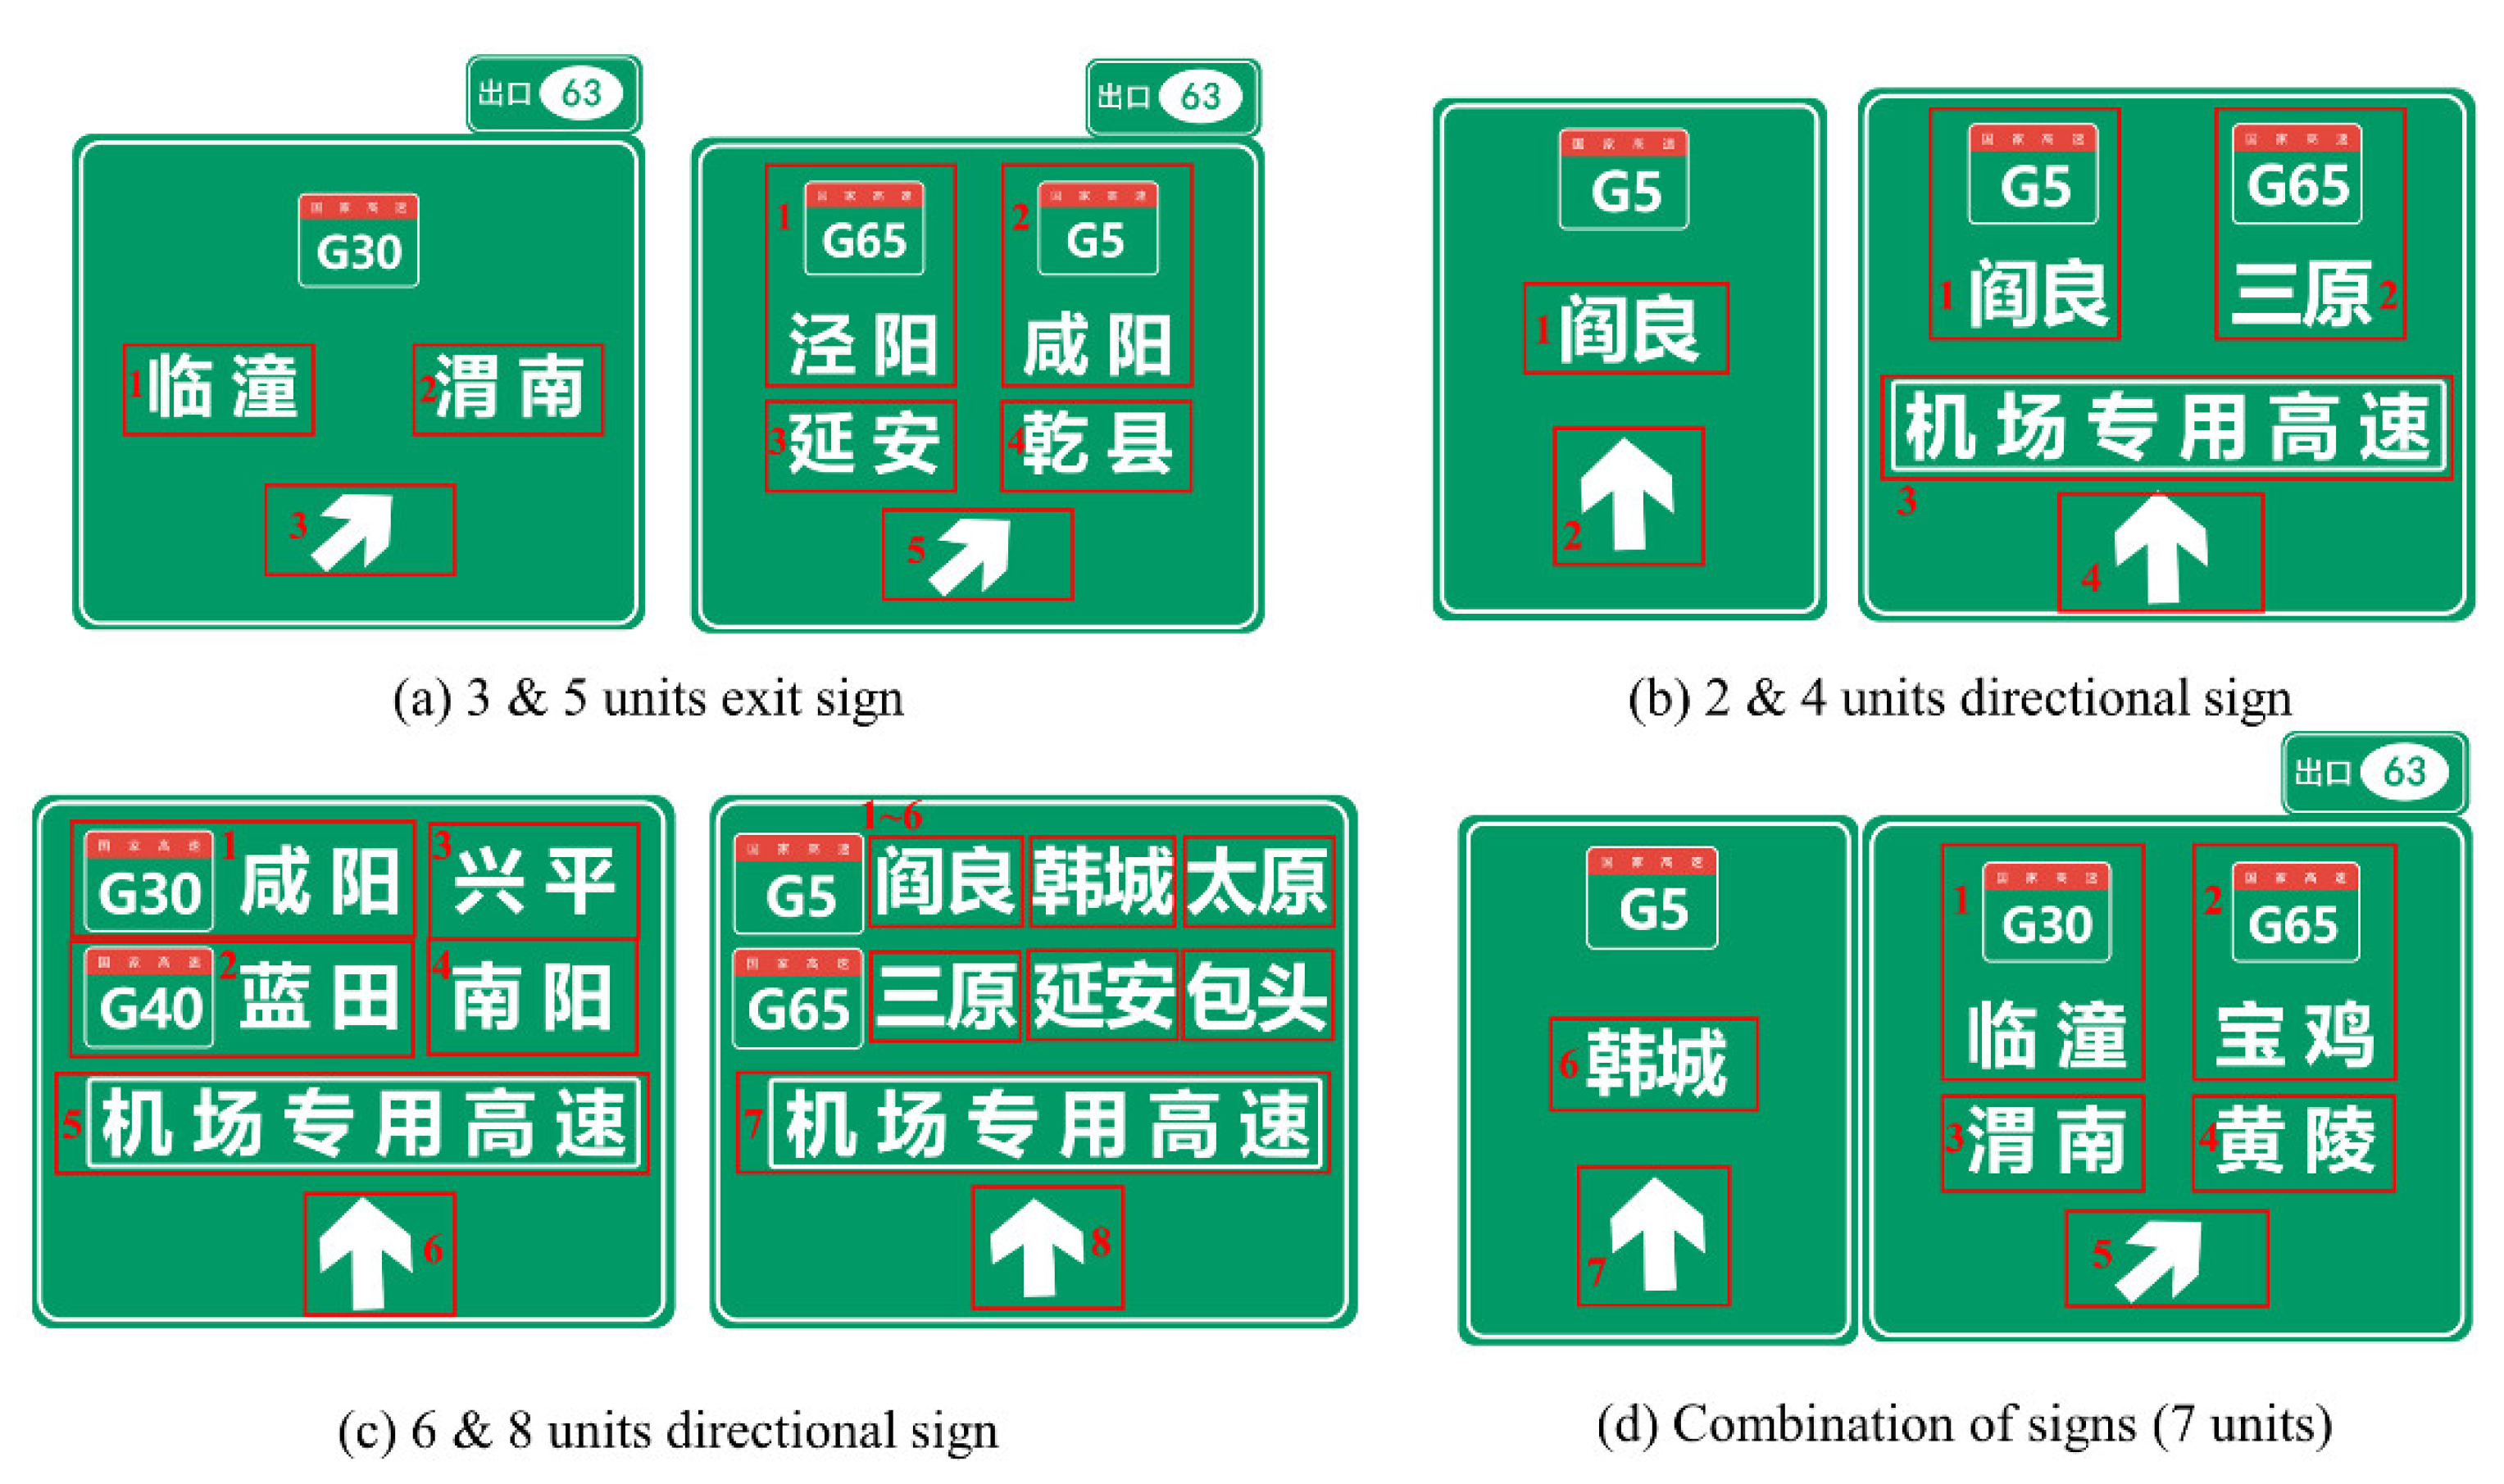
Figure 4.
Zonal classification of diverging area based on the vehicle speed attributes.
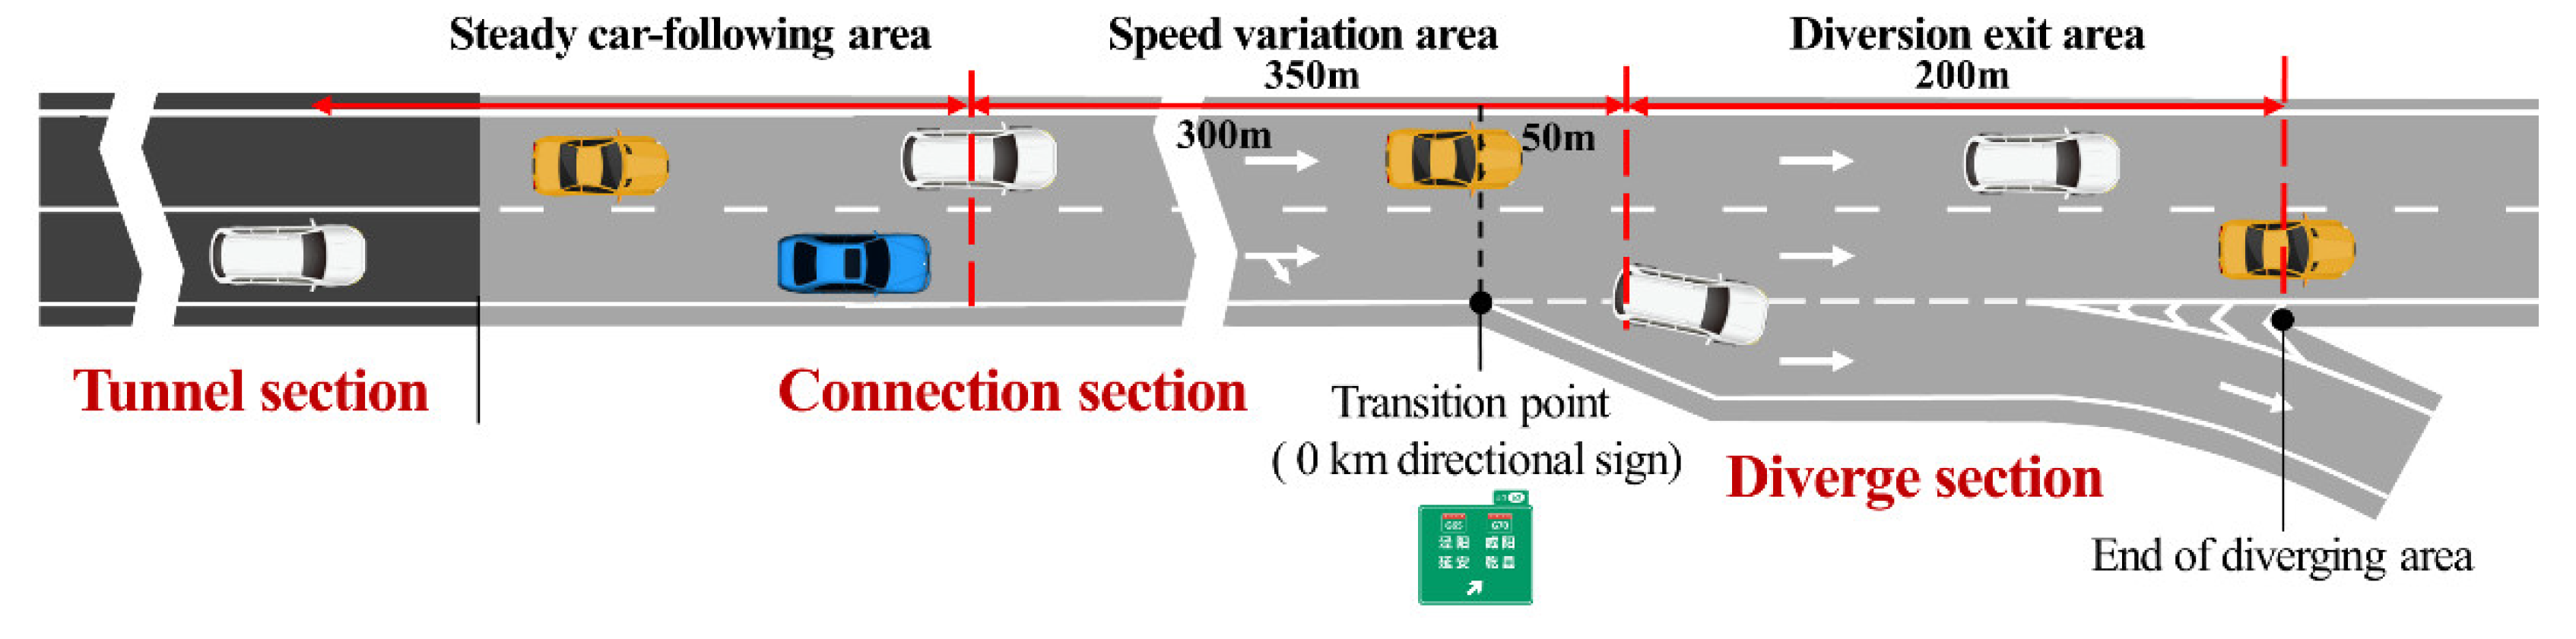
Figure 5.
Speed profiles under different CD and IV.

Figure 6.
Speed profiles under the combination of CD and IV.
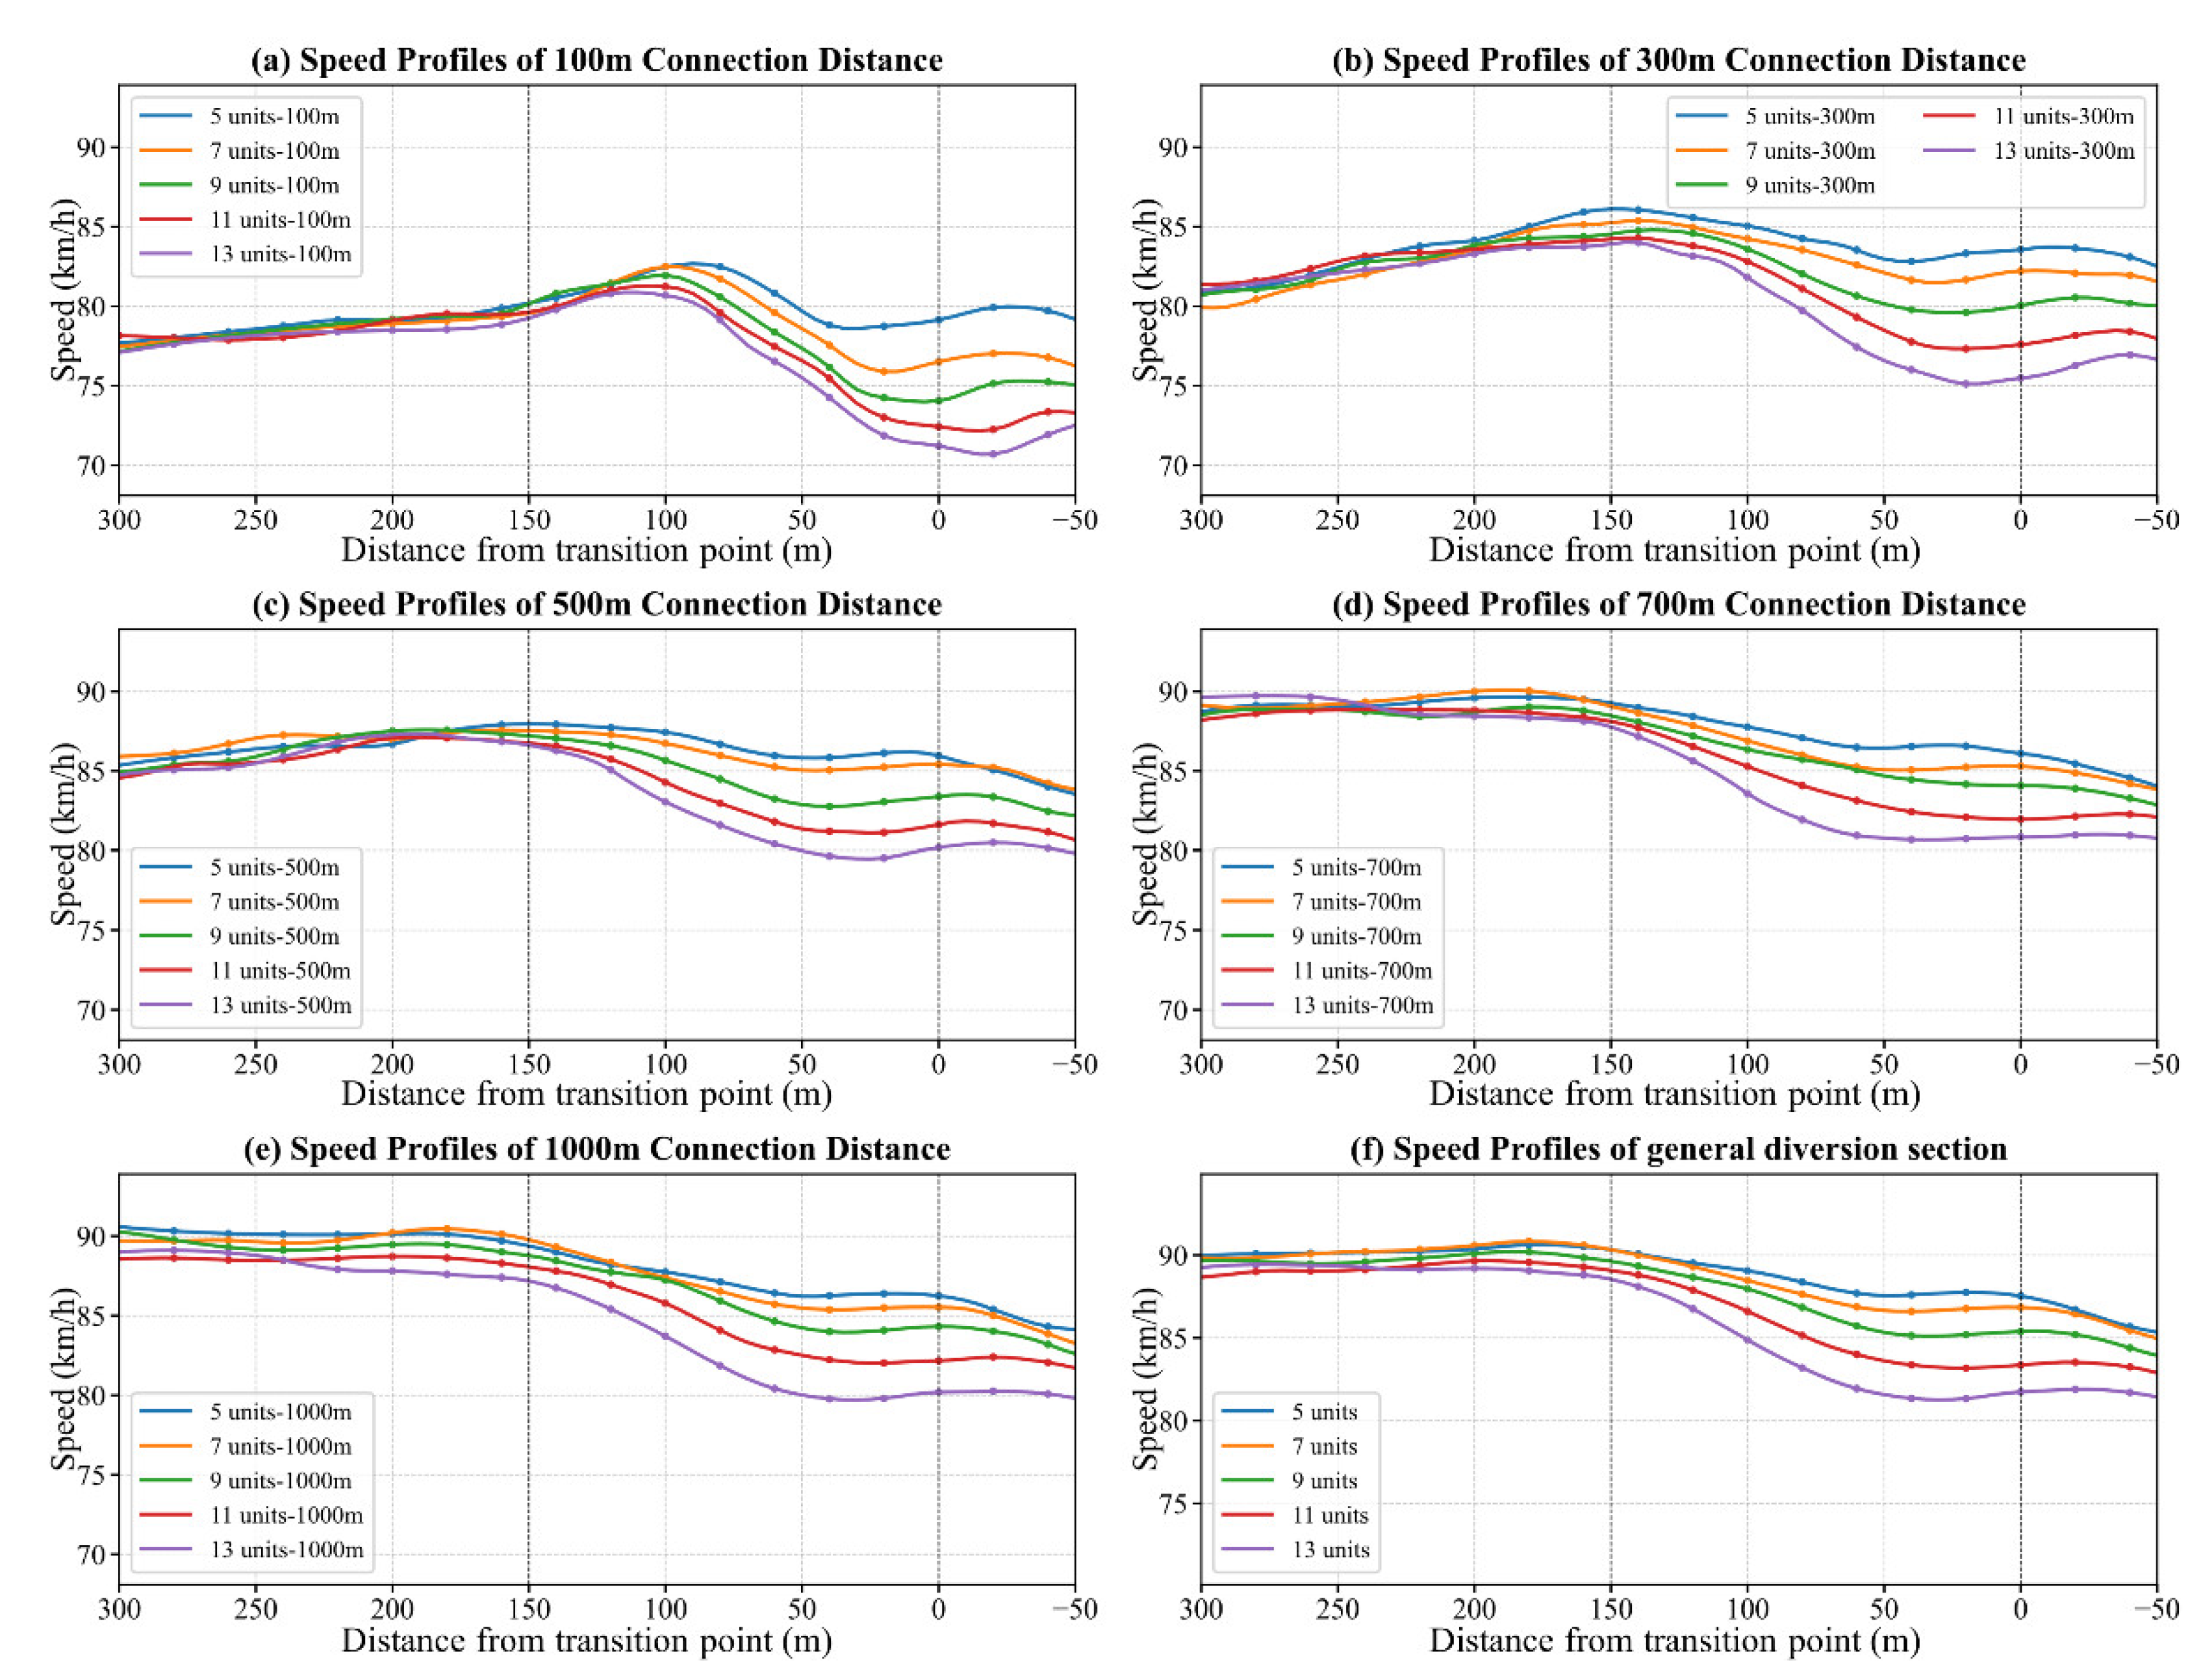
Figure 7.
DCC max distribution under different CD and IV.
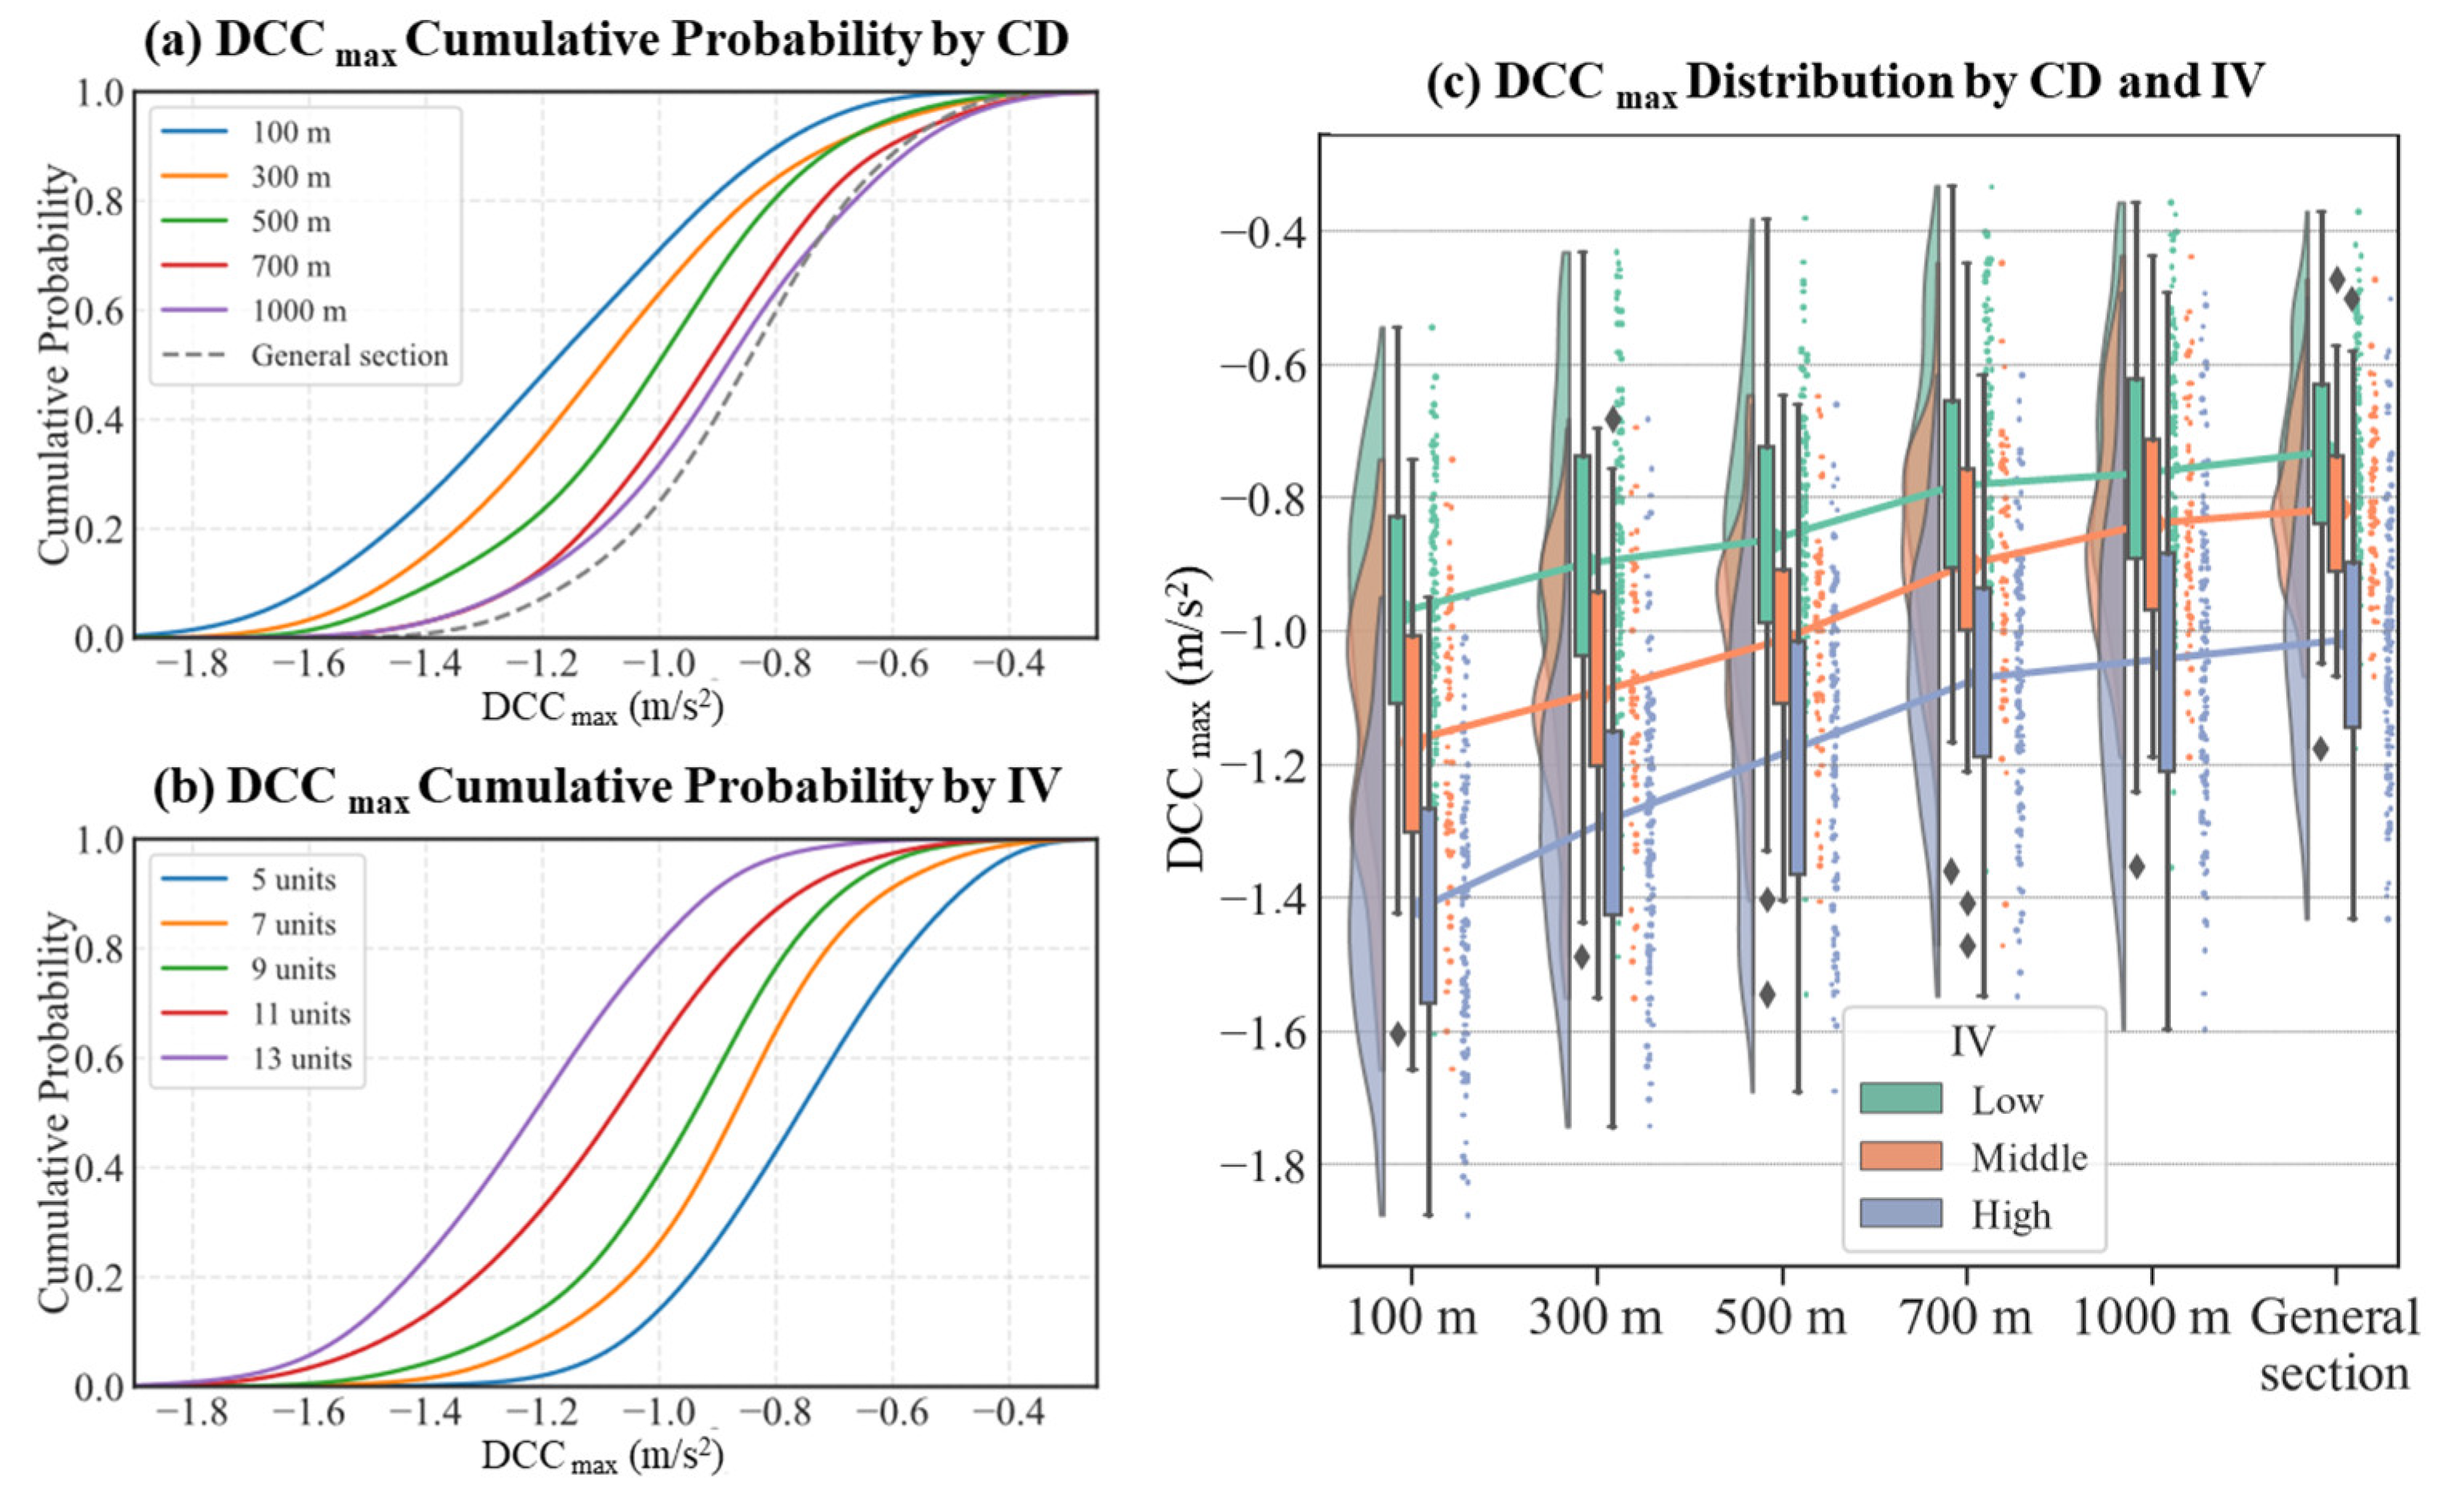
Figure 8.
The distribution of maximum deceleration position.
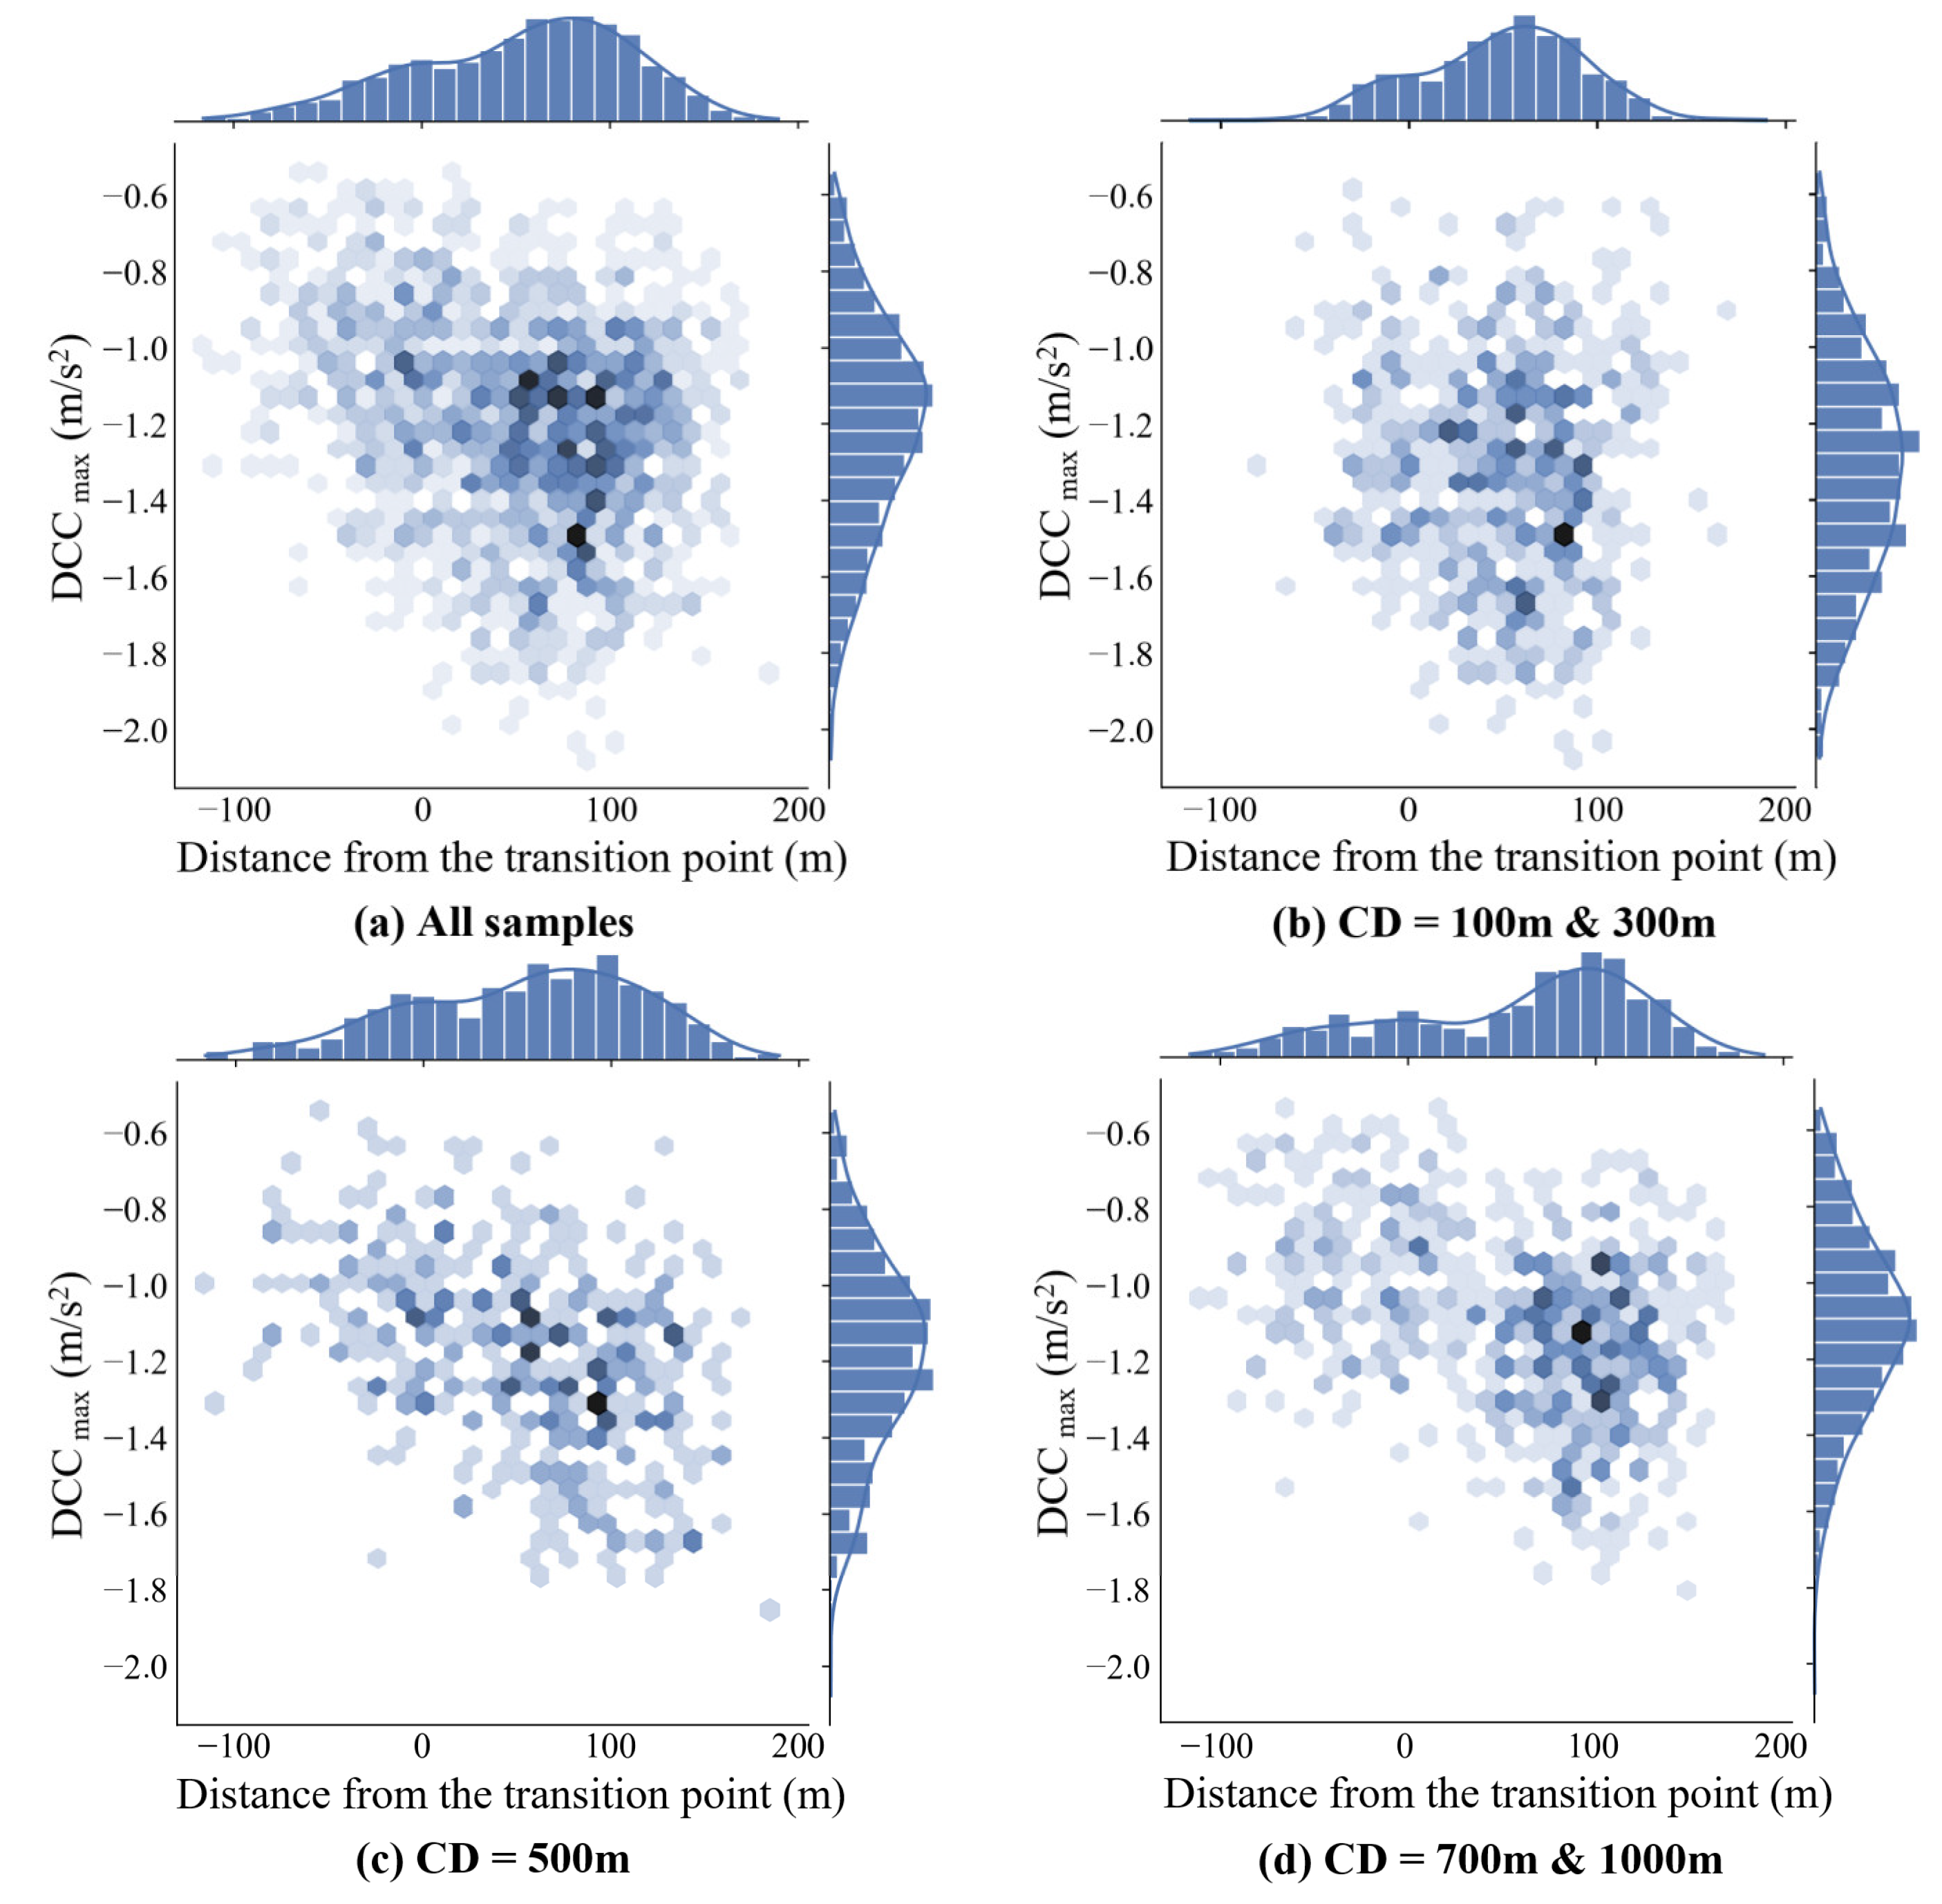
Figure 9.
Cumulative probability distribution of TH.
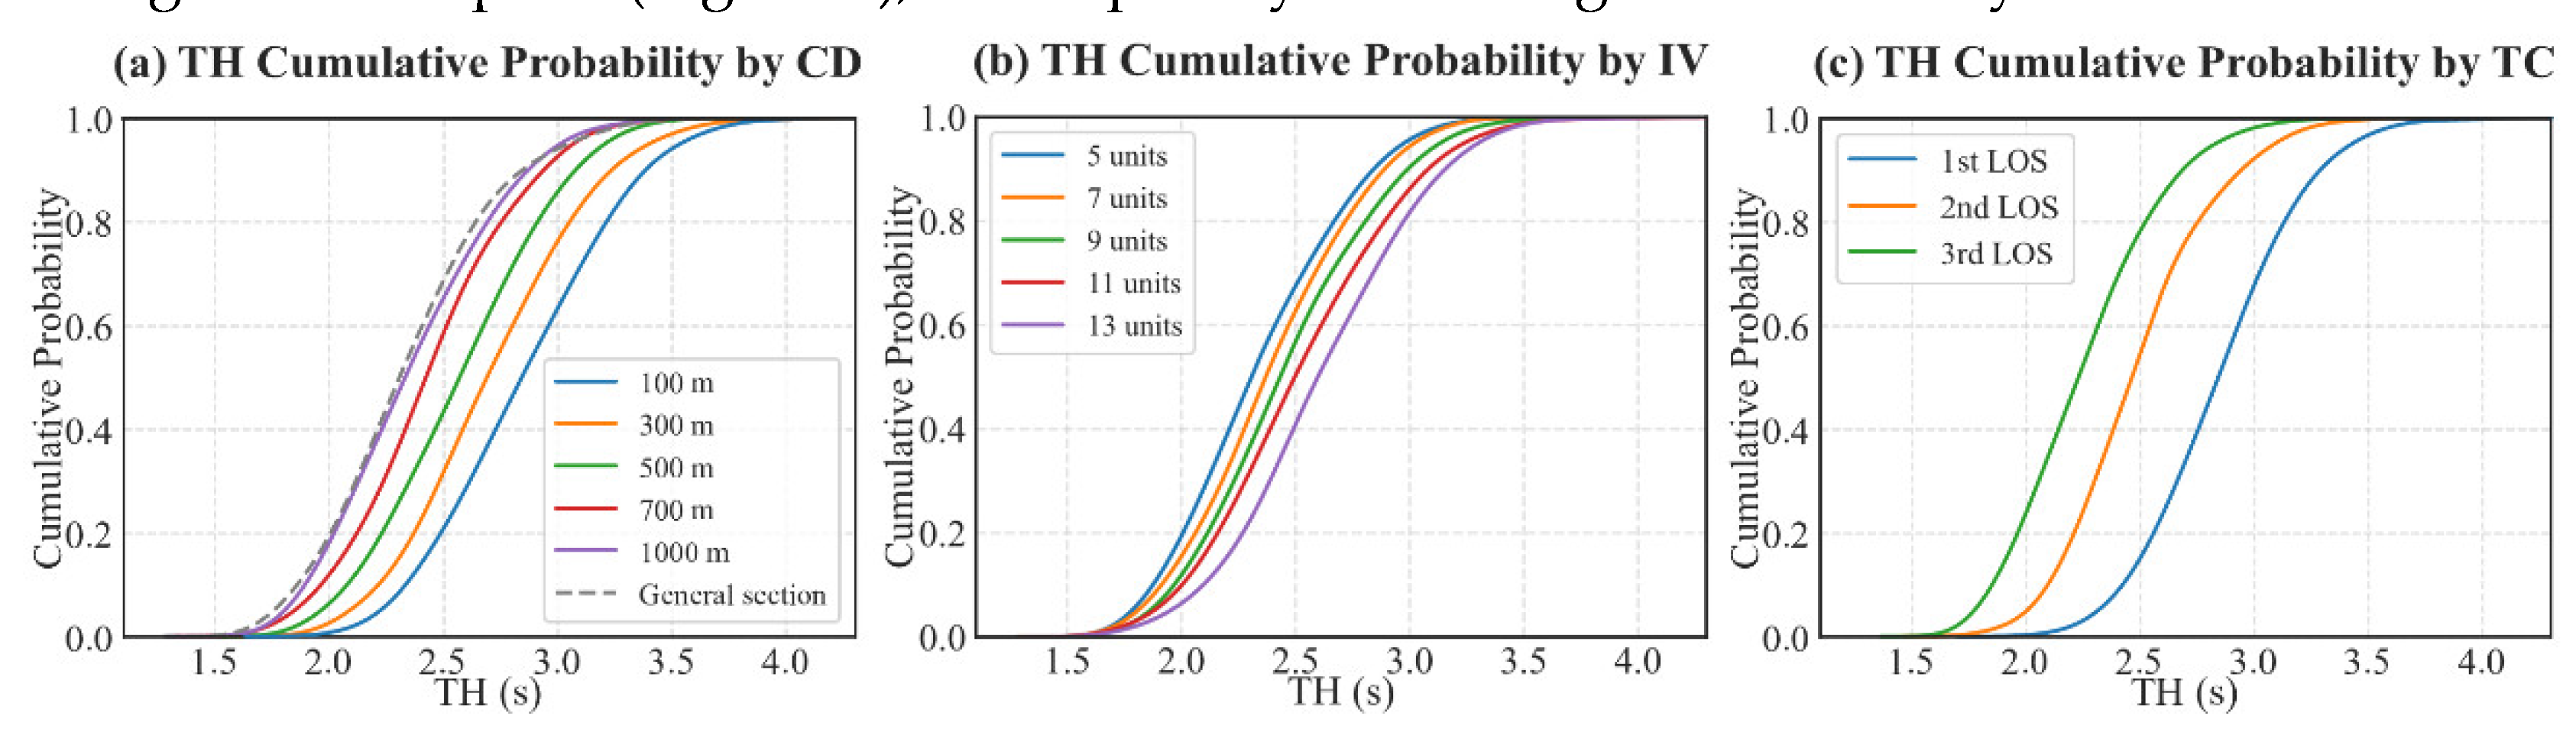
Figure 10.
Cumulative probability distribution of DH.
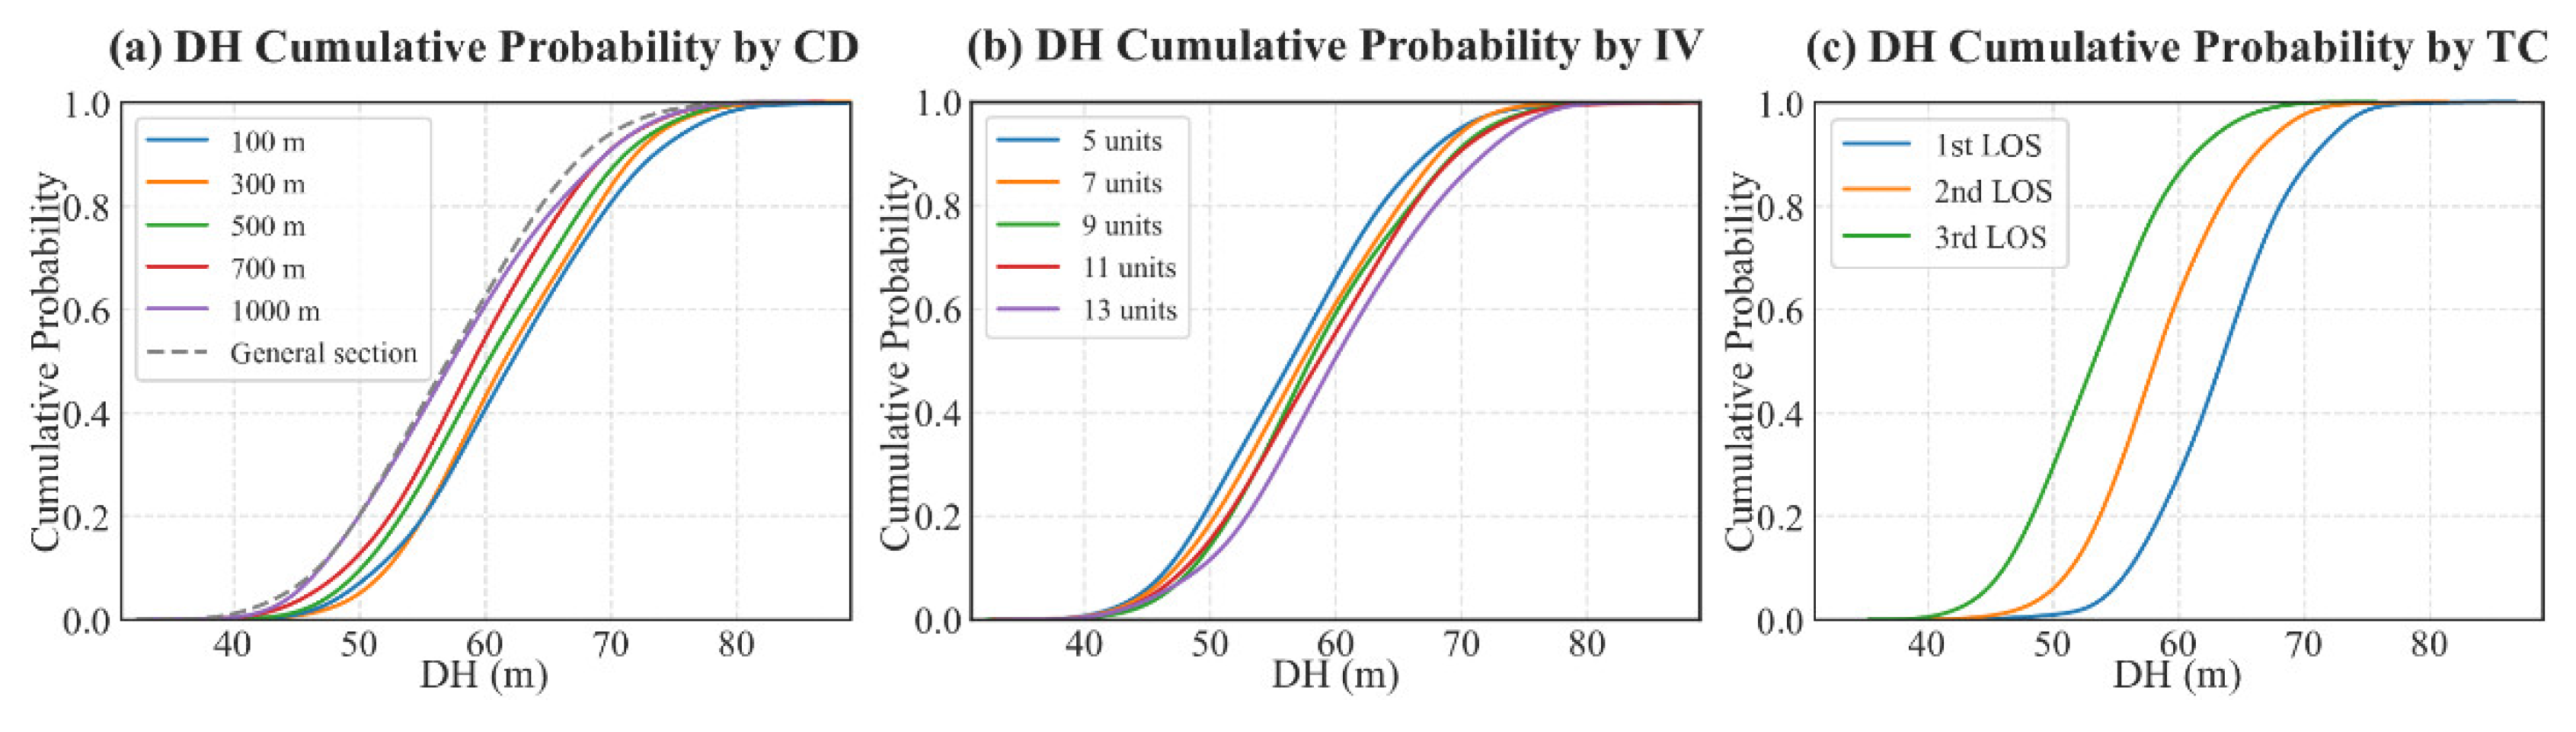
Figure 11.
Distribution of TH and DH under different CD and IV.
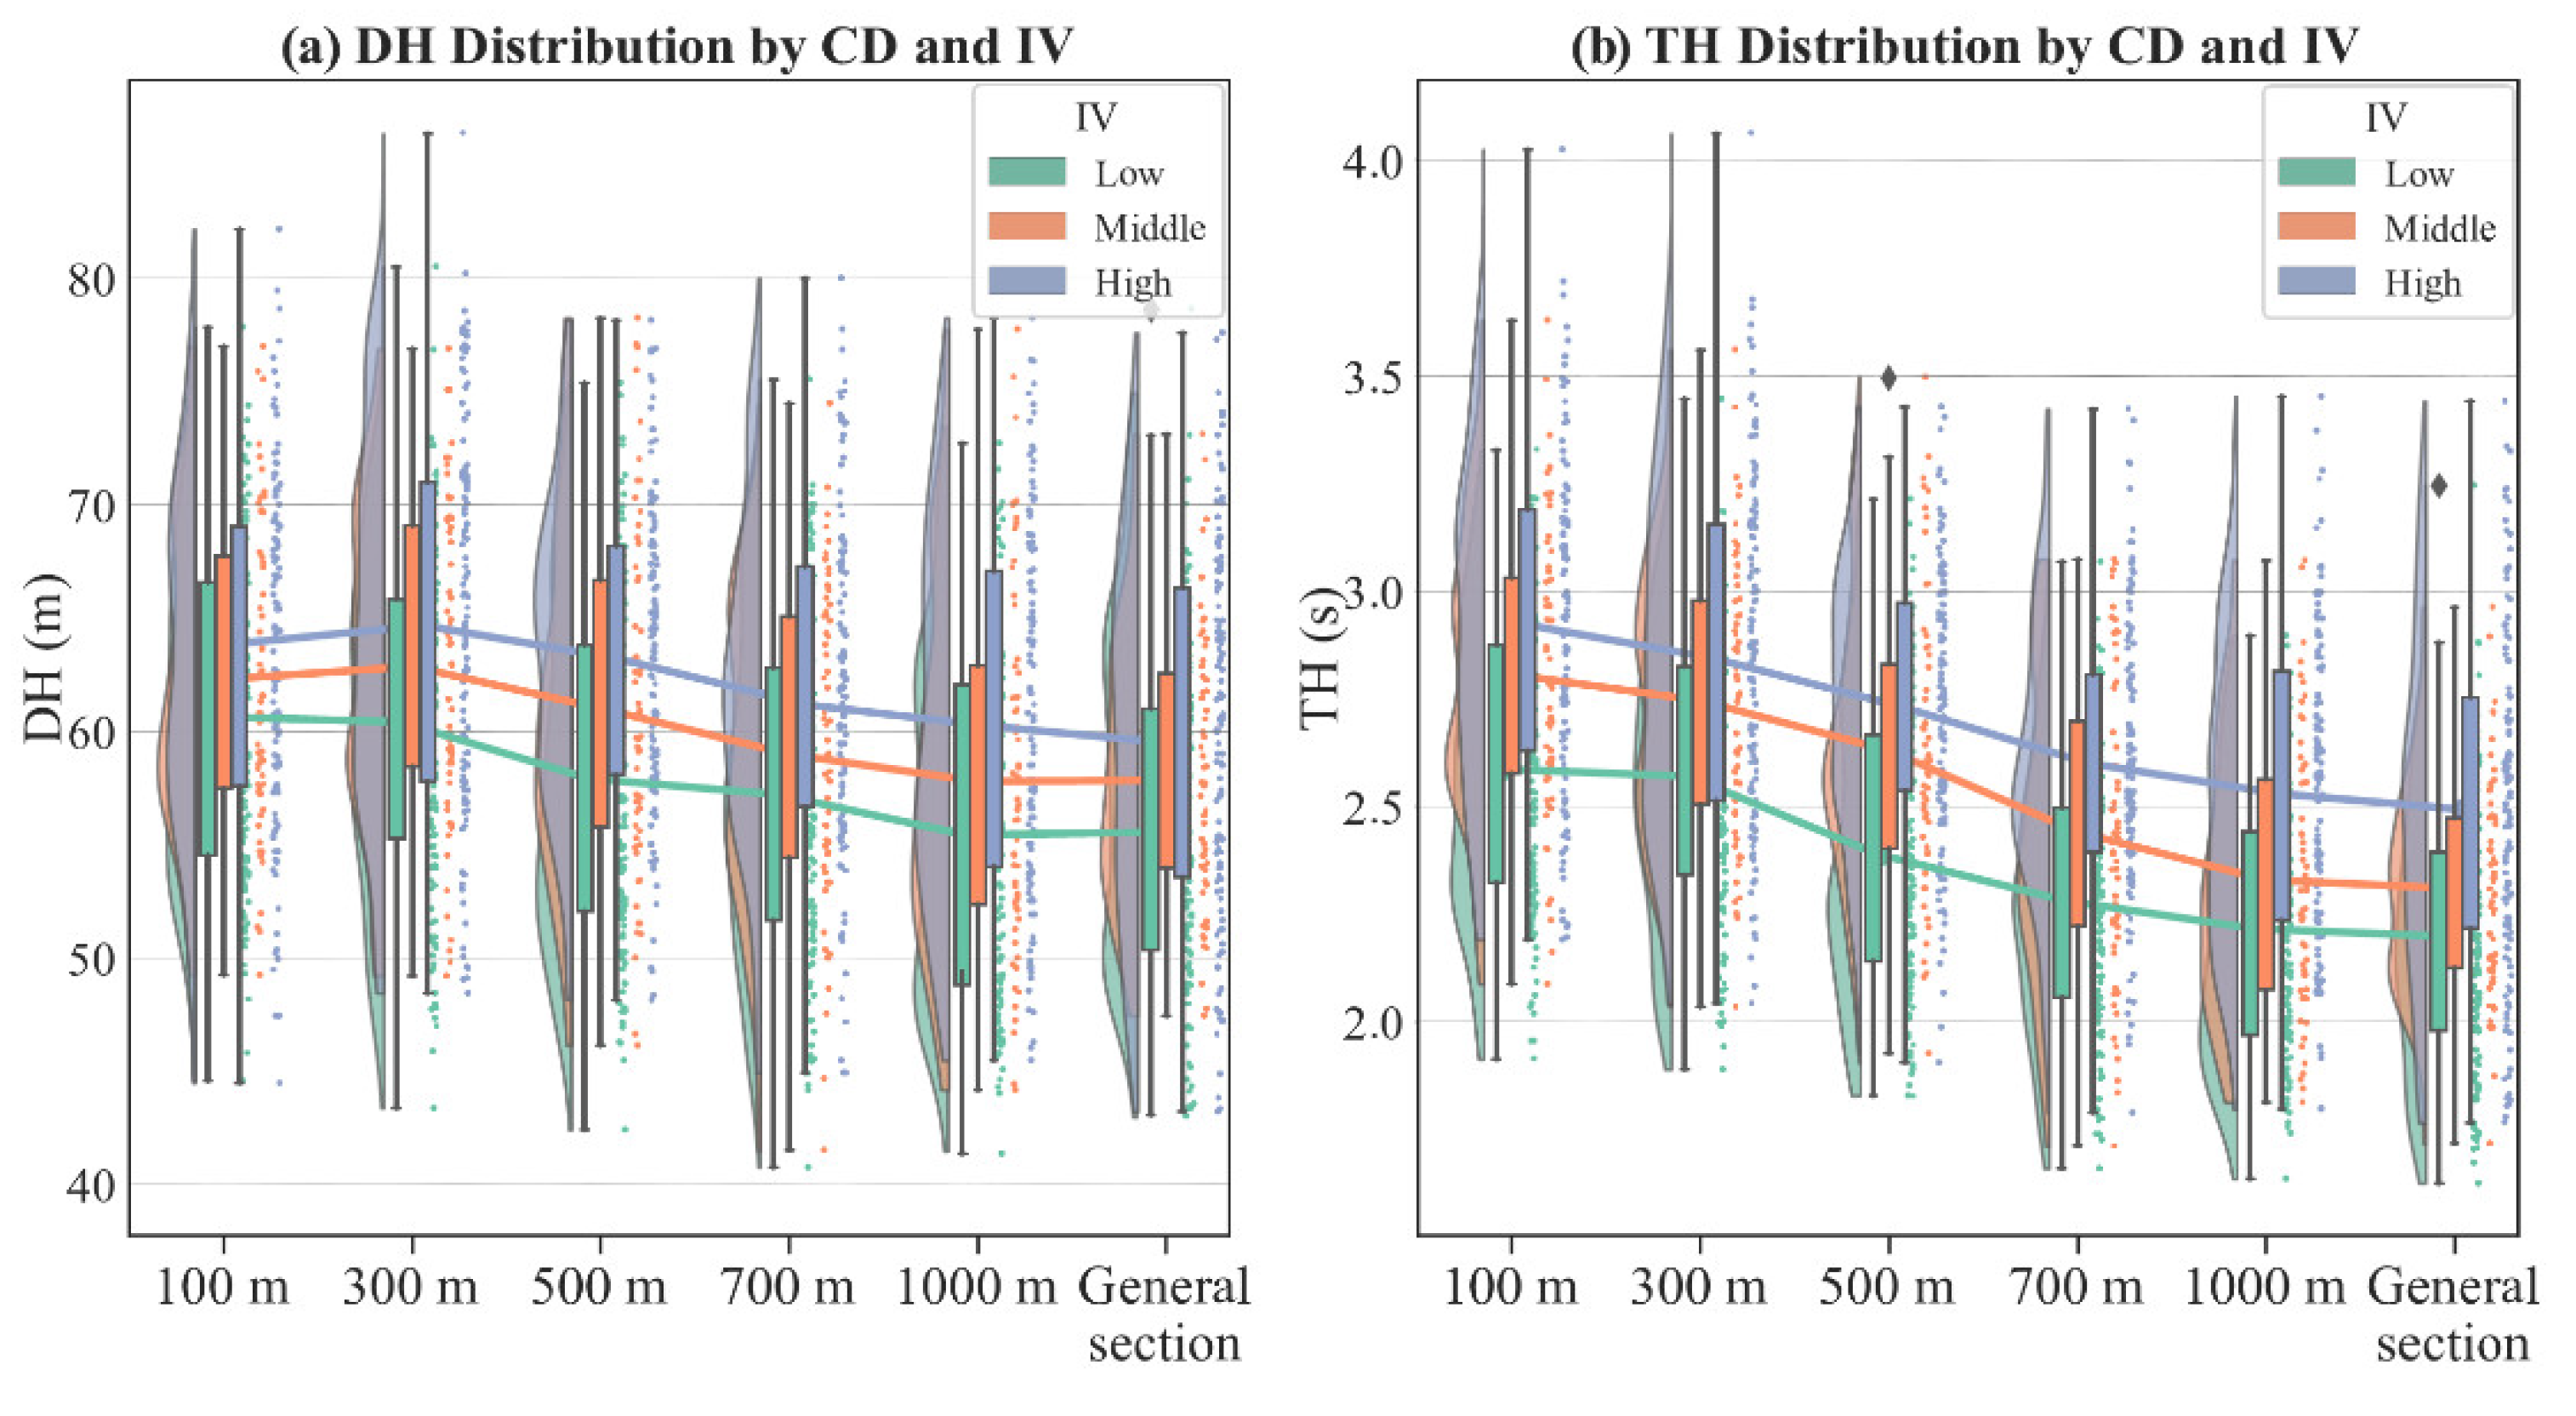
Figure 12.
Distribution of PMLC under different CD and IV.
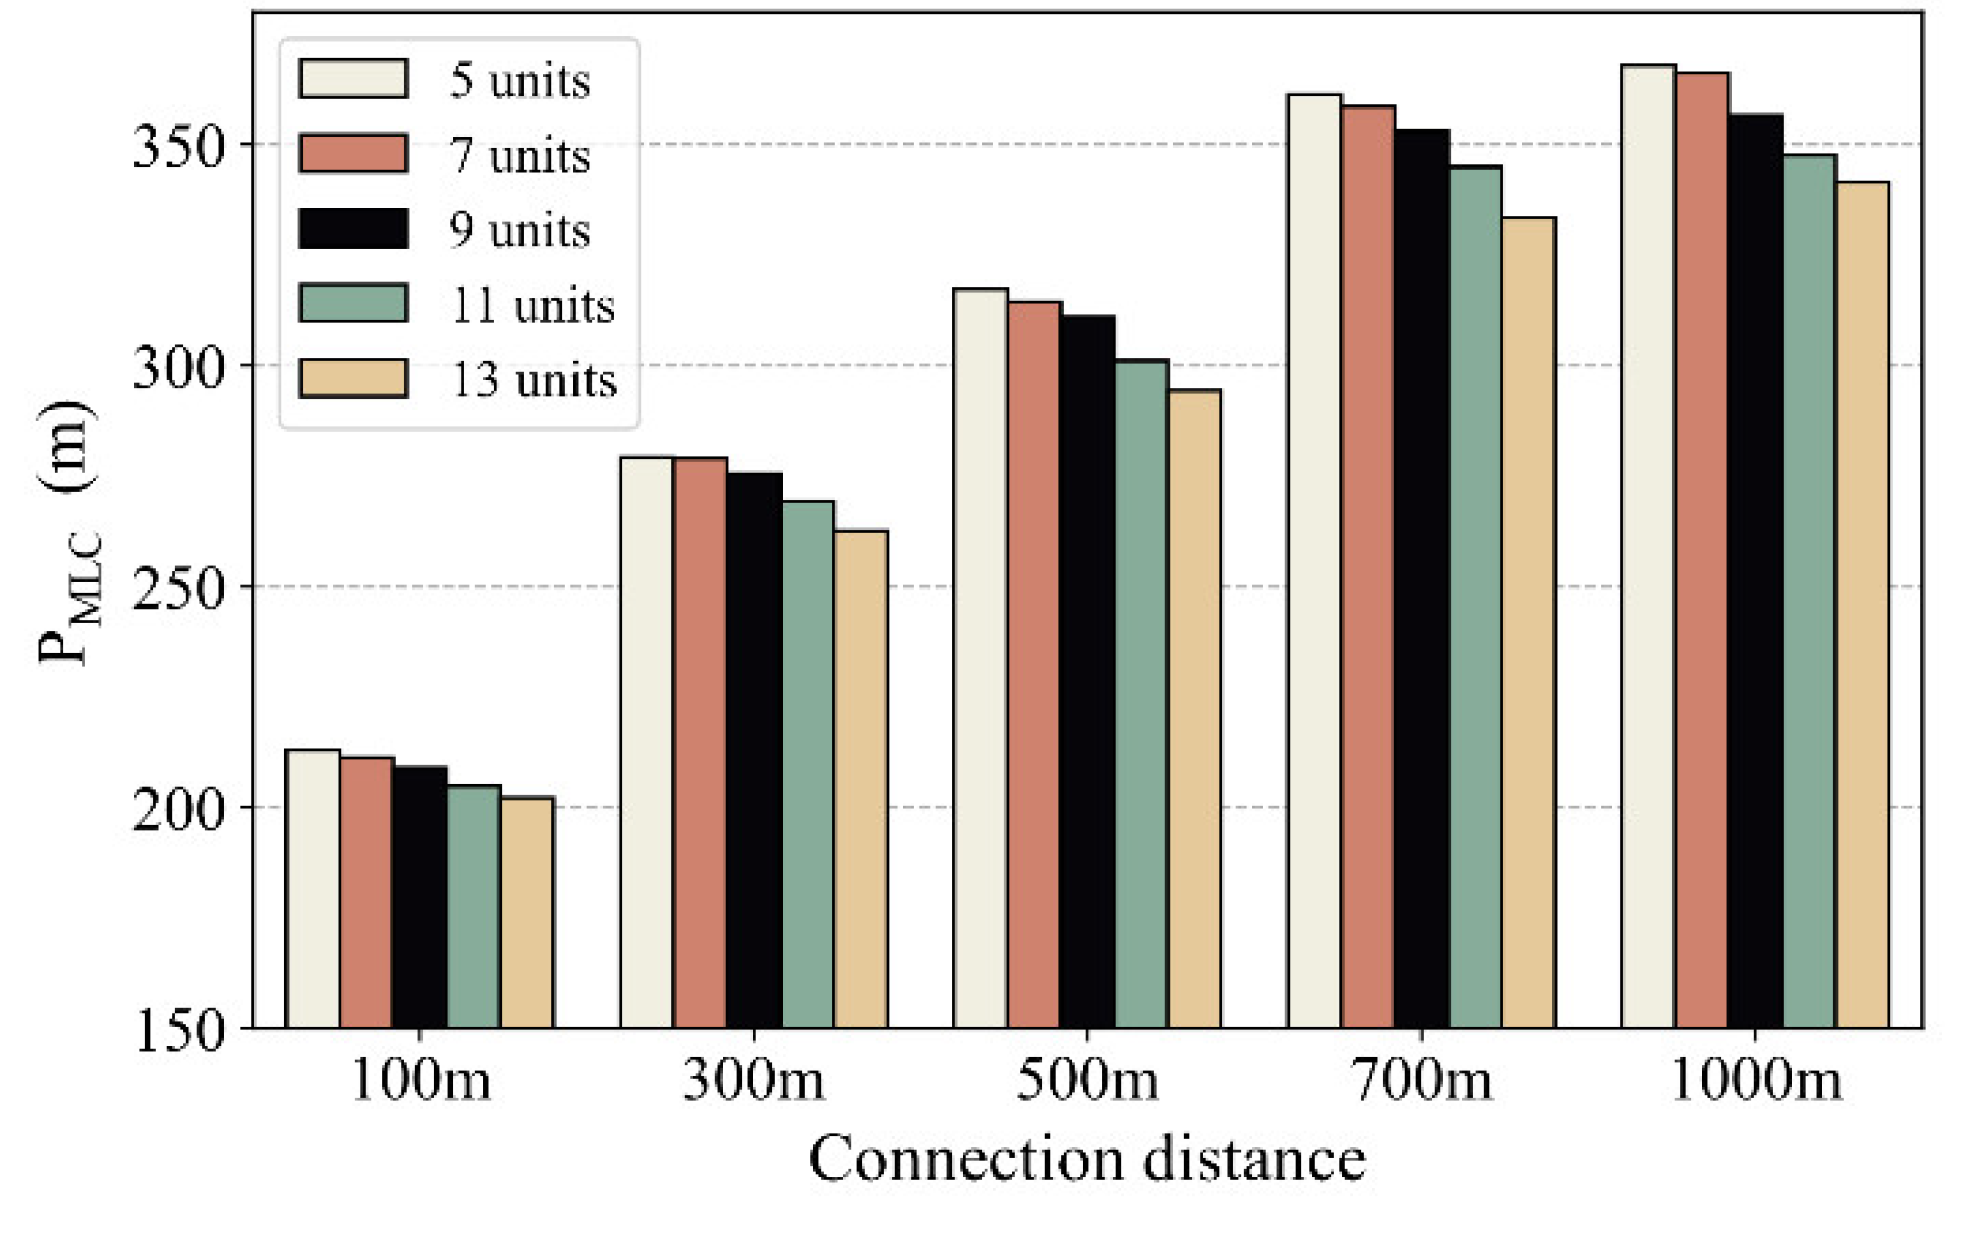
Figure 13.
LC trajectories under different CD.
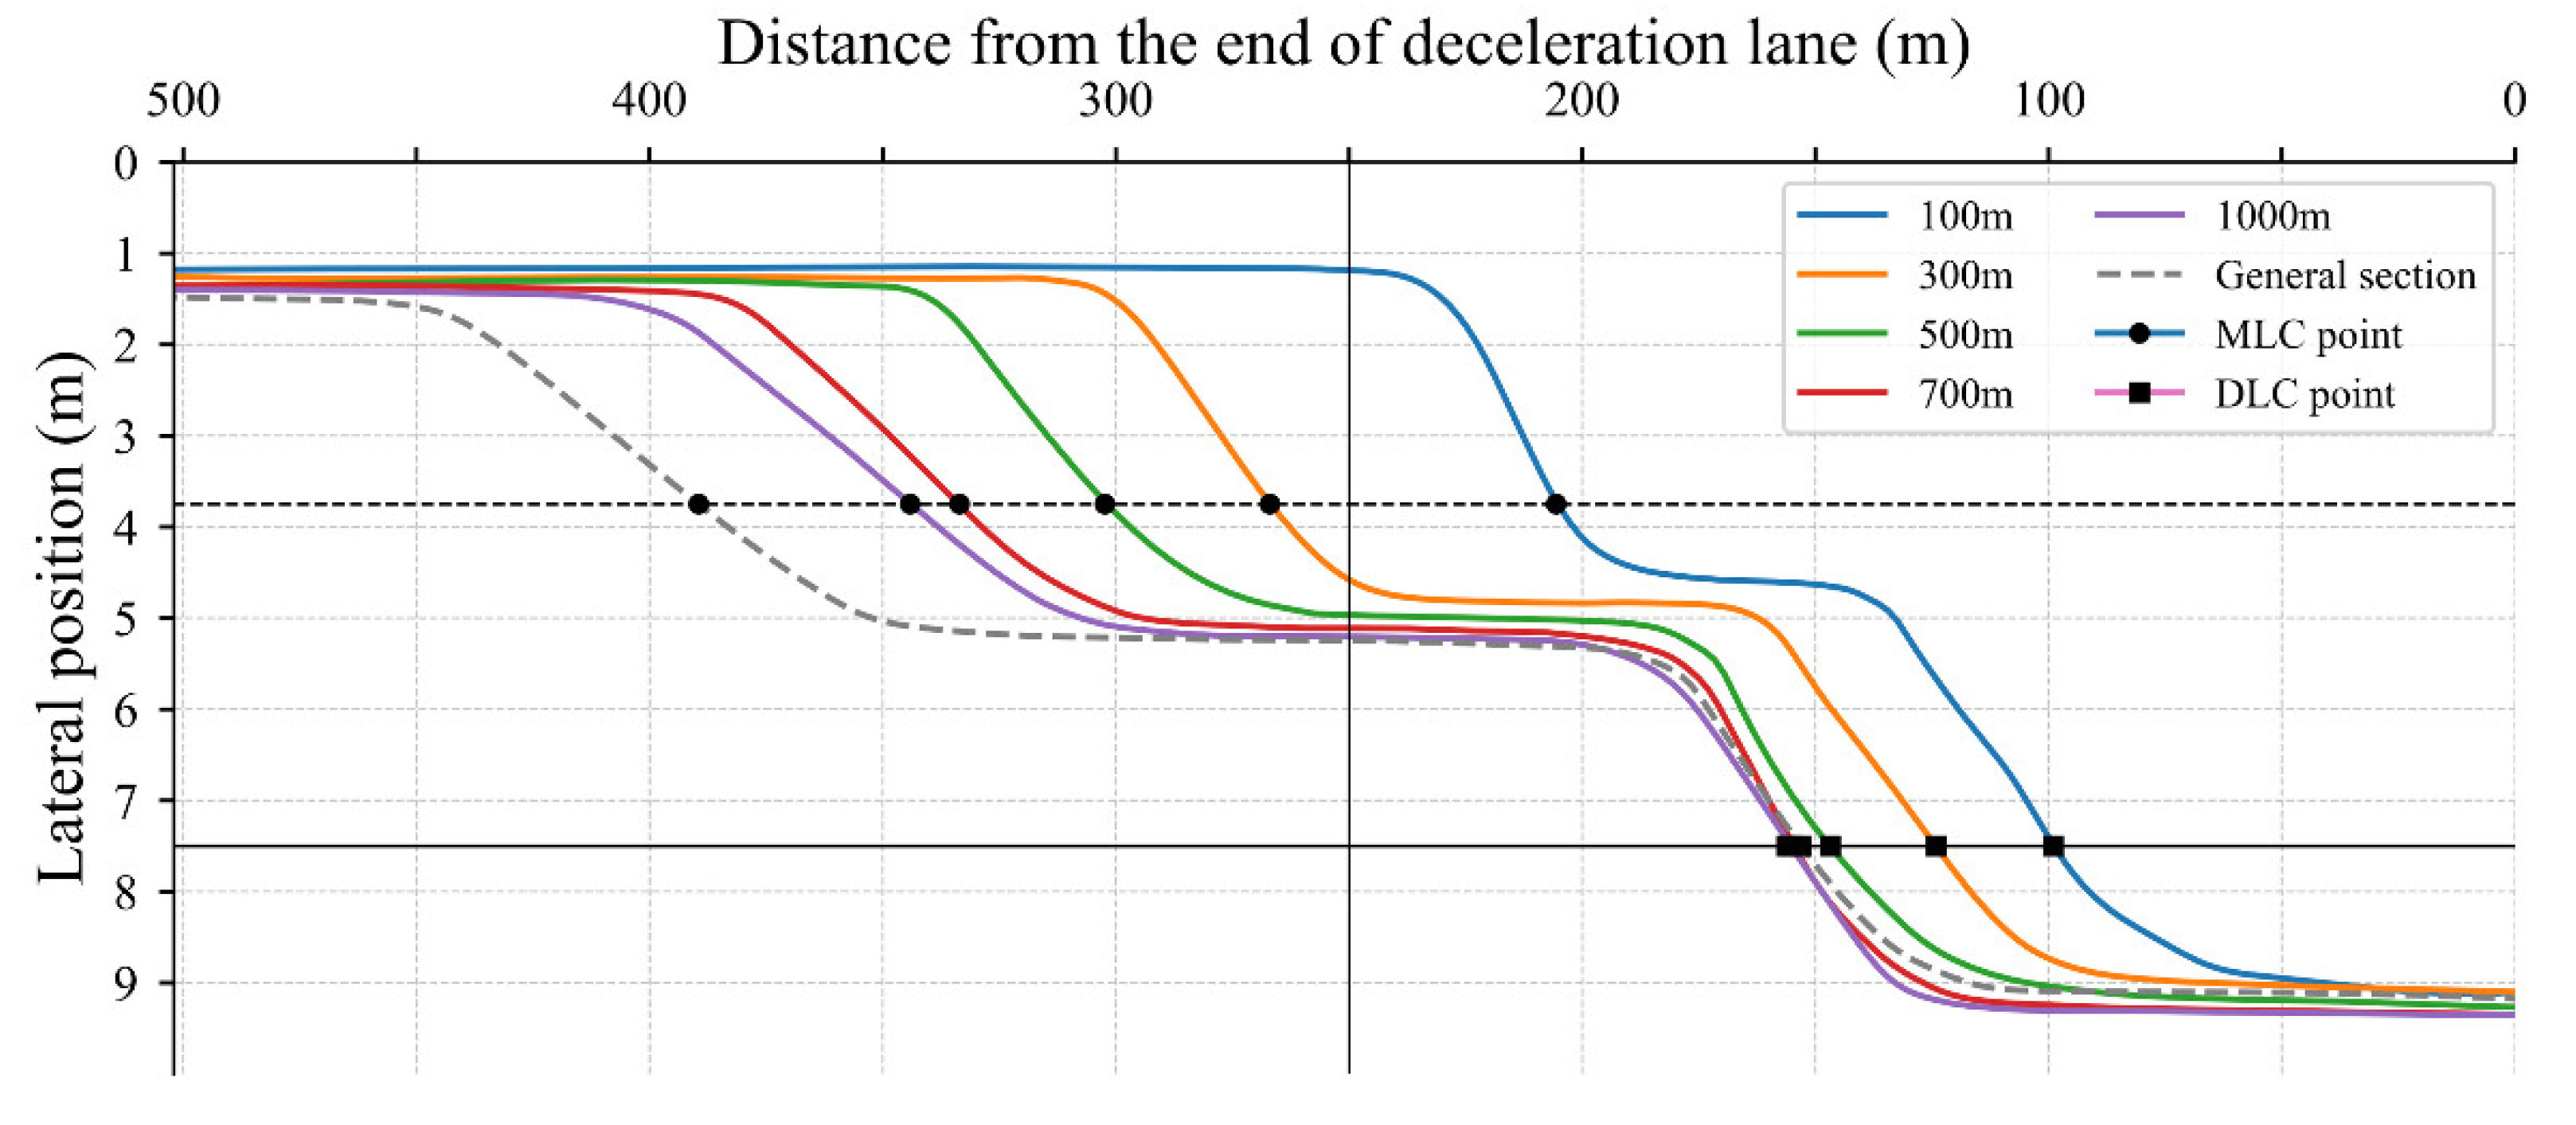
Figure 14.
Distribution of MLC characteristics.
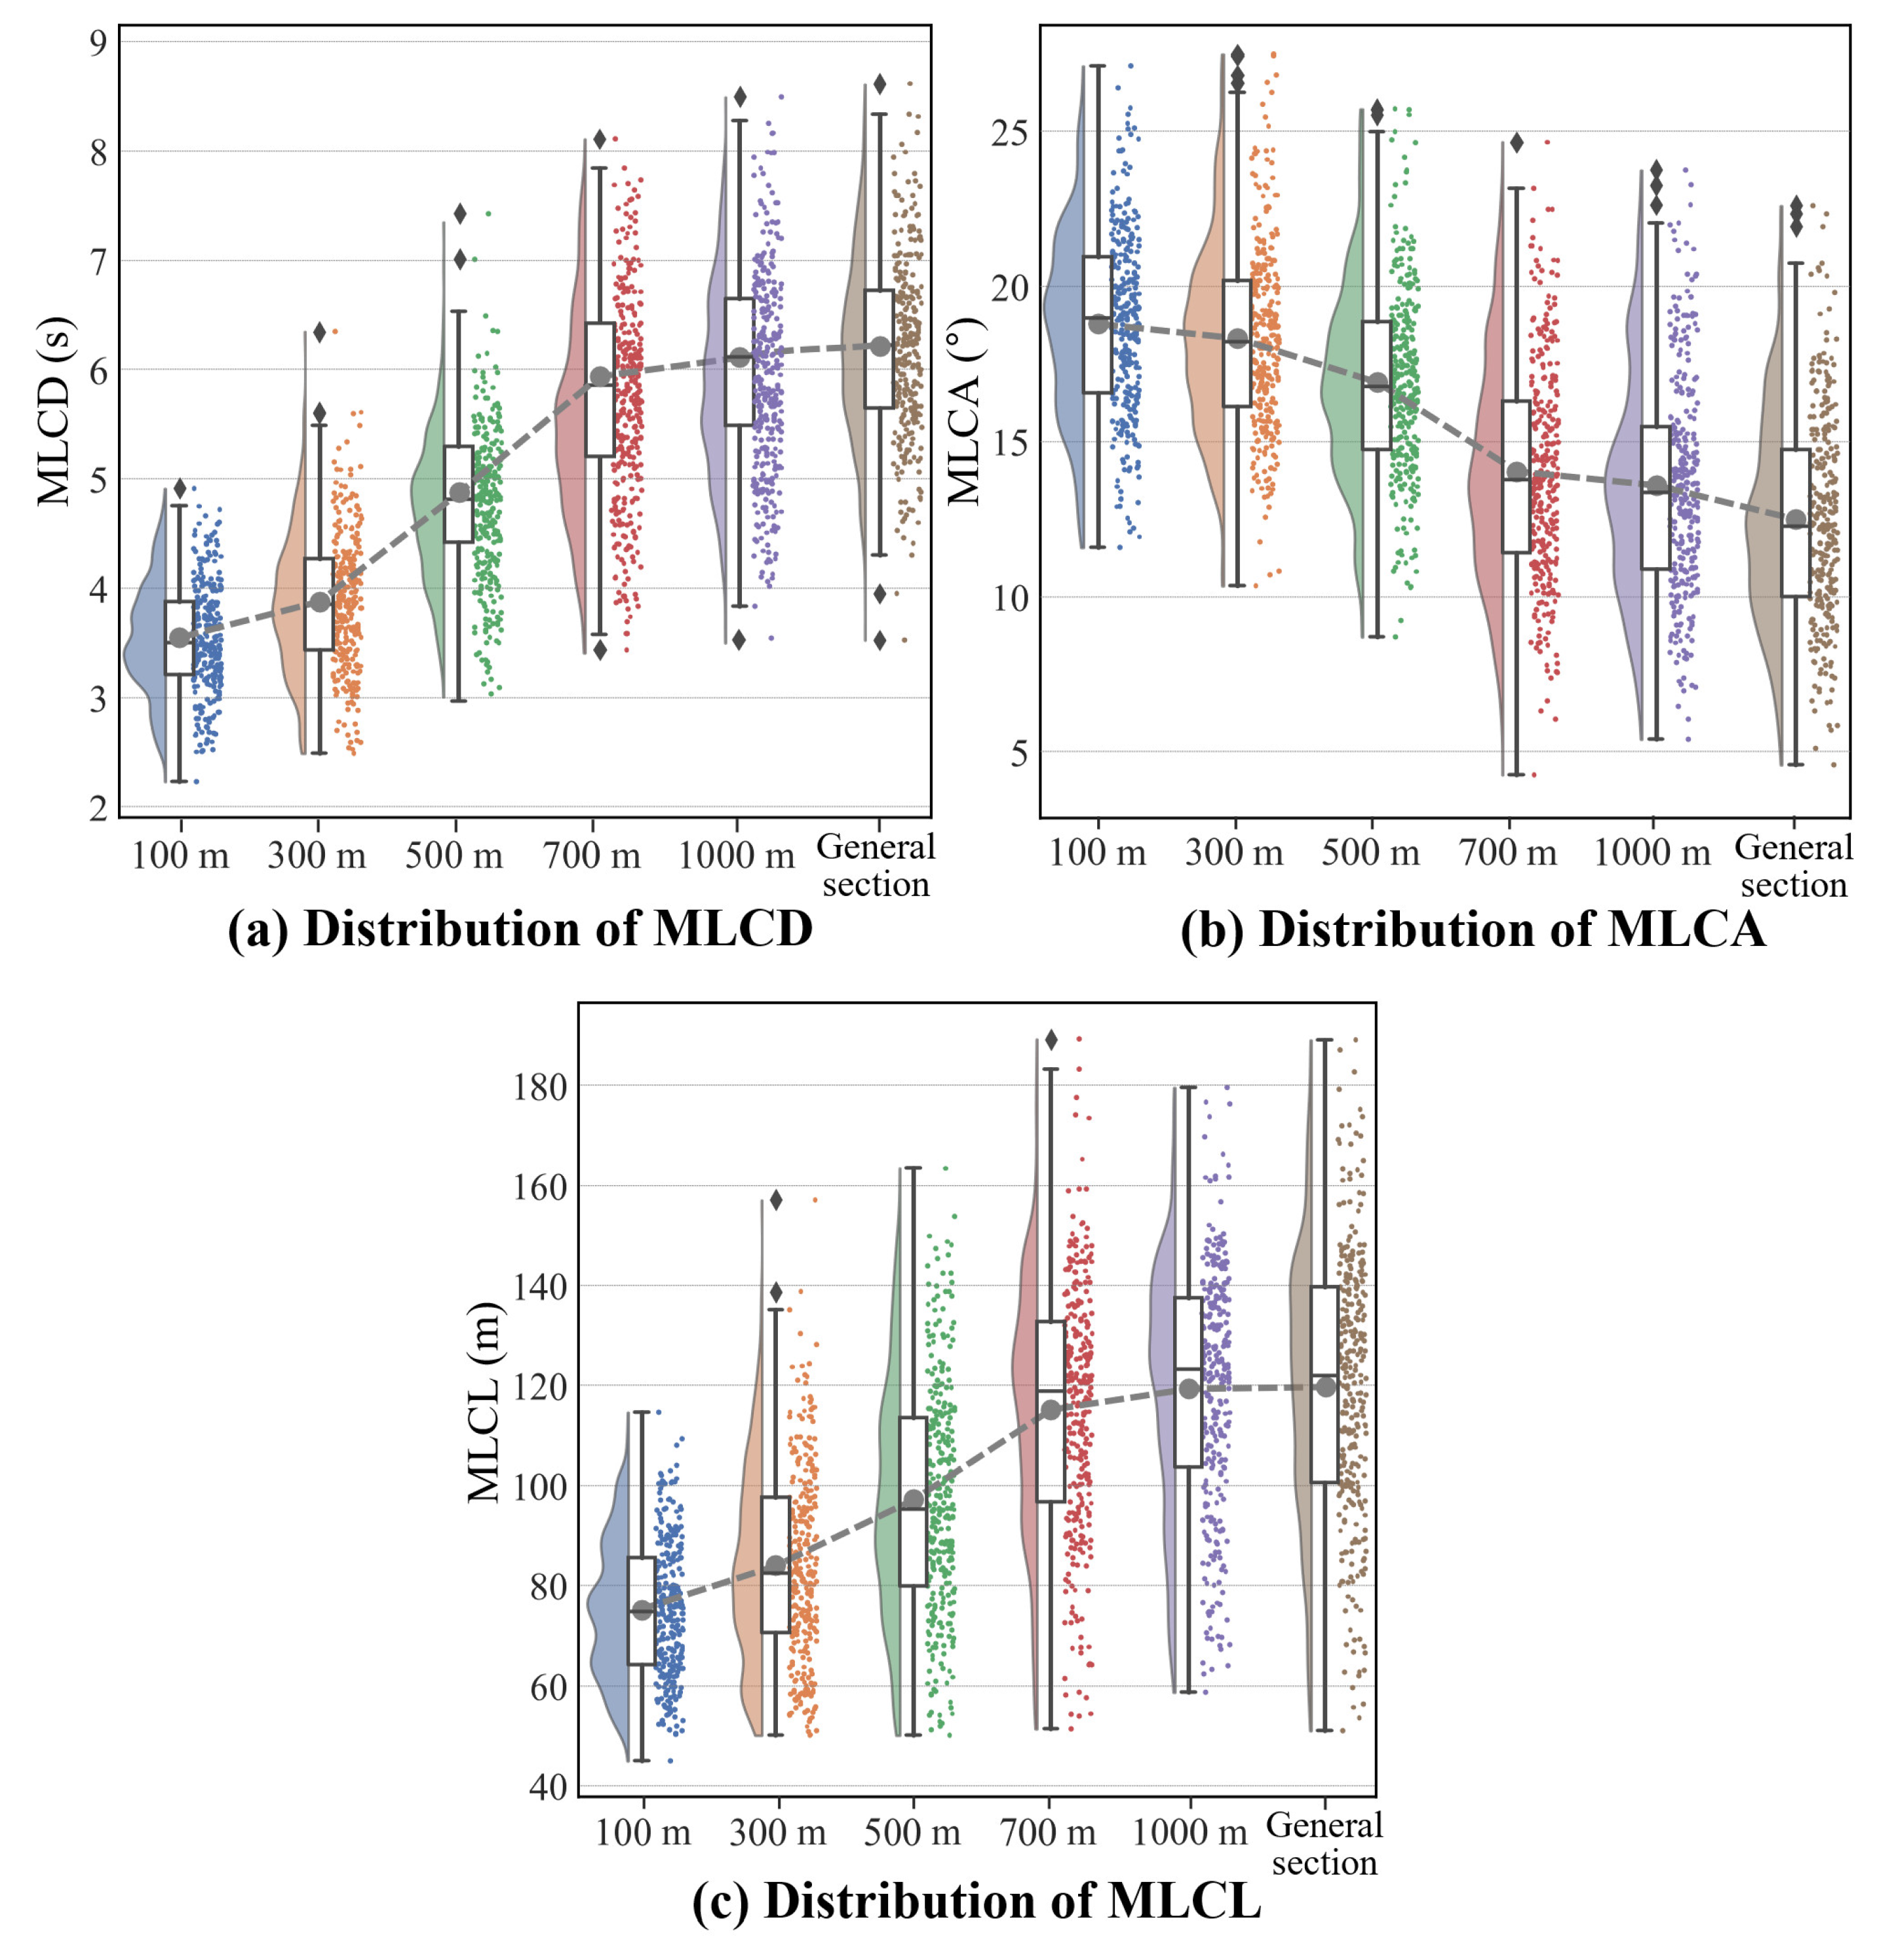
Figure 15.
Joint distribution between MLCD, MLCL and MLCA.
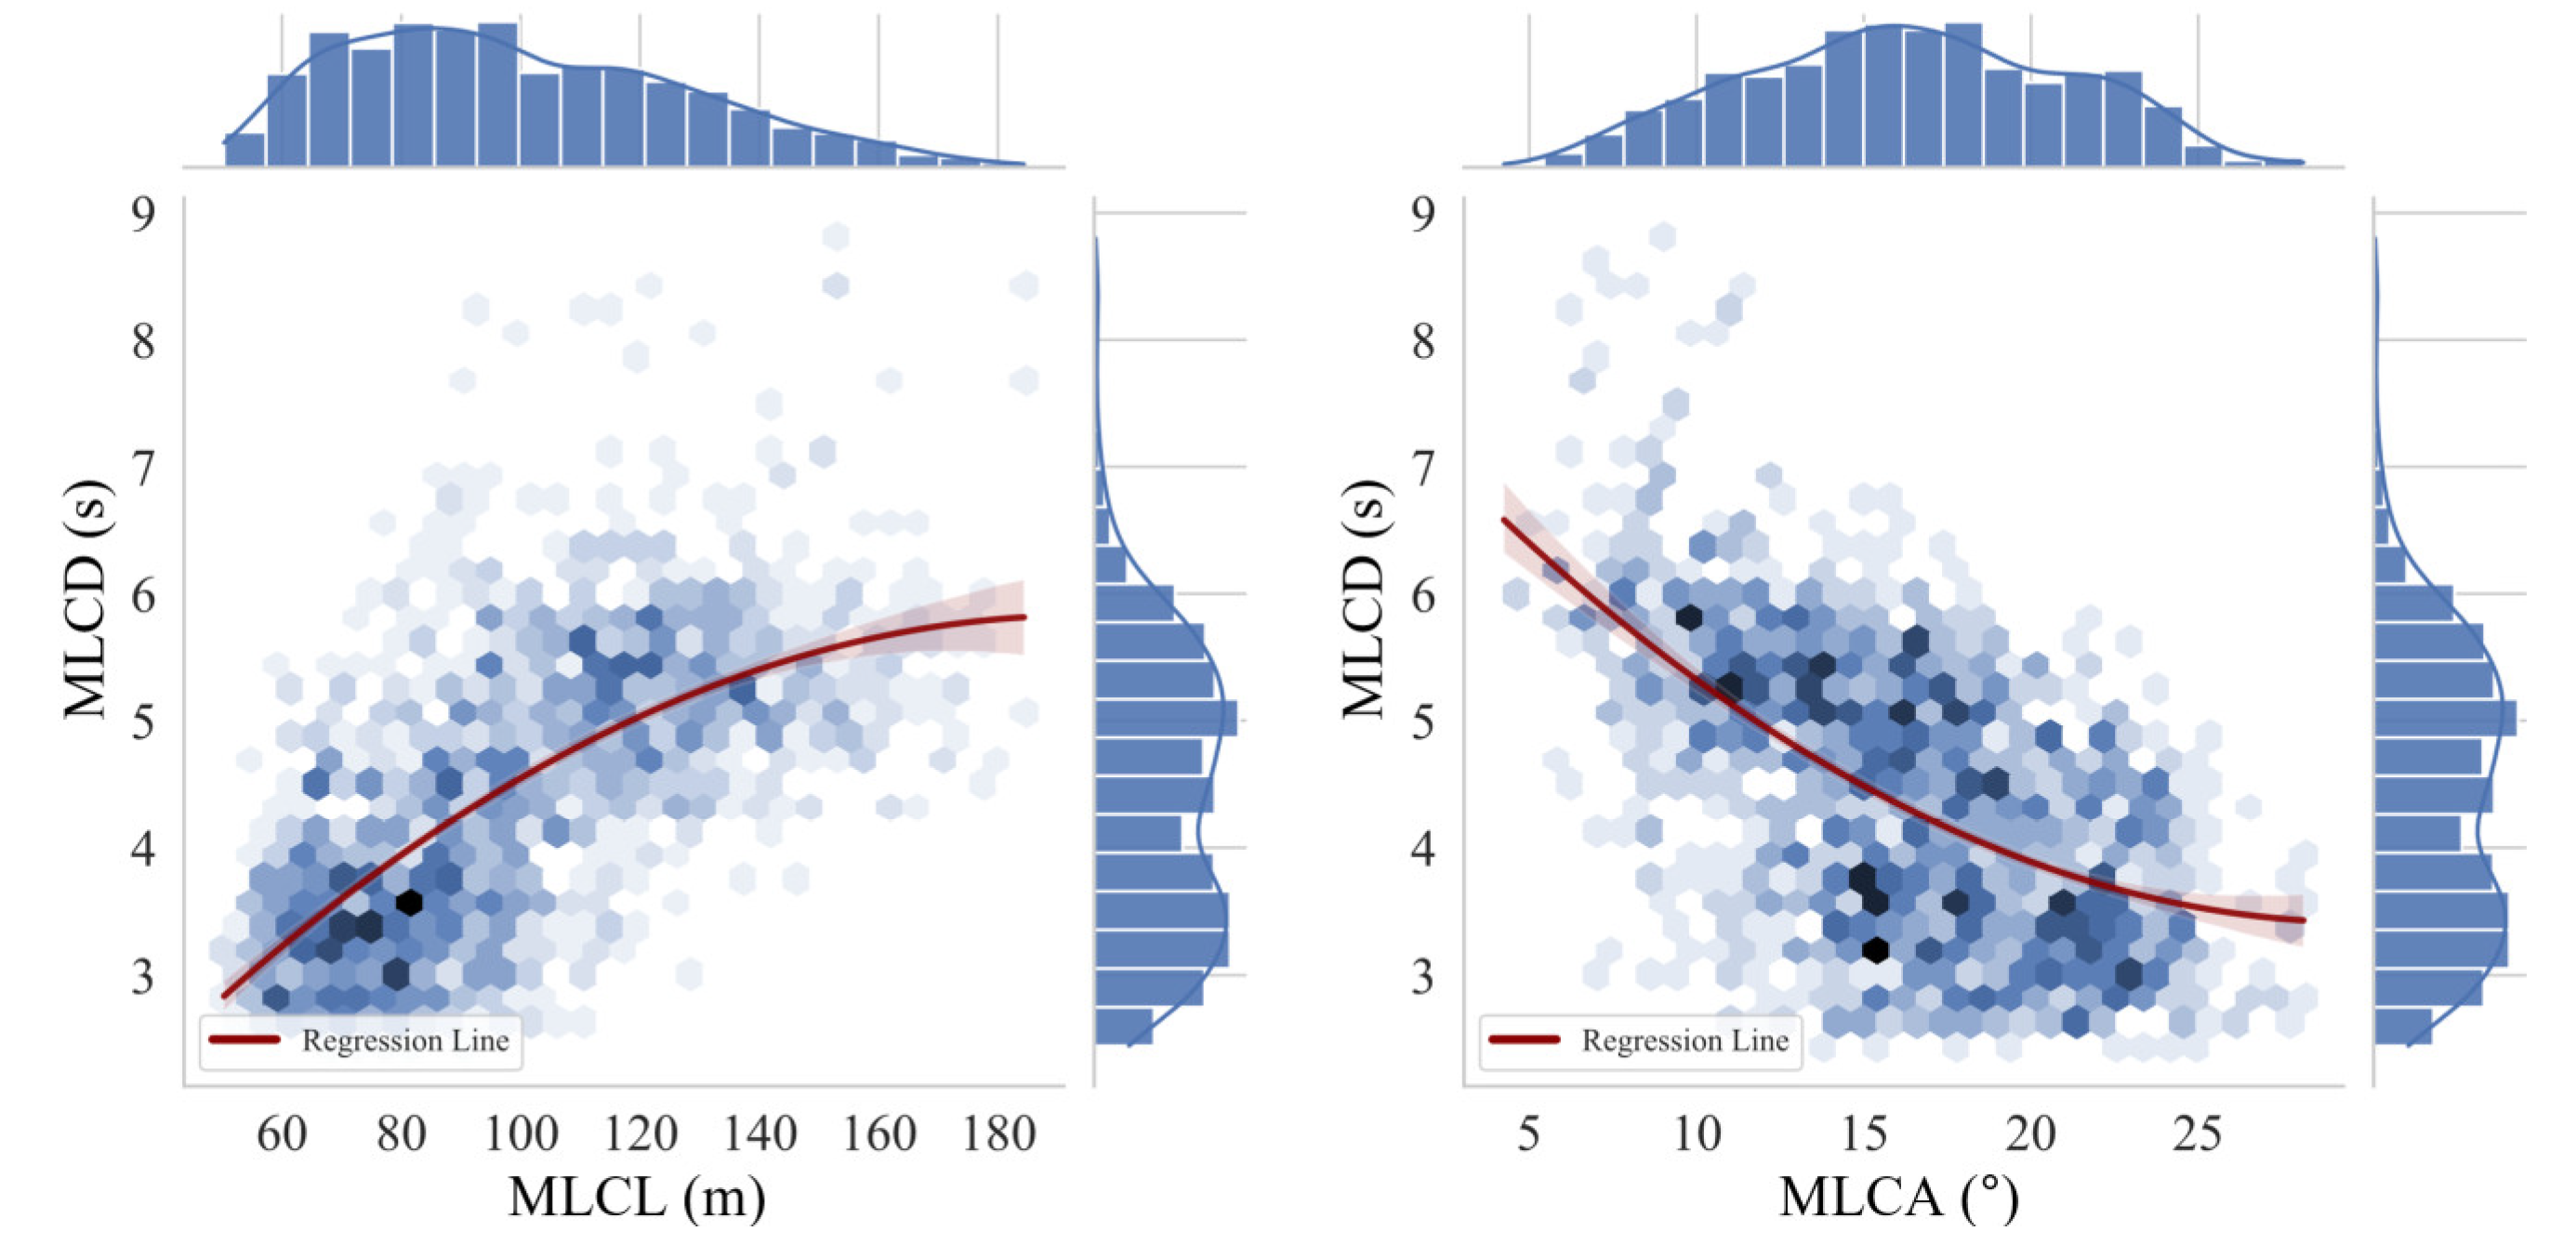
Figure 16.
Distribution of accepted gaps.
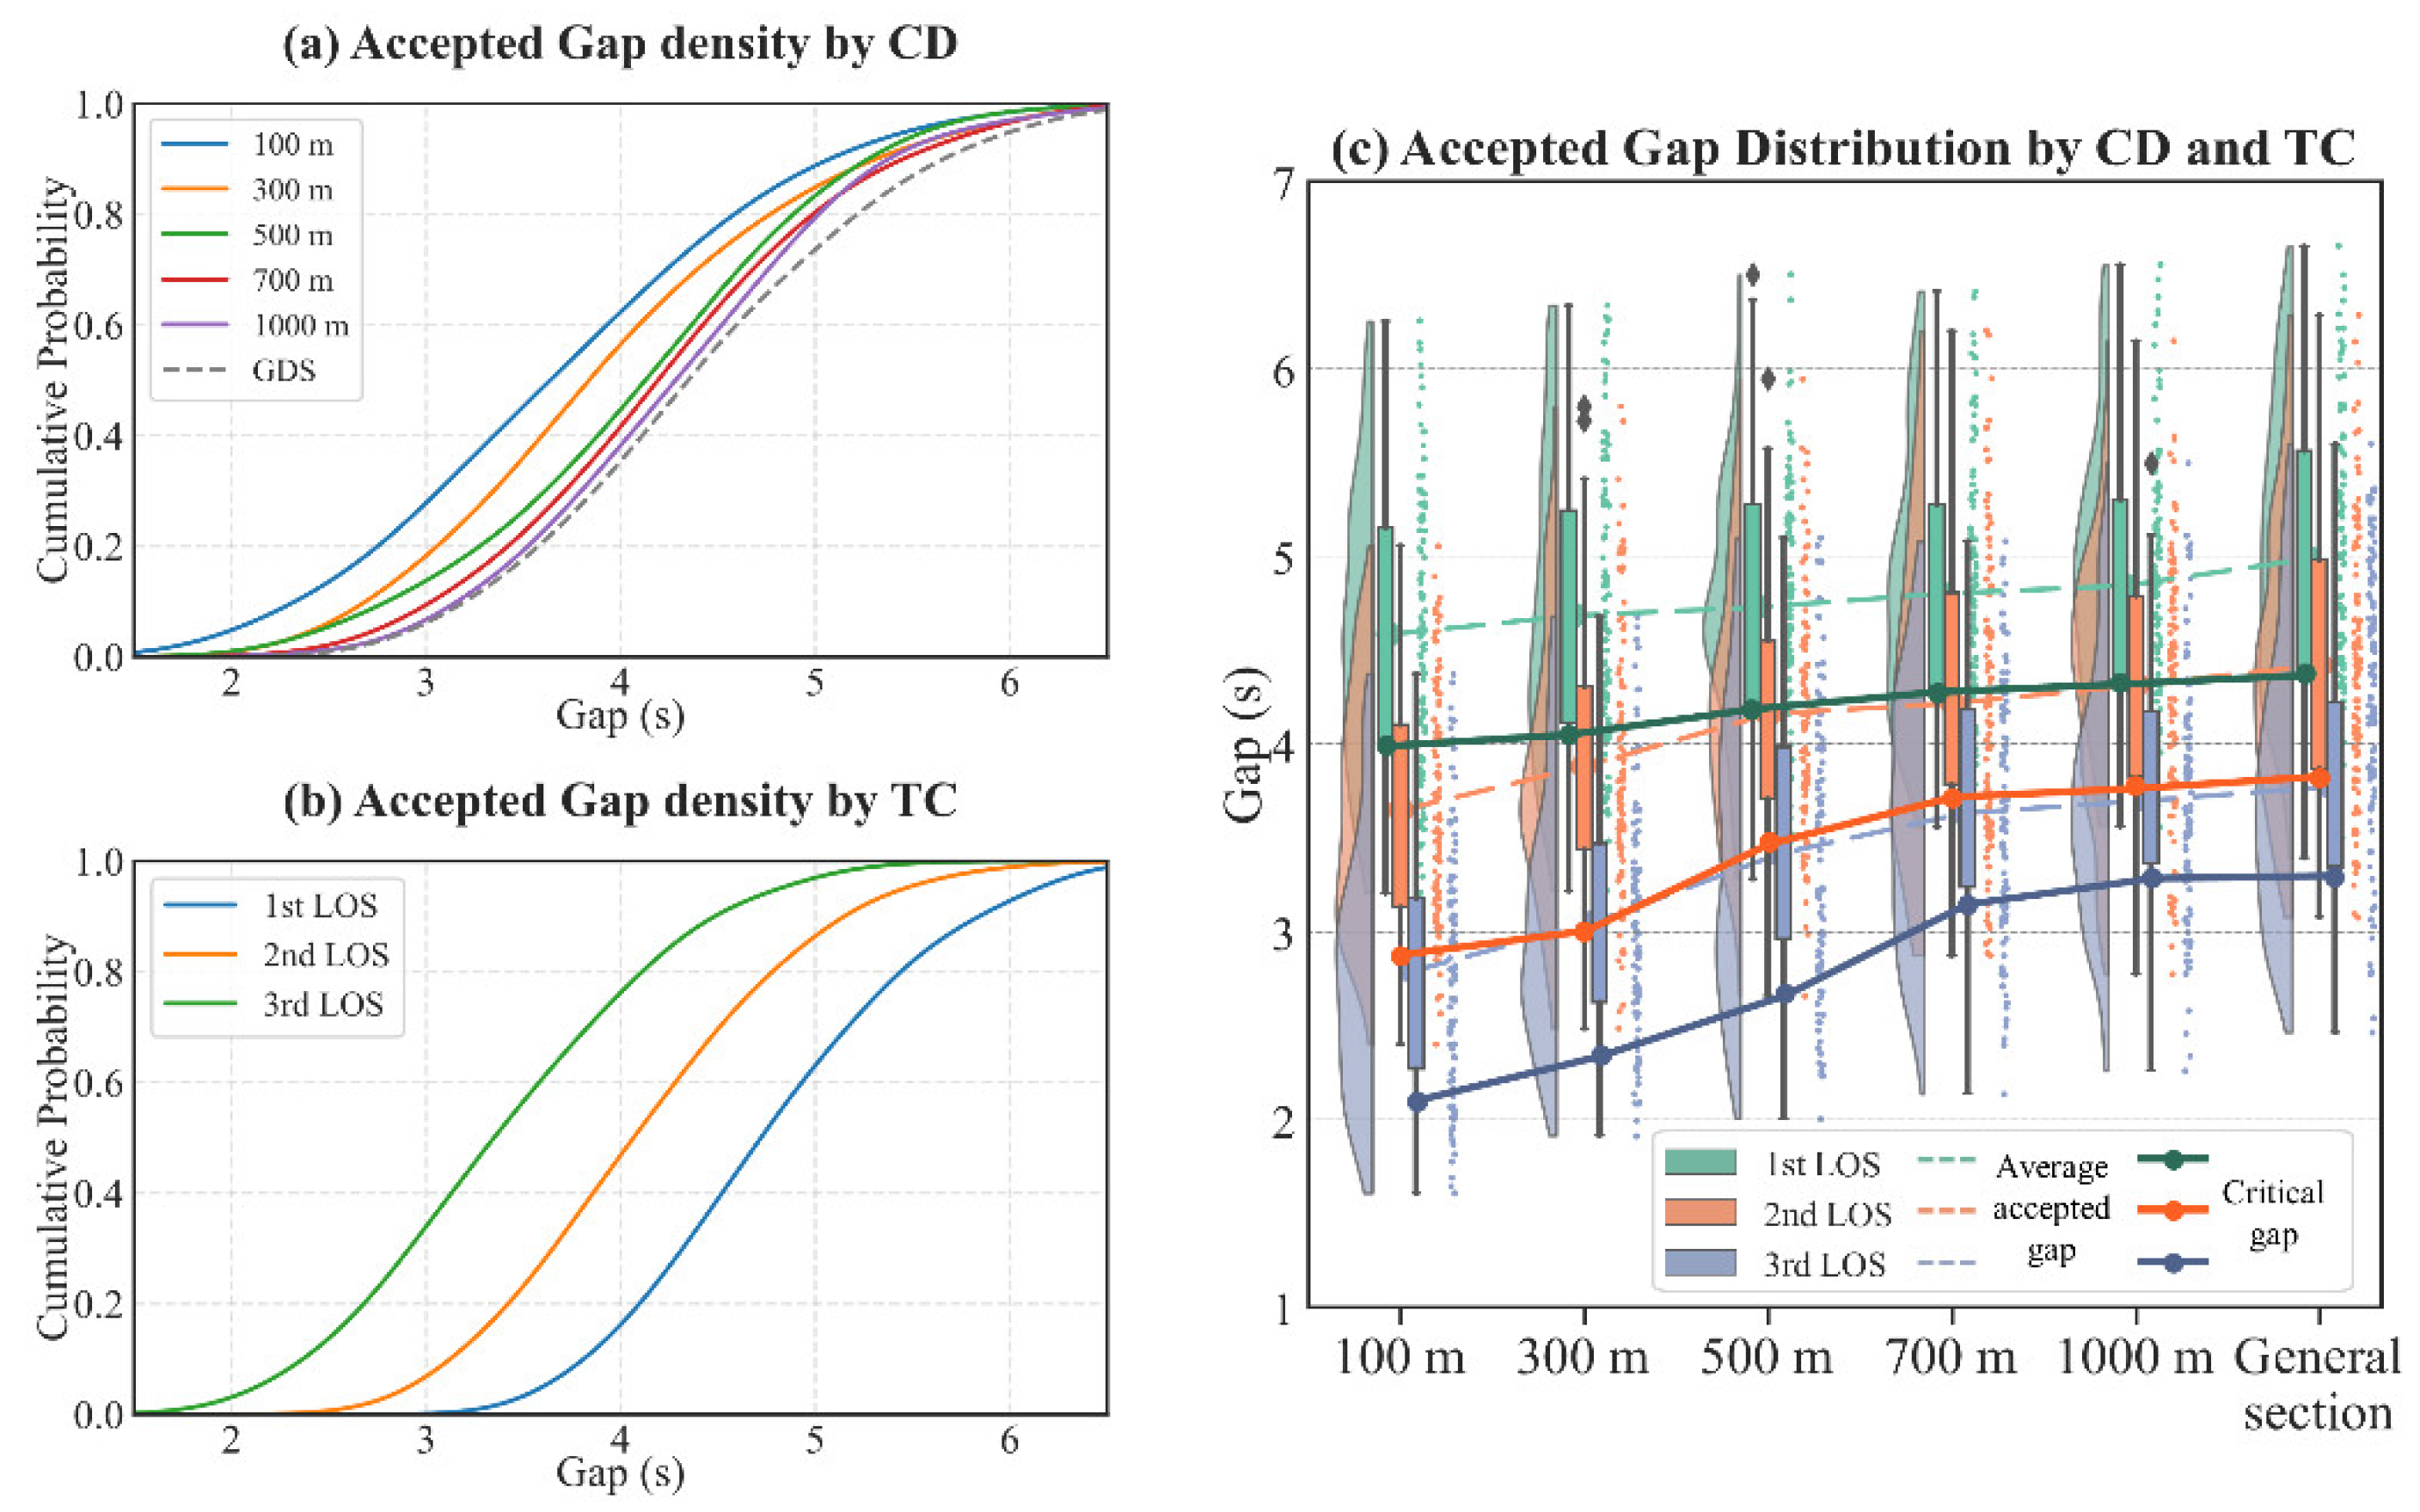
Figure 17.
Joint distribution between accepted gap and MLC indicators.
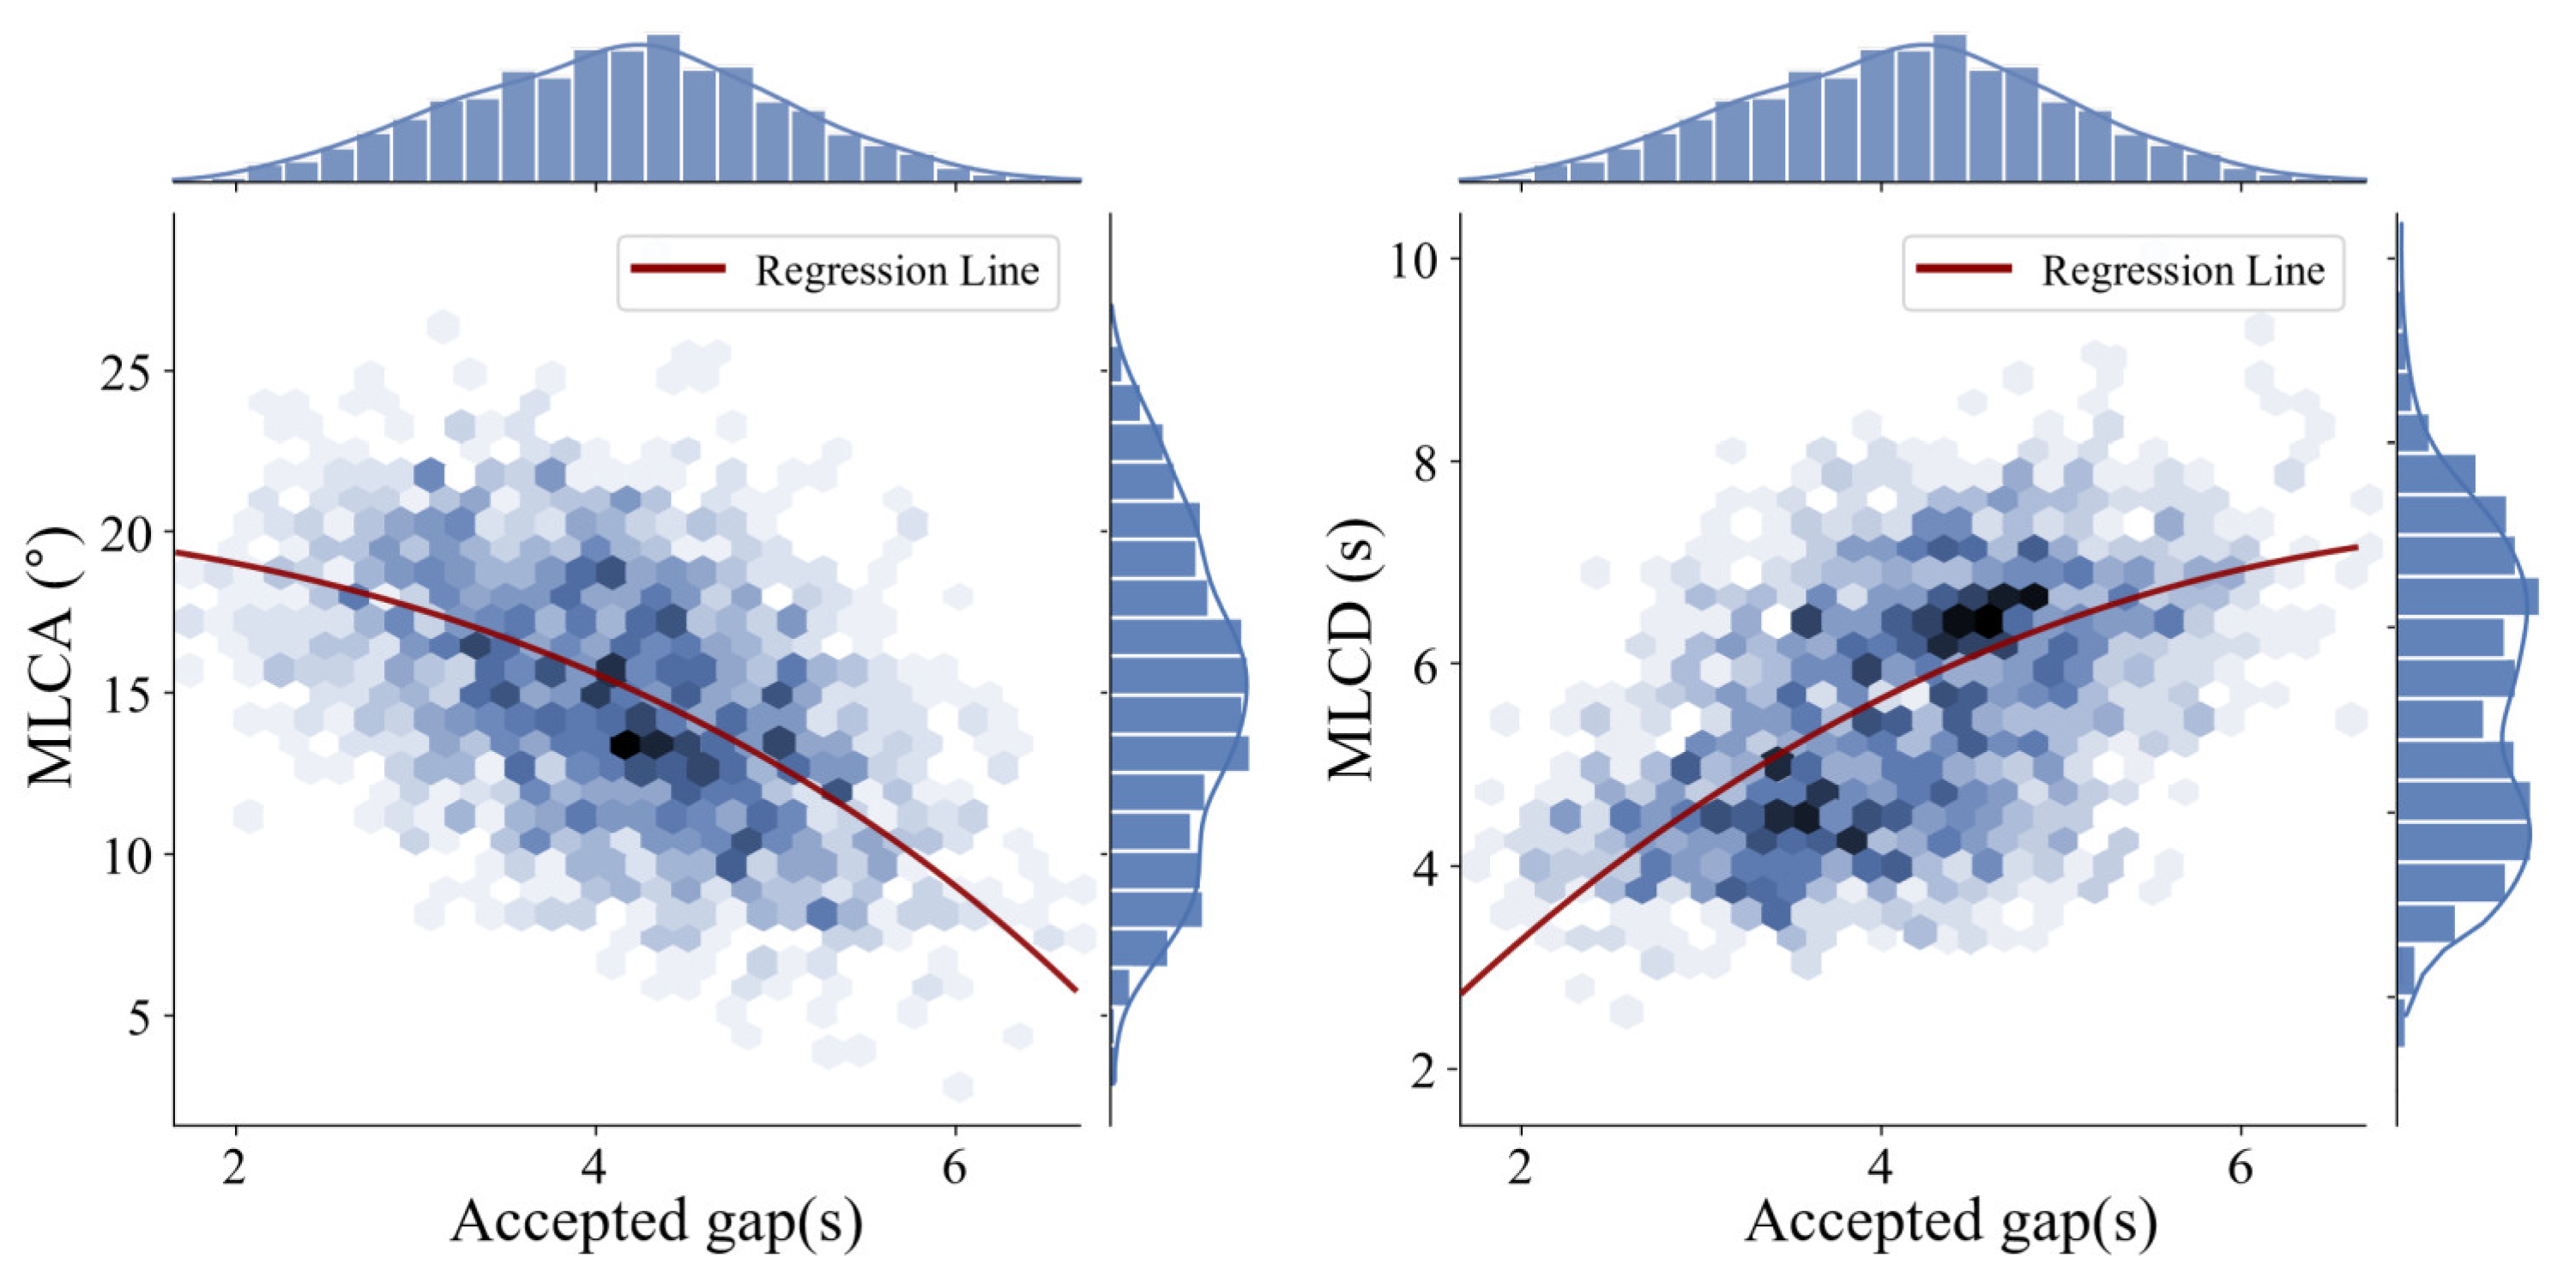
Figure 18.
Analysis of failure samples.
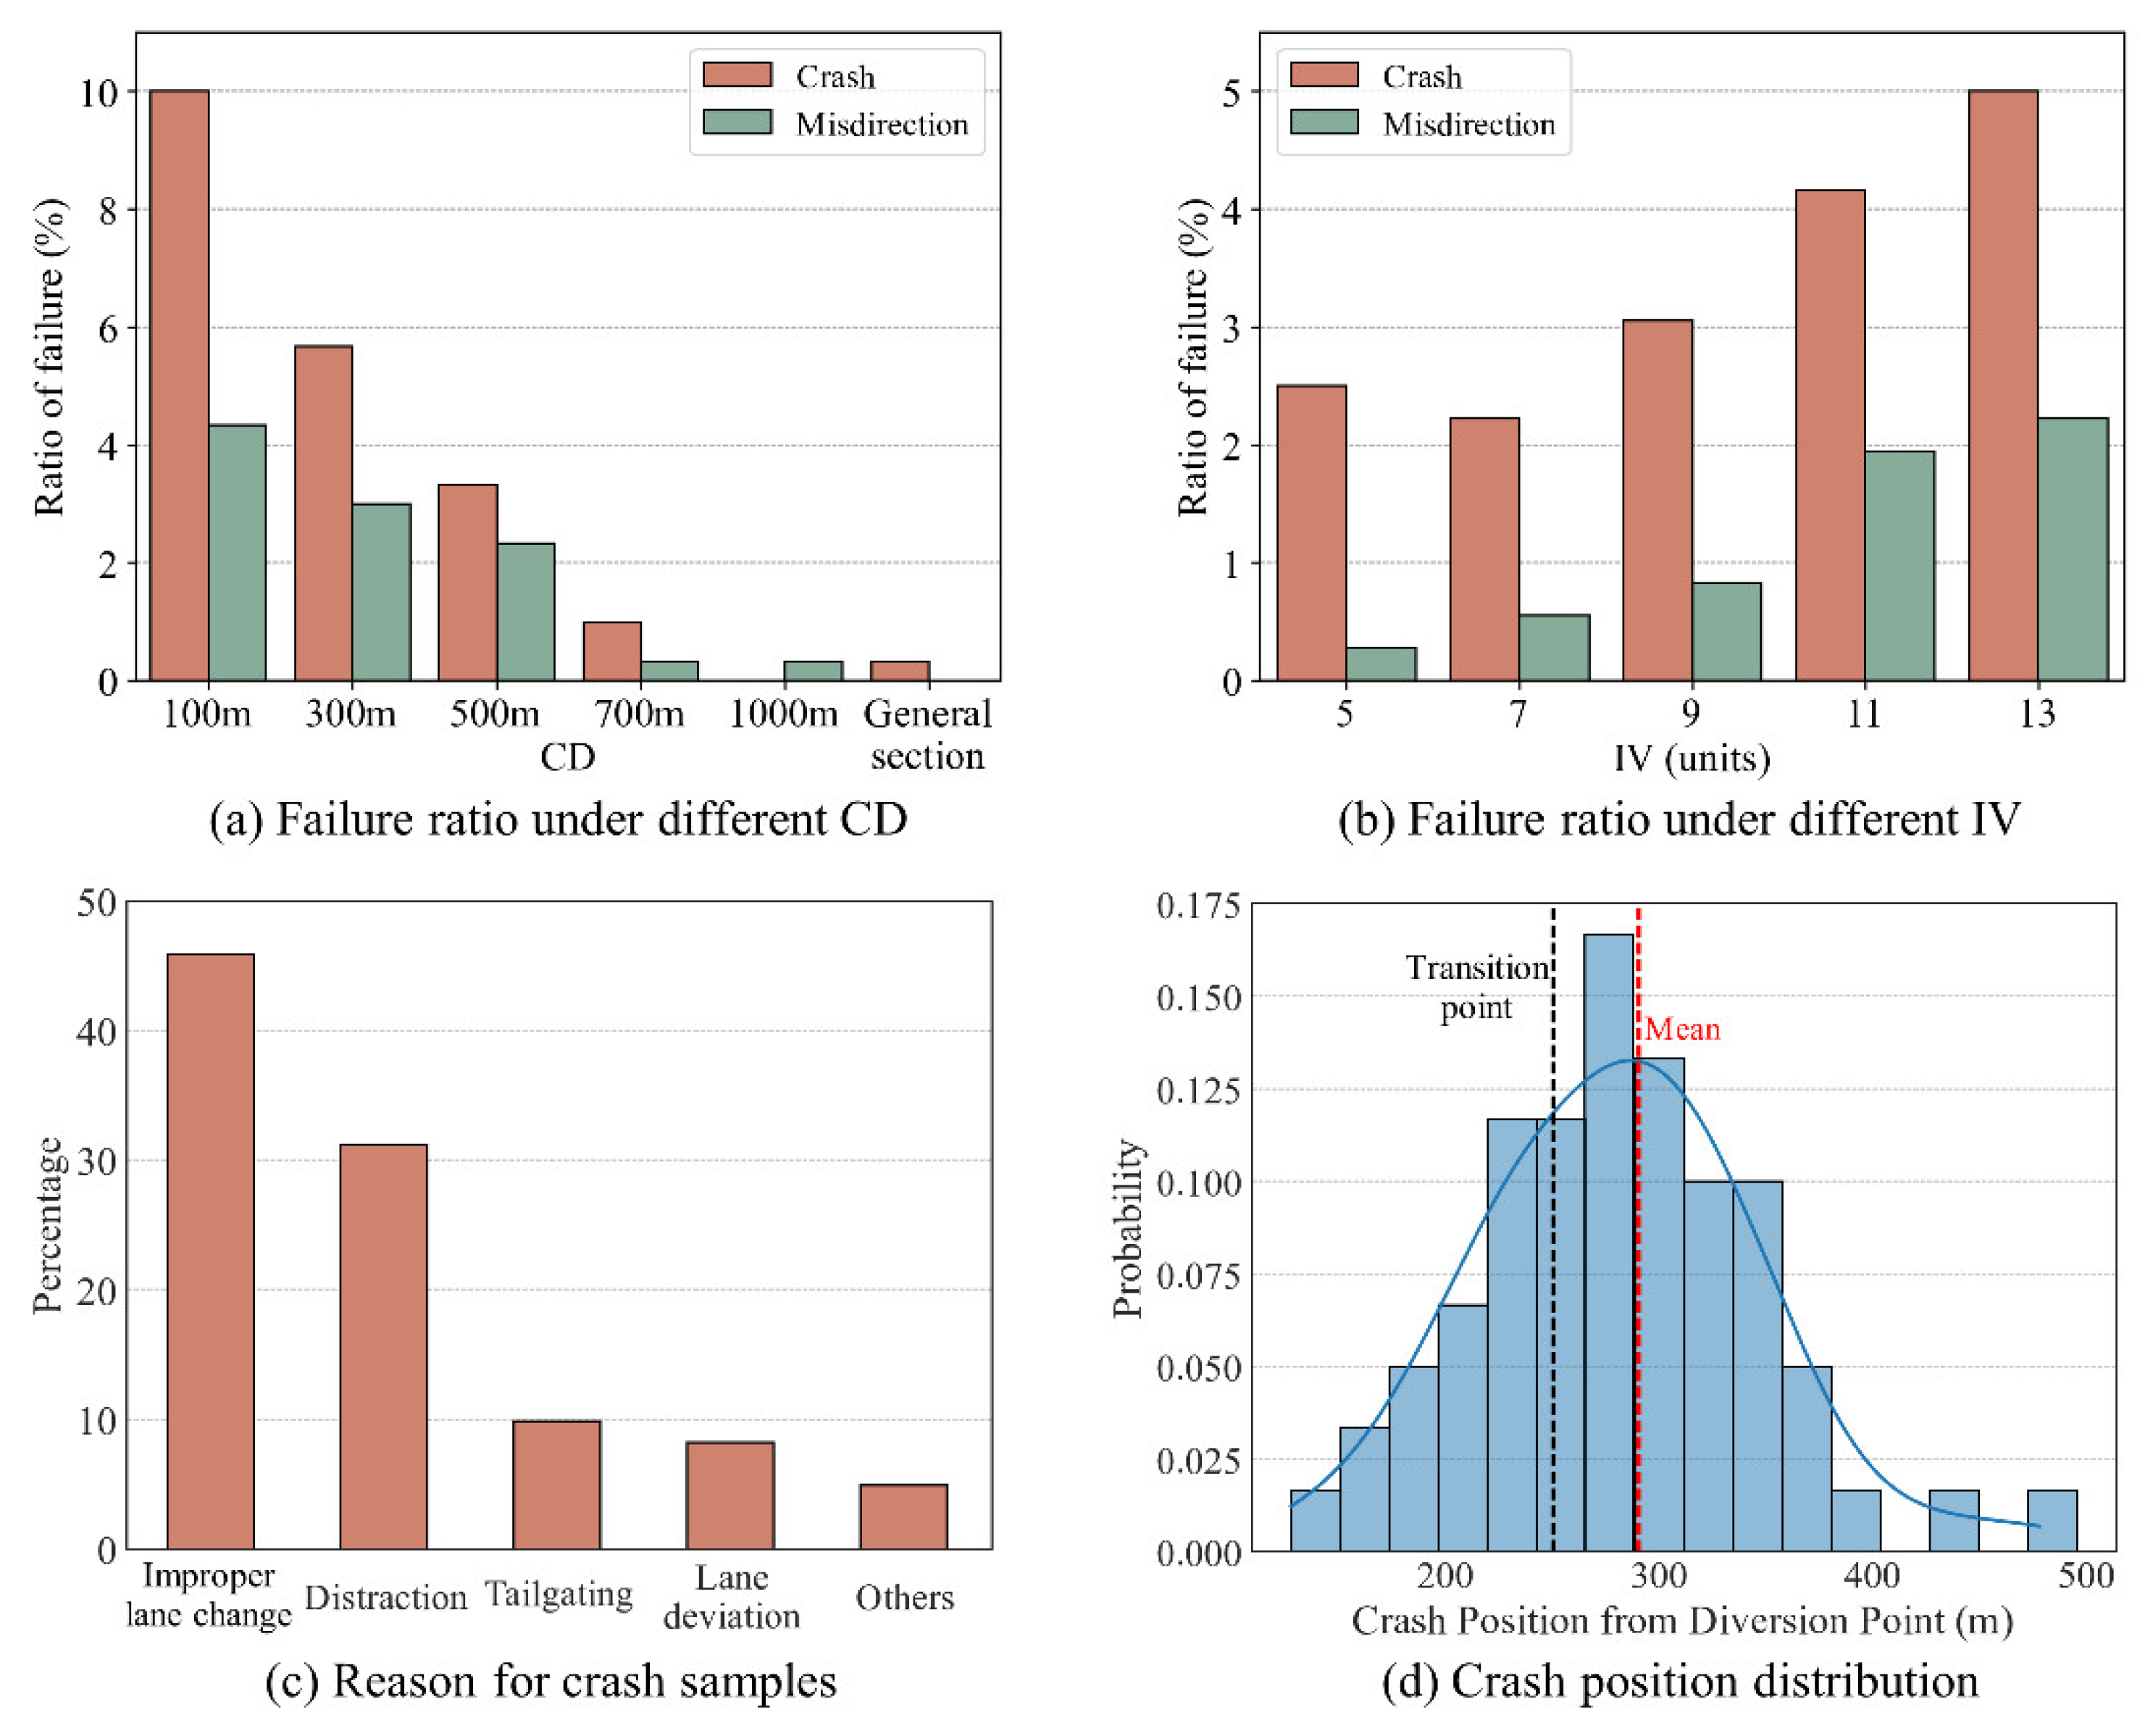

Table 1.
Field survey of tunnel-interchange connecting sections in China.
| Province | Position | Limit speed (km/h) | Tunnel length (m) | Connection distance (m) | Traffic volume (pcu/h) | Information volume of signs (units) |
| Jiangsu | S73-G228 | 70 | 949 | 507 | 420-1120 | 8 |
| Jiangsu | S73-G310 | 70 | 3105 | 89 | 400-1020 | 6 |
| Fujian | S81-S1531 | 80 | 1210 | 104 | 520-1090 | 10 |
| Fujian | S81-S1531 | 80 | 1210 | 464 | 570-1130 | 9 |
| Fujian | G104-S1531 | 80 | 5102 | 234 | 360-720 | 7 |
| Yunnan | G78-G85 | 100 | 1108 | 112 | 540-1240 | 11 |
| Yunnan | G56-S33 | 80 | 1426 | 298 | 480-1207 | 13 |
| Yunnan | S22-G5611 | 100 | 3100 | 310 | 386-870 | 6 |
| Shaanxi | S30-G65 | 80 | 2789 | 306 | 400-860 | 11 |
| Shaanxi | S65-G30 | 80 | 1300 | 667 | 405-934 | 12 |
| Shaanxi | G5-S21 | 80 | 7300 | 791 | 420-875 | 5 |
Table 2.
Information of scenario design.
| |||
| Variables | Attributes | Variables | Attributes |
| CD (m) | 100, 300, 500, 700, 1000 | IV (units) | 6, 9, 12, 15 |
| TL (m) | 1000, 200, 3000 | TC (pcu/h) | 700, 1000, 1300 |
|
|||
| Design speed (km/h) | 100 | Limit speed (km/h) | Mainline 80; ramp: 60 |
| shoulder width (m) | 3.0 | Lane number | Mainline 2; ramp: 1 |
| Ramp transition rate | 1/40 | Lane width (m) | 3.75 |
| Deceleration lane length (m) | 150 | Transition section Length (m) | 100 |
Table 3.
Descriptive statistics.
| Scenario | Variables | Mean | Std. | Variables | Mean | Std. |
| TIS * | V mean (km/h) | 84.98 | 5.44 | MLCD (s) | 4.40 | 1.54 |
| GDS | 89.26 | 4.37 | 5.81 | 1.57 | ||
| TIS | V std (km/h) | 5.05 | 1.03 | MLCL (m) | 92.34 | 26.71 |
| GDS | 4.03 | 0.97 | 124.82 | 33.11 | ||
| TIS | DCC max (m/s2) | -1.02 | 0.27 | MLCA (°) | 16.72 | 4.51 |
| GDS | -0.86 | 0.21 | 13.25 | 3.65 | ||
| TIS | RV (km/h) | 5.35 | 2.95 | DLCD (s) | 4.30 | 1.54 |
| GDS | 3.29 | 1.93 | 4.89 | 1.57 | ||
| TIS | DH (m) | 61.48 | 9.90 | DLCL (m) | 92.34 | 26.71 |
| GDS | 52.61 | 7.40 | 95.88 | 27.79 | ||
| TIS | TH (s) | 2.78 | 0.40 | DLCA (°) | 14.12 | 4.51 |
| GDS | 2.52 | 0.33 | 14.45 | 4.25 | ||
| TIS | Gap (s) | 3.85 | 0.89 | |||
| GDS | 4.36 | 0.87 |
* TIS refers to tunnel - interchange section scenarios; GDS refers to general diversion scenarios.
Table 4.
Correlation analysis.
| CD | IV | TC | TL | Variable | CD | IV | TC | TL | |
| V mean | 0.48* | -0.30 | -0.18 | -0.13 | MLCD | 0.65 | -0.10 | -0.24 | -0.09 |
| RV | -0.28 | 0.31 | 0.10 | 0.09 | MLCL | 0.43 | -0.15 | -0.17 | -0.04 |
| DCC max | 0.29 | -0.38 | 0.16 | -0.09 | MLCA | -0.62 | 0.11 | 0.21 | -0.07 |
| DH min | -0.31 | 0.30 | -0.46 | -0.08 | DLCD | 0.22 | -0.07 | 0.16 | -0.03 |
| TH min | -0.45 | 0.39 | -0.52 | -0.06 | DLCL | 0.15 | -0.13 | 0.14 | -0.05 |
| PMLC | 0.57 | 0.05 | -0.09 | 0.03 | DLCA | -0.15 | 0.10 | 0.05 | -0.04 |
| PDLC | 0.54 | 0.02 | -0.03 | 0.04 | Gap | 0.37 | -0.15 | -0.48 | -0.03 |
*Bold terms indicate that the correlation coefficient is greater than 0.25.
Table 5.
Friedman and MANOVA test for speed and CF indicators.
| Friedman test | MANOVA | |||||||
| CD | IV | TV | CD+IV | |||||
| Chi2 | p-value | Chi2 | p-value | Chi2 | p-value | F | p-value | |
| RV | 16.3 | 0.003 | 14.78 | 0.002 | 3.3 | 0.193 | 1.86 | 0.020 |
| AV SP | 9.76 | 0.045 | 9.58 | 0.022 | 3.18 | 0.203 | 1.75 | 0.033 |
| DH | 9.94 | 0.041 | 12.28 | 0.006 | 10.3 | 0.006 | 1.60 | 0.045 |
| TH | 18.52 | 0.001 | 9.76 | 0.021 | 8.44 | 0.215 | 1.66 | 0.034 |
| DCC max | 16.12 | 0.003 | 8.64 | 0.034 | 6.38 | 0.141 | 2.87 | 0.001 |
Table 6.
Intergroup differences of CF indicators under interaction effect of IV and CD.
| CD | IV1 | IV2 | RV (km/h) | V mean (km/h) | DCC max (m/s2) | DH min (m) | TH min (s) | |||||
| (m) | (units) | Diff. | p | Diff. | p | Diff. | p | Diff. | p | Diff. | p | |
| 100 | 5 | 7 | -2.61* | 0.001 | 1.33 | 0.066 | 0.119 | 0.001 | -0.75 | 0.522 | -0.065 | 0.273 |
| 7 | 9 | -1.37 | 0.001 | 0.97 | 0.182 | 0.135 | 0.001 | -4.66 | 0.001 | -0.099 | 0.096 | |
| 9 | 11 | -1.24 | 0.001 | 1.76 | 0.015 | 0.214 | 0.001 | -2.05 | 0.079 | -0.120 | 0.039 | |
| 11 | 13 | -1.06 | 0.001 | 0.52 | 0.472 | 0.069 | 0.048 | -3.94 | 0.001 | -0.197 | 0.001 | |
| 300 | 5 | 7 | -1.28 | 0.001 | 0.81 | 0.262 | 0.160 | 0.001 | -0.09 | 0.940 | -0.031 | 0.604 |
| 7 | 9 | -1.24 | 0.001 | 0.78 | 0.281 | 0.115 | 0.001 | -2.29 | 0.049 | -0.080 | 0.178 | |
| 9 | 11 | -2.21 | 0.001 | 1.70 | 0.019 | 0.142 | 0.001 | -5.18 | 0.001 | -0.168 | 0.005 | |
| 11 | 13 | -1.81 | 0.001 | 0.73 | 0.311 | 0.098 | 0.005 | -4.18 | 0.001 | -0.188 | 0.001 | |
| 500 | 5 | 7 | -0.44 | 0.103 | 0.09 | 0.710 | 0.142 | 0.001 | 0.26 | 0.824 | 0.002 | 0.970 |
| 7 | 9 | -1.55 | 0.001 | 1.44 | 0.047 | 0.080 | 0.022 | -1.35 | 0.248 | -0.064 | 0.284 | |
| 9 | 11 | -2.37 | 0.001 | 1.69 | 0.019 | 0.101 | 0.004 | -5.31 | 0.001 | -0.128 | 0.031 | |
| 11 | 13 | -1.99 | 0.001 | 1.38 | 0.058 | 0.125 | 0.001 | -2.14 | 0.067 | -0.055 | 0.356 | |
| >700 | 5 | 7 | -0.33 | 0.236 | 0.19 | 0.431 | 0.041 | 0.244 | -0.61 | 0.599 | -0.077 | 0.196 |
| 7 | 9 | -0.51 | 0.062 | 0.81 | 0.262 | 0.054 | 0.118 | -1.32 | 0.212 | -0.019 | 0.751 | |
| 9 | 11 | -2.13 | 0.001 | 0.97 | 0.182 | 0.124 | 0.001 | -4.29 | 0.001 | -0.146 | 0.014 | |
| 11 | 13 | -1.74 | 0.001 | 1.15 | 0.110 | 0.093 | 0.007 | -1.76 | 0.318 | 0.017 | 0.774 | |
* The bold terms indicate that the difference between the groups is significant at the 95% level.
Table 7.
Friedman and MANOVA test for LC indicators.
| Independent variables | Friedman test | MANOVA | ||||||
| CD | IV | TC | CD+TC | |||||
| Chi2 | p | Chi2 | p | Chi2 | p | F | p | |
| MLCD | 22.22 | 0.000 | 8.68 | 0.070 | 7.94 | 0.019 | / | / |
| MLCL | 12.18 | 0.032 | 9.65 | 0.047 | 4.98 | 0.082 | / | / |
| MLCA | 18.88 | 0.002 | 7.18 | 0.127 | 5.76 | 0.056 | 1.613 | 0.097 |
| DLCD | 9.97 | 0.076 | 3.74 | 0.442 | 3.70 | 0.157 | / | / |
| DLCL | 7.29 | 0.200 | 6.94 | 0.139 | 2.58 | 0.225 | 0.895 | 0.537 |
| DLCA | 9.45 | 0.092 | 5.27 | 0.261 | 4.56 | 0.102 | 0.854 | 0.576 |
| PMLC | 13.82 | 0.017 | 5.26 | 0.262 | 5.33 | 0.070 | ||
| PDLC | 11.61 | 0.041 | 1.28 | 0.864 | 3.48 | 0.175 | / | / |
| Gap | 12.39 | 0.030 | 7.51 | 0.111 | 17.20 | 0.000 | 3.303 | 0.001 |
Table 8.
Distribution of PMLC and PDLC.
| PMLC | PDLC | |||||||
| CD | Mean(m) | Distribution | Mean (m) | Distribution | ||||
| >460 m | 460~250 m | <250 m | >150 m | 100~150 m | <100 m | |||
| 100m | 208.11 | / | 16.7% | 83.3% | 99.2 | 1.0% | 49.3% | 49.7% |
| 300m | 273.18 | / | 72.3% | 27.7% | 123.8 | 7.3% | 82.0% | 10.7% |
| 500m | 307.65 | 8.3% | 83.7% | 8.0% | 143.1 | 30.0% | 65.0% | 5.0% |
| 700m | 343.85 | 17.3% | 79.4% | 3.3% | 158.0 | 69.3% | 29.3% | 1.3% |
| 1000m | 356.00 | 32.4% | 65.1% | 2.4% | 158.6 | 70.7% | 22.3% | 7.0% |
| Total | 297.4 | 11.6% | 63.4% | 25.0% | 136.5 | 35.7% | 49.6% | 14.7% |
| GDS | 437.6 | 48.3% | 50.5% | 1.2% | 159.1 | 70.0% | 25.3% | 4.7% |
Table 9.
Dunn’s test for intergroup differences of MLC indicators.
| CD | MLCA (°) | MLCD (s) | MLCL (m) | ||||
| Group 1 | Group 2 | Difference | p-value | Difference | p-value | Difference | p-value |
| 100m | 6.26* | 0.000 | -2.56* | 0.000 | 51.04* | 0.000 | |
| 300m | 5.69* | 0.000 | -2.23* | 0.000 | 43.65* | 0.000 | |
| 1000m | 500m | 4.41* | 0.000 | -1.23* | 0.000 | 27.46* | 0.000 |
| 700m | 0.68 | 0.064 | -0.15 | 0.147 | 4.04 | 0.079 | |
| GDS | -0.30 | 0.805 | 0.17* | 0.047 | -1.31 | 0.570 | |
| 100m | 0.58 | 0.147 | -0.33* | 0.000 | 7.38* | 0.001 | |
| 500m | -1.27* | 0.000 | 1.00* | 0.000 | -16.19* | 0.000 | |
| 300m | 700m | -5.01* | 0.000 | 2.08* | 0.000 | -39.61* | 0.000 |
| 1000m | -5.69* | 0.000 | 2.23* | 0.000 | -43.65* | 0.000 | |
| GDS | -5.98* | 0.000 | 2.40* | 0.000 | -44.96* | 0.000 | |
Table 10.
Intergroup differences of accepted gaps under interaction effect of TC and CD.
| LOS | Type | Gap (s) | LOS | Type | Gap (s) | ||||
| CD1 | CD2 | Diff. | P value | CD1 | CD2 | Diff. | P value | ||
| 1st level | 100m | 300m | -0.101 | 0.315 | 3nd level | 100m | 300m | -0.264 | 0.008 |
| 300m | 500m | -0.044 | 0.661 | 300m | 500m | -0.360 | 0.001 | ||
| 500m | 700m | -0.073 | 0.467 | 500m | 700m | -0.196 | 0.031 | ||
| 700m | 1000m | -0.042 | 0.673 | 700m | 1000m | -0.067 | 0.506 | ||
| 1000m | GDS | -0.144 | 0.100 | 1000m | GDS | -0.075 | 0.453 | ||
| 2nd level | 100m | 300m | -0.234 | 0.020 | |||||
| 300m | 500m | -0.278 | 0.006 | ||||||
| 500m | 700m | -0.157 | 0.048 | ||||||
| 700m | 1000m | -0.096 | 0.338 | ||||||
| 1000m | GDS | -0.107 | 0.286 | ||||||
Table 11.
Threshold values of environmental variables impacting driving behavior.
| Behavior indicators | Threshold for single variable | Threshold of IV under different CDs (units) | ||||||
| CD (m) | IV (units) | 100m | 300m | 500m | 700m | 1000m | GDS | |
| V mean | 500 | 9 | 7 | 9 | 7 | 11 | 11 | 11 |
| RV | 700 | 7 | 7 | 7 | 9 | 9 | 11 | 11 |
| DCC max | 700 | 7 | / | / | / | 7 | 9 | 9 |
| DH min | 700 | 7 | 7 | 7 | 9 | 9 | 9 | 9 |
| TH min | 500 | 9 | 9 | 9 | 9 | 9 | 11 | 11 |
| PMLC | 700 | 7 | 7 | 7 | 7 | 9 | 9 | 9 |
| Failure rate | 500 | 9 | / | |||||
Disclaimer/Publisher’s Note: The statements, opinions and data contained in all publications are solely those of the individual author(s) and contributor(s) and not of MDPI and/or the editor(s). MDPI and/or the editor(s) disclaim responsibility for any injury to people or property resulting from any ideas, methods, instructions or products referred to in the content. |
© 2024 by the authors. Licensee MDPI, Basel, Switzerland. This article is an open access article distributed under the terms and conditions of the Creative Commons Attribution (CC BY) license (http://creativecommons.org/licenses/by/4.0/).
Copyright: This open access article is published under a Creative Commons CC BY 4.0 license, which permit the free download, distribution, and reuse, provided that the author and preprint are cited in any reuse.


