
Submitted:
17 April 2024
Posted:
18 April 2024
You are already at the latest version
Abstract
This paper studies the flexural behavior of the bridge deck link slabs made with the Polyvinyl Alcohol-Strain Hardening Cementitious Composites (PVA-SHCC). Tensile and flexural properties of the PVA-SHCC with four volume fractions, i.e., 0%, 1%, 1.5%, and 2%, were evaluated first. Next, using the similarity theory, composite models with a geometric similarity ratio of 1: 5 were designed to represent the bridge deck with the link slabs. The models considered three materials for link slabs, including concrete, cement mortar and self-compacting PVA-SHCC; and two different curing ages at 7 and 56 days. Bending tests were performed to investigate the flexural behavior of the models. Based on the fractal theory, cracking characteristics of the models with different types of link slabs were compared, and the relationship between Df and the flexural behavior of the models were studied. Numerical models were built to correlate with the results from the bending tests. It is illustrated that the flexural behavior of the self-compacting PVA-SHCC link slab is better than that of concrete and cement mortar link slabs, where the crack initiation and propagation can be postponed.
Keywords:
SHCC
; bridge deck link slabs
; flexural behavior
; self-compacting
; cracking characteristics
; finite element analysis
1. Introduction
Large scale highways and bridges compose the backbone of the transportation system of coastal areas worldwide. When major girders are not continuous, bridge deck link slab system can improve the continuity of bridge to provide more comfortable and safer driving conditions for drivers [1]. However, bridge deck with jointless link slab is usually a weak part of a bridge under long-term vehicle load, which results in cracking of the bridge deck and degradation of the bridge and highway system, especially in offshore bridge where are more Cl− to corrode the reinforcing steel [2,3]. While many structural maintenance and repair methods have been proposed and implemented, the inherent shortfall of concrete brittleness remains a hurdle [4]. Therefore, new types of reinforced materials, such as steel fiber and polypropylene fiber composites, have been used to enhance the durability and ductility of reinforced concrete and eliminate corrosion of reinforcing steel, which can be used for both new and existing constructions [5,6].
One example is the Engineered Cementitious Composites (ECC), a type of High Performance Fiber Reinforced Cementitious Composite (HPFRCC) developed by Li. It is mixed using short fibers and has obvious toughness properties [7]. European scholars name the cementitious composites with strain-hardening properties as Strain-Hardening Cementitious Composites (SHCC) [8,9]. Xu names it as Ultra High Toughness Cementitious Composite (UHTCC) when the fiber volume fraction is less than 2.5% and the ultimate tensile strain is larger than 3% [10,11]. Among different types of fibers, Polyvinyl Alcohol (PVA) fiber is promising because of its low modulus of elasticity, high tensile and ductile properties, and high resistance, which provides a new direction for structural maintenance and repair [12,13,14].
Mechanical properties and durability of PVA-SHCC have been studied. Mechtcherine [15,16,17] tested mechanical properties of PVA-SHCC under uniaxial and cyclic tension, bending and impact loads, discussed the temperature response and time effect of PVA-SHCC, and instituted fuzzy-probabilistic durability concept for PVA-SHCC. Paul [18] concluded that, unlike many other cement-based composites, high level of tensile strain was not associated with large crack width openings of PVA-SHCC. Their results indicated that slight and parallel cracks improved integrity and ductility of reinforced concrete composites. PVA-SHCC was first used for bridge deck link slabs in a transportation infrastructure project in Grove Street Bridge, Michigan, USA in 2005 [19]. By removing the existing expansion joints and replacing a portion of two adjacent decks with a section of ECC material over top the joints, a continuous deck surface was constructed [20,21]. Theoretical and experimental study of PVA-SHCC deck link slabs were also 53 conducted by the same authors. Kim [22] deduced and instituted calculation formula of deformation and internal forces of PVA-SHCC deck link slabs. It was concluded that PVA-SHCC bridge deck link slabs have higher cracking resistance than concrete bridge deck under fatigue load [23,24]. Cracking properties of PVA-SHCC bridge deck link slabs in early age were preliminarily studied by He [25] but more work is needed. The mechanical properties, the durability and the cracking characteristics of PVA-SHCC used in marine structures is widely concerned now [26]. Hou [27] presented an experimental study of the corrosion behavior of reinforced concrete/ultrahigh toughness cementitious composite (RC/UHTCC) beams under simultaneous loading and shrinkage cracking, and of the flexural performance of these beams after corrosion. Fu [28] tested the buckle propagation of SHCC sandwich pipes for oil and gas transportation in ultra-deepwater, the results showed that sandwich pipe with SHCC core had an excellent structural strength under high external pressure. Corrosion resistance of SHCC structures in marine environment was also discussed by experiment and simulation [29,30].
However, because of harsh construction conditions, self-compacting concrete composites are needed due to their high flowability and segregation resistance. Therefore, the PVA-SHCC which has both self-compacting and strain-hardening properties is needed. In this study, a type of self-compacting PVA-SHCC was developed and tested under tensile and bending loads. Six composite models representing bridge decks with three different types of link slabs (concrete, cement mortar and self-compacting PVA-SHCC) at two curing ages (7 and 56 days) were tested under bending loads. Flexural behavior of the composite models was studied based on the results from the test and finite element analysis. Engineering applications of PVA-SHCC developed from this study are provided.
2. Materials and Methods
2.1. Mechanical Properties of PVA-SHCC
2.1.1. Materials
High strength, ductile and durable PVA was used in this study, with mechanical properties shown in Table 1. Four fiber volume fractions (0%, 1%, 1.5% and 2%) were considered. Details of mix proportions are shown in Table 2. By adjusting proportions of fly ash and water reducer, the slump of the mixtures was larger than 550 mm, which indicates that the mixtures were self-compacting [31].
2.1.2. Tensile Properties
24 samples with a dimension of 400×80×10mm3 were constructed. The mixtures were mixed using a concrete mixer, removed from the forms after 24 hours, and cured 28 days in standard conditions, where the relative humidity was larger than 90% and the temperature was 20±3℃. Tensile tests were conducted using an MTS machine, as shown in Figure 1. Stress-strain curves of the PVA-SHCC are shown in Figure 2.
From Figure 2, it can be observed that the mixtures without PVA resulted in brittle failure, where the tensile strength and the ultimate tensile strain are approximately 0.6 MPa and 0.1%, respectively. The mixtures with PVA have obvious strain-hardening characteristics under tensile load, with the ultimate tensile strains of approximately 0.9%, 2.6% and 2.4% when fiber volume fractions are 1.0%, 1.5% and 2.0%, respectively. The ductility ratio can be defined as:
where εu and εy are the ultimate and yielding strains of PVA-SHCC, respectively. The average values of the ultimate tensile stress, the ultimate tensile strain and μ for each mix proportion are listed in Table 3.
μ= εu / εy
Tensile cracks of PVA-SHCC are shown in Figure 3. The mixtures without PVA have only one crack under the ultimate tensile load, while the mixtures with PVA have more obvious parallel slight cracks as fiber volume fractions increase. Based on Table 3, the ultimate tensile strains of the mixtures with fiber volume fractions of 1.0%, 1.5% and 2.0% are 9.6, 27.3 and 25.6 times of the value of the mixture without PVA, respectively. Moreover, μ of these mixtures are 5.9, 12.4, 12.8 times of the value of the mixture without PVA, respectively. The results indicate that the mixture has excellent tensile properties and ductility when the fiber volume fractions are 1.5% and 2.0%. It is noted that μ of the mixture with a fiber volume fraction of 2.0% is only 2.5% greater than that of the mixture with a fiber volume fraction of 1.5%. In addition, the mixture with a fiber volume fraction of 2.0% has negative working performances such as agglomeration and low flowability. Moreover, higher fiber volume fractions introduce higher cost. Therefore, 1.5% is best among all fiber volume fractions under tension load, which need to be verified by bending test.
2.1.3. Flexural Behavior
18 samples with a dimension of 400×100×10mm3 were constructed with different fiber volume fractions (1%, 1.5%, and 2%). Bending test setup and crack patterns of PVA-SHCC are shown in Figure 4. To determine the strain of the tensile surface of samples at the mid-span, strain transducers were attached at point A (Figure 4). Figure 5 shows the stress-strain curves of PVA-SHCC in bending test at point A. Table 4 lists bending properties of PVA-SHCC.
From Table 4, it can be observed that deflections and quantities of cracks increase as fiber volume fraction increases. The multipoint cracking mode is beneficial to enhance the durability and service life of cement-based composites. High toughness behavior is observed when μ of PVA-SHCC is larger than 10, where the sample with a fiber volume fraction of 2.0% has a deflection of 5.3 mm. The bending test results demonstrate that the mixture has excellent properties and ductility when fiber volume fractions are 1.5% and 2.0%, which is similar to the conclusions drawn from the tensile tests. Therefore, No. 3 mix proportion in Table 2 was used in the following composite model test.
2.2. Design of Composite Models
2.2.1. Similarity Design
Composite models were designed to represent the bridge deck and pavement shown in Figure 6 and Figure 7. Based on the Similarity Theory, geometric, physical and boundary condition similarities can be built between the prototype structures and models [32]. Geometric similarities can be defined as:
where Sl, SA, Sw, SI, Sx and Sε are affinity constants of length, area, section modulus, moment of inertia, displacement and normal strain, respectively. Physical similarity can be defined as:
where Sμ, Sγ, Sσ, SE, Sτ and SG are affinity constants of Poisson's ratio, shear strain, normal stress, elastic modulus, shear stress and shear modulus, respectively. Boundary condition similarity can be defined as:
where SP and SM are affinity constants of concentrated load and concentrated moment, respectively. The affinity constant of stiffness has the following definition:
SA = Sl2; Sw = Sl3; SI = Sl4; Sx = Sl·Sε
Sμ = 1; Sε = Sγ = 1; Sσ = SE; Sτ = SG
SP = Sσ·Sl2; SM = Sσ·Sl3·σ
Sk = SE·Sl
The ratio of geometric similarity was determined to be 1: 5. The affinity constants of composite models based on the similarity design are shown in Table 5.
2.2.2. Design of Composite Models
Based on the similarity design, the bridge deck was designed as two 1.2 m span rectangular sections with a dimension of 1200×100×120mm3, where was connected with a link slab [33]. The reinforcement ratio of the models for each span was 1.248%. Commercial concrete (C60) was used, with mix details shown in Table 6. Longitudinal reinforcements were HRB400 (φ16) hot rolled reinforcing steel, with compressive and tensile strengths of 210 and 310 MPa, respectively. Stirrups were HPB335 (φ6) with a spacing of 100 mm (Figure 8). The concrete cover was 30 mm. The thickness of the link slab was 30 mm, which had two HRB400 (φ6) hot rolled rebars in longitudinal direction with a reinforcement ratio of 1.8%. No transverse reinforcement was provided. The joint width between the two spans was 15 mm, as shown in Figure 9.
2.3. Experimental Investigation
2.3.1. Test Setup
The specimens were divided into three series: C, M and S, corresponding to bridge deck link slabs with concrete, cement mortar and PVA-SHCC, respectively. To determine the effect of early curing on the flexural behavior, two curing ages were considered (7 and 56 days). Details of the test conditions are shown in Table 7.
2.3.2. Test Procedures
Bending tests were performed to investigate the flexural behavior of the models [34]. The experimental setup is shown in Figure 9, which ensures proper bonding between the concrete beams and the deck link slab, where zones A and B are no-stirrup bending zones (shown in Figure 8), and zone C is the jointless link slab. Six strain transducers were attached to the side surface of the composite models at each zone to record stain distributions under bending load [34].
3. Results and Discussions
3.1. Load-Deflection Curves
After different curing times, composite models were taken out and bending tests were performed. The relationships between applied loads and average deflections of the two spans in composite models are shown in Figure 10. At the initial stage of bending test, a linear relationship can be observed between the load and deflection. As the bending load increases, longitudinal reinforcements reach the yielding strength and oblique cracks are generated and developed. Ductility, which needs to be carefully considered in the design of concrete structure, is a significant factor that affects the bending capacities of concrete beams [35,36]. Displacement ductility coefficient (μ) is used to evaluate the ductility of the models, which can be defined as:
where Δu and Δy are the ultimate and yielding deflections of models, respectively. The results of μ are listed in Table 8.
μ = Δu/Δy
3.2. Cracking and Ultimate Loads
The ultimate strengths (Pu) and cracking loads (Pcr) of composite models were listed in Table 8. The ultimate capacities of the composite models with a curing time of 56 days (average of C-2, M-2 and S-2) were 19.3% greater than those of the models with a curing time of 7 days (average of C-1, M-1 and S-1). The ultimate capacities of series S were the largest in all series, which demonstrated that the bending capacities of composite models increased when PVA-SHCC was used in bridge deck link slabs. However, the ultimate capacity of S-2 was only 4.8% greater than that of M-2, this was because the amount of reinforcing steel governed the capacity of this system. The aspect of the structural behavior that was more improved with SHCC was the serviceability, such as ductility (as shown in Table 8) and cracking characteristics.
3.3. Cracks and Failure Mode
Cracks in the bending zones (zones A and B) were recorded under various loading levels, as shown in Figure 11. The oblique cracks were observed when longitudinal reinforcements in tensile zone yielded and concrete in the compressive zone crushed almost at the same time, which indicates that the typical failure mode of composite models was balanced-reinforced beam failure. In particular, as for series C and M, a major crack was generated and developed on the top surface of jointless link slab (zone C), but many minor parallel cracks were observed in zone C of series S under the same loading level, which manifests that the link slab was damaged under the ultimate load. The link slabs were debonded from the composite model in M-1, but not in M-2, which indicates that the bond behavior between the link slabs and concrete was weak at the early curing age (7 days) under bending load.
3.4. Cracking Characteristics of Jointless Link Slabs
3.4.1. Descriptions of Cracks
Cracks of the jointless link slabs (zone C) under the same bending load (70kN) were recorded, as shown in Figure 12 and Figure 13. A major crack can be observed for each model. Many minor cracks which are approximately parallel to the major crack can be seen in series S, which is similar to the results from Figure4. However, one or two minor cracks are observed in series C and M and they are not parallel to the major crack.
3.4.2. Width and Depth of Cracks
The width, depth and distance of the cracks in jointless link slabs under the same load were measured and recorded in Figure 14 and Table 9, respectively. Series S had the most cracks, but with the smallest average width and ultimate depth among all series. The ultimate depth of cracks in series S (average of S-1 and S-2) was 15.9% and 2.8% smaller than those in series C and M, respectively. The average width of cracks in series S (average of S-1 and S-2) was 72.6% and 37.0% smaller than those in series C and M, respectively. The cracks of the PVA-SHCC link slabs have the smallest width and depth, highest quantities and parallelism under bending load, which indicates that the cracking property of the jointless link slabs can be improved using PVA-SHCC.
3.4.3. Fractal Characteristics of Cracks
Fractal Theory has been widely used to study fracture energy, cracking mode and porosity of engineering materials over the last two decades due to its high reliability [37]. In this study, box-counting method [38] was used to obtain the distributions of cracks and fractal dimensions of link slabs. The initial side length (r) of the square mesh is 2 mm (L0=2 mm), followed by square meshes with dimensions of 2L0×2L0, 4L0×4L0, 8L0×8L0, 16L0×16L0, etc. The quantities of the meshes which are occupied by the cracks are counted in every size of mesh, and the relationships between the quantities (N) and reciprocal of side length (1/r) can be obtained. Figure 15 shows the relationships between logN and log(1/r). The fractal dimensions can be defined as:
Df = logN/log(1/r)
3.4.4. Relationships between Df and Bending Behavior
The relationships between Df and Pu/μ were shown in Figure 16 and Figure 17, respectively. Pu and μ increased with Df increased, following linear relationships. The relationship between Pu and Df was clearer (R2 was more than 0.9), however the relationship between μ and Df was not clear enough (R2 was less than 0.7) because of the high discreteness of cracking propagation, which need more experimental data to verify. These relationships could introduce a new approach to determine bending behavior of jointless link slabs in bridge decks, which might be used for health monitoring of bridge. Further study is recommended.
3.5. Distribution of Strain
Strain distributions and tensile strains before crack generation in zone C of C-1, M-1 and S-1 at different loading levels were shown in Figure 18 and Table 10, respectively. The cracking strain in zone C of S-1 was 8.963‰, which was 12.5 and 9.6 times of those of C-1 and M-1, respectively. The load at crack initiation of S-1 was 38.34 kN, which was 2.6 and 2.3 times of those of C-1 and M-1, respectively. The results indicate that the PVA-SHCC link slab has the highest crack resistance, the best integrity and the largest bending capacity than those of the concrete and cement mortar link slabs.
4. Finite Element Analysis
4.1. Finite Element Models
The geometry of the Finite Element (FE) model is shown in Figure 19. Materials used in modeling include concrete and PVA-SHCC. A concrete damaged plasticity model is adopted to simulate cracking propagation until the failure of concrete beams. The yield function is:
where α, β and γ are dimensionless material constants; and are effective tensile and compressive cohesion stresses, respectively; is the Mises equivalent effective stress; is the effective hydrostatic pressures; and is strain function which is defined as:
Based on the uniaxial tension and compression tests from this paper and others’ research [39], typical stress-strain curves of PVA-SHCC are shown as dotted lines in Figure 20. To simplify the model, the following assumptions are made: (1) stress-stain relationships of PVA-SHCC in tension and compression can be described as a bilinear curve in Figure 20(left) and a trilinear curve in Figure 20(right), respectively; (2) planes remain plane after deformation.
The tensile stress-strain relationship of PVA-SHCC can be expressed as:
where σtc and σtu are cracking and ultimate tensile strengths, respectively; εtc and εtu are cracking and ultimate tensile strains, respectively. The compressive stress-strain relationship of PVA-SHCC can be expressed as:
where σc0 and σcu are compressive and ultimate compressive strengths, respectively; εc0 and εcu are peak and ultimate compressive strains, respectively. This paper assumes σc0 = 2σcu and εc0 = 2/3εcu. The displacement is applied on the top of bridge deck at the same position with bending test. Mechanical properties of concrete, reinforcing steel and PVA-SHCC are listed in Table 11, where the ultimate tensile stress and strain of PVA-SHCC are based on the test results from the section of mechanical properties of PVA-SHCC.
4.2. Comparisons between the Experimental and Modeling Results
To verify the accuracy of FE model, load-deflection curves of the composite model with PVA-SHCC jointless link slabs from both testing (S-2) and FE model are reported in Figure 21. Like the testing results, the curve from FE modeling can also be divided into two stages. As the bending load increases, longitudinal reinforcements reach the yielding strength, and oblique cracks are generated and developed.
The moment-curvature relationships between the testing and FE model are shown in Figure 22. The curves can be divided into two stages. At the first stage, the moment increases linearly with the curvature before the cracking moment of 14.1 kN·m is reached. Subsequently, the slope of the curve decreases at the second stage. When the tensile fiber strain of link slabs reaches the ultimate tensile strain of PVA-SHCC, the maximum moment is obtained [40]. The ultimate moments from FE model and testing are 126.4 and 113.9 kN·m, respectively, corresponding to curvatures of 10.39×10⁻⁵ and 9.80×10⁻⁵ 1·mm-1. The moment and curvature from the FE model are only 10.9% and 6.0% larger than those from the bending test, which indicates that the FE model is valid and can be used in the following analysis.
4.3. Distributions of Stress and Strain in Beams
In this FE model, the maximum principal plastic strain was used to characterize the cracking trend. Typical distributions of the maximum principal stress and principal plastic strain of concrete beams with PVA-SHCC link slabs are shown in Figure 23 and Figure 24, respectively. Apparent principal plastic strain concentrations can be observed in the tensile zone at the mid-span of the beams. Cracks are generated when the strain reaches the ultimate tensile strain of the concrete. Quantities and lengths of the cracks increase as load increases, and then diagonal cracks appear when longitudinal reinforcements yield. The model finally fails under bending.
4.4. Distributions of Strain in Link Slabs
The maximum principal plastic strain of concrete and PVA-SHCC link slabs in zone C are shown in Figure 25 and Figure 26, respectively. The principal stress and plastic strain of the jointless link slabs under the ultimate bending load are listed in Table 12. As can be seen from Figure 25, the principal plastic strain concentrations are observed when the load reaches 50% of the ultimate bending load, where the tensile strain (6.2×10⁻⁴) is larger than the ultimate tensile strain of the concrete, which indicates that cracks appear in the concrete link slabs. Three cracks are generated when the load reaches the ultimate bending load. From Figure 26, it can be seen that the distributions of strain of PVA-SHCC link slabs are uniform at low loading levels. When the load reaches 75% of the ultimate bending load, slight plastic strain concentrations are observed in PVA-SHCC link slabs with a stain of 0.0182, which is close to the ultimate tensile strain. Finally, PVA-SHCC link slabs fail when the load reaches the ultimate bending load. The results are similar to testing results. It indicates that the crack resistance of PVA-SHCC link slabs is larger than that of concrete link slabs under the bending load. The integrity and serviceability of composite models are improved. Therefore, self-compacting PVA-SHCC in this study can be used as bridge deck link slabs to enhance the bending properties and crack resistance of concrete bridge.
5. Conclusions
In this study, a type of self-compacting PVA-SHCC was developed. Tensile and bending behaviors of self-compacting PVA-SHCC were studied. Six composite models with bridge deck link slabs, which were designed using similarity theory, were constructed and evaluated using bending tests. The bending behavior and cracking characteristics of the link slabs were evaluated. An FE model was developed. The testing and FE results were compared. Based on this study, the following conclusions can be drawn:
(1) The self-compacting PVA-SHCC has high ultimate tensile strain (more than 2%) and ductility ratio (between 15 and 25) under both tensile and bending loads when fiber volume fraction is between 1.5% and 2.0%. It is suitable to be used in both the model tests and structures.
(2) The ultimate bending capacity of Series S (average of S-1 and S-2) with self-compacting PVA-SHCC link slabs is 8.4% and 6.8% greater than those of Series C (average of C-1 and C-2) and Series M (average of M-1 and M-2) at the same curing age. The ductility coefficient of Series S is 27.1% and 8.3% greater than those of Series C and Series M at the same curing age. Cement mortar link slabs debonded from composite models when they were cured for 7 days, while this phenomenon did not happen when they were cured for 56 days.
(3) Cracks of concrete (average of C-1 and C-2) and cement mortar (average of M-1 and M-2) link slabs are 3.65 and 1.59 times wider, and 1.19 and 1.03 times deeper than those of PVA-SHCC link slabs (average of S-1 and S-2) under the ultimate bending load, respectively. The ultimate capacities and displacement ductility coefficients increase as Df increases following a linear relationship. Df of models with PVA-SHCC link slabs (average of S-1 and S-2) is 1.6% and 1.1% larger than that of models with (average of C-1 and C-2) and cement mortar (average of M-1 and M-2) link slabs, respectively.
(4) Based on distributions of the strain and cracking mode of FE models, the integrity of composite models is improved using PVA-SHCC. The moment and curvature of FE models are 10.9% and 6.0% larger than those from test results.
It is noted that only limited number of specimens were tested in this study. Further study is recommended to draw more solid conclusions.
Author Contributions
Methodology, H.L.; software, H.L.; writing—original draft preparation, H.L.; writing—review and editing, H.L. and Y.F.; supervision, Y.F.; funding acquisition, Y.F.; project administration, Y.W. All authors have read and agreed to the published version of the manuscript.
Funding
This research was funded by the National Natural Science Foundation of China, grant number 51578099.
Data Availability Statement
Dataset available on request from the authors.
Conflicts of Interest
The authors declare no conflicts of interest.
References
- Okeil, A.M.; ElSafty, A. Partial continuity in bridge girders with jointless decks. Practice Periodical on Structural Design and Construction 2005, 10, 229–238. [Google Scholar] [CrossRef]
- Val, D.V.; Stewart, M.G.; Melchers, R.E. Life-cycle performance of RC bridges: probabilistic approach. Computer-aided Civil and Infrastructure Engineering 2000, 15, 14–25. [Google Scholar] [CrossRef]
- Kobayashi, K.; Ahn, D.L.; Rokugo, K. Effects of crack properties and water-cement ratio on the chloride proofing performance of cracked SHCC suffering from chloride attack. Cement and Concrete Composites 2016, 69, 18–27. [Google Scholar] [CrossRef]
- Michigan Department of Transportation (MDOT). Bridge preservation timeline. Construction & Technology Division 2003, Michigan Department of Transportation, Lansing.
- Moradi, M.; Valipour, H.; Foster, S.J.; Brad, M.A. Deconstructable steel-fibre reinforced concrete deck slabs with a transverse confining system. Materials & Design 2016, 89, 1007–1019. [Google Scholar]
- Lin, Y.Z.; Yan, J.C.; Wang, Z.F.; Zou, C.Y. Effects of steel fibers on failure mechanism of S-UHPC composite beams applied in the Arctic offshore structure. Ocean Engineering 2021, 234, 109302. [Google Scholar] [CrossRef]
- Li, V.C.; Leung, C.K.Y. Theory of steady state and multiple cracking of random discontinuous fiber reinforced brittle matrix composites. Journal of Engineering Mechanics 1992, 118, 2246–2264. [Google Scholar] [CrossRef]
- Kanda, T.; Li, V.C. New micro-mechanics design theory for pseudo strain hardening cementitious composite. Journal of Engineering Mechanics (ASCE) 1999, 125, 373–381. [Google Scholar] [CrossRef]
- Li, Z.Y.; Lu, B.; Feng, J.H.; Zhao, H.Y.; Qian, S.Z. Development of Engineered Cementitious Composites/Strain-hardening Cementitious Composites (ECC/SHCC) with waste granite fine powders. Construction and Building Materials 2023, 409, 133883. [Google Scholar] [CrossRef]
- Xu, S.L.; Wan, N.; Li, Q.H. Experimental study on the flexural performance of concrete beam strengthened with ultra high toughness cementitious composites. China Civil Engineering Journal 2010, 43, 17–22. [Google Scholar]
- Xu, S.L.; Xie, H.W.; Li, Q.H.; Hong, C.K.; Liu, J.W.; Wang, Q.M. Bending performance of RC slabs strengthened by CFRP sheets using sprayed UHTCC as bonding layer: Experimental study and theoretical analysis. Engineering Structures 2023, 292, 116575. [Google Scholar] [CrossRef]
- Yang, E.H.; Garcez, E.O.; Li, V.C. Micromechanics-based optimization of pigmentable strain-hardening cementitious composites. Journal of Materials in Civil Engineering (ASCE) 2014, 26, 1–6. [Google Scholar] [CrossRef]
- Pan, Z.F.; Wu, C.; Liu, J.Z. Study on mechanical properties of cost-effective polyvinyl alcohol engineered cementitious composites (PVA-ECC). Construction and Building Materials 2015, 78, 397–404. [Google Scholar] [CrossRef]
- Pan, Z.F.; Qiao, Z.; Si, D.D.; Shang, J.Q. Experimental investigation and numerical simulation on uniaxial tensile behavior of hybrid PVA-ECC. Construction and Building Materials 2023, 398, 132517. [Google Scholar] [CrossRef]
- Jun, P.; Mechtcherine, V. Behaviour of strain-hardening cement-based composites (SHCC) under monotonic and cyclic tensile loading: part I-experimental investigations. Cement and Concrete Composites 2010, 32, 801–809. [Google Scholar] [CrossRef]
- Mechtcherine, V.; Millon, O.; Butler, M.; Thoma, K. Mechanical behaviour of strain-hardening cement-based composites under impact loading. Cement and Concrete Composites 2011, 33, 1–11. [Google Scholar] [CrossRef]
- Altmann, F.; Sickert, J.U.; Mechtcherine, V.; Kaliske, M. A fuzzy-probabilistic durability concept for strain-hardening cement-based composites (SHCC) exposed to chlorides: part II-Application example. Cement and Concrete Composites 2012, 34, 763–770. [Google Scholar] [CrossRef]
- Paul, S.C.; Pirskawetz, S.; Zijl, G.P.A.G.van.; Schmidt, W. Acoustic emission for characterising the crack propagation in strain-hardening cement-based composites (SHCC). Cement and Concrete Research 2015, 69, 19–24. [Google Scholar] [CrossRef]
- Lepech, M.; Li, V.C. Design and field demonstration of ECC link slabs for jointless bridge decks. Proceedings of CONMAT-5 2005.
- Lepech, M.; Li, V.C. Application of ECC for bridge deck link slabs. Materials and Structures 2009, 42, 1185–1195. [Google Scholar] [CrossRef]
- Hisseine, O.A.; Tagnit-Hamou, A. Shear-bond behavior of nanocellulose-modified SHCC composite slabs: Translating material-level capacity into improved structural performance. Engineering Structures 2023, 291, 116394. [Google Scholar] [CrossRef]
- Kim, Y.Y.; Fischer, G.; Li, V.C. Performance of bridge deck link slabs designed with ductile ECC. Structural Journal (ACI) 2004, 101, 792–801. [Google Scholar]
- Qian, S.; Zhou, J.; Rooij, M.R.de.; Schlangen, E.; Ye, G.; Breugel, K.van. Self-healing behavior of strain-hardening cementitious composites incorporating local waste materials. Cement and Concrete Composites 2009, 31, 613–621. [Google Scholar] [CrossRef]
- Paul, S.C.; Pirskawetz, S.; Zijl, G.P.A.G.van; Schmidt, W. Acoustic emission for characterising the crack propagation in strain-hardening cement-based composites (SHCC). Cement and Concrete Research 2015, 69, 19–24. [Google Scholar] [CrossRef]
- He, S.; Mustafa, S.; Chang, Z.; Liang, M.F.; Schlangen, E.; Lukovi´c, M. Ultra-thin Strain Hardening Cementitious Composite (SHCC) layer in reinforced concrete cover zone for crack width control. Engineering Structures 2023, 292, 116584. [Google Scholar] [CrossRef]
- Huang, B.T.; Yu, J.; Wu, J.Q.; Dai, J.G.; Leung, C.K.Y. Seawater sea-sand Engineered Cementitious Composites (SS-ECC) for marine and coastal applications. Composites Communications 2020, 20, 100353. [Google Scholar] [CrossRef]
- Hou, L.J.; Zhou, B.X.; Guo, S.; Aslani, F.; Chen, D. Corrosion behavior and flexural performance of reinforced concrete/ultrahigh toughness cementitious composite (RC/UHTCC) beams under sustained loading and shrinkage cracking. Construction and Building Materials 2019, 198, 278–287. [Google Scholar] [CrossRef]
- Fu, G.M.; Estefen, S.F.; Lourenço, M.I.; Yang, J.K.; Paz, C.M.; Duan, M.L. Buckle propagation of damaged SHCC sandwich pipes: Experimental tests and numerical simulation. Marine Structures 2021, 77, 102976. [Google Scholar] [CrossRef]
- Zhang, C.C.; Guan, X.C.; Tian, J.L.; Li, Y.Z.; Lyu, J.J. Corrosion resistance of RC/UHTCC beams with various healing promoters in marine environment. Cement and Concrete Composites 2022, 131, 104604. [Google Scholar] [CrossRef]
- Zhang, Z.Y.; Wu, X.H.; Sun, Q.; Tian, P.G.; Hu, G.X. Compressive behavior of corroded reinforced concrete columns strengthened with BFRP reinforced ECC in marine environment. Ocean Engineering 2023, 279, 114533. [Google Scholar] [CrossRef]
- ACI Committee 237. 237R-07. Self-Consolidating Concrete 2007.
- Kim, N.S.; Lee, J.H.; Chang, S.P. Equivalent multi-phase similitude law for pseudodynamic test on small scale reinforced concrete models. Engineering Structures 2009, 31, 834–846. [Google Scholar] [CrossRef]
- ACI Committee 343. 343R-95. Analysis and Design of Reinforced Concrete Bridge Structures 1995.
- ACI Committee 437. 437.2-13. Code requirements for load testing of existing concrete structures and commentary 2013.
- Fantilli, A.P.; Chiaia, B.; Gorino, A. Fiber volume fraction and ductility index of concrete beams. Cement and Concrete Composites 2016, 65, 139–149. [Google Scholar] [CrossRef]
- Yoo, D.Y.; Banthia, N. High-performance strain-hardening cementitious composites with tensile strain capacity exceeding 4%: A review. Cement and Concrete Composites 2022, 125, 104325. [Google Scholar] [CrossRef]
- Erdem, S.; Blankson, M.A. Fractal-fracture analysis and characterization of impact-fractured surfaces in different types of concrete using digital image analysis and 3D nano-map laser profilometery. Construction and Building Materials 2013, 40, 70–76. [Google Scholar] [CrossRef]
- Guo, P.W.; Meng, X.J.; Meng, W.N.; Bao, Y. Monitoring and automatic characterization of cracks in strain-hardening cementitious composite (SHCC) through intelligent interpretation of photos. Composites Part B 2022, 242, 110096. [Google Scholar] [CrossRef]
- Zhang, J.; Wang, Z.B.; Ju, X.C.; Shi, Z.J. Simulation of flexural performance of layered ECC-concrete composite beam with fracture mechanics model. Engineering Fracture Mechanics 2014, 131, 419–438. [Google Scholar] [CrossRef]
- Qin, S.Q.; Zhang, J.B.; Huang, C.L.; Gao, L.Q.; Bao, Y. Fatigue performance evaluation of steel-UHPC composite orthotropic deck in a long-span cable-stayed bridge under in-service traffic. Engineering Structures 2022, 254, 113875. [Google Scholar] [CrossRef]
Figure 1.
Tensile test.
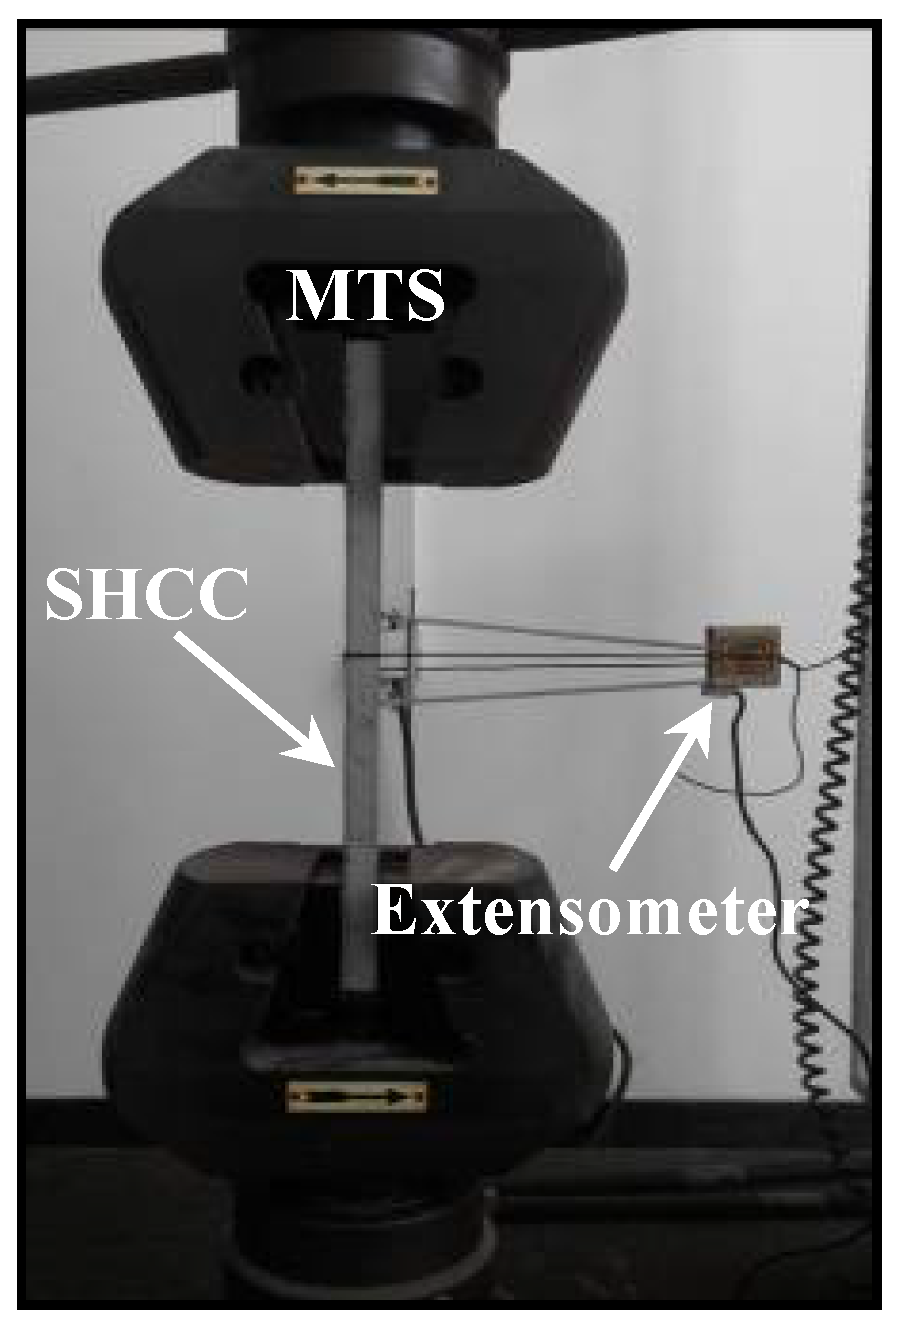
Figure 2.
Tensile Stress-strain curves of PVA-SHCC in tensile test (fiber volume fractions: 0%, 1%, 1.5% and 2%).
Figure 2.
Tensile Stress-strain curves of PVA-SHCC in tensile test (fiber volume fractions: 0%, 1%, 1.5% and 2%).
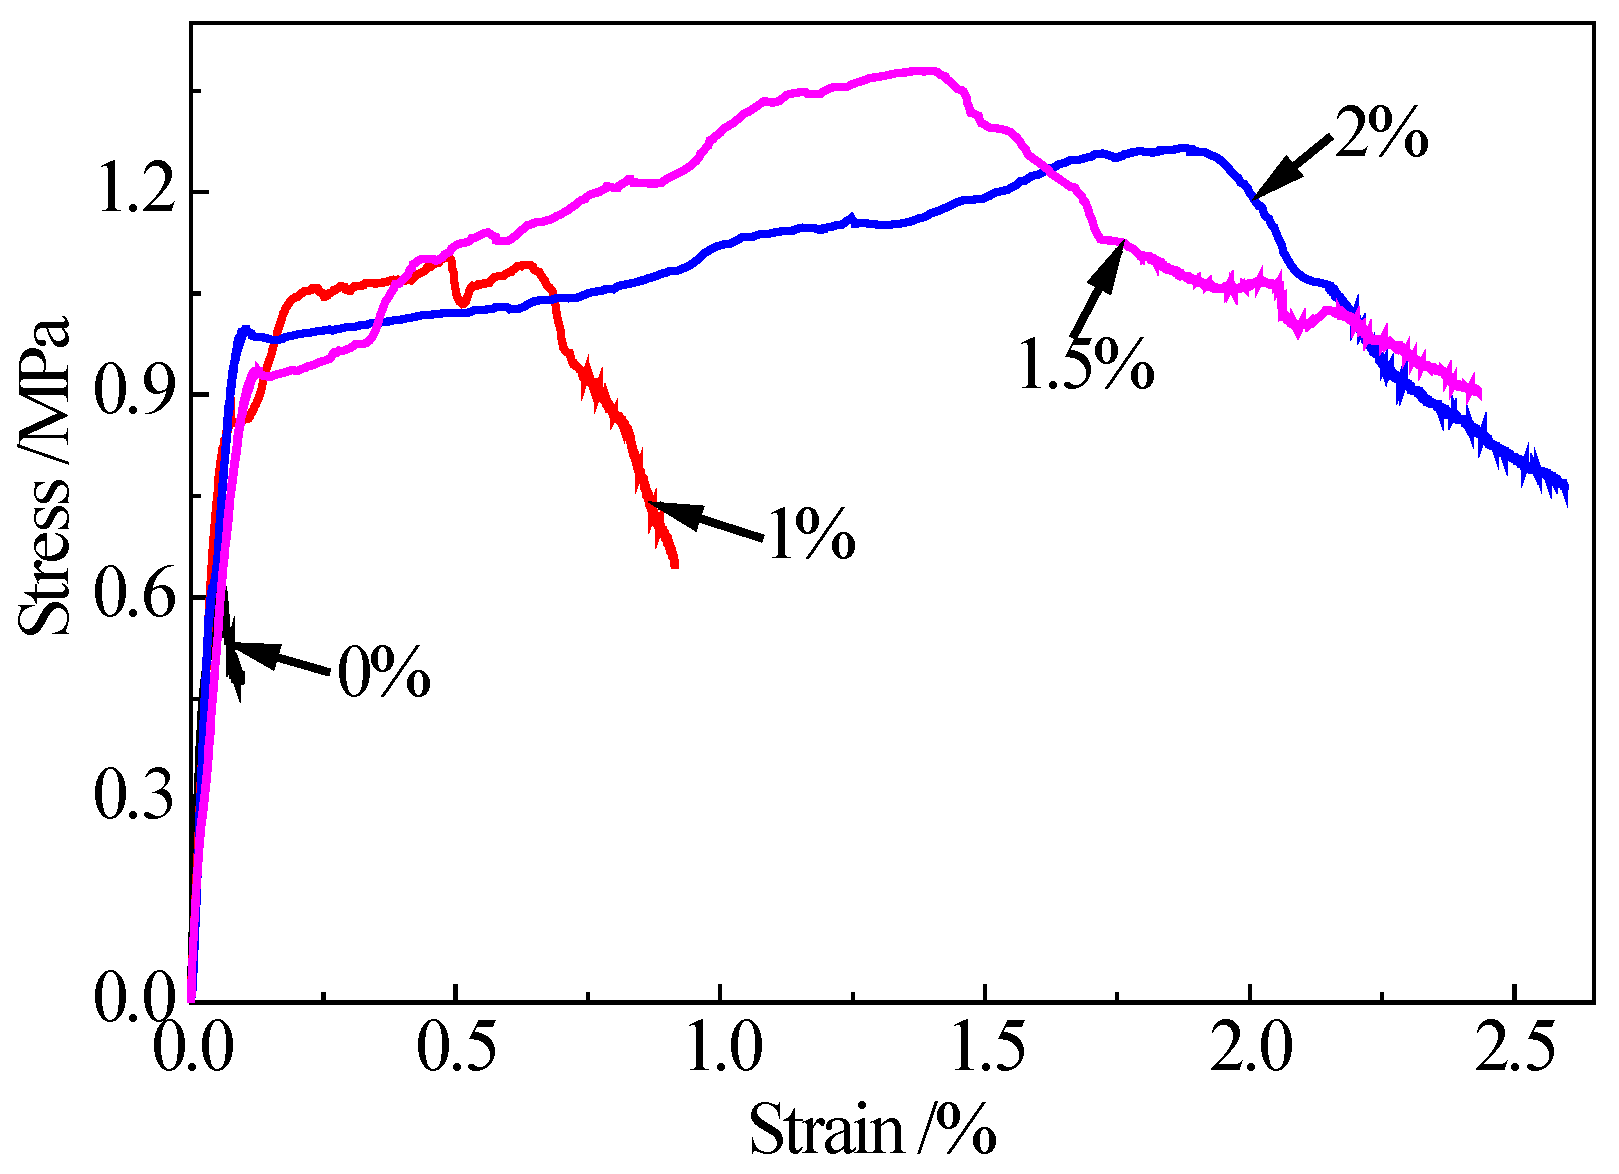
Figure 3.
Tensile cracks of PVA-SHCC (fiber volume fractions: 0%,1%、1.5%、2.0%).
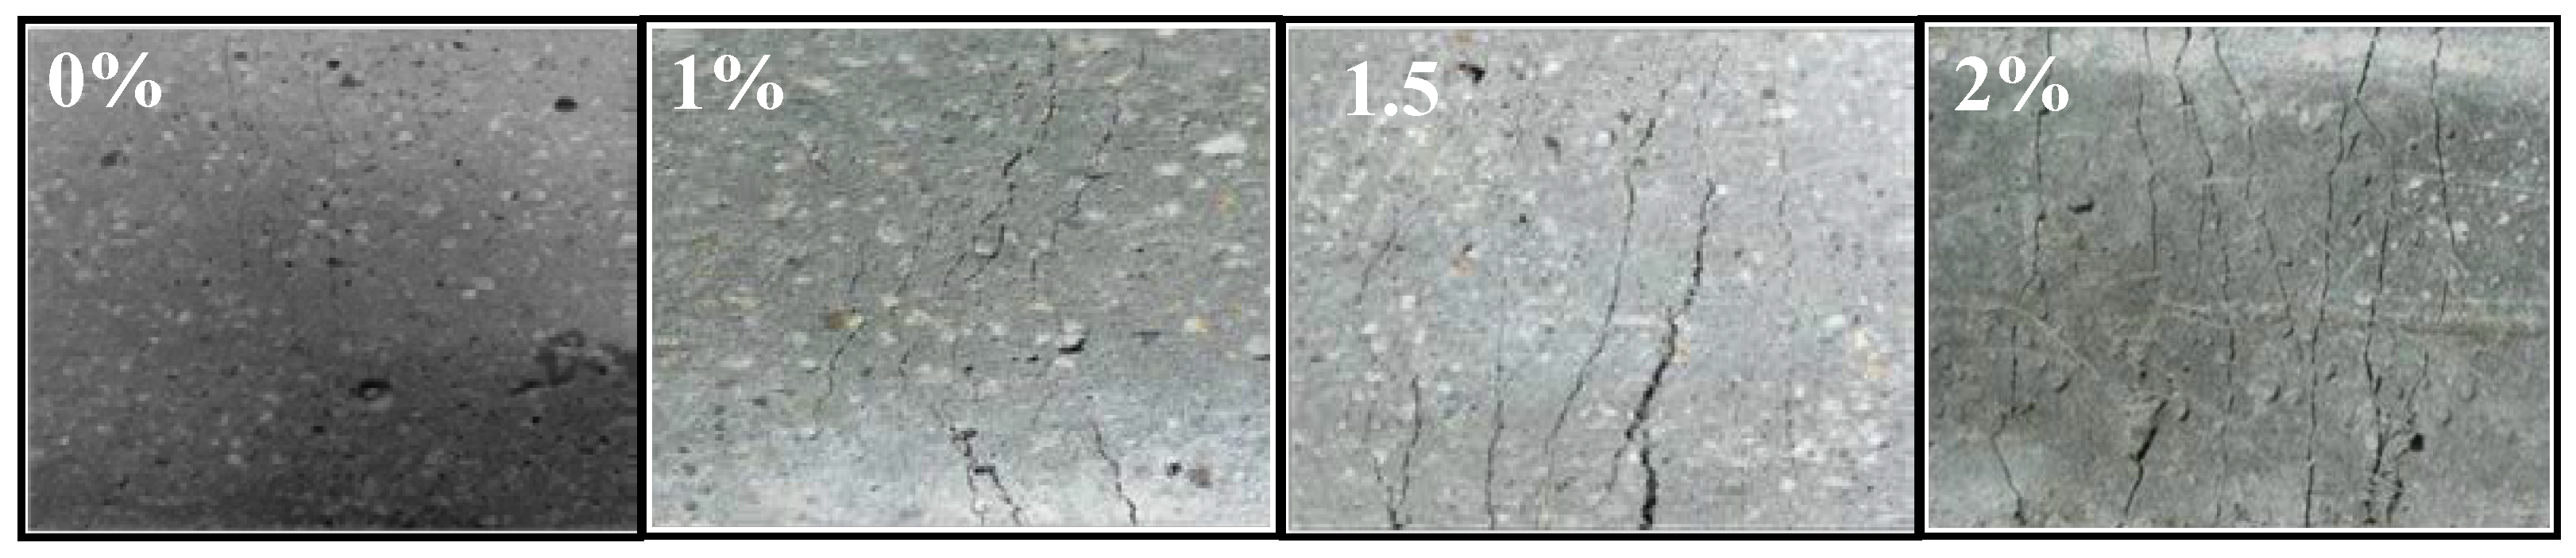
Figure 4.
Bending test setup and crack patterns of PVA-SHCC.
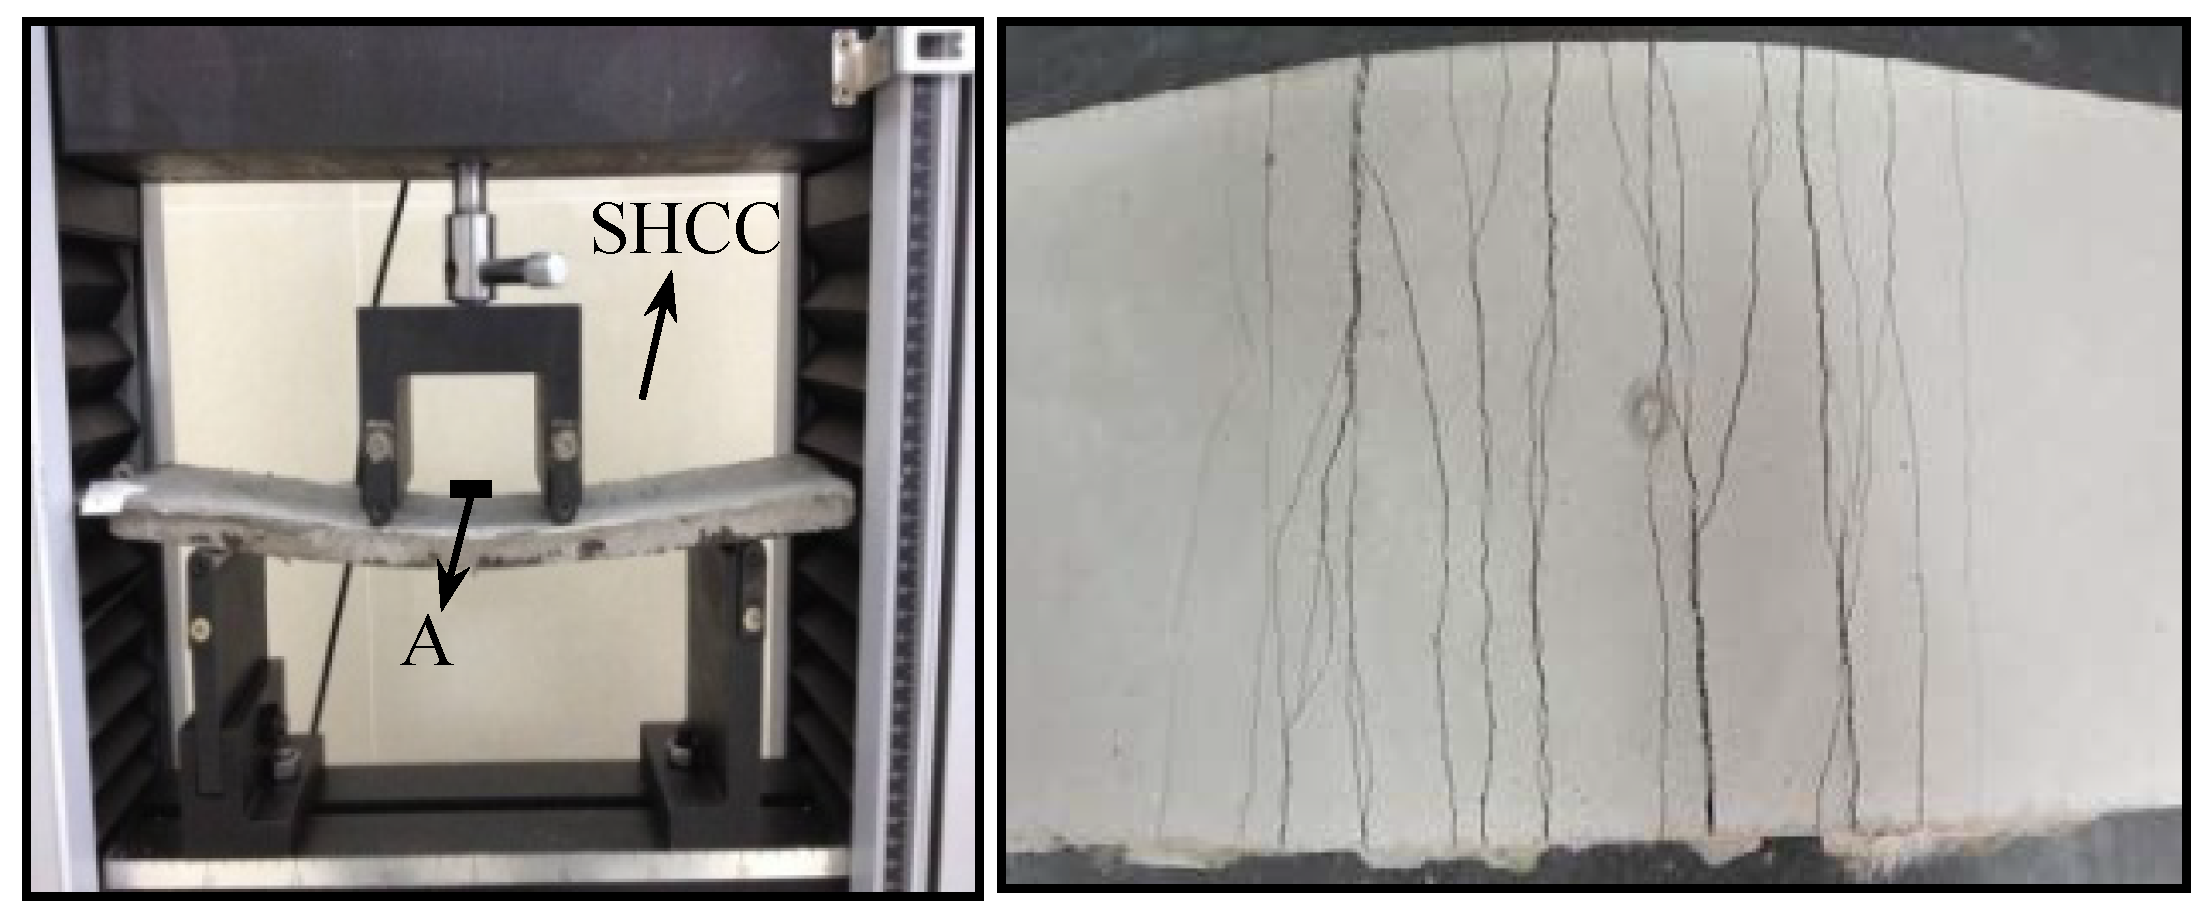
Figure 5.
Stress-strain curves of PVA-SHCC in bending test (fiber volume fractions: 0%, 1.5% and 2.0%).
Figure 5.
Stress-strain curves of PVA-SHCC in bending test (fiber volume fractions: 0%, 1.5% and 2.0%).
Figure 6.
Cross section of bridge deck (unit: mm).
Figure 7.
Cross section of pavement (unit: mm).
Figure 8.
Concrete beams in one span (unit: mm).
Figure 9.
Models and loading setup (unit: mm). 1.displacement meter; 2.spreader beam; 3.hydraulic jack; 4.stain gauge; 5.data acquisition system; 6.computer; 7.link slab.
Figure 9.
Models and loading setup (unit: mm). 1.displacement meter; 2.spreader beam; 3.hydraulic jack; 4.stain gauge; 5.data acquisition system; 6.computer; 7.link slab.
Figure 10.
Load-deflection curves of composite models
Figure 11.
Cracks of zones A and B
Figure 12.
Cracks in jointless link slabs (zone C).
Figure 13.
Descriptions of cracks in jointless link slabs (zone C).
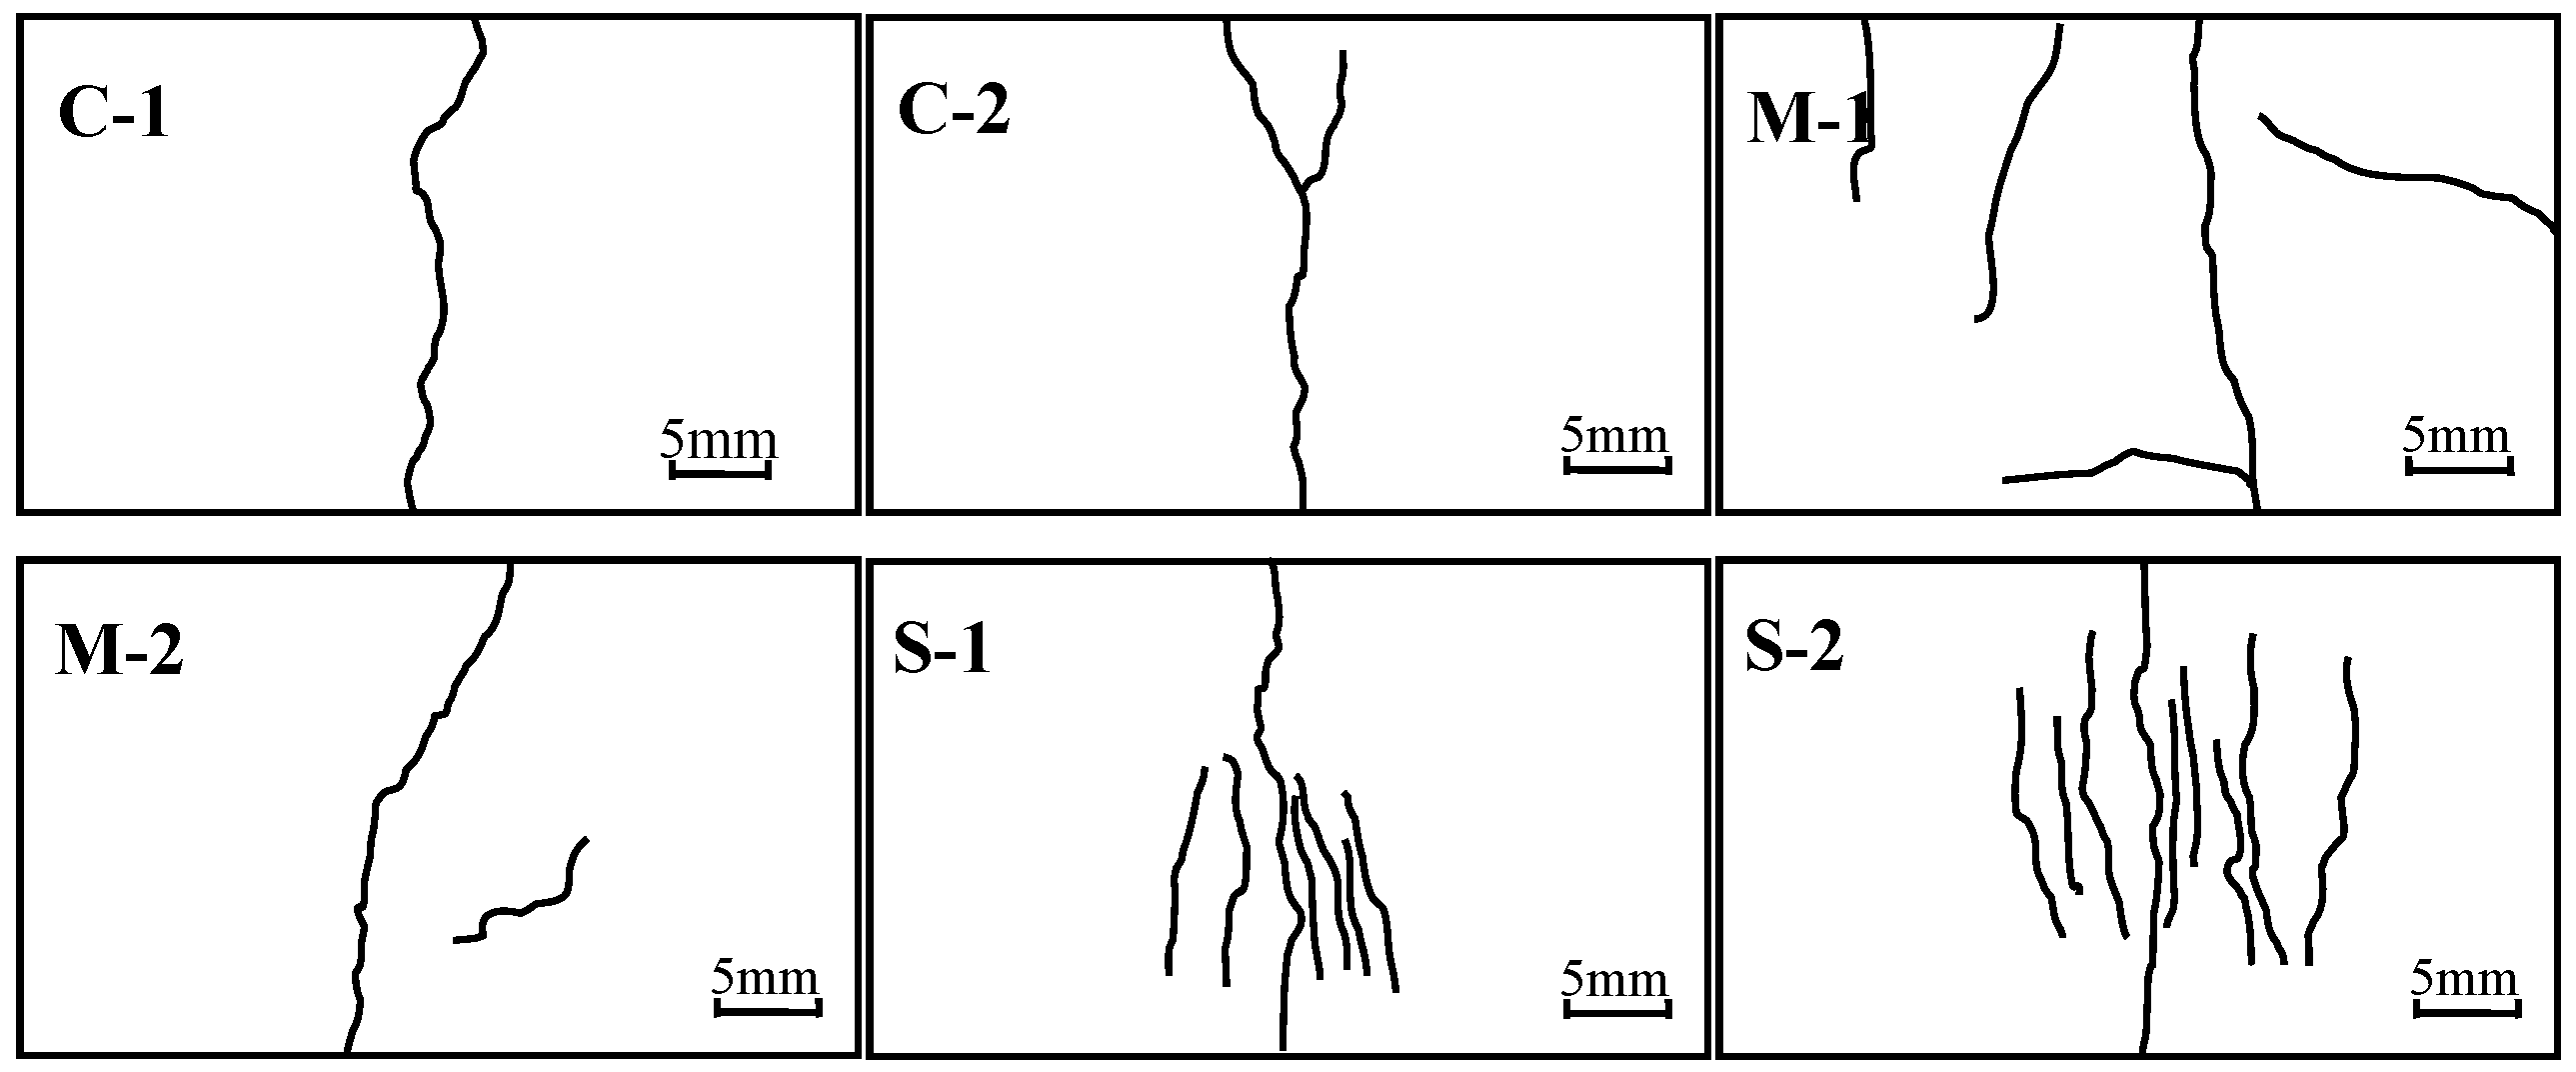
Figure 14.
Identification of cracks in link slabs (zone C).
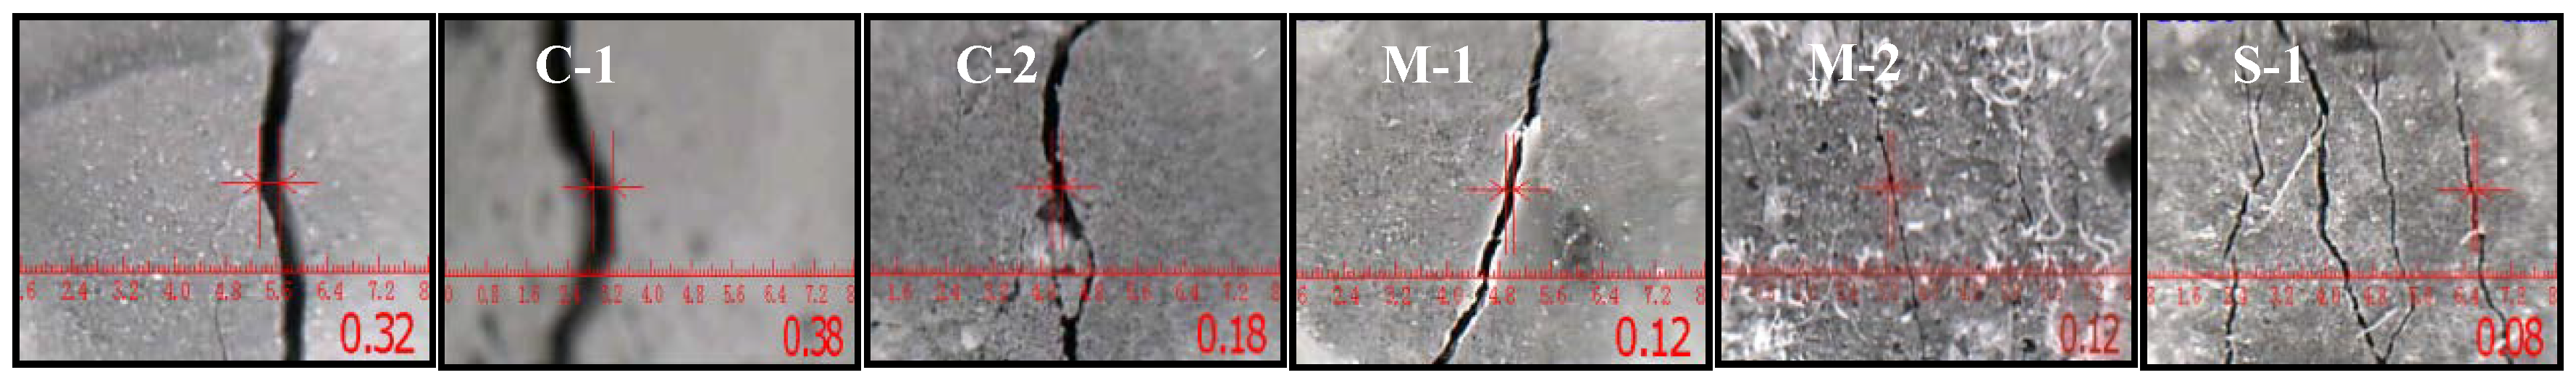
Figure 15.
Relationships between logN and log(1/r).
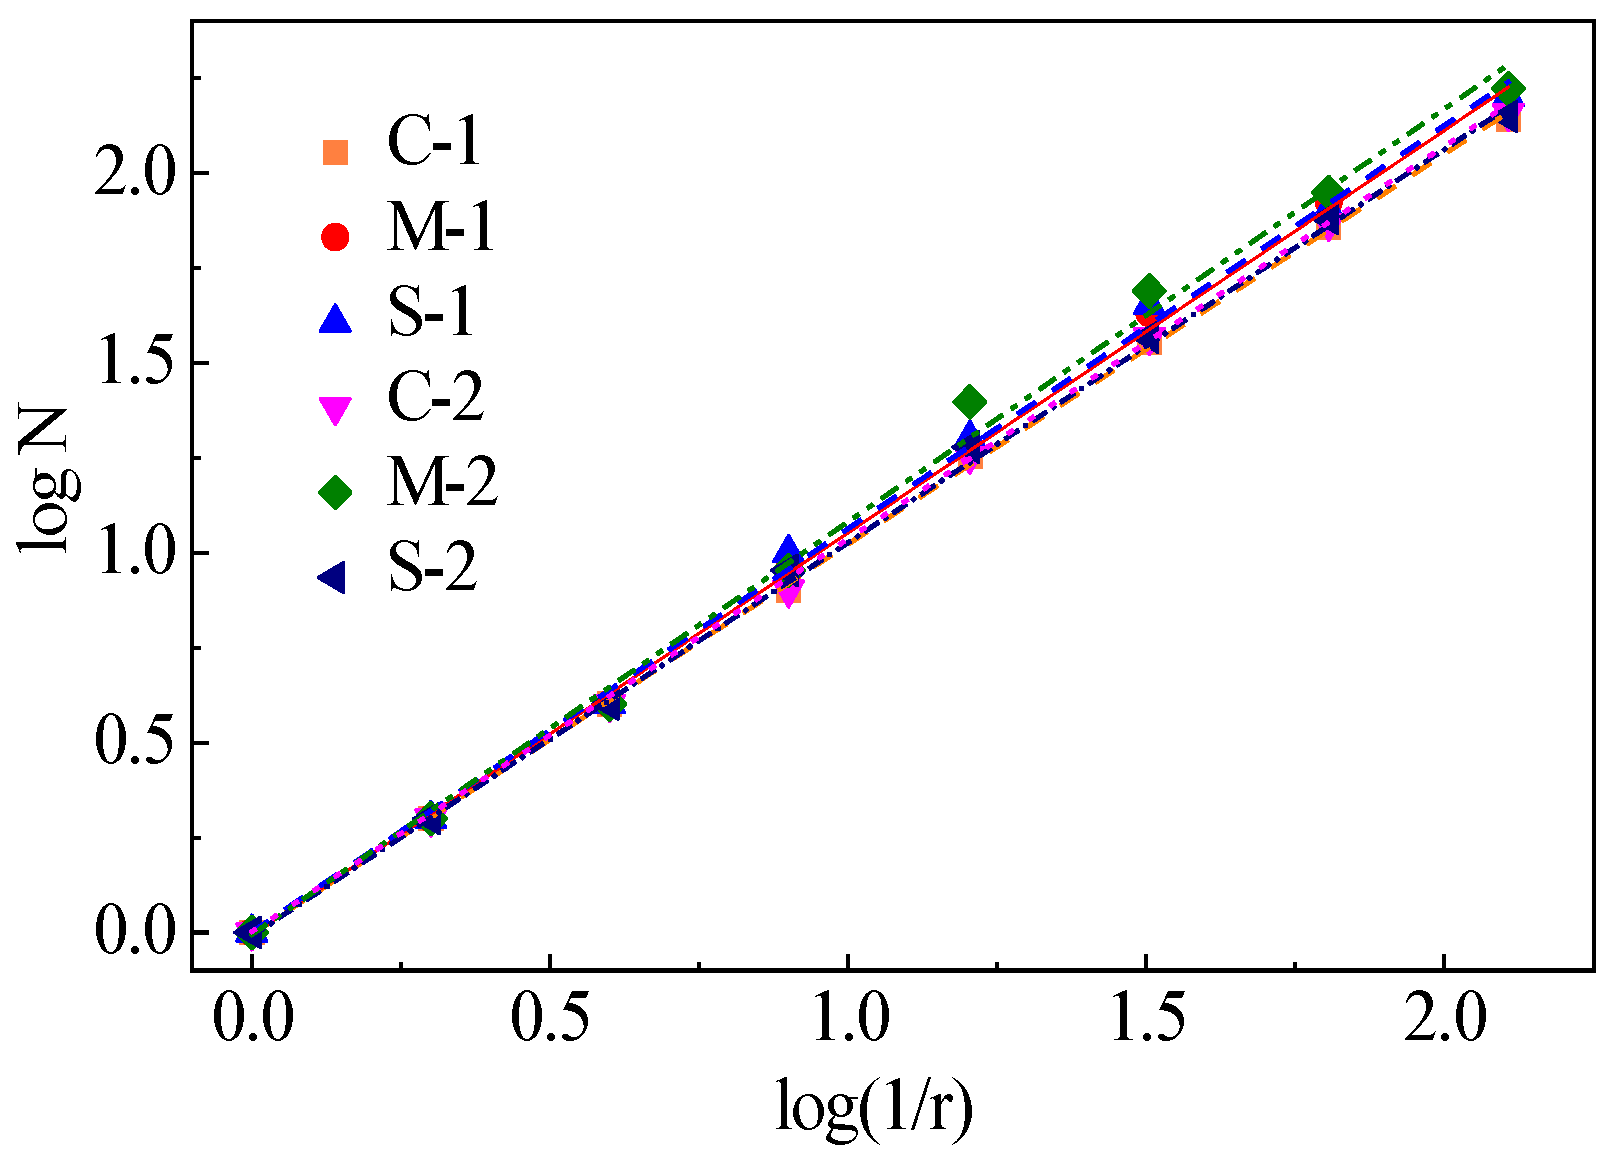
Figure 16.
Relationship between Df and Pu.
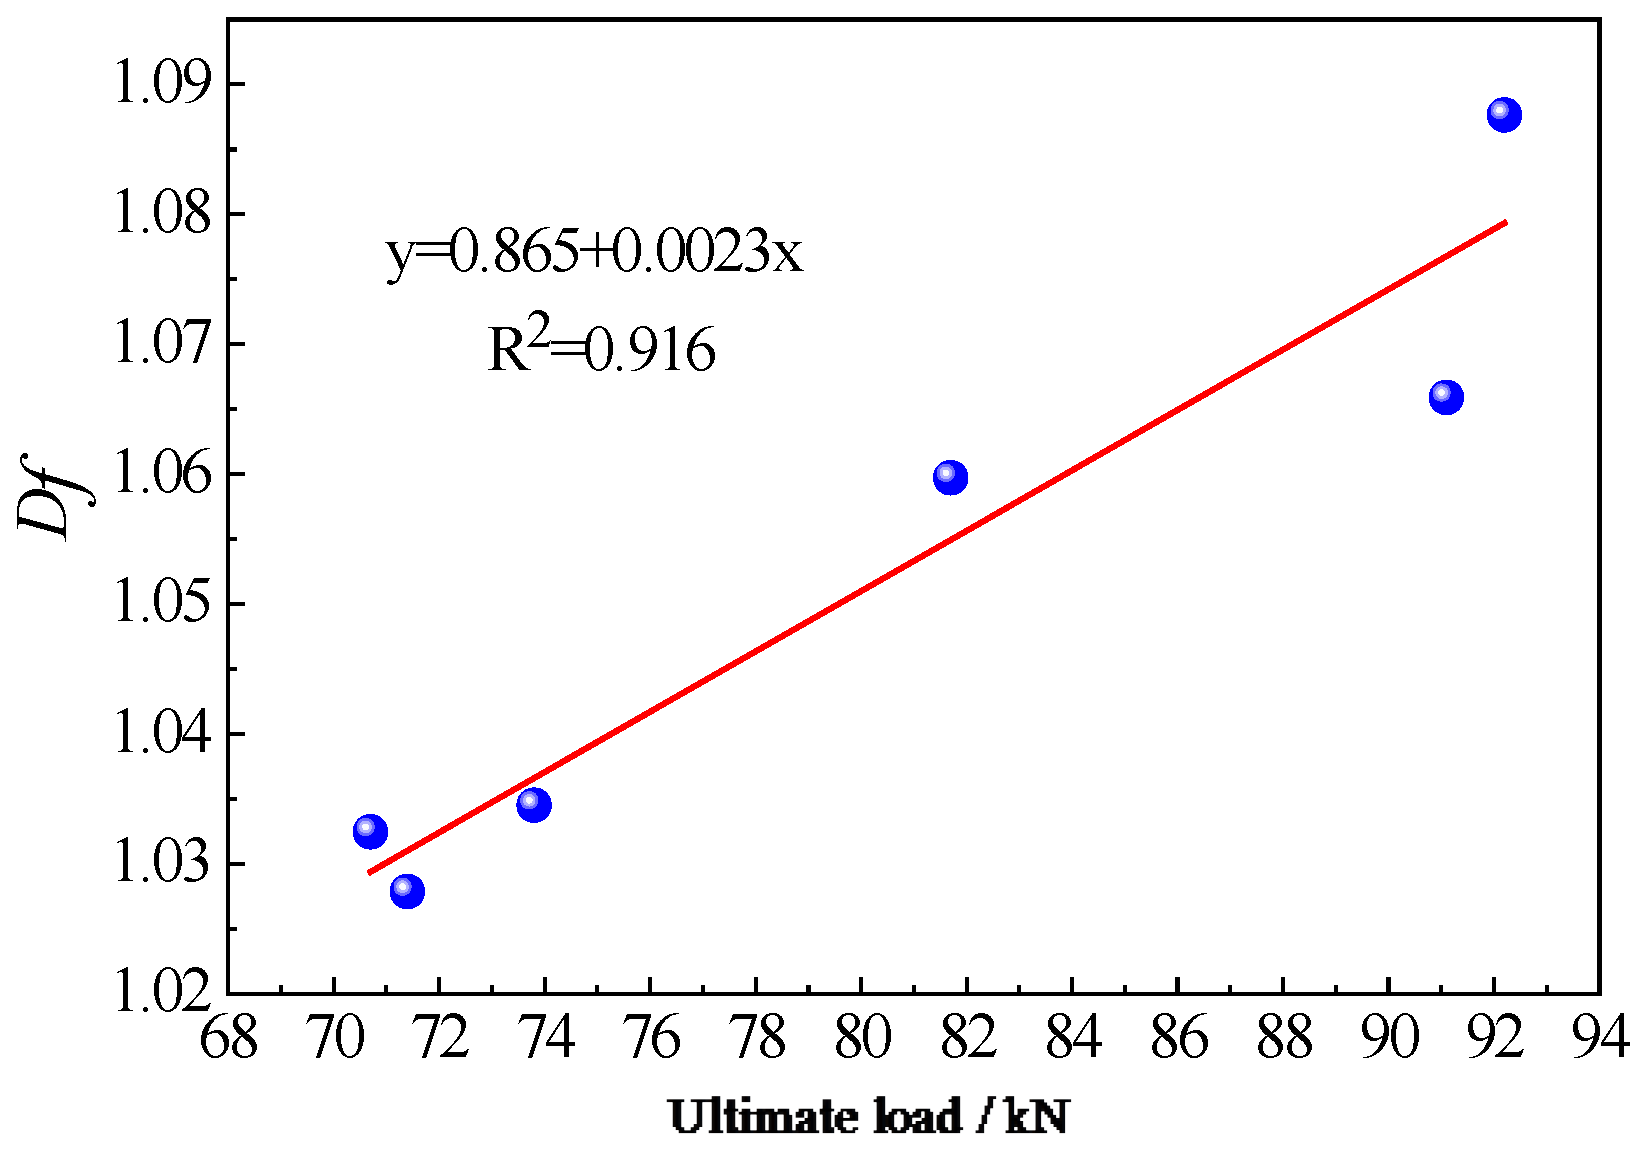
Figure 17.
Relationship between Df and μ.
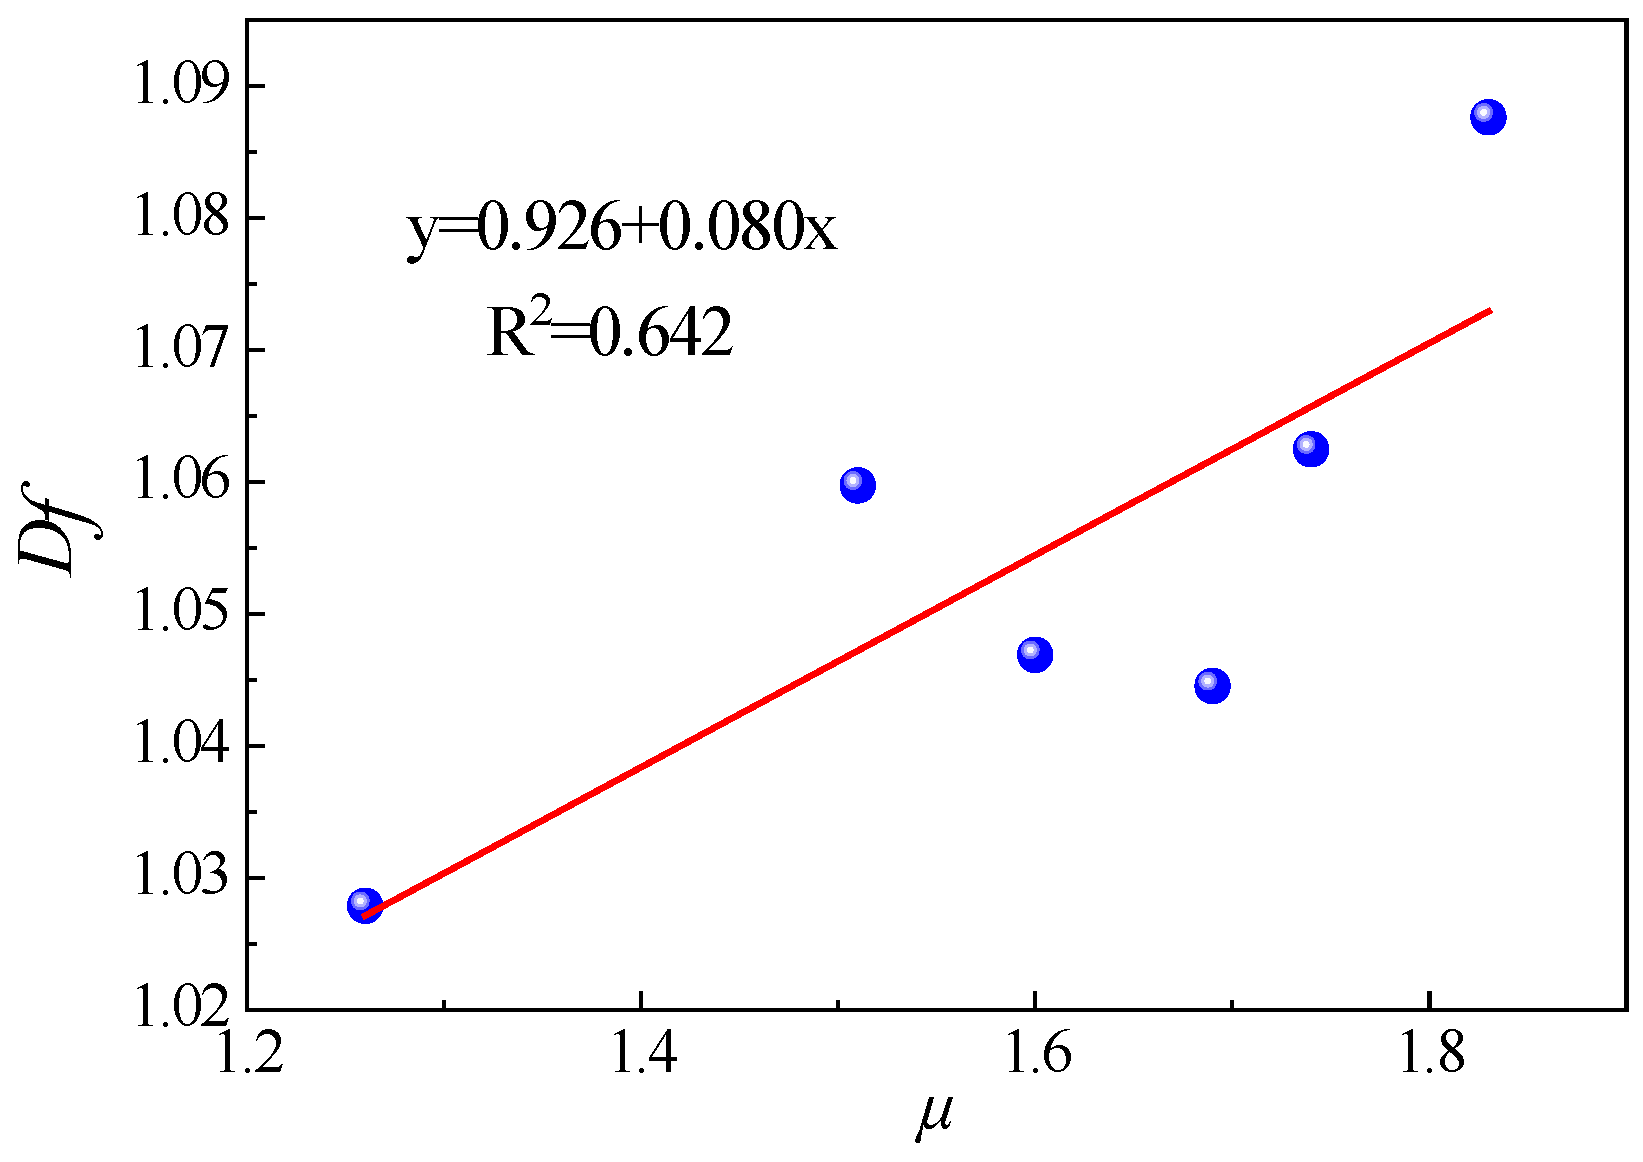
Figure 18.
Relationships between strain and load (zone C).
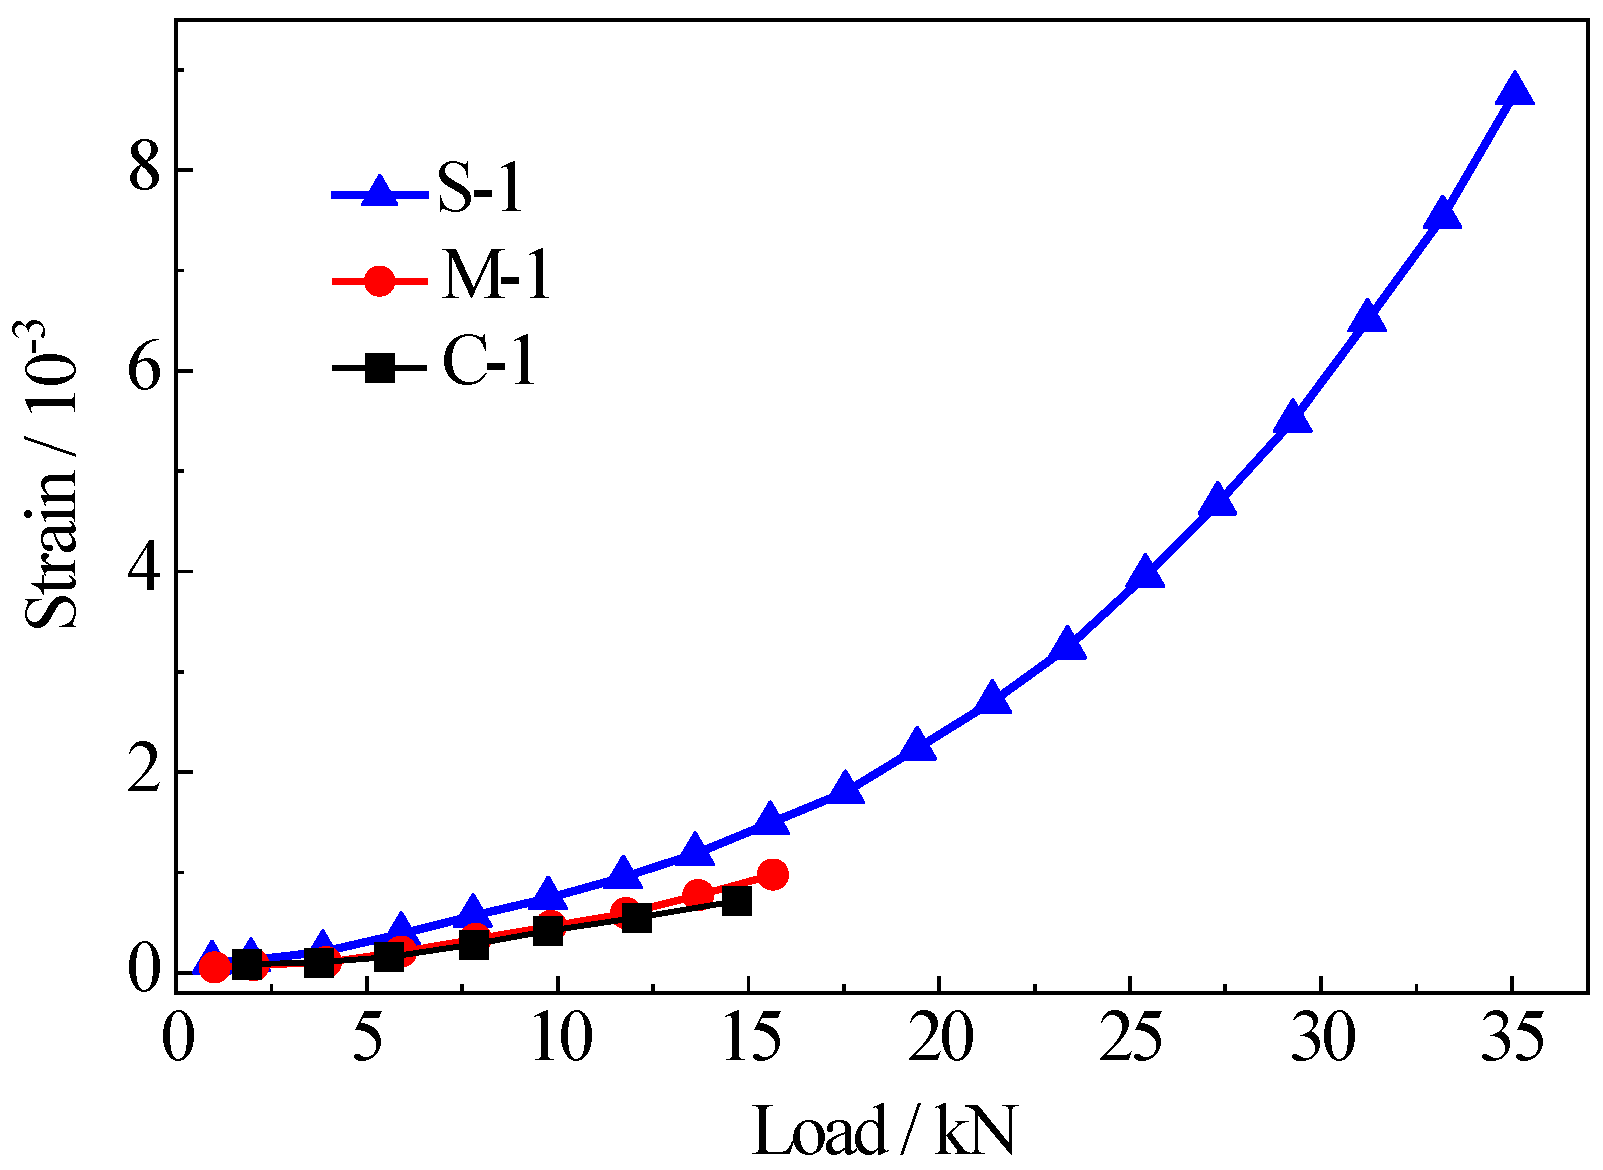
Figure 19.
Geometry of the FE model.
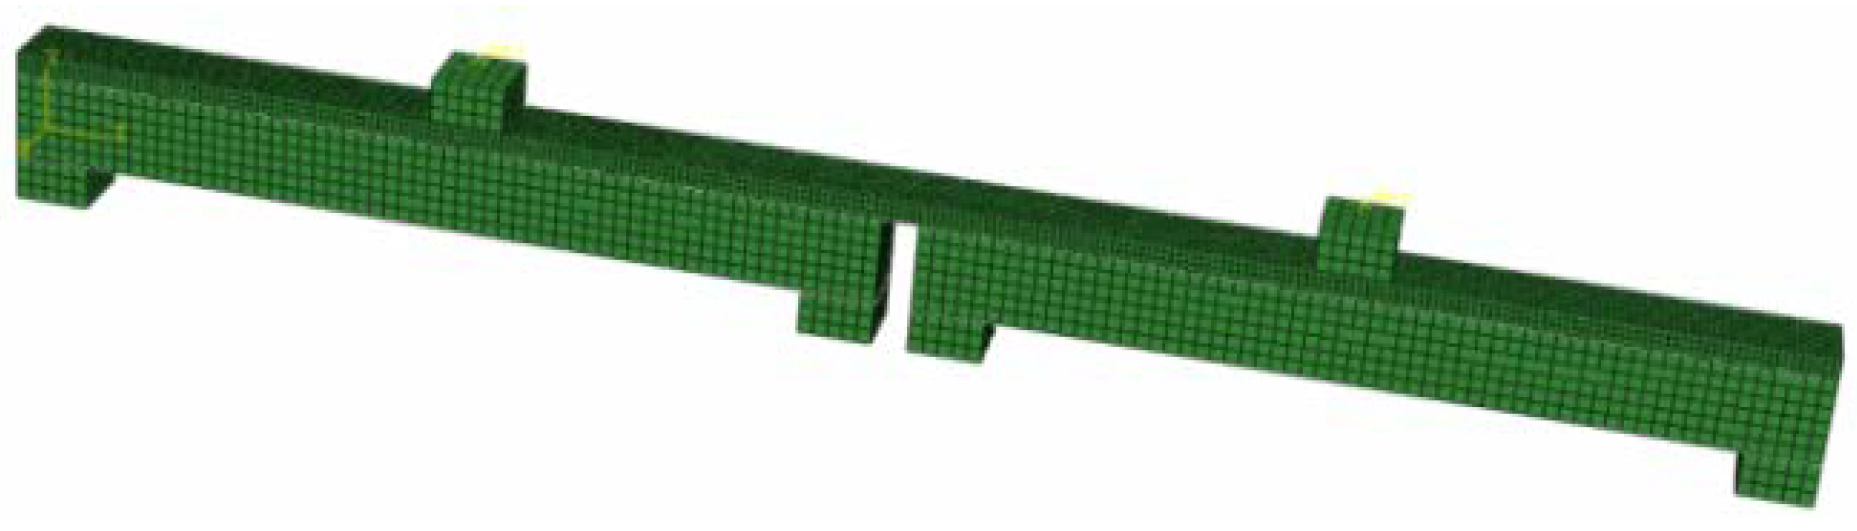
Figure 20.
Stress-strain relationships of PVA-SHCC.
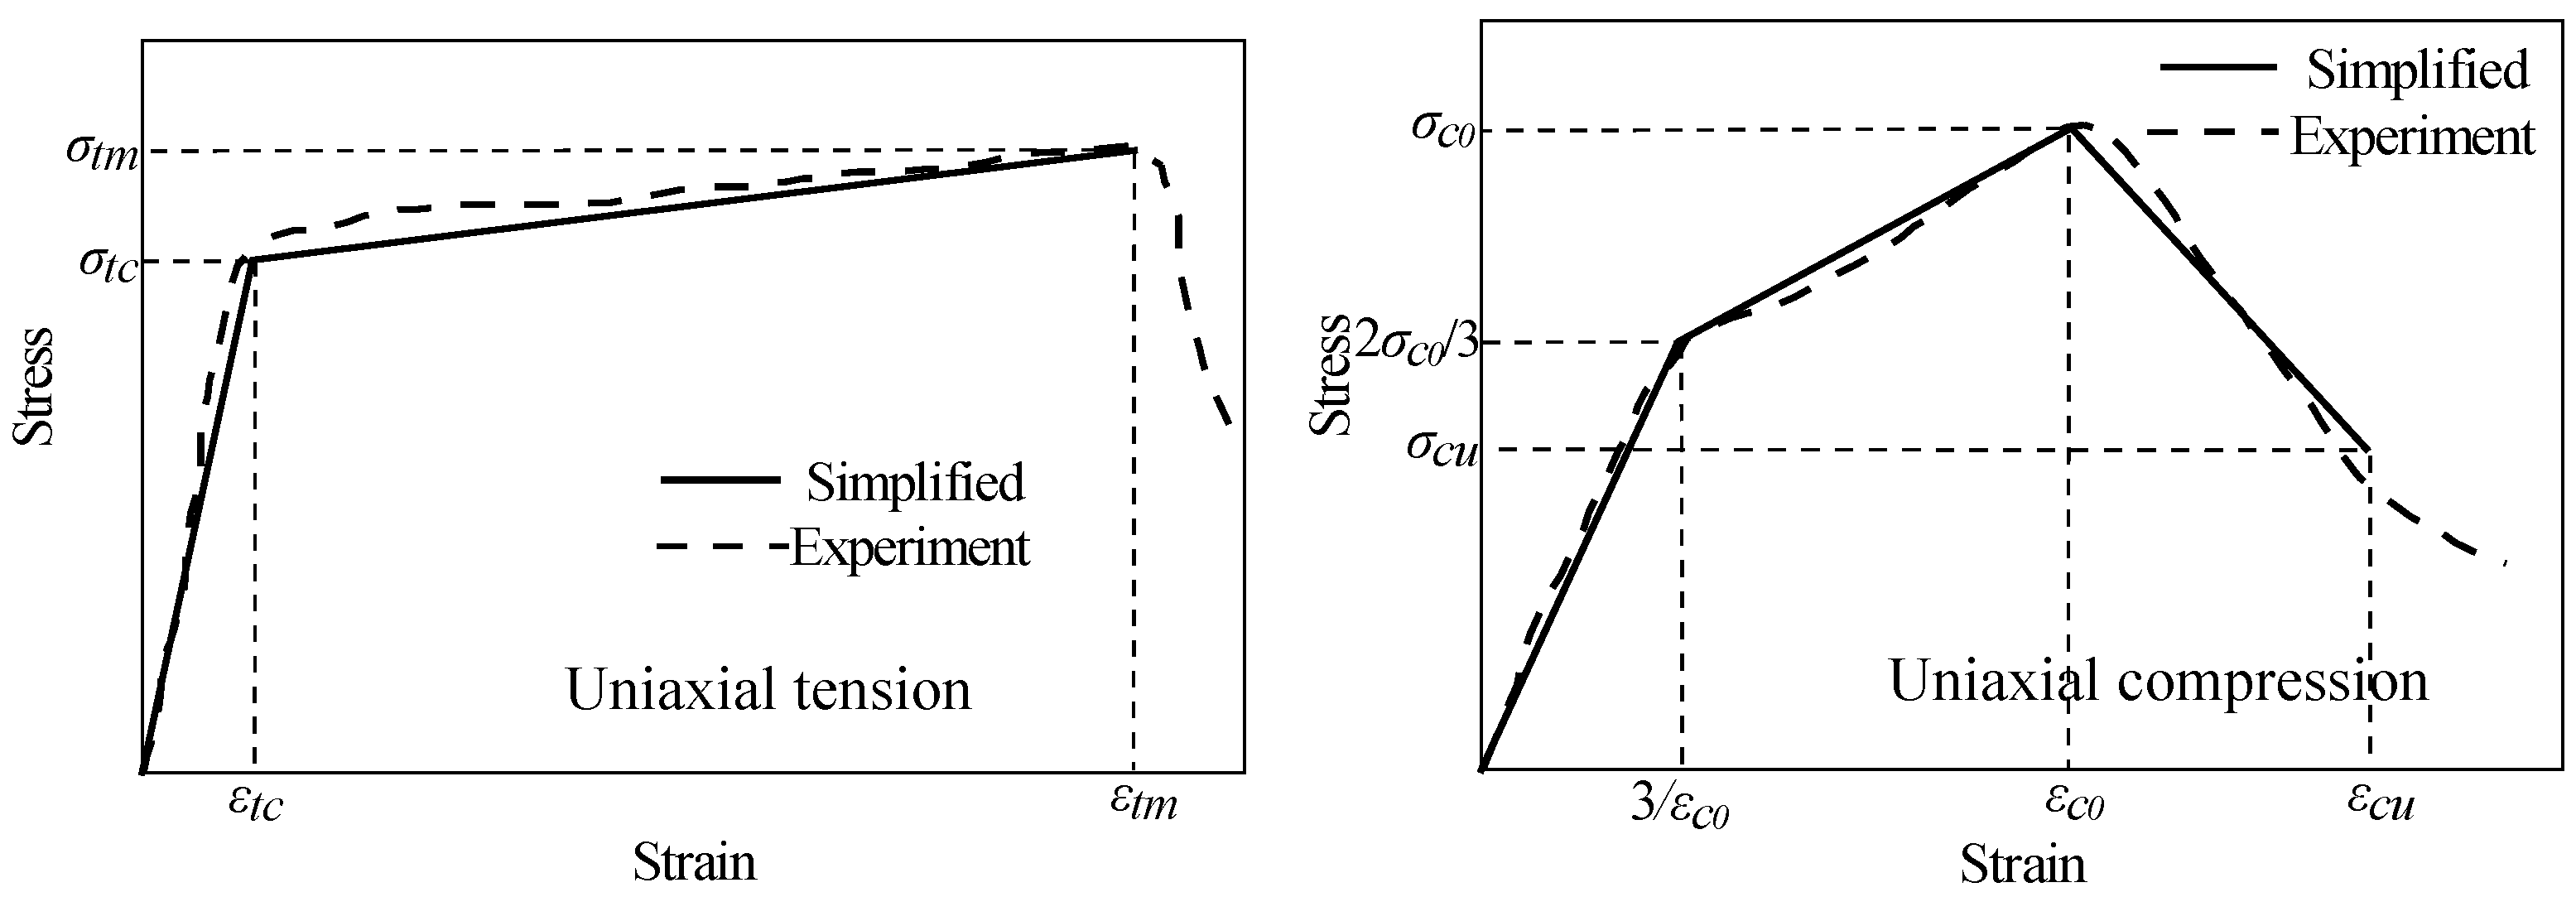
Figure 21.
Load-displacement relationships of testing and FE model.
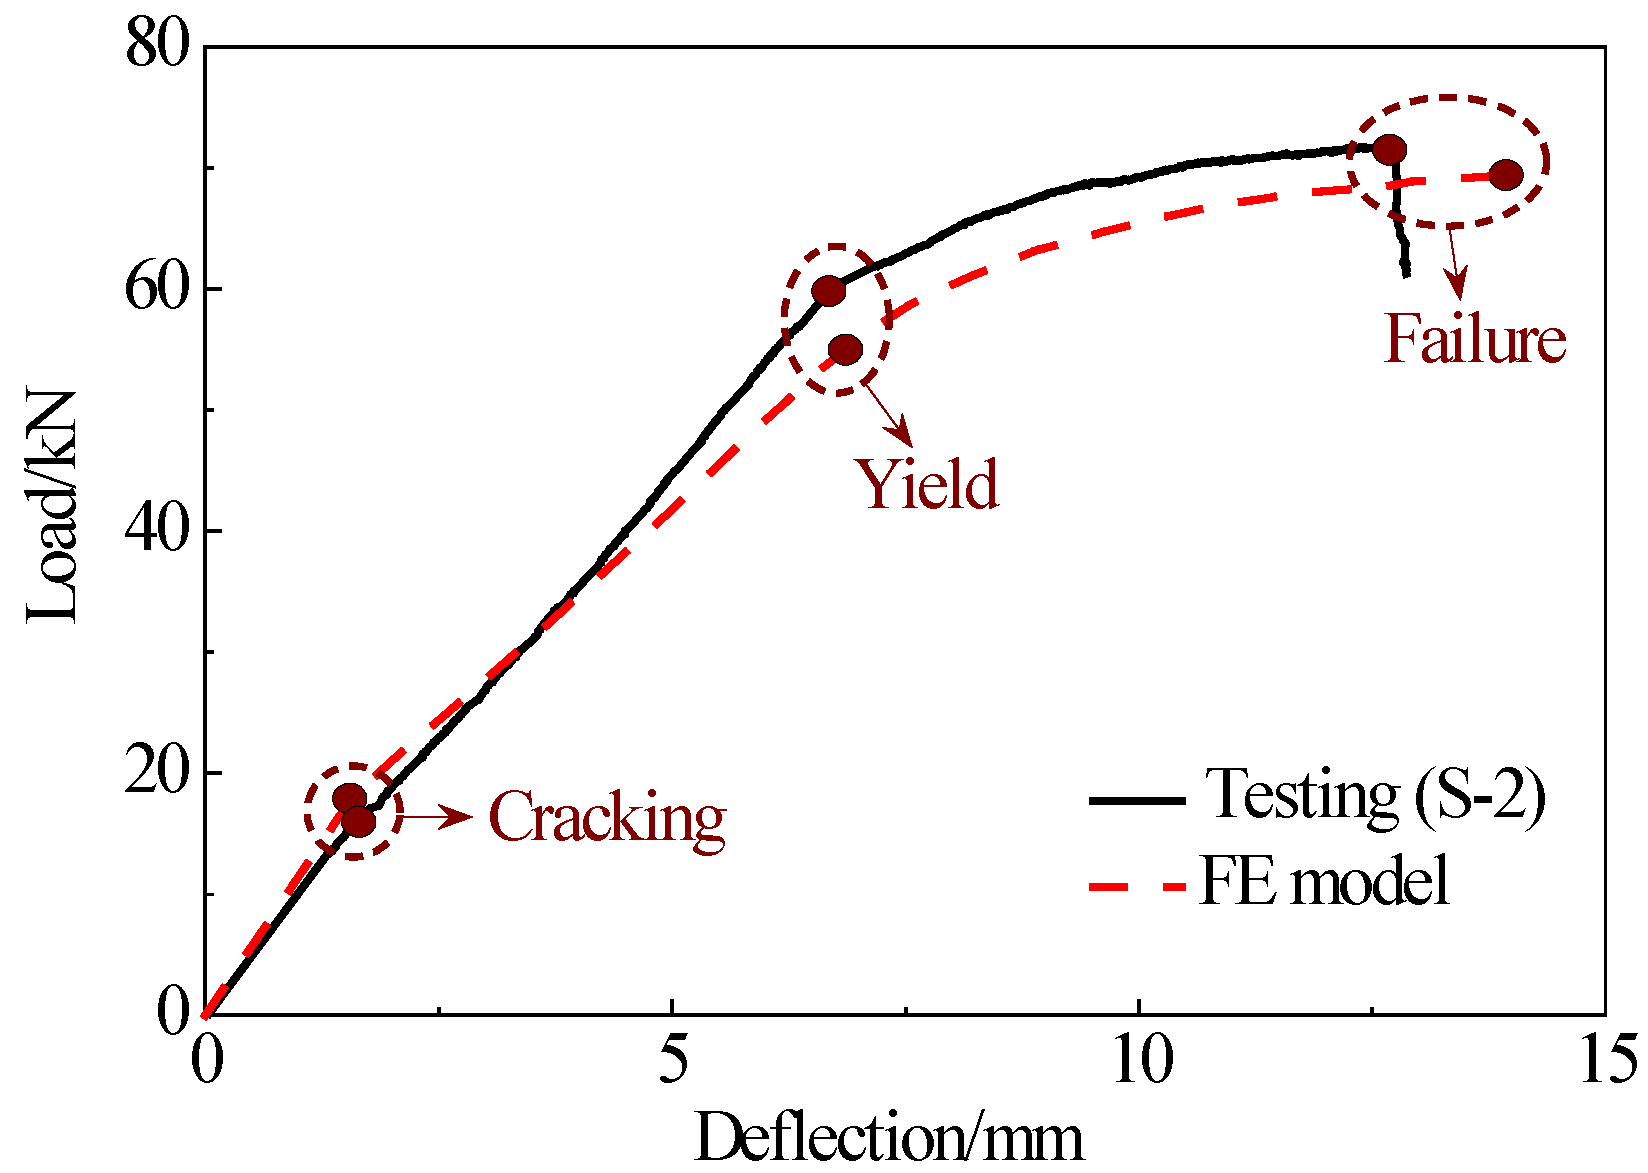
Figure 22.
Moment-curvature relationships of testing and FE model.
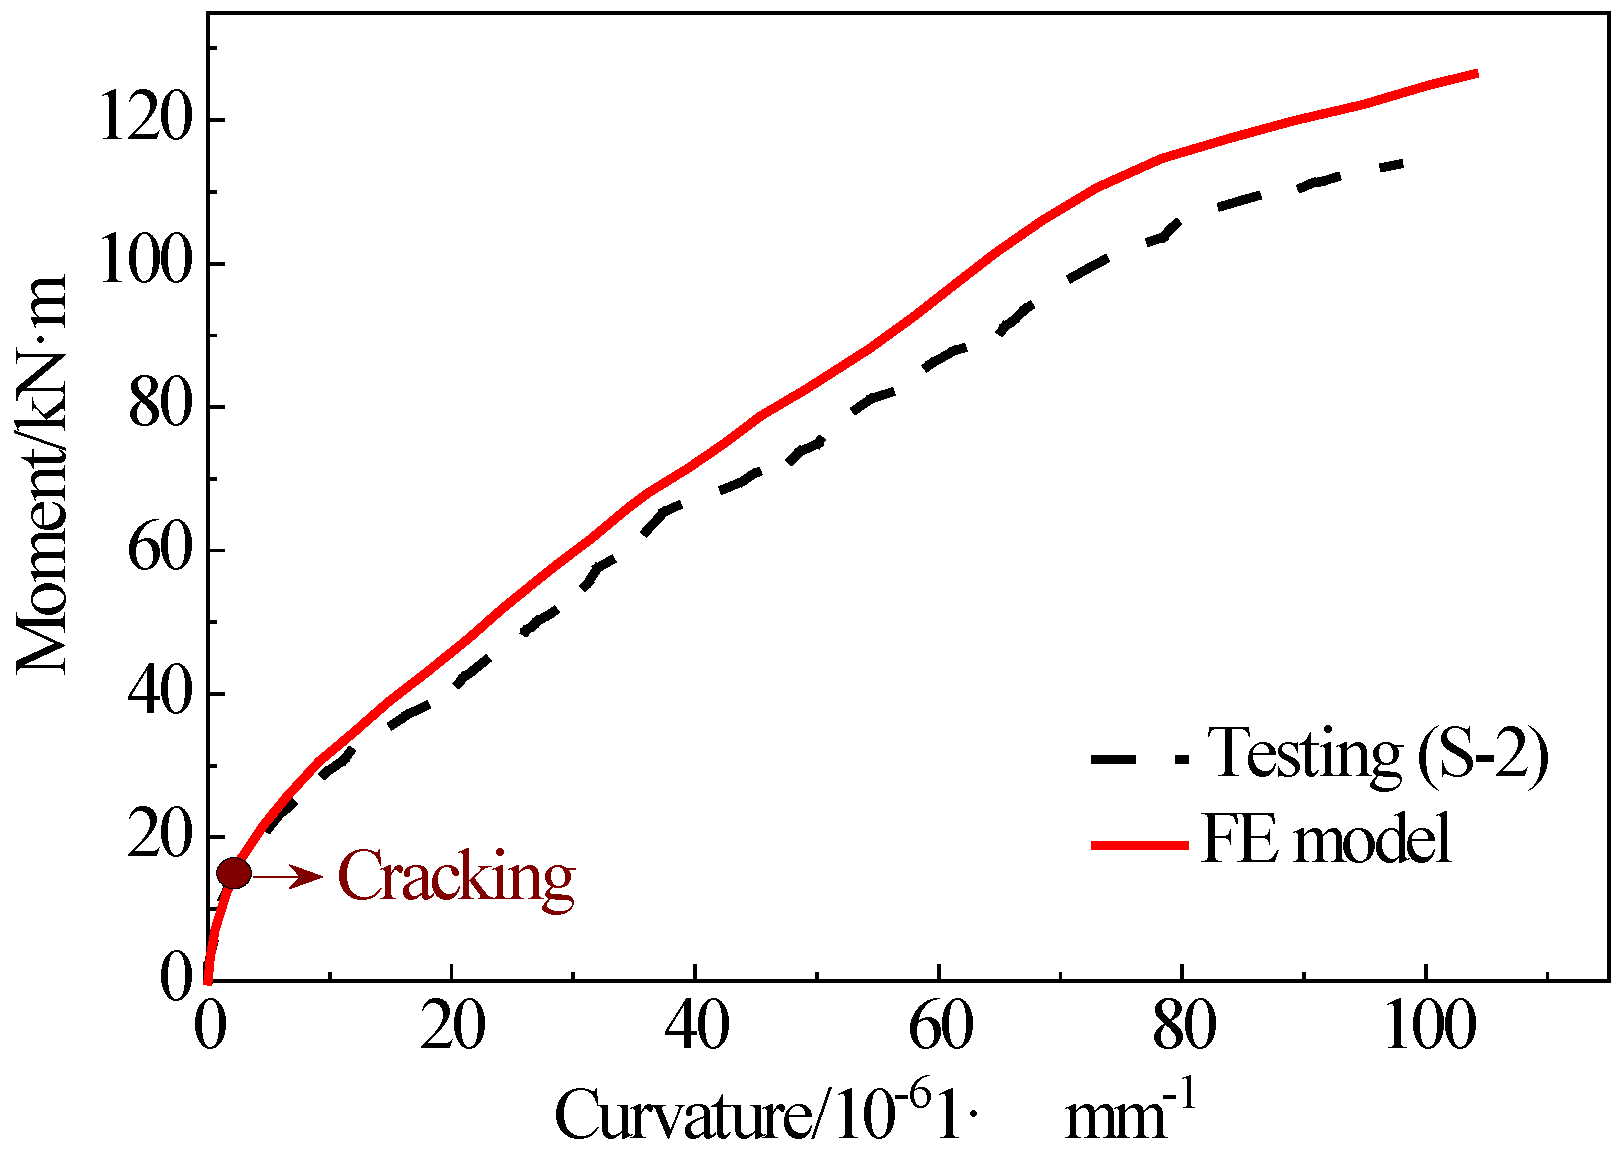
Figure 23.
The maximum principal stress of concrete beams.
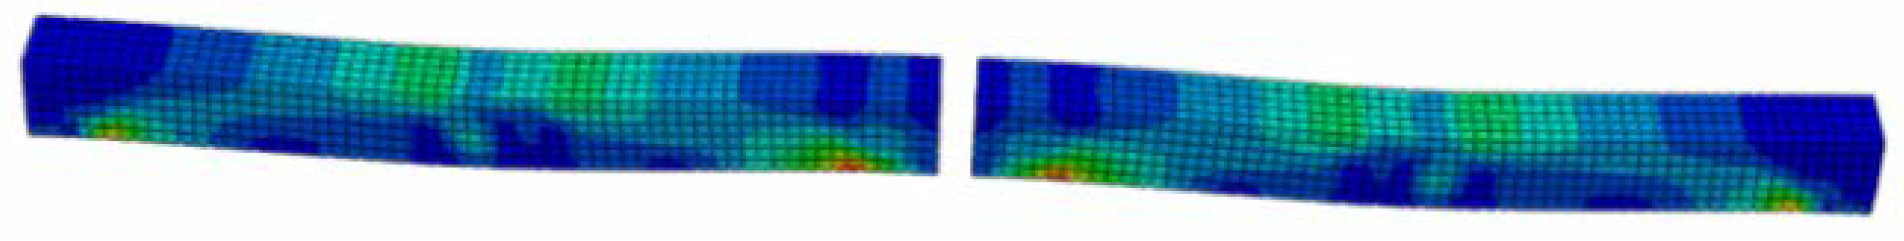
Figure 24.
The maximum principal plastic strain of concrete beams.
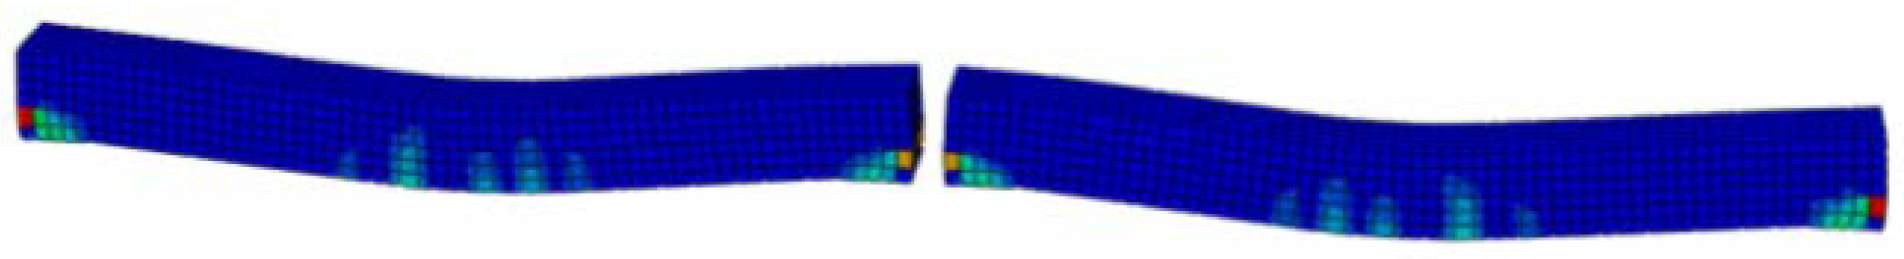
Figure 25.
The maximum principal plastic strain of concrete link slabs (zone C).
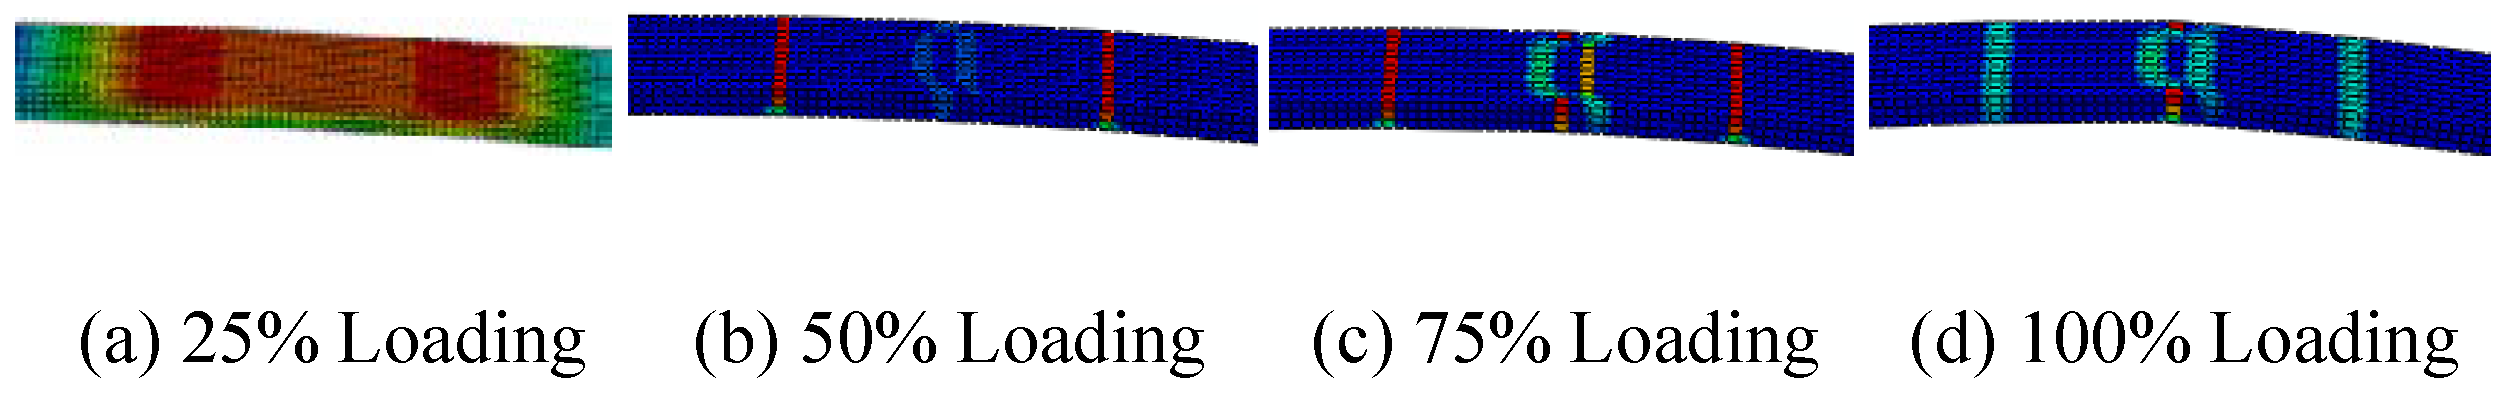
Figure 26.
The maximum principal plastic strain of PVA-SHCC link slabs (zone C).
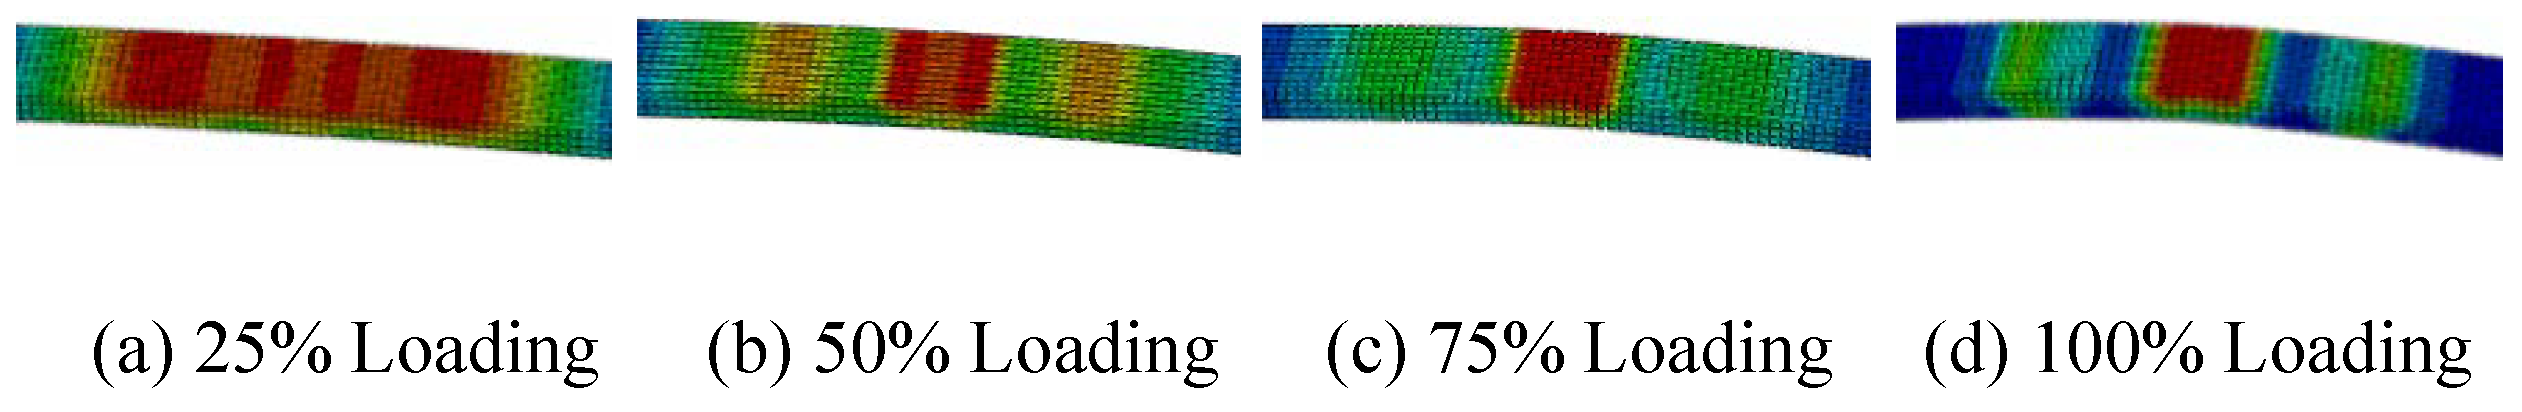

Table 1.
Mechanical properties of PVA.
| Density (g/cm3) | Diameter (μm) | Length (mm) | Strength (MPa) | Elasticity modulus (GPa) | Elongation (%) |
|---|---|---|---|---|---|
| 1.3 | 40 | 12 | 1560 | 41 | 6.5 |
Table 2.
Mix proportions of PVA-SHCC (kg/m3)
| No. | w/b | Sand | Cement | Fly ash | Water | Water reducer | PVA | Cellulose |
|---|---|---|---|---|---|---|---|---|
| 1 | 0.35 | 525.6 | 477.6 | 716.4 | 417.9 | 4.8 | 0 (0%) | 0.333 |
| 2 | 520.3 | 472.8 | 709.3 | 404.2 | 11.8 | 13 (1%) | 0.333 | |
| 3 | 517.7 | 470.4 | 705.7 | 411.6 | 16.5 | 19.5 (1.5%) | 0.333 | |
| 4 | 515.1 | 468.1 | 702.1 | 396.4 | 16.4 | 26 (2%) | 0.333 |
Table 3.
Ultimate tensile stress and strain of PVA-SHCC.
| Volume addition rates (%) | Ultimate tensile stress (MPa) | Yield strain (%) | Ultimate tensile strain (%) | Ductility (μ=εu/εy) |
|---|---|---|---|---|
| 0 | 0.623 | 0.051 | 0.095 | 1.86 |
| 1 | 1.108 | 0.083 | 0.913 | 11.02 |
| 1.5 | 1.201 | 0.112 | 2.596 | 23.18 |
| 2 | 1.359 | 0.102 | 2.431 | 23.76 |
Table 4.
Bending properties of PVA-SHCC.
| Items | Deflection (mm) |
Quantity of cracks | Max width of cracks (μm) | Ductility (μ=εu/εy) | |
|---|---|---|---|---|---|
| Vol. % | |||||
| 1.0 | 4.6 | 14 | 98 | 10.15 | |
| 1.5 | 5.0 | 17 | 105 | 14.32 | |
| 2.0 | 5.3 | 19 | 102 | 15.60 | |
Table 5.
Affinity constants of composite models.
| Types | Physical quantity |
Affinity constants |
Types | Physical quantity | Affinity constants |
|---|---|---|---|---|---|
| Physical | σ | 1 | Geometrical | l | 1/5 |
| ε | 1 | x | 1/5 | ||
| E | 1 | θ | 1 | ||
| ν | 1 | A | 1/25 | ||
| Boundary condition | f | 5 | W | 1/125 | |
| P | 1/25 | I | 1/625 | ||
| M | 1/125 | k | 1/5 | ||
| J | 1/125 |
Table 6.
Mix proportions of concrete (kg/m3).
| Cement | Sand | Stone | Water | w/c | w/b | Fly ash | Water reducer |
| 450 | 678 | 1040 | 159 | 0.353 | 0.304 | 60.0 | 12.8 |
Table 7.
Test conditions.
| Series | No. | Materials of decks | Curing age (days) |
|---|---|---|---|
| C | C-1 | Concrete | 7 |
| C-2 | 56 | ||
| M | M-1 | Cement mortar | 7 |
| M-2 | 56 | ||
| S | S-1 | PVA-SHCC | 7 |
| S-2 | 56 |
Table 8.
Results of bending test.
| No. | Cracking load (kN) | Ultimate capacity (kN) | Ductility (μ=Δu/Δy) |
| C-1 | 20 | 71.4 | 1.26 |
| C-2 | 15 | 81.7 | 1.51 |
| M-1 | 17 | 64.3 | 1.74 |
| M-2 | 10 | 91.1 | 1.60 |
| S-1 | 17 | 73.8 | 1.69 |
| S-2 | 15 | 92.2 | 1.83 |
Table 9.
Properties of cracks in jointless link slabs (zone C).
| No. | Materials | Quantities of cracks | Width of major crack (mm) | Average width of cracks (mm) | Average distance of cracks (mm) | Ultimate depth of cracks (mm) | Df |
|---|---|---|---|---|---|---|---|
| C-1 | Concrete | 1 | 0.32 | 0.320 | - | 33.1 | 1.028 |
| C-2 | Concrete | 1 | 0.38 | 0.380 | - | 30.5 | 1.060 |
| M-1 | Cement mortar | 5 | 0.18 | 0.145 | - | 31.3 | 1.062 |
| M-2 | Cement mortar | 2 | 0.22 | 0.160 | - | 23.6 | 1.036 |
| S-1 | PVA-SHCC | 7 | 0.12 | 0.087 | 1.360 | 28.0 | 1.035 |
| S-2 | PVA-SHCC | 9 | 0.14 | 0.105 | 1.473 | 25.5 | 1.087 |
Table 10.
Tensile strains of link slabs before crack initiation (zone C).
| No. | Materials of decks | Cracking load (kN) | Cracking strain (10-3) |
| C-1 | Concrete | 14.70 | 0.715 |
| M-1 | Cement mortar | 16.63 | 0.931 |
| S-1 | PVA-SHCC | 38.34 | 8.963 |
Table 11.
Mechanical properties of different materials.
| Materials | Density (kg·m-3) |
Elasticity modulus (GPa) |
Poisson's ratio | Yield stress (MPa) |
Yield strain (%) |
Ultimate tensile stress (MPa) | Ultimate tensile strain (%) |
|---|---|---|---|---|---|---|---|
| Concrete | 2400 | 32.5 | 0.2 | 1.150 | 0.010 | ||
| Reinforcing steel | 7800 | 210 | 0.3 | 300 | 0 | ||
| PVA-SHCC | 1900 | 21.0 | 0.25 | 1.201 | 2.596 |
Table 12.
Ultimate principal stress and plastic strain of the bridge deck link slabs.
| Materials | Ultimate principal stress (MPa) | Ultimate plastic strain (%) |
|---|---|---|
| PVA-SHCC | 3.187 | 2.32 |
| Concrete | 3.336 | 0.098 |
Disclaimer/Publisher’s Note: The statements, opinions and data contained in all publications are solely those of the individual author(s) and contributor(s) and not of MDPI and/or the editor(s). MDPI and/or the editor(s) disclaim responsibility for any injury to people or property resulting from any ideas, methods, instructions or products referred to in the content. |
© 2024 by the authors. Licensee MDPI, Basel, Switzerland. This article is an open access article distributed under the terms and conditions of the Creative Commons Attribution (CC BY) license (http://creativecommons.org/licenses/by/4.0/).
Copyright: This open access article is published under a Creative Commons CC BY 4.0 license, which permit the free download, distribution, and reuse, provided that the author and preprint are cited in any reuse.


