
Submitted:
12 April 2024
Posted:
12 April 2024
You are already at the latest version
Abstract
The years 2021 and 2022 showed that maritime logistics are prone to interruptions. Especially the ports turned out to be bottlenecks with long queues of waiting vessels. This leads to the question of whether this can be (at least partly) mitigated by means of better and more flexible terminal operations. Digital Twins have been in use in production and logistics to increase flexibility in operations and are considered a reasonable fit. They are suitable for real-time data integration to support decision-making. However, the true potential of Digital Twins to enhance terminal operations still needs to be further investigated. A Delphi study is conducted to explore operational pain points, best practices to counter them, and how these best practices can be supported by Digital Twins. A questionnaire with 16 propositions is developed, and a panel of 17 experts is asked for their degrees of confirmation for each. The results indicate that today’s terminal operations are far from ideal and leave space for optimisation. The experts see great potential in analysing past working shifts data to identify reasons for poor terminal performance. Moreover, they agree on the proposed best practices and support the use of aiding IT solutions.
Keywords:
container terminal
; digital twin
; emulation
; simulation
; terminal operations
; Delphi study
; questionnaire
1. Introduction
The two years 2021 and 2022 showed that maritime logistics is prone to interruptions, such as COVID-19 or the war in Ukraine, throttling international supply chains and negatively affecting the world economy [1,2]. For a better understanding, it is worth looking at how maritime supply chains are structured. A large number of supply chain partners are involved in a door-to-door transport. They organise and execute transports, transship goods between vehicles, intermediately store goods, and fulfil the related contractual and legal obligations [3]. By definition, shipping companies and seaport terminals are part of the maritime supply chain. Typically, additional parties such as customs, freight forwarders, railway companies, intermodal terminals in the hinterland, and alike are involved as well. At each of the partners, a huge volume of operational data is digested in day-to-day business. Among other things, the current states of involved assets are monitored, (e.g., tracking the position of vehicles and cargoes), information is received from the supply chain partners (e.g., an updated estimated time of arrival for a vessel), and information is shared with supply chain partners (e.g., stating that a container is not accepted for further transportation because it is damaged). In other terms, the operations of several companies (and other parties) along the maritime supply chain are deeply integrated, both physically and information-wise.
A digitalised information exchange between the parties involved achieves short reaction times at low costs. The integration of IT systems between supply chain partners has steadily improved over the last years, yet the degree of digitalisation varies. This can be partly attributed to the size of the company and the field of activity [3,4]. Moreover, incorporating continuously updated information and the related uncertainty into operational planning still constitutes a remarkable challenge [5,6,7]. Extended data collection through Internet of Things (IoT) bears the potential to improve operational efficiency in ports but as of today ports fall behind other industries and further research is needed [8]. Enabling supply chain partners to act effectively and efficiently (both in terms of costs and time) at short notice is one key component in overcoming the above-stated challenges in maritime logistics today. This requires further support through technological innovation.
In 2021 and 2022, the maritime supply chain struggled because of irregular vessel schedules and greater-than-usual variation of transported volumes. It was especially the Container Terminals (CTs) in seaports that struggled to cope with that leading to peaks in terminal operations and high yard utilisation [1,2]. While shipping companies could re-scale the deployed fleets and decide to adjust vessel schedules, the CTs were restricted by the existing infra- and superstructure. Terminal infrastructure can only be extended at major costs in collaboration and coordination with its stakeholders [9]. Thus, in short term it is more promising to better utilise available assets in terminal operations.
One promising technological approach to improve terminal operations are Digital Twins (DTs). A DT can be considered as a virtual replica of a physical environment [10]. The bi-directional transfer of information between the virtual model and the physical world is crucial [11]. This can be realised by forwarding sensor data in real-time to the virtual twin that is implemented as a simulation model [12]. Thus, the virtual replica of a CT contains the latest information available. The kind of information forwarded from the virtual twin to the physical world depends on the particular use case of which some are subsequently presented.
Szpytko and Duarte [13,14] propose using DTs to choose the right time for a crane maintenance task, taking both crane operations in its terminal environment as well as crane maintenance scheduling into account. They assess the level of risk of inefficient crane operations with the help of a Monte Carlo Markov Chain model optimised by Particle Swarm Optimisation. Jakovlev et al. [15] claim that real-time sensory data will reduce uncertainty in daily operations in the future, e.g., by feeding the large data streams into Artificial Intelligence (AI)-enriched methods and identify highly possible faults. Both Szpytko and Duarte [13,14] and Jakovlev et al. [15] focus on monitoring specific assets of the CT and their respective (structural) condition supporting maintenance.
Another angle is to closely monitor the container handling processes and make smarter operational decisions. Li et al. [16] suggest that DTs are a suitable tool to optimise operations at an automated CT in real-time. They couple a virtual twin with the physical space and account for uncertain time consumption in operations. They use Machine Learning (ML) to reduce uncertainty and thus improve how the physical and virtual systems are kept in sync. In their case, the equipment is controlled by an Equipment Control System (ECS) which is part of the standard IT setup of a CT. It is sometimes also subsumed in the term Terminal Operating System (TOS) [17]. Yang et al. [18] describe a DT that monitors terminal operations enabling anomaly detection and operation analysis, all in real time. Lou et al. [19] develop an ECS for Automated Guided Vehicles (AGVs) and use a DT to closely monitor the physical system. Based on the more detailed and repeatedly updated picture, they predict and then pre-emptively resolve routing conflicts and thus improve time efficiency. Gao et al. [20] also work on improving the path-finding of AGVs. They develop alternative solution methods which draw the required real-time information from a DT. Especially Reinforcement Learning (RL) methods need a simulation environment to learn the relationship between actions and rewards. Zhang et al. [21] use the simulation ability of a DT to train an AI-based scheduling heuristic with RL. First quay cranes are scheduled, then the AGVs, and lastly yard cranes.
Wang et al. [22] look at DTs of terminals from a port perspective and, among other things, create a list of existing DT-driven applications of smart ports worldwide. They present a five-step process to implement a DT: (a) data acquisition covering historical and real-time data on the entity (such as a CT), (b) a geo-referenced model of the entities of interest, (c) the integration of real-time information into that model, enabling it to reflect the current situation of the physical system, (d) a simulation, analysis, and optimisation platform, enabling the staff to explore potential future scenarios in detail, and (e) suitable dashboards and maps, which depict the insights created in the previous steps. Ding et al. [23] integrate their DT into existing IT systems of a CT. The information gathered at the physical layer passes through the data layer. There, information is stored in the TOS, ECS, and additional log files. The developed components of the DT import this information and focus on how to further support and potentially automate operational decision making. Early warnings are issued when vessel operations seem to lead to a delayed vessel departure. This is coupled with a feedback mechanism that triggers re-scheduling of terminal resources. Potential delays are identified by starting a detailed simulation model which represents the current state of the terminal based on the data imported from the TOS, ECS, and log files. An additional drill-down analysis allows the terminal staff to identify the cause of bottlenecks in terminal operations.
The aforementioned research aims at obtaining a more detailed picture on terminal assets and their use in operations. The second key element of a DT is its feedback loop to the physical system which allows the DT to create a positive impact on terminal operations. The idea of gathering sensor data, interpreting them, and updating information in the TOS has been around for much longer than the concept of DTs in logistics [see, e.g., [24]. Ding et al. [23] mention two more functions of a DT: (a) running ad-hoc simulation studies based on the current state of the CT and available planning information and (b) executing drill-down analyses for bottleneck detection. While the ad-hoc simulation study explores the impact of decisions within the upcoming hours of operations for what-if analyses and is rather a forecasting tool, in a bottleneck analysis the recent past is explored to find the root cause of low productivity. The interpretation of the analysis and appropriate countermeasures are then developed by the terminal staff. Both functions of the DT enable the terminal staff in the operations control room to make smarter operational decisions.
When the virtual model of the DT is decoupled from the physical environment to run ad-hoc simulation studies, the concept of a DT shows strong parallels with emulation [see also [25]. In emulation, the actual TOS (and the related IT systems such as the ECS) forward their commands to a simulation model instead of the real terminal which allows what-if analyses to be executed without impacting actual operations [25]. The simulation model then shows a realistic behaviour and allows the terminal performance and other relevant indicators to be measured. Emulation is thus a broader term because it also covers simulation studies during the terminal design phase (i.e., before its construction) to make informed investment decisions, or during the go-live phase when the IT systems are set up and the terminal staff is trained on close-to-real examples before terminal operations commence. Under these circumstances, the virtual system is a test environment for expected future scenarios and is no replica of any existing physical system. As long as the virtual and physical system are not coupled, this is not a DT as previously defined.
When there is no actual operational data available yet, scenarios need to be synthetically generated on a large scale [26]. During the operational phase of a CT, however, operational data are used for the ad-hoc simulation studies and the virtual system starts as a replication of the physical one. At this stage, the DT can be used to improve container handling processes by tuning TOS parameters or to prepare shift plans that fulfill contractual berthing windows while the planned workforce for that shift is minimised. This reduces labour costs when temporary contract workers are billed per shift, e.g. when workforce pooling among several terminals is in place. Moreover, proper planning reduces the risk of overtime for the regular terminal staff. Specific care must be shown in the case of dangerous goods and reefer containers as well [27]. Dangerous goods can pose a threat to work safety and it is crucial for the personnel to be informed and well-prepared when handling containers containing dangerous goods [28]. When dealing with reefer containers, the personnel of the CT must frequently check that the cold chain is not broken [27]. Thus, when dangerous goods and reefer containers are handled and stored at a terminal, this affects the expected workload and task composition for shift planning. In addition, terminal operators must increasingly comply with high sustainability requirements and targets. This can be achieved by using AI methods in particular, which in turn requires extensive data from stakeholders [29].
In conclusion, there are several approaches as to how DTs can improve CT operations in seaports. In CTs, there is already a rich ecosystem of IT tools, typically integrated in the TOS, that support terminal operations by, e.g., tracking containers and equipment, gathering information on them, and distributing tasks among the shift team. In previous publications, DTs were used to fulfil quite different functions making the reader wonder which solution creates the most benefit for the terminal operator and in which circumstances. This served the authors of this study as an inspiration to reach out and connect to people who work in the sector and ask for their assessment. The present study strives to capture the status quo in terminal operations and to gather features of DTs use cases that could improve terminal operations in the future. On a more conceptual level, the underlying question is: How can DTs help people working in CT operations master today’s supply chain disturbances better?
2. Materials and Methods
This study’s focus is on a novel and complex IT solution that supports CT operations in new ways. As a result, a Delphi study was used, as it is ideal for developing exploratory theory on poorly investigated issues where expert opinions are the sole informational resource for developing common knowledge and agreement [30,31]. This technique differs from other group decision-making methods such as meetings or focus groups in that it makes certain the anonymity of experts, iterates questions to allow for responses, and prevents opinion leadership, resulting in individual replies and real expert opinions [32]. As a consequence, it is regarded as an excellent forecasting tool for generating causal linkages in intricate social or economic occurrences, and it includes a model’s structure while maintaining participant heterogeneity to assure the validity of the results [33]. The Delphi method is a systematic iterative process for obtaining consensus, i.e., agreement on a certain issue, from a diverse panel of experts from various backgrounds by collecting opinions via questionnaires, combining and statistically condensing these viewpoints, and delivering regulated feedback on opinions [34]. The methodological approaches taken to produce the results of this research are detailed in depth in the following sections to guarantee transparency and replicability.
2.1. Panel Identification
The first stage in the Delphi study is to determine the panel of experts who will take part in the study. Experts must have at least five years of knowledge on the area of inquiry, as well as availability and desire to take part in the research [35], while academics must be well-recognised and referenced, with numerous papers relating to the relevant research field [36]. A diverse panel of experts needs to be assured to nurture varied perspectives and so avoid biased conclusions that a homogeneous panel may yield [37,38,39]. As a result, specialists from diverse domains, both academics and practitioners, should be chosen to increase variety and reflect multiple views.
Another important factor in the Delphi study is the number of experts. Diamond et al. [40] examined 100 studies and discovered that 40 percent of them had 11 to 25 participants (which consequently turns out to be the normal number of experts chosen in a Delphi study) and 78 percent had less than 50 participants. According to Kembro et al. [36], the panel should not include more than 30 experts as big groups tend to provide limited fresh insights and limit the study’s examination of the insights.
2.2. Panel Selection
Following all these principles, we chose 17 experts in CT-related domains for our study: 15 practitioners and 2 academics. To provide diversity to our panel of experts, we chose experts who work in CT operations, plan new CTs, or develop software and new methods to support and improve CT operations. The academic panel was chosen using bibliometric criteria. We selected well-known and well-cited authors based on the number of publications and citations in the CT planning and operations literature. Scopus was the primary database evaluated for this reason. We chose manager-level people working in the CT industry to form the panel of practitioners. The practitioners were found mostly through LinkedIn and personal networking. The panel is presented in Table 1.
2.3. Study Design
First, we performed a pilot Delphi study in combination with expert interviews to create the questionnaire. Thus, it could be cross-checked by experienced academics and practitioners, to confirm the clarity and relevance of the questions [41]. The final version of the questionnaire consisted of 16 propositions as listed in Table 2. Each of the propositions is assigned a category and a focus. The following categories are used:
- Status quo: How well are operations at terminals supported by modern TOS solutions? What does the current situation look like?
- Best practices: What are common opinions of what operations should look like? In case of challenges during operations, what are appropriate countermeasures?
- IT-supported processes: How can modern IT solutions improve terminal operations in general and operational best practices specifically?
At the same time, each proposition is associated with a temporal focus:
- Previous shifts: The proposition addresses the analysis of terminal operations during previous shifts based on recorded information.
- Current shift: The proposition focuses on terminal operations in real-time.
- Next shifts: The proposition describes shift planning including workload forecasting for the next few days.
- General: The proposition covers several of the aforementioned time ranges or does not have a clear temporal focus.
In the questionnaire, all IT-related propositions were formulated in an implementation-agnostic manner. This study takes a user-centred perspective: The users at the terminals are assumed to judge best what kind of work processes they need to achieve better results and what kind of IT functionality supports them best in their daily tasks. Whether the required IT functionality is implemented best by means of a DT or alternative approaches is a separate discussion. However, the ongoing academic discussion indicates that DTs are a promising solution (see Section 1).
The questionnaire was distributed to the participants via an Internet-based survey platform. Limesurvey was determined to meet the study’s goals and objectives. We used the inter-quartile range (IQR) approach based on a five-point Likert scale to ascertain consensus among the panel of experts [42]. In general, consensus on a particular element is considered reached when the IQR of the replies is equal to or less than 1 given the number of experts included in the Delphi study [43,44,45]. However, in order to be more cautious given the novelty of the topic, this study adopted a mixed methodology that slightly differs in the development of the consensus at the early stage of the study. In order to enhance strictness and to allow the experts to provide more insights on a new and little studied topic, in the first round of the Delphi study consensus was considered to have been reached only if the IQR of a proposition is strictly less than 1.
2.4. Rounds
The Delphi study was preceded by a preliminary step that consisted in a set of interviews with experts (see Figure 1). These were used to get deeper insights into the benefits of DT adoption in CT, as well as to collect reasonable propositions in combination with the results of the literature review. To reach unanimity, this Delphi research used three iterations. This falls in the range of number of rounds to expect [40,46].
The experts were asked to respond to the 16 propositions in Table 2 using a five-point Likert scale ranging from strongly disagree (noted as 1 point) to strongly agree (noted as 5 points) to convey their opinion on the importance of the benefits. The process involved assessing consensus based on expert opinions. In the second and third round, the items that had not yet reached consensus were presented. The third round produced the final results.
3. Results
The results of each round in terms of IQR, mean, and standard deviation are reported in Table 3. All 16 propositions were agreed upon after the three rounds of this Delphi study. In the first round, four propositions reached consensus, i.e., P1, P7, P13, and P15. In the second round, ten more propositions were agreed upon. These are P2, P3, P4, P5, P6, P9, P10, P11, P12, and P14. Finally, only two propositions were passed on to experts in the third round, and both achieved consensus: P8 and P16.
The two propositions which received the highest approval are P8 with an approval score of 4.42 and P6 with an approval score of 4.22. There are two more relevant propositions that follow in equal third place: P15 and P16, both receiving an approval score of 4.17.
The results from Table 3 are further visualised in Figure 2 for easier interpretation. Both the category and the focus as indicated in Table 2 are used as categorical dimensions. They are described in the legend, while the approval score is plotted on the x-axis and the dispersion measured by the standard deviation is plotted on the y-axis. The blue dotted lines indicate the average dispersion and average approval respectively.
4. Discussion
The results as depicted in Figure 2 show very interesting patterns. The propositions related to the status quo achieve the lowest approval and highest dispersion compared to the other two categories. This indicates that people perceive and judge the current situation of terminal operation in seaports very differently. As the participants work in different companies and roles around the world (see Table 1), some variation might be explained by that. A follow-up analysis of the responses to test this hypothesis based on the available data on 17 participants is not viable due to the low number of people in each region for each type of employer. Consensus was reached on all six propositions in the first or second round. Most responses regarding the status quo cluster and P3 is a visual outlier with a low approval rate and a slightly lower dispersion. That proposition is: `A modern TOS solution requires little to no manual intervention from the equipment operators or from the operations control room. Most to all processes are automated.’ In other terms, the panel does not uniformly agree that process automation has been implemented in modern terminals. This certainly depends on the handling volume, the desired handling speed and the capital available to the CT. The question arises as to whether smaller CTs have a lower degree of automation due to the frequently lower investment volume and, accordingly, the representatives of such CTs responded rather cautiously to the questions on the status quo. It should also be noted here that P10 is stated negatively, while the remaining propositions on the status quo are stated positively. That proposition is: `Today’s TOS solutions lack the ability to properly account for the expected developments in the next hours, such as vessel schedules, planned maintenance tasks, shift changes, and similar.’ At the same time, P10 achieves the second-highest value for approval in status quo. This suggests that there is a certain dissatisfaction with the current situation, which needs to be eliminated by future improvements in terminal IT.
The average dispersion is lower for both the categories best practices and IT-supported processes. This implies a higher level of agreement among the panel on what we should do and where we need to head to in the future. However, the spread of the results in terms of dispersion is significantly greater for IT-supported processes. This might also be explained by the very different levels of technology in CT. This raises the related question of whether the IT solutions available are not flexible enough to be applied to different terminal sizes and specific requirements, causing a certain dissatisfaction with the current situation. Most propositions related to best practices cluster at an approval rate of around 4, with P13 as a visual outlier. The corresponding question P13 is `To effectively plan the upcoming shifts, an Excel sheet with information on vessel arrivals and their call sizes is sufficient’. It was included with the intention of identifying the perceived complexity of this task, especially in relation to the subsequent proposition: `When planning upcoming shifts, the planners need to consider many aspects. Only ad-hoc simulation studies which use terminal emulation can sufficiently account for the complexity of this task’ (P14). P14 in fact received a higher approval than P13, indicating that simulation is considered a promising feature. In the last category IT-supported processes, with P7, P8, and P16 three of the five highest-ranked propositions appear (see last paragraph of Section 3) while the remaining propositions rank close to the average approval rate and/or average dispersion. It is notable that these points refer to the past shifts or the general necessity of simulation. Questions related to current or future shifts achieve a significantly lower level of approval in this context. It requires further research to determine whether the variety of possible future scenarios still exceeds available computing power to simulate them.
When looking at the propositions in terms of their focus, interpretable visual clusters appear. Again, the proposition P3 is ranked lowest for the aforementioned reasons. The propositions related to the current shift tend to receive less-than-average approval and a medium to high dispersion. This shows that there is currently no uniform standard for software support at CTs. The propositions discussing the coming shifts are mostly scored close to the average approval and have a slightly lower dispersion compared to the current shifts. The dispersion with P13 received the lowest value for the aforementioned reasons. The panel expressed their highest approval for the propositions regarding previous shifts, agreeing nearly uniformly that recording terminal operations to deduce insights and learn from the past is crucial.
4.1. Outlook
Even at so-called automated CTs, human intervention in the operations control room is common to ensure high productivity – see the rather low scores of P2 and P3 in Table 3 as well as the importance of centralised control expressed in P4. This is necessary when sensor faults occur, software products contain bugs, products lack features to properly reflect actual operations, or when products are plainly misconfigured. At times, operators also identify solutions they consider superior to the suggestion of the system so they overwrite these plans. Moreover, external blue-collar workers, such as freight train personnel, truck drivers, and seamen on container vessels, are involved in the container handling processes. Their behaviour remains a potential source for unpredictable disturbances and interruptions when their actions are not in accordance with local terminal procedures. This is less common for the blue-collar workers hired by the terminal who are usually better accustomed to local procedures. Although they may still deviate from ideal processes due to factors like fatigue. Mechanical defects of the equipment or the containers are another source for short-term adaptions in operations. All in all, there are many reasons (e.g., software-related issues, human factor, and mechanical defects) why executed processes differs from the ideal processes. When designing a DT, implementing realistic instead of idealised processes results in more reliable forecasts. This requires a close monitoring of all relevant processes on a terminal and data analyses to deepen the understanding of common interruptions and disturbances in terminal operations, as well as their causes. Here, openly available operational data (both actual and ideal processes) would be very fruitful to create a more detailed picture of CT operations in the future.
Workload balancing within the yard remains an issue both for ad-hoc workload balancing and forecasting operational developments of the next hours. This is reflected in the rather low scores of P1 and P2 in Table 3 as well as the approval of the negatively framed P10. Most likely, this is most prevelant in CTs with mixed traffic where road trucks enter the terminal area and share the road infrastructure with other terminal equipment, such as terminal trucks or multi-trailer systems. In such a case, the length of waiting queues in front of yard cranes is difficult to assess because road trucks are owned and operated by freight forwarders and not the terminal operator. Thus, they are not integrated into the IT systems of the terminal, which makes it difficult to track their position in the yard leading to a potential blind spot in operations. This might be alleviated by a the integration of the Gate Operating System which controls the inflow of trucks with IoT-based surveillance of the road trucks during their stay at the terminal.
A DT being used in daily operations requires upskilling of the terminal staff as they will be the direct users. The DT needs to be continuously updated to reflect the latest developments at the terminal such as new laws and regulations (e.g., related to customs, fire prevention, or dangerous goods), adaption of the terminal infrastructure (e.g., expanding the stacking area or adding a berth), retrofitting the terminal equipment (e.g., electrifying the yard trucks), etc. The terminal staff needs to ensure that the DT is well-aligned with the actual terminal and its actual processes to be a good predictor for terminal performance indicators while in simulation mode. Additionally, realistic what-if scenarios need to be created in a time-efficient manner so that the additional insights outweigh the invested effort. Here, one of the key challenges is the lack of reliable information in operational planning: Often, vessels, trains, and trucks do not show up on time or containers are discharged without a known destination, waiting for further information from carriers or railway transport companies. Therefore, many assumptions are required before the DT can be used in simulation mode: Early and late arrivals need to be artificially created, unexpected changes in the lists of the containers to unload and load need to be accounted for, etc. This creates a plethora of future scenarios to choose from. In the operations control room, the operational planners remain in charge to identify the most likely course of actions – they need to choose which scenarios to test with the DT. It remains an open challenge how to create the set of scenarios that are most likely to become reality. Moreover, this should happen in a semi-automated manner to reduce the effort of the terminal staff.
In summary, simulating terminal operations within a DT will require more research in the upcoming years before being rolled out in a systematic manner. As long as (unpredictable) human intervention is common practice, crucial terminal-internal information is missing, and the quality of information provided by supply chain partners is sub-optimal, the forecast ability of a DT remains limited. Accounting for these unknown factors by introducing a reasonable degree of randomness to the simulation mitigates this issue at the cost of assessing thoroughly which realistic and relevant variations need to be covered in the ad-hoc simulation study.
4.2. Limitations
This Delphi study comes with some limitations. Firstly, this study takes a user-centred approach which limited the exchange of thoughts with IT developers working for TOS providers. This perspective has been taken partly because TOS providers were rather hesitant to share implementation details of their IT solutions during the preliminary expert interviews. This made it challenging to assess how existing TOS solutions can be further improved by DTs. Another limitation is that the panel consists of 17 professionals. For the objective of this study, the panel size was sufficient but a larger pool of participants would help explore differences in terms of region or employer in a statistically significant manner, allowing additional insights. In the preliminary interviews, some experts also hinted at another fact: today, there is still a difference between the digitally exchanged information and the reality, e.g., when a vessel berths, the actual container arrangement might differ from the previously digitally shared stowage plan. These and similar deviations lead to frequent re-planning of terminal operations with adjusted information. The extend and severity of this have not been addressed in the latest literature (see Section 1) and might be fruitful for future evaluation.
4.3. Conclusion
In conclusion, the study panel expressed their greatest approval when it came to best practices and the related IT support covering the analysis of past shifts. When turning back to our guiding question `How can DTs help people working in CT operations master today’s supply chain disturbances better?’, the participants stated that operational decisions sometimes lead to poor operational performance. In retrospect meetings, the team needs to identify the root cause of possibly reoccurring operational issues. Once these are identified, appropriate measures need to be taken to either prevent certain events from occurring at all or find suitable reactions to mitigate a given situation. On this journey, proper IT support is crucial to draw sound conclusions from past records and share the insights with the team. DTs can be part of such an IT system that enables the team to better understand the course of actions in past shifts. In a first step, all relevant terminal activities need to be recorded and stored, creating a digital shadow of terminal operations. This allows the team to take a bird’s eye view while replaying terminal operations as a 3-dimensional visualisation in team discussions. Once problematic operational decisions are identified, potential solutions need to be evaluated for the given setting. This requires a decoupling of the DT from the recorded shift and switching into simulation mode. The team can then test various operational decisions and their estimated impact on terminal performance, exploring alternative courses of the past. In this way, past operational decisions can be examined and re-evaluated in retrospect. An improved understanding of causal links in terminal operations will eventually also lead to a more sophisticated operational decision-making process both for current and upcoming shifts and thus better terminal operations overall.
When turning back to the question of `How can DTs help people working in CT operations master today’s supply chain disturbances better?’, today the answer appears to be `by analysing process data in retrospect and thus better understand cause-effect relationships in terminal operations.’ In the next years, we will hopefully add ’by evaluating several options in terms of terminal performance before making critical operational decisions.’ This will enable the CT staff to be prepared for the next time when the maritime supply chains are disrupted and consequences need to be mitigated.
Author Contributions
Conceptualization, A.L., M.K., and N.S.; methodology, N.S. and T.S.; formal analysis, N.S.; investigation, M.K.; resources, A.L.; data curation, M.K. and N.S.; writing—original draft preparation, M.K. and N.S.; writing—review and editing, A.L. and T.S.; visualization, N.S.; supervision, T.S.; project administration, A.L. and M.K. All authors have read and agreed to the published version of the manuscript.
Funding
This research received no external funding.
Data Availability Statement
The participants of this study did not give written consent for their data to be shared publicly, so due to the sensitive nature of the research supporting data is not available.
Acknowledgments
The Delphi study was conducted online with the great help of experts in the domain of container terminal operations. The authors gratefully acknowledge the input of the members of the expert panel who freely gave their time and expertise for this study. Further thanks to all colleagues who provided us with their helpful feedback when compiling the questions, contacting experts, and drafting this paper.
Conflicts of Interest
The authors declare no conflicts of interest.
Abbreviations
The following abbreviations are used in this manuscript:
| AI | Artificial Intelligence |
| AGV | Automated Guided Vehicle |
| CT | Container Terminal |
| DT | Digital Twin |
| ECS | Equipment Control System |
| IoT | Internet of Things |
| ML | Machine Learning |
| RL | Reinforcement Learning |
| TOS | Terminal Operating System |
References
- UNCTAD. Review of Maritime Transport 2021: Challenges faced by seafarers in view of the COVID-19 crisis; Review of maritime transport / United Nations Conference on Trade and Development, Geneva, United Nations Publications: New York, USA, 2021. [Google Scholar]
- UNCTAD. Review of Maritime Transport 2022: Navigating stormy waters; Vol. 2022, Review of maritime transport / United Nations Conference on Trade and Development, Geneva, United Nations: Geneva, 2022. [Google Scholar]
- UNCTAD. Digitalizing the Port Call Process; Vol. 13, Transport and Trade Facilitation, United Nations: New York, 2020. [Google Scholar] [CrossRef]
- Lange, A.K.; Grafelmann, M. Digitalization of Maritime Logistics Systems. In Arctic Maritime Logistics: The Potentials and Challenges of the Northern Sea Route; Ilin, I., Devezas, T., Jahn, C., Eds.; Springer International Publishing: Cham, 2022; pp. 95–116. [Google Scholar] [CrossRef]
- Kim, A.; Park, H.J.; Park, J.H.; Cho, S.W. Rescheduling Strategy for Berth Planning in Container Terminals: An Empirical Study from Korea. Journal of Marine Science and Engineering 2021, 9. [Google Scholar] [CrossRef]
- Voss, A.; Guckenbiehl, G.; Schütt, H.; Buer, T. An online storage strategy with dynamic bay reservations for container terminals. 2016 IEEE Symposium Series on Computational Intelligence (SSCI). IEEE, 2016, pp. 1–8. [CrossRef]
- Raeesi, R.; Sahebjamnia, N.; Mansouri, S.A. The synergistic effect of operational research and big data analytics in greening container terminal operations: A review and future directions. European Journal of Operational Research 2023, 310, 943–973. [Google Scholar] [CrossRef]
- Jing Gao, Yuhui Sun, R.R.; Chow, C. Understanding data governance requirements in IoT adoption for smart ports – a gap analysis. Maritime Policy & Management. [CrossRef]
- PIANC. Masterplans for the development of existing ports: MarCom Working Group Report N° 158, 2014.
- He, B.; Bai, K.J. Digital twin-based sustainable intelligent manufacturing: a review. Advances in Manufacturing 2021, 9, 1. [Google Scholar]
- Grieves, M.; Vickers, J. Digital Twin: Mitigating Unpredictable, Undesirable Emergent Behavior in Complex Systems. Transdisciplinary Perspectives on Complex Systems.
- Negri, E.; Fumagalli, L.; Macchi, M. A Review of the Roles of Digital Twin in CPS-based Production Systems. Procedia Manufacturing 2017, 11, 939–948. [Google Scholar]
- Szpytko, J.; Duarte, Y.S. Digital Twins Model for Cranes Operating in Container Terminal. IFAC-PapersOnLine 2019, 52, 25–30. [Google Scholar] [CrossRef]
- Szpytko, J.; Salgado Duarte, Y. A digital twins concept model for integrated maintenance: a case study for crane operation. Journal of Intelligent Manufacturing 2021, 32, 1863–1881. [Google Scholar] [CrossRef]
- Jakovlev, S.; Eglynas, T.; Voznak, M.; Partila, P.; Tovarek, J.; Jusis, M.; Pocevicius, E.; Purlaura, Z. Development of an Intelligent Digital Twins Framework for Secure Container Terminal Operations. ITMS 2021 - 2021 62nd International Scientific Conference on Information Technology and Management Science of Riga Technical University, Proceedings, 2021. [CrossRef]
- Li, Y.; Chang, D.; Gao, Y.; Zou, Y.; Bao, C. Automated Container Terminal Production Operation and Optimization via an AdaBoost-Based Digital Twin Framework. Journal of Advanced Transportation 2021, 2021. [Google Scholar] [CrossRef]
- Saanen, Y.A. Modeling Techniques in Planning of Terminals: The Quantitative Approach. In Handbook of Terminal Planning; Böse, J.W., Ed.; Springer International Publishing: Cham, 2020; pp. 49–71. [Google Scholar] [CrossRef]
- Yang, A.; Liu, Y.; Xin, C.; Chen, Q.; Wang, L. Towards intuitive visualisation goals for the operation optimisation of automated container terminal based on digital twin technology. Maritime Policy & Management. [CrossRef]
- Lou, P.; Zhong, Y.; Hu, J.; Fan, C.; Chen, X. Digital-Twin-Driven AGV Scheduling and Routing in Automated Container Terminals. Mathematics 2023, 11. [Google Scholar] [CrossRef]
- Gao, Y.; Chen, C.H.; Chang, D.; Chen, S.; Song, X.T. Machine Learning and Digital Twin-Based Path Planning for AGVs at Automated Container Terminals. Advances in Transdisciplinary Engineering, 2022, Vol. 28, p. 423 – 432. Cited by. [CrossRef]
- Zhang, Y.; Bao, X.; Zhang, L.; Chen, L.; Tang, X.; Zhang, Z.; Zheng, Y. Digital Twin Enhanced Reinforcement Learning for Integrated Scheduling in Automated Container Terminals*. 2023 IEEE 19th International Conference on Automation Science and Engineering (CASE). IEEE, 2023, pp. 1–6. [CrossRef]
- Wang, K.; Hu, Q.; Zhou, M.; Zun, Z.; Qian, X. Multi-aspect applications and development challenges of digital twin-driven management in global smart ports. Case Studies on Transport Policy 2021, 9, 1298–1312. [Google Scholar]
- Ding, Y.; Zhang, Z.; Chen, K.; Ding, H.; Voss, S.; Heilig, L.; Chen, Y.; Chen, X.; others. Real-Time Monitoring and Optimal Resource Allocation for Automated Container Terminals: A Digital Twin Application at the Yangshan Port. Journal of Advanced Transportation 2023, 2023. [Google Scholar] [CrossRef]
- Bozzo, R.; Derito, A.; Nurchi, R.; Ackroyd, N. MOCONT: a new system for container terminal monitoring and control. ITSC 2001. 2001 IEEE Intelligent Transportation Systems. Proceedings (Cat. No.01TH8585), 2001, pp. 1090–1094. [CrossRef]
- Boer, C.A.; Saanen, Y.A. Using simulation and emulation throughout the life cycle of a container terminal. 2017 Winter Simulation Conference (WSC), 2017, pp. 3126–3137. [CrossRef]
- Kastner, M.; Grasse, O.; Jahn, C. Container Flow Generation for Maritime Container Terminals. Dynamics in Logistics; Freitag, M., Kinra, A., Kotzab, H., Megow, N., Eds.; Springer International Publishing: Cham, 2022; pp. 133–143. [Google Scholar] [CrossRef]
- Schnabel, D. Pavements for Container Terminals. In Handbook of terminal planning; Böse, J.W., Ed.; Operations research, computer science interfaces series; Springer: Cham, CH, 2020; pp. 155–172. [Google Scholar] [CrossRef]
- Huang, C.; Bai, Y.; Lu, L. Hazard Analysis and Quantitative Risk Assessment of Port Operation for Dangerous Goods Container. IOP Conference Series: Materials Science and Engineering 2020, 780, 072027. [Google Scholar] [CrossRef]
- Tsolakis, N.; Zissis, D.; Papaefthimiou, S.; Korfiatis, N. Towards AI driven environmental sustainability: an application of automated logistics in container port terminals. International Journal of Production Research 2022, 60, 4508–4528. [Google Scholar]
- Sauer, P.; Seuring, S. Extending the reach of multi-tier sustainable supply chain management – Insights from mineral supply chains. International Journal of Production Economics 2019, 217, 31–43. [Google Scholar]
- Ekström, T.; Hilletofth, P.; Skoglund, P. Towards a purchasing portfolio model for defence procurement – A Delphi study of Swedish defence authorities. International Journal of Production Economics 2021, 233. [Google Scholar]
- Goodman, C. The Delphi technique: a critique. Journal of Advanced Nursing 1987, 6, 729–734. [Google Scholar]
- Linstone, H.; Turoff, M. The delphi method; Addison-Wesley, 1975.
- Okoli, C.; Pawlowski, S. The Delphi method as a research tool: An example, design considerations and applications. Information and Management 2004, 1, 15–29. [Google Scholar]
- Dohale, V.; Gunasekaran, A.; Akarte, M.; Verma, P. An integrated Delphi-MCDM-Bayesian Network framework for production system selection. International Journal of Production Economics 2021, 242. [Google Scholar]
- Kembro, J.; Näslund, D.; Olhager, J. Information sharing across multiple supply chain tiers: A Delphi study on antecedents. International Journal of Production Economics 2017, 193, 77–86. [Google Scholar]
- Landeta, J. Current validity of the Delphi method in social sciences. Technological Forecasting and Social Change 2006, 5, 467–482. [Google Scholar]
- Hasson, F.; Keeney, S. Enhancing rigour in the Delphi technique research. Technological Forecasting and Social Change 2011, 9, 1695–1704. [Google Scholar]
- Culot, G.; Orzes, G.; Sartor, M.; Nassimbeni, G. The future of manufacturing: A Delphi-based scenario analysis on Industry 4.0. Technological Forecasting and Social Change 2020, 157. [Google Scholar]
- Diamond, I.; Grant, R.; C, R.; Feldman, B.M.; Pencharz, P.B.; Ling, S.C.; Moore, A.M.; Wales, P.W. Defining consensus: A systematic review recommends methodologic criteria for reporting of Delphi studies. Journal of Clinical Epidemiology 2014, 67, 401–409. [Google Scholar]
- Blair, J.; Czaja, R.; Blair, E. Designing surveys: A guide to decisions and procedures; SAGE Publications, Inc, 2013.
- von der Gracht, H. Consensus measurement in Delphi studies. Review and implications for future quality assurance. Technological Forecasting and Social Change 2012, 8, 1525–1536. [Google Scholar]
- Gbededo, M.; Liyanage, K. Descriptive framework for simulation-aided sustainability decision-making: A Delphi study. Sustainable Production and Consumption 2020, 22, 45–57. [Google Scholar]
- Moeuf, A.; Lamouri, S.; Pellerin, R.; Tamayo-Giraldo, S.; Tobon-Valencia, E.; Eburdy, R. Identification of critical success factors, risks and opportunities of Industry 4.0 in SMEs. International Journal of Production Research 2020, 5, 1384–1400. [Google Scholar]
- Saporiti, N.; Cannas, V.; Pozzi, R.; Rossi, T. Challenges and countermeasures for digital twin implementation in manufacturing plants: A Delphi study. International Journal of Production Economics 2023, 261, 1–13. [Google Scholar] [CrossRef]
- Chen, Z.; Pak, M. A Delphi analysis on green performance evaluation indices for ports in China. Maritime Policy & Management 2017, 44, 537–550. [Google Scholar] [CrossRef]
Figure 1.
Delphi study methodology diagram
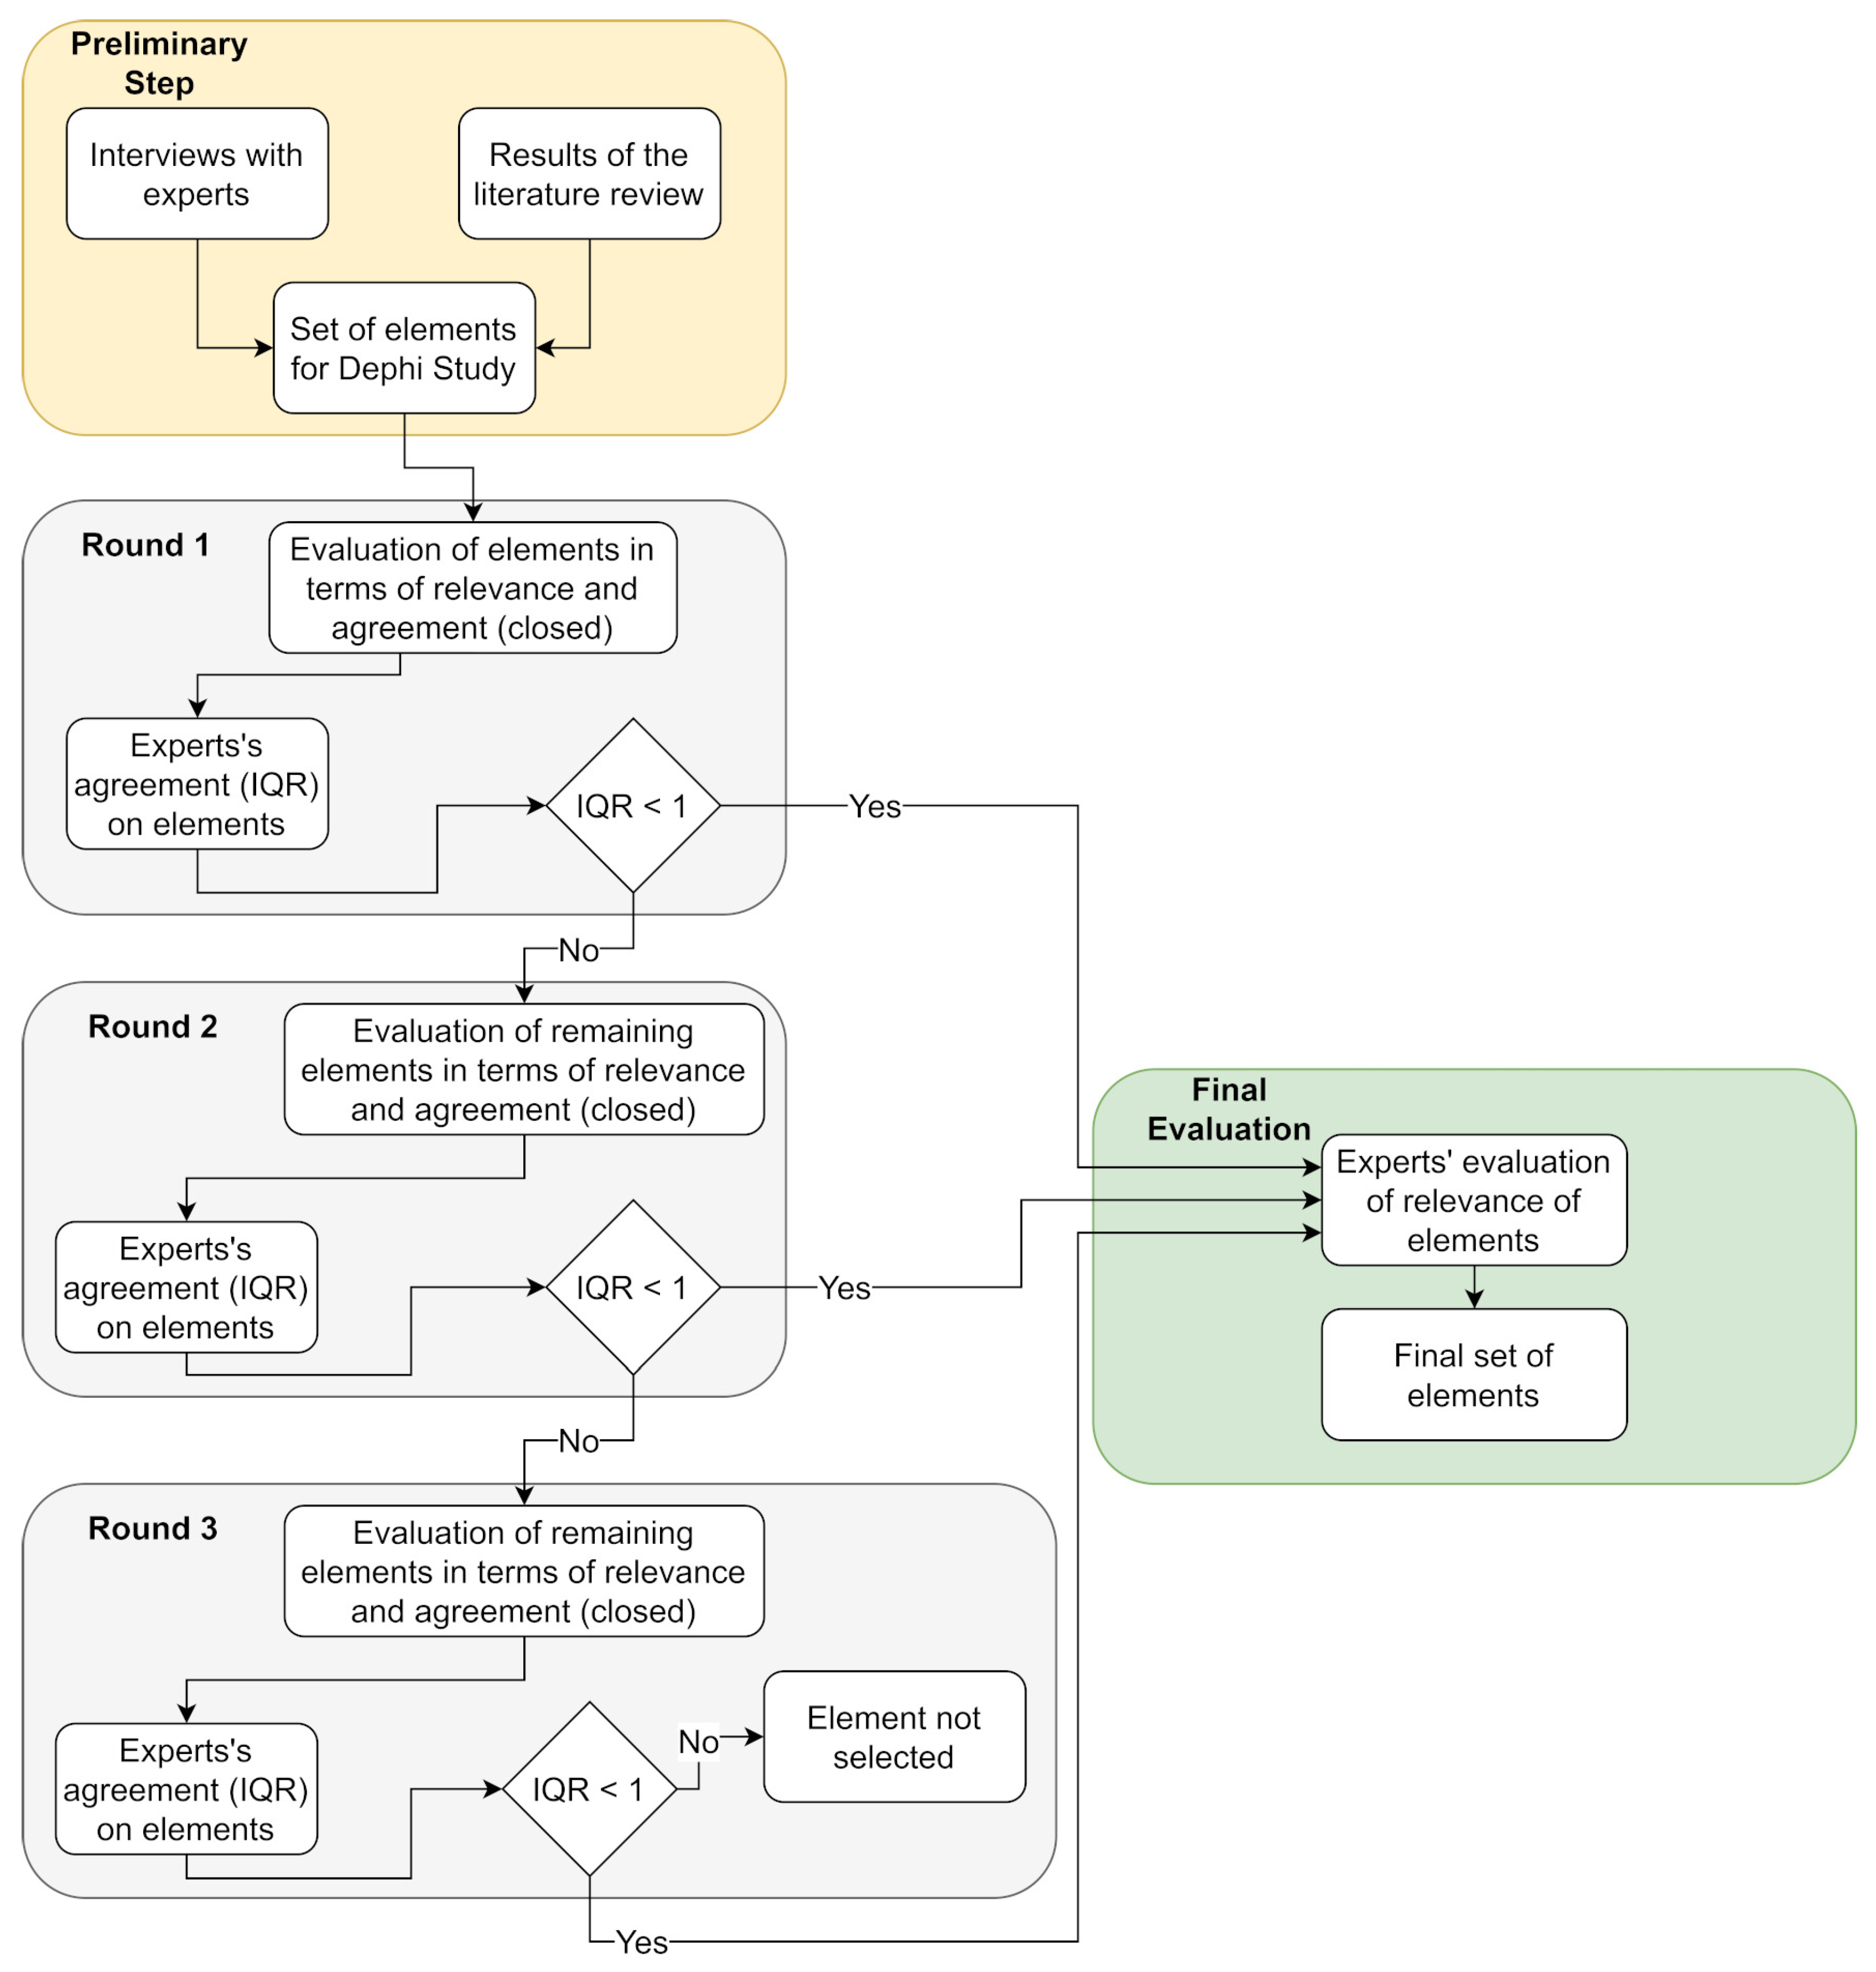
Figure 2.
Approval-Dispersion Matrix
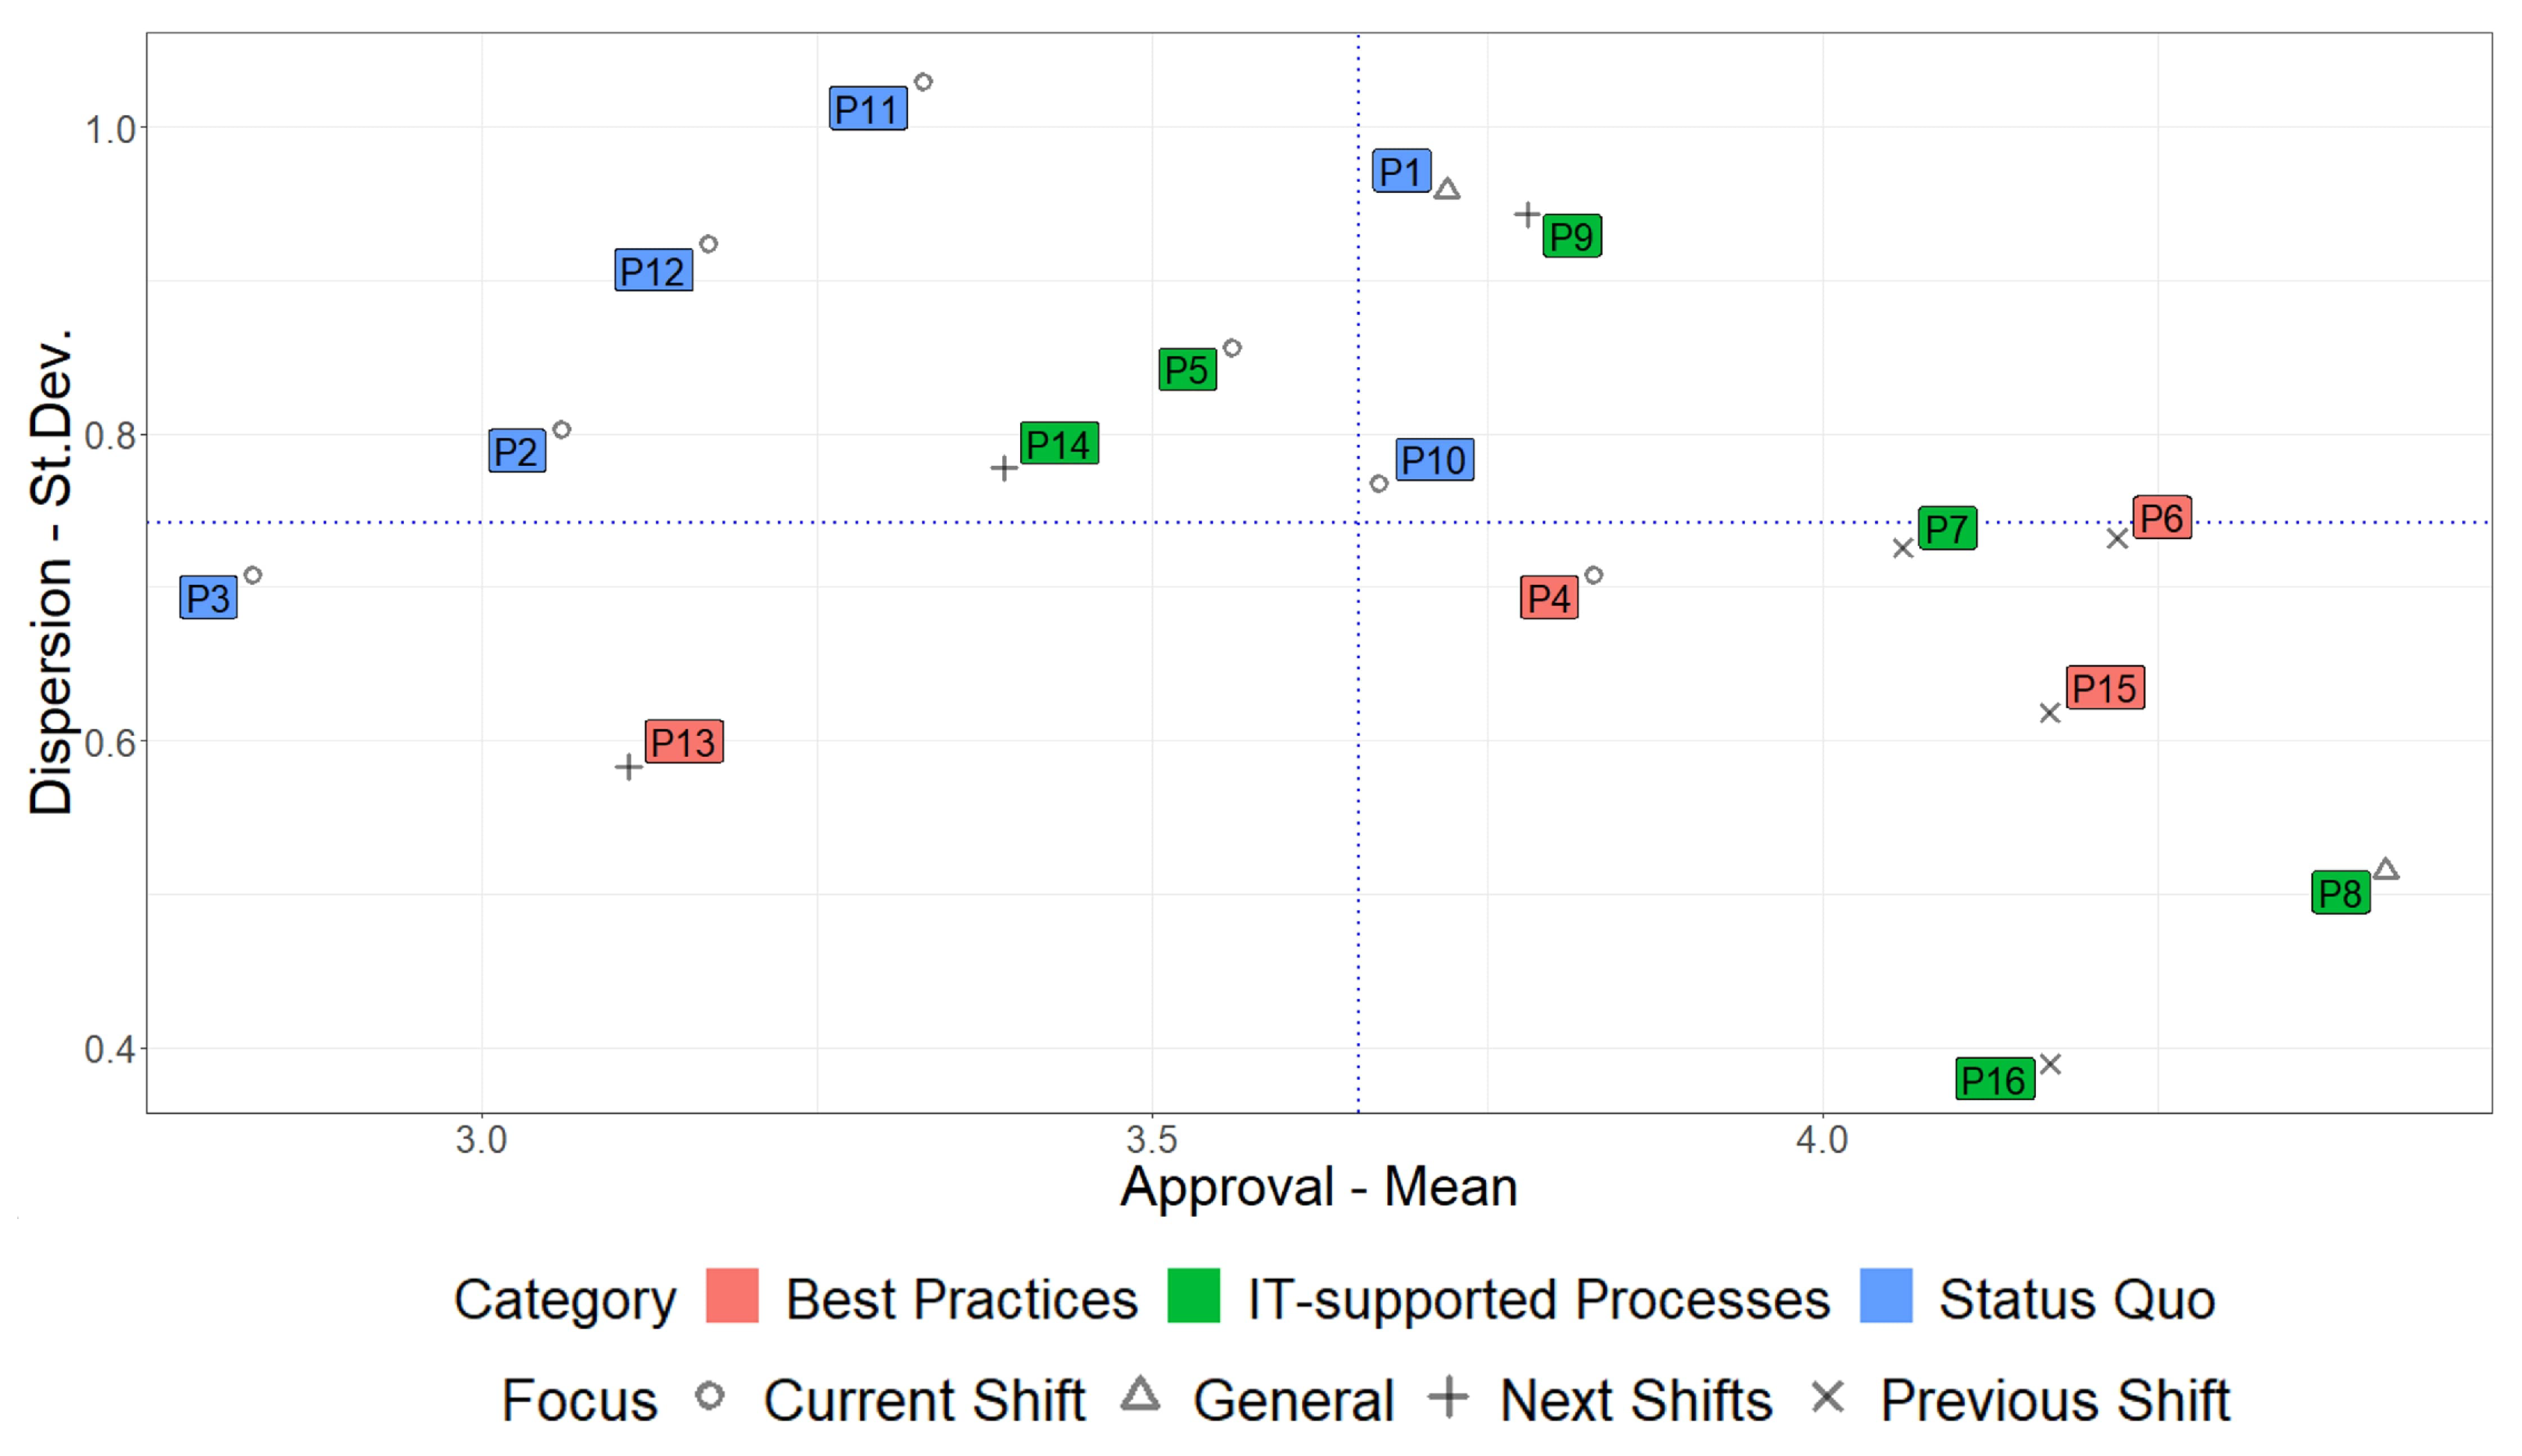

Table 1.
List of CVs
| Code | Region | Employer | Shortened CV / Research Focus |
| 1 | Eastern Europe | CT Operator |
|
| 2 | Northern America | Labour Organisation |
|
| 3 | Northern America | Port Consultant |
|
| 4 | Northern Europe | CT Operator |
|
| 5 | Northern Europe | Port Consultant |
|
| 6 | South America | CT Operator |
|
| 7 | South America | CT Operator |
|
| 8 | Southern Asia | CT Operator |
|
| 9 | Southern Asia | TOS Provider |
|
| 10 | Southern Europe | Academia |
|
| 11 | Southern Europe | CT Operator |
|
| 12 | Western Asia | CT Operator |
|
| 13 | Western Europe | Academia |
|
| 14 | Western Europe | CT Operator |
|
| 15 | Western Europe | Port Consultant |
|
| 16 | Western Europe | Port Consultant |
|
| 17 | Western Europe | TOS Provider |
|
Table 2.
List of Propositions
| No. | Category | Focus | Proposition |
| P1 | Status quo | General | Today’s TOS solutions consider the entire picture of terminal operations. This includes the terminal equipment as well as the ships, trains, and external trucks which visit the terminal. |
| P2 | Status quo | Current shift | Today’s TOS solutions are excellent in workload balancing – they take both internal and external vehicles into account. This successfully prevents waiting queues in front of cranes inside the terminal. |
| P3 | Status quo | Current shift | A modern TOS solution requires little to no manual intervention from the equipment operators or from the operations control room. Most to all processes are automated. |
| P4 | Best practices | Current shift | Centralising the control over container handling processes in a TOS solution (and thus limiting the degrees of freedom for the equipment operators) is essential for higher efficiency. |
| P5 | IT-supported processes | Current shift | A configurable 3-D visualisation of terminal operations in the control room enables the office staff to make smarter decisions and thus adds value to terminal operations. |
| P6 | Best practices | Previous shifts | When terminal operations do not meet the required performance indicators, it is crucial to examine the root cause in retrospect and to discuss the insights with the whole team. |
| P7 | IT-supported processes | Previous shifts | To find the root cause of poor operations, it is crucial to have proper visualisation tools to display the operational data in retrospect. Modern TOS solutions need to have a visual playback mode. |
| P8 | IT-supported processes | General | It is crucial not to tamper with the productive system when trying out new TOS add-ons or checking the effect of changes in the TOS configuration on terminal operations. A terminal needs a realistic emulation environment to digitally test changes under various productive scenarios. |
| P9 | IT-supported processes | Next shifts | Terminal operations can be improved by developing automated what-if analyses in daily decision-making processes. These analyses could, e.g., take the shape of ad-hoc simulation studies with short execution times. |
| P10 | Status quo | Current shift | Today’s TOS solutions lack the ability to properly account for the expected developments in the next hours, such as vessel schedules, planned maintenance tasks, shift changes, and similar. |
| P11 | Status quo | Current shift | Today’s TOS solutions support IMO container-specific handling processes and monitoring tasks well. The open tasks, such as applying dangerous goods labels to the containers as a service, are well communicated to the workforce. |
| P12 | Status quo | Current shift | Today’s TOS solutions support reefer-specific processes and monitoring tasks appropriately. The open tasks, such as plugging in and unplugging reefers, are well communicated to the workforce. |
| P13 | Best practices | Next shifts | To effectively plan the upcoming shifts, an Excel sheet with information on vessel arrivals and their call sizes is sufficient |
| P14 | IT-supported processes | Next shifts | When planning upcoming shifts, the planners need to consider many aspects. Only ad-hoc simulation studies which use terminal emulation can sufficiently account for the complexity of this task. |
| P15 | Best practices | Previous shifts | It is necessary to frequently check the adequacy of shift plans in retrospect. Especially when terminal performance indicators are missed within a shift, it is crucial to discuss this with the shift planning team. |
| P16 | IT-supported processes | Previous shifts | To find the root cause of poor shift plans, it is crucial to have proper visualisation tools to display the operational data in retrospect. Modern TOS solutions need to have a visual playback mode. |
Table 3.
Results.
| Prop. No. | Round 1 | Round 2 | Round 3 | Final Result | ||||||||||
| Mean | St.Dev. | IQR | IQR Pass | Mean | St.Dev. | IQR | IQR Pass | Mean | St.Dev. | IQR | IQR Pass | Mean | St.Dev. | |
| P1 | 3.72 | 0.96 | 0.75 | ✓ | 3.72 | 0.96 | ||||||||
| P2 | 3.11 | 1.13 | 2.00 | ✗ | 3.06 | 0.80 | 0.00 | ✓ | 3.06 | 0.80 | ||||
| P3 | 2.83 | 0.71 | 1.00 | ✗ | 2.83 | 0.71 | 1.00 | ✓ | 2.83 | 0.71 | ||||
| P4 | 3.50 | 0.86 | 1.00 | ✗ | 3.83 | 0.71 | 0.00 | ✓ | 3.83 | 0.71 | ||||
| P5 | 3.83 | 0.99 | 1.75 | ✗ | 3.56 | 0.86 | 0.75 | ✓ | 3.56 | 0.86 | ||||
| P6 | 4.44 | 0.62 | 1.00 | ✗ | 4.22 | 0.73 | 1.00 | ✓ | 4.22 | 0.73 | ||||
| P7 | 4.06 | 0.73 | 0.75 | ✓ | 4.06 | 0.73 | ||||||||
| P8 | 4.56 | 0.51 | 1.00 | ✗ | 4.00 | 1.08 | 1.75 | ✗ | 4.42 | 0.51 | 1.00 | ✓ | 4.42 | 0.51 |
| P9 | 4.22 | 0.73 | 1.00 | ✗ | 3.78 | 0.94 | 0.75 | ✓ | 3.78 | 0.94 | ||||
| P10 | 3.50 | 0.92 | 1.00 | ✗ | 3.67 | 0.77 | 1.00 | ✓ | 3.67 | 0.77 | ||||
| P11 | 3.44 | 0.78 | 1.00 | ✗ | 3.17 | 0.92 | 1.00 | ✓ | 3.17 | 0.92 | ||||
| P12 | 3.44 | 0.86 | 1.00 | ✗ | 3.33 | 1.03 | 1.00 | ✓ | 3.33 | 1.03 | ||||
| P13 | 1.89 | 0.58 | 0.00 | ✓ | 1.89 | 0.58 | ||||||||
| P14 | 3.67 | 0.84 | 1.00 | ✗ | 3.39 | 0.78 | 1.00 | ✓ | 3.39 | 0.78 | ||||
| P15 | 4.17 | 0.62 | 0.75 | ✓ | 4.17 | 0.62 | ||||||||
| P16 | 4.33 | 0.69 | 1.00 | ✗ | 3.94 | 0.80 | 1.75 | ✗ | 4.17 | 0.39 | 0.00 | ✓ | 4.17 | 0.39 |
Disclaimer/Publisher’s Note: The statements, opinions and data contained in all publications are solely those of the individual author(s) and contributor(s) and not of MDPI and/or the editor(s). MDPI and/or the editor(s) disclaim responsibility for any injury to people or property resulting from any ideas, methods, instructions or products referred to in the content. |
© 2024 by the authors. Licensee MDPI, Basel, Switzerland. This article is an open access article distributed under the terms and conditions of the Creative Commons Attribution (CC BY) license (https://creativecommons.org/licenses/by/4.0/).
Copyright: This open access article is published under a Creative Commons CC BY 4.0 license, which permit the free download, distribution, and reuse, provided that the author and preprint are cited in any reuse.


