

Submitted:
09 April 2024
Posted:
10 April 2024
You are already at the latest version
Abstract
The importance of conflict analysis and safety considerations during work zone intervals at signalized intersections cannot be overstated, as these periods pose unique challenges and safety risks for both motorists and pedestrians. Work zones introduce temporary changes to traffic patterns, lane configurations, and signal timings, which can disrupt the flow of traffic and increase the likelihood of conflicts between vehicles and pedestrians. By conducting comprehensive conflict analysis, it is possible to identify potential conflict points, such as merging areas, pedestrian crossings, and lane transitions, and implement targeted safety measures to mitigate risks. Additionally, considering safety considerations during work zone intervals is paramount to safeguarding the well-being of road users and minimizing the occurrence of conflicts or collisions. Measures such as enhanced signage, temporary traffic control devices, and increased enforcement efforts can help promote compliance with traffic regulations and ensure the safe passage of vehicles and pedestrians through work zones. This study investigates the dynamics of traffic behavior and safety implications within work zones at signalized intersections, aiming to address key challenges and enhance intersection management strategies. Through comprehensive analysis, varying frequencies of Vehicle-to-Vehicle (V2V) conflicts were observed across different movement directions, with significant occurrences identified in specific phases of the traffic signal cycle. Specifically, 69 V2V conflicts in phase #1, 181 in phase #2, 31 in phase #3, 207 in phase #4, 1 in phase #5, 274 in phase #6, 93 in phase #7, and 186 in phase #8 were recorded. Furthermore, the examination of Vehicle-to-Pedestrian (V2P) conflicts underscored the importance of prioritizing pedestrian safety, with notable occurrences observed in phases associated with pedestrian crossing movements. Meanwhile, despite the closure of left-turn movements, instances of red light running persisted, with 69 red light running events in phase #1, 181 in phase #2, 31 in phase #3, 207 in phase #4, 1 in phase #5, 274 in phase #6, 93 in phase #7, and 186 in phase #8.To mitigate these safety concerns during work zone intervals, proactive measures are essential. Strategies include improving communication through clear signage and advanced warning systems, enhancing enforcement efforts with red light cameras and increased police presence, and investing in infrastructure improvements such as temporary pedestrian facilities. Integration of real-time data from sensors, particularly LiDAR technology, offers significant advantages in detecting conflicts and red light runners during work zone intervals. LiDAR's precise, real-time data on vehicle and pedestrian movements, combined with its 360-degree coverage and high spatial resolution, facilitates accurate detection and tracking of potential conflict scenarios, contributing to enhanced intersection safety and traffic management efficiency. This study endeavored to conduct a traffic safety analysis during work zone intervals at a signalized intersection in Baltimore City, known for its high rate of traffic crashes, utilizing LiDAR sensor technology.
Keywords:
LiDAR Sensor
; Signalized Intersections
; Work Zone Safety
; Traffic Analysis
; Work Zone Management
Introduction
Signalized intersections serve as key nodes in transportation networks, facilitating the orderly flow of vehicular and pedestrian traffic [1,2,3,4]. They play a critical role in ensuring efficient mobility, enhancing safety, and regulating traffic movements. The significance of signalized intersections extends beyond mere connectivity; they are fundamental to urban and suburban transportation systems, impacting overall traffic performance and urban livability [5,6,7,8,9,10]. Consequently, any disruptions or modifications to these intersections, such as those caused by work zones, can have profound implications for traffic safety, efficiency, and user experience [11]. Safety considerations at signalized intersections are paramount, particularly when work zones are situated within their confines. Work zones positioned at the center of intersections pose unique challenges, significantly increasing the risk of crashes and traffic conflicts. Vehicles navigating through such intersections encounter turning limitations, exacerbated by the presence of work zones. The altered traffic patterns and reduced maneuvering space impose constraints on drivers, necessitating heightened vigilance and adherence to traffic regulations to mitigate potential hazards.
The location of work zones within signalized intersections also impacts traffic queues, leading to congestion and delays across various approaches [2,11]. The queue dynamics vary based on the positioning of the work zone, with differing implications for traffic flow and intersection performance. Vehicles approaching the intersection from different directions may experience varying degrees of delay, depending on their proximity to the work zone and the resultant traffic diversions. Queue dynamics are influenced not only by the physical location of the work zone but also by the intricate interplay of traffic patterns, signal timing, and driver behaviors. Vehicles approaching the intersection from upstream segments may experience queuing effects, as traffic congestion propagates backward along the roadway network. This phenomenon is particularly pronounced during peak hours when traffic volumes are at their highest, exacerbating delays and gridlock conditions. Additionally, the spatial configuration of the work zone within the intersection, such as its proximity to critical traffic lanes or pedestrian crosswalks, can further intensify queueing effects by impeding the efficient movement of vehicles and pedestrians.
Moreover, work zones within signalized intersections can trigger conflicts between vehicles-to-vehicle (V2V) and vehicle-to-pedestrian (V2P) interactions, particularly during peak hours. Morning and afternoon rush hours amplify these conflicts, as heightened traffic volumes intersect with the constraints imposed by the work zone. The potential for collisions and near-misses escalates, necessitating proactive measures to manage traffic interactions and enhance safety protocols within the work zone vicinity. Closure of left-turning directions due to work zones further exacerbates traffic disruptions, necessitating rerouting strategies to mitigate congestion and alleviate delays. The rerouting of vehicles entails complex logistical considerations, including alternative route selection, traffic signal synchronization, and communication of route modifications to drivers. Effective rerouting strategies are imperative to minimize traffic congestion and maintain overall traffic efficiency during work zone operations at signalized intersections. Hereupon, in this paper, the implications of work zones within signalized intersections is analyzed, focusing on safety considerations, traffic queue dynamics, and potential conflicts. This paper explores tactics to minimize traffic disturbances, incorporating rerouting methods and advanced safety measures, to streamline intersection operations and maintain smooth traffic flow. By tackling these obstacles, the study seeks to advance the implementation of proactive and adaptable approaches for overseeing work zones within signalized intersections, ultimately bolstering transportation efficacy and safety standards.
Methodology
This study focuses on the intersection of E Cold Spring Ln and Hillen Rd in Baltimore City, Maryland. Specifically, it examines the impact of a recent infrastructure project that necessitated the closure of the intersection's central area on April 5th, 2024. The closure was initiated to facilitate the replacement of sewage pipes, highlighting the intersection's vulnerability to work zone disruptions and its significance in the local transportation network. By analyzing the repercussions of this specific work zone instance, valuable insights can be gleaned into the challenges posed by such disruptions, including traffic congestion, safety concerns, and operational constraints. The chosen intersection serves as a microcosm for broader discussions on urban infrastructure maintenance and the critical need for effective management strategies to minimize disruptions and ensure the smooth functioning of transportation systems. Through a detailed examination of the E Cold Spring Ln – Hillen Rd intersection, this study aims to contribute to a deeper understanding of the complexities surrounding work zone management and inform future initiatives aimed at optimizing urban mobility and infrastructure maintenance practices. This intersection is monitored by a LiDAR sensor which has been installed on the pole (the purple circle location). The LiDAR data on April, 5th 2024 was analyzed to provide a practical accurate understanding of the intersection safety conditions. Figure 1 shows the intersection’s location. The installation location of the LiDAR sensor is shown by the purple circle.
In Figure 2, the precise location of the work zone and the extent of the intersection closure on April 5th are visually depicted. This graphical representation provides valuable spatial context for understanding the scope and impact of the work zone within the intersection. As can be seen in Figure 2, all left-turn approaches have been closed off due to the presence of the work zone, creating a significant disruption to normal traffic flow. This closure necessitates the implementation of rerouting measures to accommodate vehicles intending to make left turns. Specifically, drivers seeking to execute left-turn movements must now utilize designated U-Turn locations located along Cold Spring Lane in both westbound and eastbound directions. This rerouting strategy aims to maintain traffic fluidity and safety while mitigating the impacts of the intersection closure. By directing left-turning vehicles to alternate routes via U-Turn facilities, the traffic management plan seeks to minimize congestion and optimize the efficiency of the transportation network. The integration of U-Turn maneuvers as part of the rerouting strategy underscores the importance of strategic planning and coordination in managing work zone disruptions effectively. It is important to note that, despite the closure of left-turn movements, a substantial number of vehicles persist in attempting illegal left turns within the intersection. This behavior underscores the challenges inherent in enforcing traffic regulations and ensuring compliance with designated detour routes. Despite efforts to communicate the closure and rerouting instructions through signage, electronic message boards, and other communication channels, some drivers opt to disregard the prescribed detour and seek alternate routes through unauthorized left turns. This disregard for traffic regulations not only poses safety risks to motorists and pedestrians but also exacerbates congestion and delays within the work zone vicinity.
Utilizing LiDAR sensor installed at the intersection offers several significant advantages in efficiently collecting data on vehicle volume and detecting V2V (vehicle-to-vehicle) and V2P (vehicle-to-pedestrian) conflicts during the work zone interval (from 6 AM to 7 PM). LiDAR sensors provide precise and accurate measurements of vehicle positions and movements by emitting laser pulses and measuring their reflection off surrounding objects, creating detailed 3D maps of the intersection environment. This level of precision ensures that even in the complex traffic scenarios typical of work zone environments, LiDAR captures accurate data, enabling thorough analysis of traffic patterns and interactions. Moreover, LiDAR sensors offer full 360-degree coverage of the intersection, capturing data from all directions simultaneously. This comprehensive coverage ensures that no vehicles or potential conflicts go unnoticed, regardless of their position relative to the sensor. Real-time monitoring capabilities of LiDAR sensors provide continuous data streams throughout the duration of the work zone, facilitating immediate detection and response to traffic incidents or congestion. Additionally, LiDAR sensors are capable of accurately classifying different types of objects, including vehicles and pedestrians, based on their size, shape, and movement patterns. Furthermore, the robust performance of LiDAR sensors in diverse environmental conditions ensures reliable data collection and analysis throughout the work zone period.
The methodology for analyzing the effect of work zone on vehicle counts and conflicts utilizing LiDAR sensor technology involves a multi-step approach integrating data collection, statistical analysis, and interpretation. Firstly, LiDAR sensor continuously captured data on vehicle movements, including counts and trajectories, throughout the duration of the work zone period. The collected LiDAR data is then processed to extract relevant metrics such as vehicle counts, speeds, and trajectories, as well as the presence of potential conflicts between vehicles and pedestrians. Next, statistical analysis techniques are employed to examine the impact of the work zone on vehicle counts and conflicts. Descriptive statistics are used to summarize the collected data, providing insights into the overall traffic patterns and trends observed during the work zone period. This includes measures such as mean vehicle counts, distribution of vehicle speeds, and frequency of conflict events. Additionally, inferential statistical tests, such as t-tests or ANOVA, were utilized to compare vehicle counts and conflict rates between different time periods (e.g., before, during, and after the work zone) or between different intersection movements configurations (e.g., with and without left-turn closures). These tests help identify statistically significant differences in traffic behavior attributable to the presence of the work zone. Furthermore, spatial analysis techniques were employed to assess the spatial distribution of vehicle counts and conflicts within the intersection. This involves mapping the LiDAR-derived data onto a geographic information system (GIS) platform and conducting spatial statistical analysis to identify hotspots or areas of heightened activity. By overlaying the work zone boundaries onto the spatial distribution maps, the impact of the work zone on traffic patterns and conflict zones are visually analyzed and quantified.
Data Analysis
Vehicles and Pedestrian Counts Data
To analyze the hourly vehicle volumes encompassing passenger cars, trucks, and buses from 6 AM to 7 PM, a systematic approach was undertaken. Utilizing data collected by LiDAR sensors installed at the intersection undergoing work zone activities, hourly vehicle counts were meticulously recorded and categorized into different vehicle types [12,13,14,15,16]. Each vehicle passing through the intersection during the specified timeframe was classified based on its size and characteristics, distinguishing between passenger cars, trucks, and buses. The data collection process ensured comprehensive coverage of vehicle movements throughout the entire duration of the work zone, allowing for a detailed analysis of hourly traffic patterns. Following data collection, statistical techniques were employed to analyze the hourly vehicle volumes across the specified time period. Descriptive statistics, such as mean, median, and standard deviation, were computed to summarize the hourly vehicle counts for each vehicle type. This facilitated the identification of peak traffic hours and variations in vehicle volumes throughout the day. Additionally, graphical representations, such as line charts were generated to visualize the temporal distribution of vehicle volumes, providing insights into traffic flow dynamics and potential fluctuations associated with peak commuting hours or other temporal factors. Figure 3, Figure 4, Figure 5 and Figure 6 illustrate the hourly integrated vehicle volumes in southbound, northbound, westbound, and eastbound approaches, respectively.
Vehicle-Vehicle (V2V) Conflicts Data
The collection and analysis of Vehicle-Vehicle (V2V) conflicts data during work zone activities play a crucial role in ensuring the safety and efficiency of traffic operations. By systematically monitoring and documenting instances of V2V conflicts, transportation authorities and planners gain valuable insights into the potential risks and hazards present within the work zone environment. V2V conflicts encompass a wide range of scenarios, including rear-end collisions, side-swipes, and near-misses between vehicles navigating through the work zone. Analyzing these conflicts provides a comprehensive understanding of the factors contributing to traffic incidents, such as inadequate signage, lane closures, or driver behavior, allowing for targeted interventions and mitigating measures to be implemented. Furthermore, V2V conflicts data serve as a vital tool for evaluating the effectiveness of traffic management strategies and safety measures deployed within the work zone. By quantifying the frequency and severity of conflicts over time, transportation authorities can assess the impact of different interventions, such as temporary traffic control devices, speed restrictions, or lane configurations, on reducing conflict rates and enhancing overall safety. This data-driven approach enables evidence-based decision-making and facilitates the refinement of work zone designs and traffic management plans to optimize safety outcomes. Moreover, analyzing V2V conflicts data allows for proactive identification of potential hotspots or high-risk areas within the work zone, enabling targeted interventions to be implemented to mitigate risks and improve traffic flow.
The V2V conflicts collected by the LiDAR sensor from 06:00 AM to 07:00 PM underwent a detailed analysis to ascertain patterns and trends in traffic interactions within the work zone. This analysis involved examining the frequency, severity, and spatial distribution of V2V conflicts occurring during the specified timeframe. Moreover, the analysis aimed to identify the highest-risk zones within the work zone environment based on the location and intensity of V2V conflicts. By overlaying the spatial data on work zone boundaries and traffic control measures, transportation authorities pinpointed areas prone to elevated conflict rates and safety hazards. This process facilitated the identification of critical intervention points where targeted measures, such as enhanced signage, traffic signal adjustments, or temporary traffic calming measures, could be implemented to mitigate risks and improve safety outcomes. Furthermore, the analysis enabled the prioritization of resources and interventions based on the severity and frequency of conflicts, ensuring that efforts were directed towards addressing the most pressing safety concerns within the work zone. Table 1 demonstrates the frequency and severity of V2V conflicts by leading movements during the work zone time interval.
As shown in Table 1, 302 V2V conflicts were collected by the LiDAR sensor during the work zone interval. The provided data presents a breakdown of conflicts between leading and following movements observed during the work zone time interval from 06:00 AM to 07:00 PM. Each conflict is categorized based on the direction of the leading movement (e.g., eastbound, westbound) and the subsequent following movement (e.g., northbound, southbound). The frequency of conflicts occurring between each pair of movements is also documented, providing valuable insights into traffic interactions within the work zone environment. Analyzing the data reveals several notable patterns and trends in V2V conflicts during the specified time interval. For instance, the most frequent conflicts occur between EW-WN, WN-EW, and WE-ES movements, with a total of 138, 60, and 41 conflicts, respectively. The high frequency can be attributed to the intersection's layout and traffic flow patterns, where vehicles traveling in opposite directions are more likely to encounter each other, particularly during peak traffic hours. Similarly, conflicts between westbound left (ES) and southbound left (NE) movements, as well as between westbound left (ES) and eastbound left (WN) movements, are also relatively common. These conflicts may arise due to the intersection's configuration, or temporary traffic control measures implemented during the work zone period. The persistence of left-turn conflicts at the intersection despite the closure of left-turn movements during the work zone period can be attributed to several potential reasons:
- Driver Non-Compliance: Despite the closure of left-turn movements, some drivers may still attempt to make illegal left turns due to familiarity with previous traffic patterns or a disregard for traffic regulations. These non-compliant behaviors can lead to conflicts with vehicles traveling in opposing directions or proceeding straight through the intersection.
- Confusion or Misinterpretation: Drivers may misinterpret signage or temporary traffic control measures indicating the closure of left-turn movements, leading to unintentional left-turn attempts. Confusion about alternative routes or temporary detour instructions may also contribute to drivers inadvertently entering left-turn lanes, resulting in conflicts with other vehicles.
- Navigation Errors: Some drivers may rely on GPS navigation systems that are not updated to reflect the closure of left-turn movements due to the work zone. As a result, these drivers may follow outdated routing instructions that direct them to make left turns despite the closure, leading to conflicts with other vehicles.
- Illegal Maneuvers by Pedestrians or Cyclists: Pedestrians or cyclists may also contribute to left-turn conflicts by illegally crossing the intersection or navigating through restricted areas designated for vehicles. Their presence in left-turn lanes or crossing paths with turning vehicles can increase the likelihood of conflicts and safety hazards.
Figure 9 illustrates the V2V conflicts heat map during the work zone interval.
Vehicle-Pedestrian (V2P) Conflicts Data
The collection and analysis of Vehicle-pedestrian (V2P) conflicts data during work zone activities are paramount for ensuring the safety of both motorists and pedestrians. V2P conflicts represent instances where vehicles and pedestrians interact within the work zone environment, potentially leading to accidents or near-misses. By systematically documenting and analyzing these conflicts, it is possible to gain valuable insights into the dynamics of traffic-pedestrian interactions and identify areas of heightened risk within the work zone. V2P conflicts data serve as a critical tool for evaluating the effectiveness of existing safety measures and informing the development of targeted interventions to enhance pedestrian safety within work zones. By quantifying the frequency and severity of conflicts, it is possible to assess the impact of factors such as signage visibility, pedestrian crossing configurations, and traffic control measures on V2P interaction patterns [17]. This evidence-based approach facilitates the refinement of work zone designs and safety protocols to minimize the risk of accidents and improve pedestrian mobility. Additionally, analyzing V2P conflicts data allows for the identification of high-risk areas or intersections within the work zone where targeted interventions, such as enhanced signage, pedestrian barriers, or speed reduction measures, may be warranted to mitigate safety hazards. Table 2 demonstrates the frequency and severity of V2P conflicts during the work zone time interval.
In both Table 1 and Table 2, Post Encroachment Time (PET) was utilized as a pivotal surrogate safety measure for evaluating both Vehicle-to-Vehicle (V2V) and Vehicle-to-Pedestrian (V2P) conflicts within the work zone environment. PET refers to the duration of time between a vehicle's passage through a conflict zone, such as an intersection, and the subsequent passage of another vehicle or pedestrian. It serves as a crucial indicator of potential collision risk, with shorter PET values indicating a higher likelihood of conflicts and increased safety concerns. During the work zone intervals, PET values may exhibit fluctuations, influenced by various factors that impact traffic flow and pedestrian movements. One key reason for the increase or decrease in PET values during work zone intervals is the alteration of traffic patterns and flow dynamics resulting from lane closures, detours, or reduced roadway capacity. Lane closures or temporary traffic control measures may redirect vehicular traffic, altering the timing and frequency of conflicts at intersections or pedestrian crossings. Additionally, changes in traffic signal timing or the presence of flaggers directing traffic within the work zone can affect the timing of vehicle-pedestrian interactions, thereby influencing PET values. Moreover, the implementation of temporary pedestrian accommodations, such as temporary crosswalks or pedestrian barriers, may also impact PET values by altering pedestrian behavior and interaction patterns with vehicular traffic.
As demonstrated in Table 2, a notable prevalence of V2P conflicts was observed in association with movements corresponding to eastbound left (=WN), southbound through (=NS), and northbound through (=SN) directions. Such conflicts represent critical safety concerns, as they involve potential interactions between vehicles and pedestrians, posing risks of accidents or collisions. During work zone intervals, the significant frequency of V2P conflicts associated with WN, NS, and SN movements may be influenced by various factors contributing to pedestrian-vehicle interactions. One key factor is pedestrian activity patterns, with higher foot traffic volumes observed in areas adjacent to pedestrian crossings, transit stops, or access points to adjacent properties. Additionally, the configuration of pedestrian pathways or crossing facilities within the work zone, such as the presence of temporary sidewalks or pedestrian detours, may influence the likelihood of V2P conflicts occurring along specific movement directions. Moreover, variations in vehicle speeds, traffic signal timing, and driver behavior can also impact the frequency of V2P conflicts, with higher conflict rates often observed in areas characterized by congestion, reduced visibility, or limited sightlines. Figure 10 illustrates the V2P heat map during the work zone intervals.
Red Light Runners Analysis
Red light runners represent a significant safety concern at signalized intersections, posing risks to both motorists and pedestrians. These drivers disregard traffic signals and proceed through intersections despite facing a red signal indication. The prevalence of red light runners can be attributed to various factors, particularly during work zone intervals, where the likelihood of such behavior may increase. One primary reason for red light running during work zone intervals is the disruption of typical traffic patterns and the introduction of temporary traffic control measures. Lane closures, detours, and altered signal timing within work zones can lead to confusion among drivers, increasing the likelihood of misjudging signal phases or failing to recognize red light indications. Additionally, the presence of construction equipment, signage, and temporary barriers may obscure visibility and distract drivers, further contributing to instances of red light running. Moreover, during work zone intervals, the need for increased attention to navigational cues and route deviations may lead to cognitive overload or distraction among drivers, diminishing their ability to perceive and respond to traffic signals effectively. The urgency to navigate through unfamiliar or congested routes within work zones may also incentivize risky driving behaviors, such as speeding up to beat changing signal phases or attempting to clear intersections despite facing red lights [18,19,20]. Furthermore, the heightened stress and frustration associated with delays or congestion within work zones may exacerbate impulsive decision-making among some drivers, leading to reckless maneuvers and red light violations in an attempt to expedite their journey.
Addressing the issue of red light runners at signalized intersections during work zone intervals necessitates a multi-faceted approach. Implementing enhanced signage, temporary traffic control devices, and advanced warning systems can help provide clear guidance to drivers approaching work zones, reducing confusion and the likelihood of red light running. Additionally, increasing enforcement efforts and deploying automated enforcement technologies, such as red light cameras, can serve as deterrents to red light violations, promoting compliance with traffic signals and enhancing overall intersection safety. Education campaigns targeting motorists about the risks of red light running and the importance of adhering to traffic regulations, particularly during work zone intervals, can also raise awareness and foster a culture of responsible driving behavior. By addressing the root causes of red light running and implementing proactive measures to mitigate risks, it is possible to enhance safety and reduce the incidence of traffic violations at signalized intersections, contributing to improved road safety for all road users.
LiDAR technology offers a promising avenue for detecting red light runners at signalized intersections, particularly during work zone intervals. LiDAR sensors emit laser pulses and measure their reflection off surrounding objects, creating detailed 3D maps of the environment. This technology enables precise detection and tracking of moving objects, including vehicles, pedestrians, and cyclists, within the intersection area. During work zone intervals, LiDAR sensors can play a crucial role in detecting red light runners by continuously monitoring vehicle movements approaching the intersection. LiDAR technology allows for real-time analysis of vehicle trajectories and speeds, enabling the identification of vehicles that fail to stop at red signal indications. By comparing vehicle positions and velocities against the timing of signal phases, LiDAR sensors can flag instances where vehicles enter the intersection during the red signal phase, indicative of red light running behavior. Furthermore, LiDAR sensors offer the advantage of 360-degree coverage and high spatial resolution, allowing for comprehensive monitoring of all approaches to the intersection. This ensures that red light violations are captured from various angles and perspectives, regardless of the vehicle's entry point into the intersection. Additionally, LiDAR sensors operate effectively in diverse environmental conditions, including low light and adverse weather, ensuring reliable detection capabilities even during challenging work zone conditions. Integration with advanced data processing algorithms enables LiDAR sensors to distinguish between vehicles, pedestrians, and other objects within the intersection area, reducing false positives and enhancing the accuracy of red light violation detection. Moreover, LiDAR data can be seamlessly integrated with other sensor data, such as video cameras or radar systems, through data fusion techniques, further enhancing the robustness and effectiveness of red light runner detection systems. In order to comprehensively evaluate the occurrence of red light runners across various phases of the traffic signal cycle, a detailed analysis of the frequency of red light violations was conducted. This investigation aimed to provide insights into the patterns and trends of red light running behavior exhibited by motorists at signalized intersections. Each red light violation was analyzed in relation to the specific phase of the traffic signal cycle during which it occurred, allowing for the identification of temporal patterns and trends in red light running behavior. This granular approach facilitated the identification of critical time periods or signal phases associated with higher frequencies of red light violations, providing valuable insights for targeted enforcement efforts and safety interventions aimed at mitigating the risk of collisions and improving intersection safety. Figure 11 illustrates different phases of the traffic signal at E Cold Spring Ln – Hillen Rd intersection.
The red light runners’ analysis demonstrated that 69 events in phase #1, 181 events in phase #2, 31 events in phase #3, 207 events in phase #4, 1 event in phase #5, 274 events in phase #6, 93 events in phase #7, and 186 events were collected in phase #8. The analysis of red light runners across different phases of the traffic signal cycle revealed varying frequencies of violations occurring in each direction. Phase #1, which corresponds to northbound left movements, recorded 69 red light running events. This phenomenon could be attributed to several factors, despite the closure of left-turn movements. One potential reason is the presence of residual traffic habits or confusion among drivers who may have been accustomed to making left turns at the intersection prior to the closure. Additionally, some drivers may attempt to navigate through the intersection illegally to access nearby destinations, disregarding the closure and risking red light violations in the process. Figure 12 shows the duration and frequency of red light runners in phase #1 during the work zone interval.
In phase #2, encompassing southbound right and through movements, a higher frequency of red light running events was observed, totaling 181 occurrences. This trend may be influenced by the prevalence of through traffic along the southbound direction, with drivers potentially underestimating the yellow signal duration or misjudging their ability to safely proceed through the intersection before the onset of the red signal. Additionally, aggressive driving behaviors or time pressures associated with work zone congestion may contribute to an increased propensity for red light running among southbound motorists. Figure 13 shows the duration and frequency of red light runners in phase #2 during the work zone interval.
In phase #3, corresponding to westbound left movements, the presence of red light runners despite the closure of left-turn movements could stem from various factors. Despite the closure, some drivers may attempt illegal left turns due to habit or familiarity with previous traffic patterns at the intersection. Additionally, inadequate signage or temporary traffic control measures may fail to effectively communicate the closure, leading to confusion among drivers and an increased likelihood of red light violations. Moreover, drivers may opt to disregard the closure to access nearby destinations or navigate through the work zone, prioritizing convenience over compliance with traffic regulations. Figure 14 shows the duration and frequency of red light runners in phase #3 during the work zone interval.
Moving to phase #4, encompassing eastbound through and right movements, the prevalence of red light runners (207 events) suggests potential challenges associated with managing traffic flow during the work zone period. Aggressive driving behaviors or time pressures may motivate motorists to attempt to clear the intersection before the onset of the red signal, particularly in the absence of enforcement measures. Additionally, altered traffic patterns or lane configurations within the work zone may contribute to driver confusion or frustration, increasing the likelihood of red light violations among eastbound motorists. Figure 15 illustrates the duration and frequency of red light runners in phase #4 during the work zone interval.
In phase #5, which represents southbound left movements, the occurrence of one red light violation may still pose safety concerns despite the closure of left-turn movements. This outlier event could be attributed to factors such as driver distraction, misjudgment, or disregard for traffic regulations. Even with left-turn movements closed, some drivers may attempt illegal turns due to habit or a lack of awareness of the closure. Additionally, enforcement efforts or signage may be insufficient to deter red light running behavior effectively, allowing for isolated instances of non-compliance to occur.
Moving to phase #6, corresponding to northbound through and right movements, the significant frequency of red light violations (274 events) highlights potential challenges in managing traffic flow during the work zone period. Aggressive driving behaviors, impatience, or time pressures may motivate motorists to disregard the red signal in an attempt to expedite their journey. Additionally, altered traffic patterns or lane configurations within the work zone may contribute to driver confusion or frustration, leading to an increased propensity for red light violations among northbound motorists. Figure 16 illustrates the duration and frequency of red light runners in phase #6 during the work zone interval.
In phase #7, representing eastbound left movements, the presence of red light runners may indicate challenges in effectively communicating the closure of left-turn movements to drivers. Despite the closure, some motorists may attempt illegal left turns due to habit, familiarity with previous traffic patterns, or a lack of awareness of the closure. Inadequate signage or enforcement efforts may fail to deter red light running behavior effectively, allowing for instances of non-compliance to occur among eastbound motorists. Figure 17 illustrates the duration and frequency of red light runners in phase #7 during the work zone interval.
Finally, in phase #8, corresponding to westbound through and right movements, the occurrence of 186 red light violations suggests potential challenges in managing traffic flow and ensuring compliance with signal indications. Aggressive driving behaviors, impatience, or time pressures may motivate motorists to attempt to clear the intersection before the onset of the red signal, particularly in the absence of enforcement measures. Additionally, altered traffic patterns or lane configurations within the work zone may contribute to driver confusion or frustration, increasing the likelihood of red light violations among westbound motorists. Figure 18 shows the duration and frequency of red light runners in phase #8 during the work zone interval.
Conclusion
The investigation into the dynamics of traffic behavior and safety challenges within work zones at signalized intersections has yielded several key insights. Firstly, the analysis of V2V conflicts revealed varying frequencies across different movement directions, with notable occurrences observed in phases associated with through movements and right turns. Despite the closure of left-turn movements, instances of red light running persisted, particularly in directions where through traffic prevailed. This persistence may stem from factors such as residual traffic habits, inadequate signage, or driver distraction, emphasizing the need for enhanced communication and enforcement measures during work zone intervals.
The assessment of V2P conflicts further underscored the importance of prioritizing pedestrian safety within work zones, with significant occurrences observed in directions corresponding to pedestrian crossing movements. The closure of left-turn movements did not entirely eliminate red light violations or conflicts involving left-turning vehicles, suggesting the need for comprehensive safety measures and public awareness campaigns to address non-compliant behavior. Additionally, the presence of red light runners highlights the importance of enforcing traffic regulations and implementing proactive measures, such as automated enforcement technologies or enhanced signage, to deter risky driving behaviors.
To mitigate V2V and V2P conflicts during work zones, several strategies can be considered. Firstly, improving communication through clear and visible signage, coupled with advanced warning systems, can help alert drivers to changes in traffic patterns and temporary restrictions. Secondly, enhancing enforcement efforts, including the deployment of red light cameras and increased police presence, can serve as deterrents to red light violations and reckless driving behaviors. Furthermore, investing in infrastructure improvements, such as temporary pedestrian facilities and protected work zones, can help minimize the risk of conflicts between vehicles and pedestrians.
One promising technology that offers significant advantages in detecting conflicts and red light runners during work zone intervals is LiDAR. LiDAR sensors provide precise, real-time data on vehicle and pedestrian movements, enabling proactive monitoring and detection of potential conflicts. Unlike traditional methods, LiDAR offers 360-degree coverage and high spatial resolution, allowing for comprehensive surveillance of the intersection area. Moreover, LiDAR operates effectively in diverse environmental conditions, ensuring reliable detection capabilities even in low light or adverse weather conditions. Furthermore, LiDAR's ability to generate detailed 3D maps of the environment facilitates accurate detection and tracking of moving objects, enabling rapid identification of red light runners and potential conflict scenarios. Integration with advanced data processing algorithms enables LiDAR sensors to distinguish between different types of road users and minimize false positives, enhancing the accuracy and reliability of conflict detection systems.
As for future works, ongoing research efforts should focus on developing advanced technologies and predictive analytics to anticipate and mitigate safety risks within work zones. Integrating real-time data from sensors, including LiDAR and video cameras, can enable proactive detection of potential conflicts and facilitate targeted interventions to enhance safety. Additionally, exploring innovative approaches, such as connected and automated vehicles, can offer new opportunities for optimizing traffic flow and reducing the likelihood of conflicts at signalized intersections. Ultimately, a multidisciplinary approach encompassing engineering, technology, and behavioral sciences will be essential for addressing the complex challenges of managing work zones and ensuring the safety and efficiency of transportation systems in the future.
References
- Yang, D.; Zhou, X.; Su, G.; Liu, S. Model and simulation of the heterogeneous traffic flow of the urban signalized intersection with an island work zone. IEEE Transactions on intelligent transportation systems 2018, 20, 1719–1727. [Google Scholar] [CrossRef]
- Zhao, J.; Kigen, K. K.; Xia, X. An alternative design for traffic intersections with work zones by using pre-signals. Journal of Intelligent Transportation Systems 2022, 26, 168–182. [Google Scholar] [CrossRef]
- Essa, M.; Sayed, T. Traffic conflict models to evaluate the safety of signalized intersections at the cycle level. Transportation research part C: emerging technologies 2018, 89, 289–302. [Google Scholar] [CrossRef]
- Srinivasan, R.; Council, F.; Lyon, C.; Gross, F.; Lefler, N.; Persaud, B. Safety effectiveness of selected treatments at urban signalized intersections. Transportation Research Record 2008, 2056, 70–76. [Google Scholar] [CrossRef]
- Lyon, C.; Haq, A.; Persaud, B.; Kodama, S. T. Safety performance functions for signalized intersections in large urban areas: Development and application to evaluation of left-turn priority treatment. Transportation research record 2005, 1908, 165–171. [Google Scholar]
- Ansariyar, A. (2022). "Investigating the Car-Pedestrian Conflicts Based on an Innovative Post Encroachment Time Threshold (PET) Classification." Available at SSRN 4377745, Available at SSRN: https://ssrn.com/abstract=4377745 or http://dx.doi.org/10.2139/ssrn.4377745. [CrossRef]
- Ansariyar, A.; Taherpour, A. (2023). Statistical analysis of vehicle-vehicle conflicts with a LIDAR sensor in a signalized intersection. Advances in Transportation Studies, 60.
- Ansariyar, A.; Taherpour, A. (2023). Investigating the accuracy rate of vehicle-vehicle conflicts by LIDAR technology and microsimulation in VISSIM and AIMSUN. Advances in Transportation Studies, 61.
- Ansariyar, A. Ardeshiri, A; Jeihani, M.; (2023). "Investigating the collected vehicle-pedestrian conflicts by a LIDAR sensor based on a new Post Encroachment Time Threshold (PET) classification at signalized intersections." Advances in Transportation Studies 61: 103-118. Available at: https://www.atsinternationaljournal.com/index.php/2023-issues/lxi-november-2023/1442-investigating-the-collected-vehicle-pedestrian-conflicts-by-a-lidar-sensor-based-on-a-new-post-encroachment-time-threshold-pet-classification-at-signalized-intersections.
- Essa, M.; Sayed, T.; Reyad, P. Transferability of real-time safety performance functions for signalized intersections. Accident Analysis & Prevention 2019, 129, 263–276. [Google Scholar]
- Yang, H.; Ozbay, K.; Ozturk, O.; Xie, K. Work zone safety analysis and modeling: a state-of-the-art review. Traffic injury prevention 2015, 16, 387–396. [Google Scholar] [CrossRef] [PubMed]
- Ansariyar, A. (2023). Providing a comprehensive traffic safety analysis collected by two LiDAR sensors at a signalized intersection. [CrossRef]
- Ansariyar, A. (2023). Real-time Traffic Control and Safety Measures Analysis Using LiDAR Sensor during Traffic Signal Failures. Available at SSRN 4591914. [CrossRef]
- Ansariyar, A. (2022). Investigating the Car-Pedestrian Conflicts Based on an Innovative Post Encroachment Time Threshold (PET) Classification. Available at SSRN 4377745, https://ssrn.com/abstract=4377745 , https://dx.doi.org/10.2139/ssrn.4377745. [CrossRef]
- ANSARIYAR, A.; JEIHANI, M. STATISTICAL ANALYSIS OF JAYWALKING CONFLICTS BY A LIDAR SENSOR. Scientific Journal of Silesian University of Technology. Series Transport 2023, 120, 17–36. [Google Scholar] [CrossRef]
- Ansariyar, A. (2023). Enhancing Intersection Efficiency Through Smart Green Time Allocation at a Signalized Intersection Equipped with two LiDAR Sensors. [CrossRef]
- Kuşkapan, E.; Sahraei, M. A.; Çodur, M. K.; Çodur, M. Y. Pedestrian safety at signalized intersections: Spatial and machine learning approaches. Journal of Transport & Health 2022, 24, 101322. [Google Scholar]
- Almallah, M.; Hussain, Q.; Alhajyaseen, W. K.; Pirdavani, A.; Brijs, K.; Dias, C.; Brijs, T. Improved traffic safety at work zones through animation-based variable message signs. Accident Analysis & Prevention 2021, 159, 106284. [Google Scholar]
- Qiao, F.; Jia, J.; Yu, L. (2013). A short range vehicle to infrastructure system at work zones and intersections. In 20 th ITS World Congress, Japan.
- Liu, Y.; Chang, G. L.; Tao, R.; Hicks, T.; Tabacek, E. Empirical observations of dynamic dilemma zones at signalized intersections. Transportation Research Record 2007, 2035, 122–133. [Google Scholar] [CrossRef]
Figure 1.
E Cold Spring Ln – Hillen Rd Intersection.
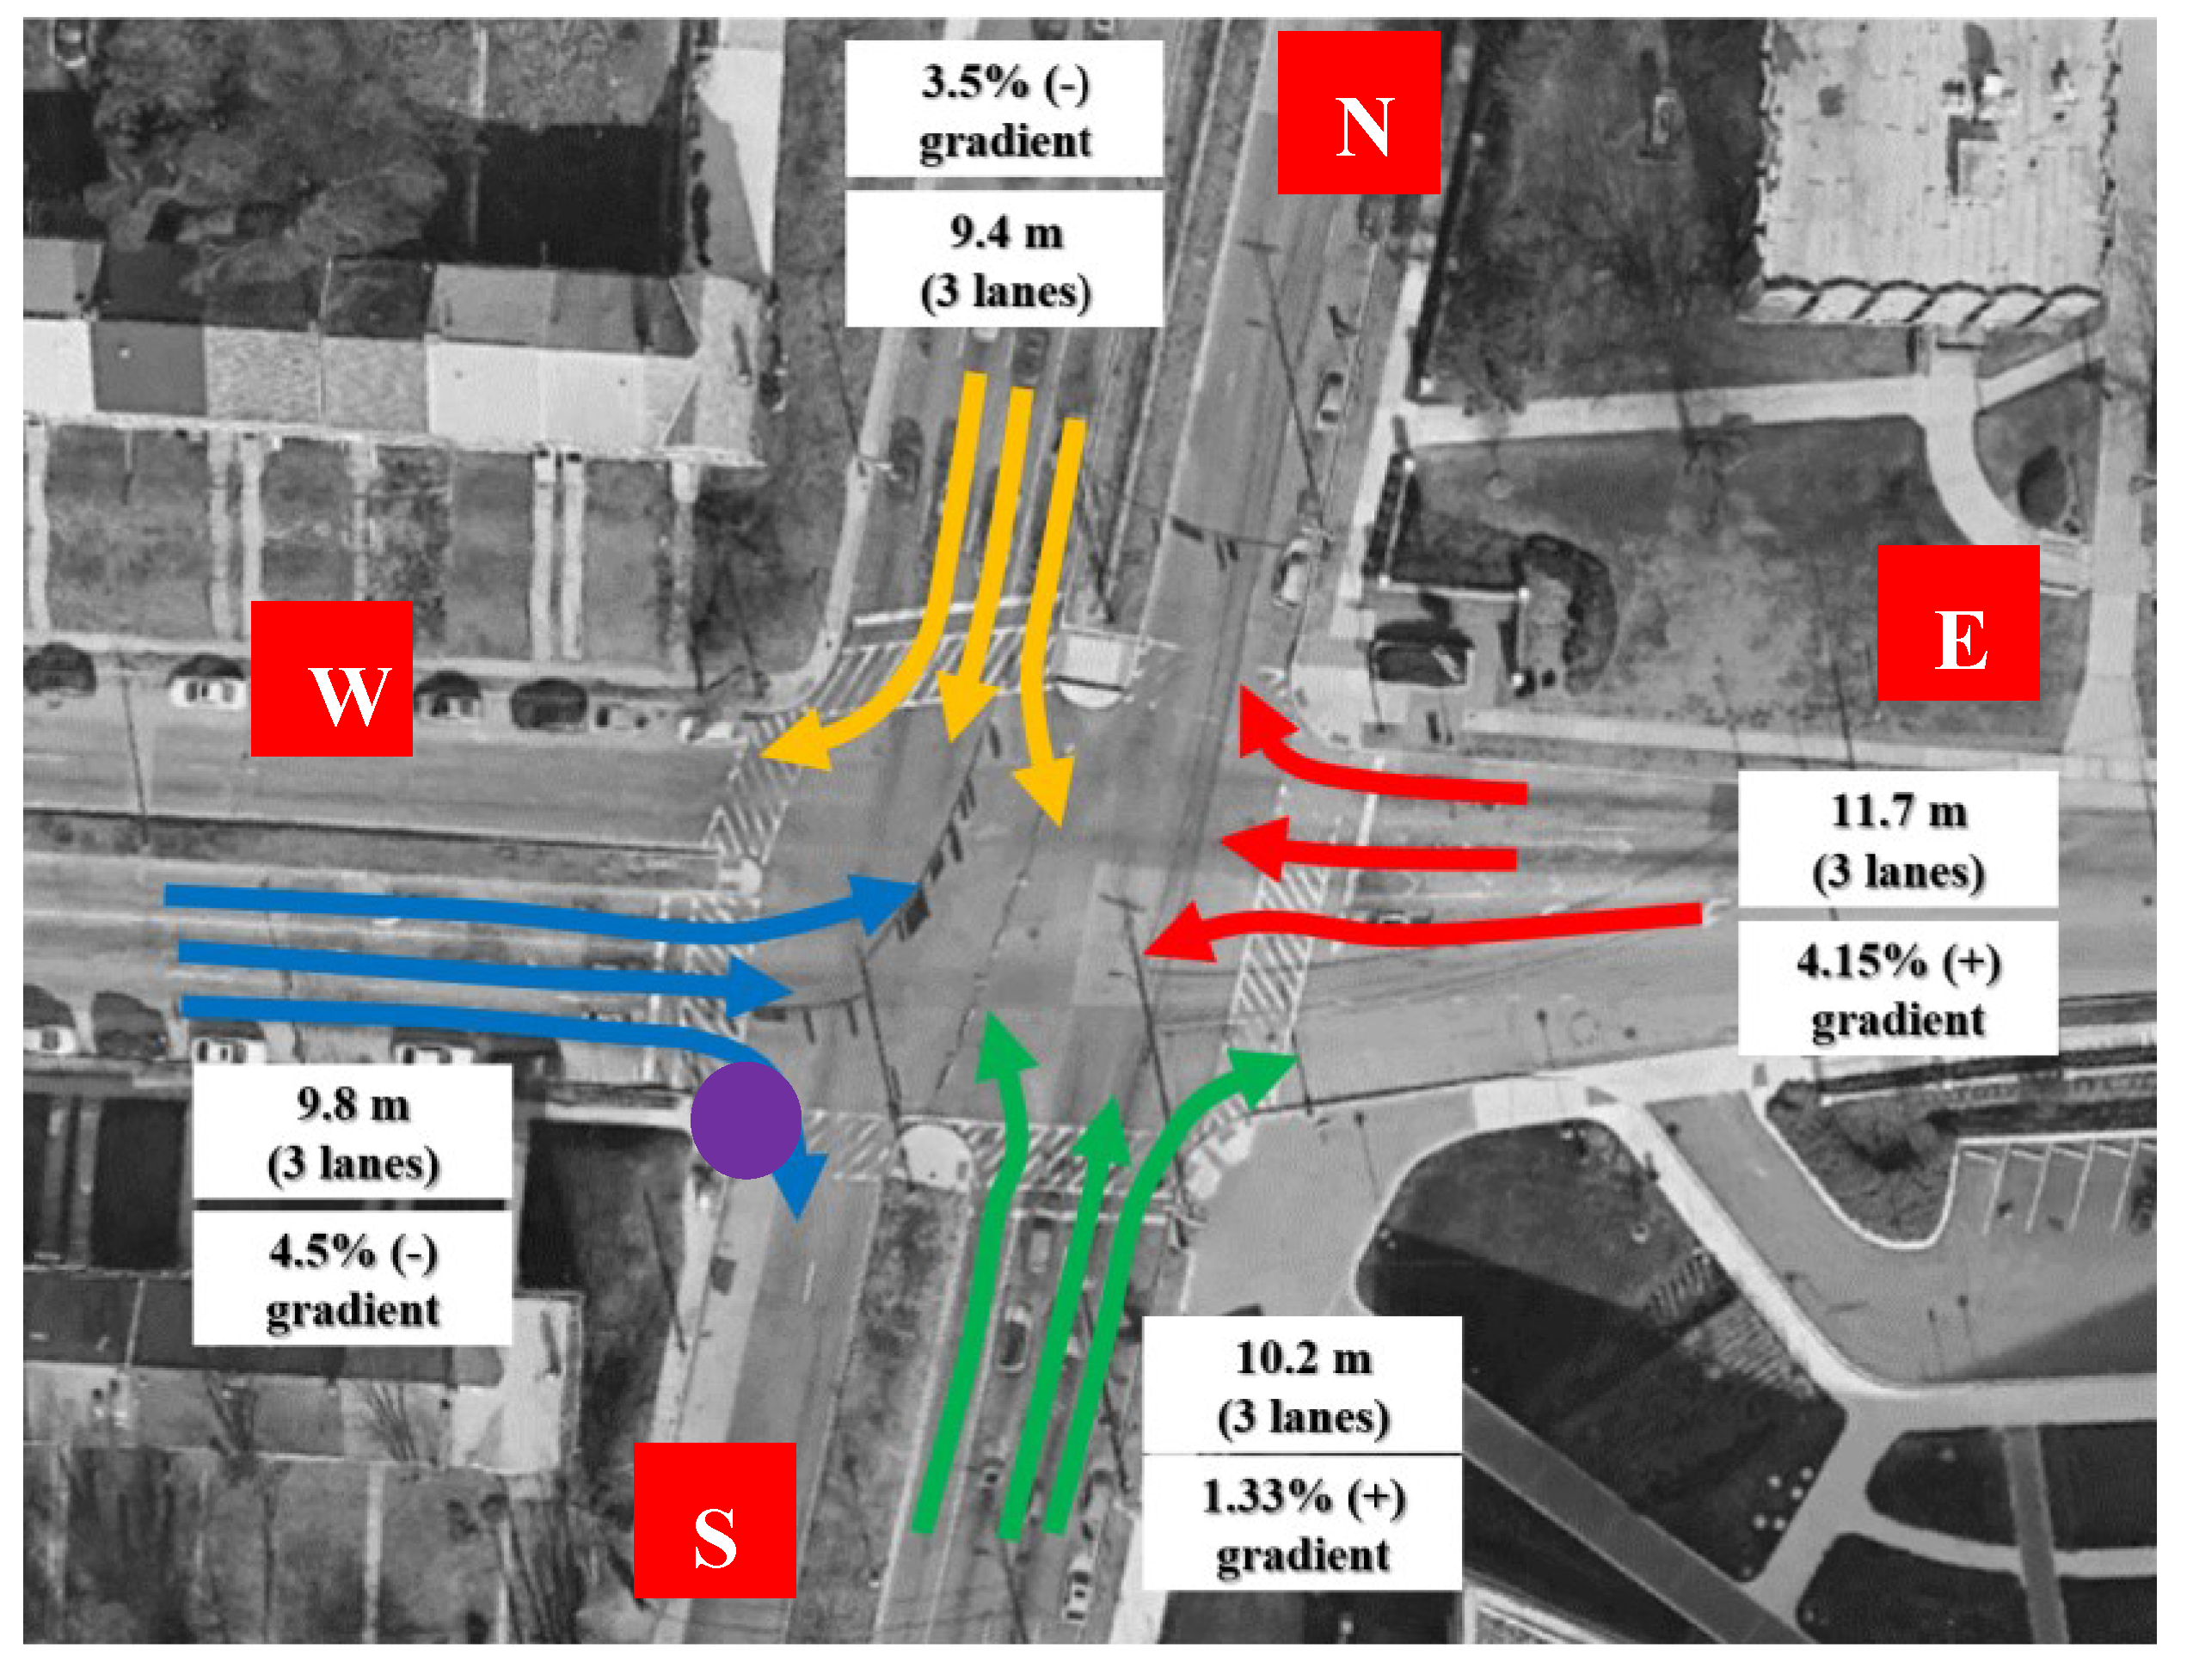
Figure 2.
Work Zone Layout and Left-Turn Closure Schedule.
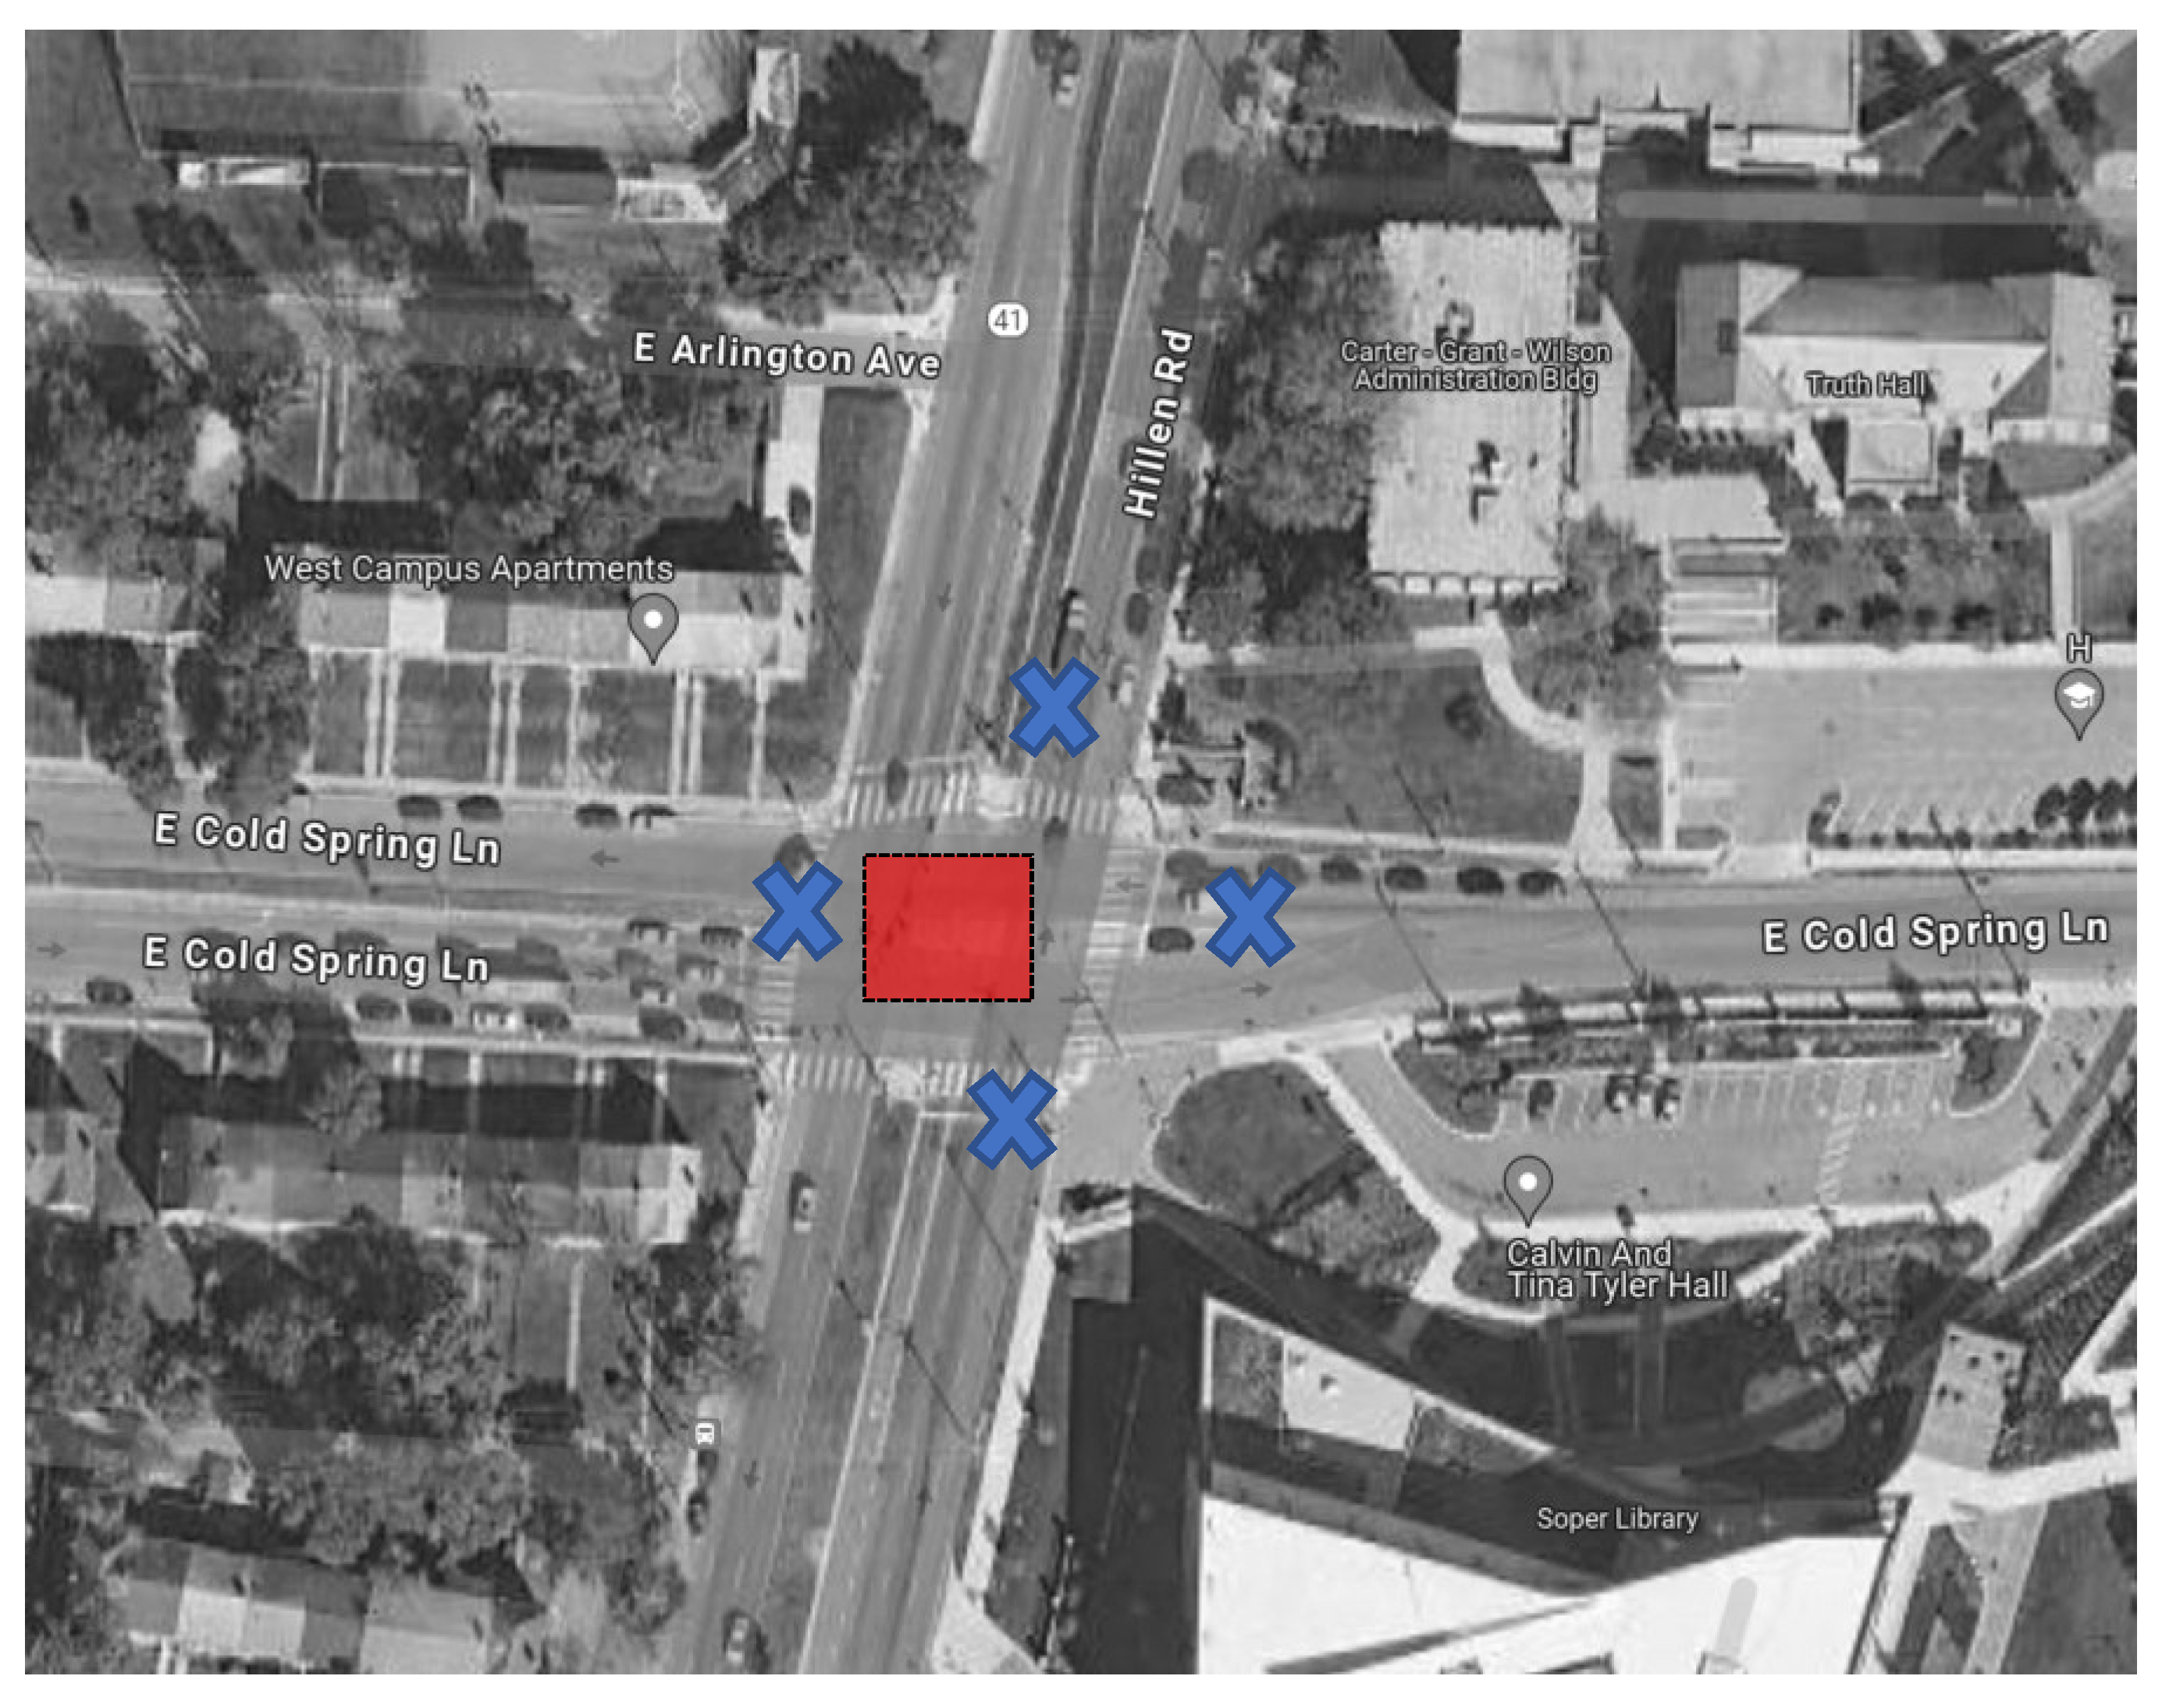
Figure 3.
Vehicle Volumes in Southbound direction from 06:00 AM to 07:00 PM.
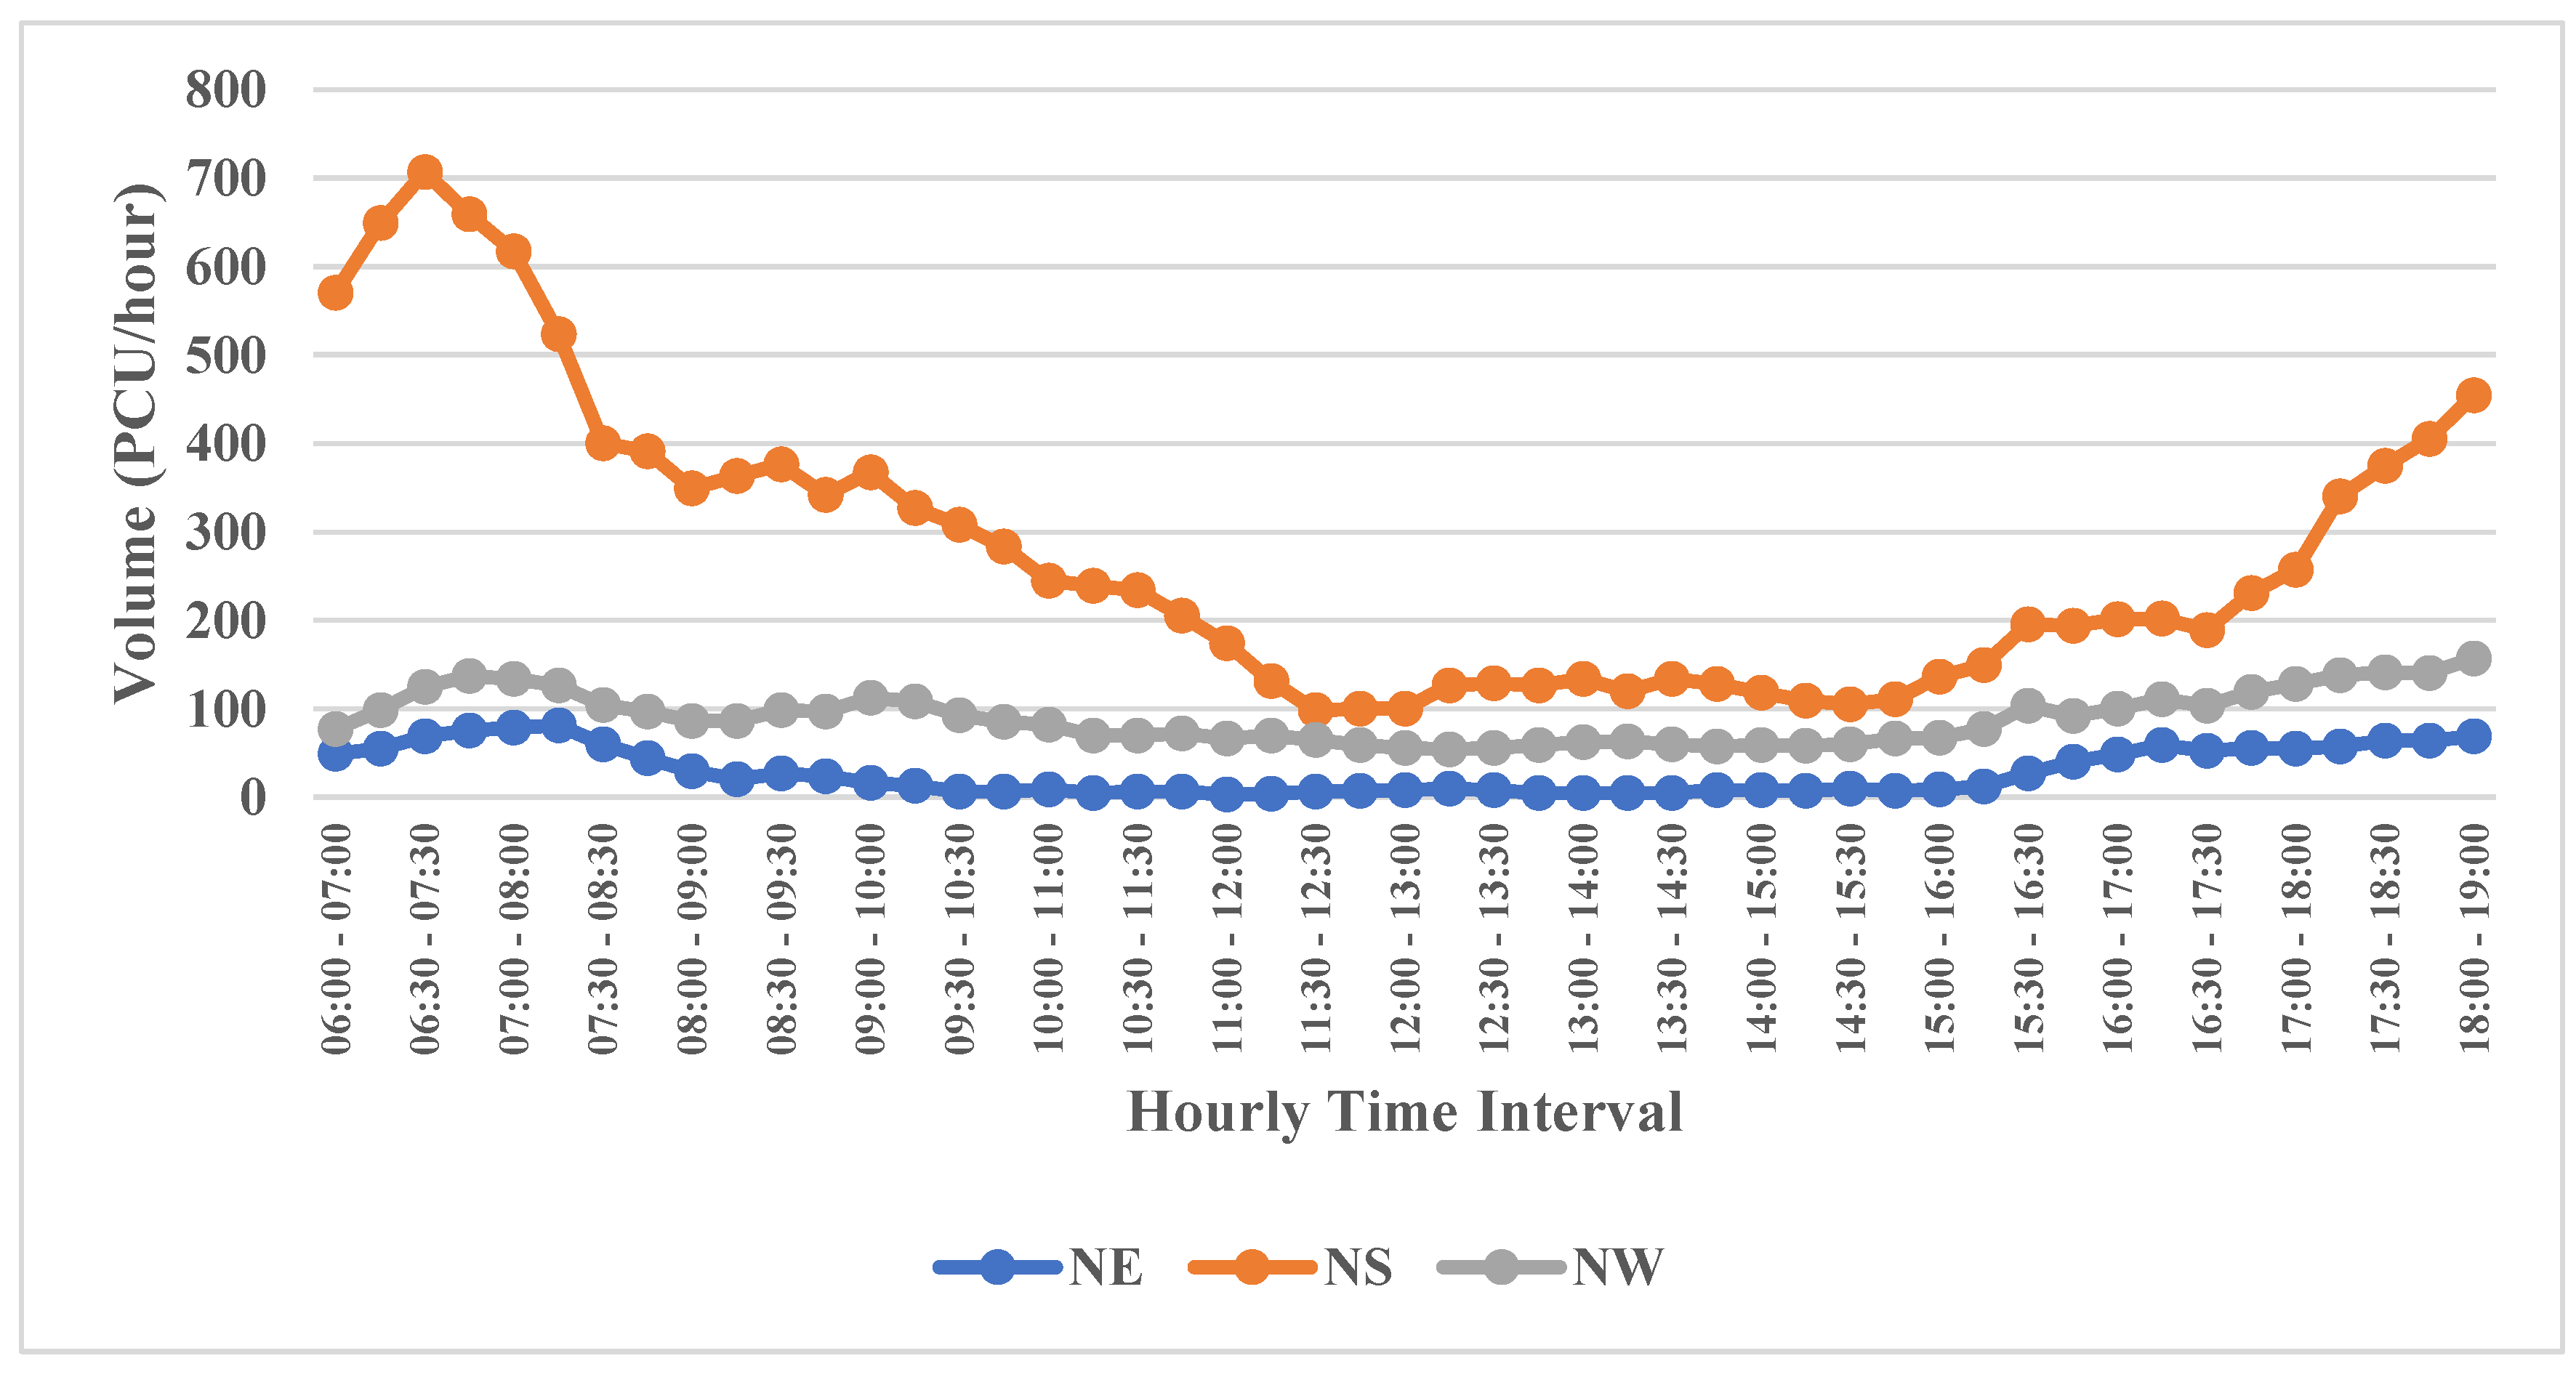
Figure 4.
Vehicle Volumes in Northbound direction from 06:00 AM to 07:00 PM.
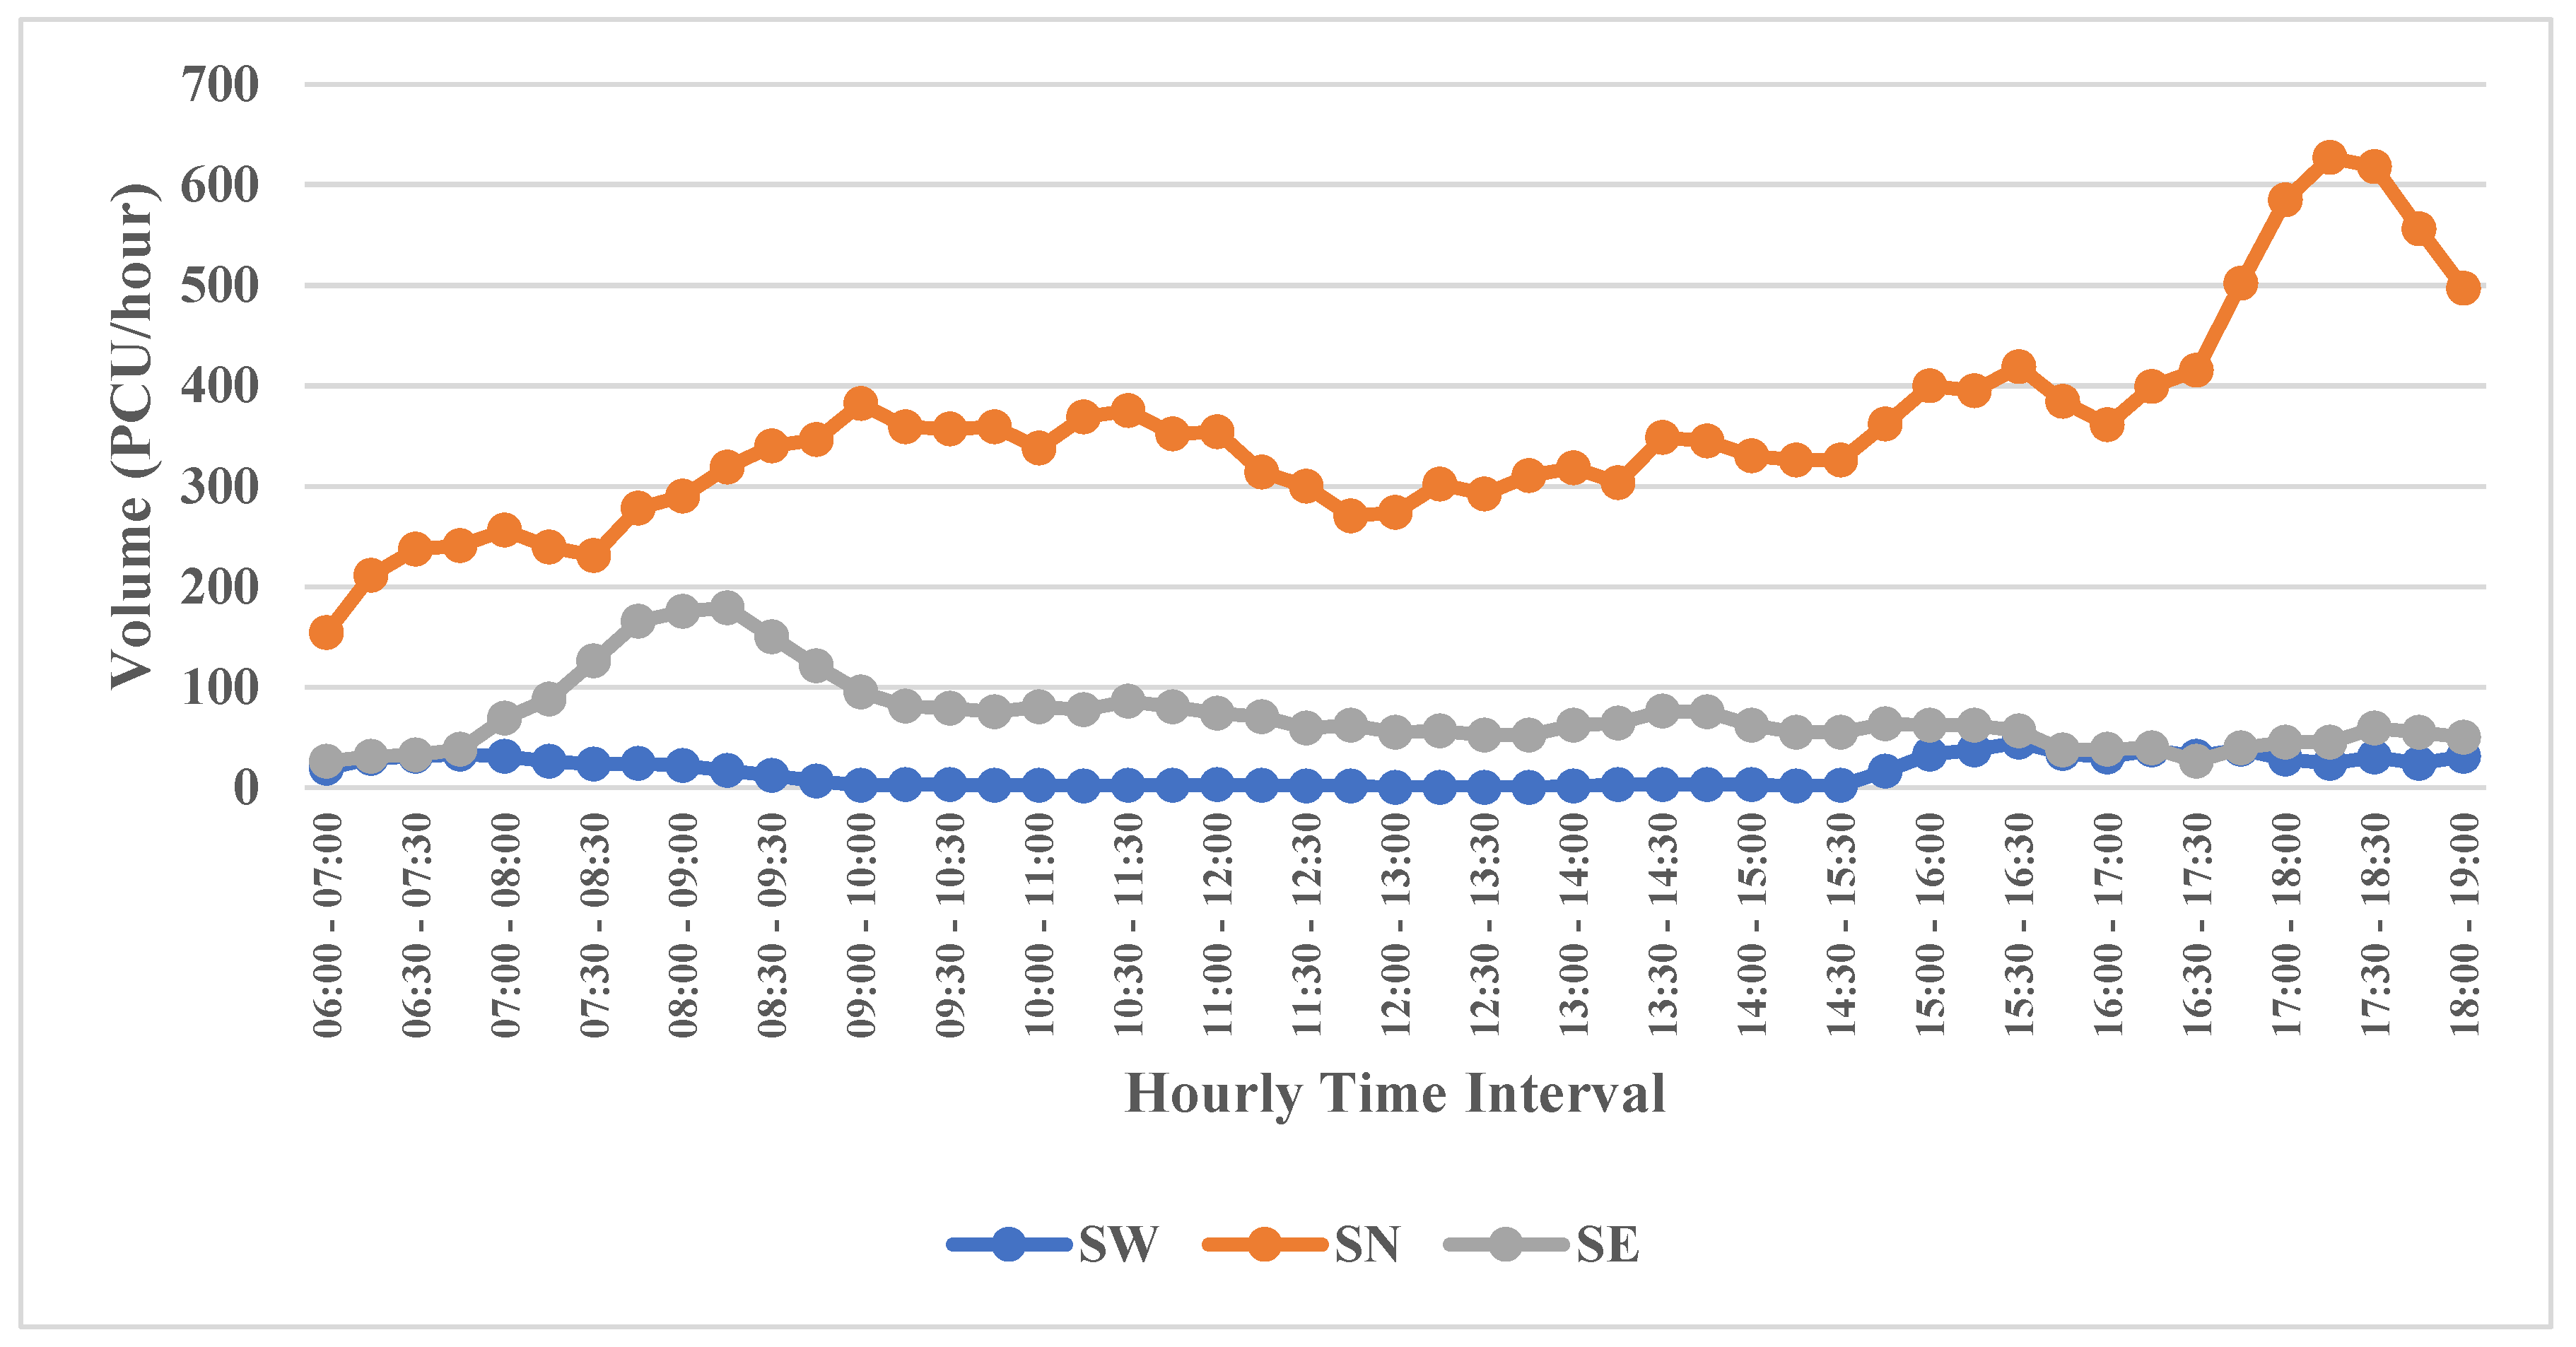
Figure 5.
Vehicle Volumes in Westbound direction from 06:00 AM to 07:00 PM.
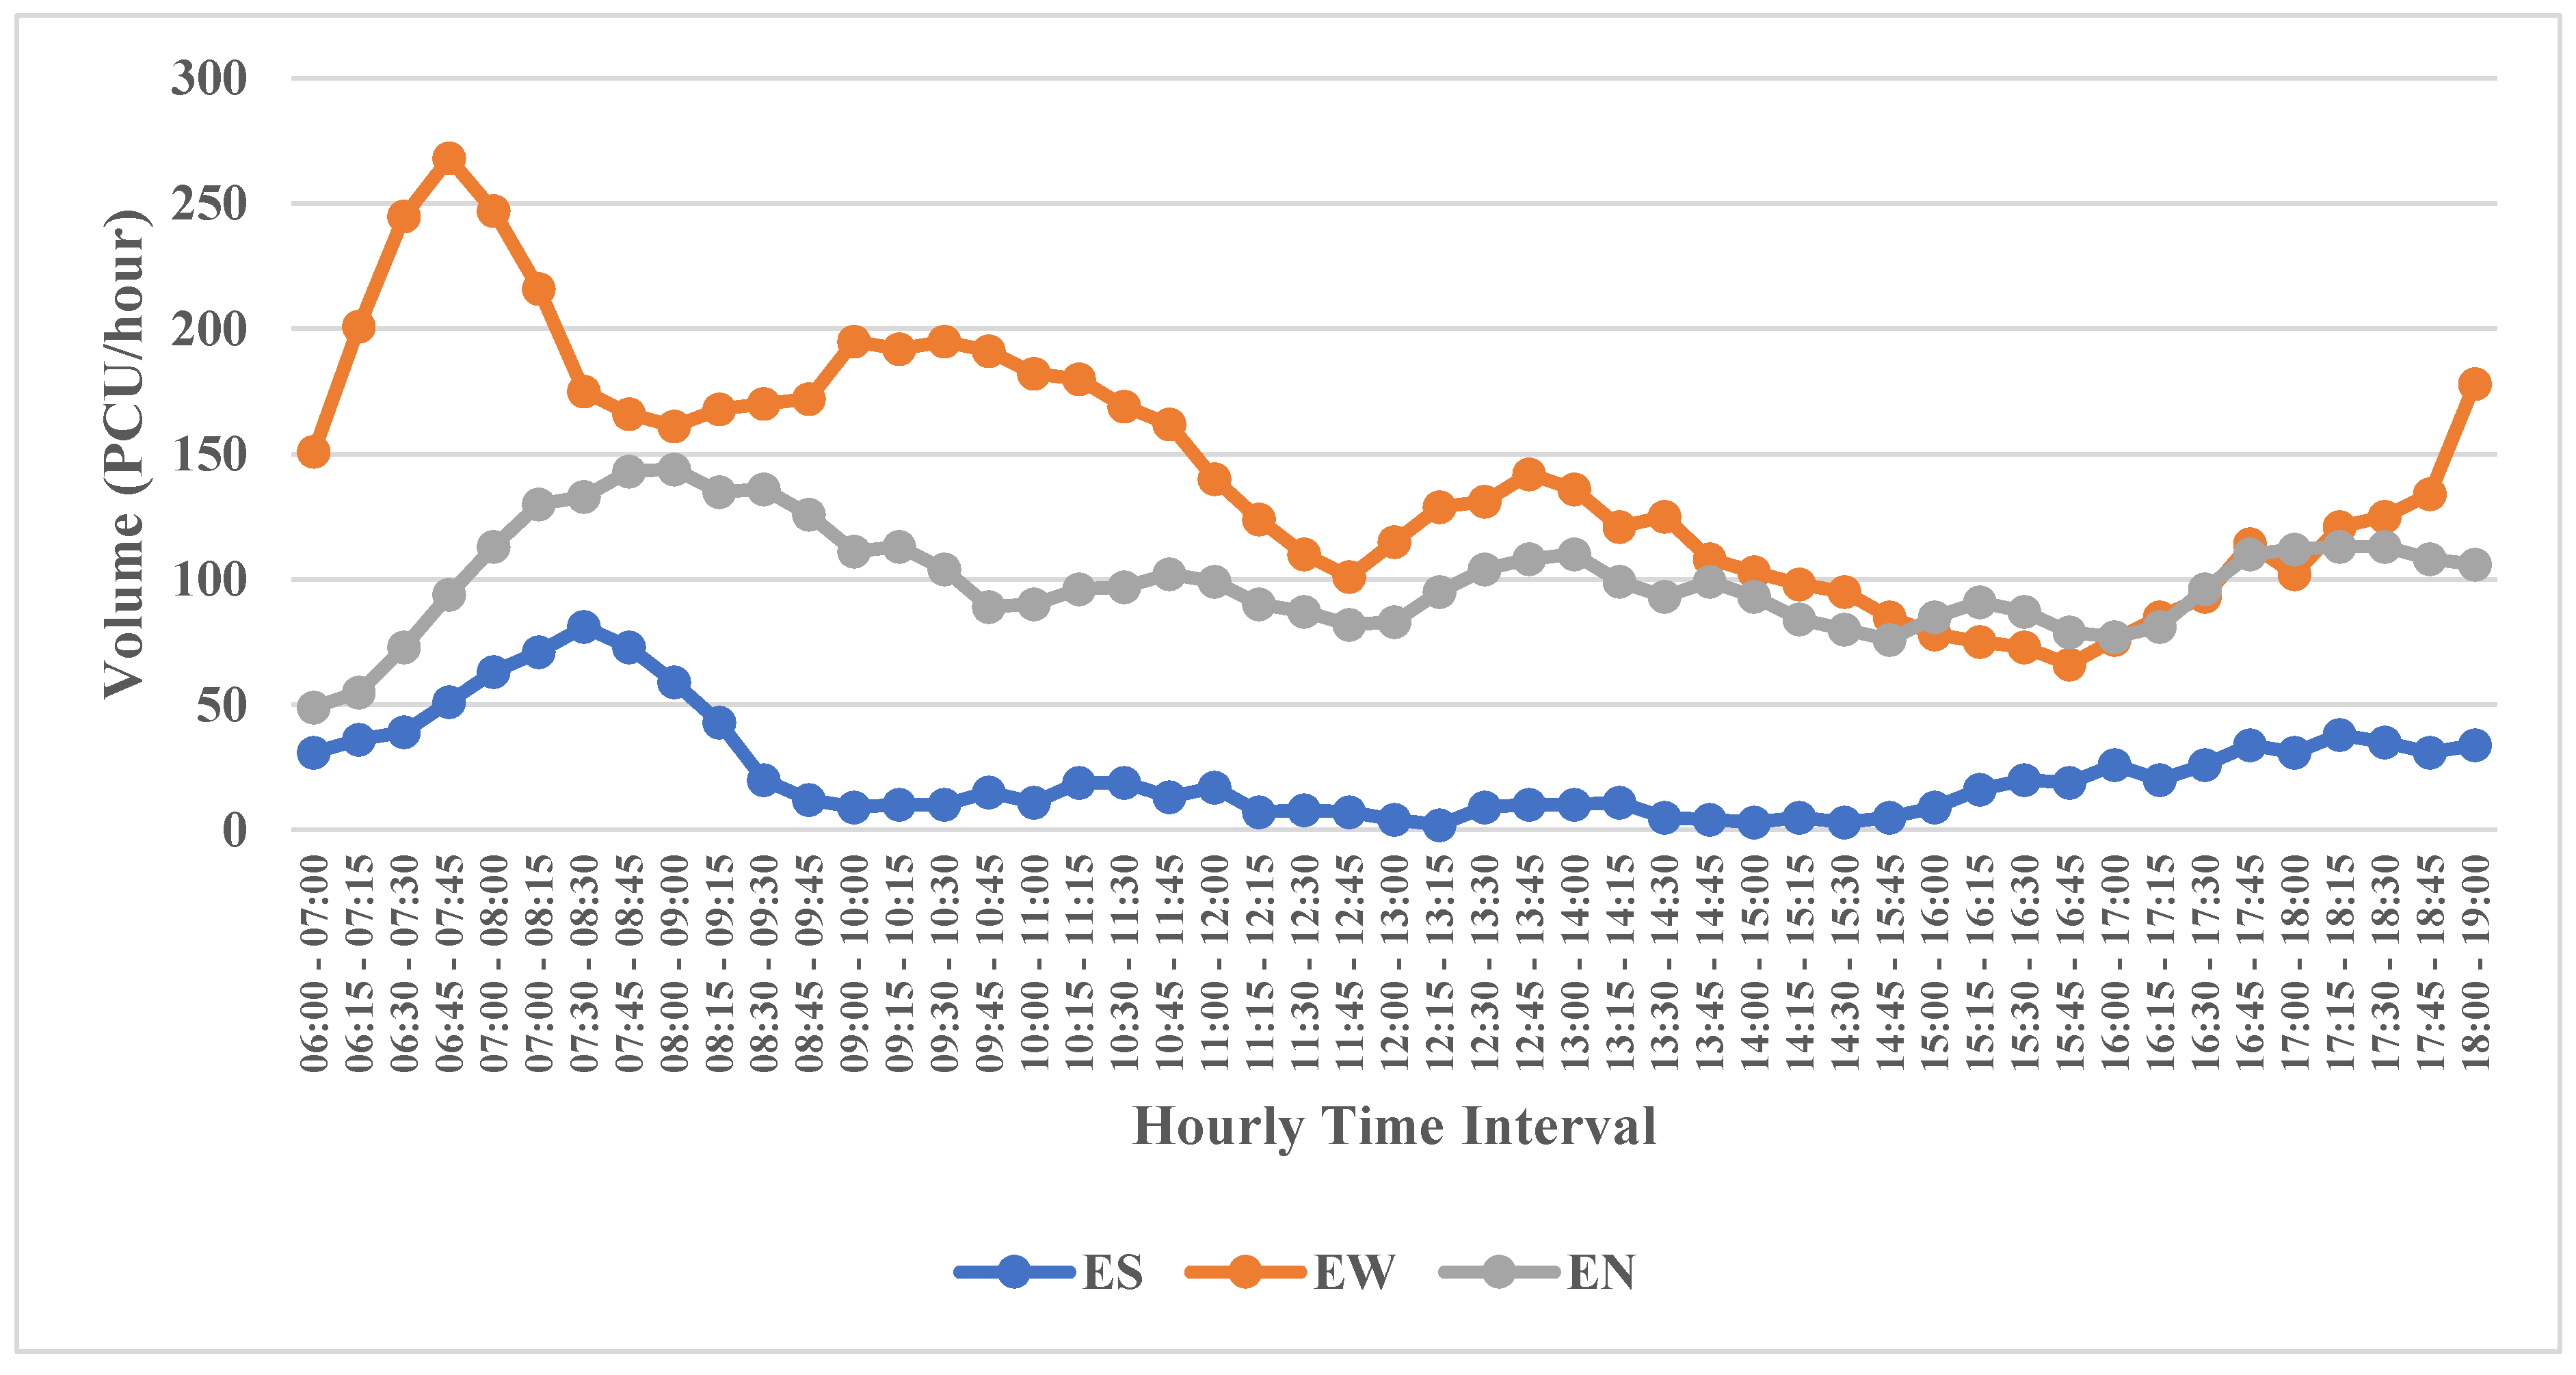
Figure 6.
Vehicle Volumes in Eastbound direction from 06:00 AM to 07:00 PM.
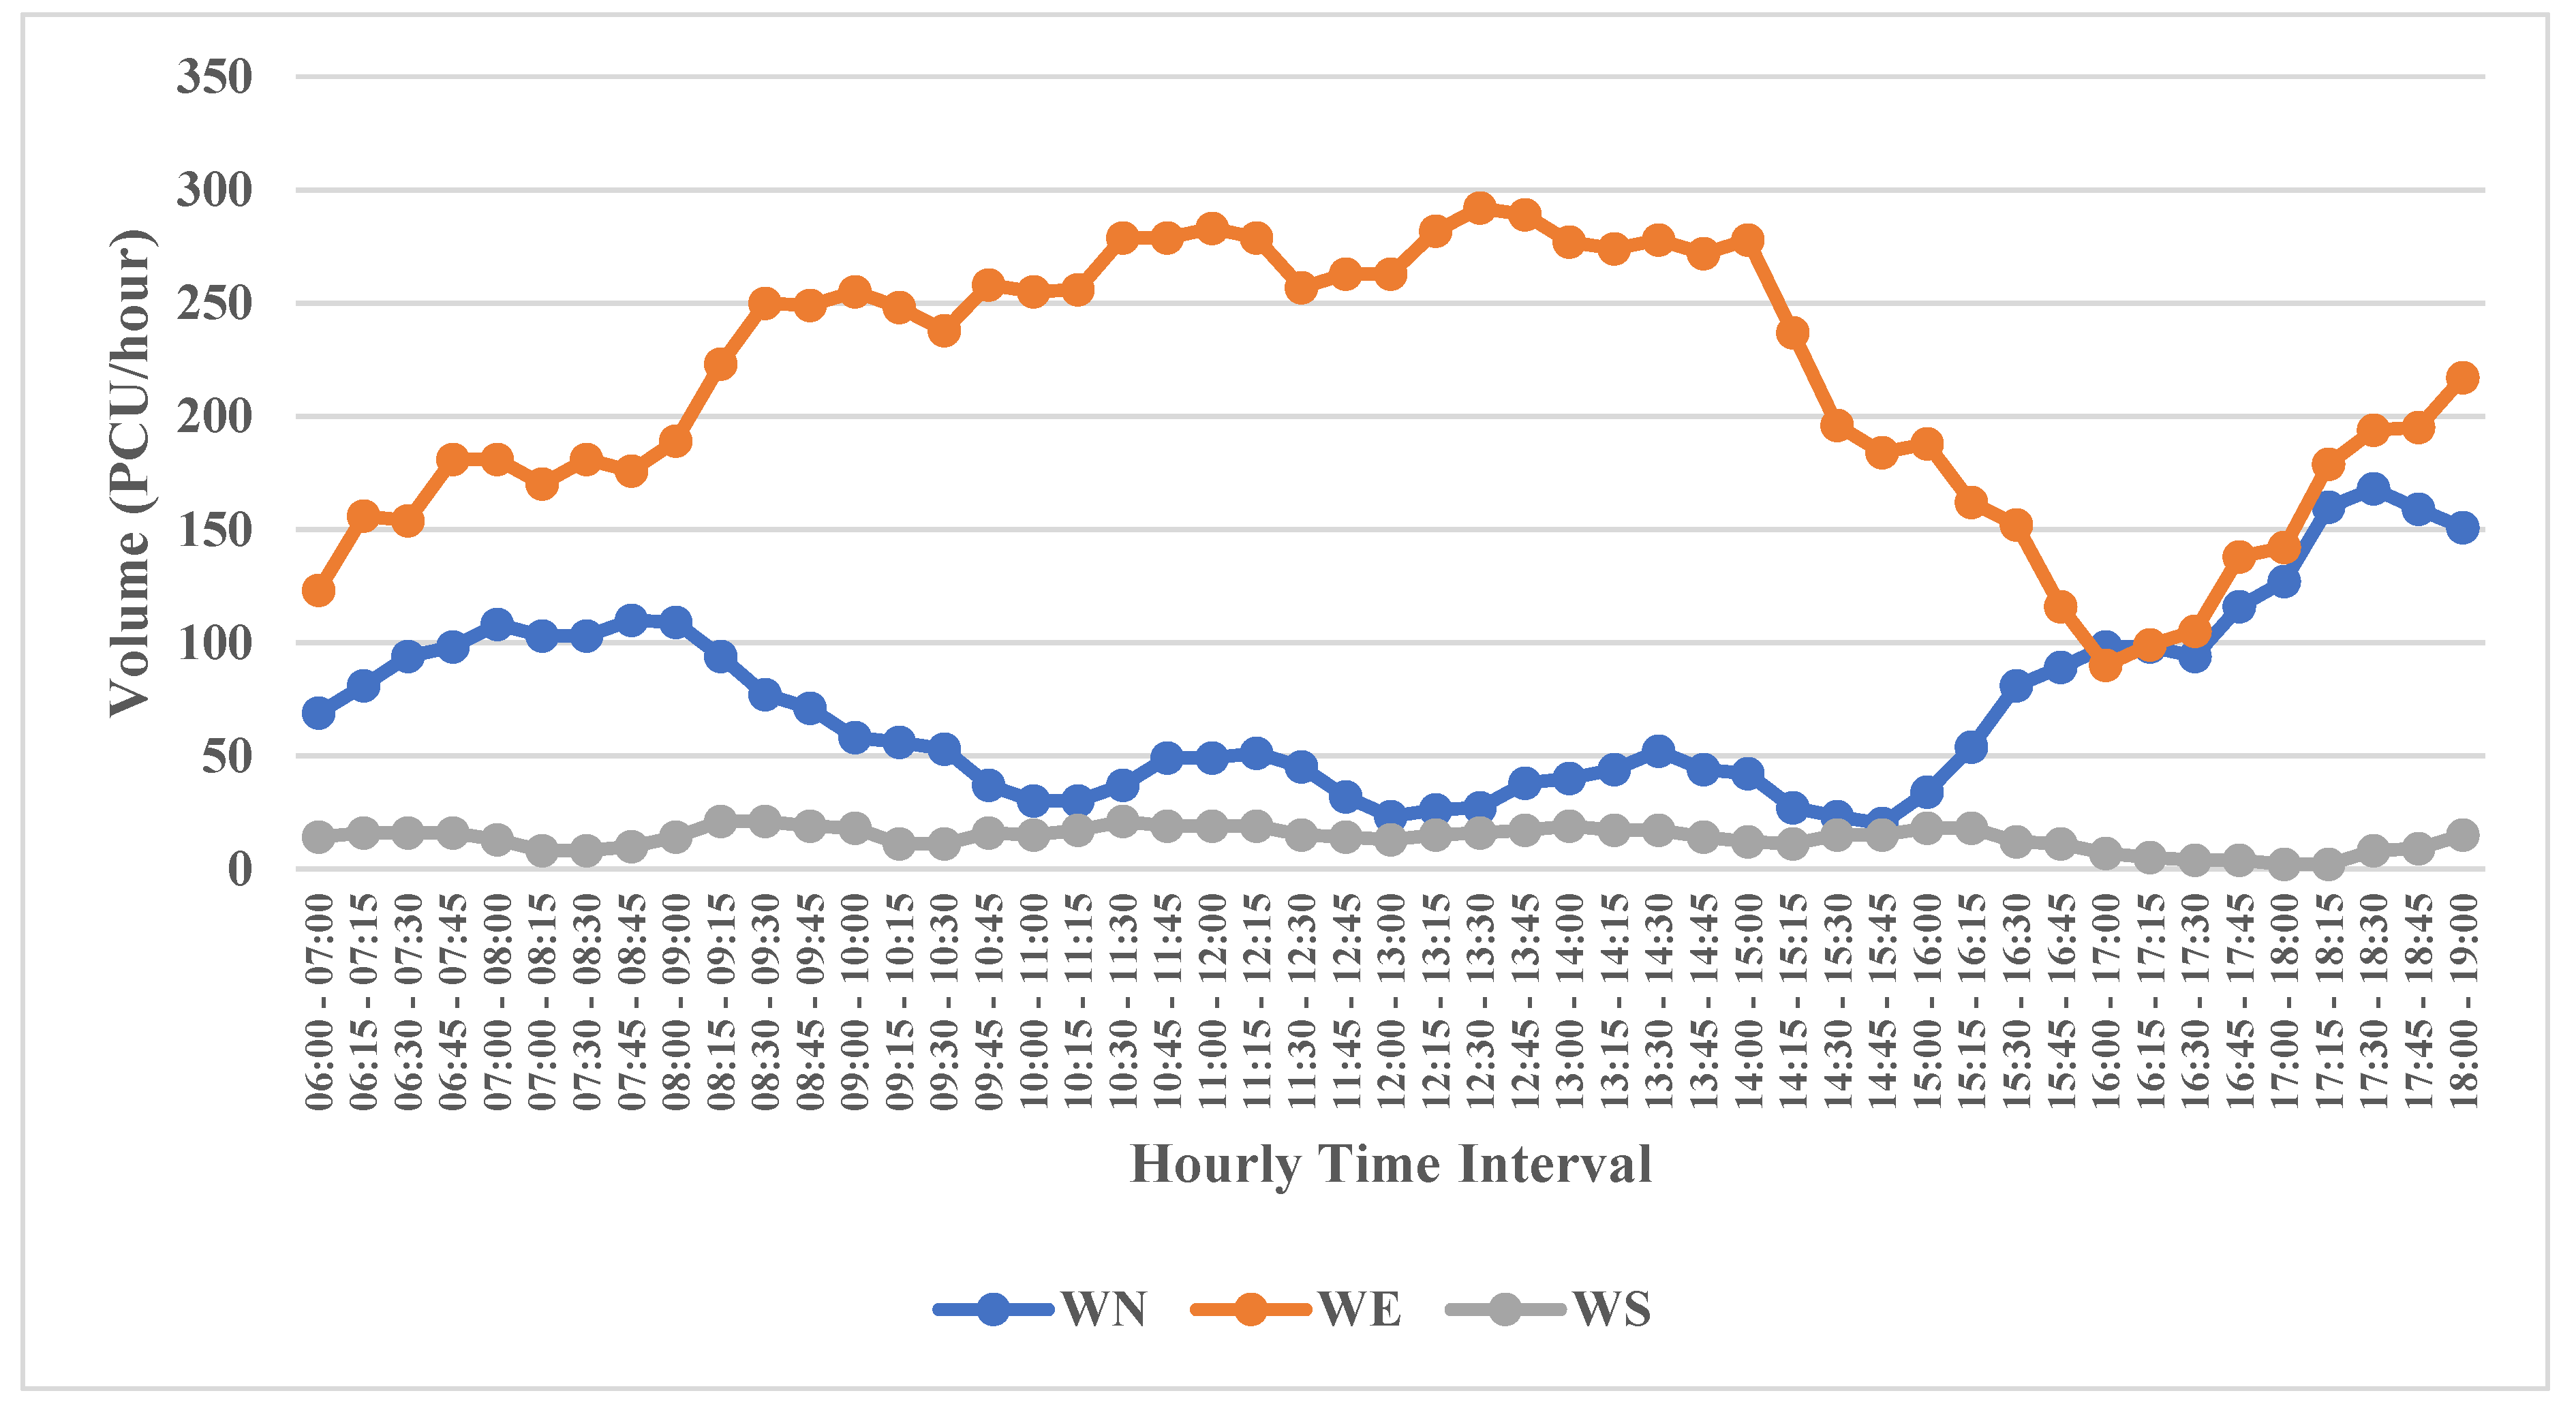
Figure 7.
Pedestrian Counts data in Southbound and Westbound Cross Sections.
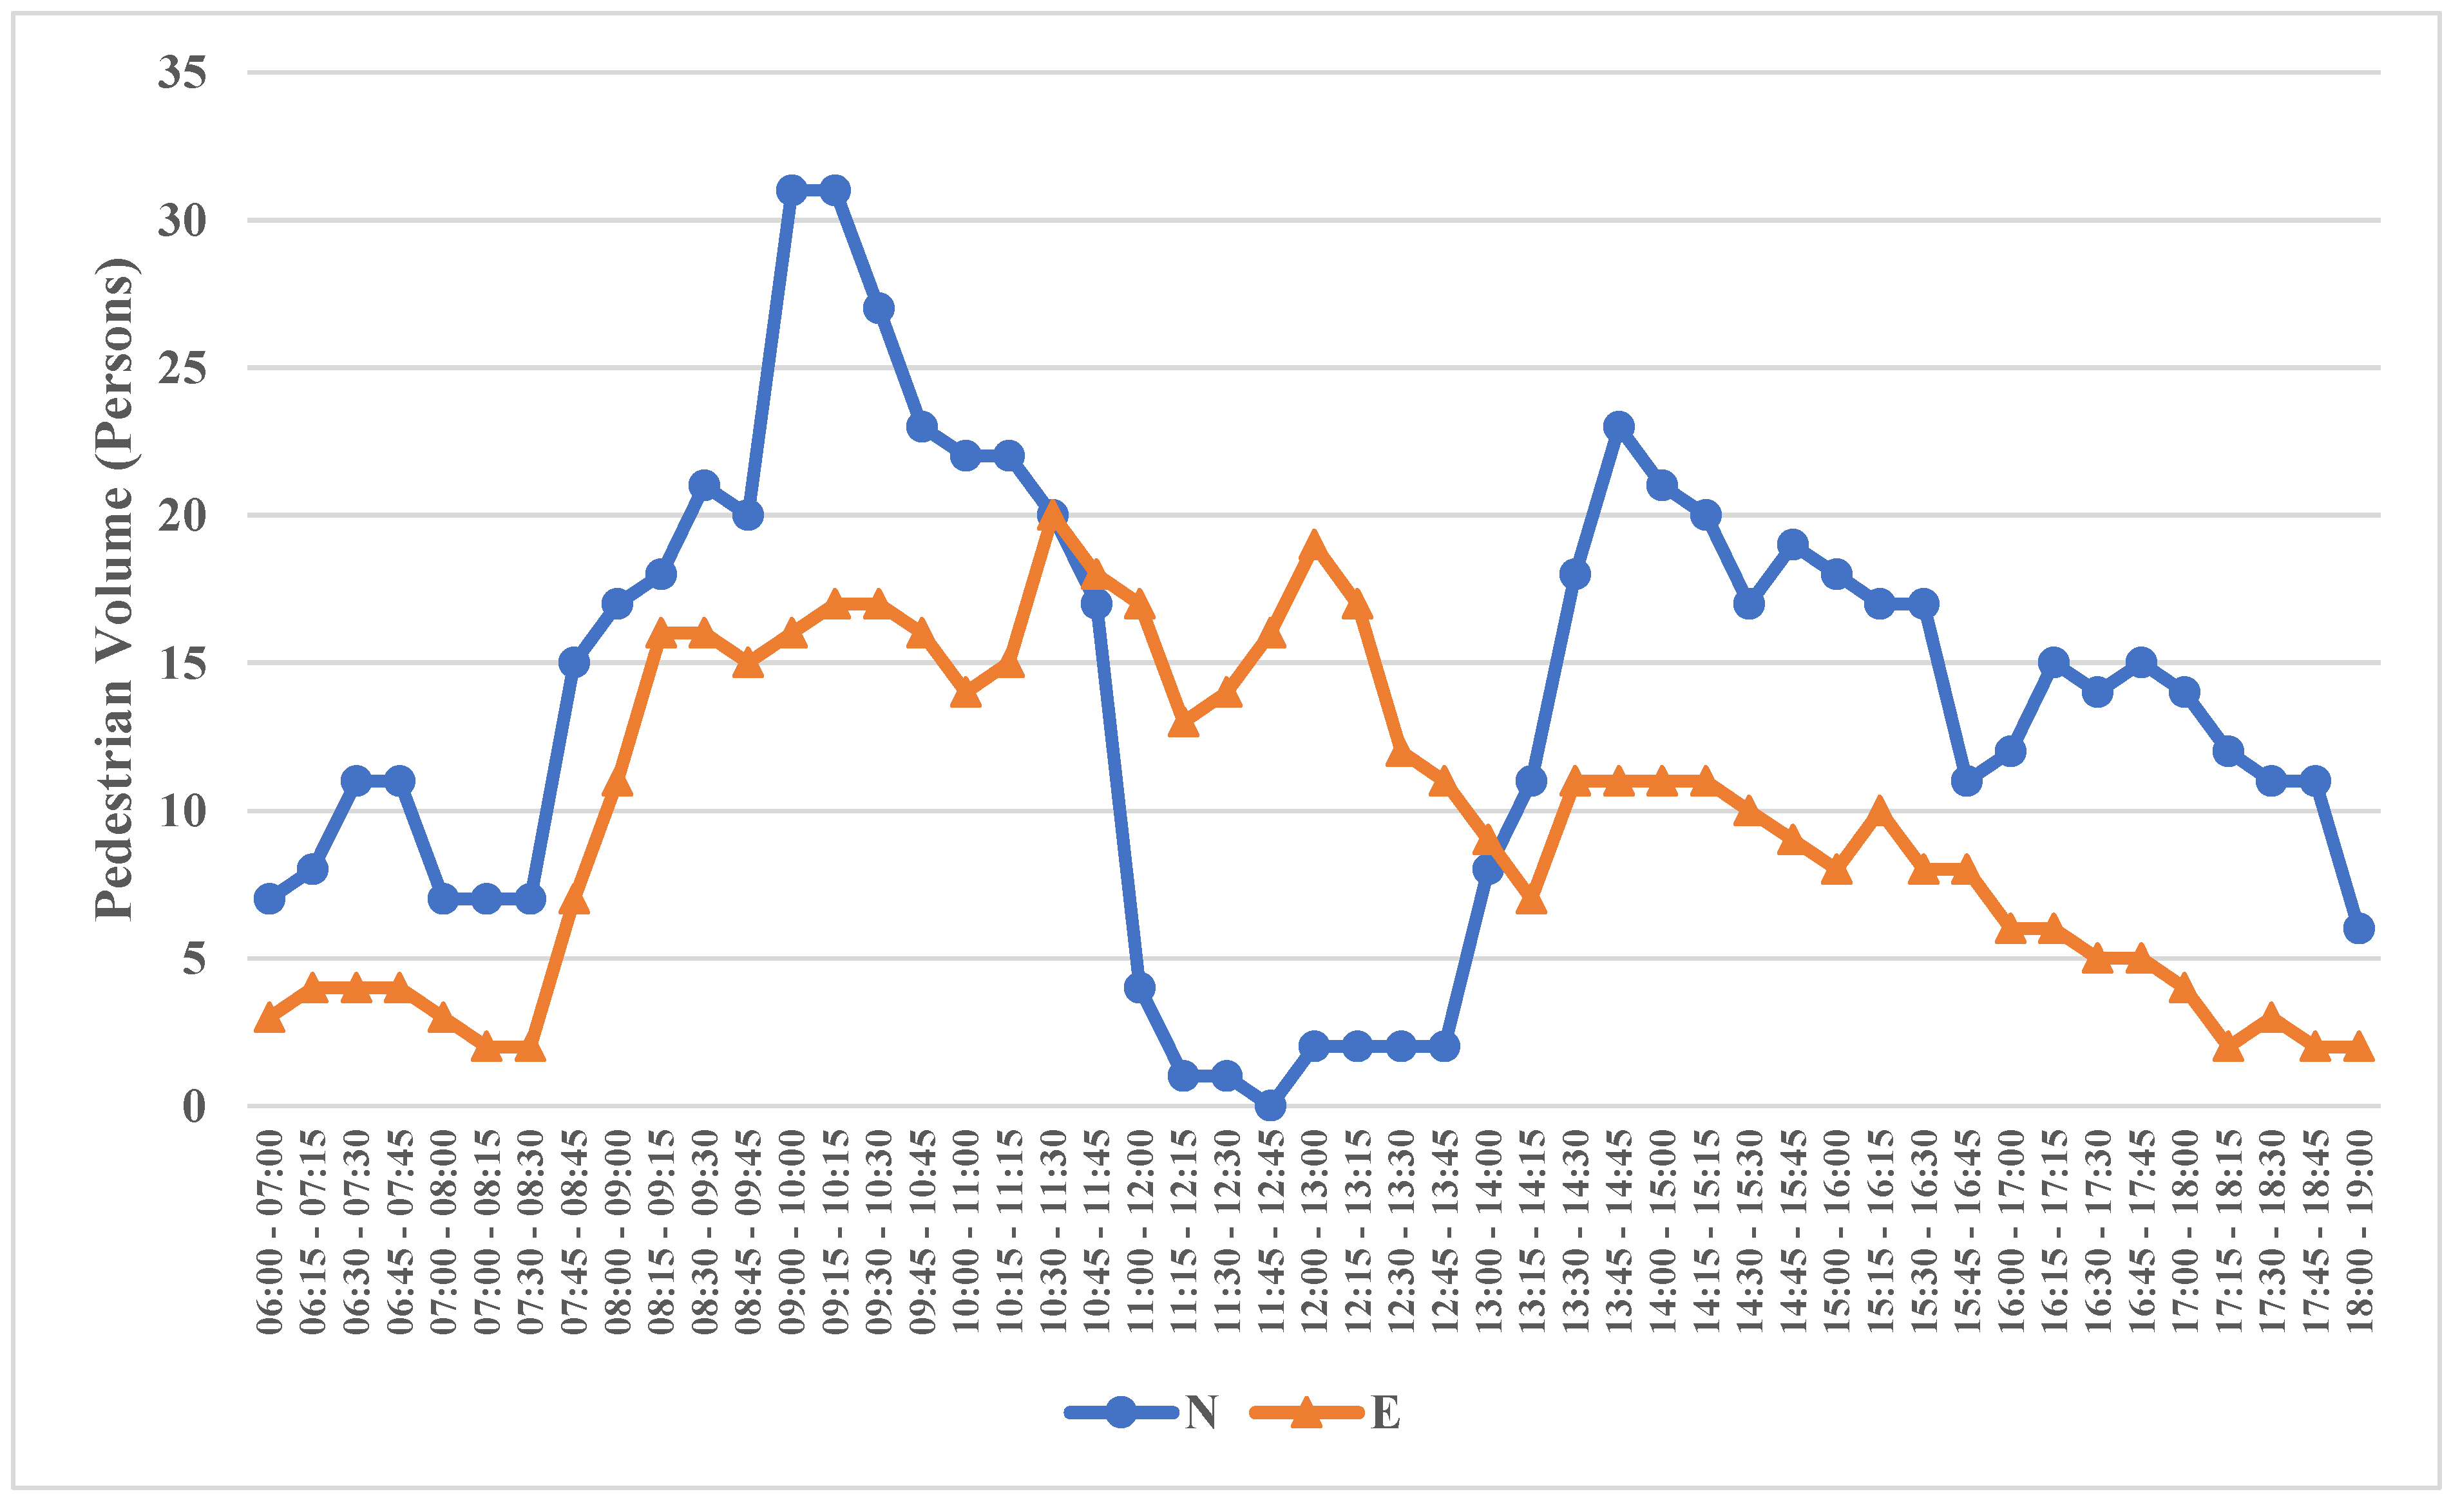
Figure 8.
Pedestrian Counts data in Northbound and Eastbound Cross Sections.
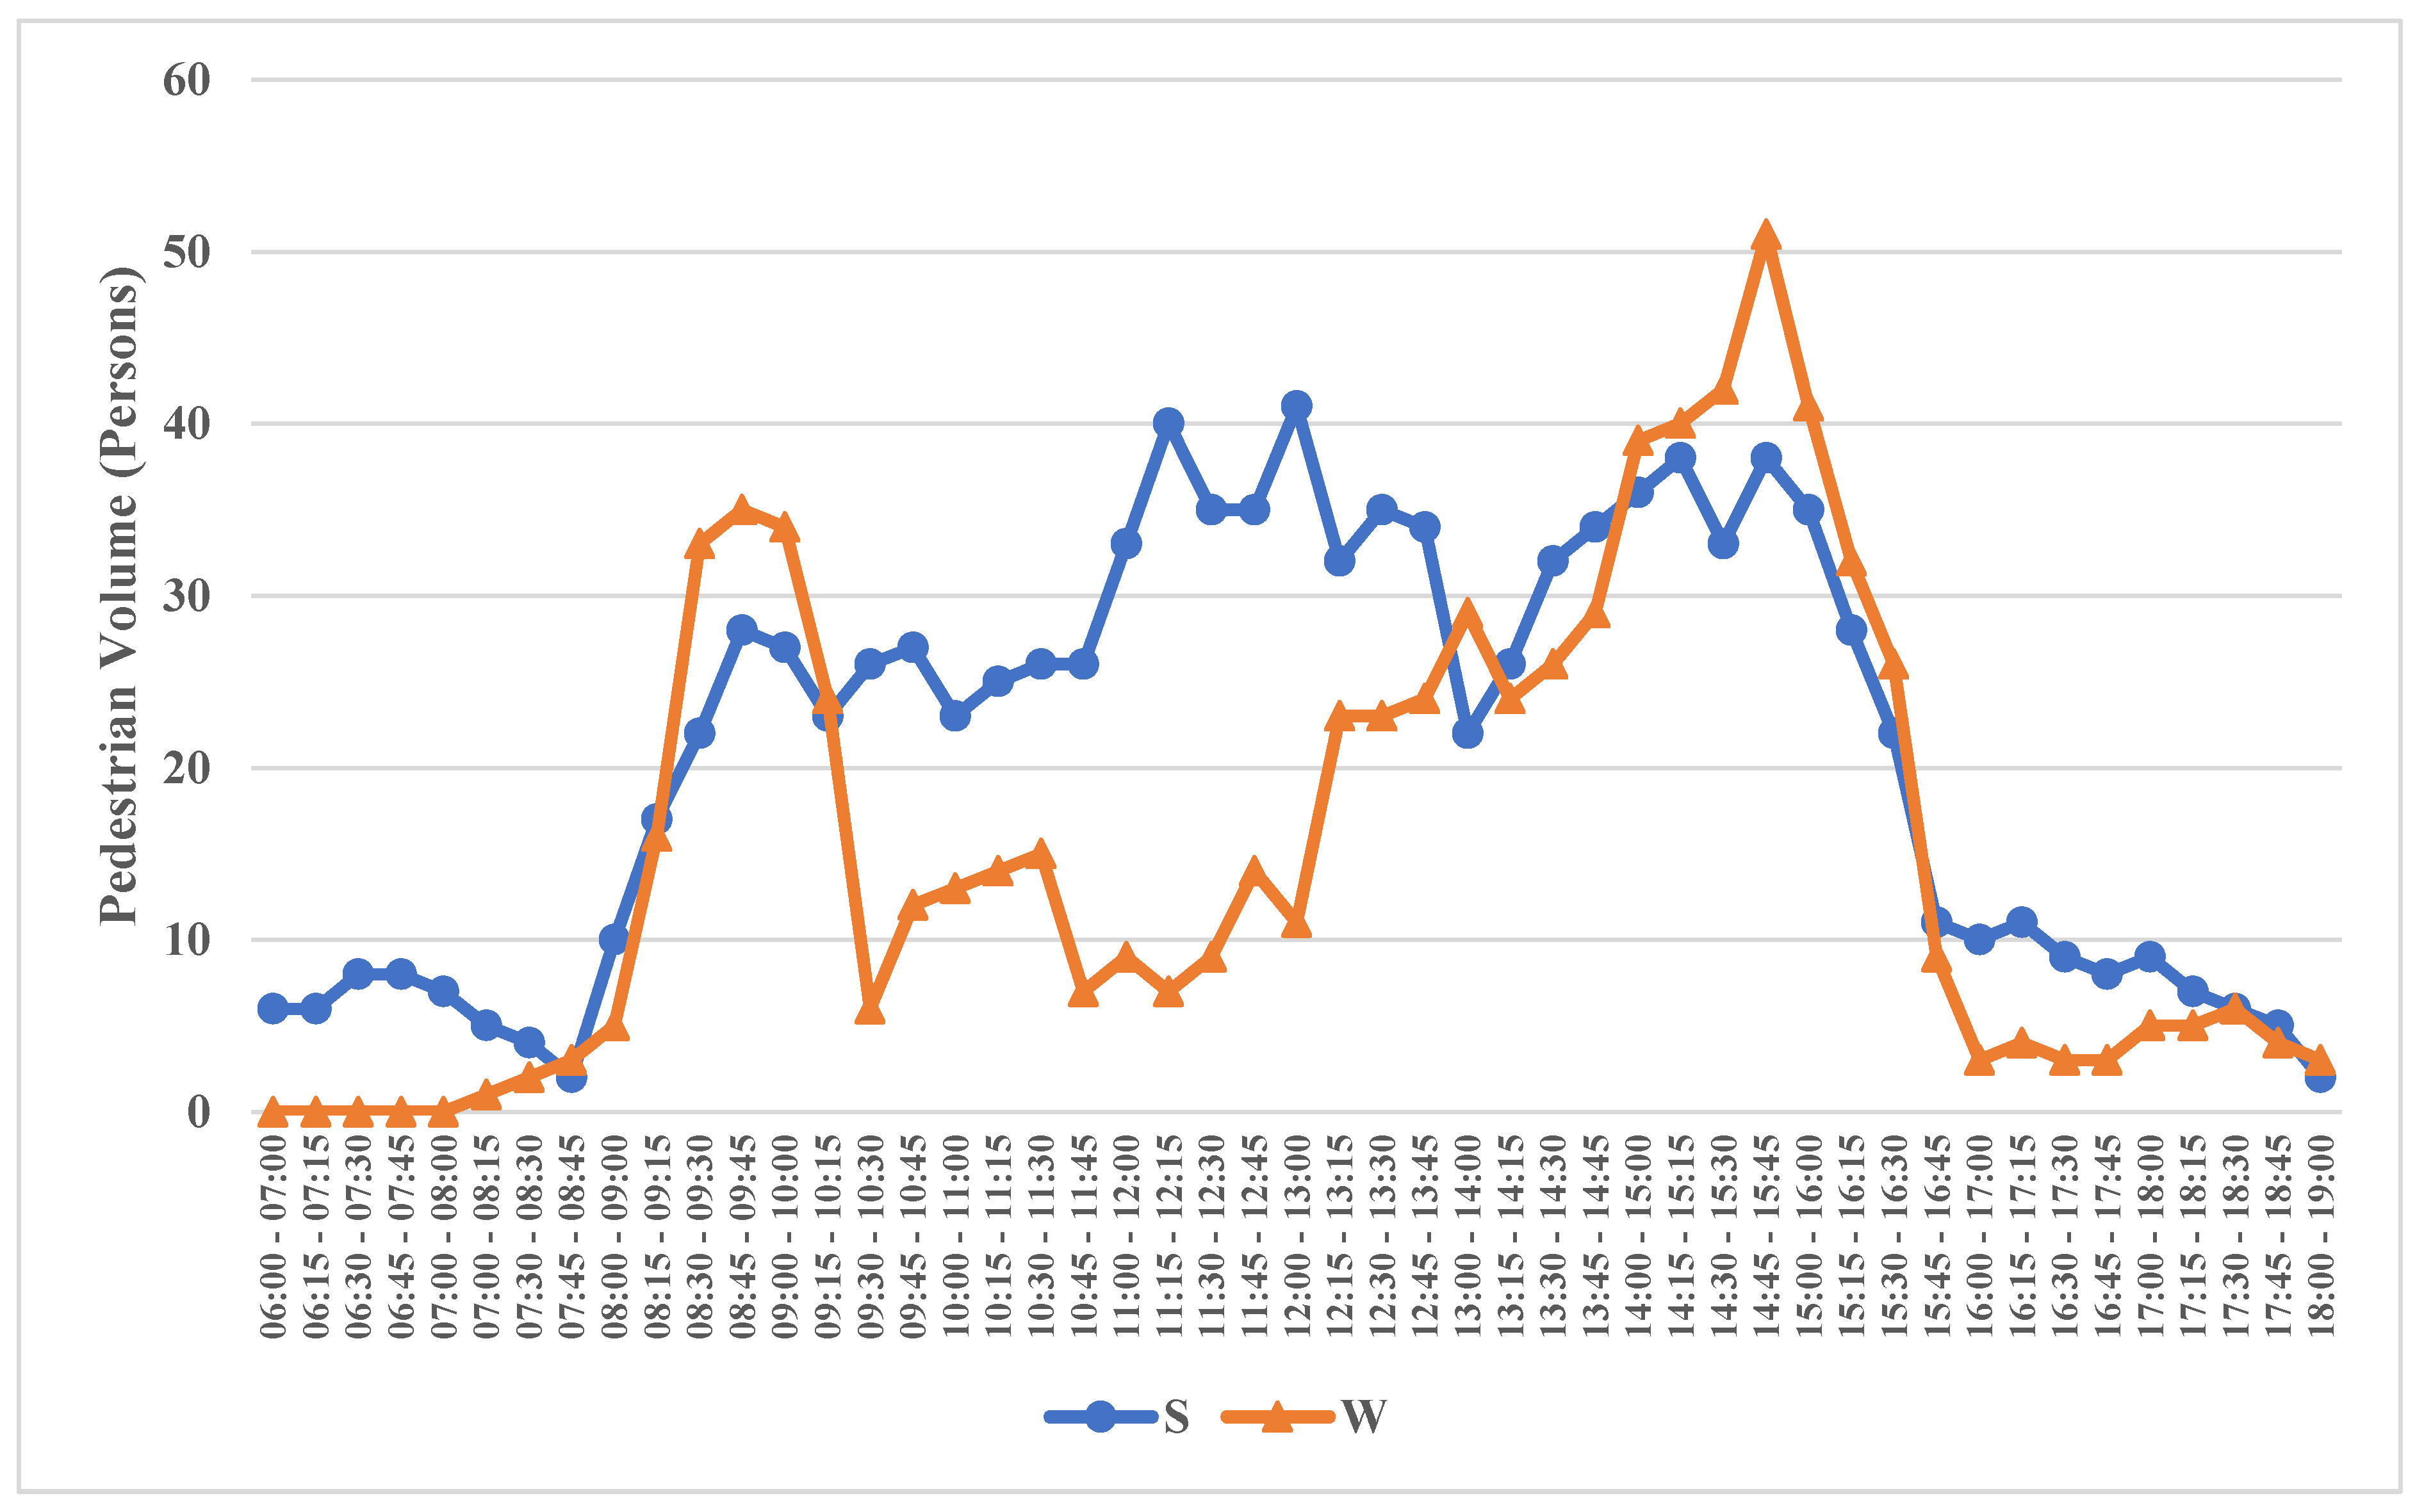
Figure 9.
V2V Heat map Over the Work Zone Time Interval.
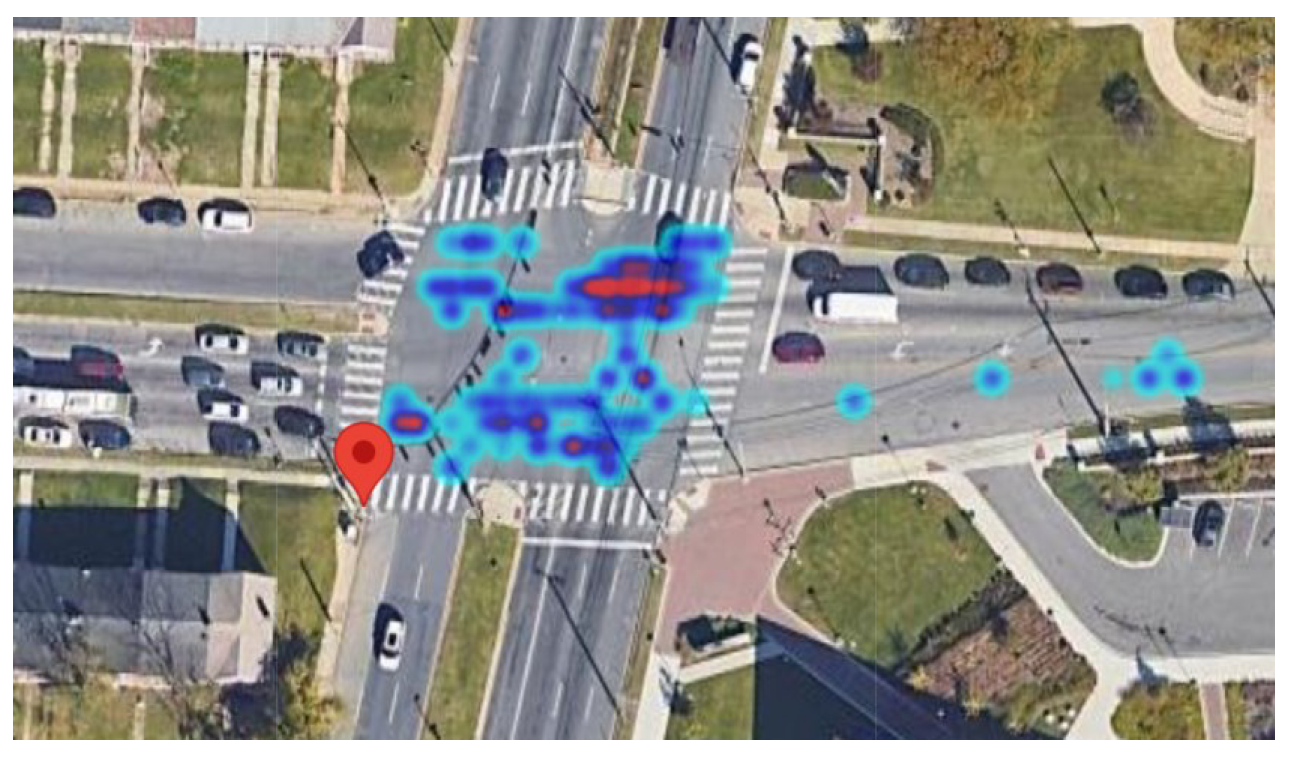
Figure 10.
V2P Heat map Over the Work Zone Time Interval.
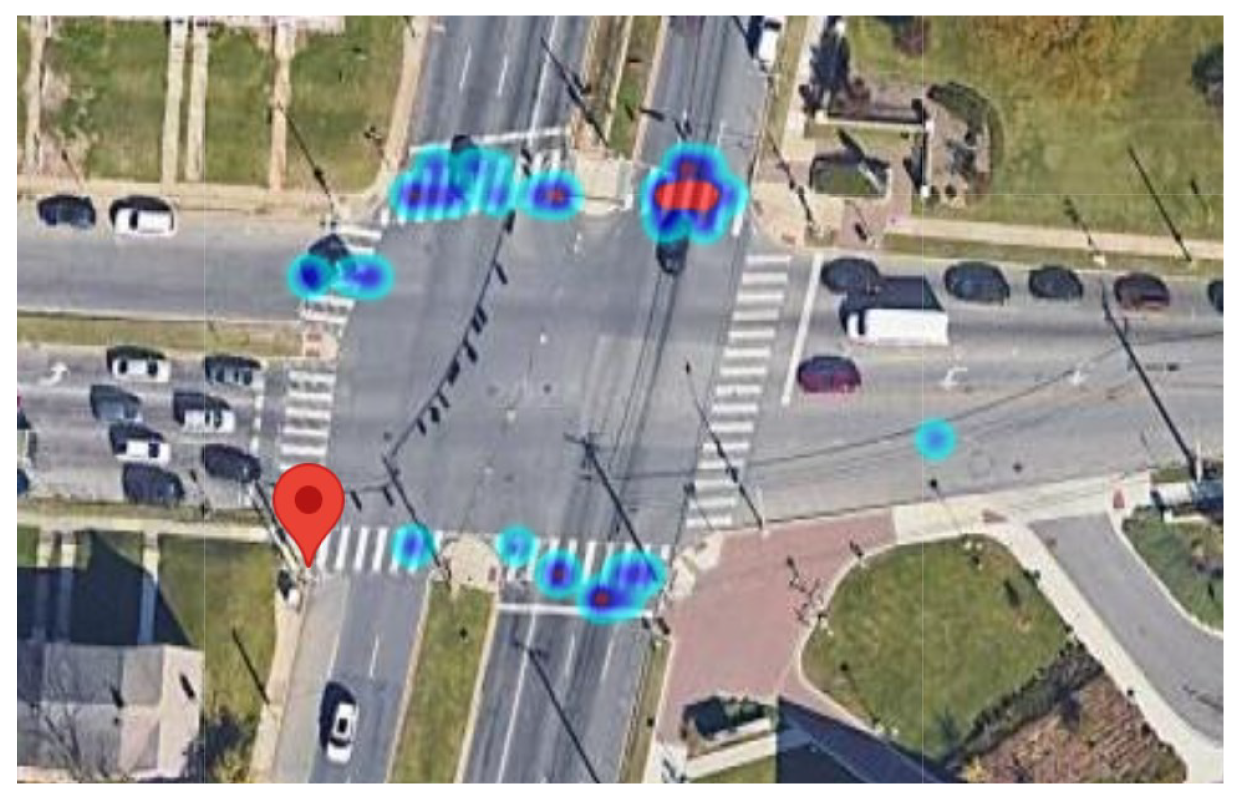
Figure 11.
Different Phases of the Traffic Signal.
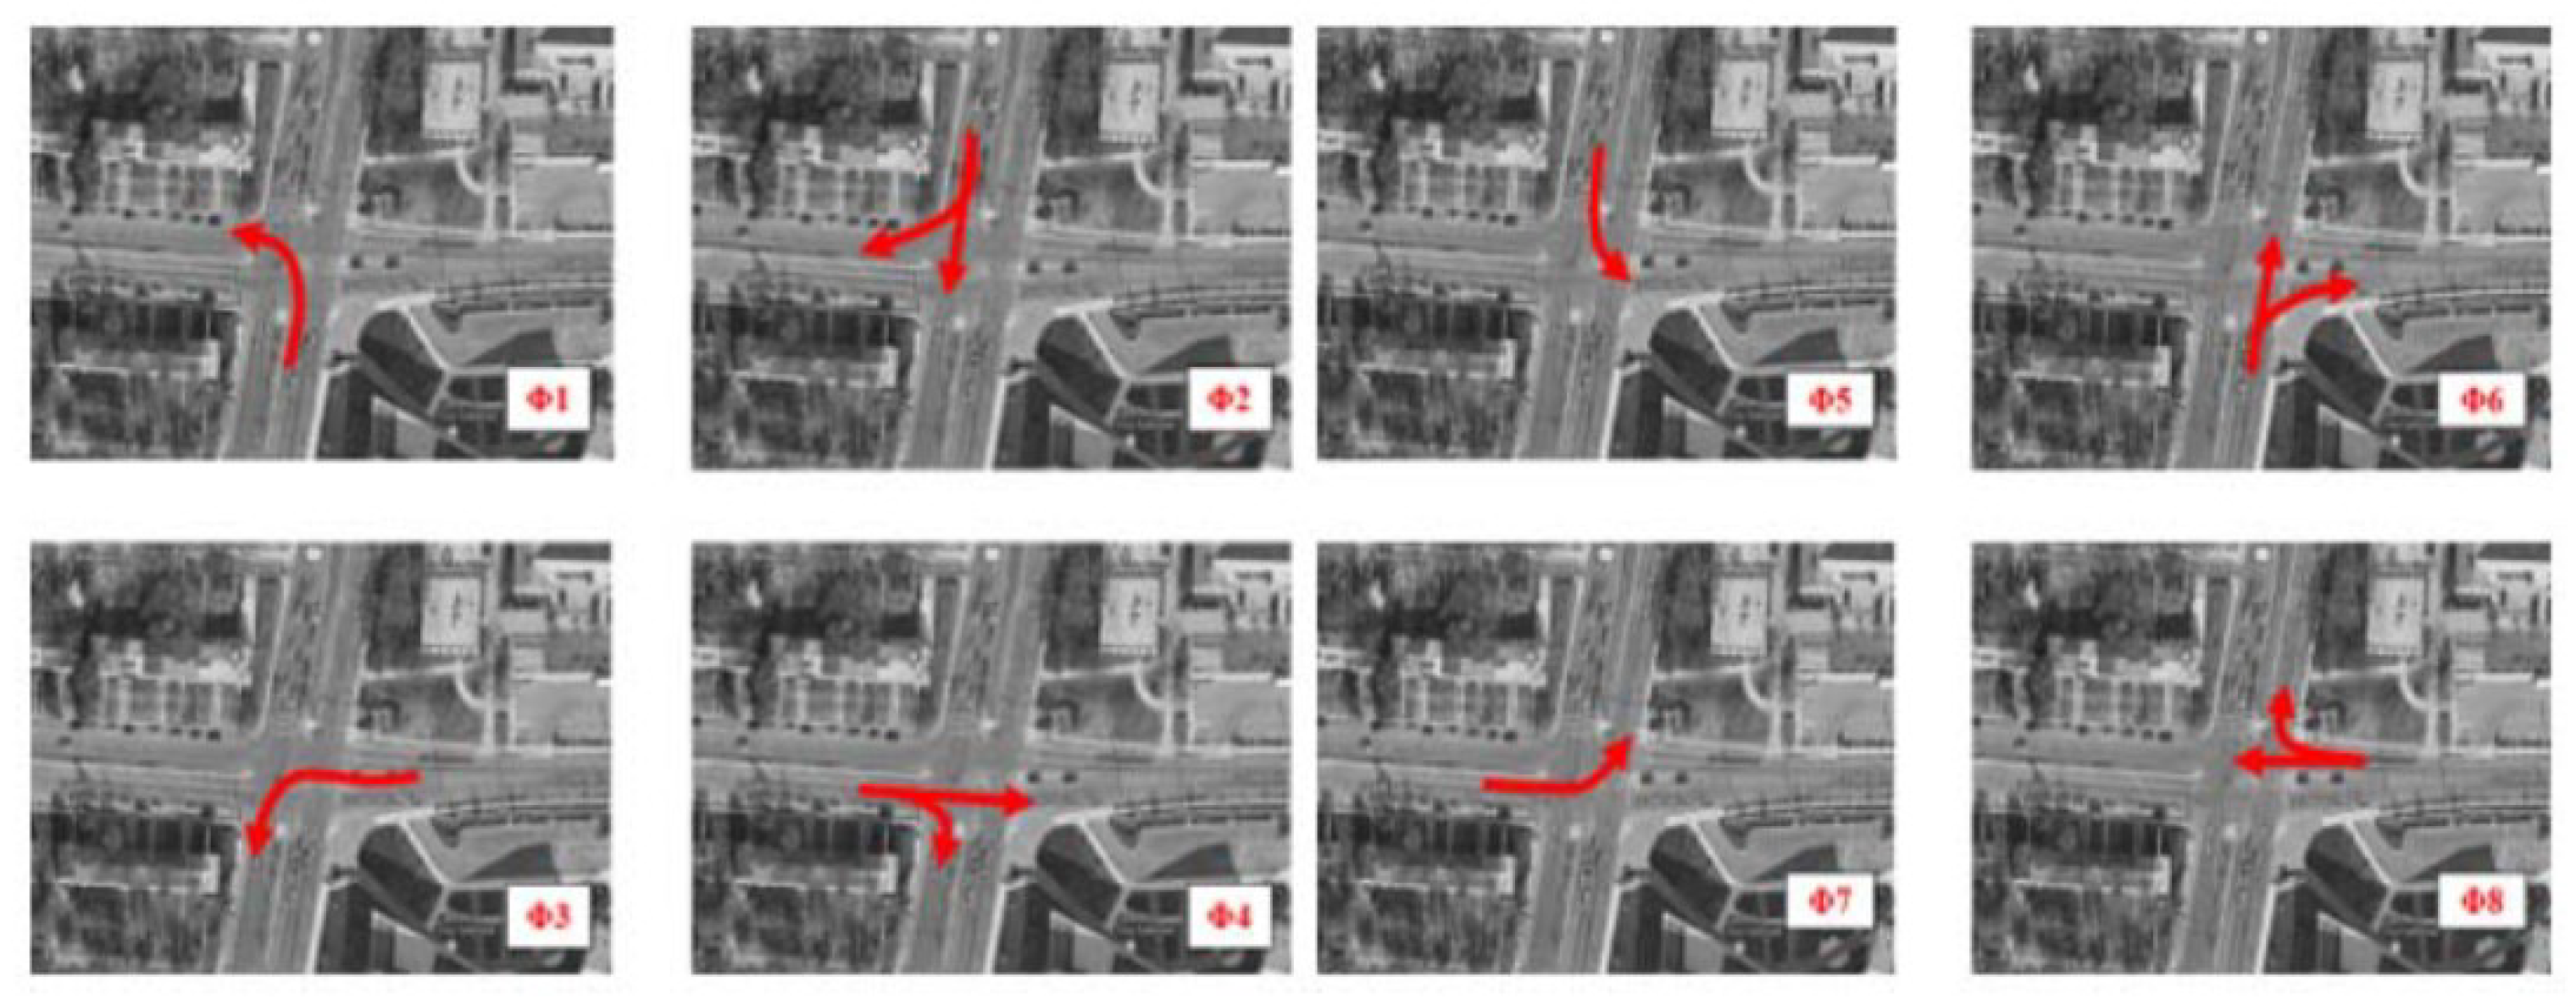
Figure 12.
Red light Runners in Phase #1.
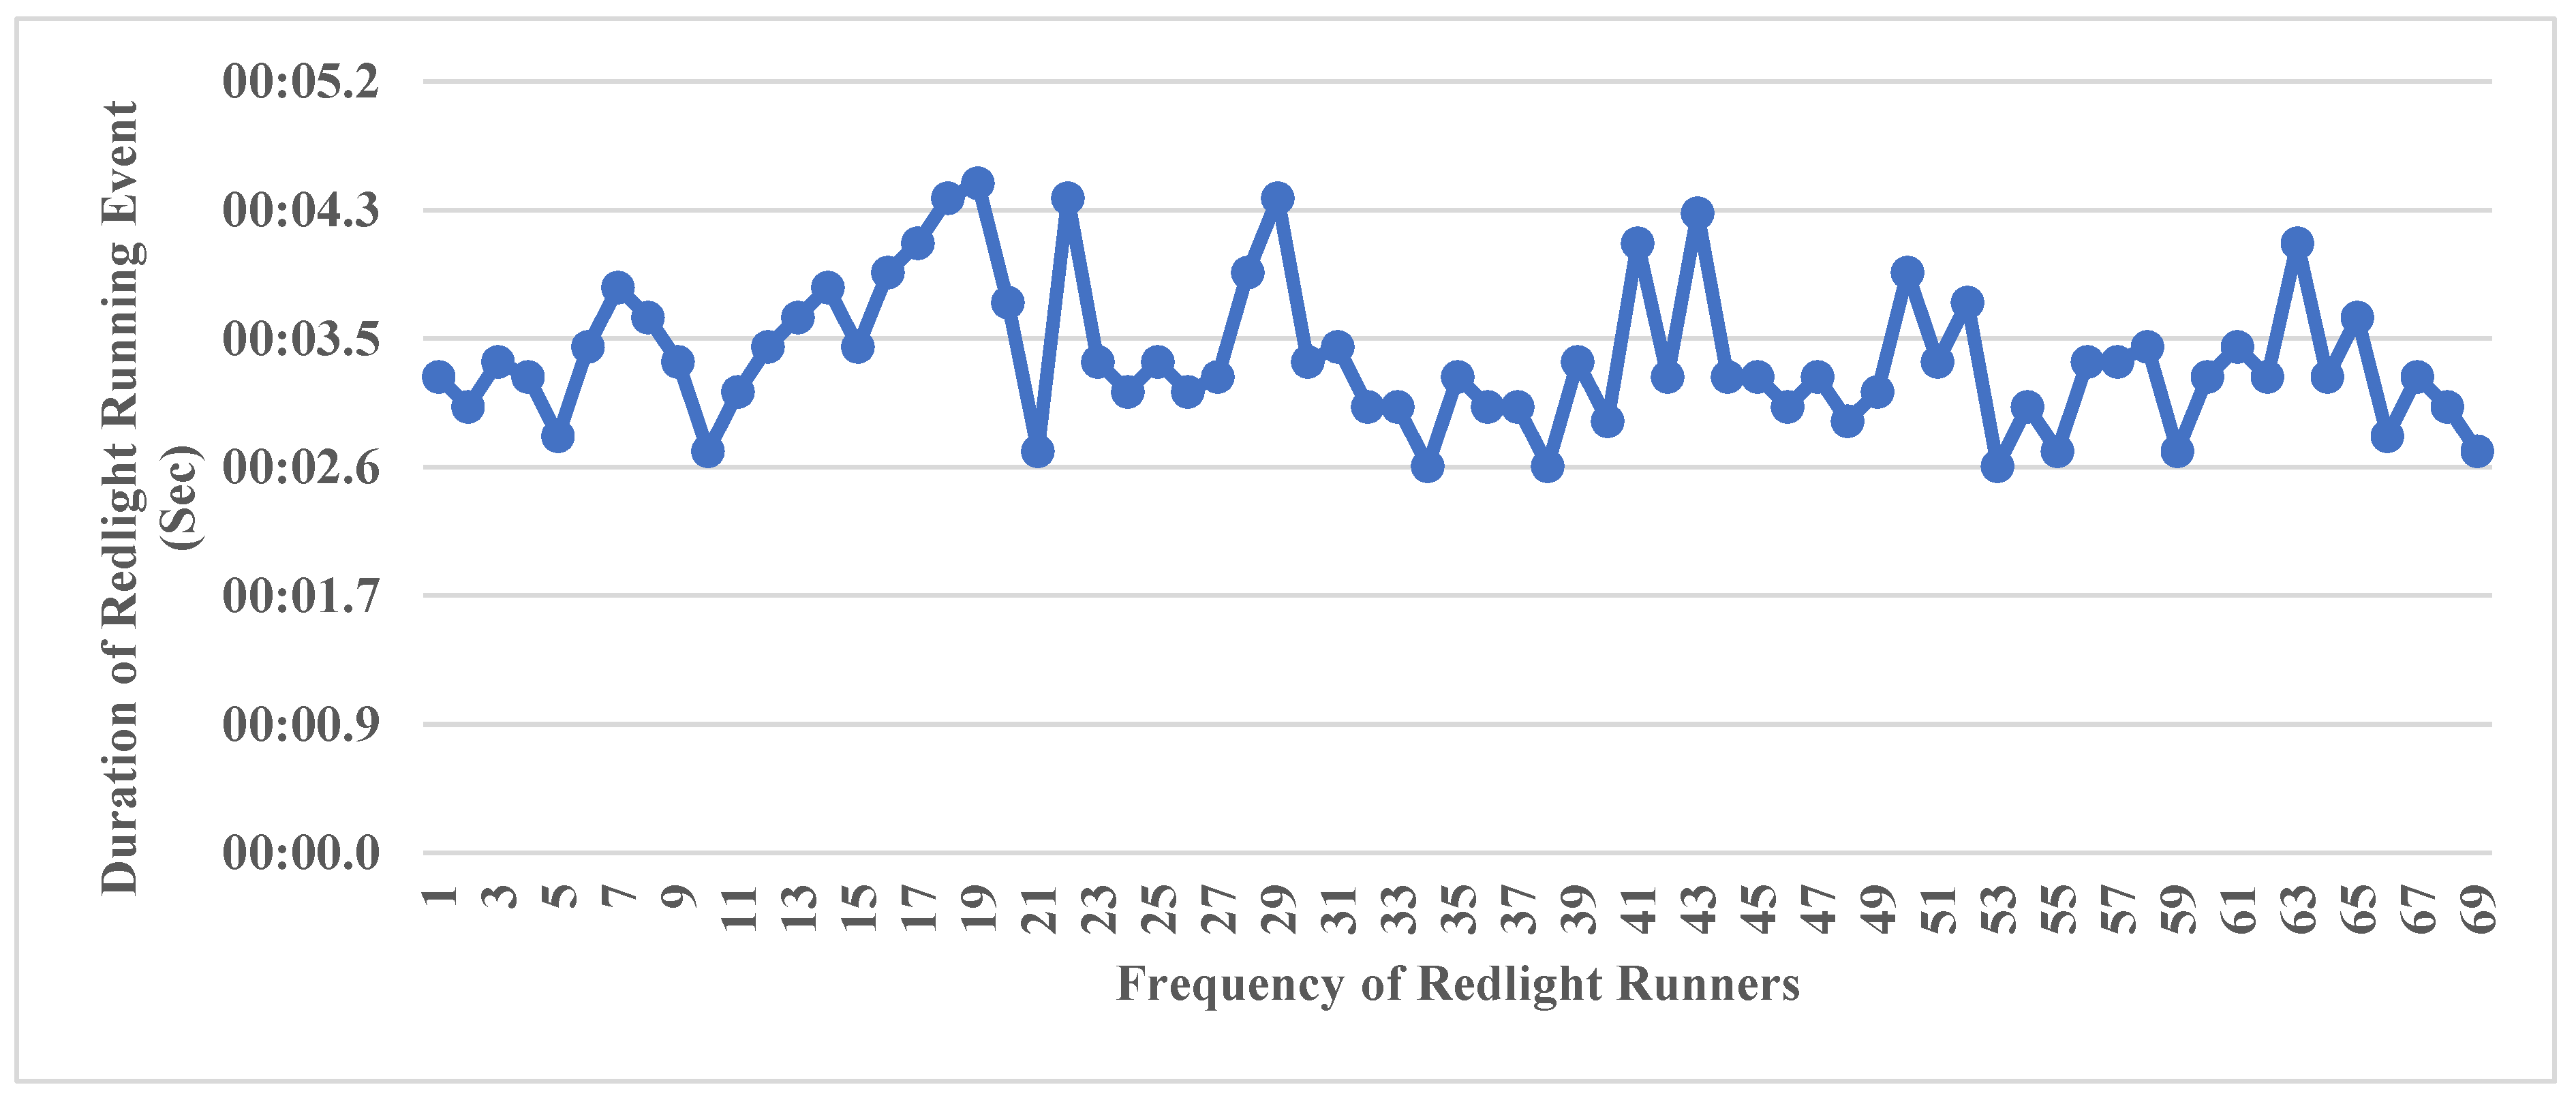
Figure 13.
Red light Runners in Phase #2.
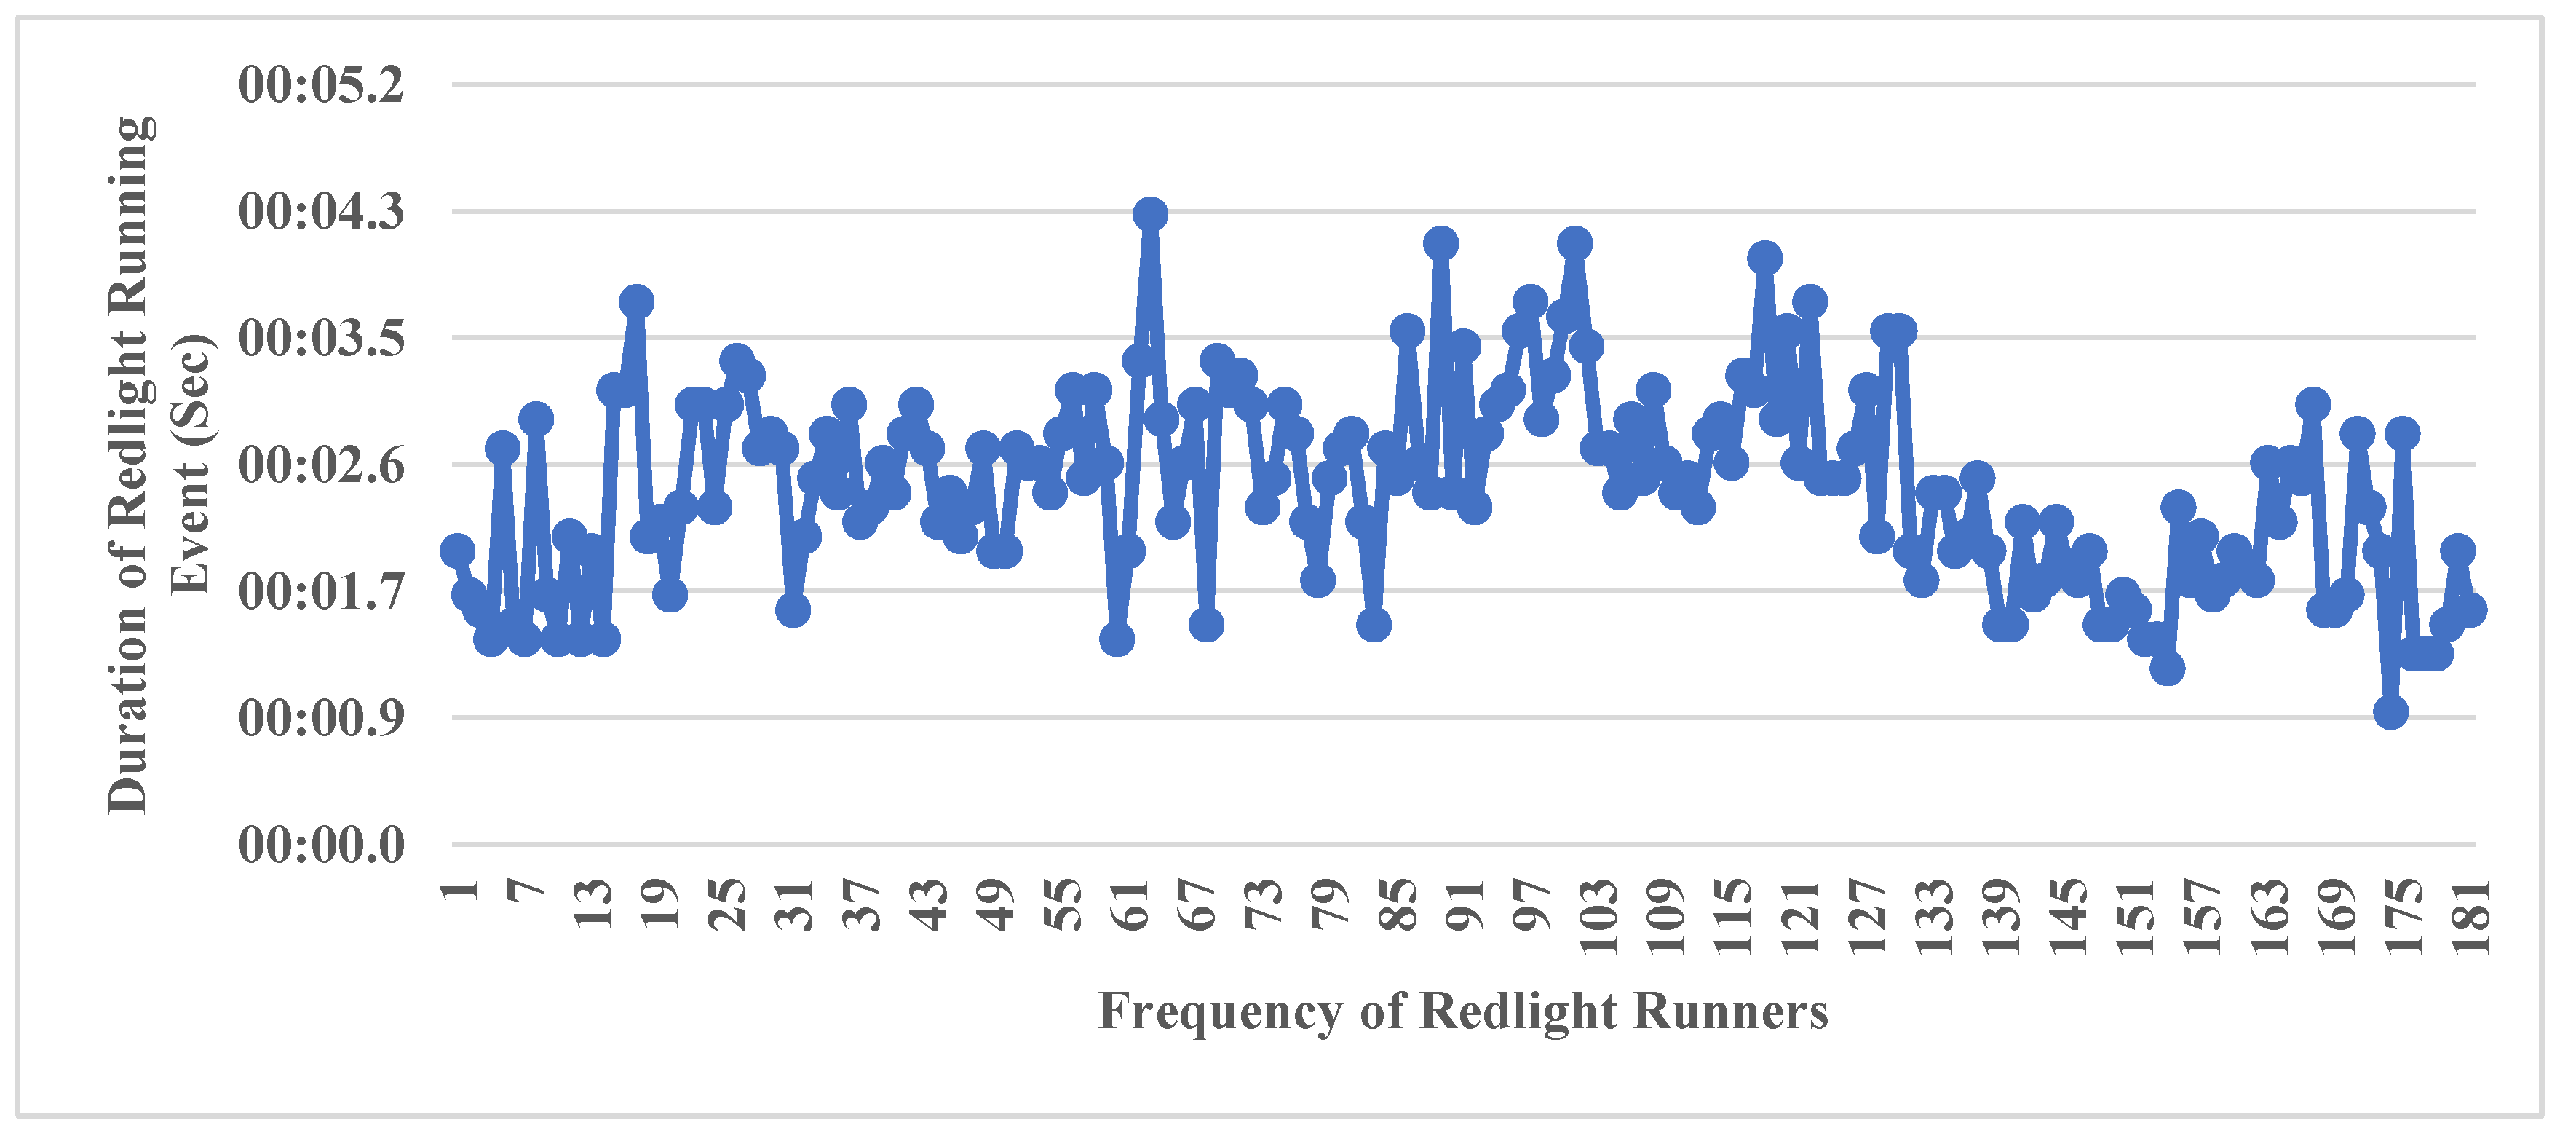
Figure 14.
Red light Runners in Phase #3.
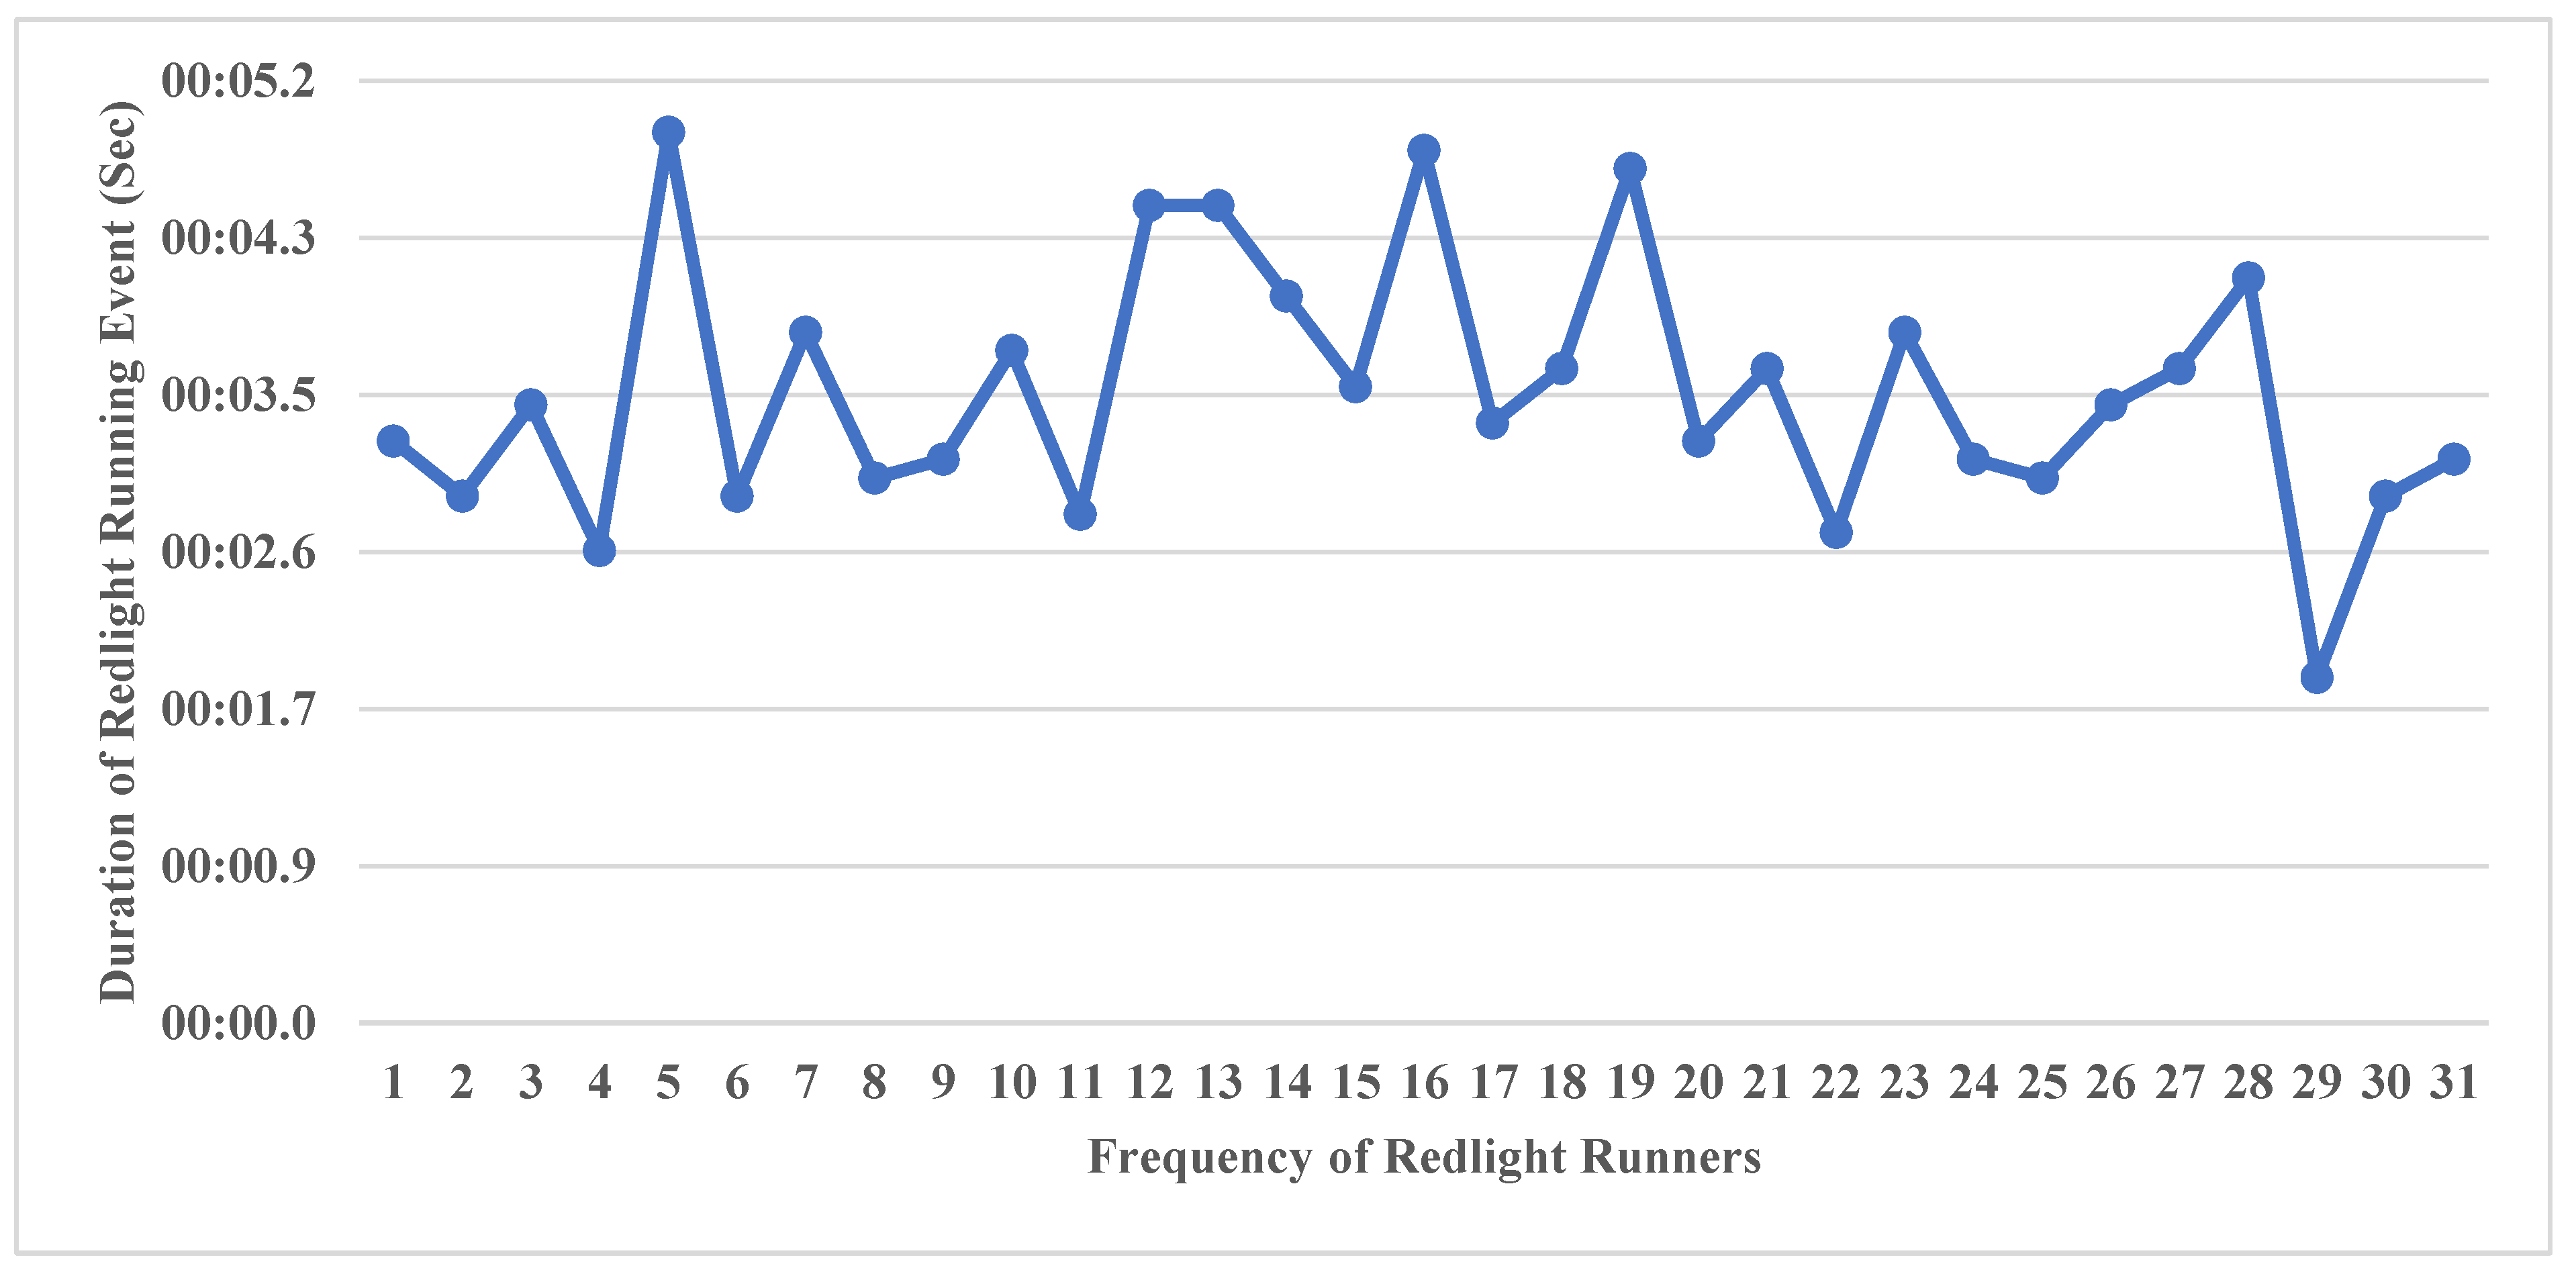
Figure 15.
Red light Runners in Phase #4.
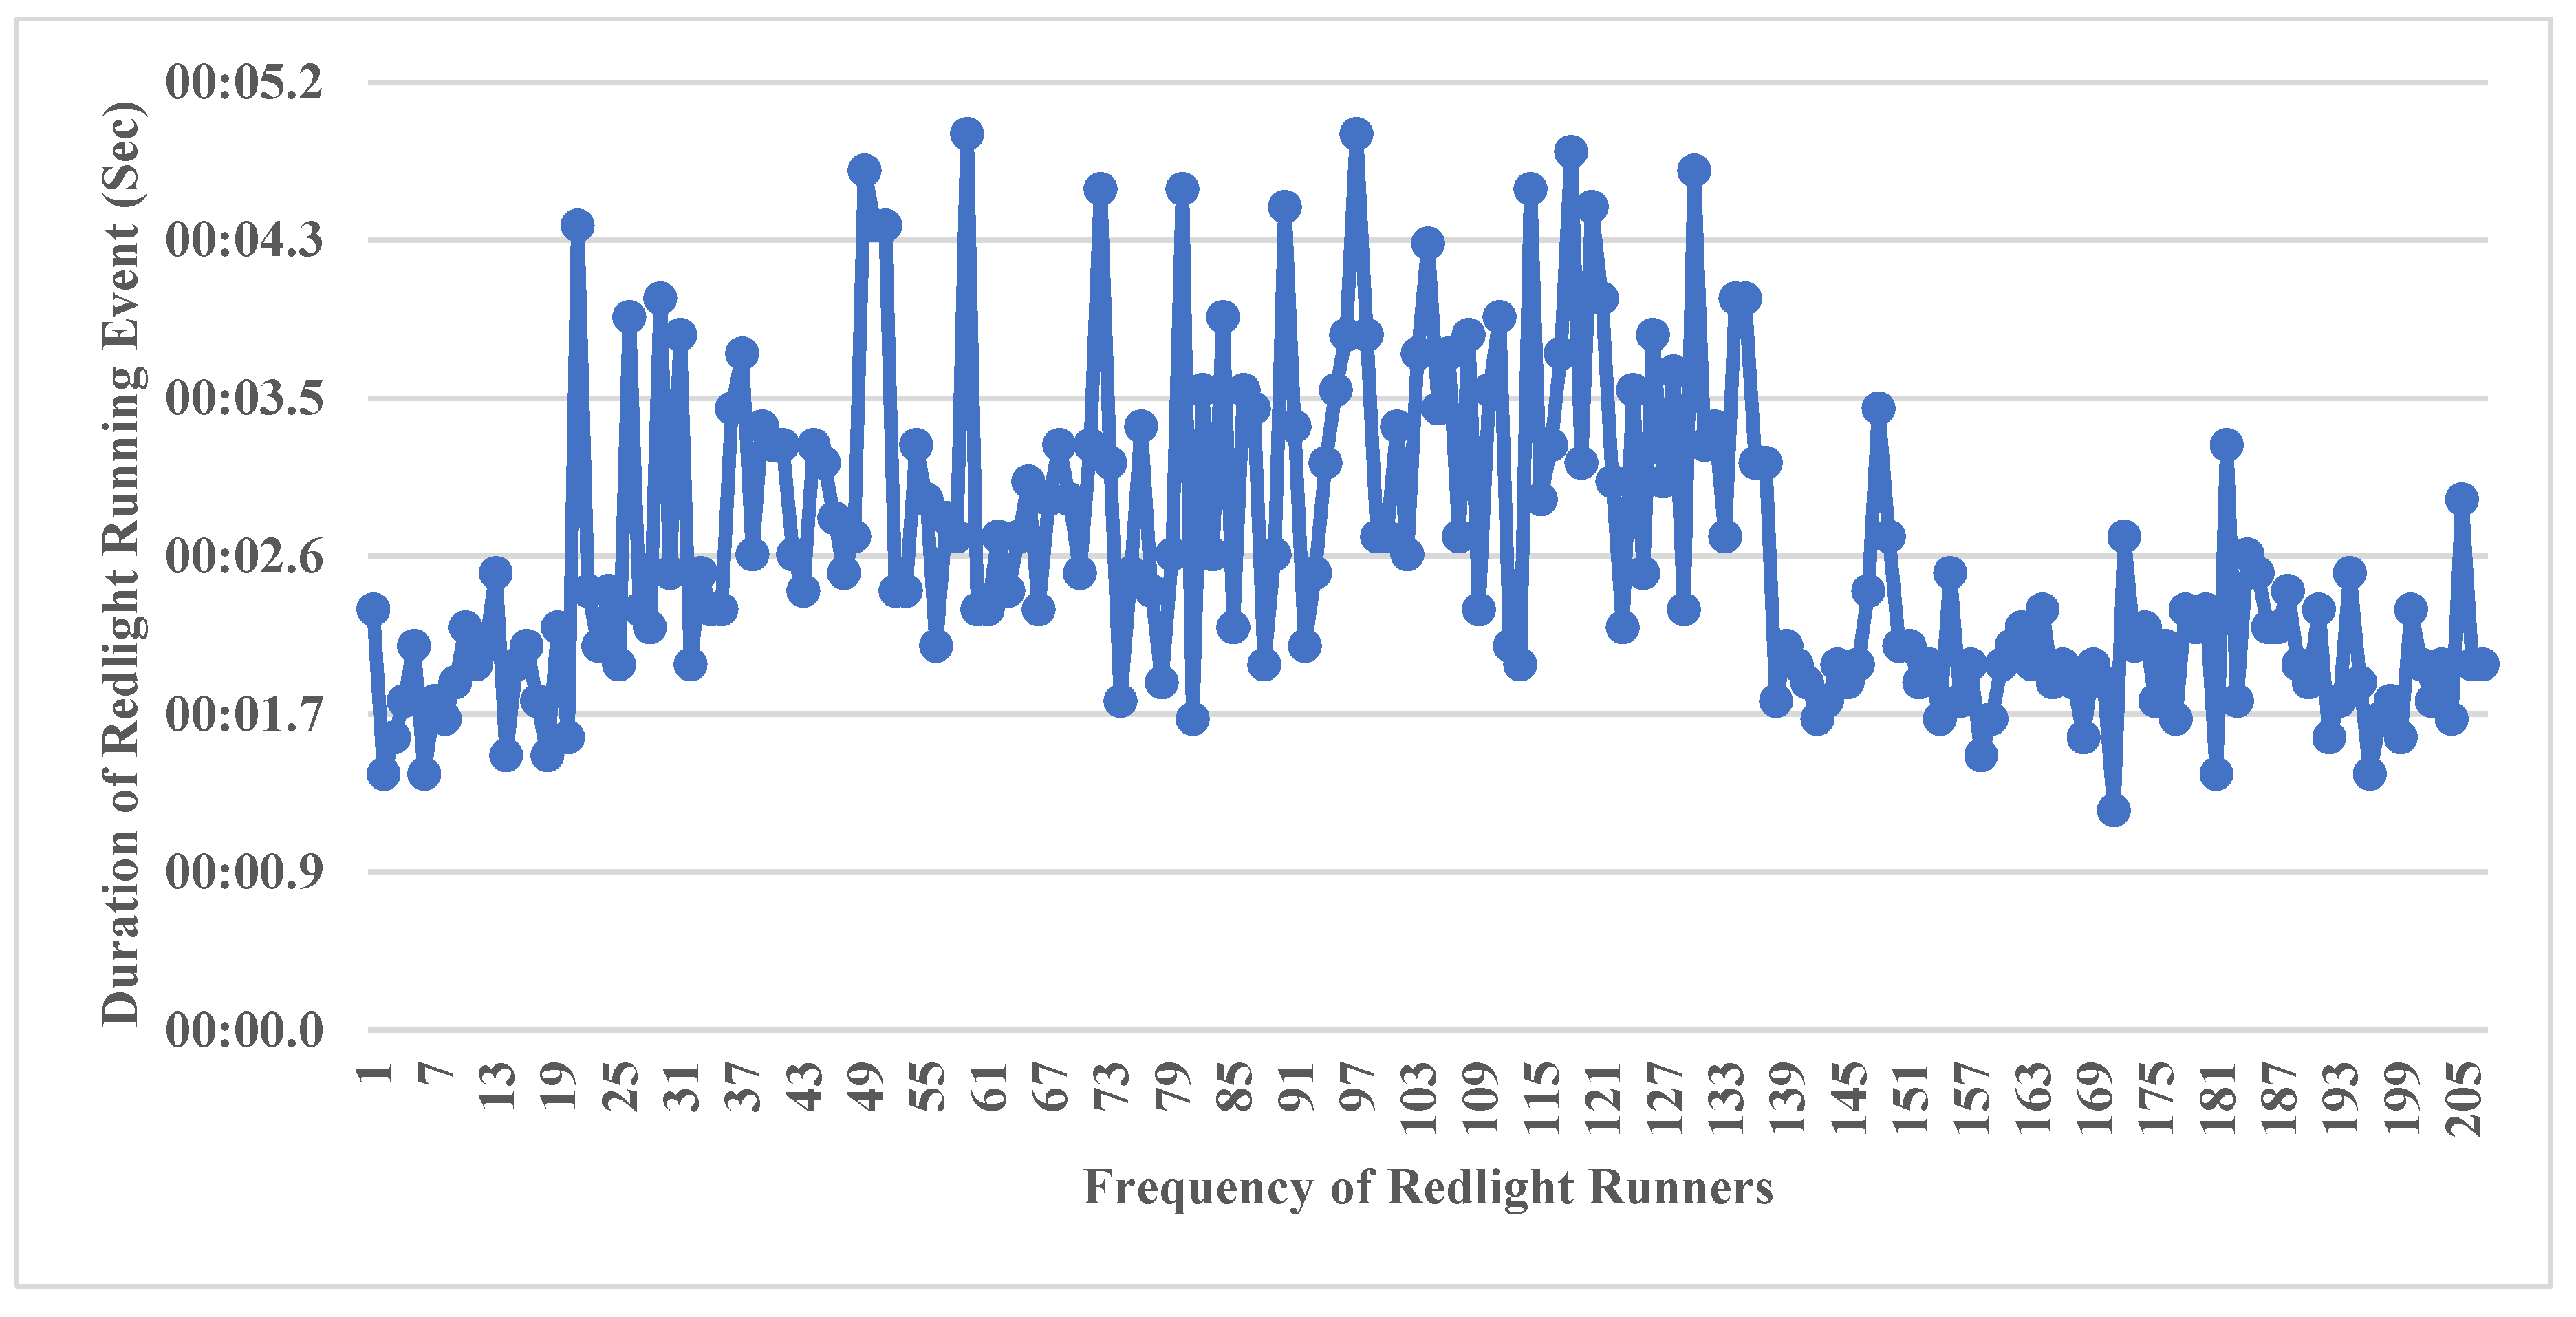
Figure 16.
Red light Runners in Phase #6.
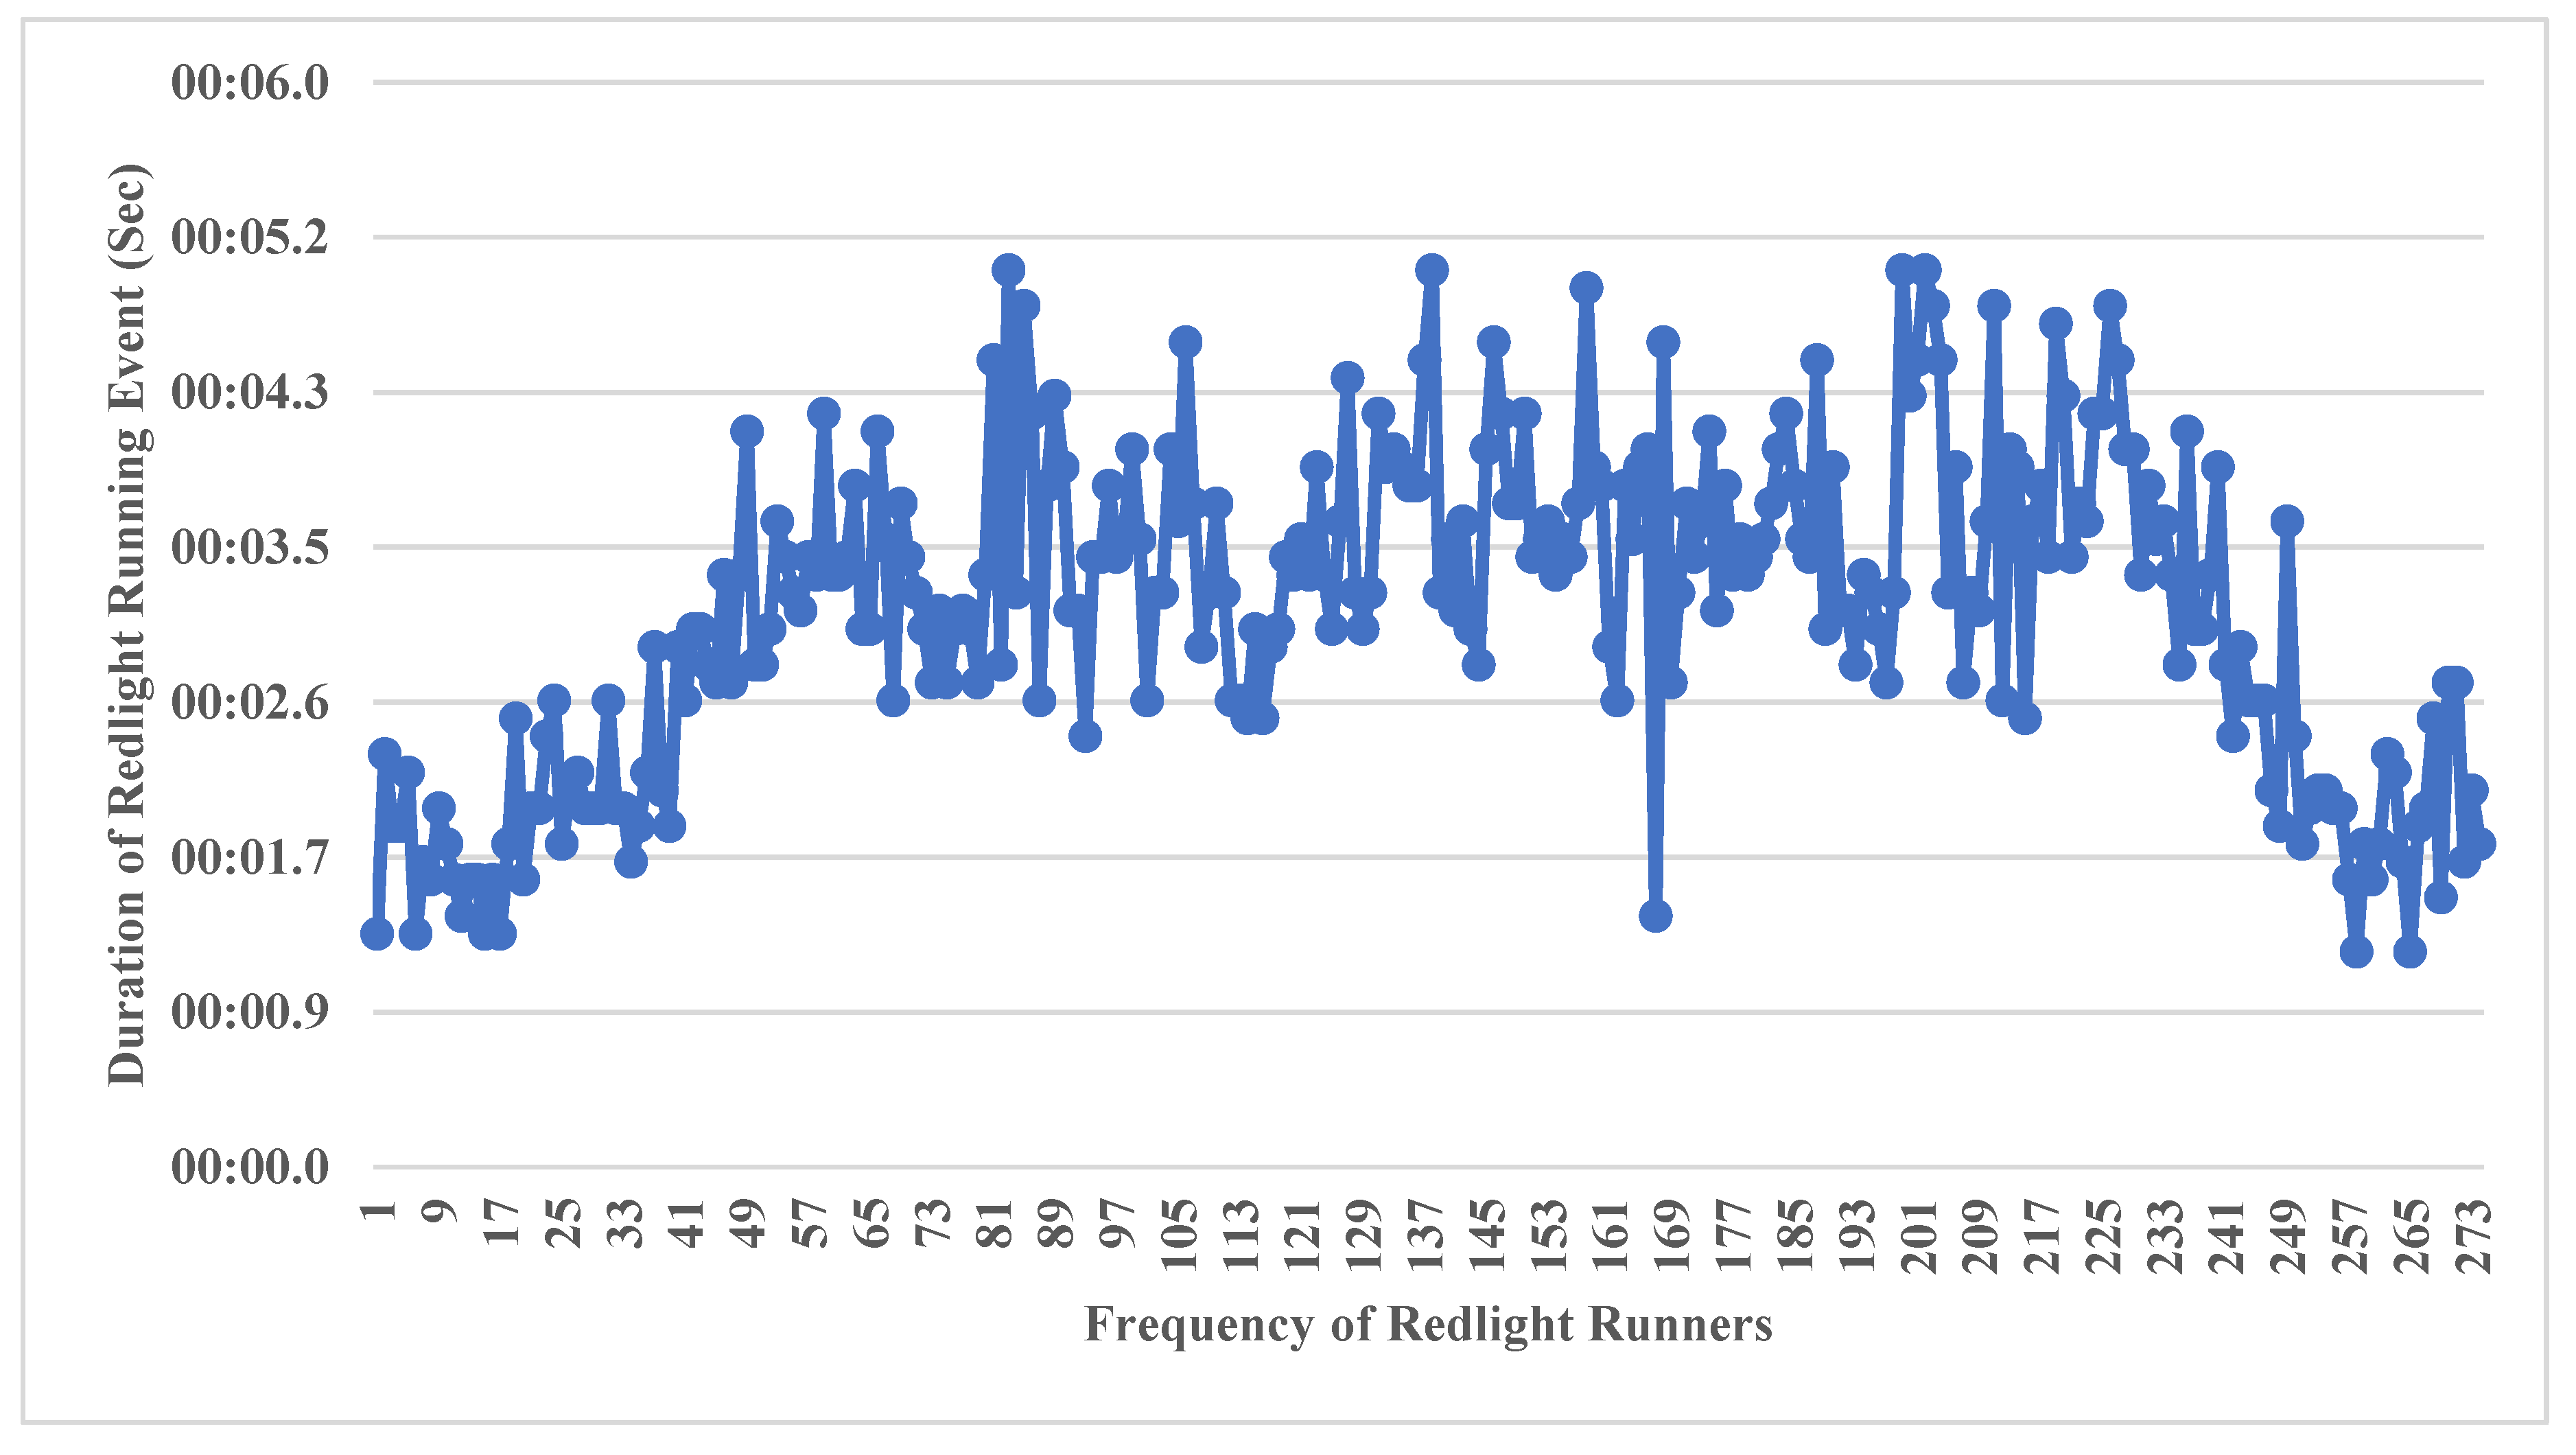
Figure 17.
Red light Runners in Phase #7.
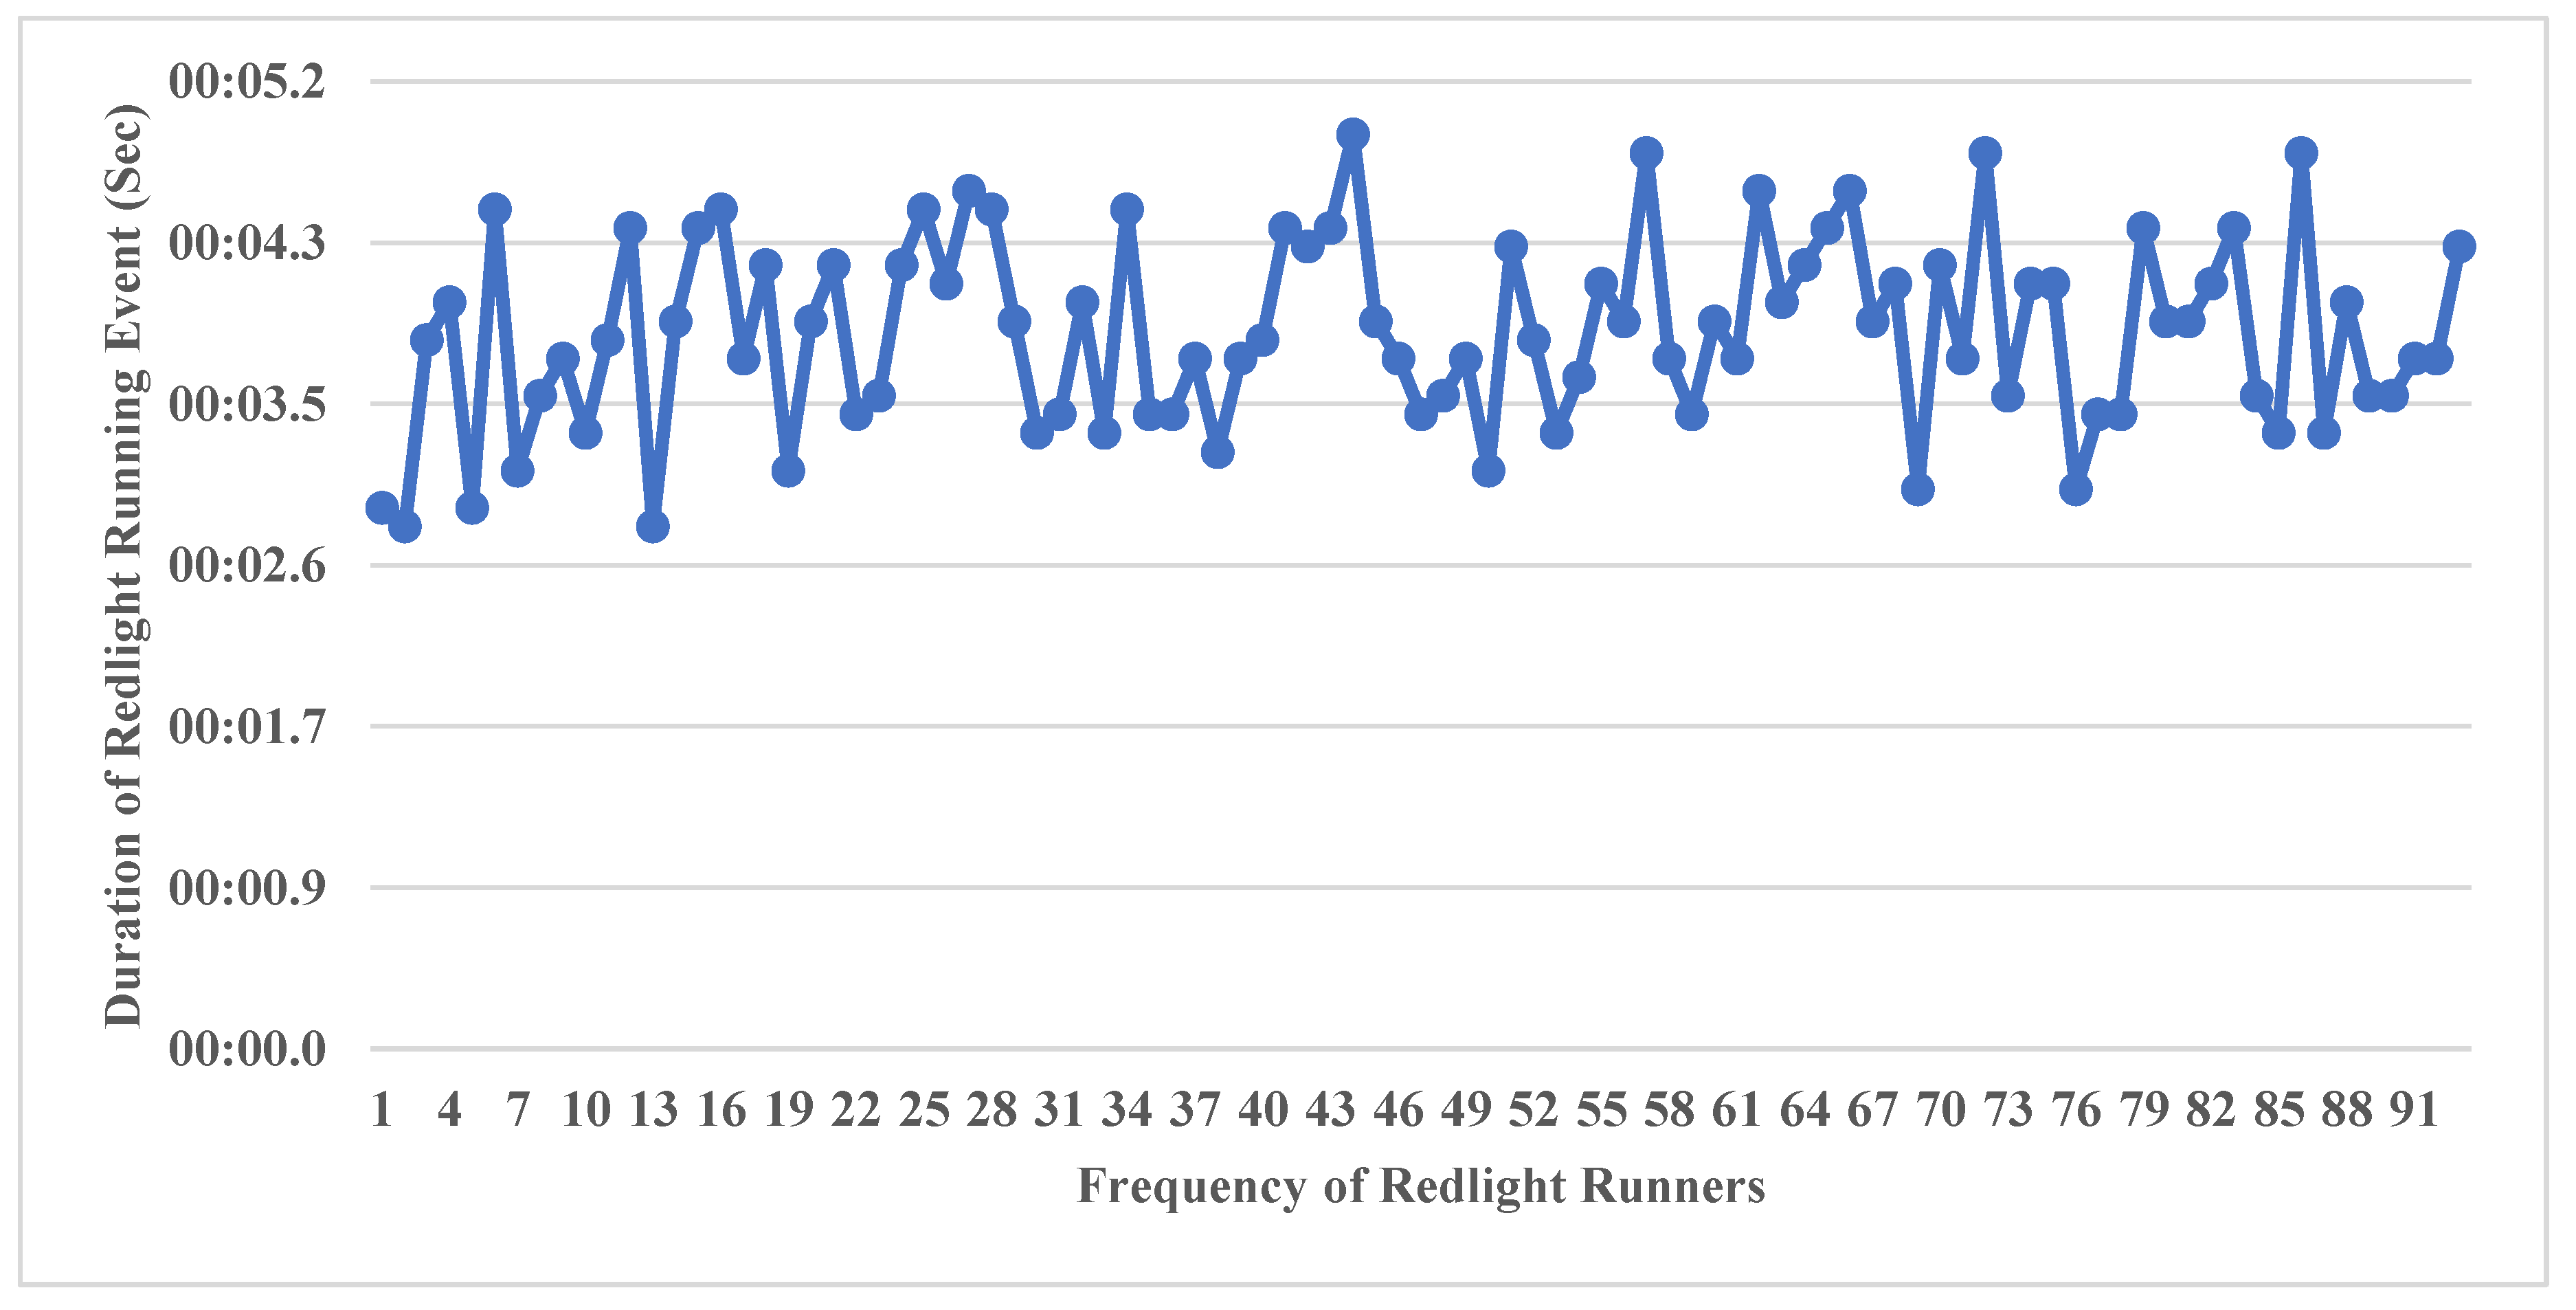
Figure 18.
Red light Runners in Phase #8.
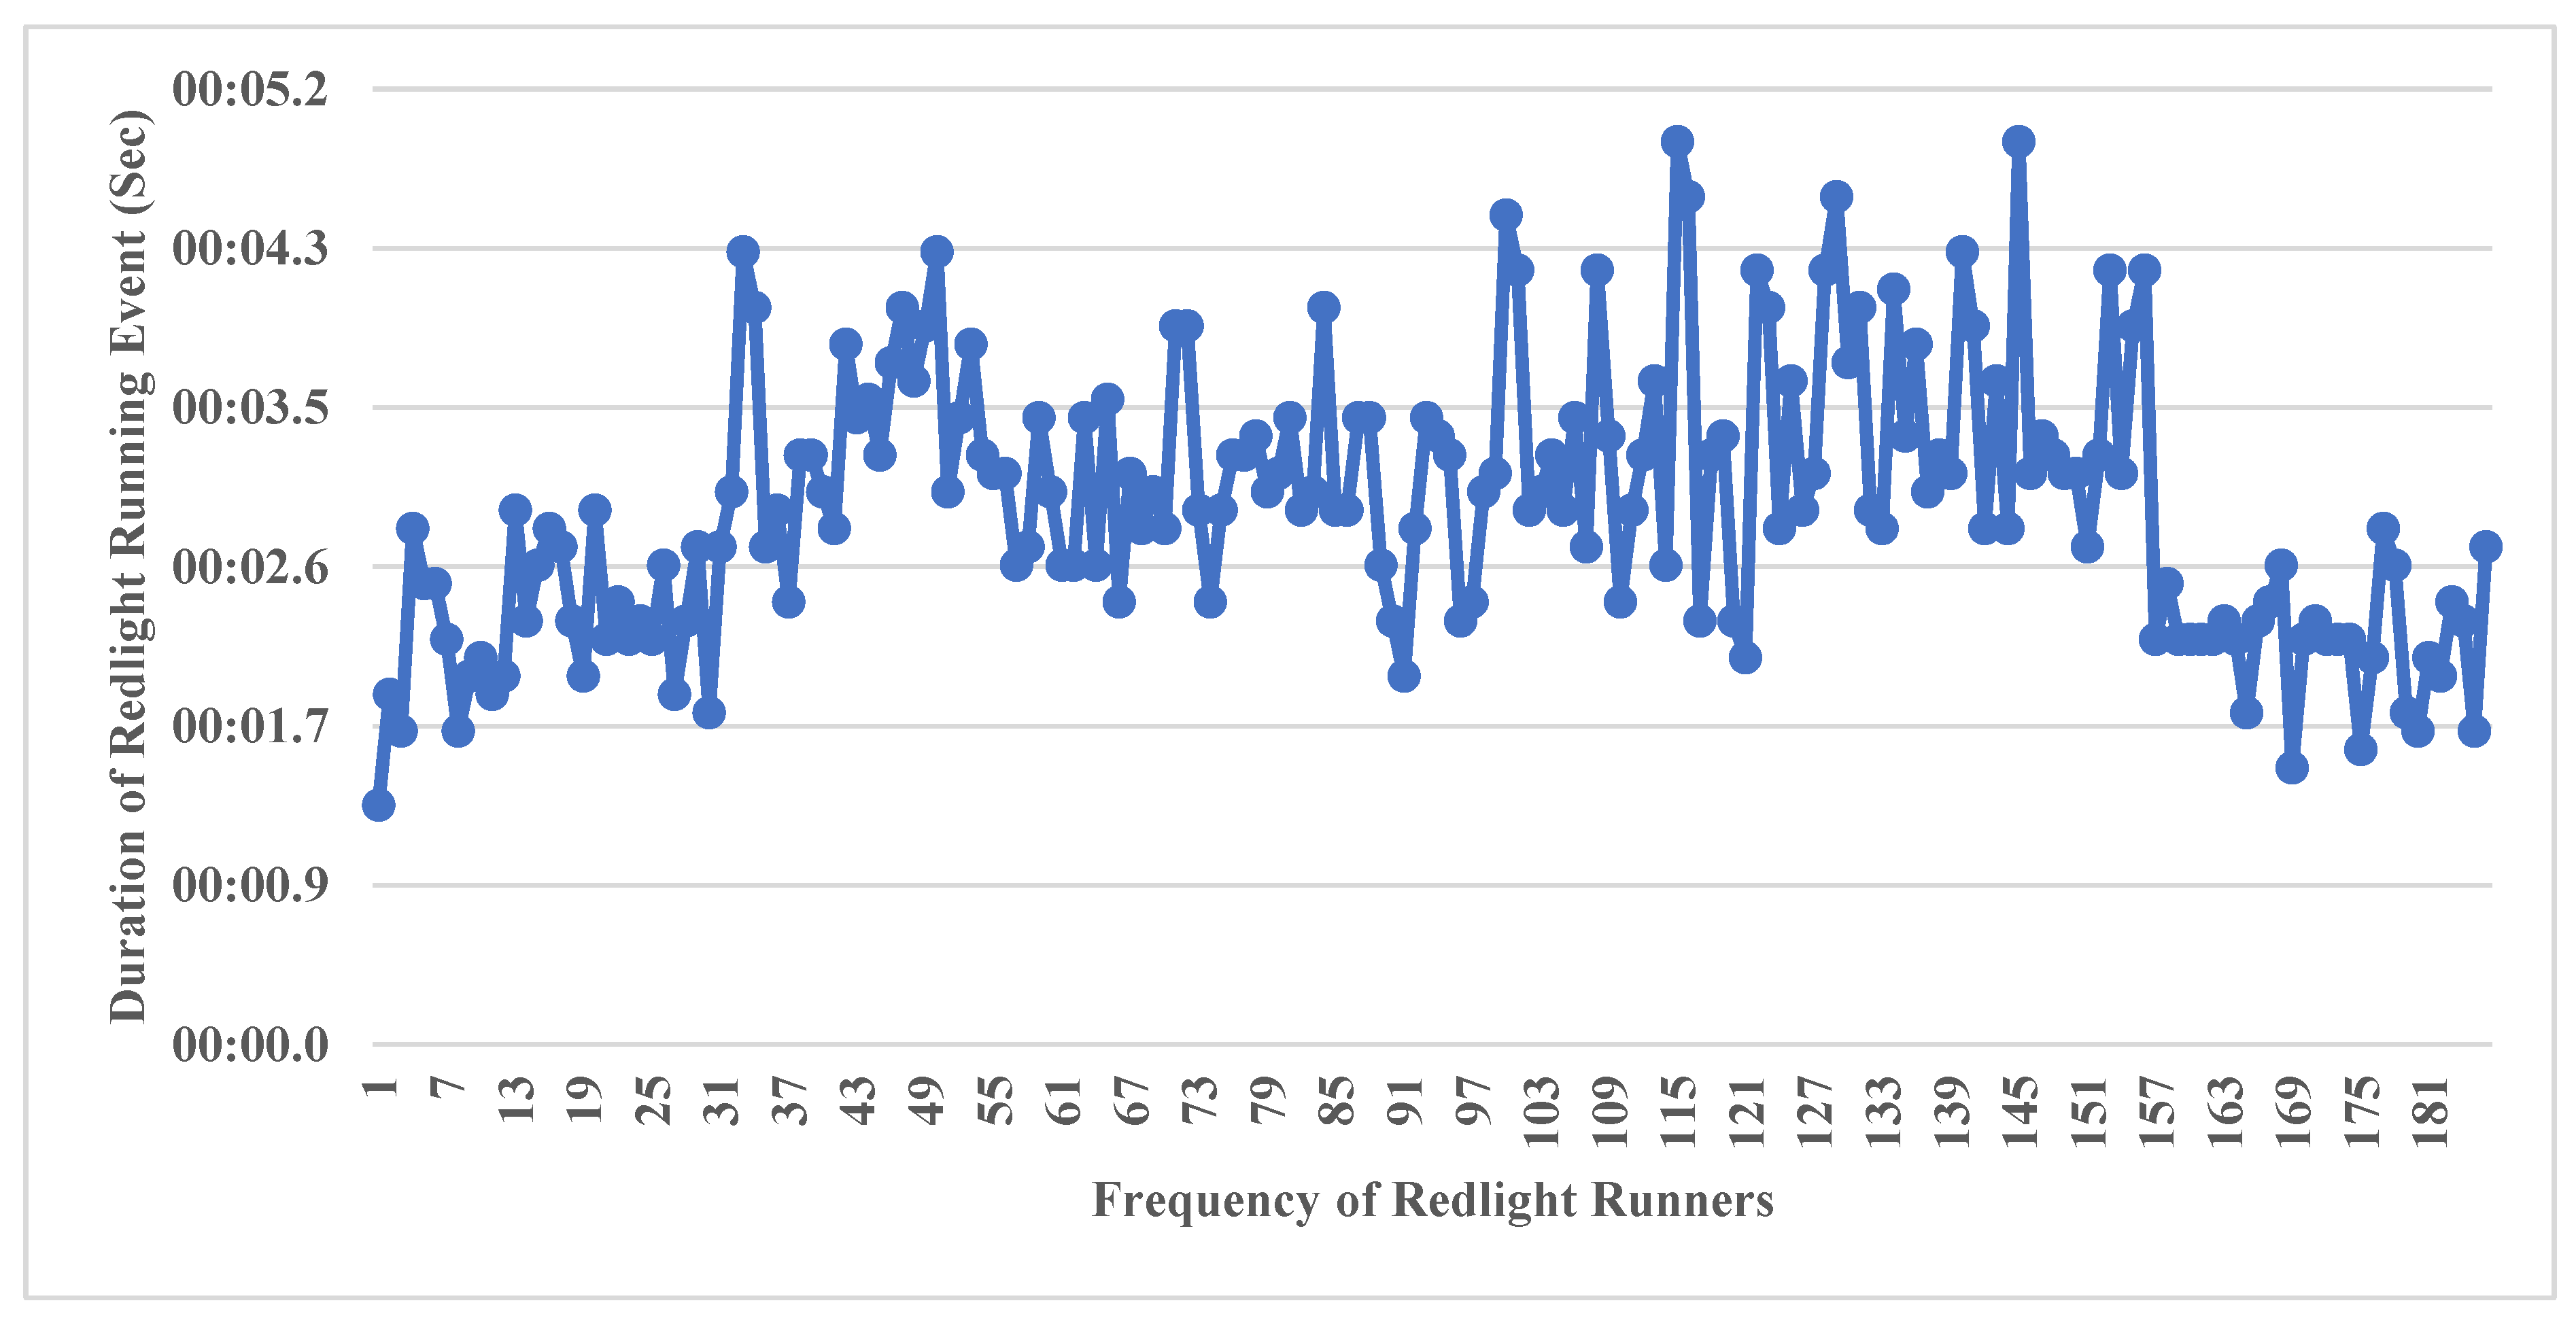

Table 1.
V2V Conflicts Analysis During the Work Zone Time Interval.
| Leading Movement | Following Movement | Frequency of Conflicts | Average Leading Movement Speed (km/hour) | Average Following Movement Speed (km/hour) | |
|---|---|---|---|---|---|
| ES | SN | 1 | 0.29 | 13.8 | 11.8 |
| ES | WE | 12 | 0.4 | 16.9 | 22.1 |
| ES | WN | 5 | 0.47 | 13.1 | 12.7 |
| EW | WN | 138 | 0.4 | 19.6 | 13.2 |
| EW | WS | 1 | 0.29 | 12.4 | 24.6 |
| NE | SN | 5 | 0.27 | 13.4 | 17.1 |
| NE | WN | 1 | 0.67 | 11.8 | 10.5 |
| NS | EW | 1 | 0.2 | 22.5 | 18.3 |
| NS | SW | 1 | 0.38 | 28.1 | 15.1 |
| NS | WE | 3 | 0.41 | 12.7 | 11.1 |
| NS | WN | 5 | 0.23 | 15.2 | 12.4 |
| SN | NE | 6 | 0.43 | 20.2 | 12.9 |
| SW | NS | 7 | 0.28 | 13.2 | 16.6 |
| WE | ES | 41 | 0.41 | 18.9 | 14.7 |
| WE | SN | 2 | 0.38 | 19.6 | 11.8 |
| WN | ES | 3 | 0.33 | 13.8 | 11.5 |
| WN | EW | 60 | 0.35 | 14.7 | 17.1 |
| WN | NE | 7 | 0.33 | 13.6 | 17.4 |
| WN | SW | 1 | 0.26 | 16.5 | 13.7 |
| WS | EW | 2 | 1.78 | 11.2 | 12.8 |
Table 2.
V2P Conflicts Analysis During the Work Zone Time Interval.
| Leading Movement | Following Movement | Frequency of Conflicts | |
|---|---|---|---|
| EN | Pedestrian | 4 | 0.33 |
| NE | Pedestrian | 2 | 0.24 |
| NS | Pedestrian | 7 | 0.36 |
| NW | Pedestrian | 2 | 0.26 |
| SE | Pedestrian | 2 | 0.26 |
| SN | Pedestrian | 7 | 0.31 |
| SW | Pedestrian | 2 | 0.47 |
| WE | Pedestrian | 1 | 0.4 |
| WN | Pedestrian | 12 | 0.34 |
| Pedestrian | EN | 3 | 0.29 |
| Pedestrian | ES | 1 | 0.26 |
| Pedestrian | EW | 1 | 0.22 |
| Pedestrian | NE | 2 | 0.34 |
| Pedestrian | NS | 1 | 0.29 |
| Pedestrian | NW | 1 | 0.28 |
| Pedestrian | SN | 6 | 0.33 |
| Pedestrian | WN | 4 | 0.24 |
Disclaimer/Publisher’s Note: The statements, opinions and data contained in all publications are solely those of the individual author(s) and contributor(s) and not of MDPI and/or the editor(s). MDPI and/or the editor(s) disclaim responsibility for any injury to people or property resulting from any ideas, methods, instructions or products referred to in the content. |
© 2024 by the authors. Licensee MDPI, Basel, Switzerland. This article is an open access article distributed under the terms and conditions of the Creative Commons Attribution (CC BY) license (http://creativecommons.org/licenses/by/4.0/).
Copyright: This open access article is published under a Creative Commons CC BY 4.0 license, which permit the free download, distribution, and reuse, provided that the author and preprint are cited in any reuse.


