
Submitted:
21 October 2023
Posted:
23 October 2023
You are already at the latest version
Abstract
This study investigates the application of Light Detection and Ranging (LiDAR) sensor technology for data collection at signalized intersections characterized by a high rate of traffic crashes. The research aims to provide valuable insights into the potential of LiDAR-based data analysis to enhance road safety and traffic management at signalized intersections. The research methodology involved the deployment of LiDAR sensors at Marlboro Pike & Brooks Dr. signalized intersection in Coral Hills, Maryland. Two LiDAR sensors installed in this intersection to collect high-resolution, three-dimensional data of the intersection area from June, 1st to July, 7th 2023. The data included information on vehicle trajectories, speeds, and behaviors, as well as pedestrian and cyclist movement patterns. Concurrently, historical traffic crashes recorded and traffic flow data were obtained for the same intersection.The analysis of LiDAR data involved several key aspects including LiDAR data allowed for a precise evaluation of traffic flow patterns, including congestion points, traffic volume fluctuations, and peak-hour behavior. This information provided insights into potential factors contributing to crashes. By analyzing LiDAR data, the study identified near-miss incidents, which are often precursors to actual crashes. This proactive approach could assist in identifying crash-prone areas within the intersection. The LiDAR data analysis also focused on pedestrian and cyclist movements, including jaywalking and bike lane usage. The aim was to identify areas where infrastructure improvements could enhance safety for vulnerable road users. LiDAR data was compared with historical crash data to identify specific locations within the intersection that exhibited a high frequency of crashes. This information can guide targeted safety interventions. Last but not least, the study explored opportunities to optimize traffic signal timings based on real-time traffic data from LiDAR. Adaptive signal control could help mitigate congestion and reduce the risk of crashes.The results of this study demonstrated the potential of LiDAR sensor technology in collecting detailed data for traffic analysis in signalized intersections. By combining LiDAR data with historical crash records and traffic flow data, traffic engineers and urban planners can develop evidence-based strategies to reduce the frequency and severity of crashes in high-risk areas. Ultimately, this research contributes to a comprehensive understanding of how LiDAR technology can be employed to enhance road safety and traffic management, providing valuable insights for traffic engineers, urban planners, and policymakers seeking to improve the safety and efficiency of signalized intersections with a history of high traffic crashes.
Keywords:
LiDAR sensor technology
; signalized intersections
; historical crash data
; traffic safety
; vulnerable road users
1. Introduction
Signalized intersections serve as critical junctures in urban and suburban transportation networks, facilitating the orderly flow of vehicular and pedestrian traffic [1]. However, they are also well-known hotspots for traffic crashes, often resulting in substantial human and economic costs. Understanding and mitigating the factors contributing to crashes at these intersections is of paramount importance for enhancing road safety and optimizing traffic management. This study delves into the application of LiDAR sensor technology as a potent tool for comprehensive data collection and analysis at signalized intersections characterized by a high rate of traffic crashes.
LiDAR technology has emerged as a groundbreaking means of collecting precise and high-resolution spatial data in a variety of applications, including autonomous vehicles, environmental monitoring, and urban planning [2]. Its unique ability to capture detailed three-dimensional information about the surrounding environment in real-time makes it an ideal candidate for traffic analysis at signalized intersections. By leveraging LiDAR's capabilities, this research seeks to provide a deeper understanding of the intricate dynamics at play within these crash-prone areas and to develop data-driven strategies for improving safety and efficiency.
The motivation behind this study arises from the pressing need to address traffic crashes at signalized intersections. Such crashes often result in injuries, fatalities, property damage, and traffic disruptions, impacting both individuals and communities. Despite advancements in traffic engineering and safety measures, crashes continue to occur with alarming frequency, necessitating innovative approaches to data collection and analysis. LiDAR technology offers a promising avenue for gaining insights into traffic behavior, identifying crucial hotspots, and devising evidence-based interventions.
In this context, the primary objectives of this research are as follows:
- 1)
- Data Collection: Deploy LiDAR sensors at a selected signalized intersection known for a high rate of traffic crashes to collect comprehensive data on vehicular, pedestrian, and cyclist movements, as well as other environmental factors influencing traffic dynamics.
- 2)
- Data Analysis: Utilize advanced data analysis techniques to extract valuable information from the LiDAR-generated datasets, including traffic flow patterns, near-miss crashes, pedestrian and cyclist behavior, and crucial hotspots.
- 3)
- Integration with Historical Data: Combine LiDAR data with historical crash records and traffic flow data to identify patterns and correlations that may shed light on the root causes of crashes at the selected intersection.
- 4)
- Safety and Efficiency Enhancements: Develop evidence-based recommendations for safety enhancements, traffic signal optimization, and infrastructure improvements aimed at reducing the frequency and severity of accidents.
- 5)
- Policy Implications: Provide insights and recommendations to inform policy decisions, urban planning, and traffic management strategies, with the ultimate goal of improving road safety and optimizing traffic flow at signalized intersections.
Hereupon, this study represents a significant step forward in the realm of traffic safety and management by harnessing the power of LiDAR technology to comprehensively analyze and address the challenges posed by high-crash signalized intersections. By doing so, it seeks to contribute to the ongoing efforts to create safer and more efficient transportation systems while minimizing the human and economic toll of traffic accidents. The following sections will delve into the methodology, data analysis, findings, conclusion, and references.
2. Methodology
The first step in the methodology was the careful selection of a signalized intersection with a documented high rate of traffic crashes. Criteria for selection included historical crash data, severity of crashes, traffic volume, and the presence of vulnerable road users such as pedestrians and cyclists. Two LiDAR sensors were strategically installed at key vantage points within and around the selected intersection. These LiDAR sensors were chosen for their ability to capture detailed, three-dimensional data with high precision and accuracy. Two sensors were synchronized to ensure comprehensive coverage of the intersection. The LiDAR sensors continuously collected data over an extended monitoring period. The data included:
- 1)
- Vehicle Movement: LiDAR sensors recorded the trajectories, speeds, and behaviors of vehicles approaching, traversing, and exiting the intersection. This included information on lane changes, accelerations, decelerations, and potential violations of traffic rules.
- 2)
- Pedestrian and Cyclist Behavior: Data collection also encompassed the movement patterns of pedestrians and cyclists within the intersection, including jaywalking, adherence to crosswalks, and interaction with vehicles.
- 3)
- Traffic Conflict: The LiDAR sensors are capable of recording Post Encroachment Time (PET) as one of key surrogate safety measures at signalized intersections. LiDAR sensors emit laser beams, and when these beams encounter objects, they bounce back to the sensor. By analyzing the time, it takes for the laser pulses to return and the angle at which they return, LiDAR sensors can create a 3D point cloud map of the objects in their vicinity. The data generated by LiDAR sensors is processed by computer algorithms as explained in author’s previous studies [3,4,5,6,7,8] to identify and classify objects. Machine learning and computer vision techniques were used to differentiate between various object types. PET refers to the time interval between the moment a traffic signal turns red (the end of the green phase) and when the last vehicle or pedestrian has cleared the intersection. At a signalized intersection, traffic signals cycle through different phases, including green (go), yellow (warning), and red (stop). PET specifically focuses on the time during the red phase. When the signal turns red, it's essential for all vehicles and pedestrians within the intersection to have enough time to clear the area safely. The time required for the last vehicle or pedestrian to exit the intersection after the signal turns red is known as the clearance time. PET is the duration of time after the signal turns red but before the intersection is entirely cleared of vehicles and pedestrians. It represents the potential conflict zone where vehicles and pedestrians are still present within the intersection while cross traffic may be starting to move on the green signal.
The significance of PET lies in its role in intersection safety and efficiency. In terms of “safety”, a sufficient PET ensures that vehicles and pedestrians have ample time to clear the intersection, reducing the risk of collisions and conflicts between cross traffic and those still within the intersection. In terms of “efficiency”, longer PET can lead to longer delays for cross-traffic, reducing the overall efficiency of the intersection. Balancing PET with the needs of different road users is essential for optimizing traffic flow. Traffic engineers use data and analysis to determine the appropriate duration for PET based on factors such as traffic volume, pedestrian activity, road geometry, and local regulations. The goal is to strike a balance between safety and traffic flow, making sure that all road users can safely exit the intersection before cross traffic is given the green light. Proper signal timing and coordination play a crucial role in achieving this balance and minimizing conflicts at signalized intersections.
In order to provide an accurate research, this study combines the LiDAR-generated data with historical crash records obtained from relevant authorities (e.g., traffic police, transportation departments). This integration will facilitate the identification of crash locations within the LiDAR data. Near-miss incidents were identified by analyzing LiDAR data for instances where vehicles or pedestrians came close to collision without actually colliding. Then, the crucial areas of the intersection were identified where pedestrian and cyclist safety can be improved. Additionally, the real-time traffic data was used from LiDAR to assess the effectiveness of current traffic signal timings.
Statistical analyses were performed, including correlation and regression analyses, to identify relationships between variables and crash occurrences [9,10,11,12,13,14]. Based on the findings, evidence-based recommendations were developed for safety improvements, traffic management strategies, and infrastructure enhancements at the selected intersection. Consequently, this methodology outlines the systematic approach to collecting, analyzing, and interpreting LiDAR sensor data at a signalized intersection with a high rate of traffic crashes. It aims to provide a data-driven understanding of the factors contributing to crashes and to offer actionable recommendations for improving road safety and traffic management. The methodology is designed to be adaptable to various intersection contexts and serves as a valuable tool for addressing traffic safety challenges.
3. Data Analysis
This study concentrates on Marlboro Pike & Brooks Dr. intersection in Coral Hills, Maryland. The LiDAR data from June, 1st to July, 7th 2023 was analyzed to provide a practical accurate understanding of the intersection safety conditions. Figure 1 shows the intersection and the main land-uses around the intersection’s location. The installation locations of the LiDAR sensors are shown by two red circle-shaped figures.
The vehicle volume, pedestrian and bicyclists volume were analyzed over the specified interval. In the investigated intervals, morning, midday, and afternoon peak hours were identified based on diurnal vehicle, pedestrian, and bicycle counts. Figure 2 demonstrates the morning, Figure 3 shows mid-day, and Figure 4 shows afternoon peak hours’ vehicle volumes of peak day of the interval (Friday, June 2nd). It is worth mentioning that 07:30 – 08:30 AM, 13:00 – 14:00 PM, and 17:00 – 18:00 PM were identified as the morning, mid-day, and afternoon peak hours.
The speed changes at the intersection are illustrated in Figure 5.
As can be seen in Figure 5, 23.5 mph (=37.8 km/h), 18.3 mph (=29.4 km/h), 25.5 mph (=41 km/h), and 18.7 mph (=30.1 km/h) are collected by the LiDAR sensors as the average speed of NS (SBT), EW (WBT), SN (NBT), and WE (EBT) directions. It is evident from the speed diagram that the north-south approach to the intersection experiences higher diurnal speeds.
Considering the frequency and severity of vehicle-vehicle conflicts over the specified interval, the heat map of vehicle-vehicle conflicts was provided as shown in Figure 6.
According to the collected LiDAR data, frequency of vehicle – vehicle conflicts chart (Figure 7), severity (1/pet) of vehicle – vehicle conflicts chart (Figure 8), hourly distribution of vehicle-vehicle conflict – frequency chart (Figure 9), hourly distribution of vehicle-vehicle conflict – severity chart (Figure 10), normalized vehicle-vehicle conflicts by vehicle volume (Figure 11), normalized vehicle volume by vehicle-vehicle conflicts (Figure 12) were drawn.
Figure 12 illustrates the frequency of vehicles entering the intersection involved in one vehicle-vehicle conflict (=The mean number of vehicles across all days is 142).
Considering the author’s previous studies in terms of high-risk V2X conflicts at signalized intersection [2,3,4,5,6,7,8], serious vehicle-vehicle conflicts (conflicts with PET <0.7) were analyzed over the specified time interval. Table 1 illustrates the results of serious conflicts.
In terms of “vehicle-pedestrian” conflicts, Figure 13 shows the vehicle-pedestrian conflicts heat map over the specified time interval.
Signalized intersections, while designed to regulate the flow of vehicular and pedestrian traffic, can become sites of significant safety concerns when they experience a high rate of traffic crashes. One critical aspect of this safety challenge is the occurrence of vehicle-pedestrian conflicts, which can result in crashes, injuries, and fatalities. Understanding the dynamics of vehicle-pedestrian conflicts at such intersections is essential for developing effective safety measures and reducing the incidence of crashes. Vehicle-pedestrian conflicts refer to situations where vehicles and pedestrians interact within the same space, and the potential for collisions exists. These conflicts can occur at various points within a signalized intersection, including crosswalks, turning lanes, and pedestrian islands. Key factors contributing to vehicle-pedestrian conflicts include:
- 1)
- Crosswalk Usage: Pedestrians are expected to use designated crosswalks to safely cross the road. However, conflicts arise when pedestrians jaywalk or do not adhere to traffic signals.
- 2)
- Turning Movements: Vehicle turning movements, especially right turns on red, can intersect with pedestrian paths, leading to conflicts.
- 3)
- Pedestrian Visibility: Poor visibility due to factors such as inclement weather, obstructed sightlines, or inadequate street lighting can increase the likelihood of conflicts.
- 4)
- Driver Behavior: Inattentive or aggressive driving behavior, such as failing to yield to pedestrians or disregarding traffic signals, can escalate conflicts.
In signalized intersections with a high rate of traffic crashes, several contributing factors can lead to vehicle-pedestrian conflicts:
- 1)
- High Traffic Volume: Congestion and heavy traffic increase the complexity of interactions between vehicles and pedestrians, potentially leading to conflicts.
- 2)
- Traffic Signal Timing: Inefficient or poorly coordinated signal timings can create situations where pedestrians may be in conflict with turning vehicles.
- 3)
- Pedestrian Behavior: Pedestrian actions, including distraction (e.g., smartphone use) or misjudging vehicle speeds, can result in conflicts.
- 4)
- Infrastructure Design: Poorly designed crosswalks, inadequate pedestrian signage, and insufficient pedestrian islands can contribute to conflicts.
- 5)
- Intersection Geometry: The layout and geometry of the intersection, including the width can contribute to conflicts.
To provide an accurate vehicle-pedestrian conflicts analysis, vehicle-pedestrian frequency chart (Figure 14), vehicle-pedestrian severity chart (Figure 15), hourly distribution of vehicle-pedestrian conflict – frequency chart (Figure 16), hourly distribution of vehicle-pedestrian conflict – severity chart (Figure 17), normalized vehicle-pedestrian conflicts by pedestrian’s volume (Figure 18), normalized vehicle-pedestrian conflicts by vehicles volume (Figure 19), and the frequency of pedestrians are involved in one "vehicle-pedestrian" conflict in each approach (Figure 20) are presented.
Vehicle-pedestrian serious conflicts (conflicts with PET <0.7) were analyzed as can be seen in Table 2. As shown in Table 2, five serious vehicle-pedestrian conflicts occurred from June 1st to July 7th.
Considering the numerical values of collected PETs, vehicle-pedestrian conflicts with 0.7 < PET < 1.31 were considered as general conflicts [2,3,4,5,6]. As shown in Table 3, 39 general conflicts collected from June 1st to July 7th.
Table 4 shows the frequency and severity of general conflicts – critical movements. As can be seen in Table 4, SN (=NBT), WS (=EBR), NW (=SBR), and WN (=EBL) are crucial movements in terms of the frequency and severity of vehicle-pedestrian conflicts.
Jaywalking Conflicts
Jaywalking conflicts at signalized intersections with a high rate of traffic crashes pose significant risks to pedestrian and driver safety [5]. This issue arises when pedestrian’s cross streets at locations other than designated crosswalks or against traffic signals, leading to potentially dangerous conflicts with vehicles. This comprehensive explanation will delve into the various facets of this problem, its contributing factors, consequences, and potential mitigation strategies. Addressing this issue requires a multi-faceted approach that combines education, infrastructure improvements, signal optimization, enforcement, and urban planning. By addressing the contributing factors and consequences of jaywalking conflicts, cities can work towards safer and more efficient traffic management at these critical intersections.
Factors Contributing to Jaywalking Conflicts:
- 1)
- Pedestrian Behavior: Jaywalking often occurs due to pedestrians' disregard for traffic signals, impatience, or a desire for more direct routes. Some may underestimate the risks associated with crossing outside of crosswalks.
- 2)
- Signal Timing: Inadequate signal timing, such as long pedestrian wait times or short crossing times, can lead pedestrians to ignore traffic signals and cross against the light.
- 3)
- Infrastructure: Lack of clearly marked crosswalks, poorly designed pedestrian facilities, and insufficient signage can encourage jaywalking behavior.
- 4)
- Safety Perception: Pedestrians may perceive certain intersections as unsafe due to high traffic crash rates or inadequate lighting, leading them to cross outside designated areas.
Consequences of Jaywalking Conflicts:
- 1)
- Increased Crash Risk: Jaywalking pedestrians are at a higher risk of being struck by vehicles, leading to injuries or fatalities.
- 2)
- Traffic Disruptions: Vehicles may be forced to brake suddenly or swerve to avoid jaywalkers, leading to traffic disruptions and potential rear-end collisions.
- 3)
- Legal Implications: Both pedestrians and drivers involved in jaywalking conflicts may face legal consequences, including fines, penalties, or liability in civil cases.
Mitigation Strategies:
- 1)
- Education and Awareness: Public awareness campaigns can inform pedestrians about the risks of jaywalking and promote adherence to traffic signals and crosswalks.
- 2)
- Improved Infrastructure: Designing pedestrian-friendly infrastructure with well-marked crosswalks, countdown timers, and proper lighting can discourage jaywalking.
- 3)
- Signal Timing Adjustments: Signal timings should be optimized to minimize pedestrian wait times and ensure adequate crossing opportunities.
- 4)
- Enforcement: Law enforcement efforts, including issuing citations for jaywalking, can act as a deterrent and promote compliance with traffic rules.
- 5)
- Technological Solutions: Implementing pedestrian detection systems or pedestrian-activated signals can enhance pedestrian safety at high-risk intersections.
- 6)
- Urban Planning: Consideration of pedestrian safety in urban planning, including the placement of crosswalks and traffic calming measures, can reduce jaywalking conflicts.
From June 1st to July 7th, 1000 jaywalking events were recorded by tow LiDAR sensors at Marlboro Pike & Brooks Dr. intersection in Coral Hills, Maryland. Figure 21 illustrates jaywalking frequency and trajectories, Figure 22 shows hourly distribution of jaywalking event’s frequency, and Figure 23 demonstrates jaywalking events frequency based on the jaywalking duration.
As can be seen in Figure 23, 86% of jaywalking events were recorded in less than 10 seconds duration. The duration of jaywalking, or the time interval during which pedestrians engage in the illegal act of crossing streets outside designated crosswalks or against traffic signals, is a critical factor at signalized intersections with a high rate of traffic crashes. Understanding the duration of jaywalking is essential for traffic engineers, urban planners, and law enforcement agencies as it impacts safety, traffic flow, and the overall efficiency of intersections. By addressing the factors that influence jaywalking duration and implementing mitigation strategies, cities can work towards safer and more efficient traffic management, reducing the risks associated with illegal pedestrian behavior at these critical intersections.
Factors Influencing the Duration of Jaywalking:
- 1)
- Pedestrian Behavior: The duration of jaywalking is influenced by how long pedestrians wait for a perceived safe gap in traffic before crossing against the signal.
- 2)
- Traffic Signal Timing: Signal cycle lengths, including pedestrian walk intervals, impact how long pedestrians have to wait at the intersection. Longer wait times may encourage jaywalking.
- 3)
- Intersection Geometry: The layout of the intersection, such as its width, the number of lanes, and the presence of medians, can affect the perceived difficulty of crossing at designated crosswalks.
Implications of Jaywalking Duration:
- 1)
- Safety Risks: Longer jaywalking durations increase the exposure of pedestrians to moving vehicles, elevating the risk of crashes, injuries, and fatalities.
- 2)
- Traffic Disruptions: Prolonged jaywalking events can disrupt the flow of vehicular traffic, leading to congestion, delays, and a higher likelihood of rear-end collisions.
- 3)
- Legal and Enforcement Challenges: Extended jaywalking incidents may require more significant law enforcement efforts and present challenges in terms of identifying and penalizing violators.
- 4)
- Public Perceptions: Public perception of safety at intersections can be negatively influenced by lengthy jaywalking incidents, impacting trust in traffic management.
Mitigation Strategies:
- 1)
- Signal Timing Optimization: Traffic engineers can adjust signal timings to minimize pedestrian wait times, reducing the incentive for jaywalking.
- 2)
- Crosswalk Enhancement: Well-marked crosswalks, pedestrian countdown timers, and audible signals can encourage pedestrians to use designated crossing points.
- 3)
- Pedestrian Education: Public awareness campaigns can educate pedestrians about the benefits of using crosswalks and adhering to traffic signals.
- 4)
- Enforcement: Law enforcement agencies can target areas with frequent jaywalking incidents, issuing citations to deter violations.
- 5)
- Physical Barriers: Installing physical barriers or bollards can prevent pedestrians from jaywalking at dangerous locations.
- 6)
- Technological Solutions: Advanced pedestrian detection systems (visual or audible signs) can trigger pedestrian signals or traffic signal changes based on real-time pedestrian activity, improving safety.
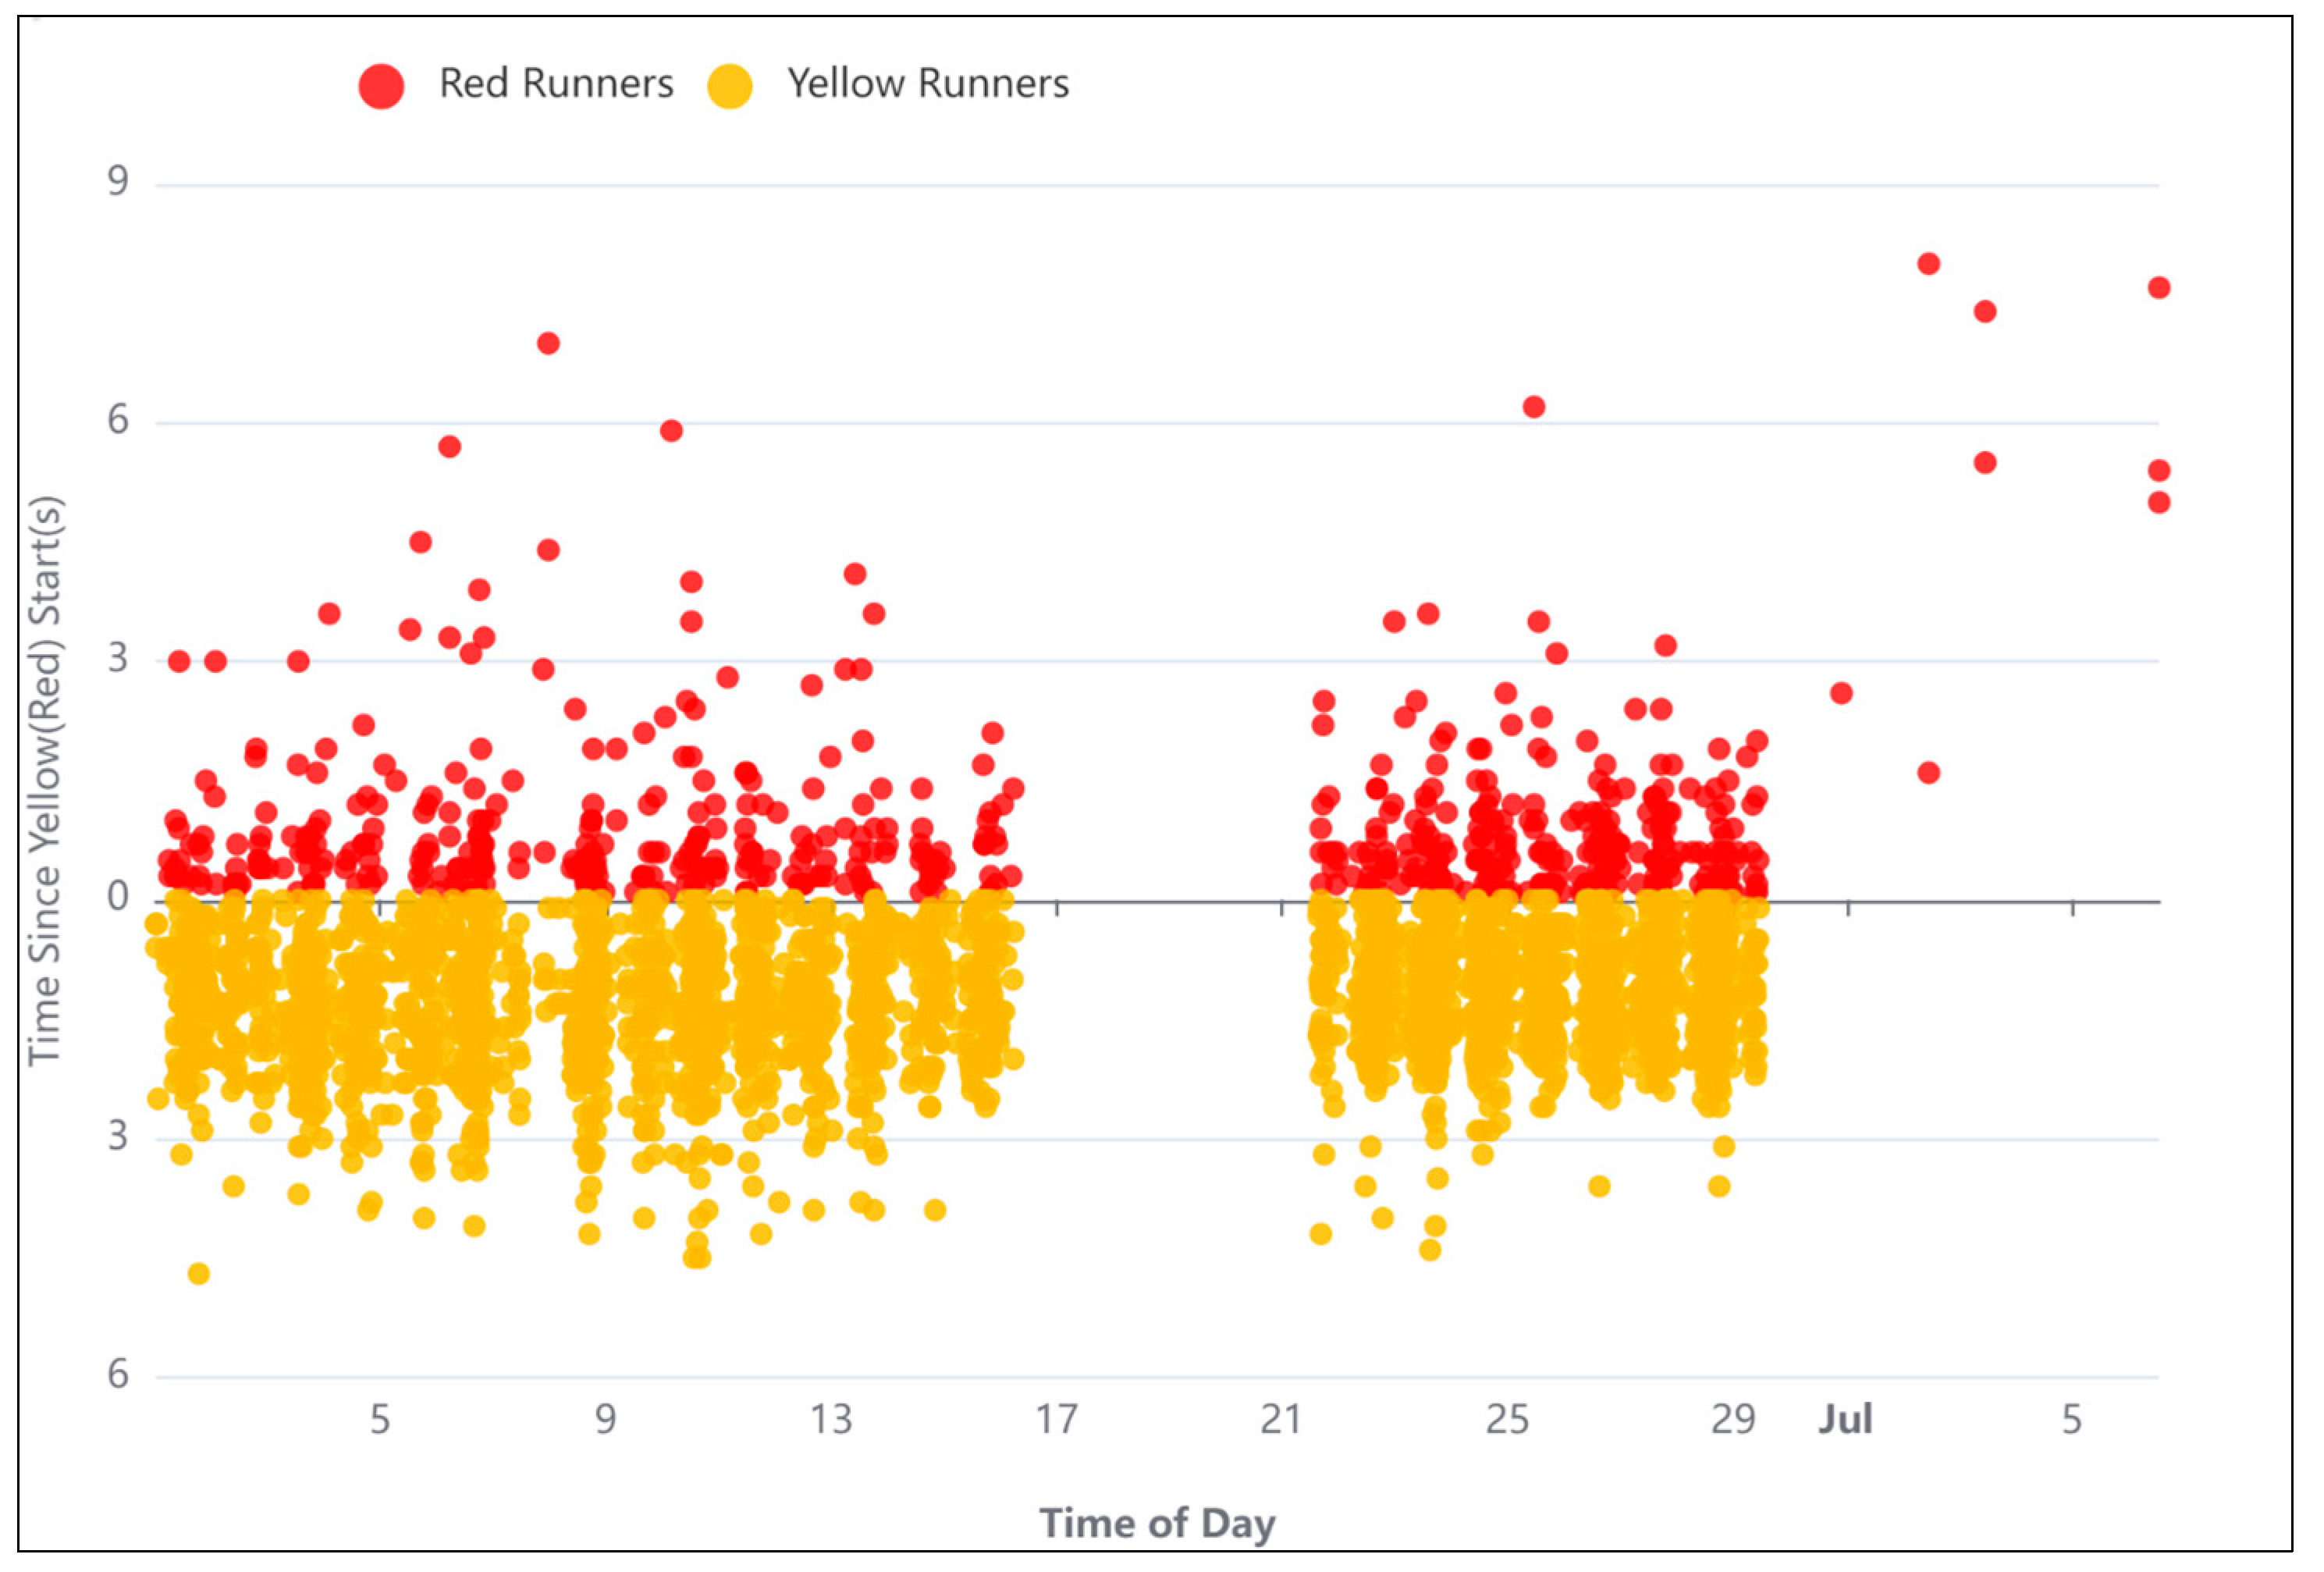
Yellow and Red Light Runner Analysis
Yellow and red light runners at signalized intersections with a high rate of traffic crashes pose significant risks to road safety and traffic management. Addressing this issue requires a multi-pronged approach that encompasses signal timing adjustments, enforcement measures, public education, and infrastructure improvements [15,16,17,18,19,20,21]. By tackling the contributing factors and consequences of light running, cities can work toward safer and more efficient traffic management at these critical intersections, ultimately saving lives and reducing crashes. Running a yellow or red traffic signal can have severe consequences, including collisions, injuries, and fatalities. In traffic safety analysis, a "red light runner" refers to a motorist who enters an intersection after the traffic signal has turned red. In other words, they disregard the red light and continue through the intersection, often in violation of traffic laws. This behavior is highly dangerous as it can lead to collisions with vehicles crossing from other directions that have the right of way [22,23,24,25]. To address this issue, many intersections are equipped with red light cameras, which automatically capture images or video footage of vehicles that run red lights. Additionally, law enforcement can then use this evidence to issue citations to the drivers who violated traffic laws. Additionally, public awareness campaigns, educational efforts, and stricter enforcement are often used to discourage red light running and promote safer driving behavior.
Factors Contributing to Yellow and Red Light Running:
- 1)
- Driver Behavior: Human factors play a significant role in light running incidents. This includes aggressive driving, impatience, inattentiveness, and a disregard for traffic laws.
- 2)
- Signal Timing: Inadequate signal timing, such as short yellow signal durations or a lack of proper transition times between green and red phases, can catch drivers off guard and encourage light running.
- 3)
- Traffic Volume: High traffic volume can lead to congestion and increased driver frustration, potentially prompting some drivers to run lights to save time.
- 4)
- Impaired Driving: Drivers under the influence of alcohol or drugs may have impaired judgment and reaction times, increasing the likelihood of running lights.
Consequences of Yellow and Red Light Running:
- 1)
- Collisions: Running a red or yellow light often leads to intersection collisions, which can result in property damage, injuries, or fatalities.
- 2)
- Safety Risks: Pedestrians and cyclists are vulnerable road users who may be struck by light runners, leading to serious injuries or fatalities.
- 3)
- Traffic Disruptions: Light running incidents can disrupt traffic flow, causing congestion and increasing the risk of secondary crashes.
- 4)
- Legal and Insurance Consequences: Drivers who run lights may face legal penalties, including fines, license suspension, and increased insurance premiums.
Mitigation Strategies:
- 1)
- Signal Timing Adjustments: Traffic engineers can optimize signal timing to provide adequate warning time, including lengthening yellow signal intervals to give drivers more time to stop safely.
- 2)
- Red-Light Cameras: Installing red-light cameras at intersections can deter light runners by capturing photographic evidence of violations and issuing citations.
- 3)
- Public Awareness Campaigns: Educational campaigns can inform drivers about the dangers of light running and encourage compliance with traffic signals.
- 4)
- Improved Intersection Design: Intersection design enhancements, such as clearer signage, countdown timers, and dedicated left-turn signals, can reduce the likelihood of light running.
- 5)
- Enforcement: Law enforcement agencies can actively patrol intersections prone to light running and issue citations to violators.
- 6)
- Technological Solutions: Advanced vehicle detection systems can trigger traffic signal changes based on real-time traffic conditions, reducing the likelihood of light running incidents.
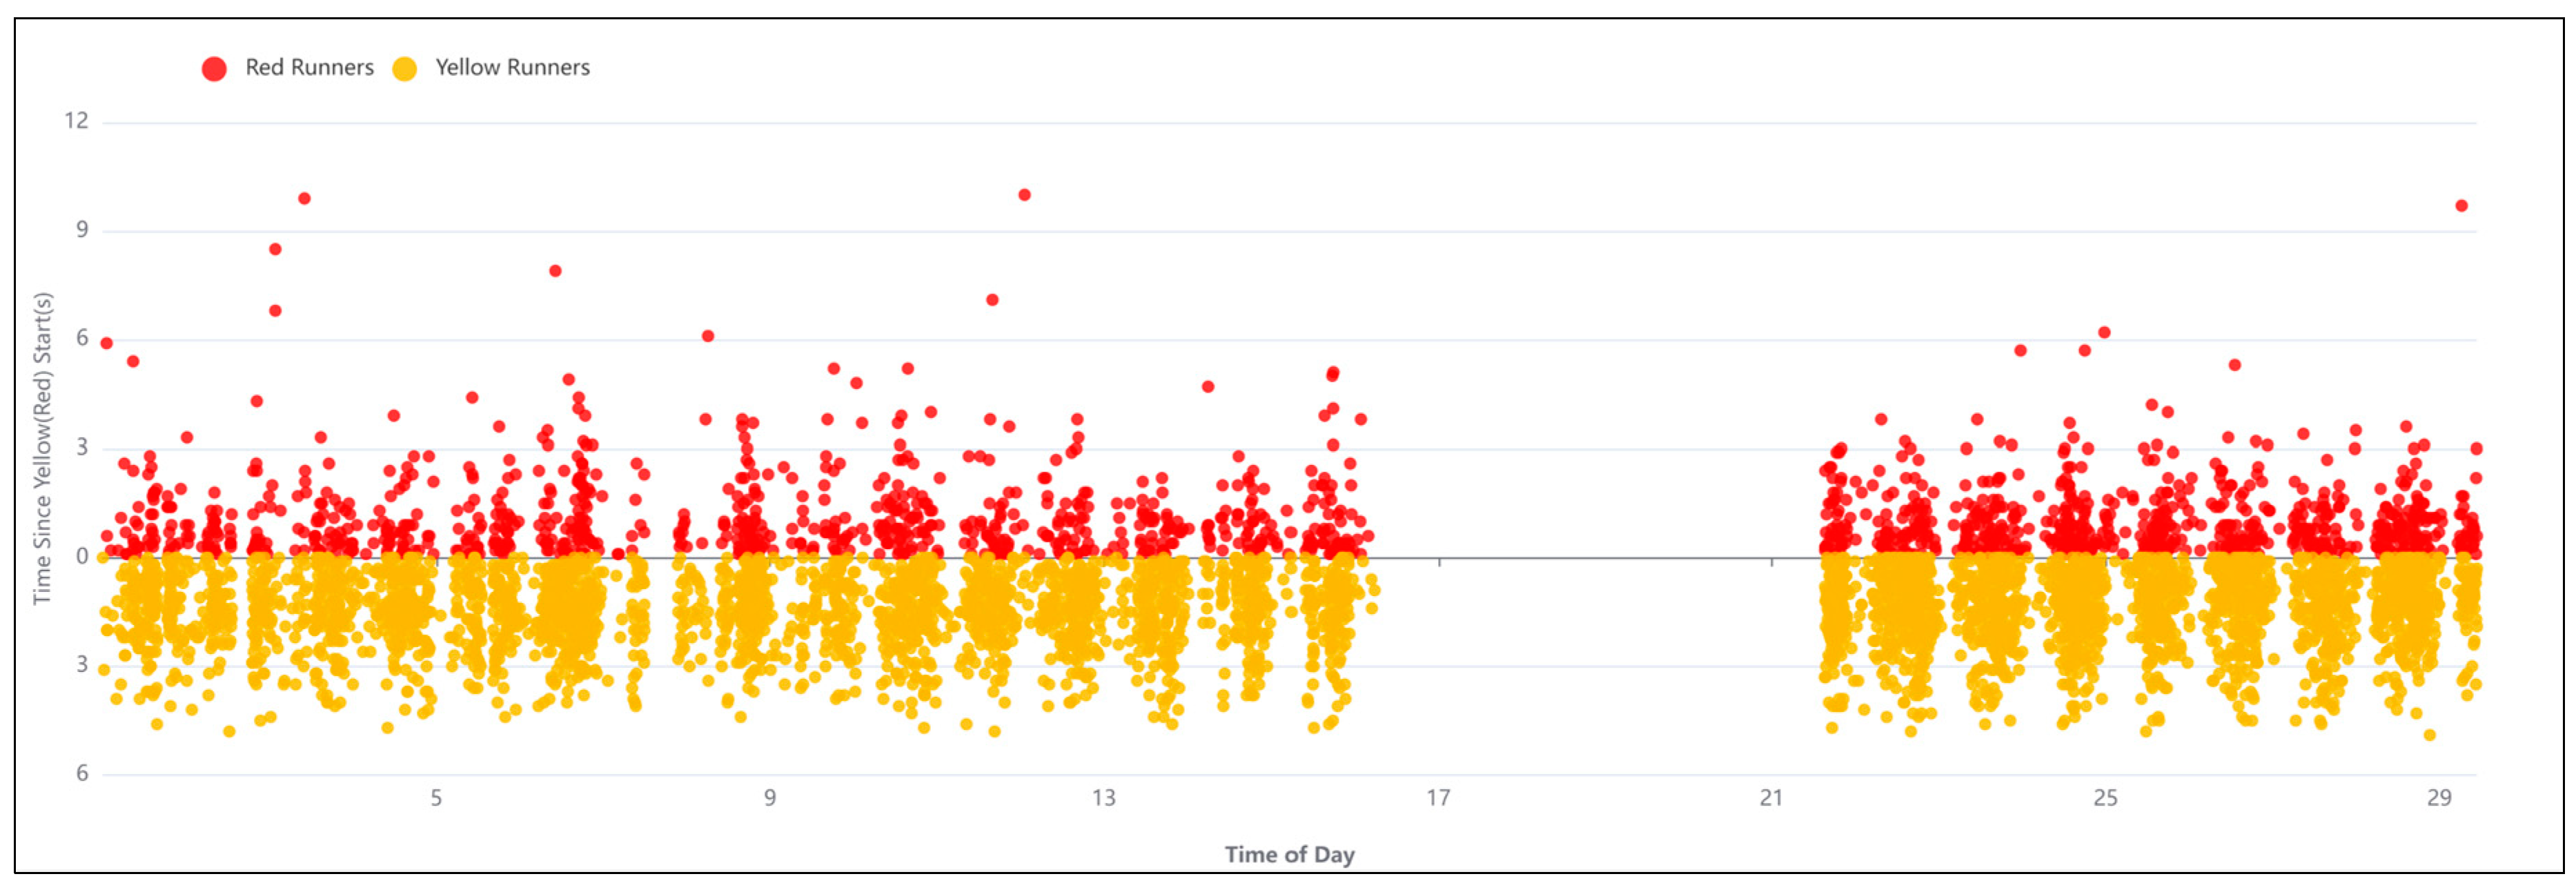
In different phases of the traffic signal, the frequency of yellow and red light runners were analyzed.
Phase 2 (ø2): 3480 red light runners were recorded for North Bound Straight Thru (NBT or SN), and 2531 events were recorded for North Bound Left Turn (NBL or SW).
Figure 24.
Red Light Runners in Phase #2 of the traffic signal.
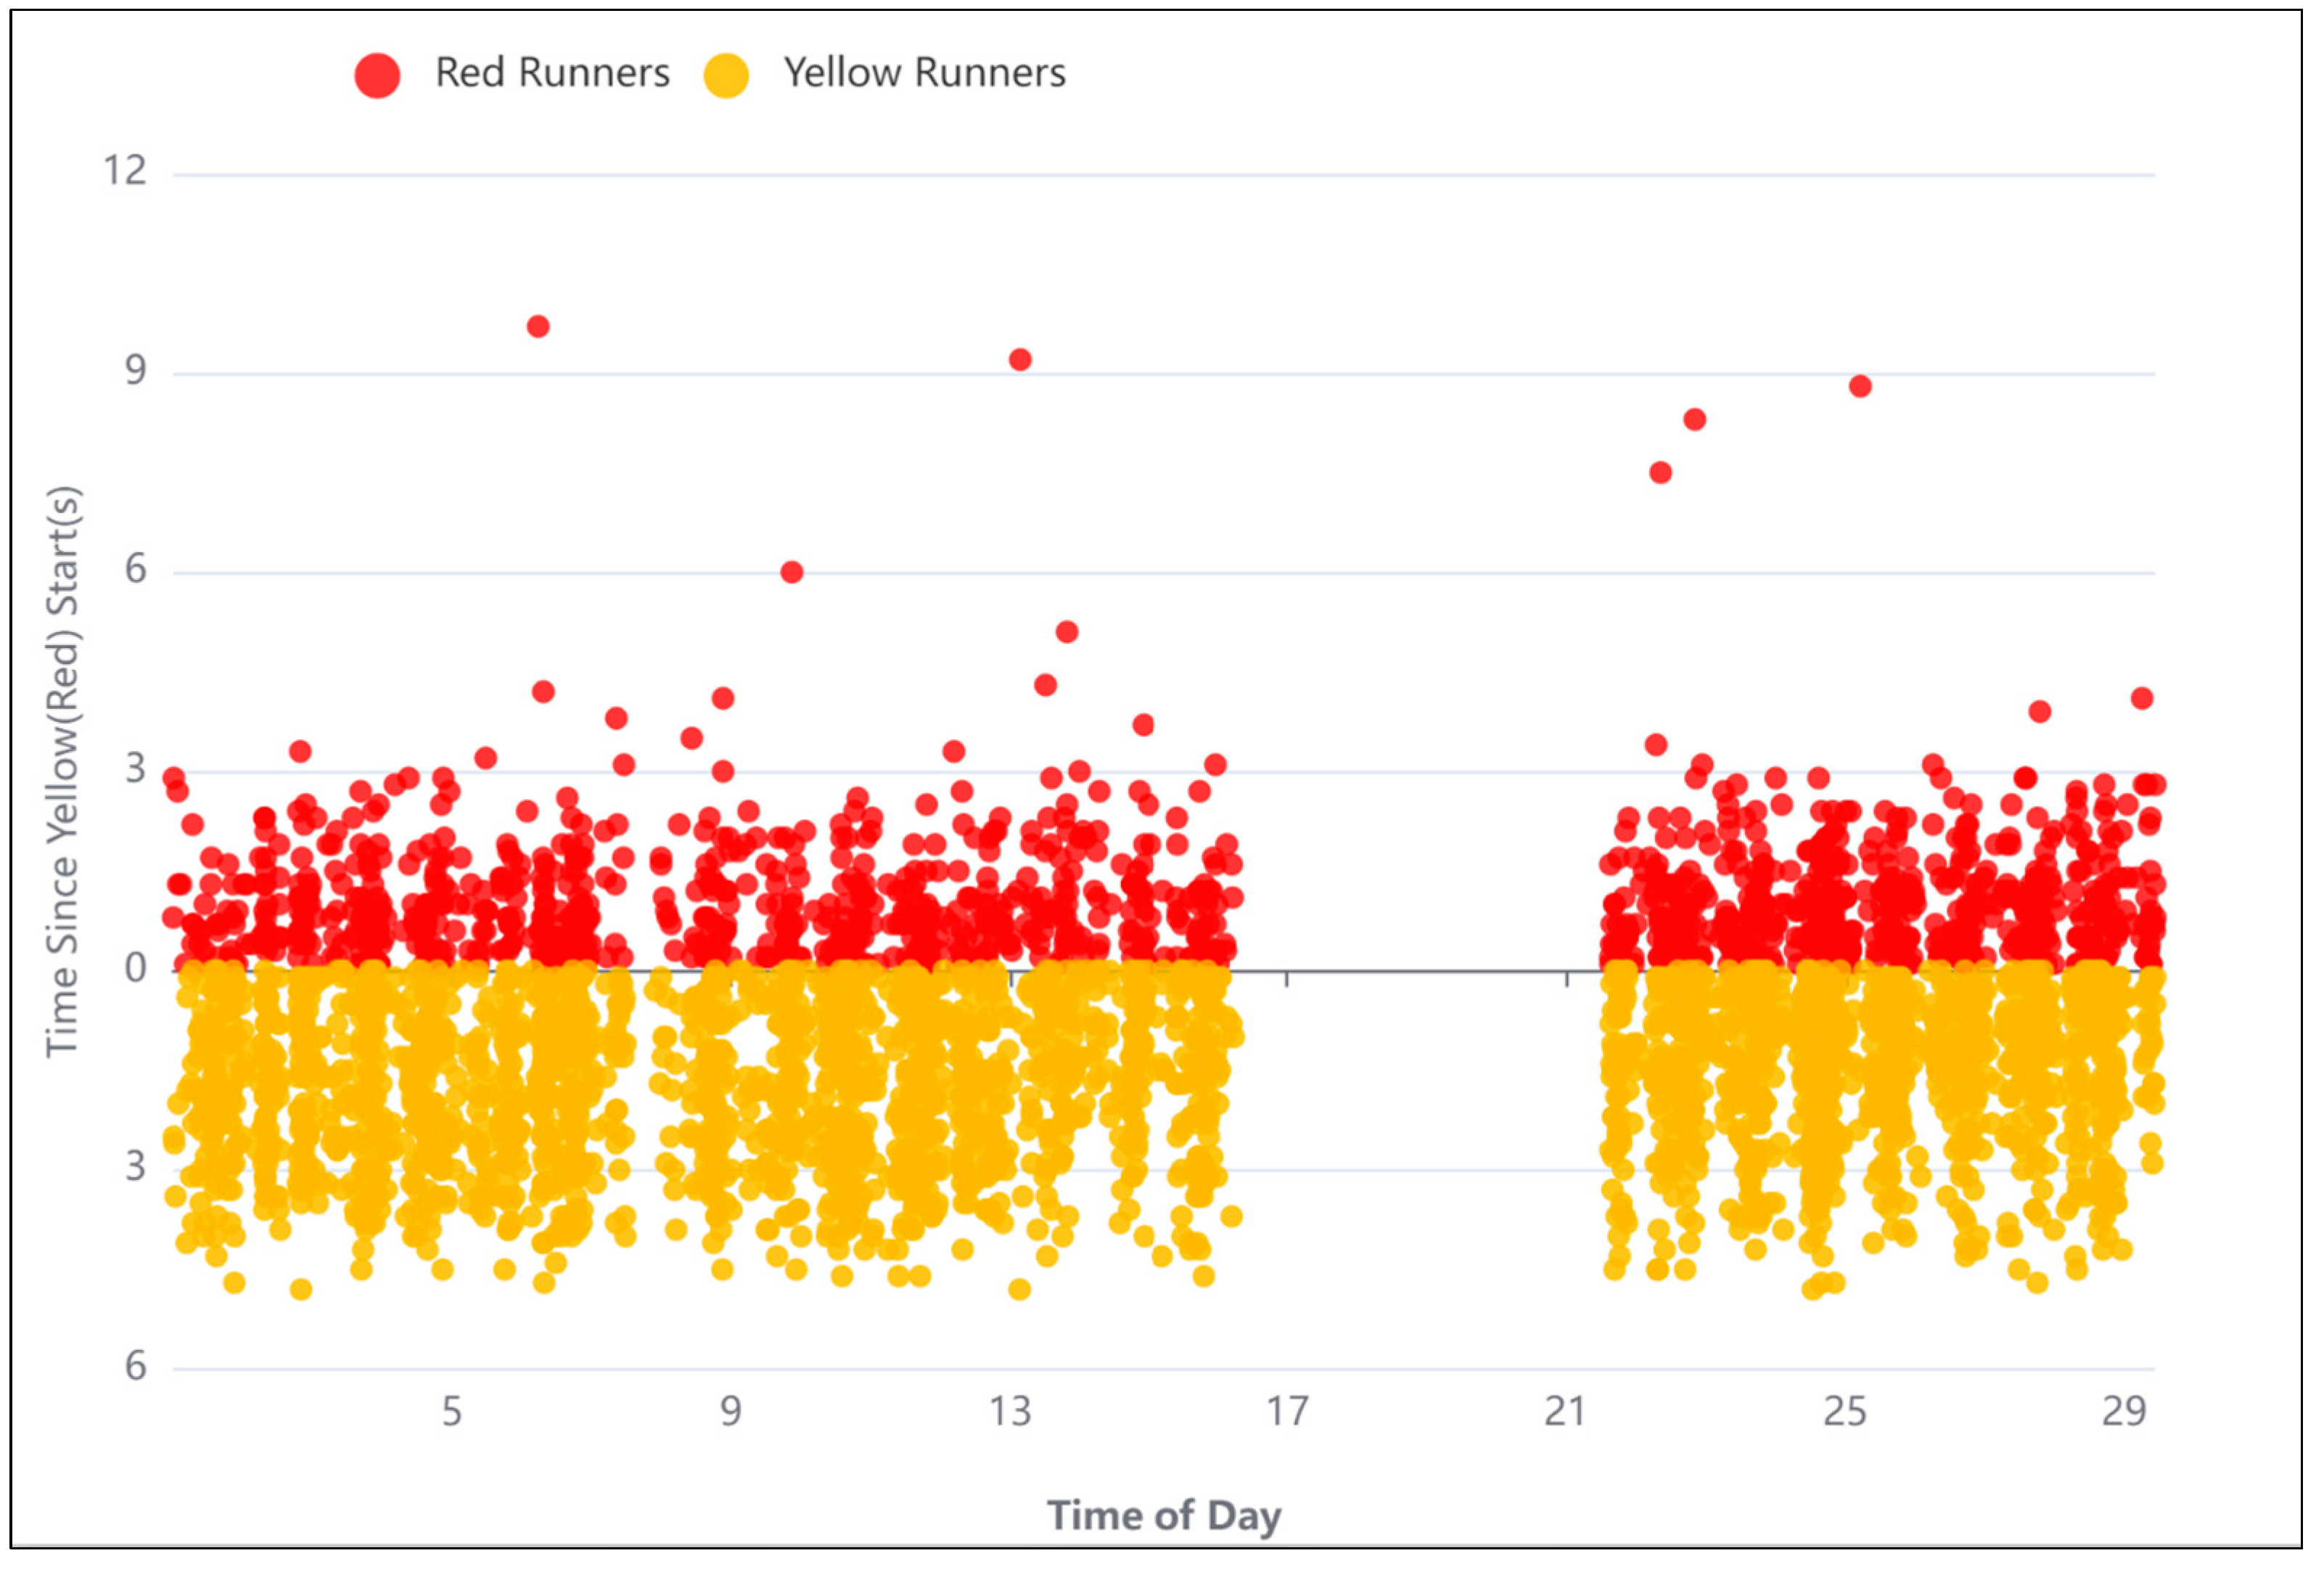
Phase 3 (ø3): 327 red light runners were recorded for East Bound Straight Thru (EBT or WE), and 3755 events were recorded for East Bound Left Turn (EBL or WN).
Figure 25.
Red Light Runners in Phase #3 of the traffic signal.
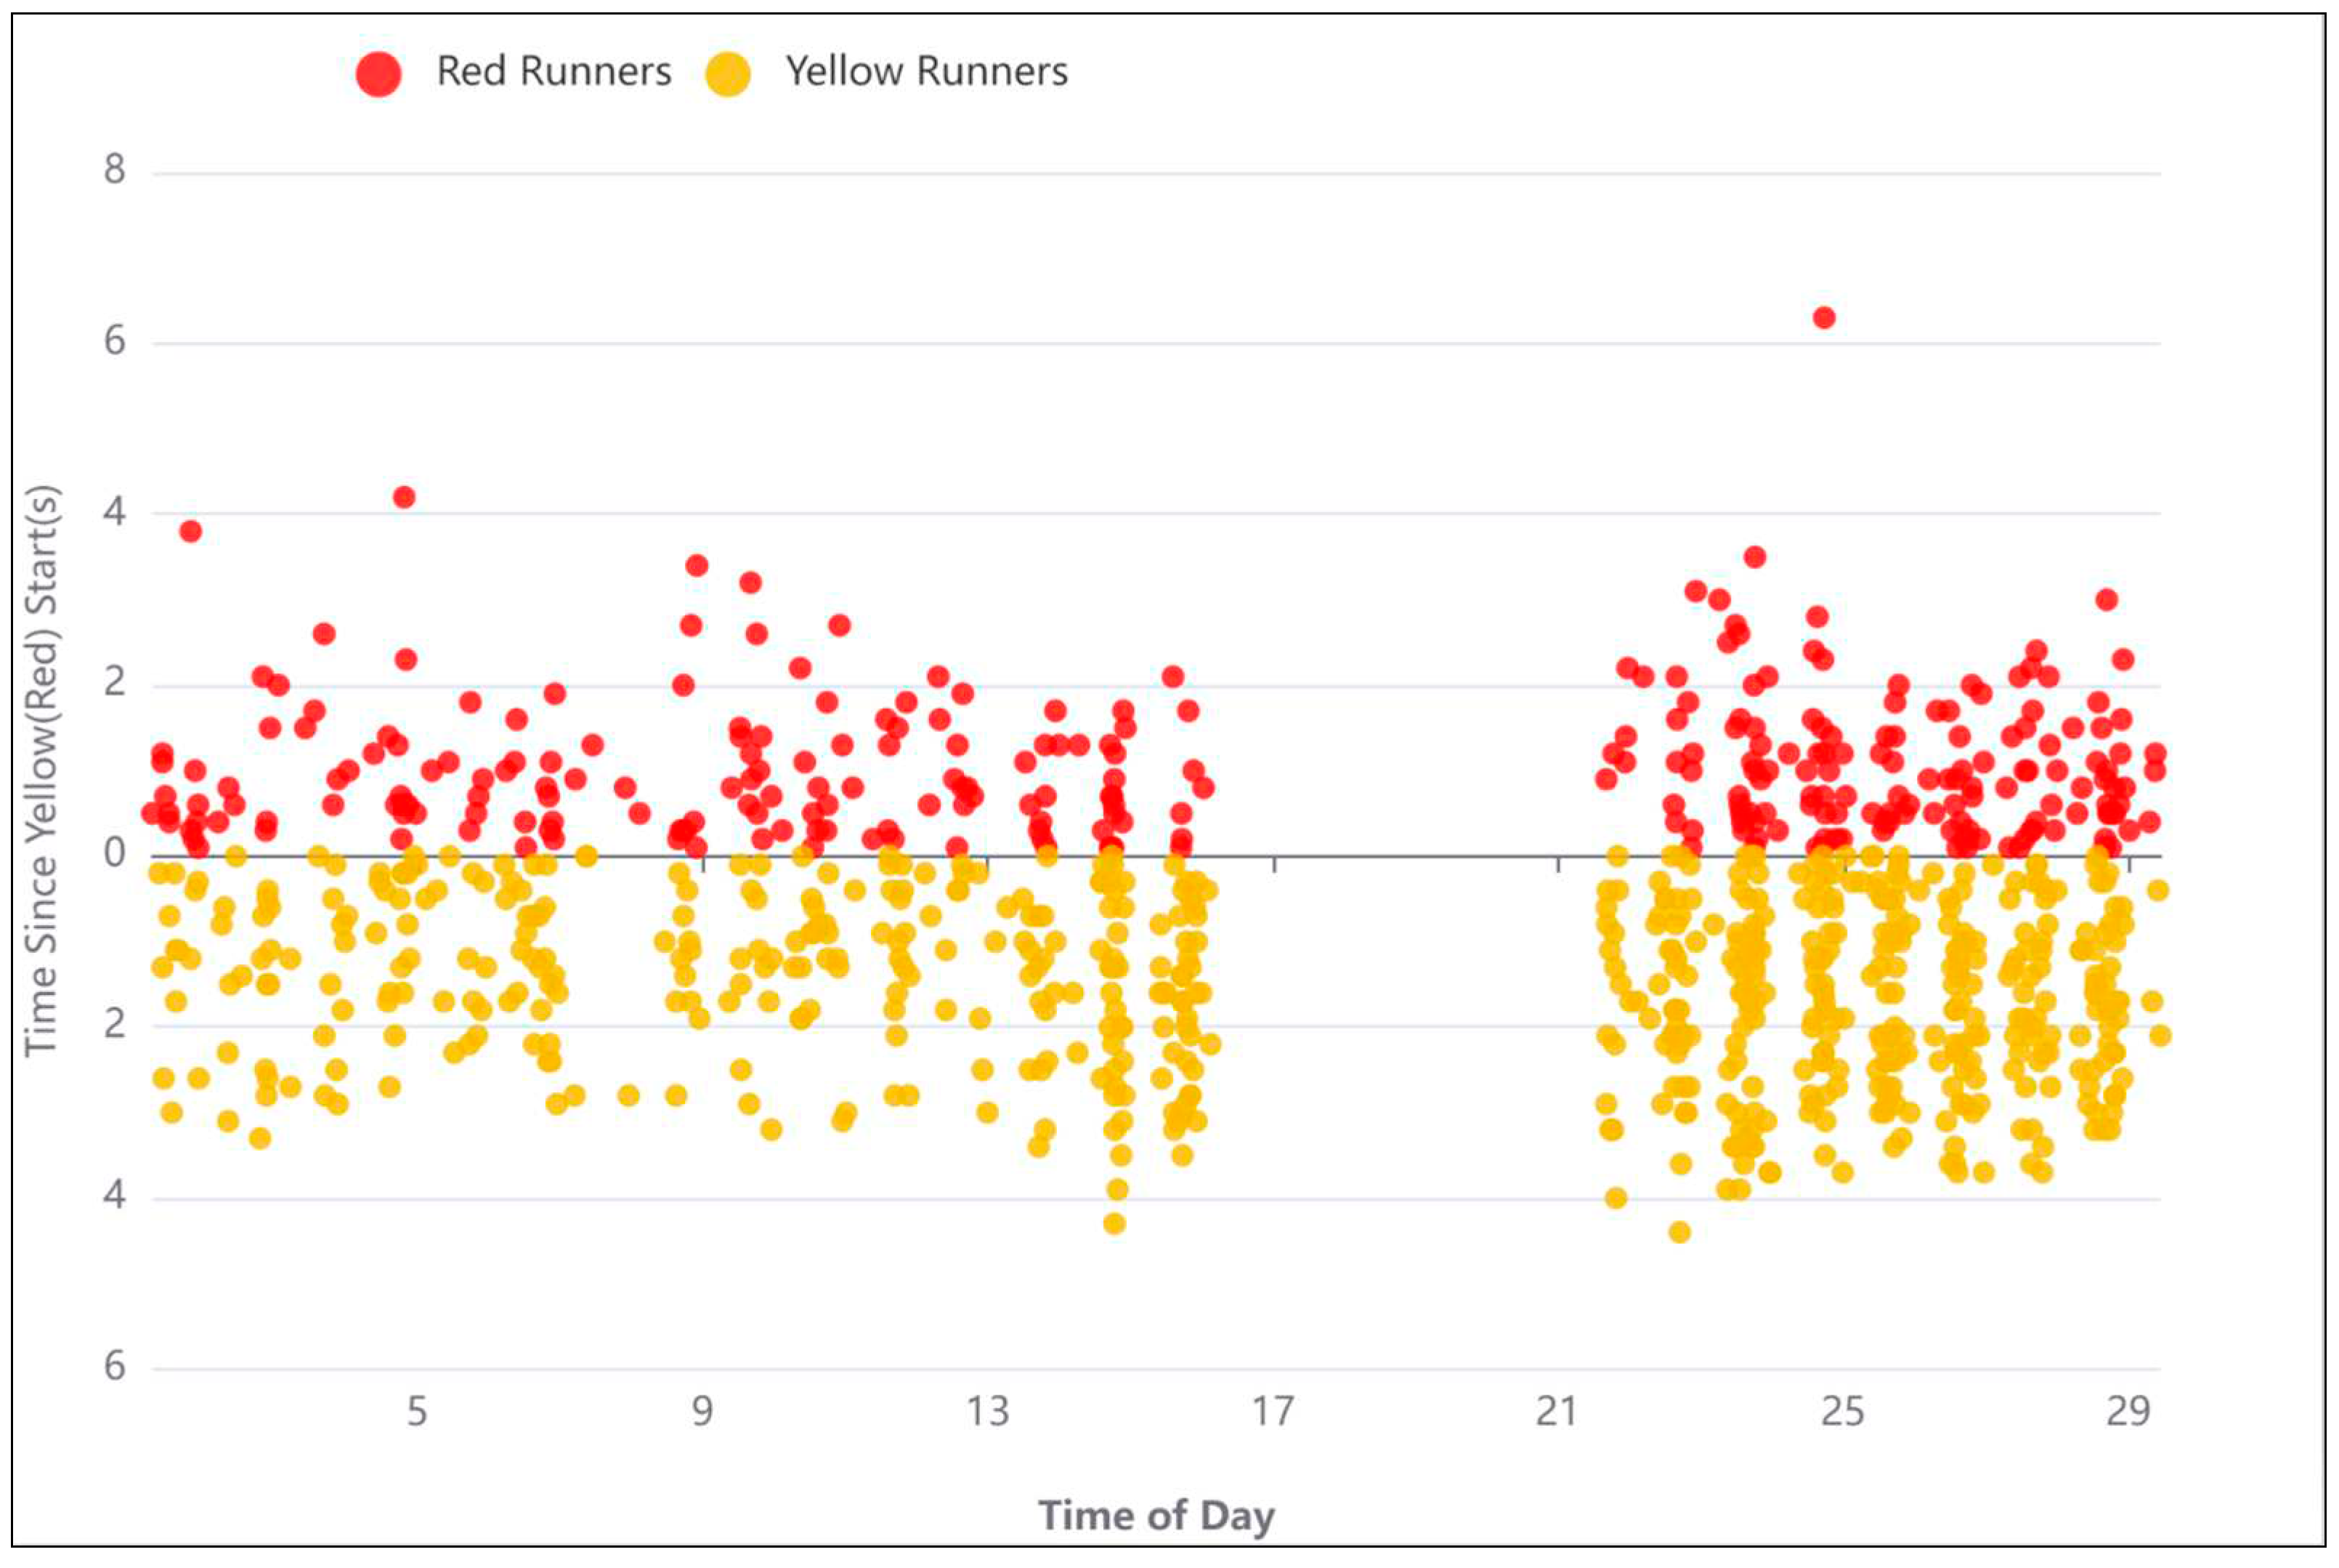
Phase 4 (ø4): 395 red light runners were recorded for West Bound Straight Thru (WBT or EW), and 528 events were recorded for West Bound Left Turn (WBL or ES).
Figure 26.
Red Light Runners in Phase #4 of the traffic signal.
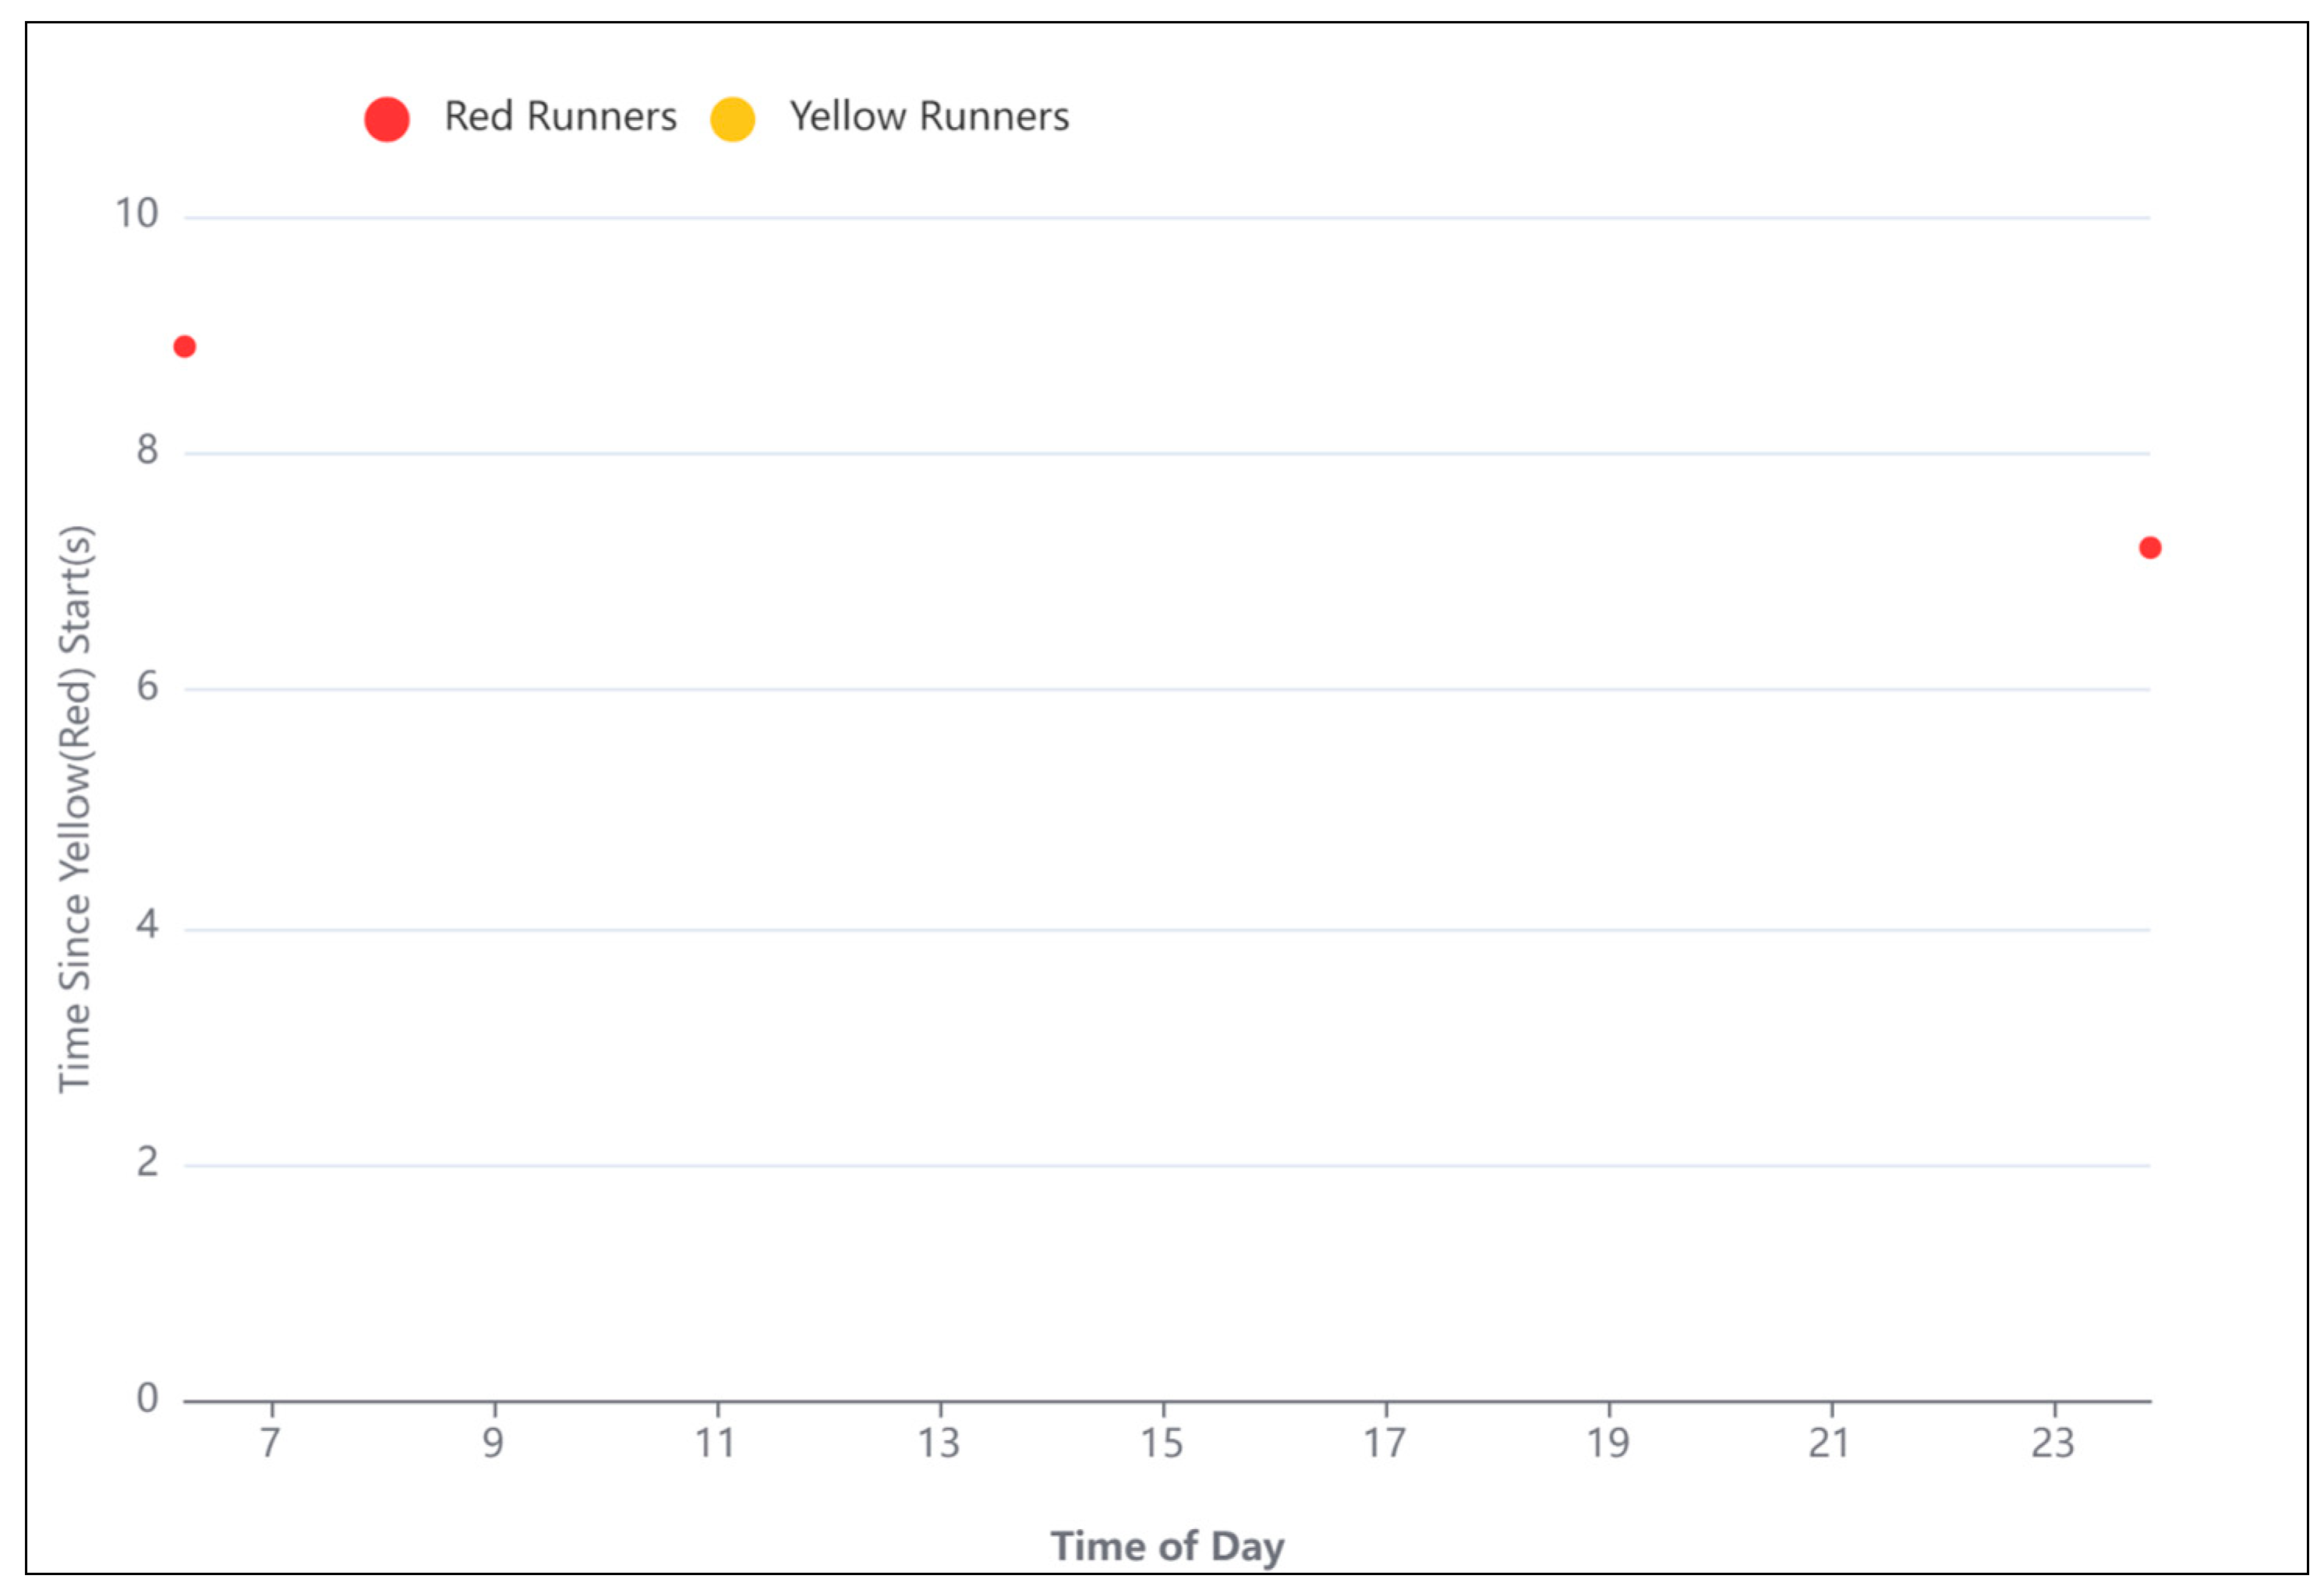
Phase 5 (ø5): Only one red light runners were recorded for North Bound Straight Thru (NBT or SN), and one events were recorded for North Bound Left Turn (NBL or SW).
Figure 27.
Red Light Runners in Phase #5 of the traffic signal.
Phase 6 (ø6): 3119 red light runners were recorded for South Bound Straight Thru (SBT or NS), and 204 events were recorded for South Bound Left Turn (SBL or NE).
Figure 28.
Red Light Runners in Phase #6 of the traffic signal.
Historical Crash Data Analysis
Analyzing historical crash data is a critical aspect of road safety management and transportation planning [26,27,28,29,30,31]. This process involves collecting, processing, and interpreting data related to traffic crashes that have occurred over time. By examining historical crash data, transportation authorities, researchers, and policymakers can identify trends, patterns, and risk factors that contribute to crashes. In this discussion, we will explore the importance of historical crash data analysis, the steps involved, and its practical applications.
Importance of Historical Crash Data Analysis [32]:
- Safety Improvement: Historical crash data analysis helps identify high-risk locations, such as intersections or stretches of road with a high frequency of crashes. This information is essential for implementing safety measures, such as traffic signals, roundabouts, or road redesigns, to reduce the likelihood of future crashes.
- Resource Allocation: It allows for the allocation of resources, such as law enforcement personnel and emergency response teams, to areas with a history of frequent crashes. This proactive approach can save lives and reduce property damage.
- Policy Development: Policymakers can use historical crash data to create evidence-based policies and regulations that address specific safety concerns. For example, data might lead to the implementation of stricter seatbelt laws or alcohol-impaired driving prevention measures.
- Transportation Planning: Planners can use crash data to inform decisions about road design, maintenance, and expansion. Understanding where and why crashes occur can help in creating safer transportation systems.
Steps in Historical Crash Data Analysis:
- Data Collection: Gather comprehensive data on each crash, including location, time, weather conditions, vehicle types, road conditions, and severity of injuries. This data is often collected by law enforcement agencies and compiled into a centralized database.
- Data Cleaning: The collected data may contain errors or inconsistencies, so it needs to be cleaned and standardized. This involves removing duplicates, correcting inaccuracies, and ensuring consistency in data format.
- Data Integration: Combine crash data with other relevant datasets, such as road infrastructure data, traffic flow data, and demographic information, to provide a more comprehensive picture of crash causes and effects.
- Descriptive Analysis: Perform initial descriptive analyses to identify trends, such as the most common types of crashes, contributing factors (e.g., speeding, distracted driving), and locations with a high accident rate.
- Spatial Analysis: Utilize Geographic Information Systems (GIS) to map crash locations and identify hotspots where accidents cluster. This helps in pinpointing areas in need of safety improvements.
- Temporal Analysis: Analyze crash data over time to identify seasonal, monthly, or daily patterns, which can inform the allocation of resources and the implementation of targeted safety campaigns.
- Statistical Modeling: Employ statistical techniques to develop predictive models that can estimate the likelihood of crashes based on various factors. These models can assist in risk assessment and prioritization of safety measures.
Practical Applications:
- Traffic Engineering: Engineers can use crash data analysis to optimize traffic signal timings, design safer road layouts, and implement traffic calming measures.
- Law Enforcement: Police departments can focus their enforcement efforts on locations and times with a high likelihood of accidents, improving traffic safety.
- Insurance Industry: Insurance companies use historical crash data to assess risk and set premium rates for policyholders.
- Research and Education: Researchers can use crash data to study the effectiveness of safety interventions and develop educational materials for drivers.
- Emergency Response: Emergency services can plan their response strategies based on accident data, ensuring faster and more efficient assistance to accident victims.
By using “The Maryland Open Crash Dataset” [33], a total of 20 crashes were reported at the intersection of Marlboro Pike and Brooks Dr. These crashes were recorded by various agencies that submitted their respective crash reports. Fatal, Injury, and Property damage crashes are described.
Fatal Crashes: Out of a total of 571 fatal crashes, 2 crashes occurred in close proximity to the intersection of Marlboro Pike and Brooks Dr. Figure 29 shows the location of fatal crashes.
Injury Crashes: Out of a total of 21,598 injury crashes, 17 crashes occurred in close proximity to the intersection of Marlboro Pike and Brooks Dr. As shown in Figure 30, the movements SN, EN, WS, SW, and NS are critical movements. Figure 30 illustrates the location of injury crashes.
Property Damage Crashes: Out of a total of 77,638 property damage crashes, 1 crash occurred in close proximity to the intersection of Marlboro Pike and Brooks Dr. Figure 31 illustrates a property damage crash occurred by movements SN or SW.
To determine the safety risk for each intersection, an intersection crash rate, as shown in Eq. (1) was developed to describe the crashes per million entering vehicles to the intersection.
Where,
R = Crash rate for the intersection expressed as crashes per million entering vehicles
C = Total number of intersection crashes in the study period
N = Number of years of data
V = Traffic volumes entering the intersection daily
In this study,
C = 20 total crashes over the past 5 years
N = 5 years of data
V = 26,956 entering vehicles per day
= 0.406 crashes per million entering vehicles
4. Findings
Followings are the key findings of this research study.
- 1)
- The passing vehicle volumes in Marlboro Pike approaches is significantly more than Brooks Dr. approaches.
- 2)
- From June 1st to July 7th, 2776, 5473, 1725, and 1849 pedestrians passed by southbound, westbound, northbound, and eastbound approaches, respectively. It emphasizes that 70% of pedestrians crossed the westbound and southbound of the intersection.
- 3)
- From June 1st to July 7th, 385, 794, 116, and 402 bicyclists passed by southbound, westbound, northbound, and eastbound approaches, respectively. It indicates that the westbound and southbound approaches were used by 47% and 23% of the overall bicyclists, respectively.
- 4)
- The average vehicles speed in Marlboro Pike is 24% more than the average speed in Brooks Dr.
- 5)
- In terms of “vehicle-vehicle” conflicts, the hours 20:00 – 21:00 PM (=660 conflicts), 19:00 – 20:00 PM (=624 conflicts), and 18:00 – 19:00 PM (=623 conflicts) are critical hours. By considering 608 conflicts at 21:00 – 22:00 PM, it highlights that the time interval from 18:00 PM to 22:00 PM is more critical for vehicle-vehicle conflicts at Marlboro Pike & Brooks Dr. intersection. Conflicts might be increased as a result of the darkness and insufficient lighting. Additionally, the vehicle-vehicle conflicts are more severe from 18:00 to 22:00 PM as shown on hourly severity graph.
- 6)
- PET is the time difference between the time when the first vehicle ends encroachment over the conflict area and when the second vehicle enters the conflict area. It is assumed that 0 indicates a crash, while non-zero PET values indicate a close proximity to a crash. PET Analysis for “vehicle-vehicle” conflicts demonstrated that “NS and WN” movements are critical leading movements. Furthermore, “NS and SW” are critical following movements. Taking into account both leading and following movements, NS (or SBT) is critical movement of this intersection for vehicle-vehicle conflicts.
- 7)
- Regarding the “serious vehicle-pedestrian conflicts (PET <0.7)”, the safety considerations should be implemented for “westbound (Eastern Approach).
- 8)
- Regarding the “General vehicle-pedestrian conflicts (0.7 <PET <1.31)”, SN (or NBT) and WS (or EBR) are critical movements.
- 9)
- Vehicle-Pedestrian analysis highlighted that 52% of total conflicts occurred from 16:00 PM to 23:00 PM. Also, 26% of conflicts occurred from 19:00 PM to 22:00 PM.
- 10)
- Vehicle-Pedestrian conflicts are more severe from 16:00 PM to 23:00 PM. The results showed that 53% of severe conflicts occurred from 16:00 PM to 23:00 PM.
- 11)
- Jaywalking analysis results showed that westbound and southbound are approaches with 45% and 33% of jaywalking frequency. Additionally, Jaywalking events occur most frequently between 20:00 - 21:00 PM (=83 jaywalking events).
- 12)
- There are a number of factors that influence a crossing decision (e.g., origin and destination, complexity and length of the route), infrastructure (e.g., types of pedestrian facilities, road geometry, and traffic conditions), and individual characteristics (e.g., age and gender, and safety awareness).
- 13)
- As the frequency of jaywalking increases, vehicle-pedestrian conflicts will occur more frequently and with greater severity. In addition, jaywalking speed increases the likelihood of severe vehicle-pedestrian conflicts. Also, jaywalking is affected by the weather to a considerable extent, since the weather motivates the jaywalkers to cross illegally.
- 14)
- The analysis of red and yellow runners showed that phases 2, 3, and 6 of the traffic signal have a higher frequency of yellow and red light runners. Hereupon, the timing and the split of these phases should be revised.
- 15)
- The crash analysis revealed that the movements SN, NS, EN, SW, and WS are critical in terms of the frequency of crashes. The findings align with the LiDAR conflict analysis.
5. Conclusions
In conclusion, traffic safety data analysis at signalized intersections with a high rate of traffic crashes is a multifaceted and critical endeavor aimed at understanding, mitigating, and ultimately improving road safety. This comprehensive analysis encompasses several key components:
- 1)
- Traffic Volumes: Understanding the flow and distribution of vehicular and pedestrian traffic is essential for effective traffic management and intersection design. Data on traffic volumes provide insights into congestion levels and the potential for conflicts.
- 2)
- Speed: Analyzing vehicle speeds at intersections helps identify potential safety hazards. Excessive speeds can lead to more severe crashes, and managing speed is crucial for minimizing the impact of collisions.
- 3)
- Vehicle-Vehicle and Vehicle-Pedestrian Conflicts: Identifying and analyzing conflicts between vehicles and pedestrians, as well as vehicle-vehicle conflicts, are pivotal for recognizing high-risk areas within an intersection. This data informs safety improvements and interventions.
- 4)
- Jaywalking Conflicts: Examining instances of jaywalking, including the duration and frequency of such incidents, sheds light on pedestrian behavior at intersections. Addressing jaywalking conflicts is vital for enhancing pedestrian safety and compliance.
- 5)
- Red Light Runners: Studying incidents of red light running, their frequency, and contributing factors are critical for reducing intersection collisions and improving overall traffic safety.
The comprehensive analysis of these data points reveals the challenges and vulnerabilities present at signalized intersections with a high rate of traffic crashes. It provides the foundation for evidence-based decision-making and the development of targeted mitigation strategies to enhance safety.
To address the issues identified through data analysis, several strategies can be employed:
- 1)
- Infrastructure Improvements: Enhancements to intersection design, such as clear signage, pedestrian-friendly features, and optimized signal timing, can reduce conflicts and enhance safety.
- 2)
- Enforcement: Law enforcement agencies can play a crucial role in deterring risky behavior, such as red light running and jaywalking, through active patrolling and the use of automated enforcement systems.
- 3)
- Public Education: Awareness campaigns aimed at both drivers and pedestrians can inform them about the risks associated with non-compliance with traffic laws and promote safe behavior.
- 4)
- Technological Solutions: Advanced traffic management systems, including adaptive signal control and detection technologies, can improve intersection safety and efficiency.
In summary, comprehensive traffic safety data analysis is an essential tool for identifying, understanding, and mitigating the risks associated with signalized intersections experiencing a high rate of traffic crashes. By integrating data-driven insights with targeted interventions, communities and transportation authorities can work towards safer roadways, reducing crashes, injuries, and fatalities for all road users. This holistic approach to traffic safety ultimately contributes to more efficient and secure urban transportation systems.
As we look to the future of traffic safety, understanding the dynamics of traffic flow, identifying conflict points, and implementing effective mitigation strategies are essential for improving road safety. This future study outlines key areas of focus and potential advancements in traffic safety data analysis. By embracing advanced data collection methods, AI-driven analytics, predictive models, and a holistic approach to safety, researchers and policymakers can work together to create safer and more efficient transportation systems. This future study paves the way for innovative solutions that prioritize road safety in an ever-evolving urban landscape.
- 1)
- Advanced Data Collection Methods: Future research should explore innovative data collection methods. This may include the use of more advanced sensor technologies, such as LiDAR, machine vision, and IoT (Internet of Things) devices, to provide real-time, high-resolution data on traffic volumes, speeds, and conflicts.
- 2)
- Big Data and Artificial Intelligence: Harnessing big data analytics and artificial intelligence (AI) will play a significant role in the future of traffic safety analysis. AI algorithms can process vast datasets, identify patterns, and predict potential safety risks, allowing for proactive interventions.
- 3)
- Predictive Analytics: Future studies should focus on developing predictive models that can forecast traffic safety issues before they escalate. These models can factor in historical data, weather conditions, and other variables to provide early warnings and inform traffic management decisions.
- 4)
- Connected and Autonomous Vehicles (CAVs): The integration of CAVs into traffic environments will require specialized data analysis. Studying how CAVs interact with traditional vehicles and pedestrians, as well as their impact on safety, will be a critical area of research.
- 5)
- Pedestrian and Cyclist Safety: Future studies should emphasize pedestrian and cyclist safety, particularly at signalized intersections. This includes analyzing pedestrian and cyclist behavior, improving infrastructure design, and developing technologies to enhance their safety.
- 6)
- Behavioral Analysis: In-depth analysis of driver, pedestrian, and cyclist behavior, including factors like distraction and impairment, will be essential for developing targeted interventions and educational campaigns.
- 7)
- Simulation and Virtual Testing: Advanced simulation tools and virtual testing environments will allow researchers to model and evaluate the safety impact of various intersection designs and traffic management strategies before implementation.
- 8)
- Human-Machine Interaction: Studying the interaction between humans and emerging transportation technologies, such as autonomous vehicles and smart traffic management systems, will be crucial for ensuring safe coexistence.
- 9)
- Policy and Regulatory Frameworks: Future research should also consider the development of policy and regulatory frameworks that encourage the adoption of safety-enhancing technologies and practices.
- 10)
- Cross-Disciplinary Collaboration: Interdisciplinary collaboration between transportation engineers, data scientists, urban planners, and social scientists will be essential for addressing complex traffic safety challenges effectively.
References
- Anisha, A.M.; Abdel-Aty, M.; Abdelraouf, A.; Islam, Z.; Zheng, O. Automated vehicle to vehicle conflict analysis at signalized intersections by camera and LiDAR sensor fusion. Transportation research record 2023, 2677, 117–132. [Google Scholar] [CrossRef]
- Ansariyar, A. (2022). Investigating the Car-Pedestrian Conflicts Based on an Innovative Post Encroachment Time Threshold (PET) Classification. Available at SSRN 4377745. [CrossRef]
- Ansariyar, A.; Ardeshiri, A.; Vaziri, E.; Jeihani, M. (2022). Investigating the Traffic Behavior of Bicyclists in Interaction with Car Users on Shared Bike Lanes Without Physical Barriers. In Transportation Research Board 102nd Annual Meeting Location: Washington DC, United States. [CrossRef]
- Ansariyar, A.; & Jeihani, M. (2023, June). Investigating the Vehicle-Bicyclists Conflicts using LIDAR sensor technology at signalized intersections. In ICTTE 2023: International Conference on Transportation and Traffic Engineering https://publications. waset. org/abstracts/166804/investigating-the-vehicle-bicyclists-conflicts-using-lidar-sensor-technology-at-signalized-intersections. [CrossRef]
- Ansariyar, A.; Jeihani, M. Statistical Analysis of Jaywalking Conflicts By a LiDAR Sensor. Scientific Journal of Silesian University of Technology Series Transport 2023, 120, 17–36. [Google Scholar] [CrossRef]
- Ansariyar, A.; Taherpour, A. Statistical analysis of vehicle-vehicle conflicts with a LIDAR sensor in a signalized intersection. Advances in Transportation Studies 2023, 60. [Google Scholar]
- Ansariyar, A.; Taherpour, A. Investigating the accuracy rate of vehicle-vehicle conflicts by LIDAR technology and microsimulation in VISSIM and AIMSUN. Advances in Transportation Studies 2023, 61. [Google Scholar]
- Ansariyar, A.; Ardeshiri, A; Jeihani, M. Investigating the collected vehicle-pedestrian conflicts by a LIDAR sensor based on a new Post Encroachment Time Threshold (PET) classification at signalized intersections. Advances in Transportation Studies 2023, 61, 103–118. [Google Scholar]
- Arun, A.; Haque, M.M.; Bhaskar, A.; Washington, S.; Sayed, T. A systematic mapping review of surrogate safety assessment using traffic conflict techniques. Accident Analysis & Prevention 2021, 153, 106016. [Google Scholar]
- Astarita, V.; et al. , Surrogate safety measures from traffic simulation models a comparison of different models for intersection safety evaluation. Transportation research procedia 2019, 37, 219–226. [Google Scholar] [CrossRef]
- Ghanim, M.S.; Shaaban, K. A case study for surrogate safety assessment model in predicting real-life conflicts. Arabian Journal for Science and Engineering 2019, 44, 4225–4231. [Google Scholar] [CrossRef]
- Essa, M.; Sayed, T. Comparison between surrogate safety assessment model and real-time safety models in predicting field-measured conflicts at signalized intersections. Transportation research record 2020, 2674, 100–112. [Google Scholar] [CrossRef]
- Savolainen, P.T.; et al. , The statistical analysis of highway crash-injury severities: A review and assessment of methodological alternatives. Accident Analysis & Prevention 2011, 43, 1666–1676. [Google Scholar]
- Salman, N.K.; Al-Maita, K.J. Safety evaluation at three-leg, unsignalized intersections by traffic conflict technique. Transportation Research Record 1995, 1485, 177–185. [Google Scholar]
- Sayed, T.; Zein, S. Traffic conflict standards for intersections. Transportation Planning and Technology 1999, 22, 309–323. [Google Scholar] [CrossRef]
- Zhang, X.; et al. , Modeling the frequency of opposing left-turn conflicts at signalized intersections using generalized linear regression models. Traffic injury prevention 2014, 15, 645–651. [Google Scholar] [CrossRef] [PubMed]
- Sacchi, E.; Sayed, T. Bayesian estimation of conflict-based safety performance functions. Journal of Transportation Safety & Security 2016, 8, 266–279. [Google Scholar]
- Essa, M.; Sayed, T. Full Bayesian conflict-based models for real time safety evaluation of signalized intersections. Accident Analysis & Prevention 2019, 129, 367–381. [Google Scholar]
- Minderhoud, M.M.; Bovy, P.H. Extended time-to-collision measures for road traffic safety assessment. Accident Analysis & Prevention 2001, 33, 89–97. [Google Scholar]
- Vogel, K. A comparison of headway and time to collision as safety indicators. Accident analysis & prevention 2003, 35, 427–433. [Google Scholar]
- Sayed, T.; Zaki, M.H.; Autey, J. Automated safety diagnosis of vehicle–bicycle interactions using computer vision analysis. Safety science 2013, 59, 163–172. [Google Scholar] [CrossRef]
- Sayed, T.; Brown, G.; Navin, F. Simulation of traffic conflicts at unsignalized intersections with TSC-Sim. Accident Analysis & Prevention 1994, 26, 593–607. [Google Scholar]
- Van der Horst, A.R.A. A time-based analysis of road user behaviour in normal and critical encounters. 1991.
- Meng, Q.; Qu, X. Estimation of rear-end vehicle crash frequencies in urban road tunnels. Accident Analysis & Prevention 2012, 48, 254–263. [Google Scholar]
- Farah, H.; et al. A model for passing decisions on two-lane rural highways. 2008.
- Hou, J.; List, G.F.; Guo, X. New algorithms for computing the time-to-collision in freeway traffic simulation models. Computational intelligence and neuroscience 2014, 2014. [Google Scholar] [CrossRef] [PubMed]
- Stylianou, K.; Dimitriou, L. Analysis of rear-end conflicts in urban networks using Bayesian networks. Transportation research record 2018, 2672, 302–312. [Google Scholar] [CrossRef]
- Xie, K.; et al. Use of real-world connected vehicle data in identifying high-risk locations based on a new surrogate safety measure. Accident Analysis & Prevention 2019, 125, 311–319. [Google Scholar]
- Formosa, N.; et al. Predicting real-time traffic conflicts using deep learning. Accident Analysis & Prevention 2020, 136, 105429. [Google Scholar]
- Mahmud, S.; et al. Prioritizing hazardous road sections using surrogate safety measures: A count data modelling application in a heterogeneous traffic environment. 2018.
- Uzondu, C.; Jamson, S.; Lai, F. Exploratory study involving observation of traffic behaviour and conflicts in Nigeria using the Traffic Conflict Technique. Safety science 2018, 110, 273–284. [Google Scholar] [CrossRef]
- Dimitriou, L.; Stylianou, K.; Abdel-Aty, M.A. Assessing rear-end crash potential in urban locations based on vehicle-by-vehicle interactions, geometric characteristics and operational conditions. Accident Analysis & Prevention 2018, 118, 221–235. [Google Scholar]
- Maryland Crash Dataset, 2023, Maryland government, https://mdsp.maryland.gov/Pages/Dashboards/CrashDataDownload.aspx.
Figure 1.
Marlboro Pike & Brooks Dr. intersection.
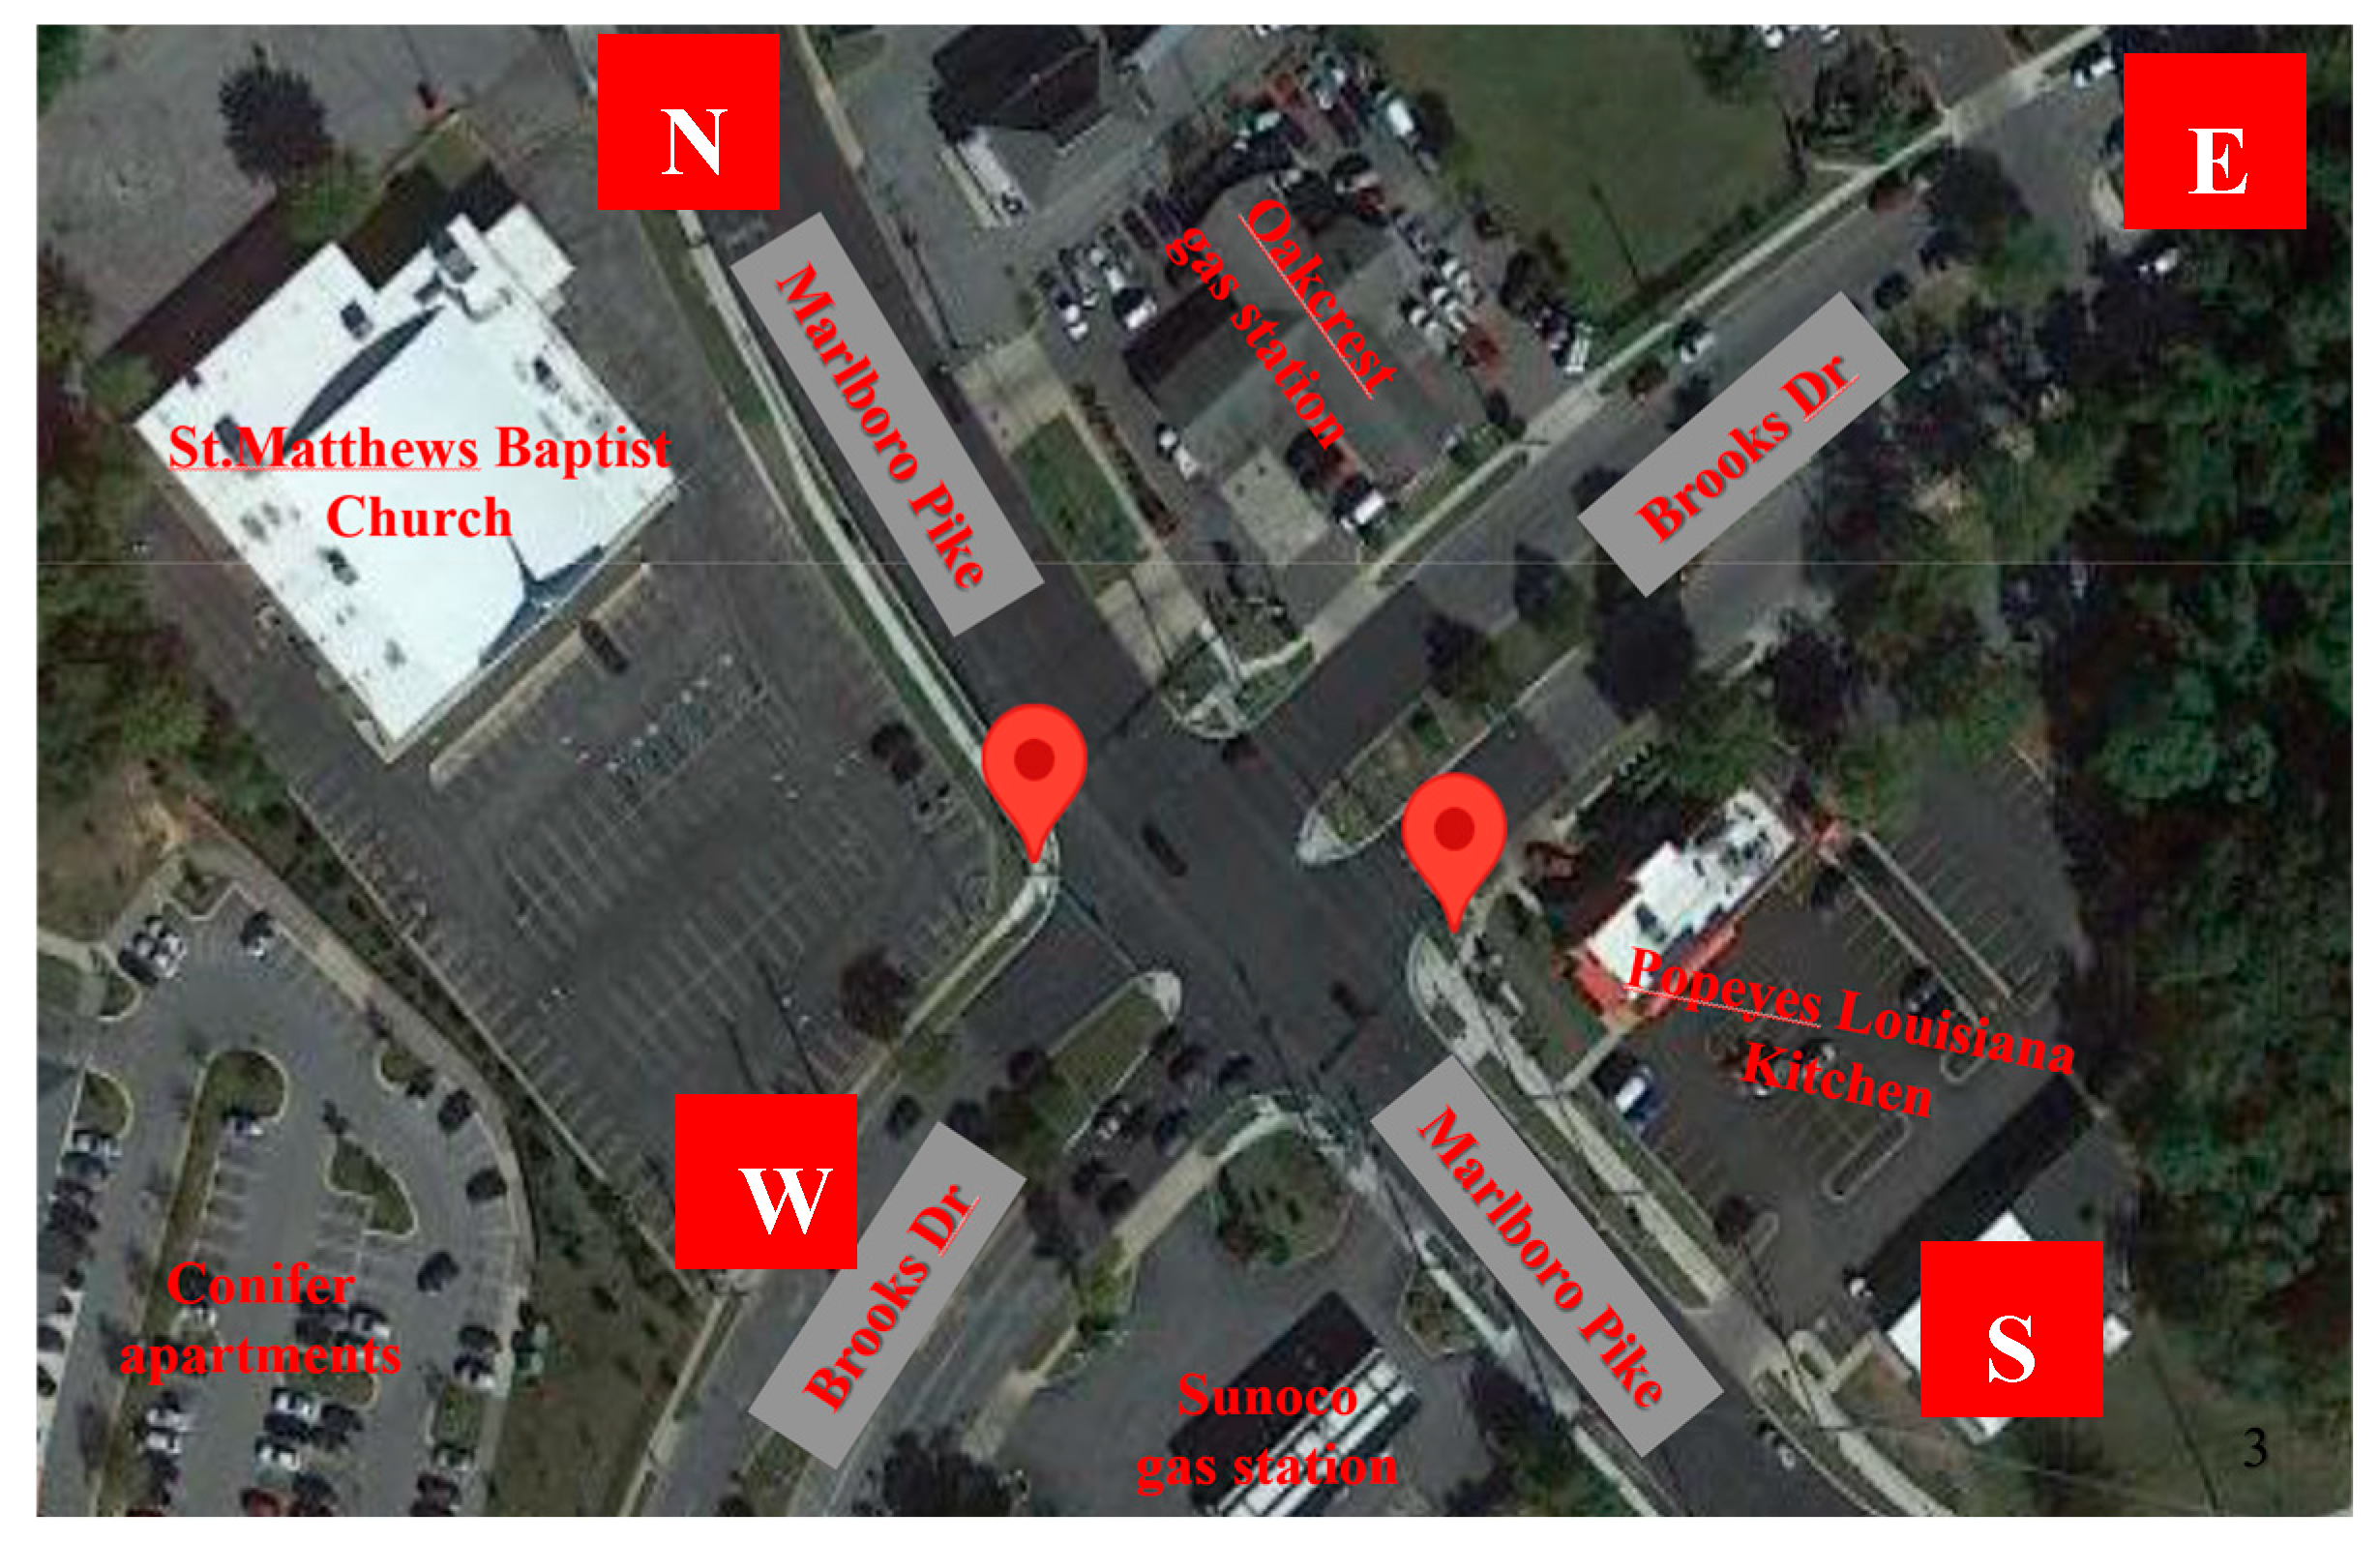
Figure 2.
Morning peak hour, Peak Day Vehicle and Pedestrian Volumes on Friday, June 2nd.
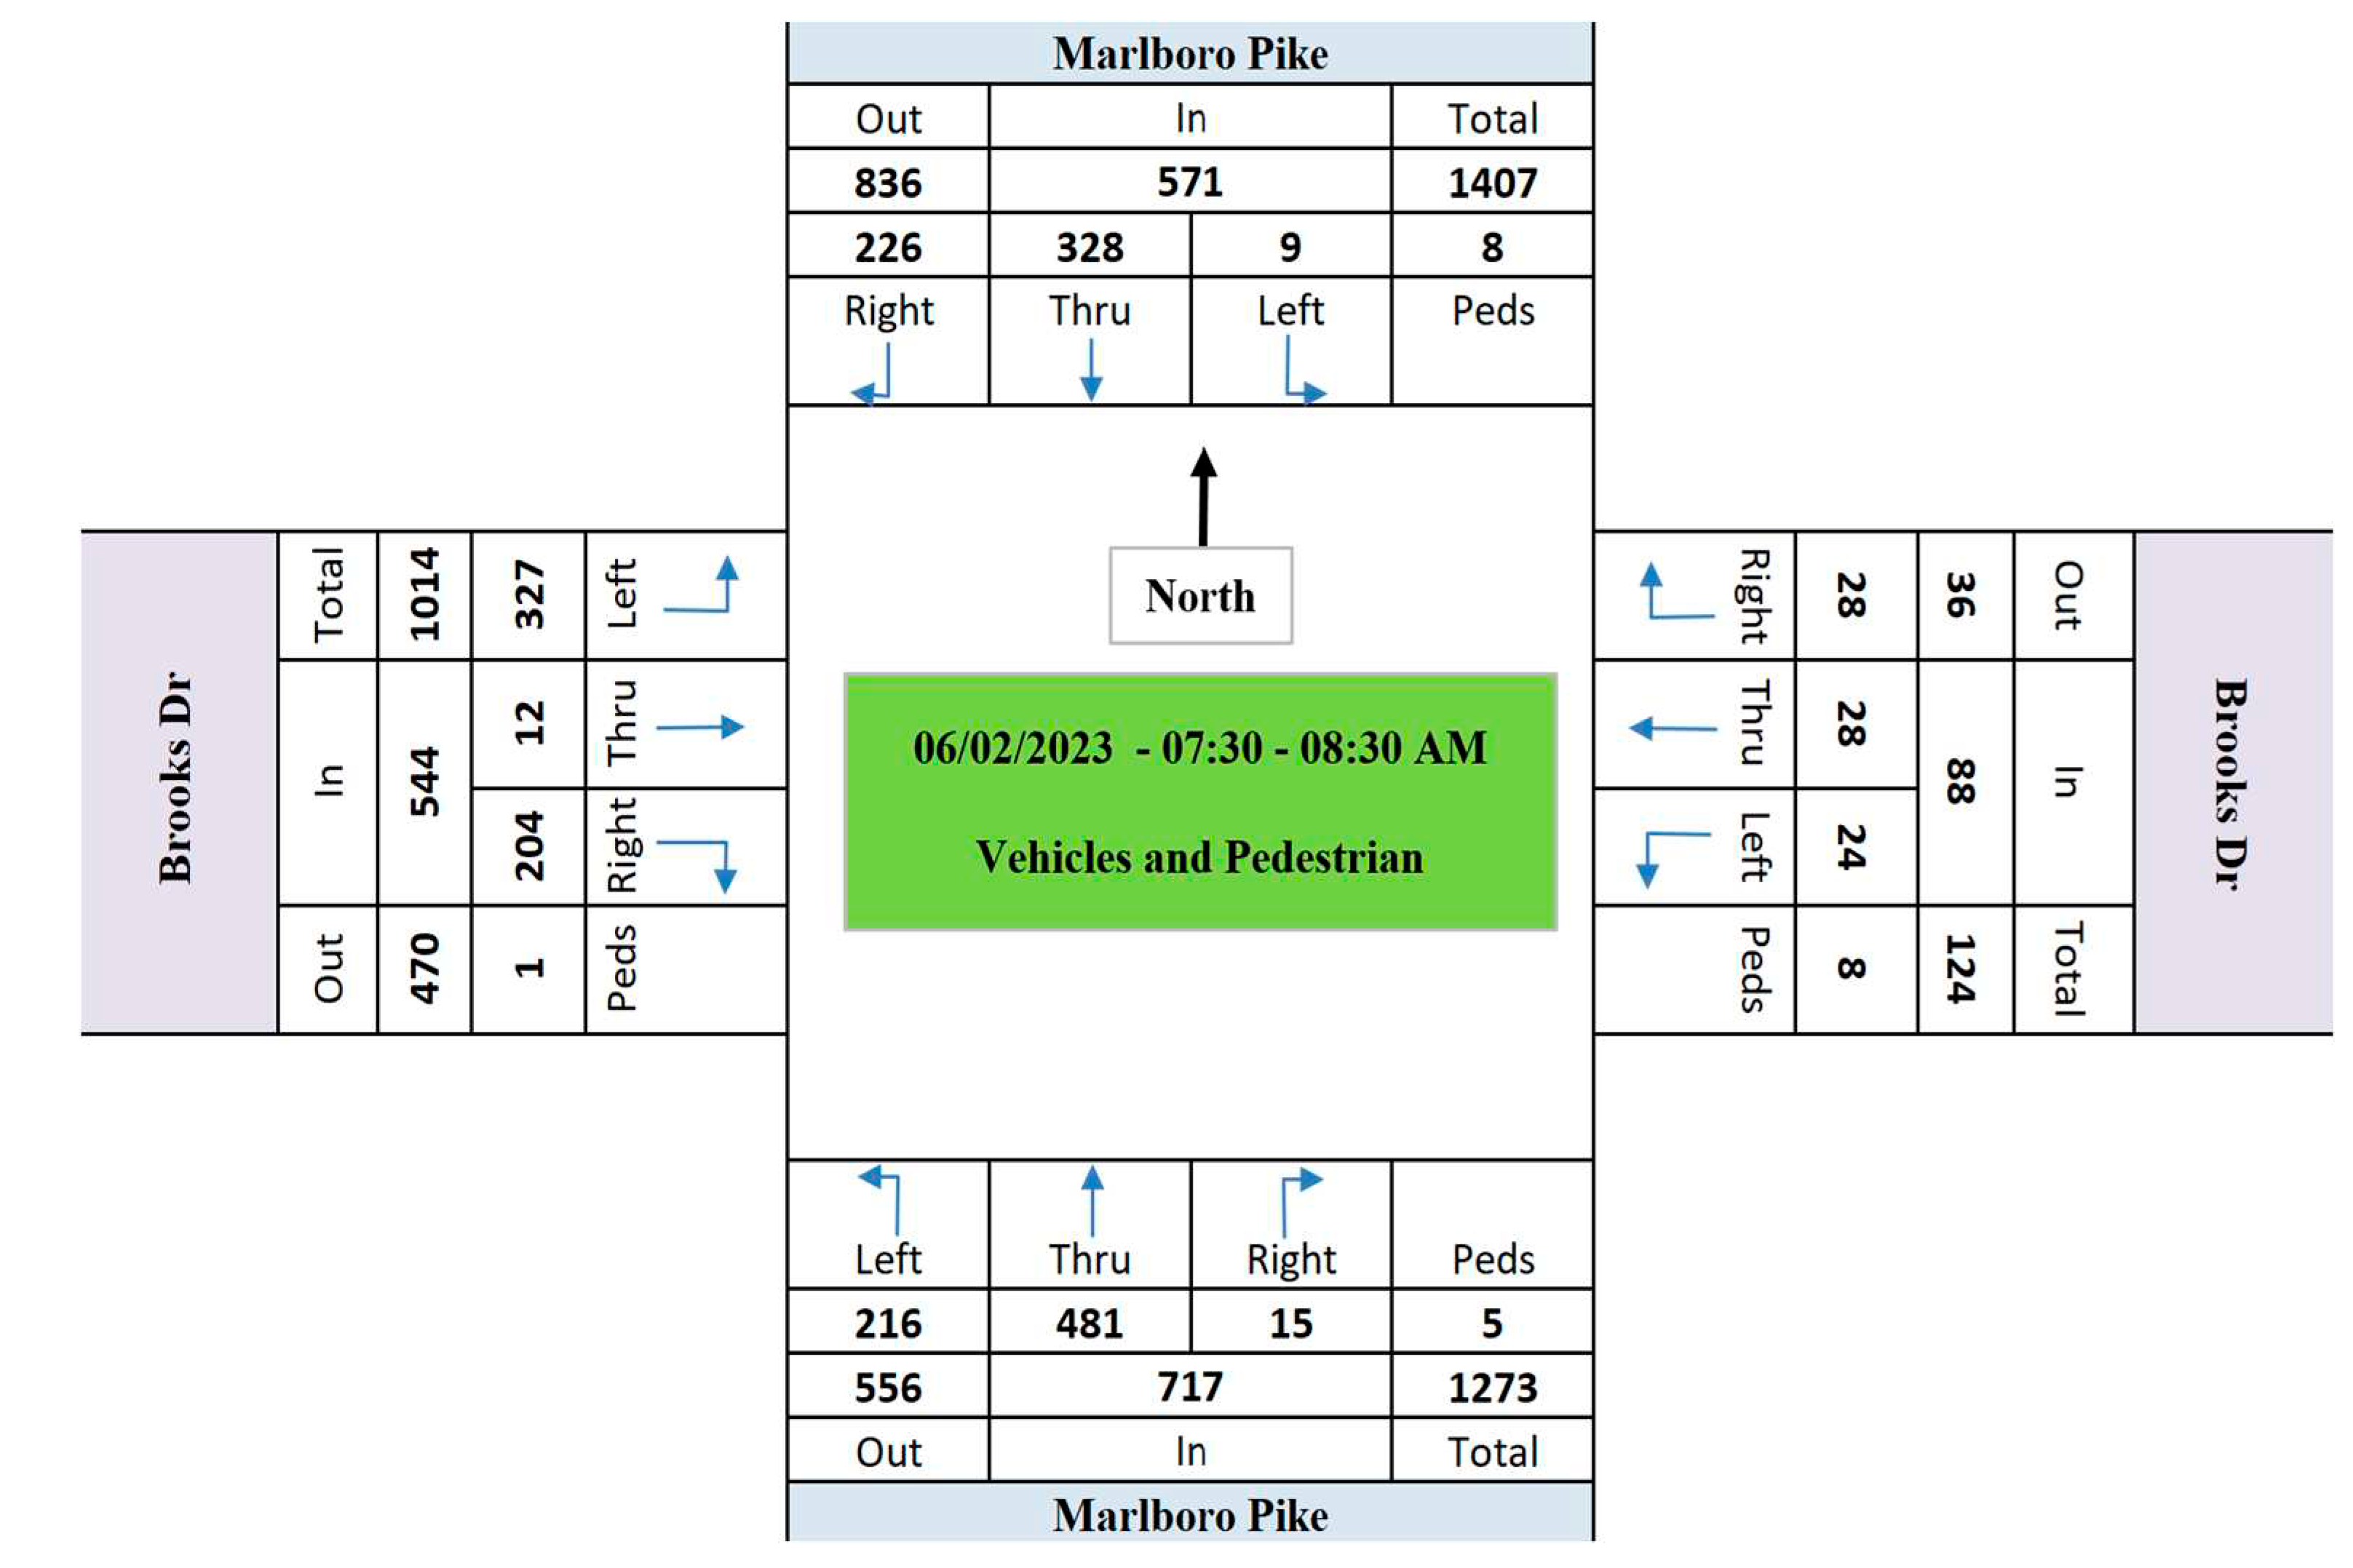
Figure 3.
Mid-day peak hour, Peak Day Vehicle and Pedestrian Volumes on Friday, June 2nd.
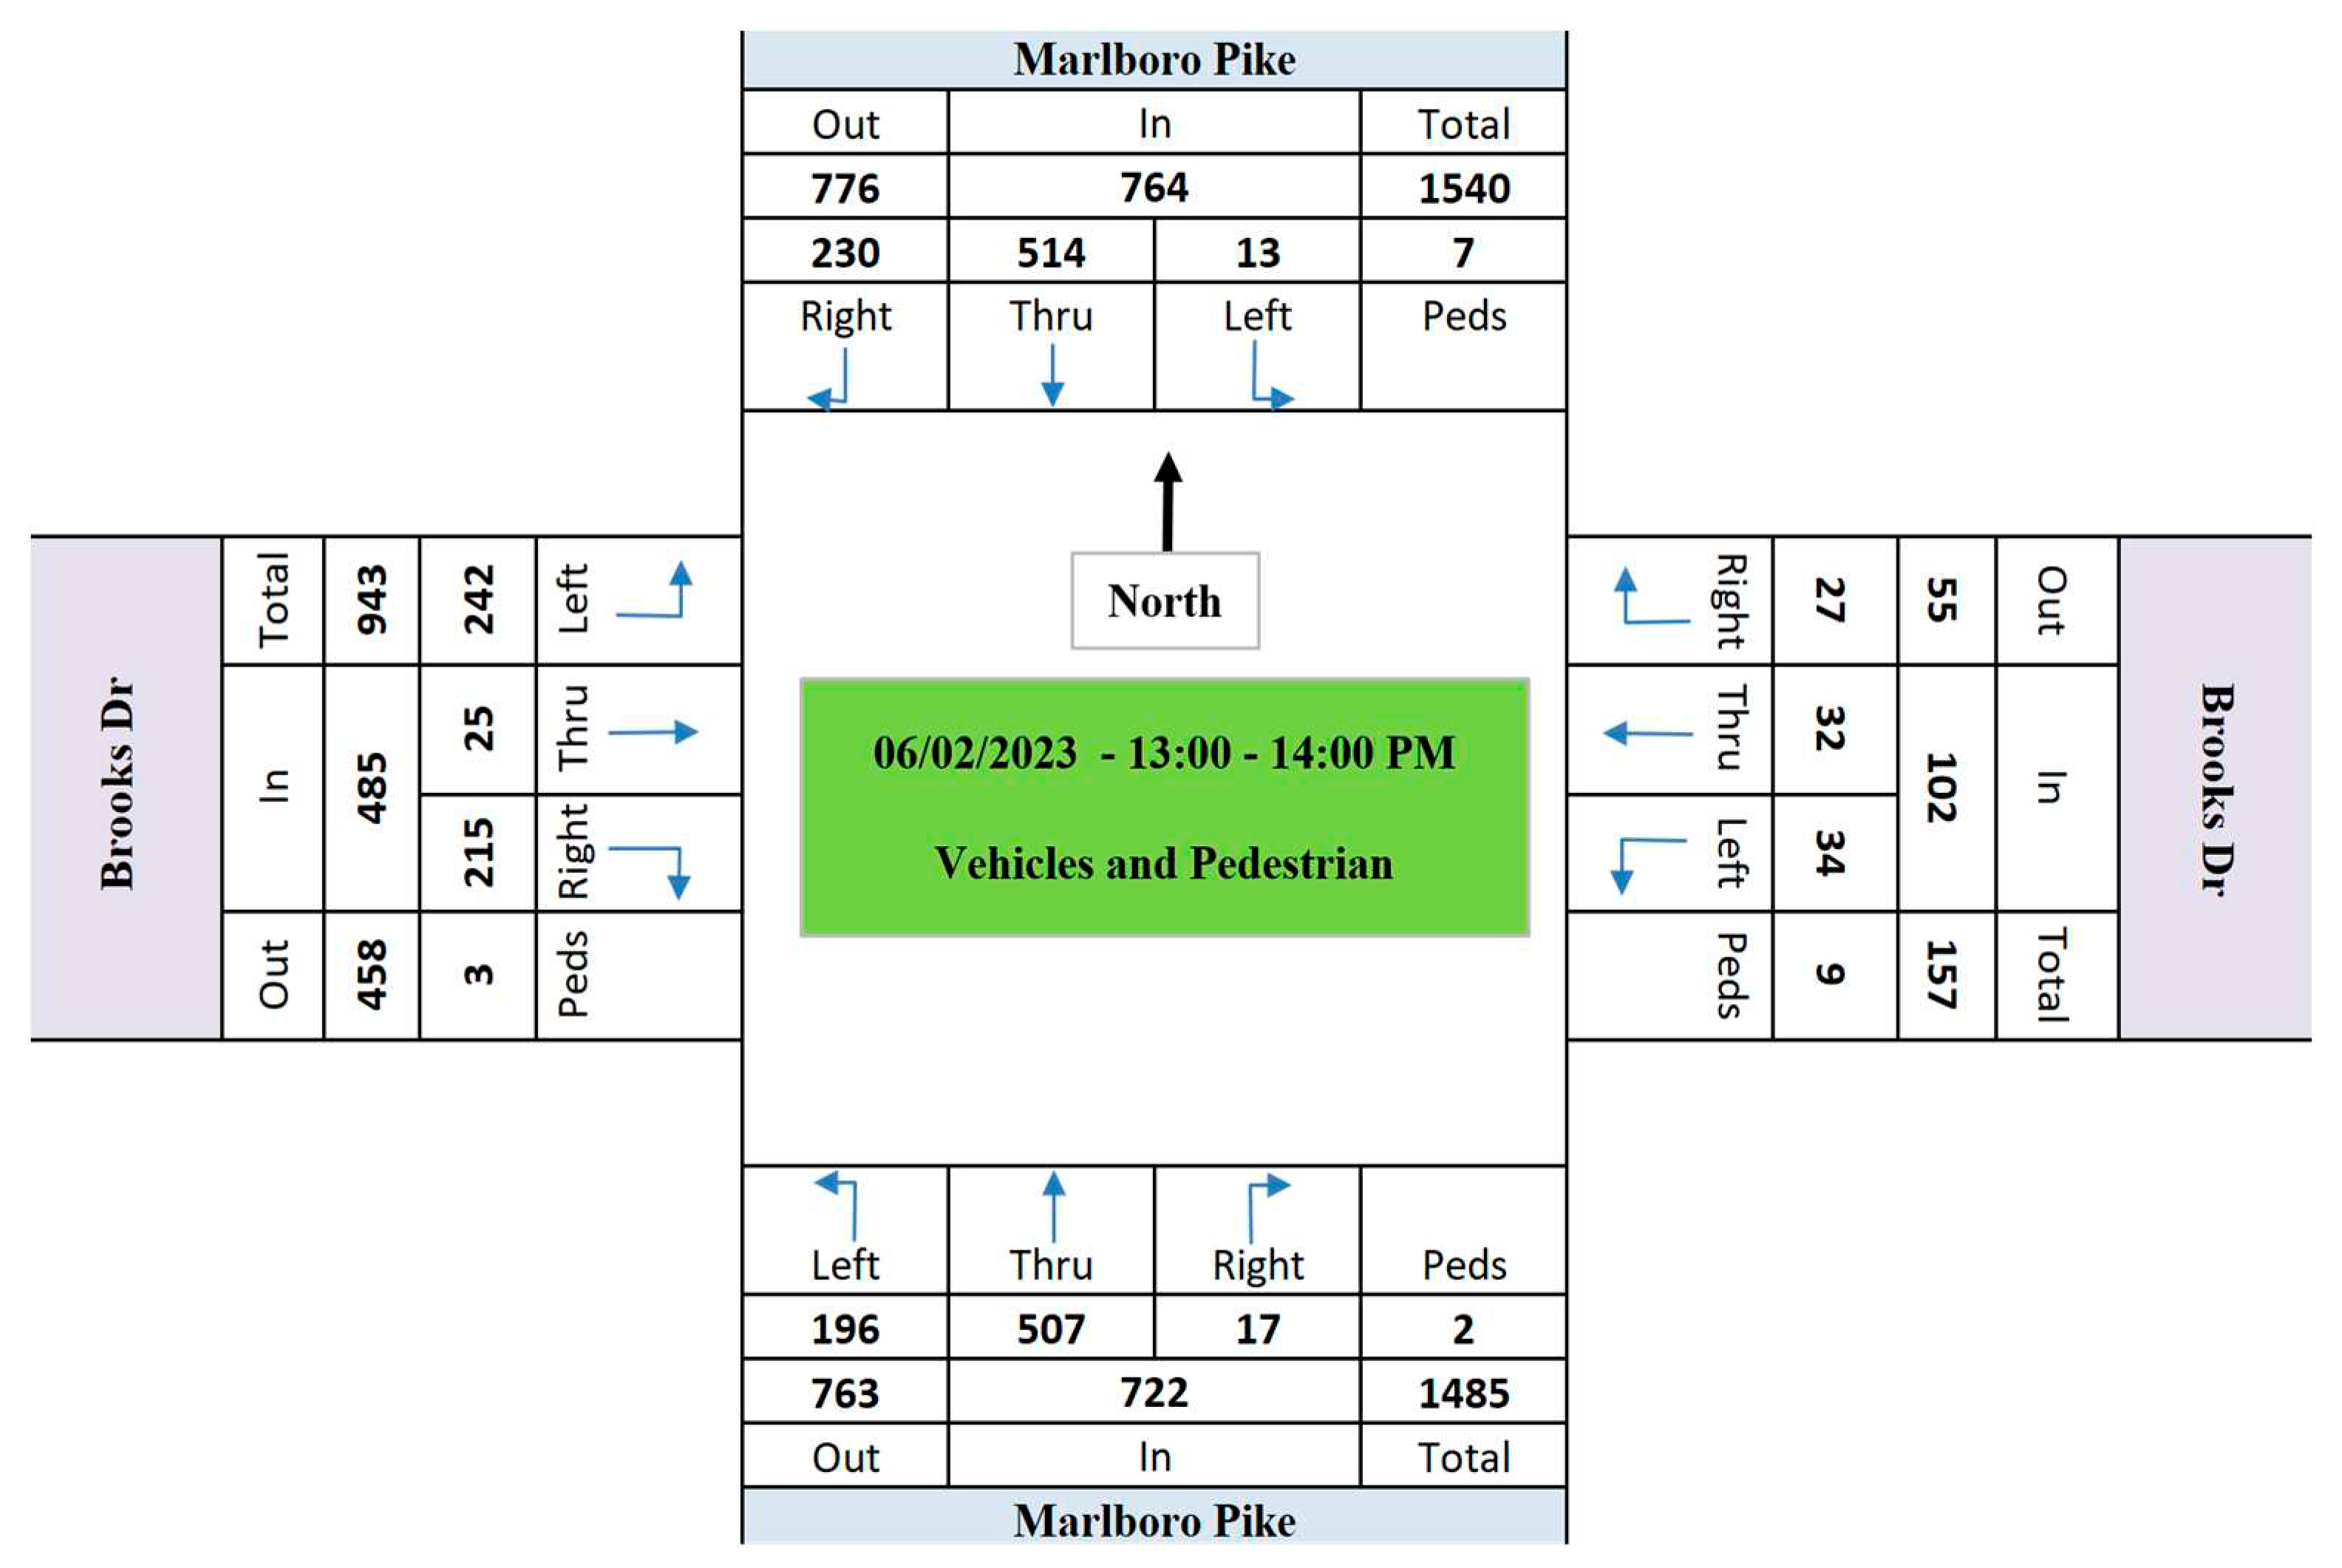
Figure 4.
Afternoon peak hour, Peak Day Vehicle and Pedestrian Volumes on Friday, June 2nd.
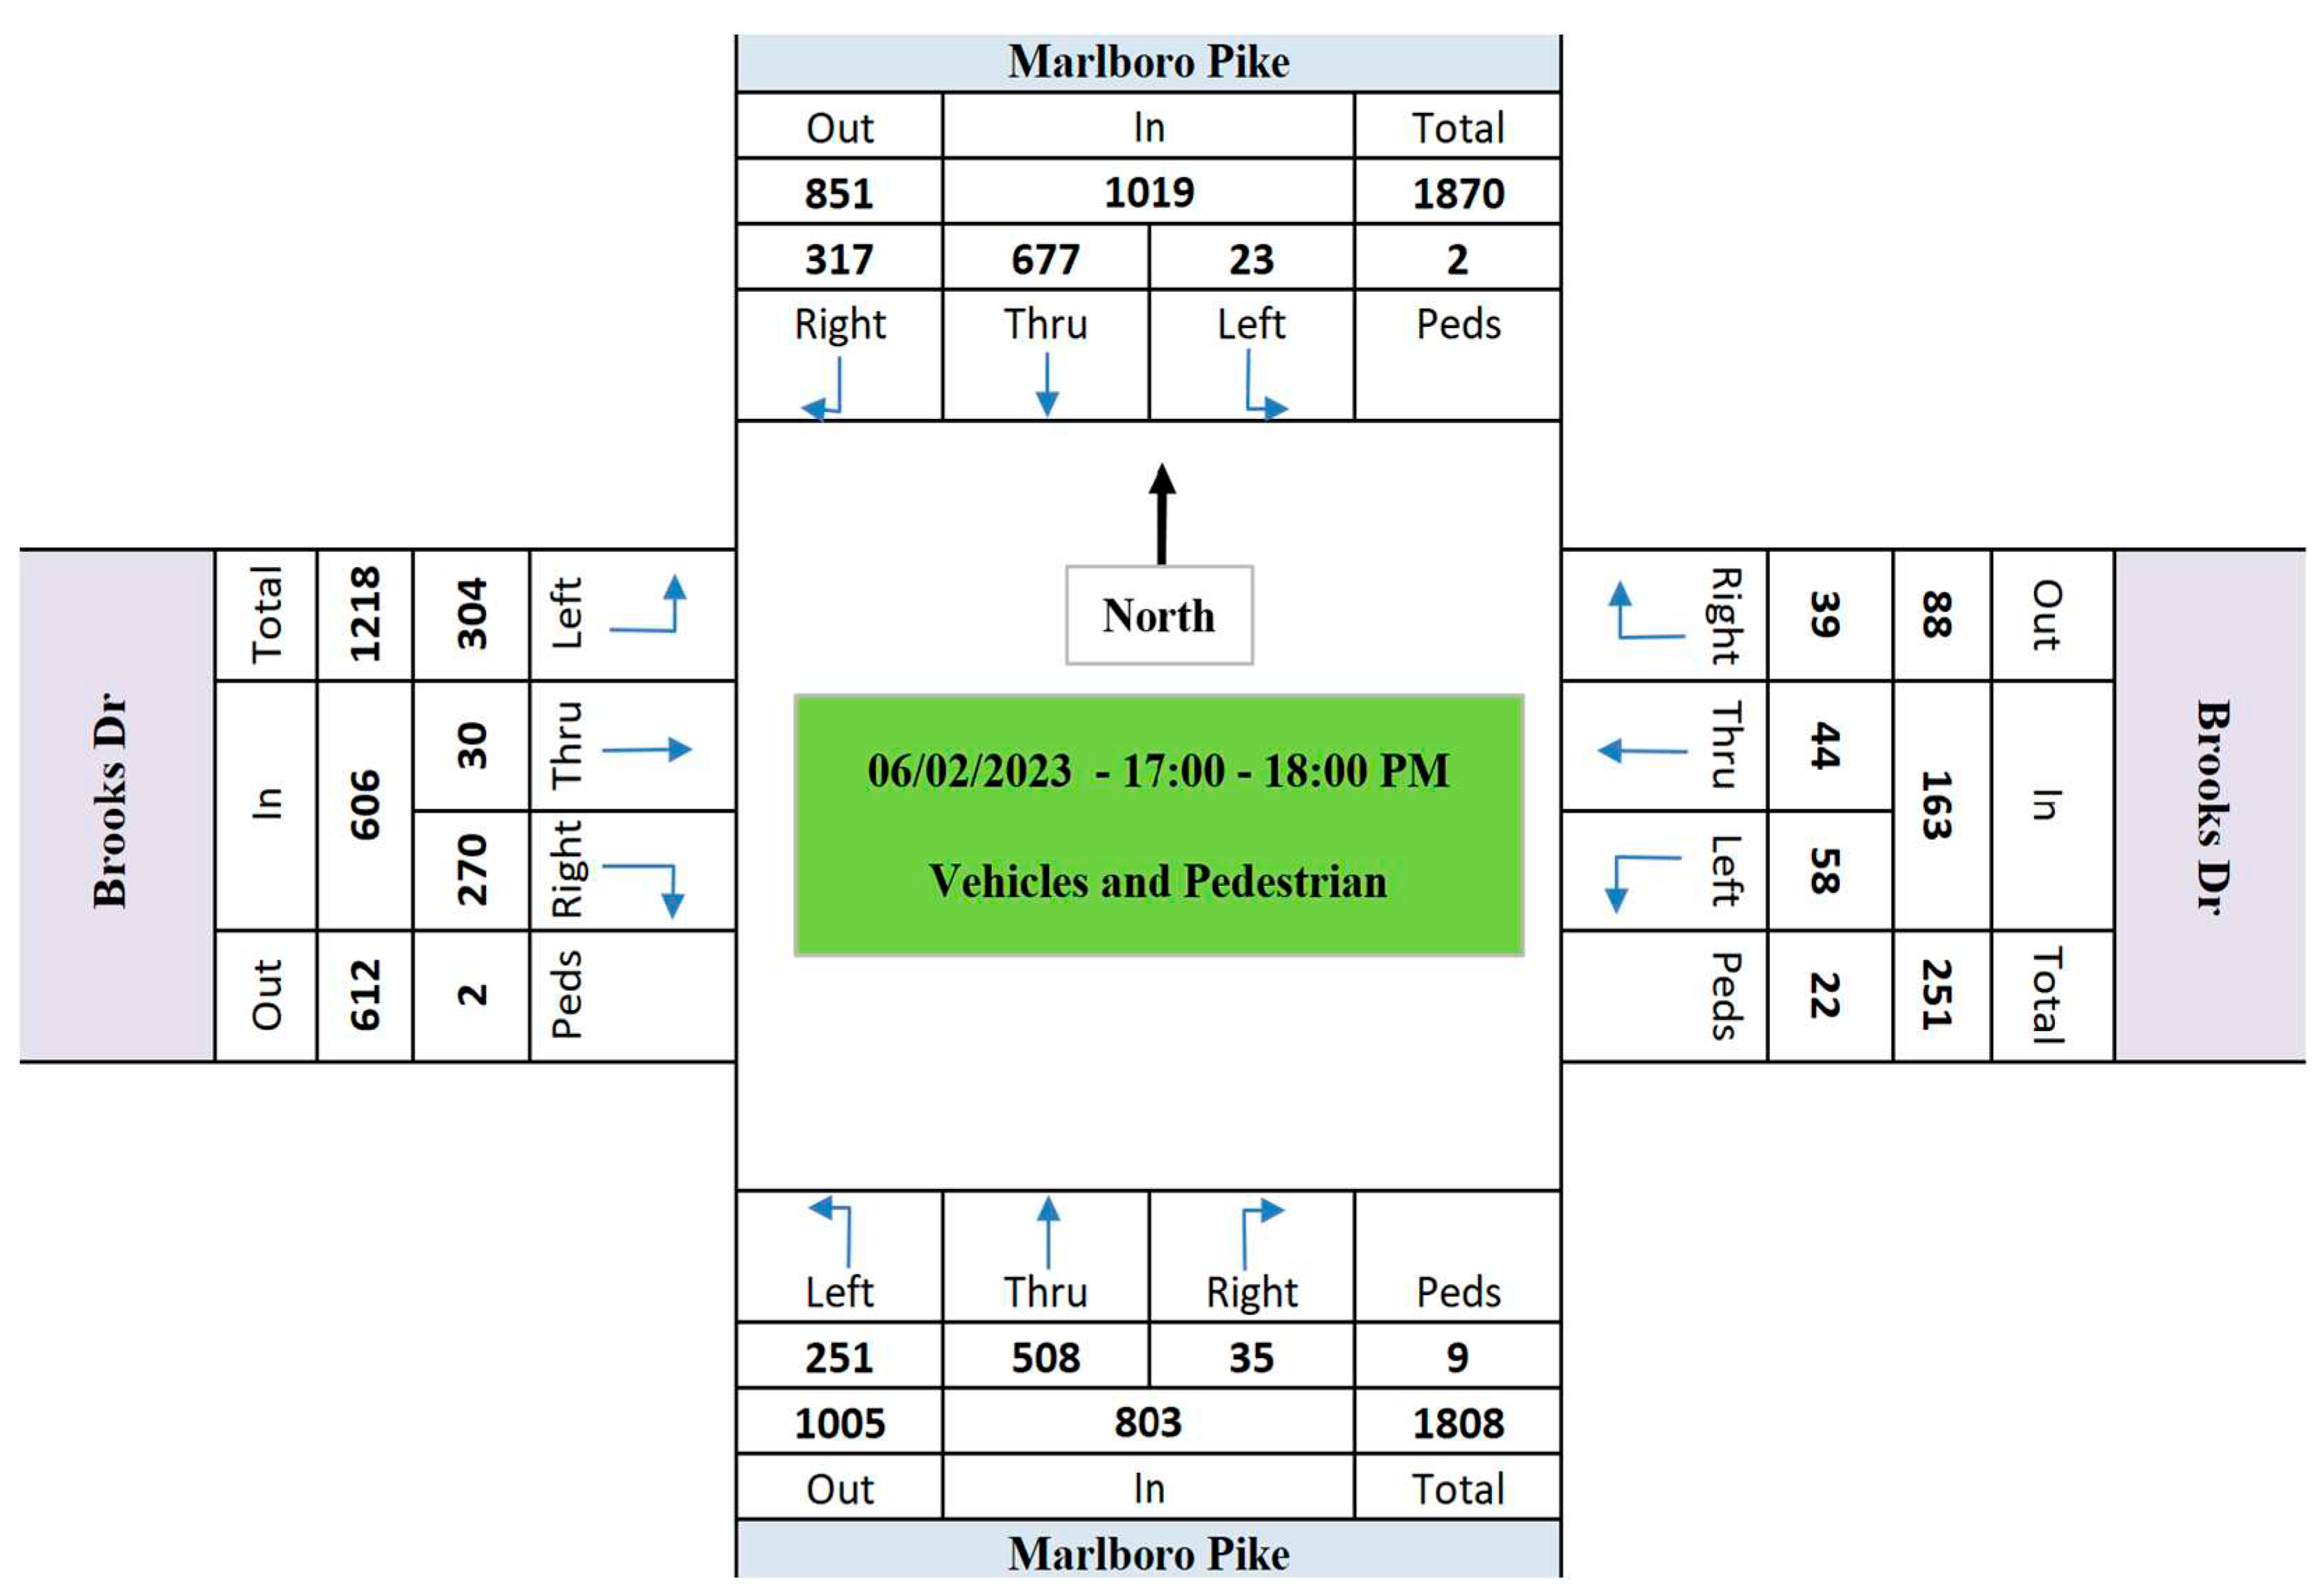
Figure 5.
Speed Changes In Different Intersection's Approaches From June, 1st to July, 7th 2023 .
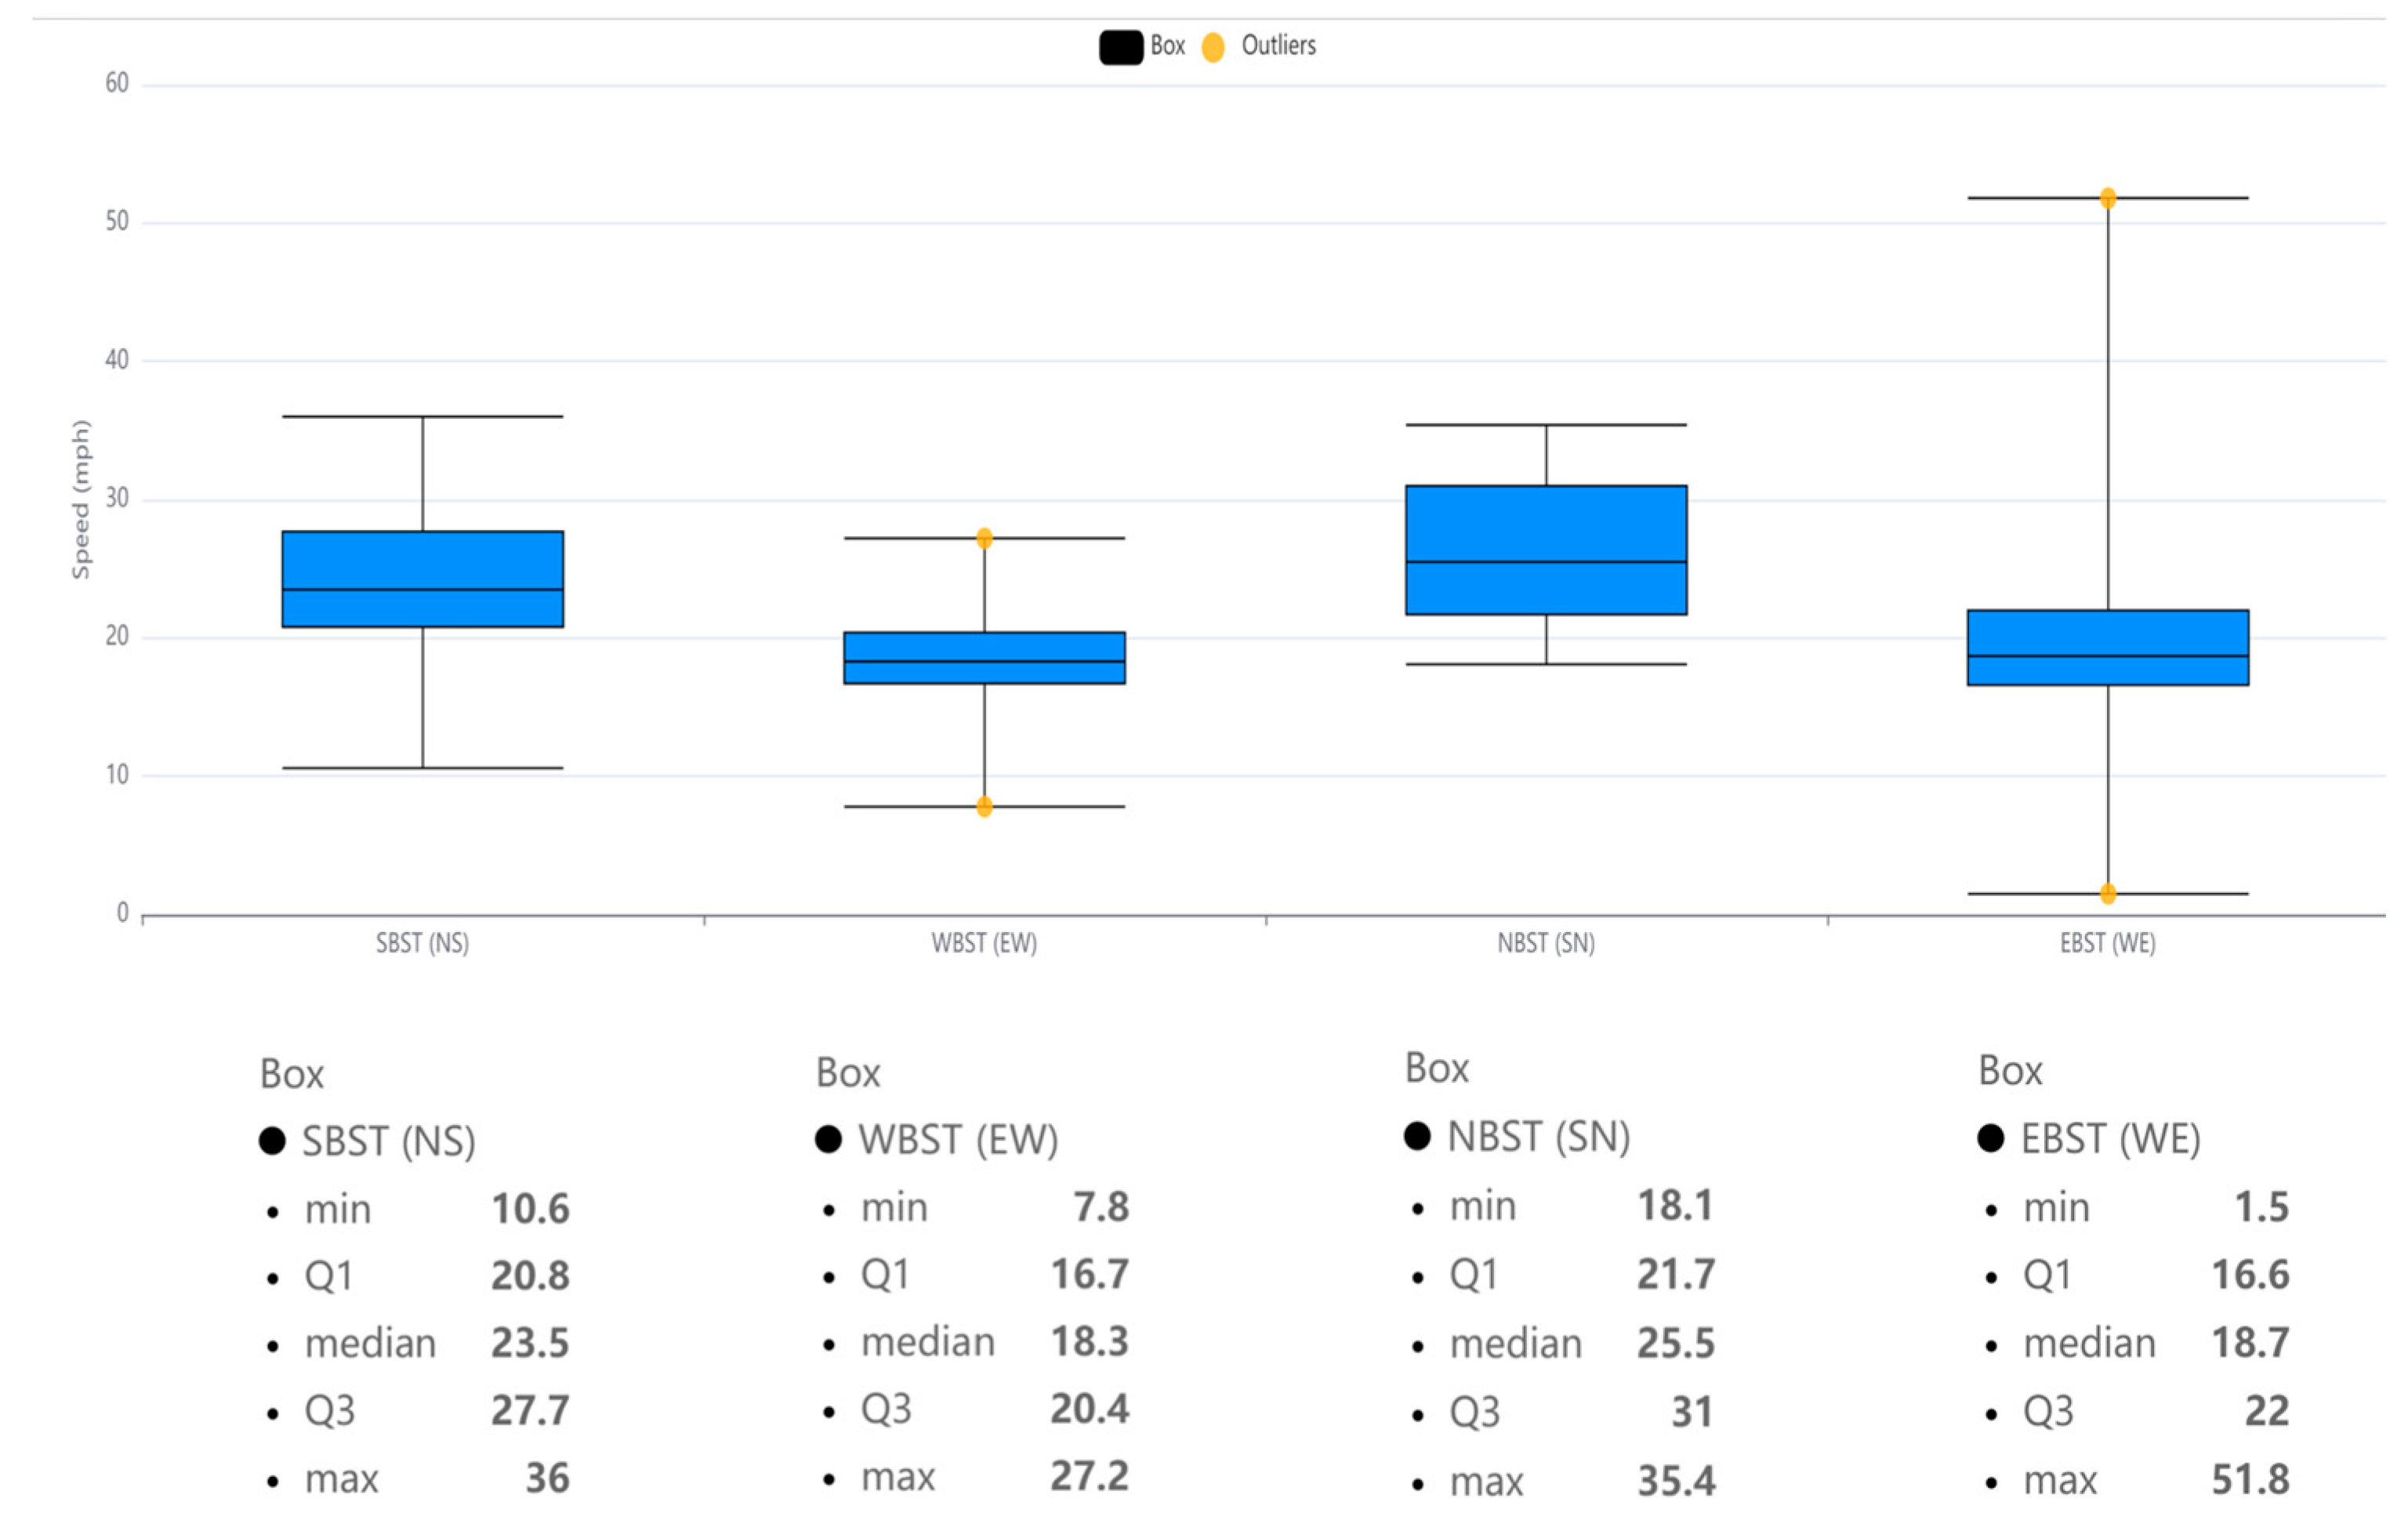
Figure 6.
Vehicle – Vehicle Conflicts Heat map from June, 1st to July, 7th.
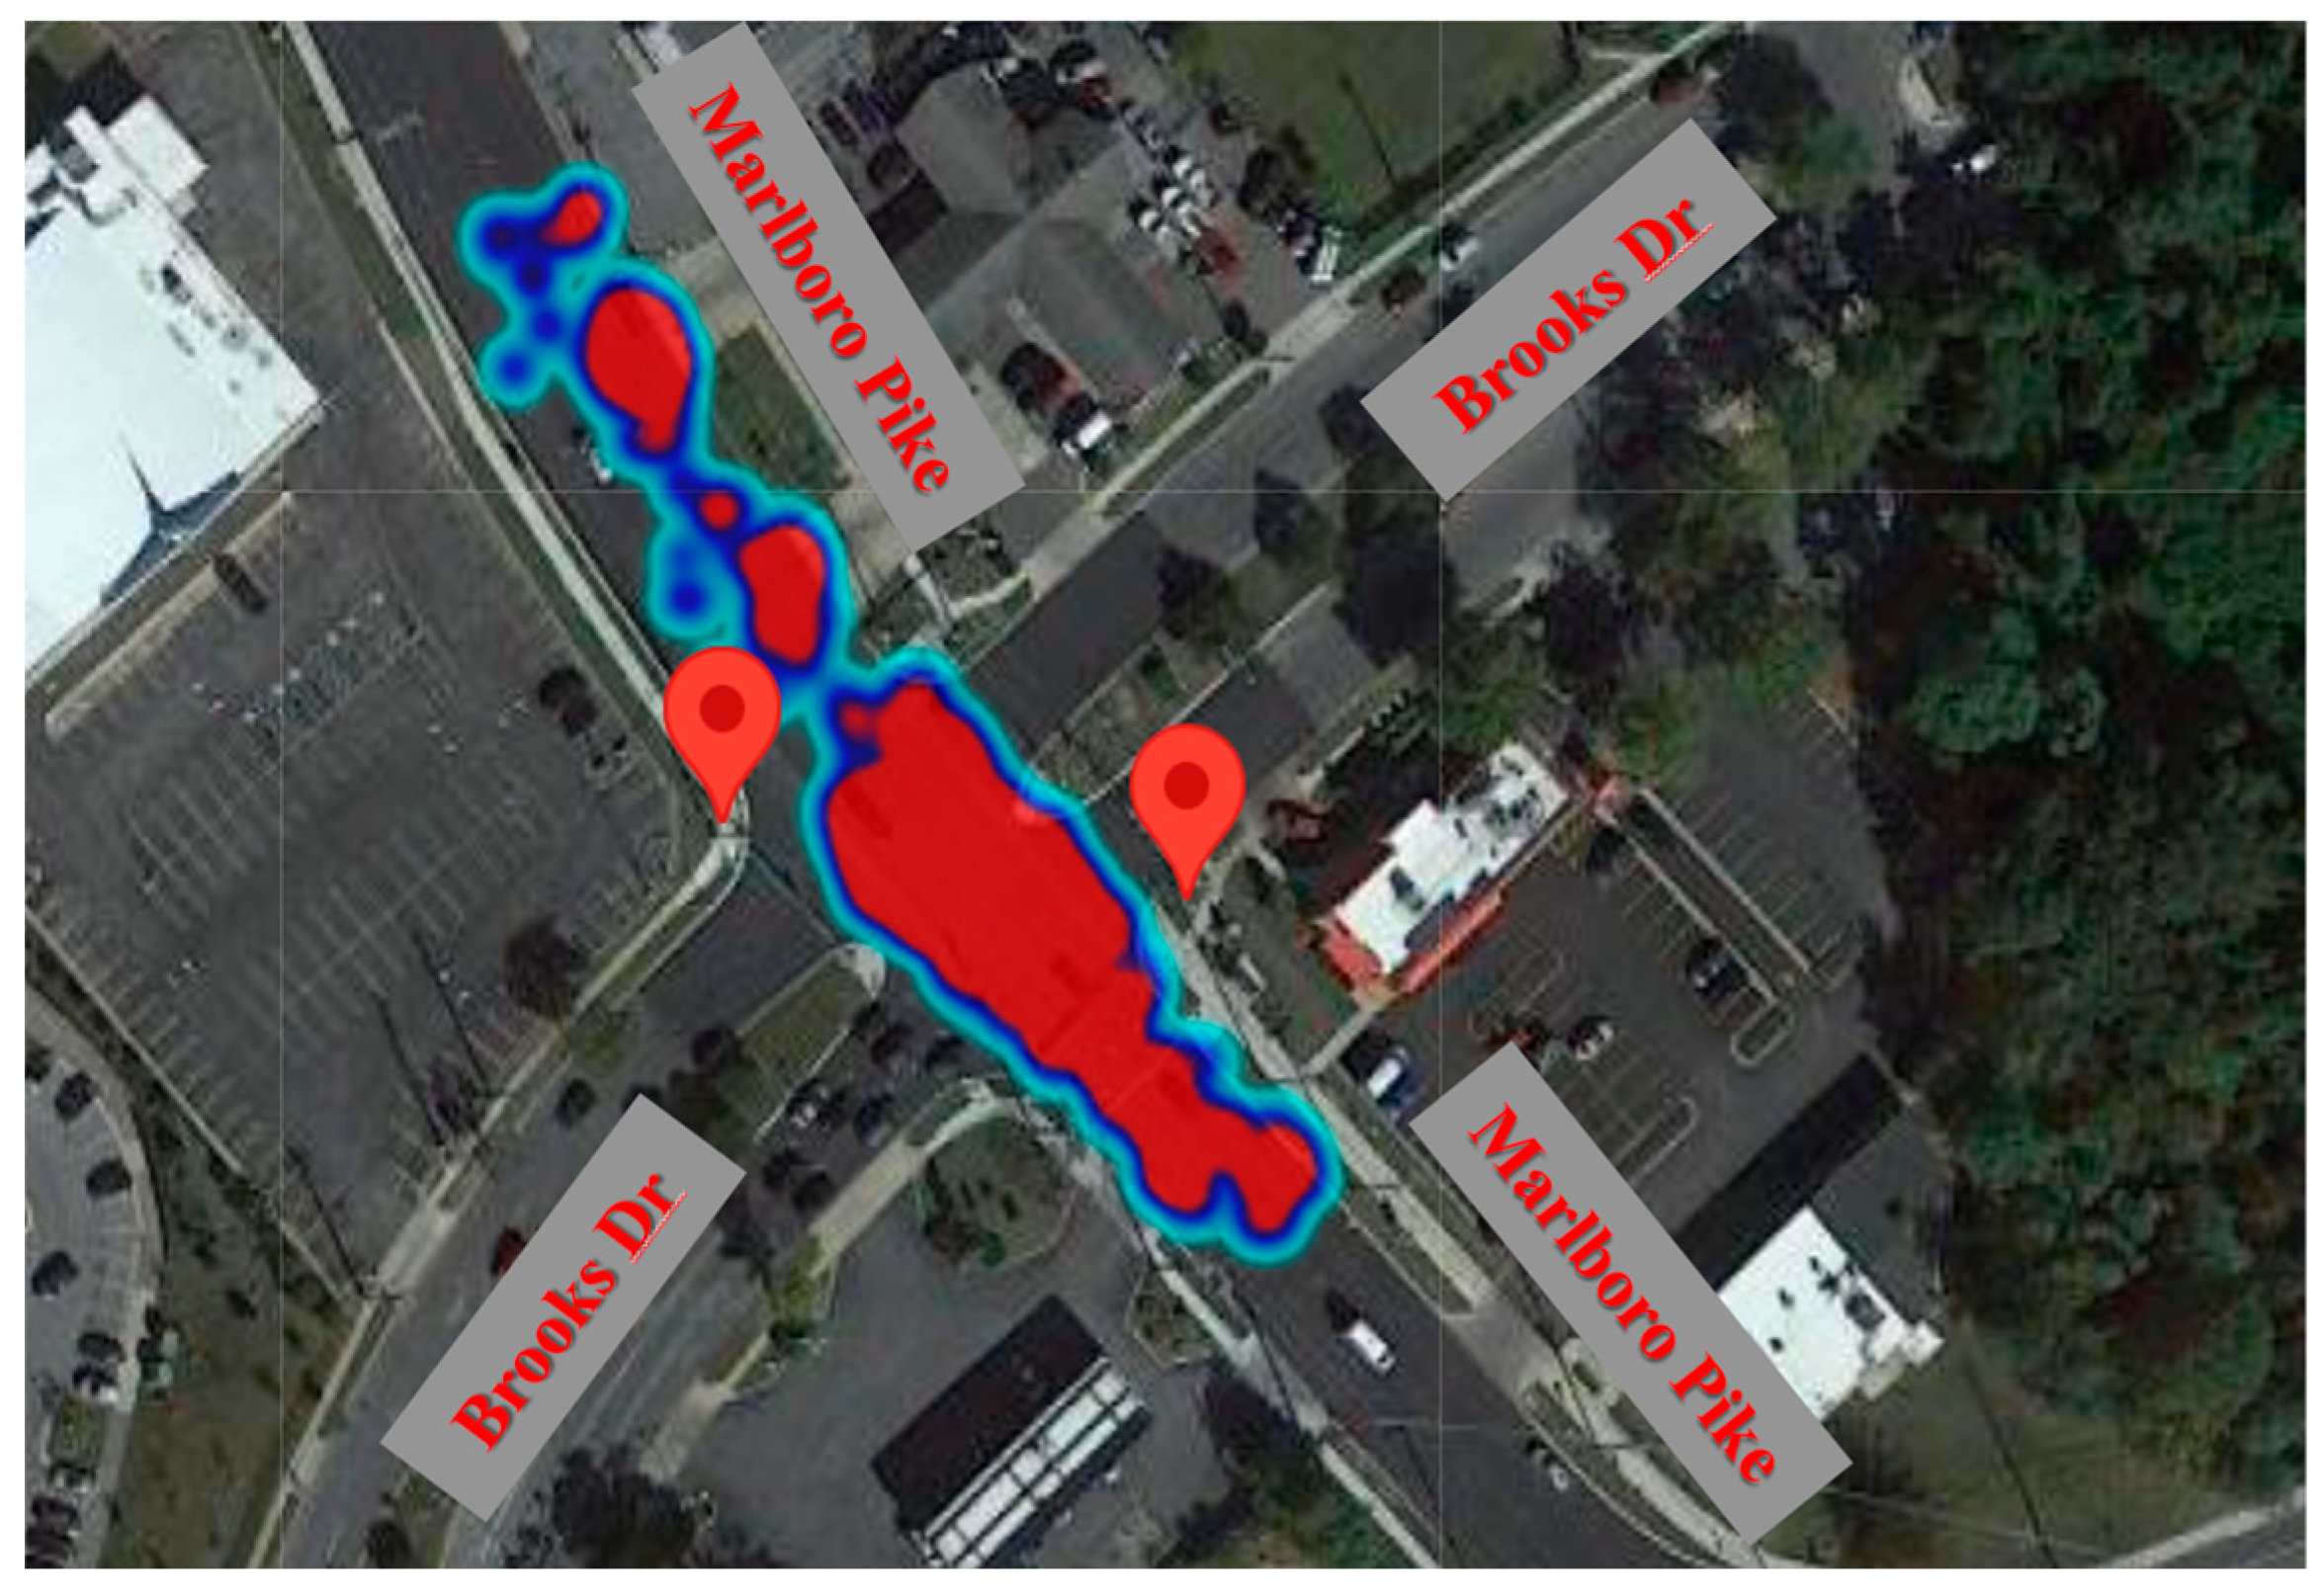
Figure 7.
Daily Frequency of Vehicle – Vehicle Conflicts Chart.
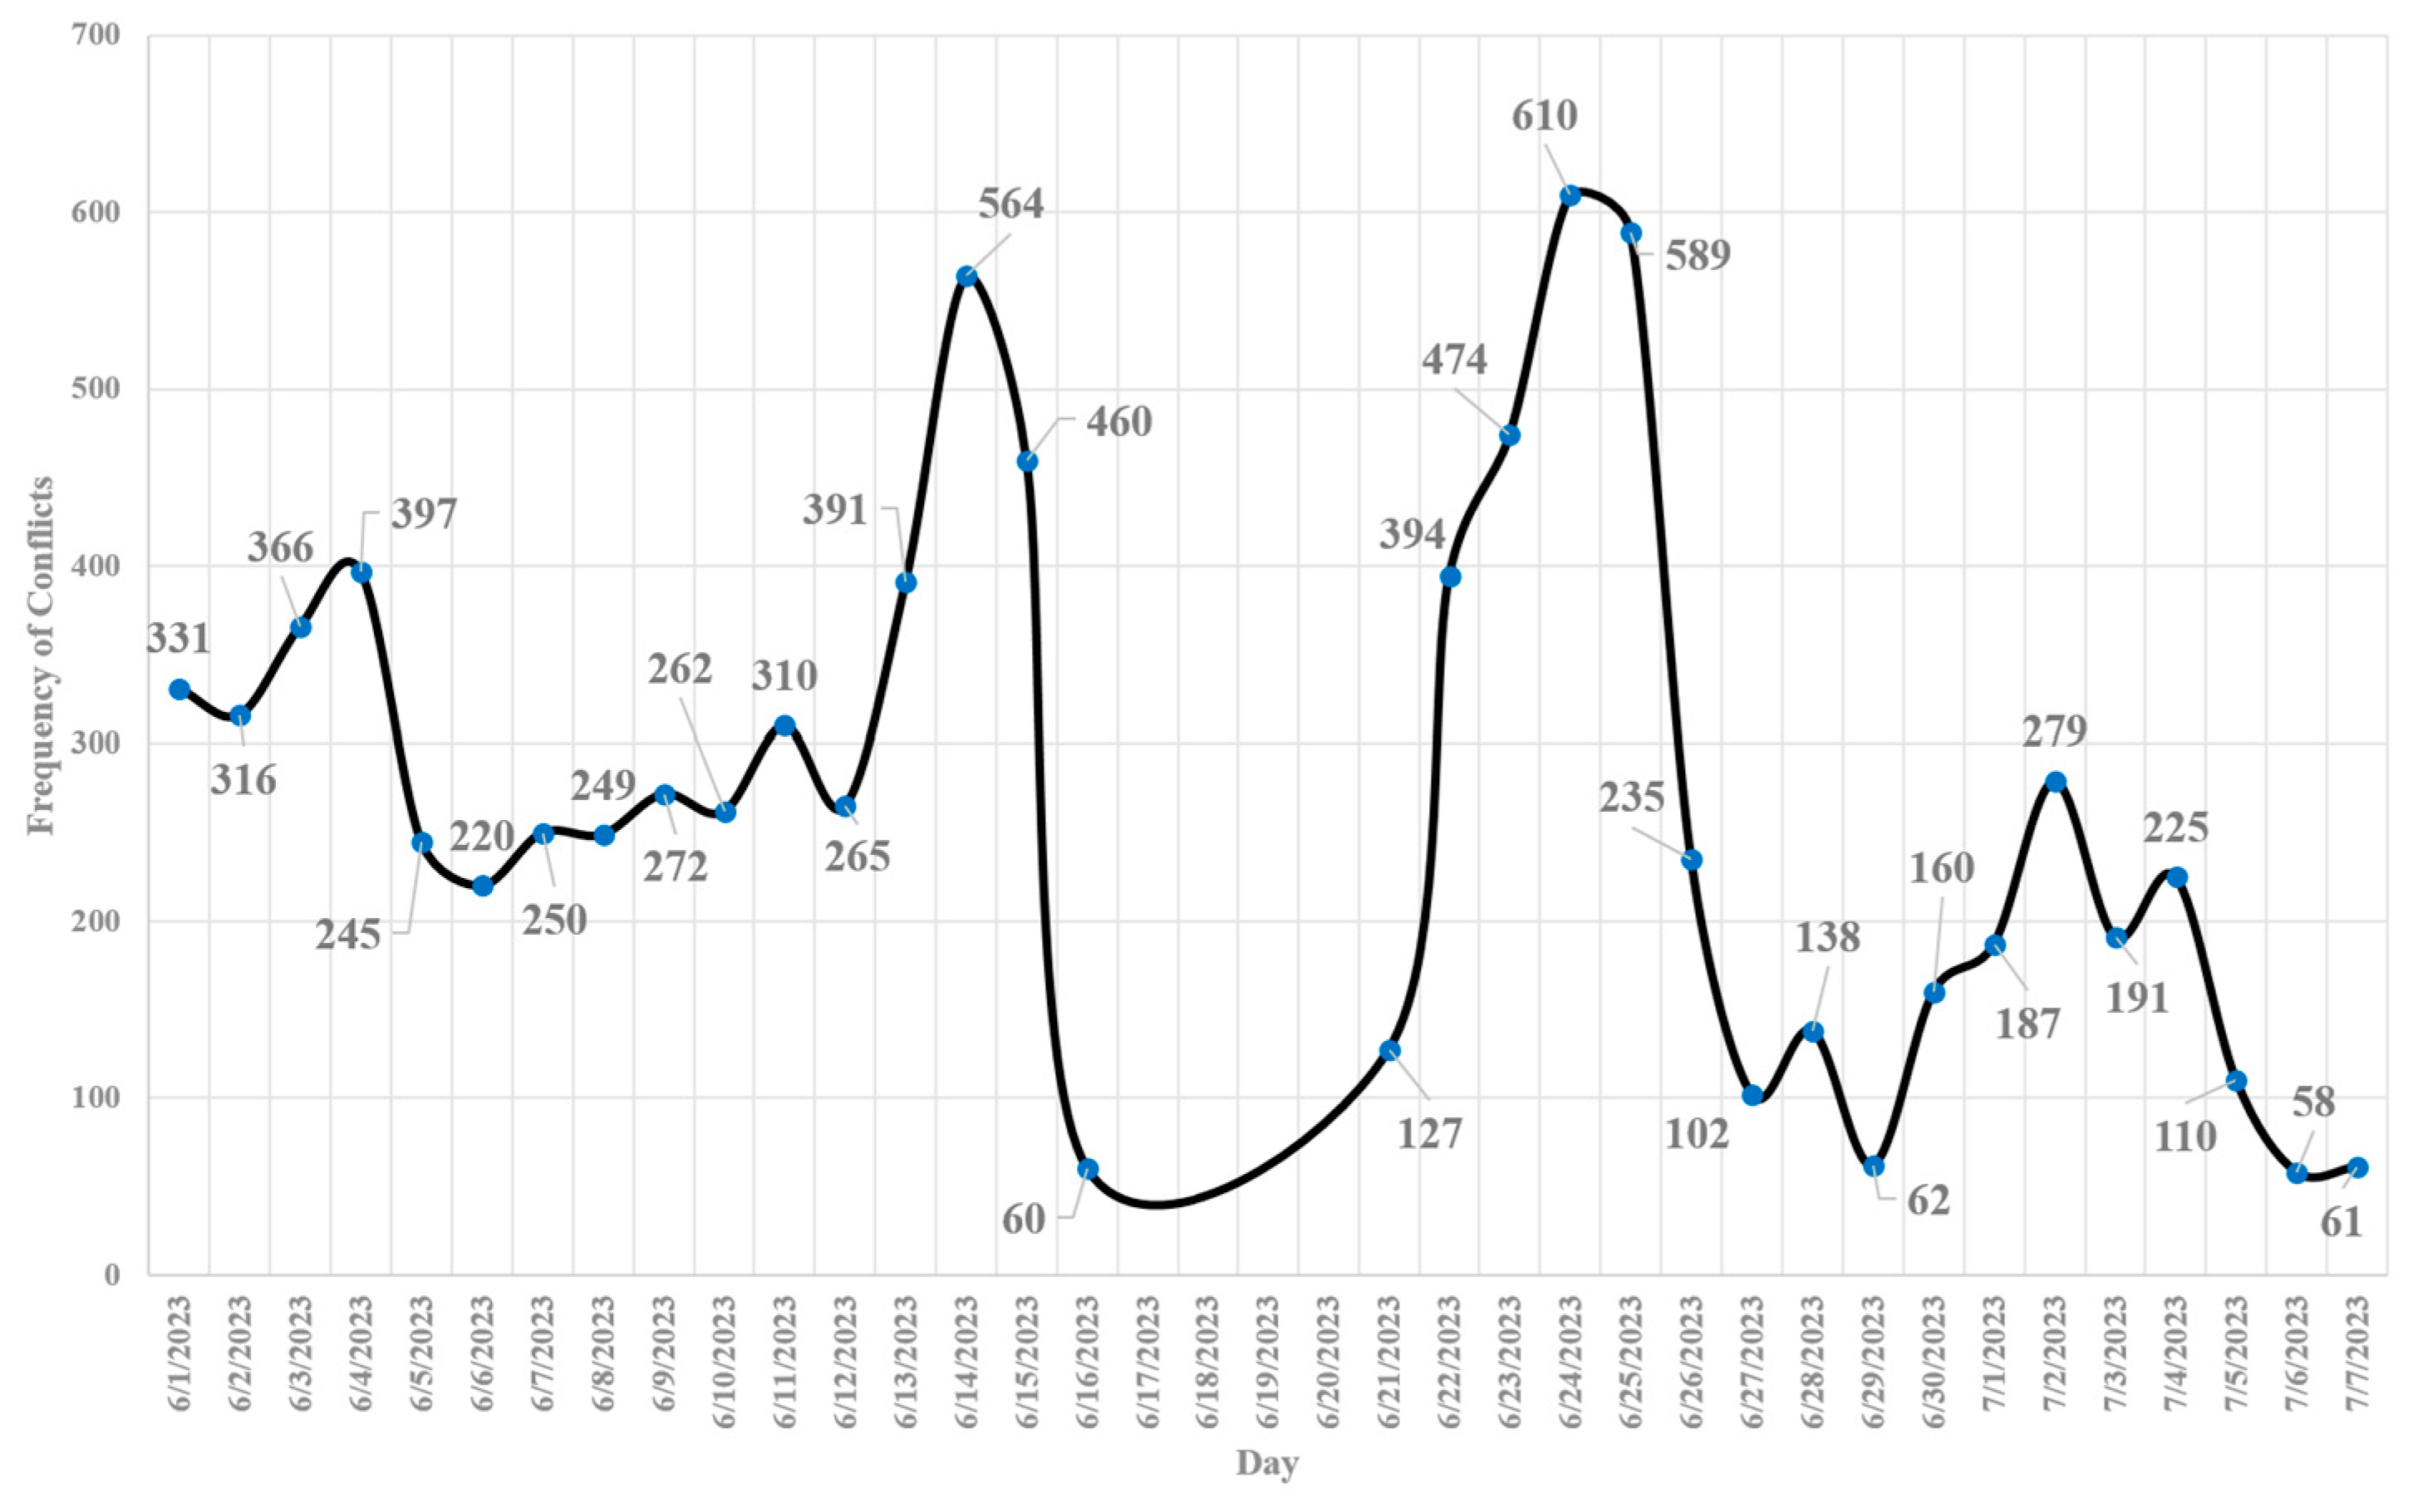
Figure 8.
Daily Severity of Vehicle – Vehicle Conflicts Chart.
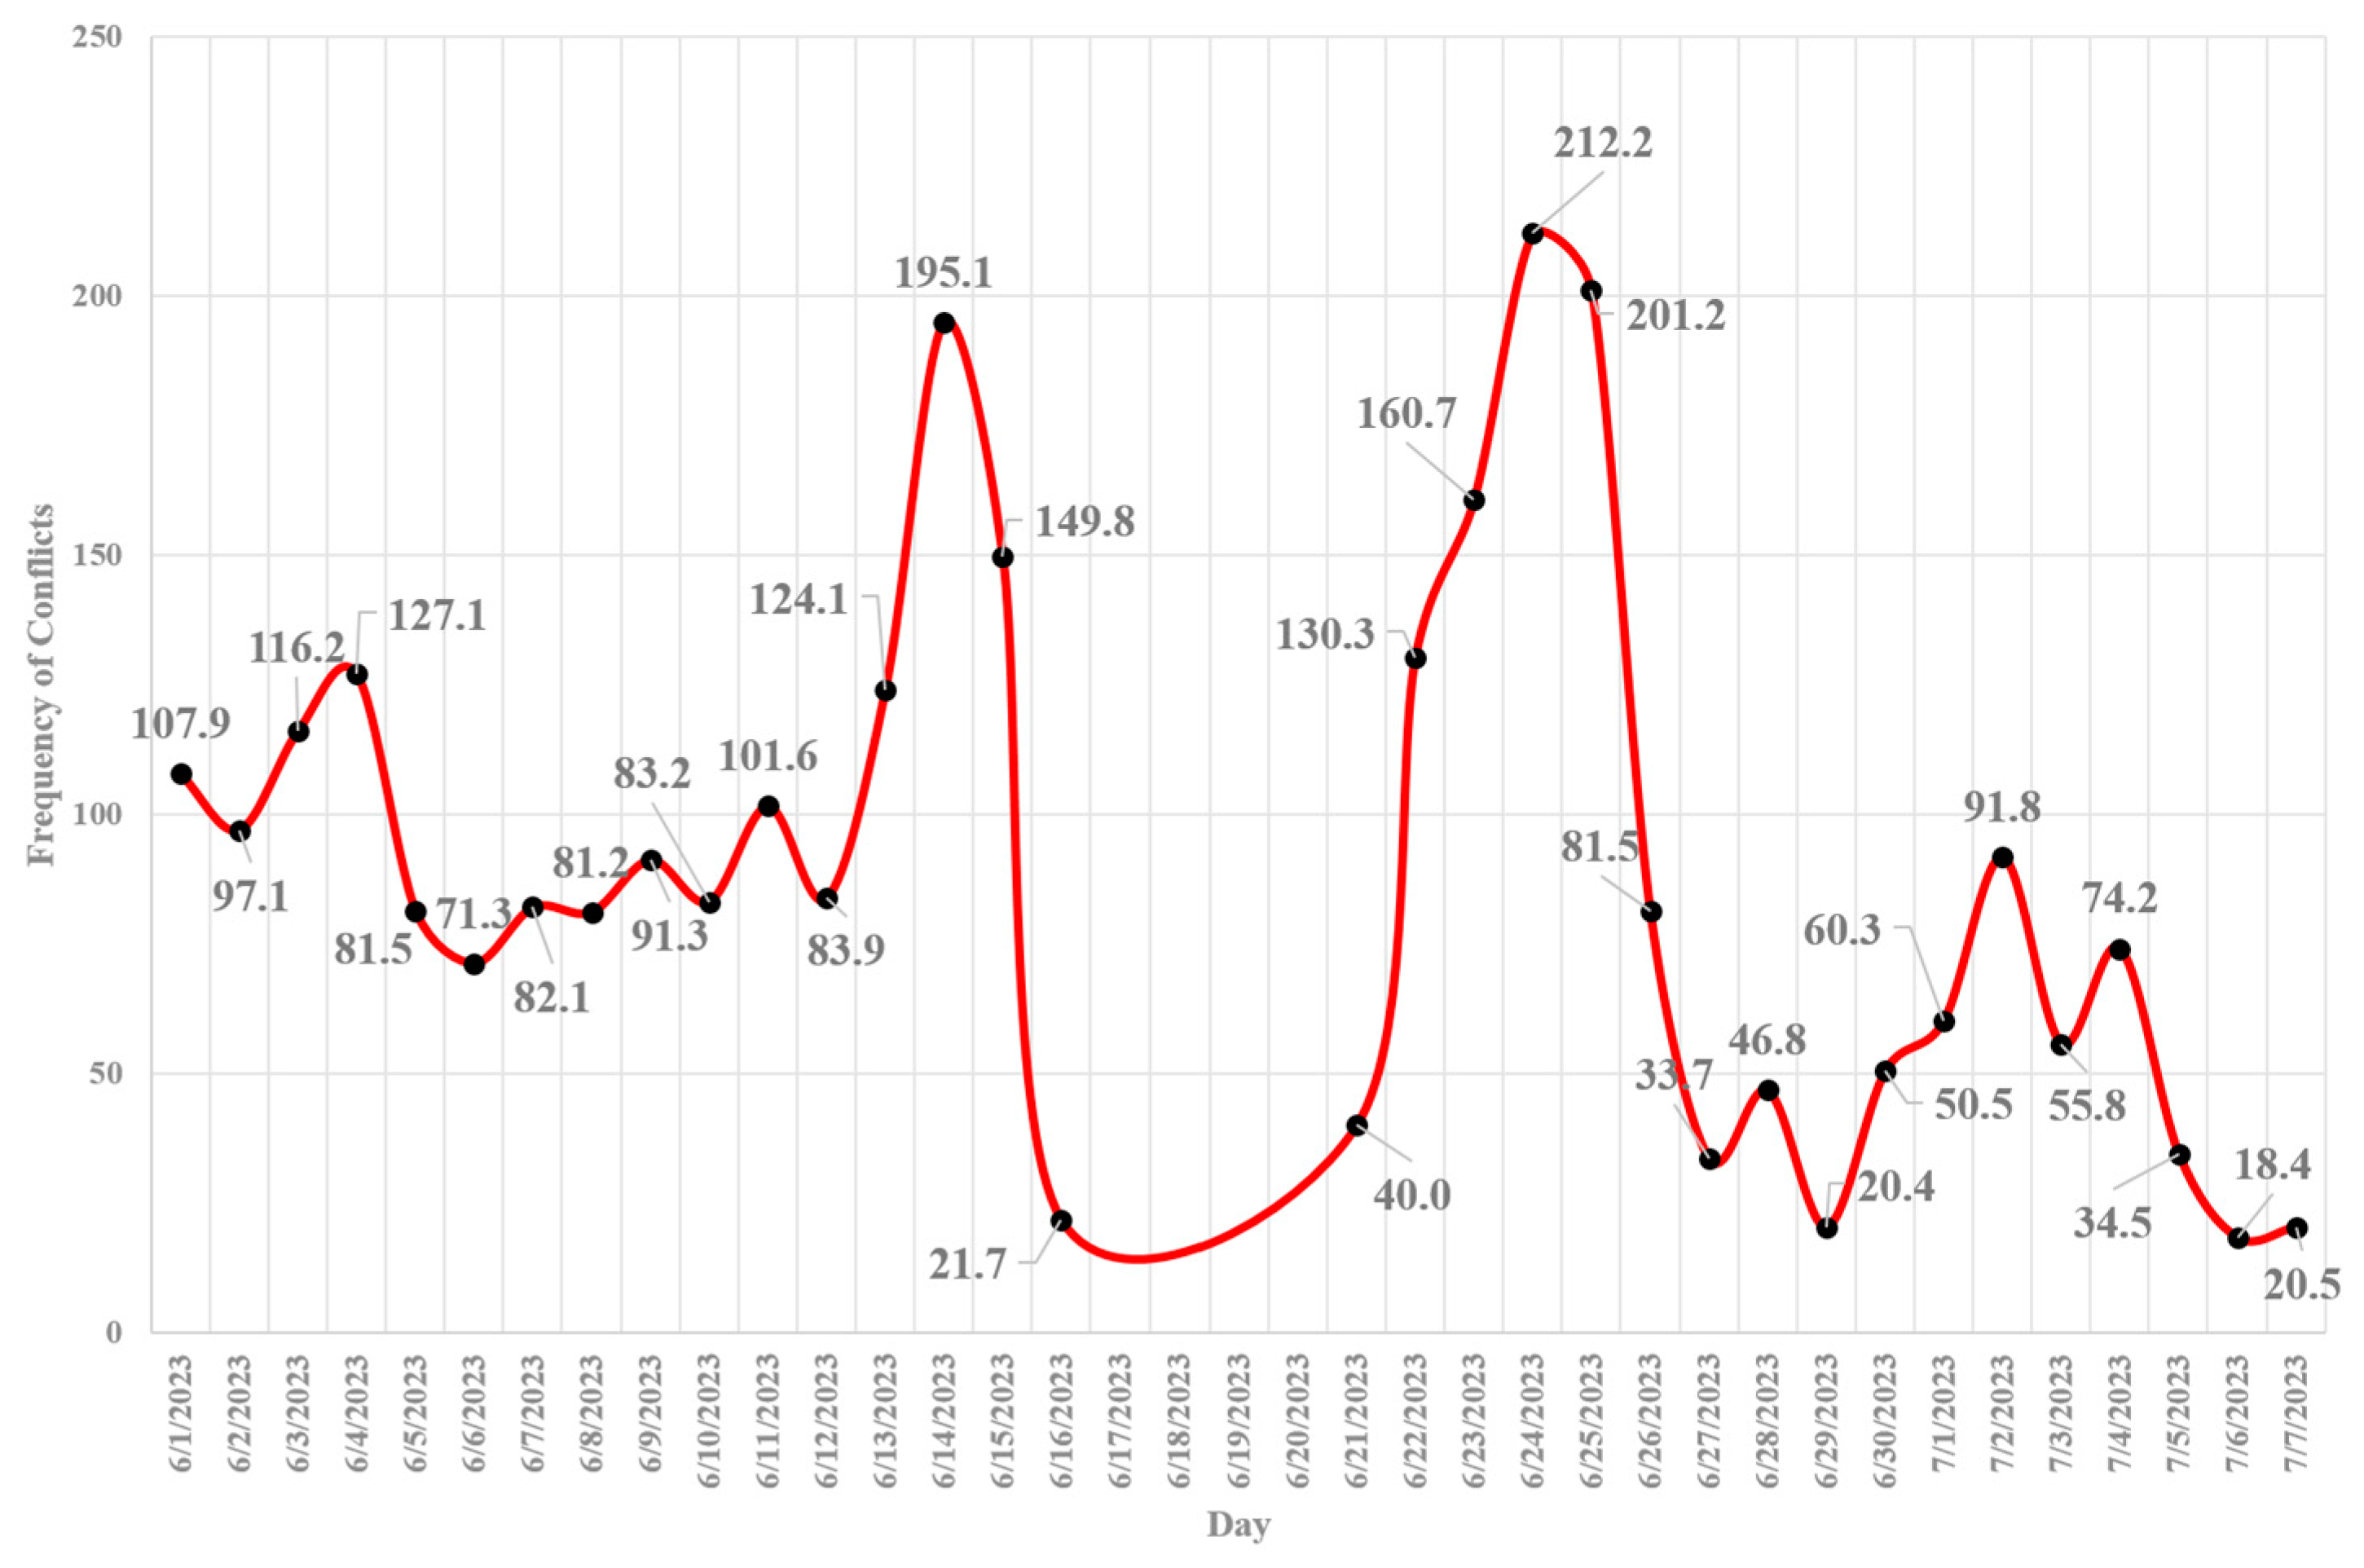
Figure 9.
Hourly Distribution of Vehicle-Vehicle Conflict – Frequency Chart.
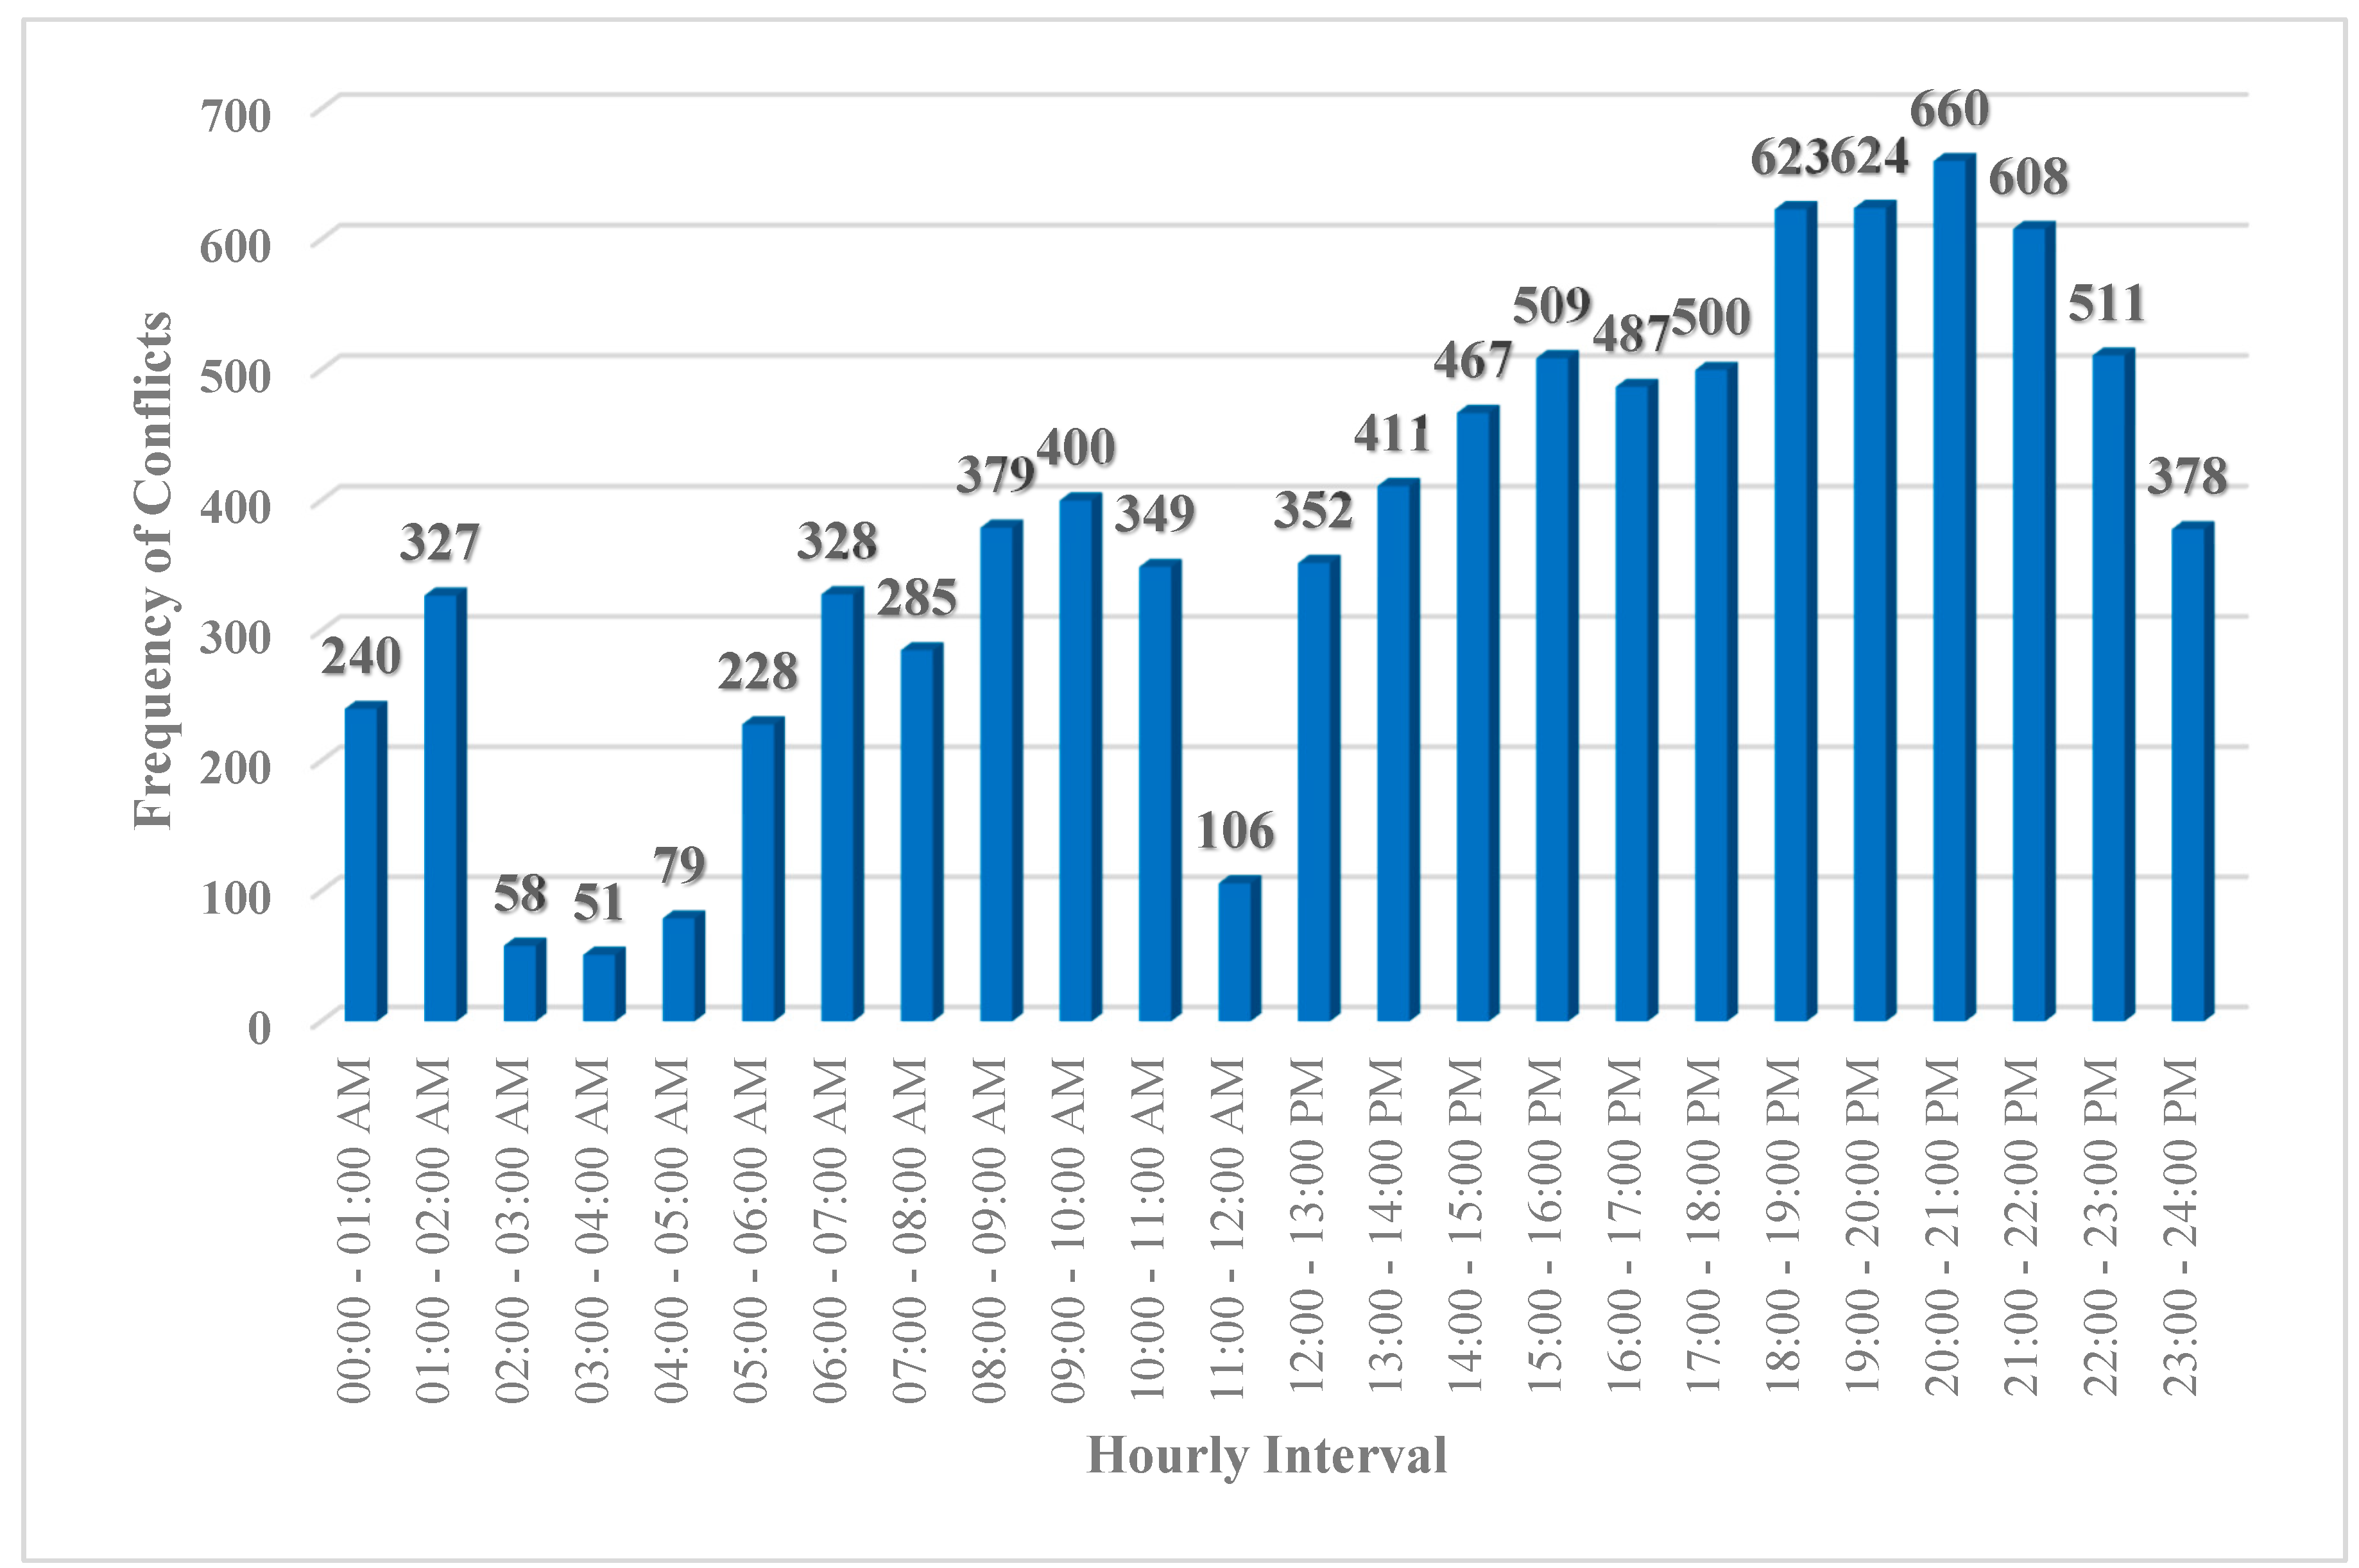
Figure 10.
Hourly Distribution of Vehicle-Vehicle Conflict – Severity Chart.
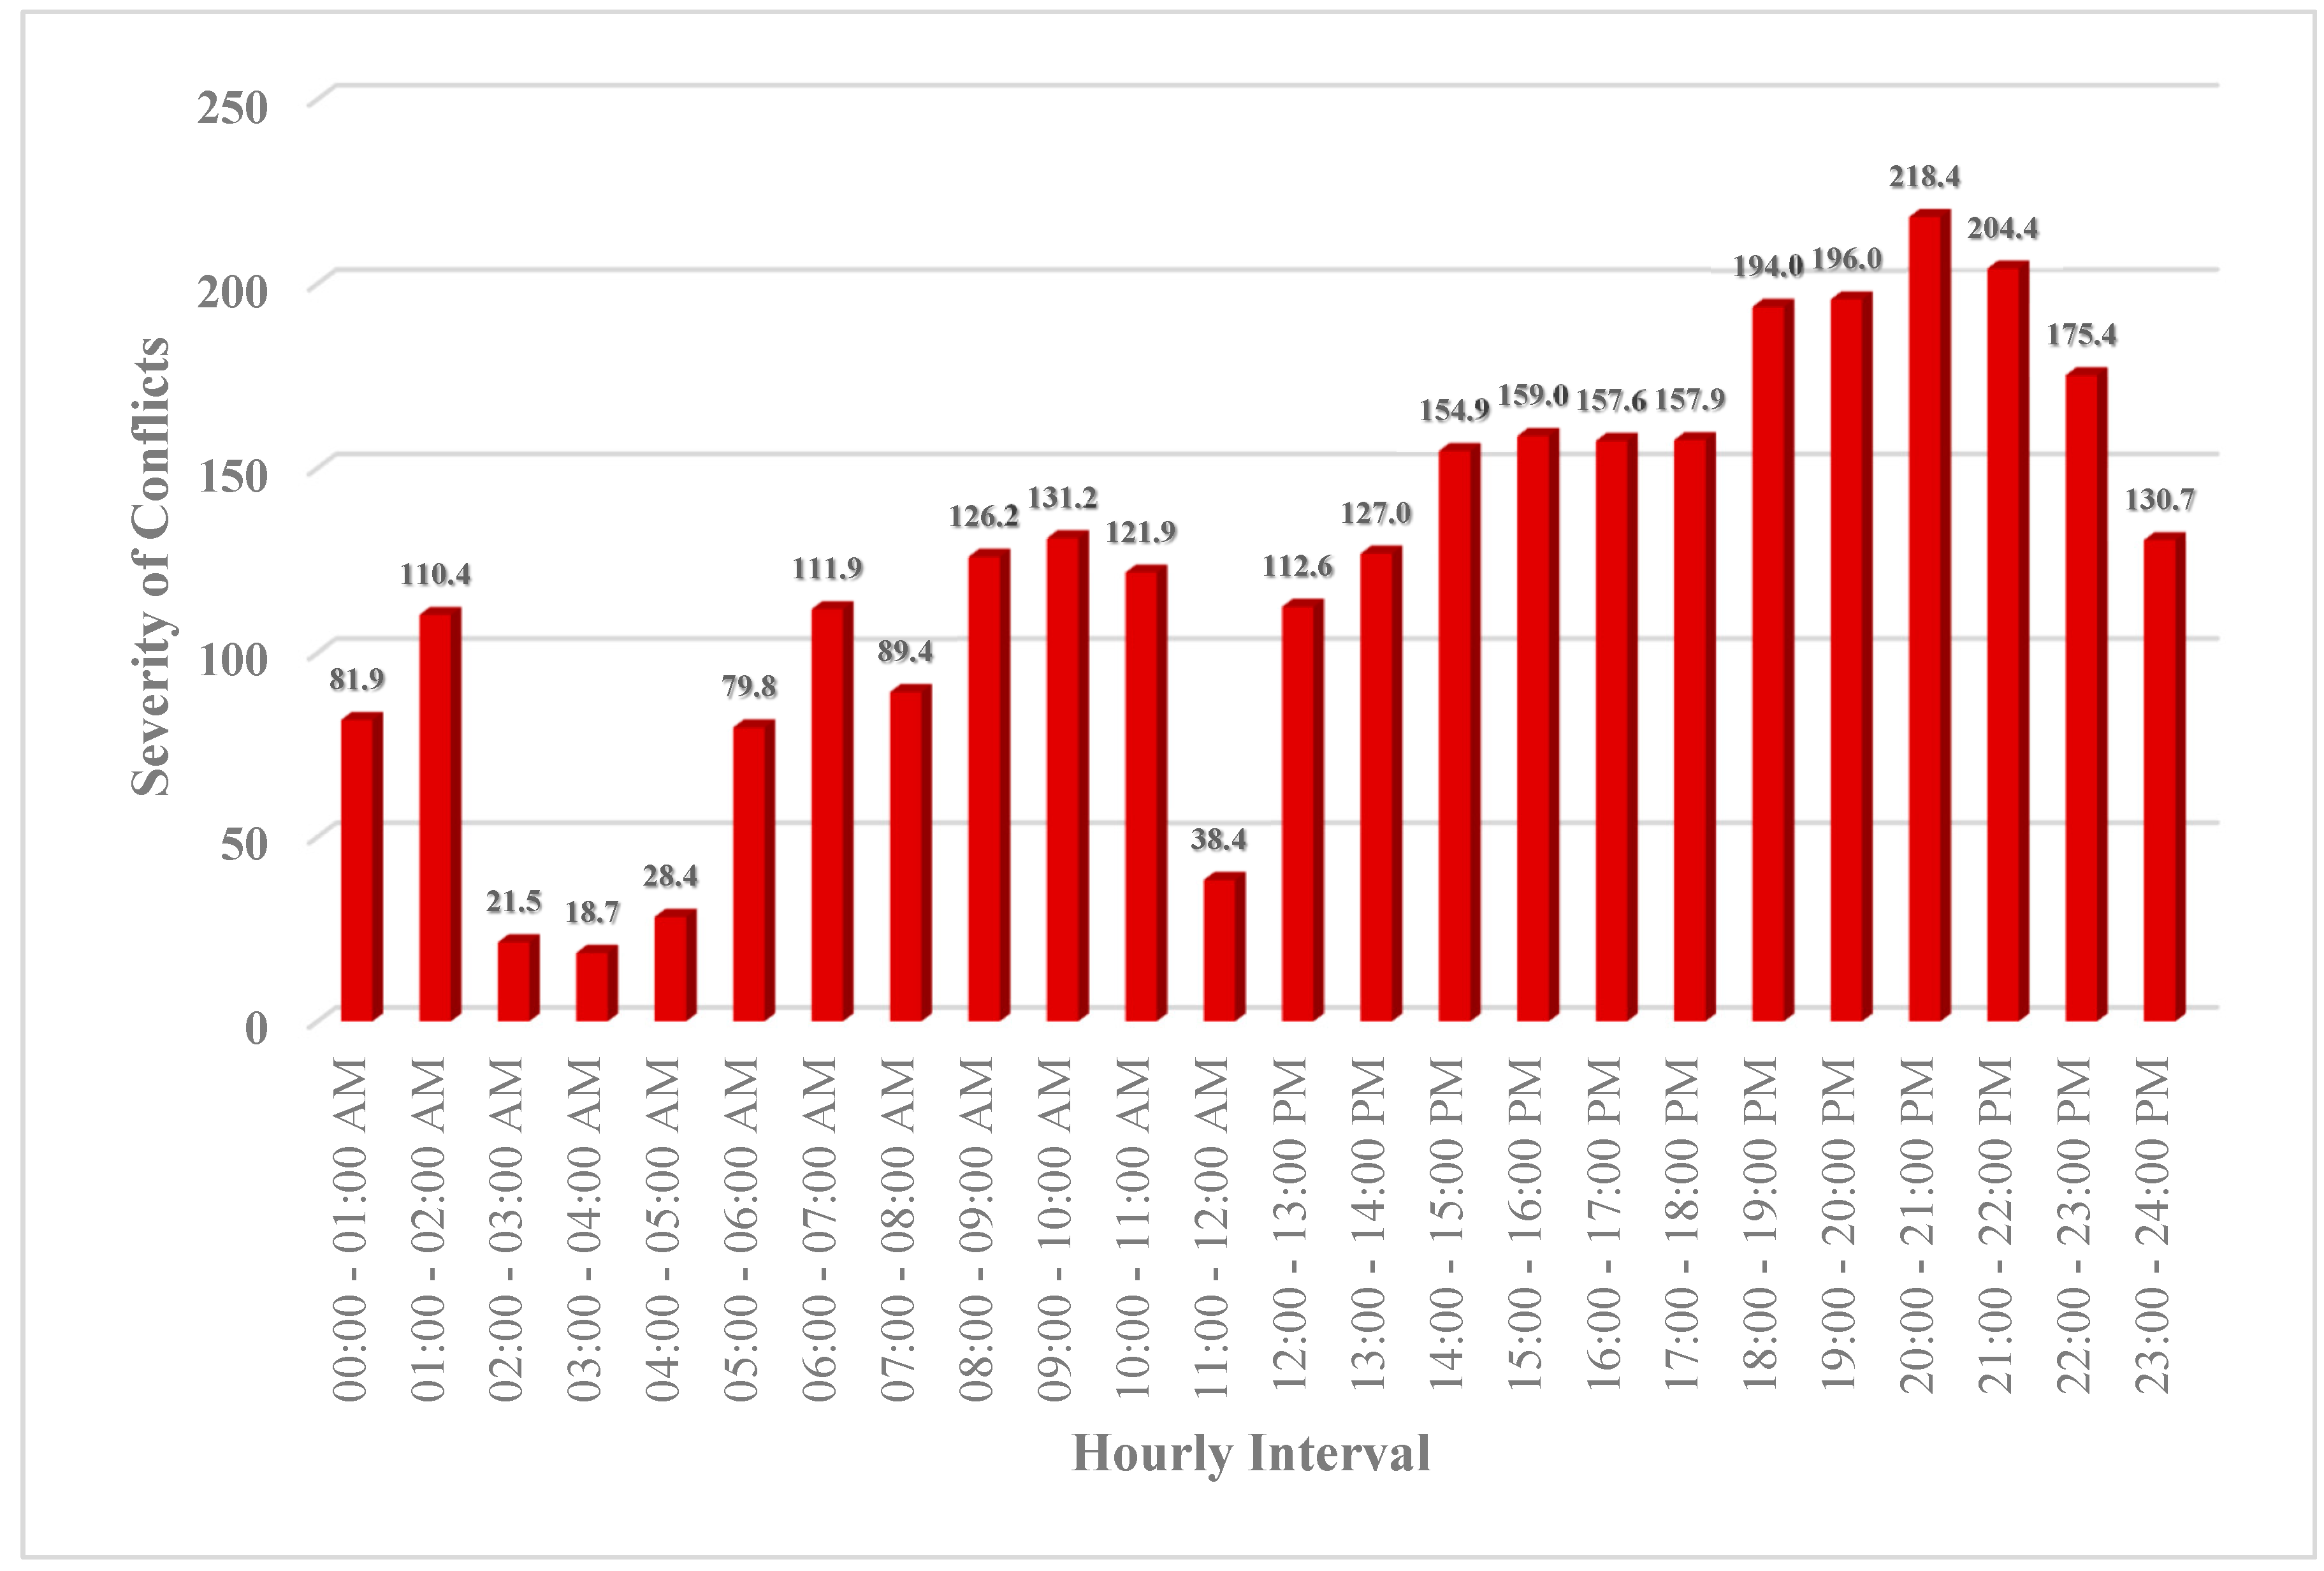
Figure 11.
Normalized Vehicle-Vehicle Conflicts by Vehicle Volume.
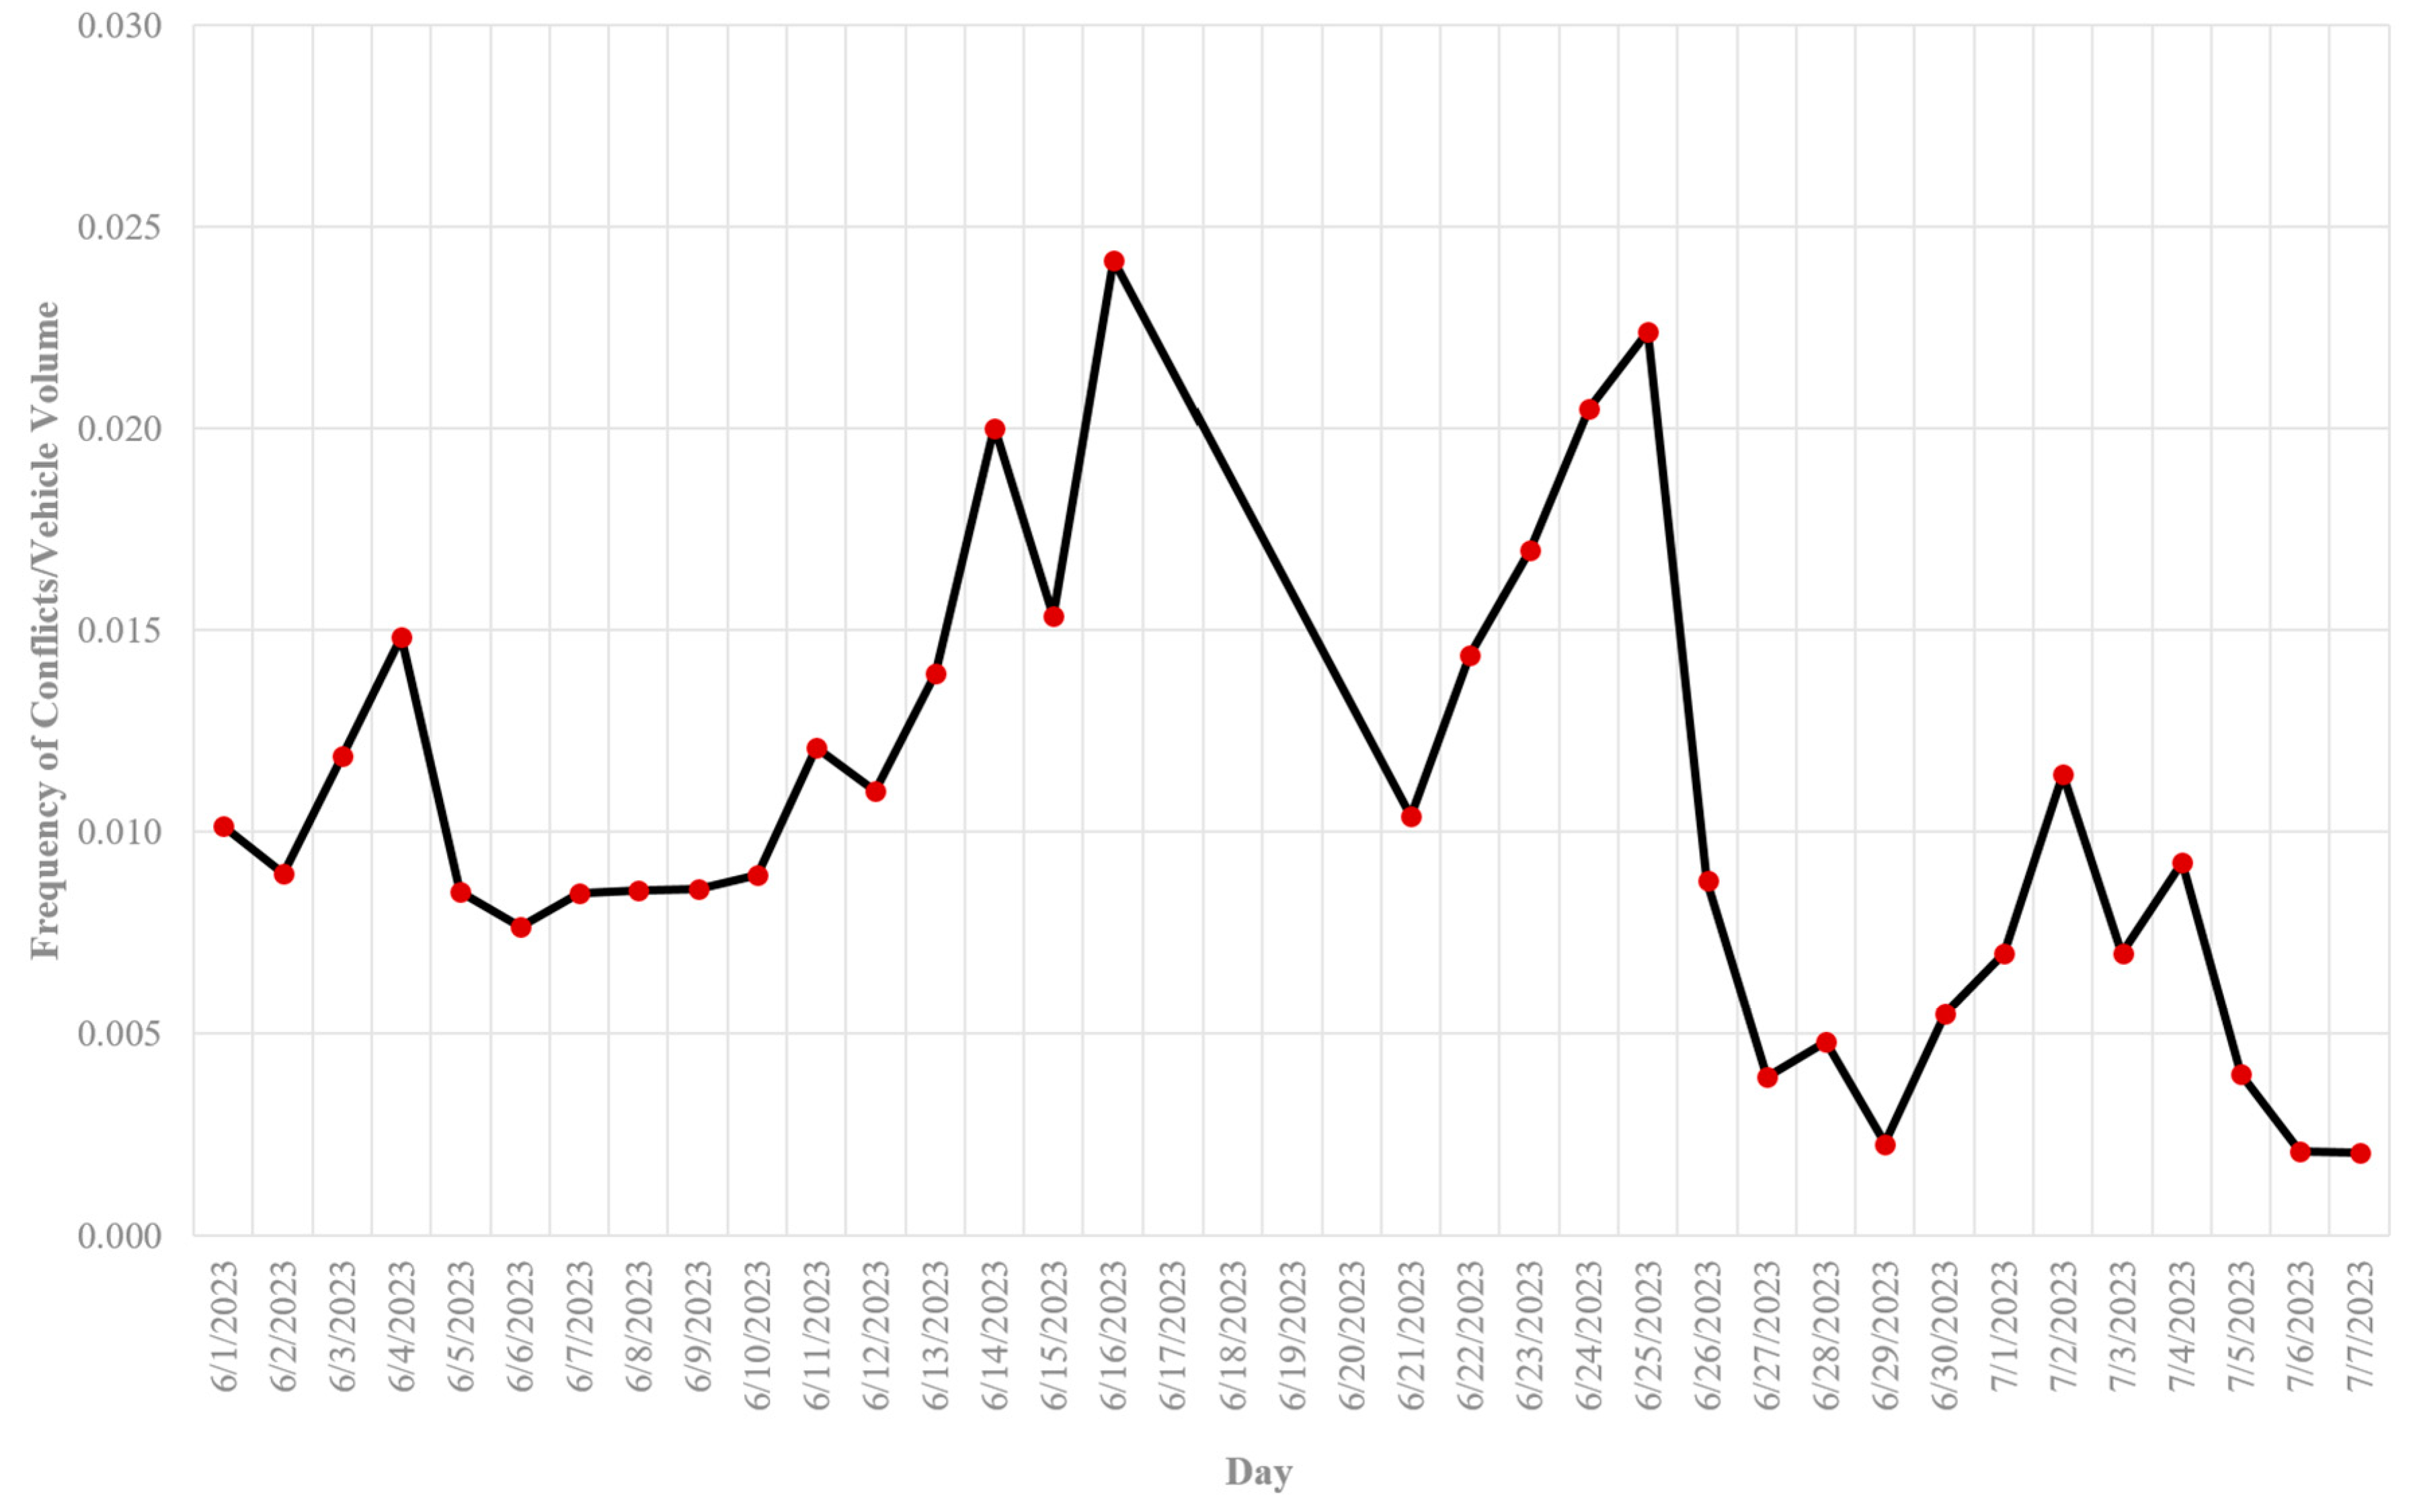
Figure 12.
Normalized Vehicle Volume by Vehicle-Vehicle Conflicts.
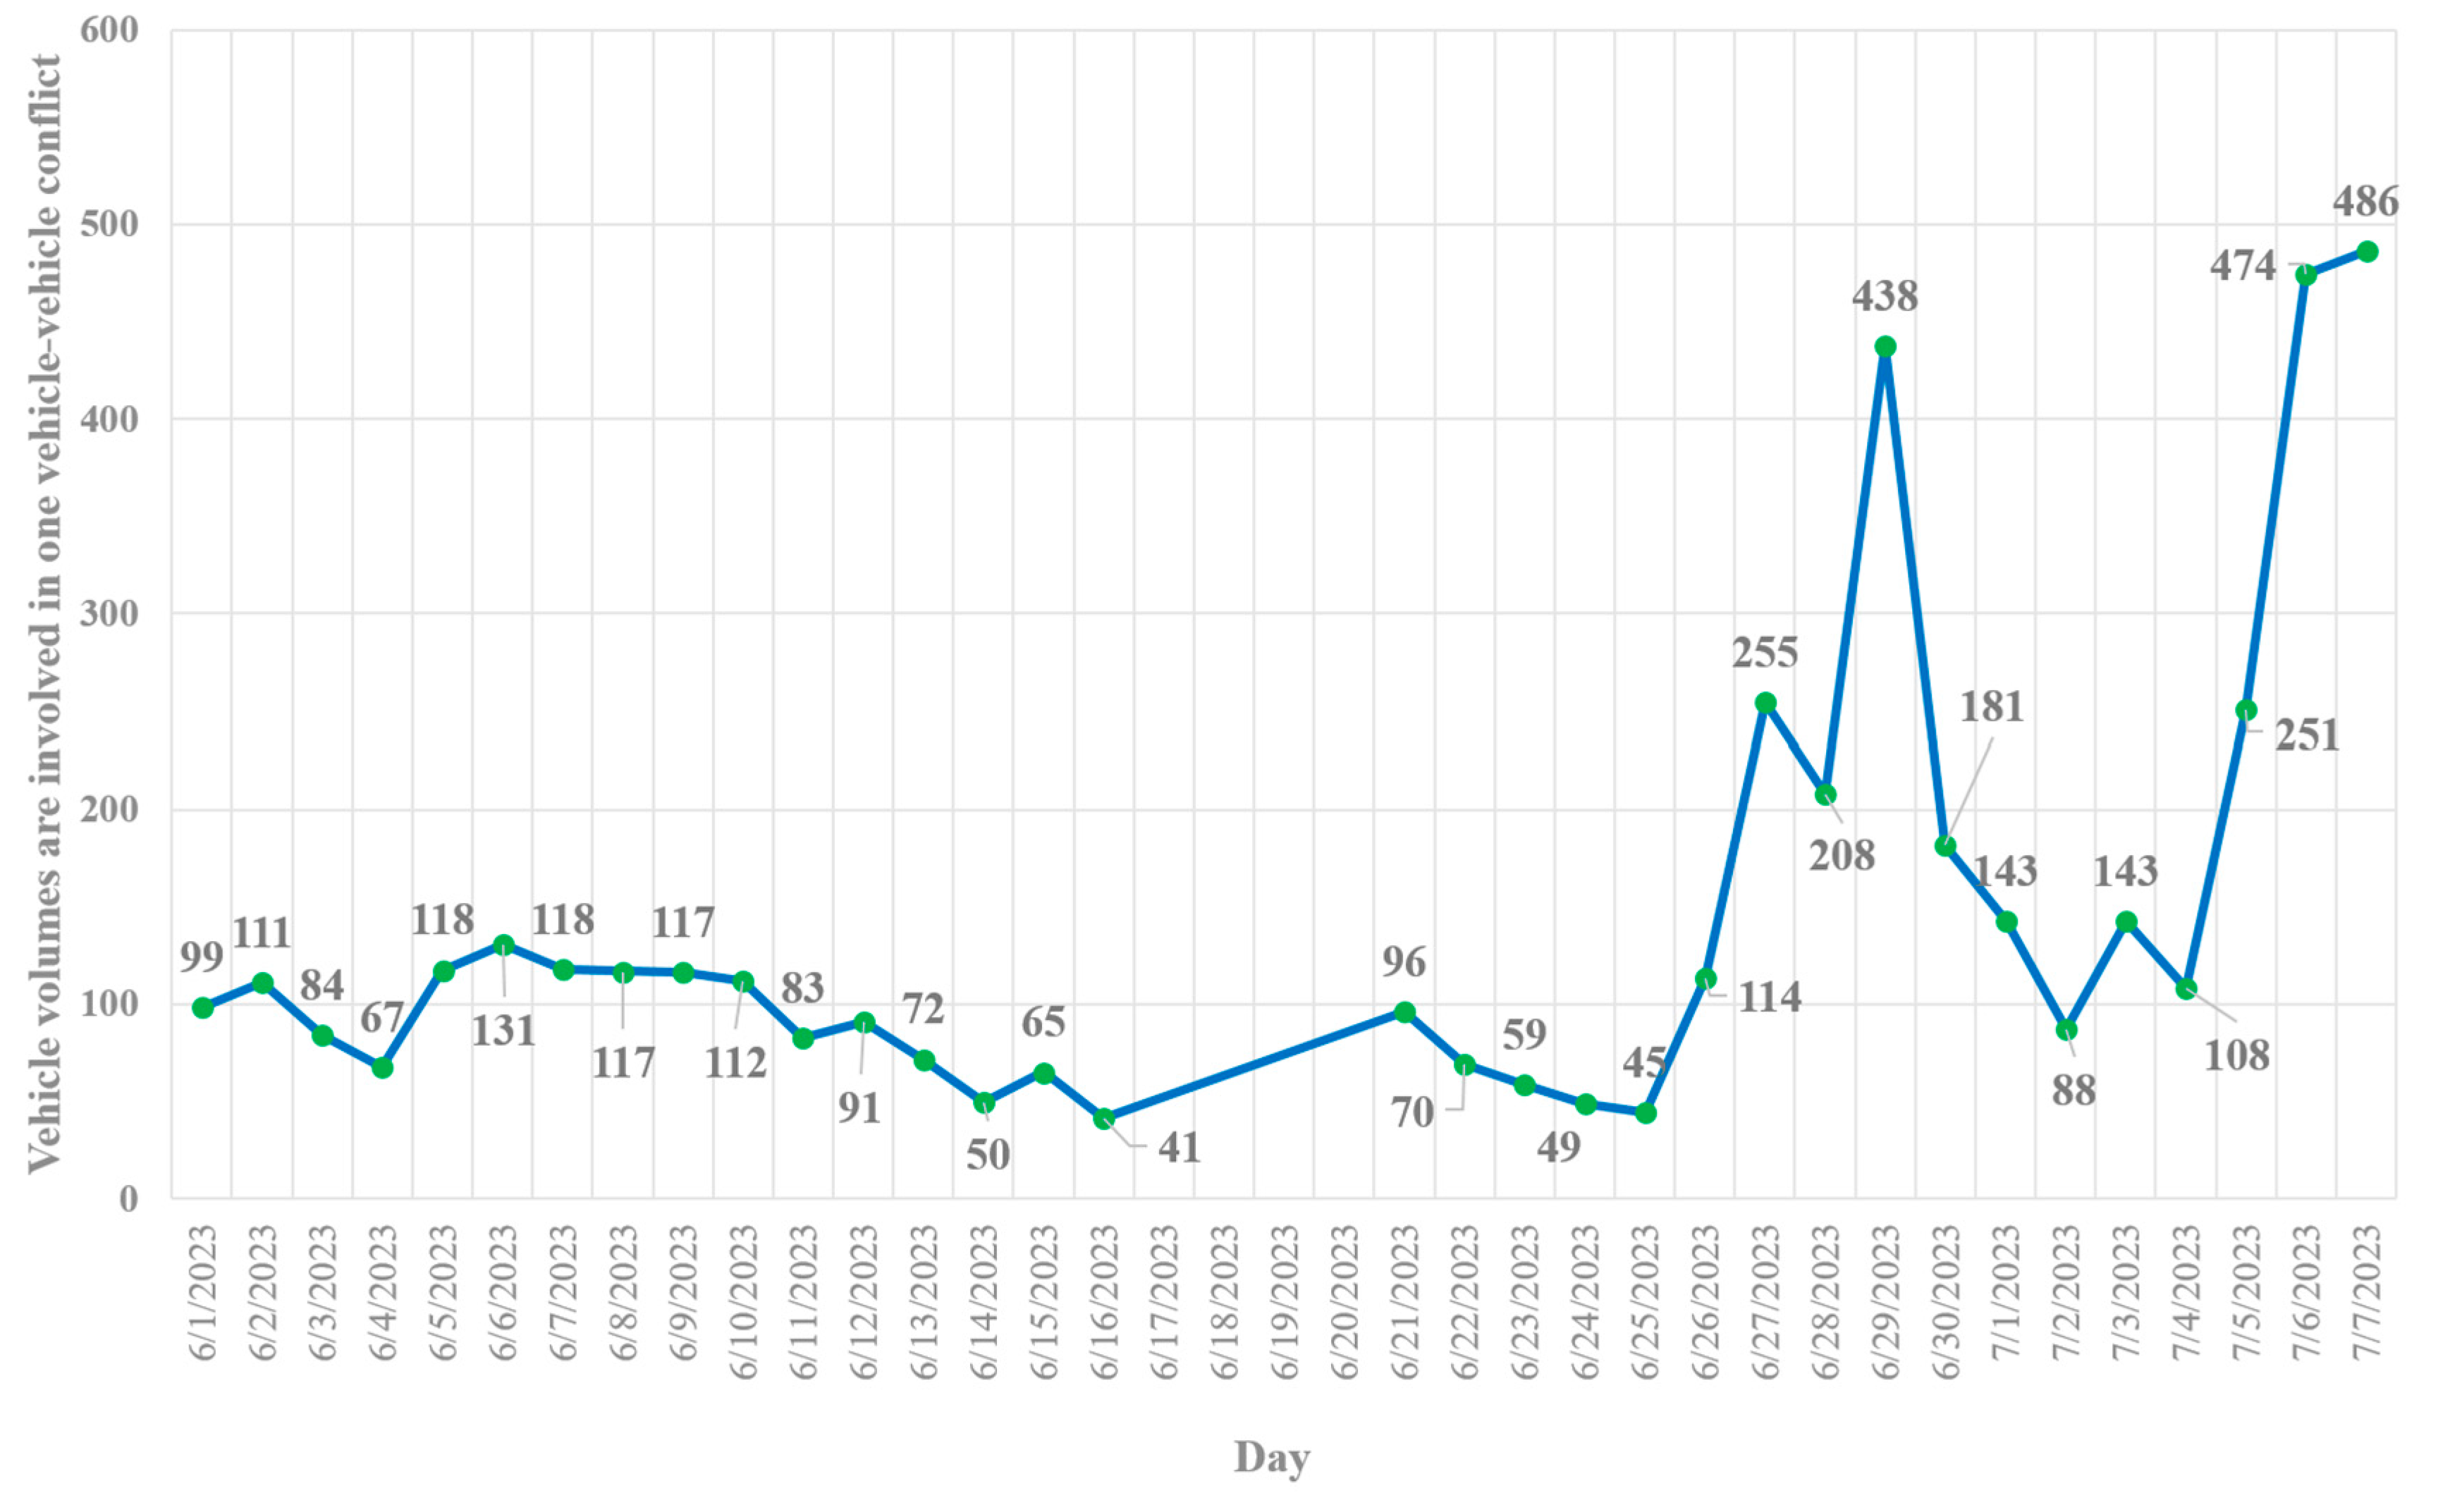
Figure 13.
Vehicle-Pedestrian Conflicts Heat map from June, 1st to July, 7th.
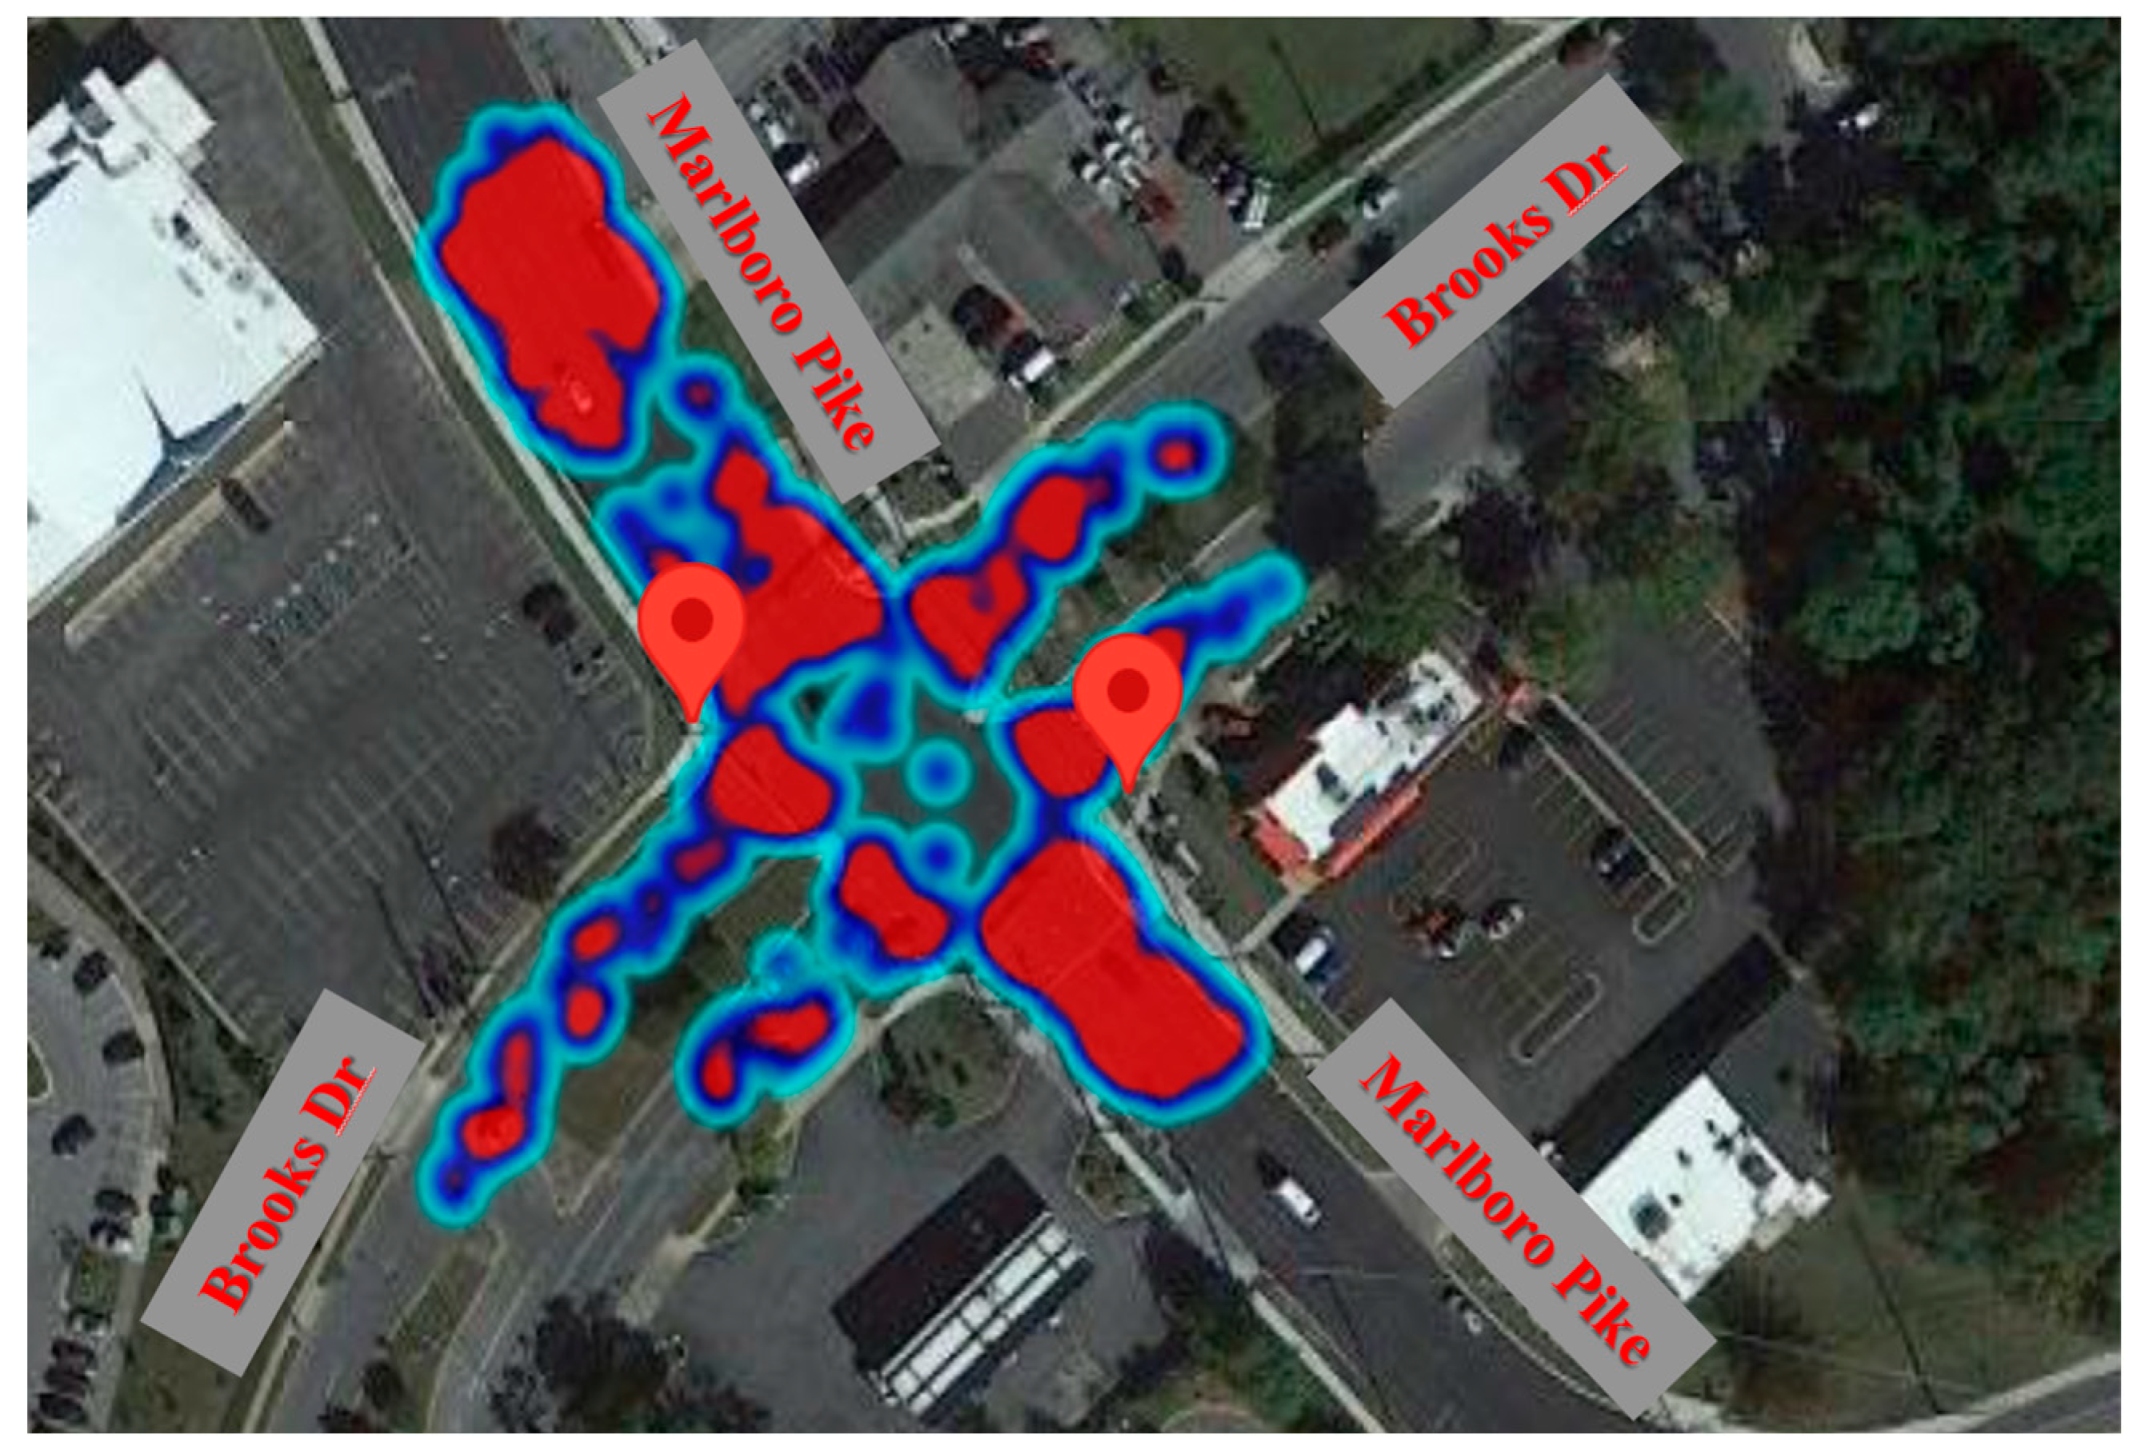
Figure 14.
Vehicle-Pedestrian Frequency Chart.
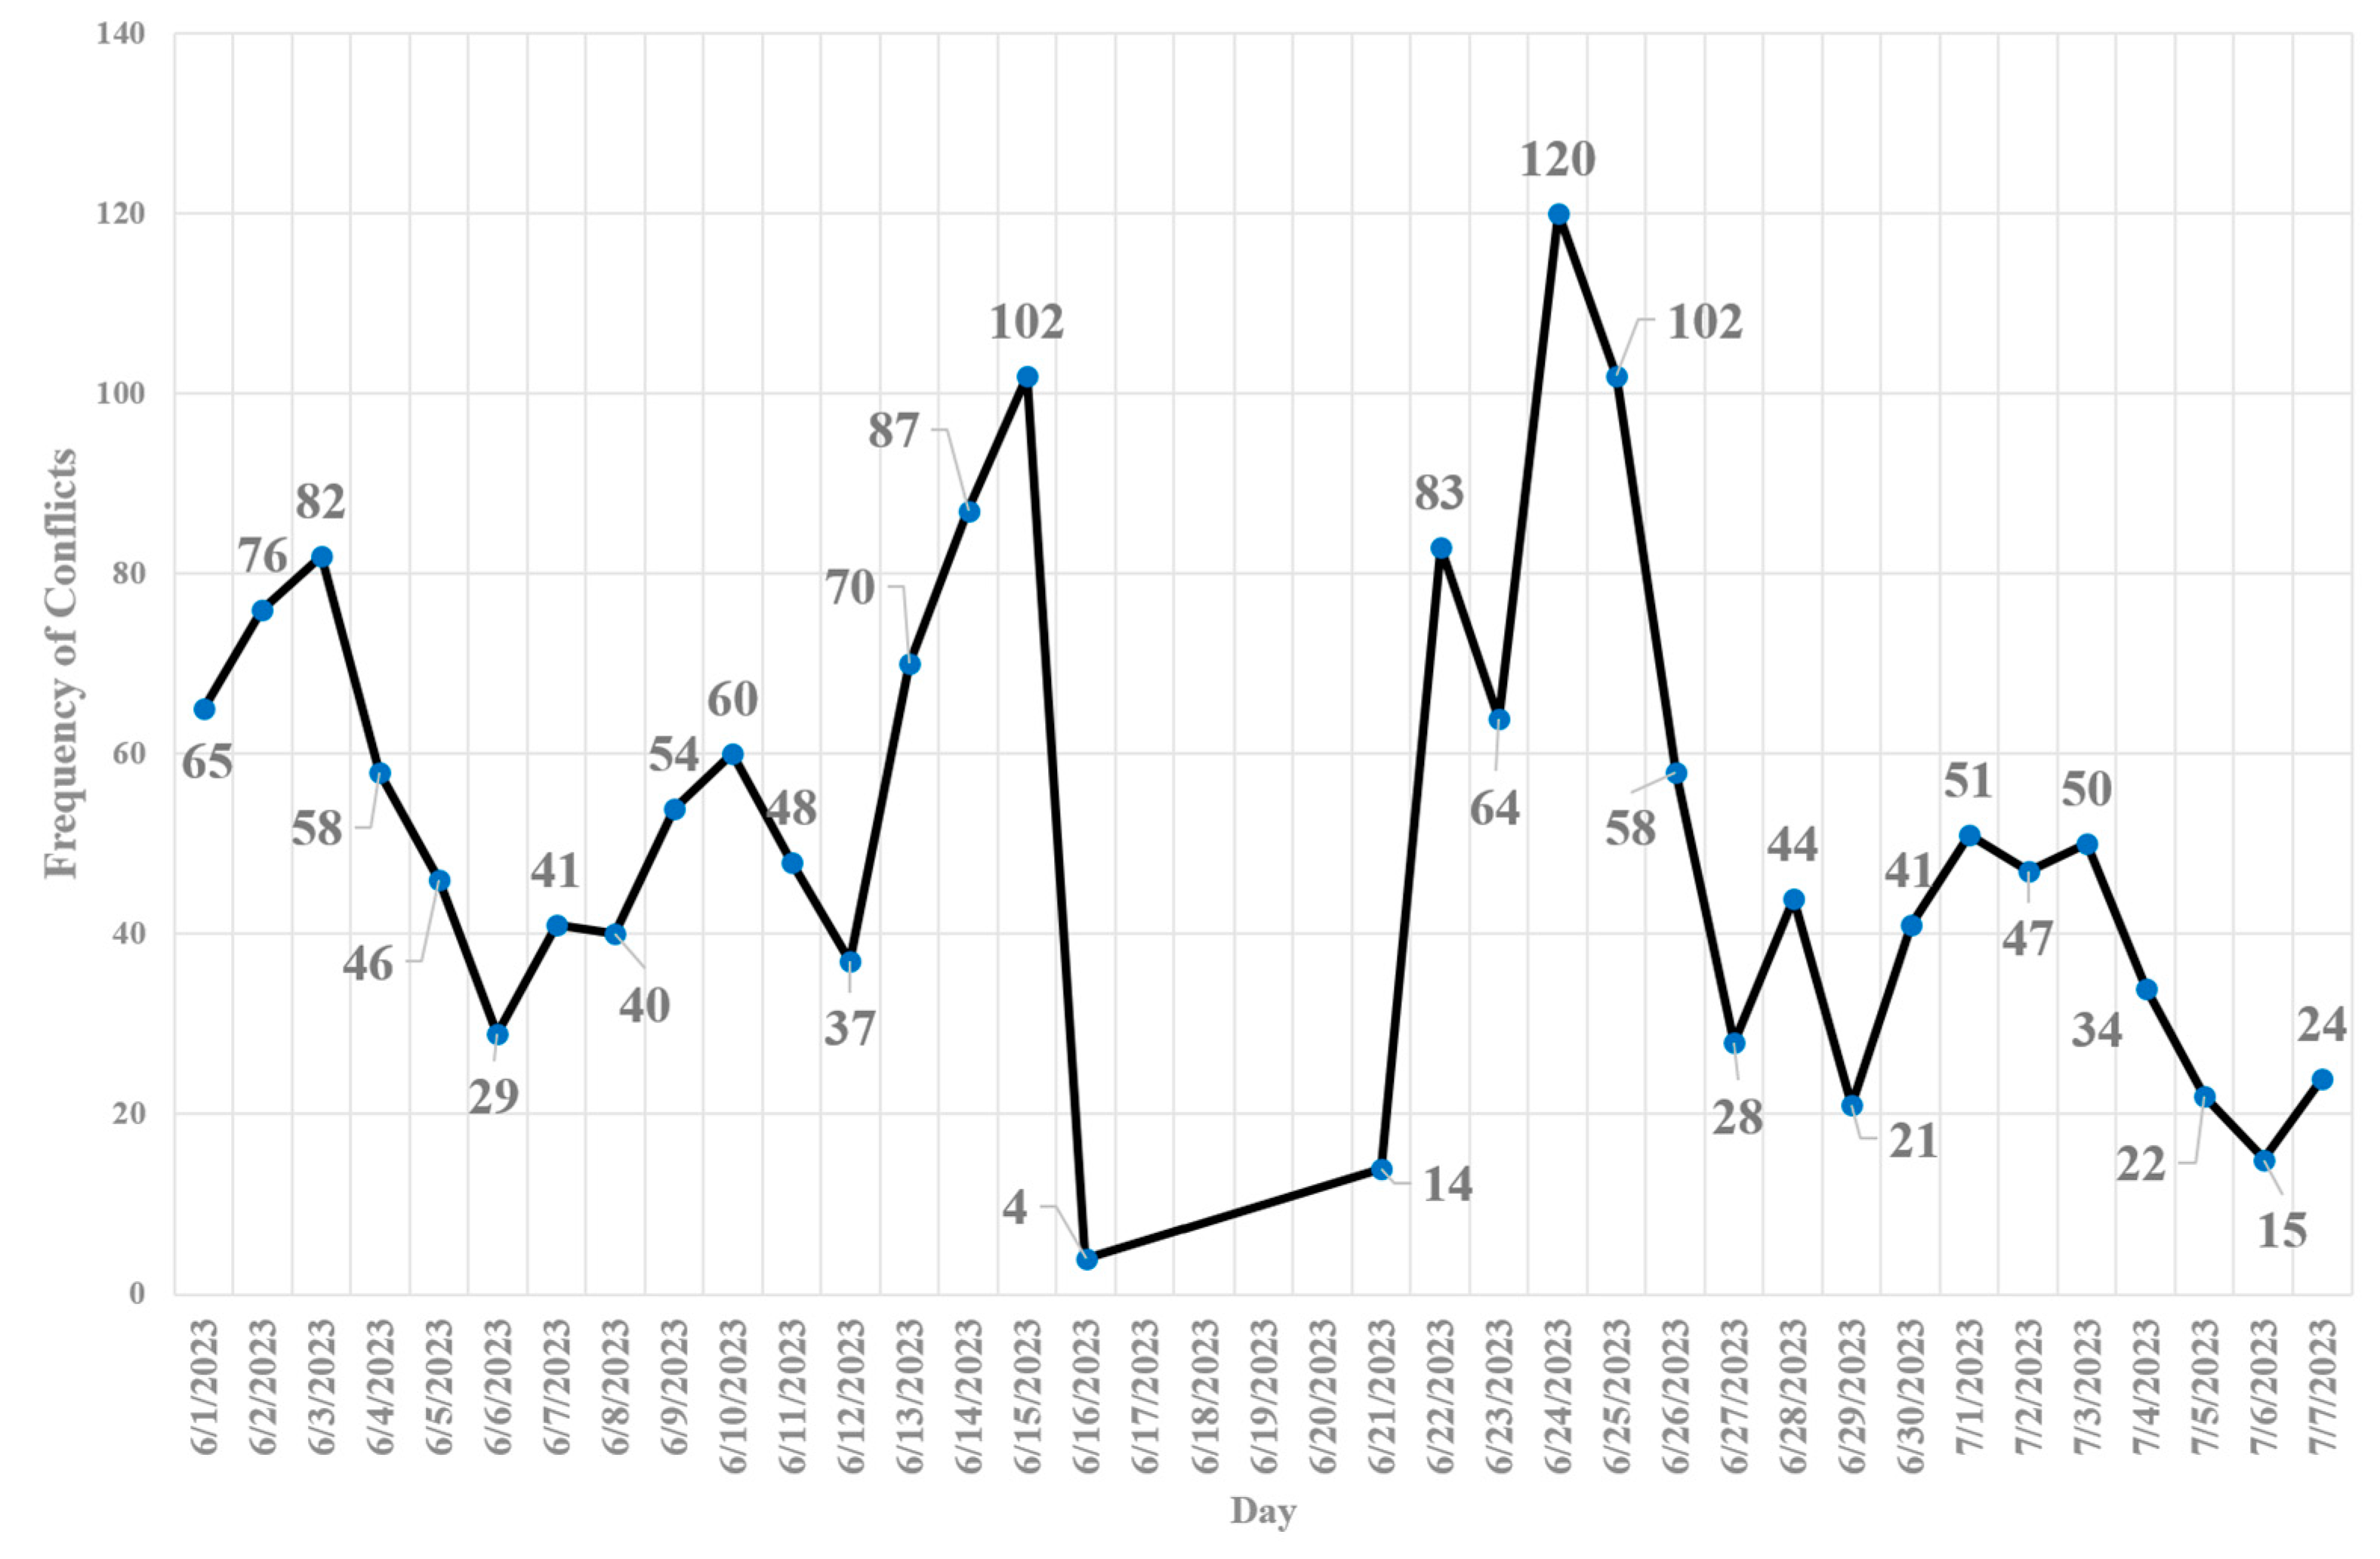
Figure 15.
Vehicle-Pedestrian Severity Chart.
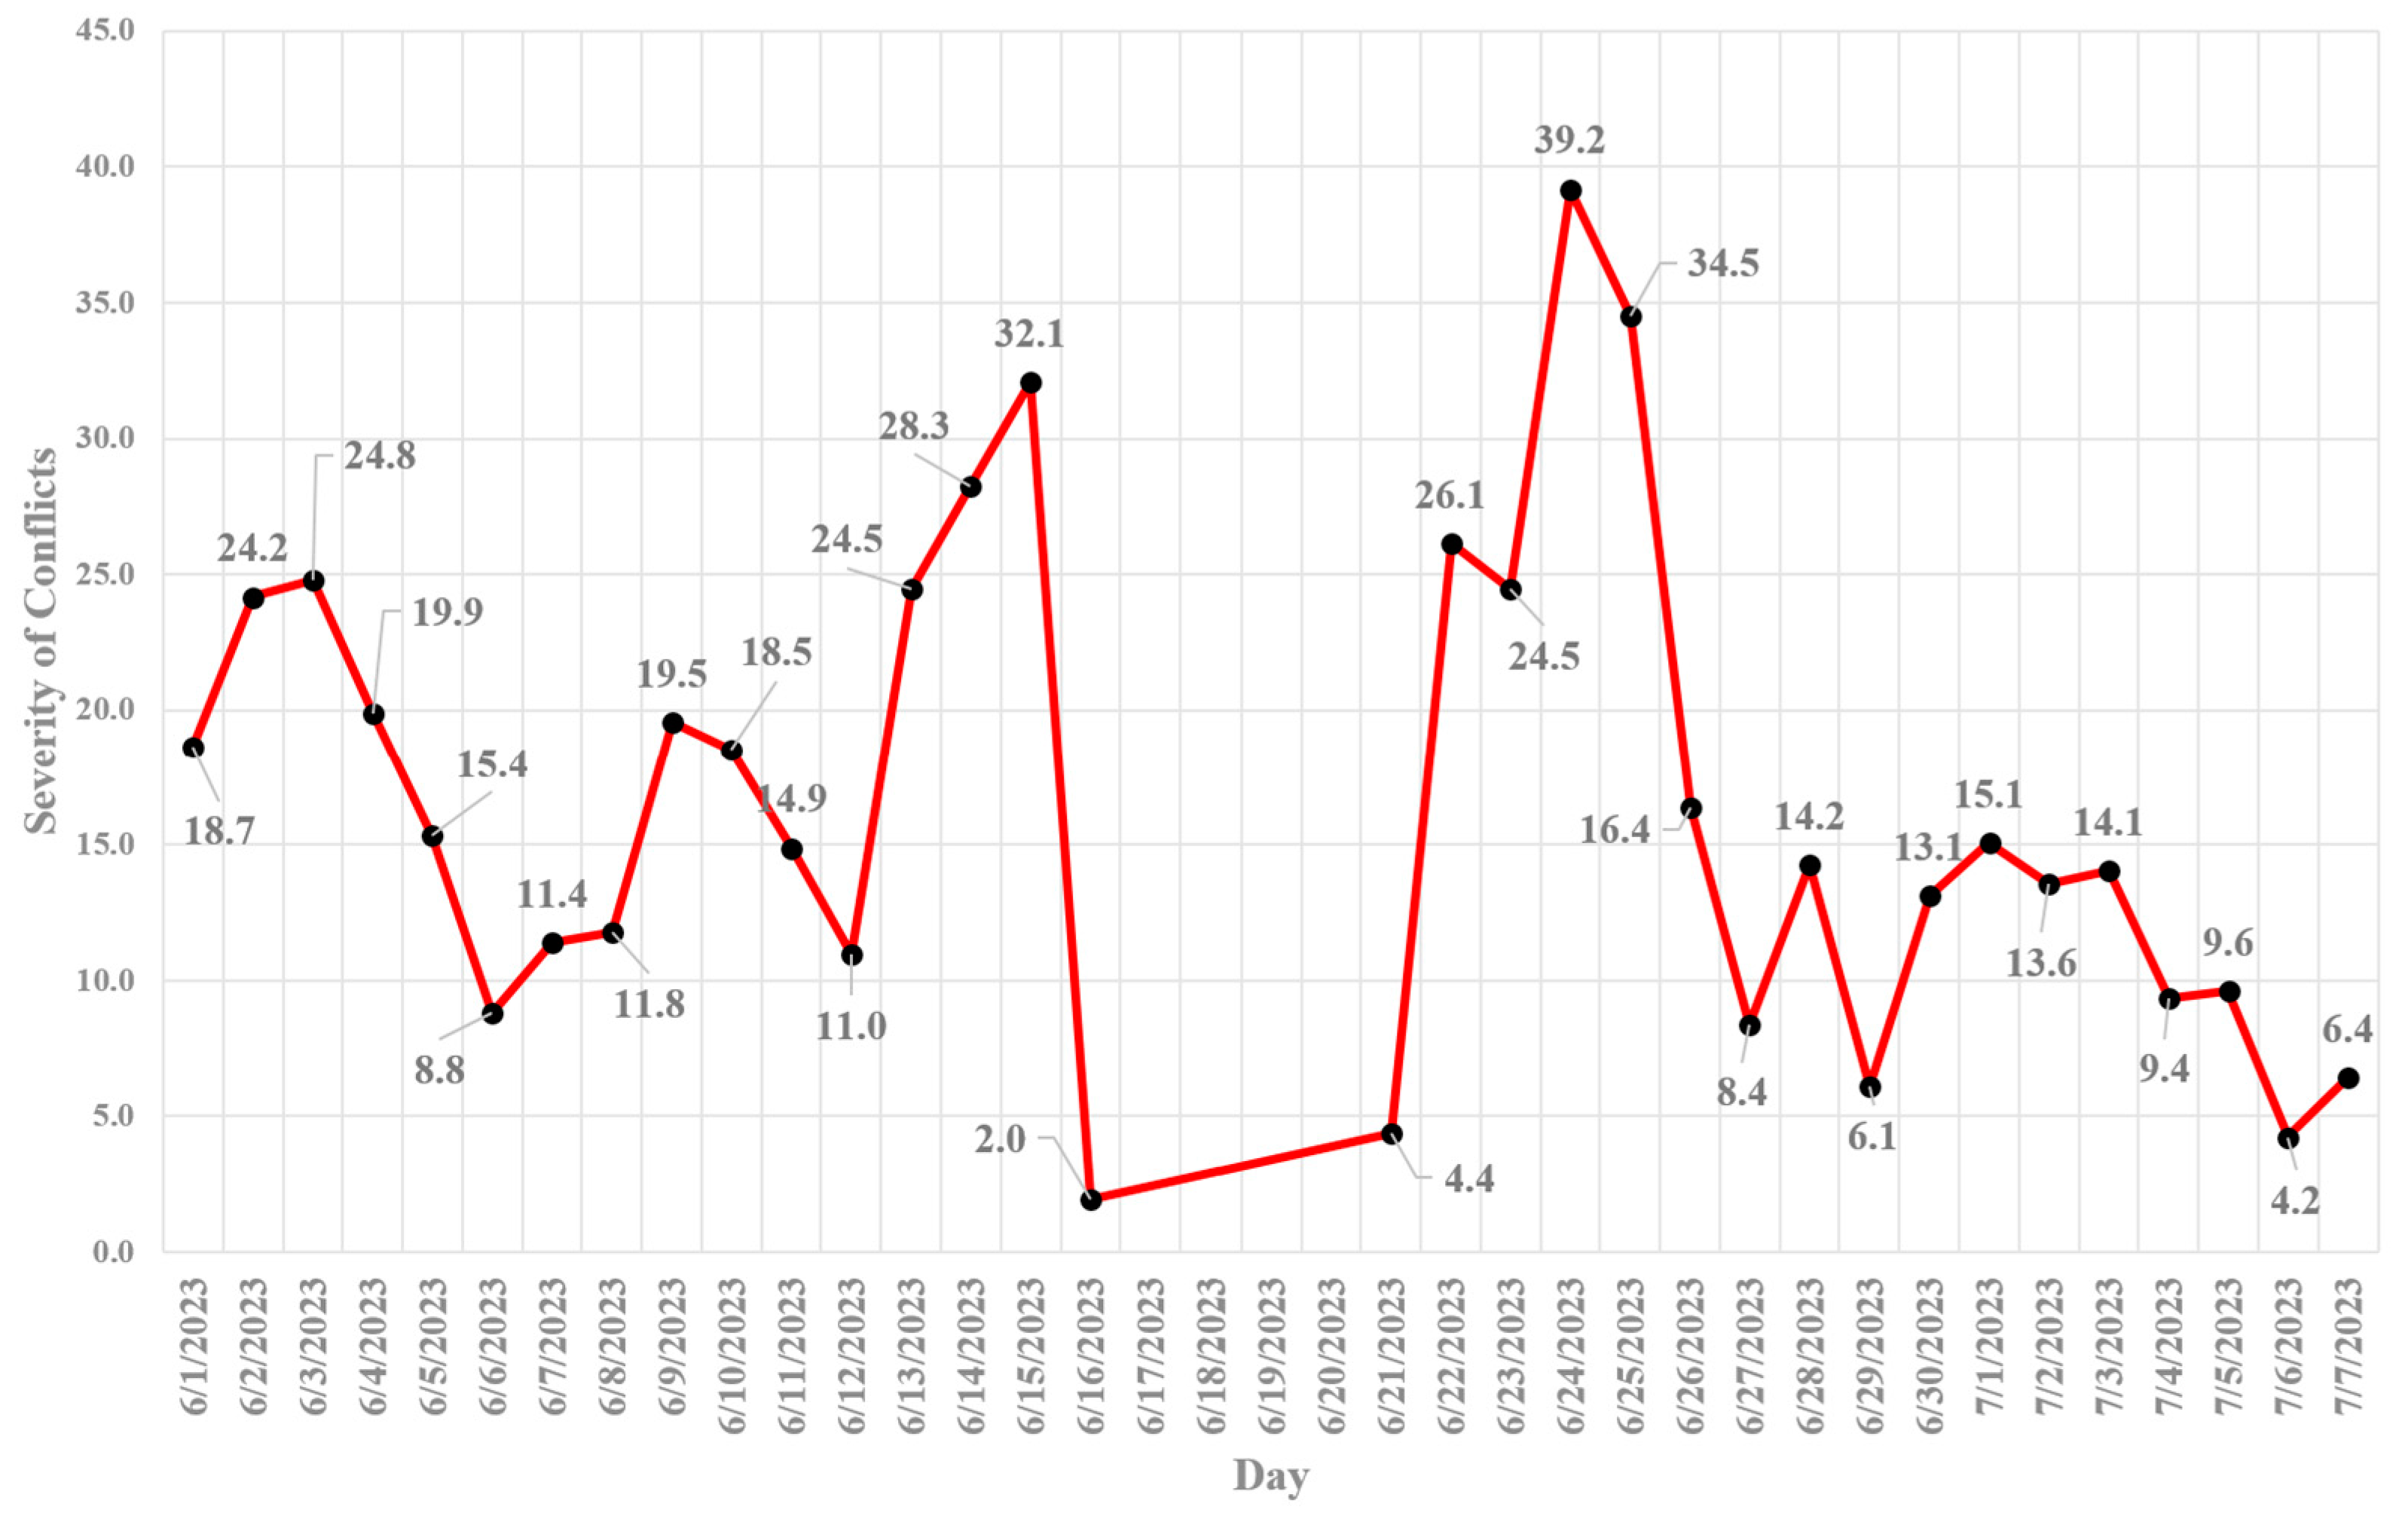
Figure 16.
Hourly Distribution of Vehicle-Pedestrian Conflict – Frequency Chart.
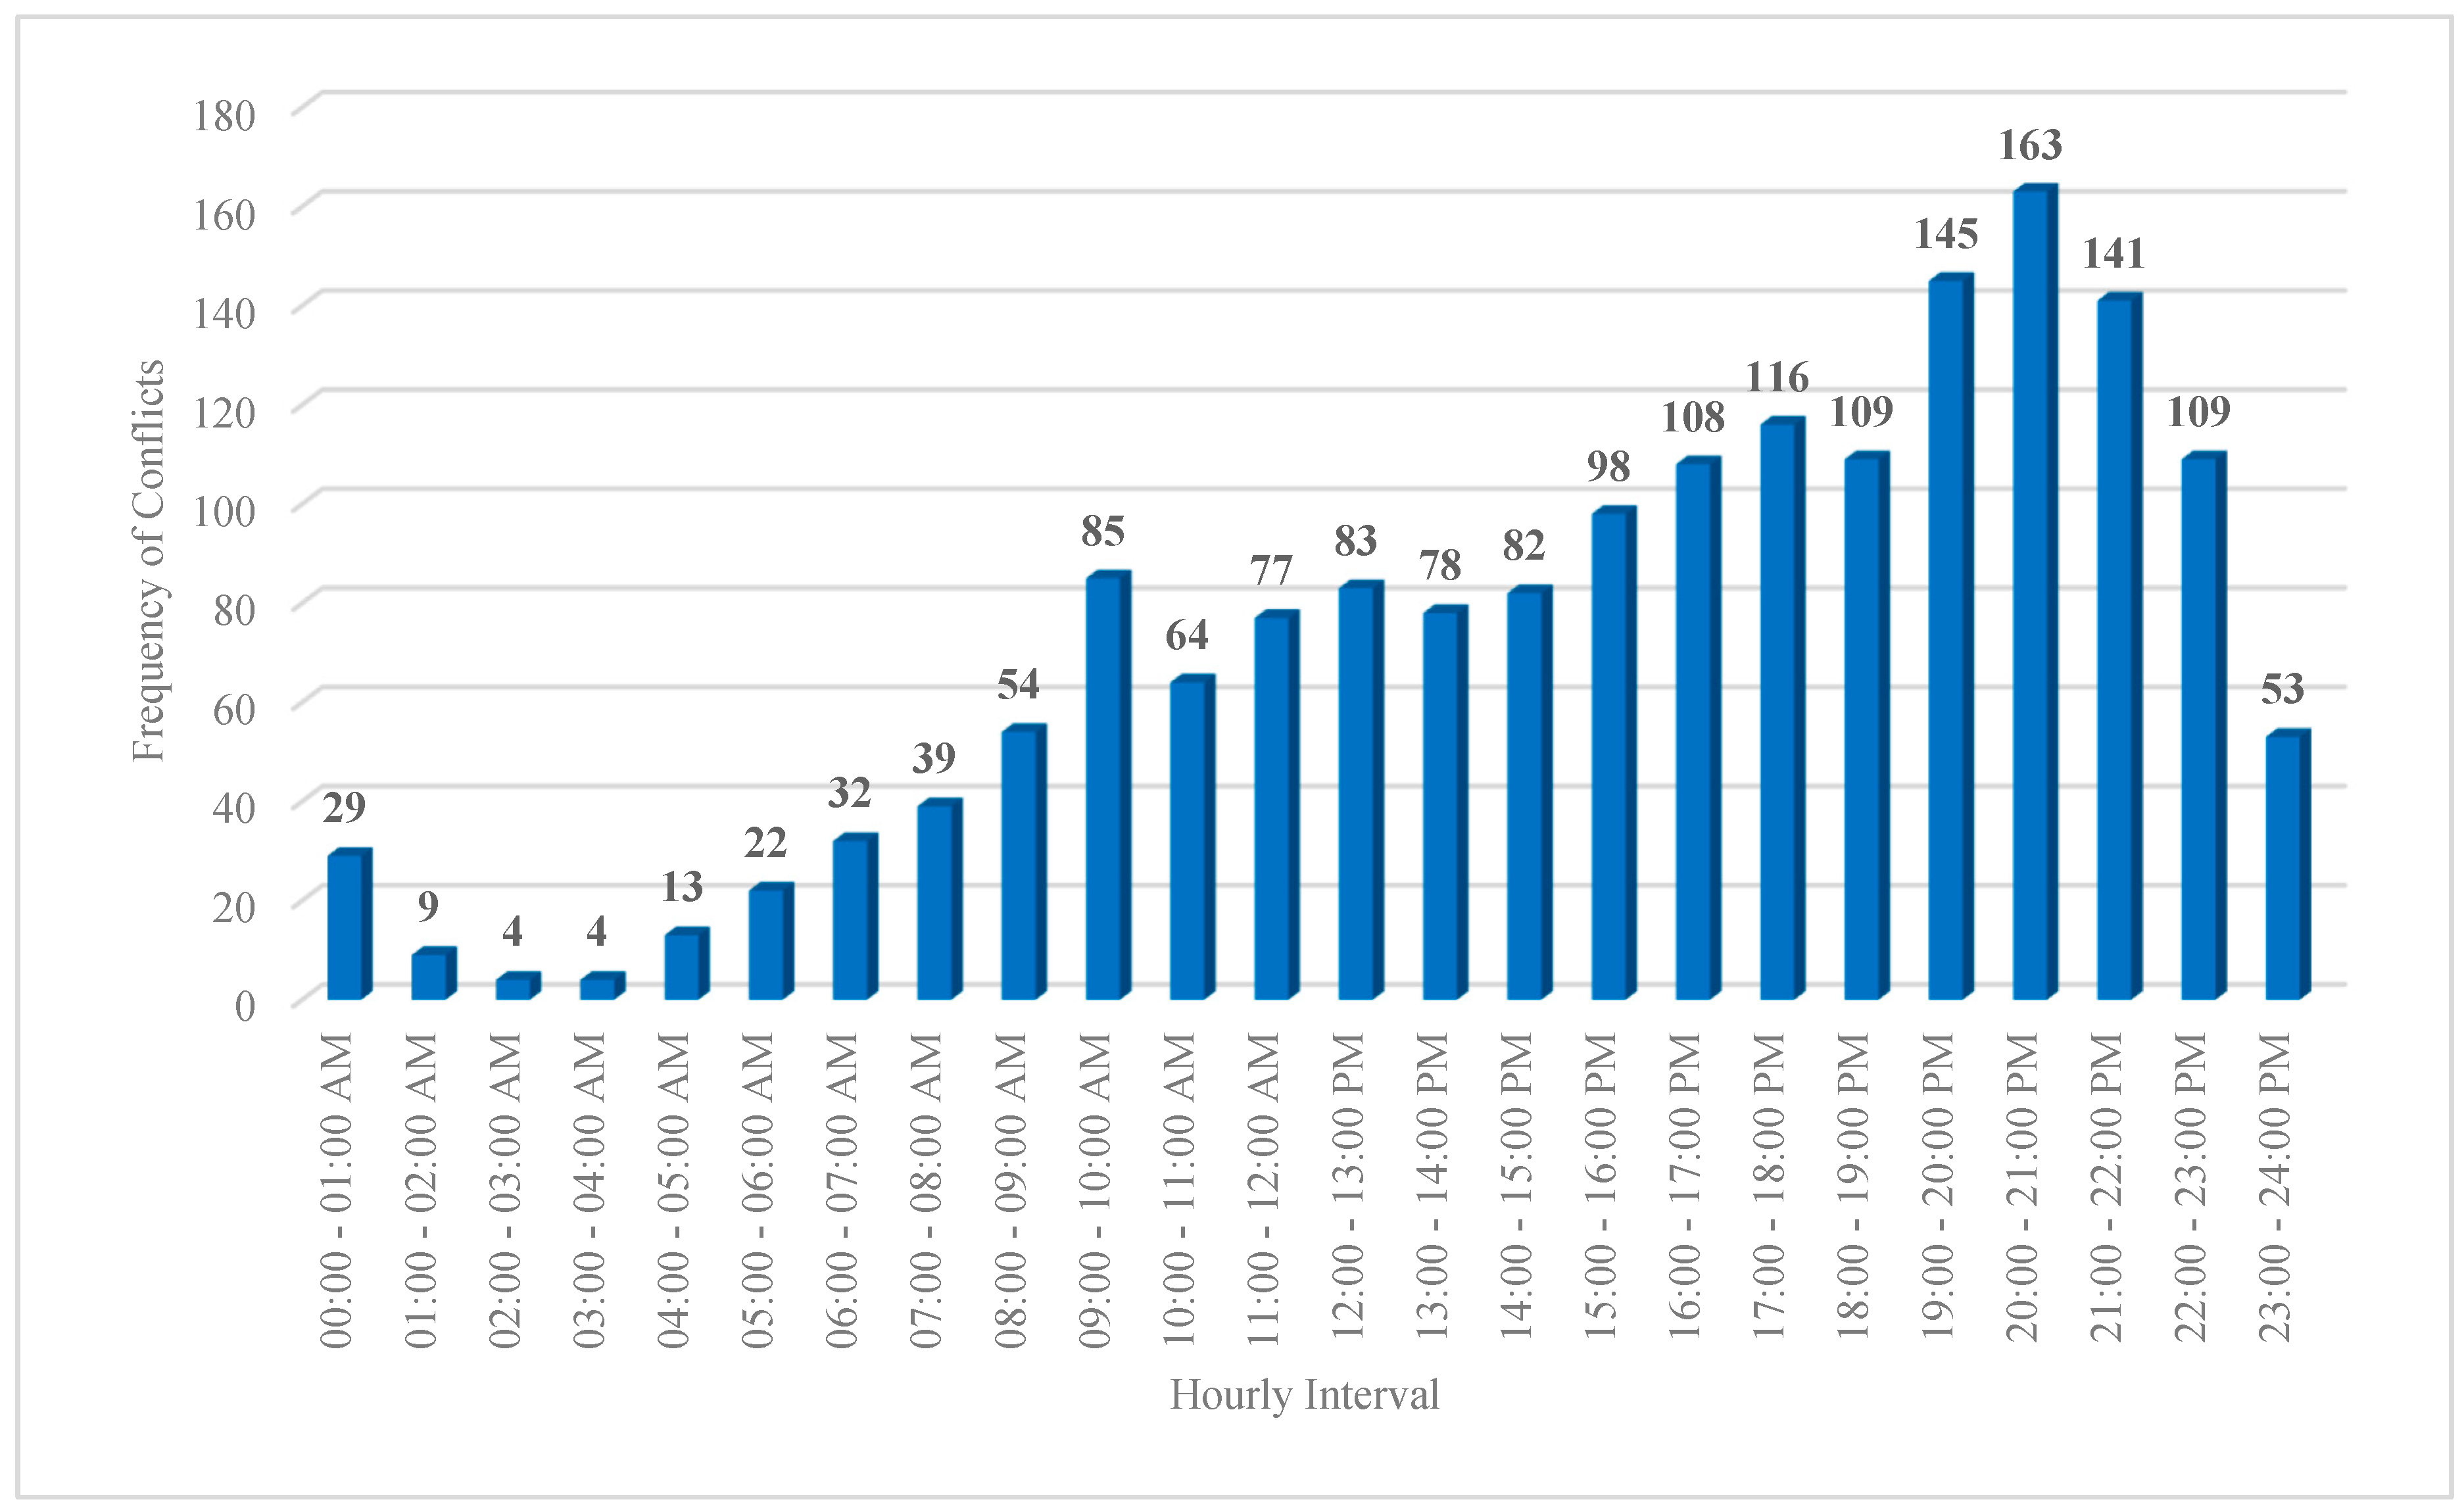
Figure 17.
Hourly Distribution of Vehicle-Pedestrian Conflict – Severity Chart.
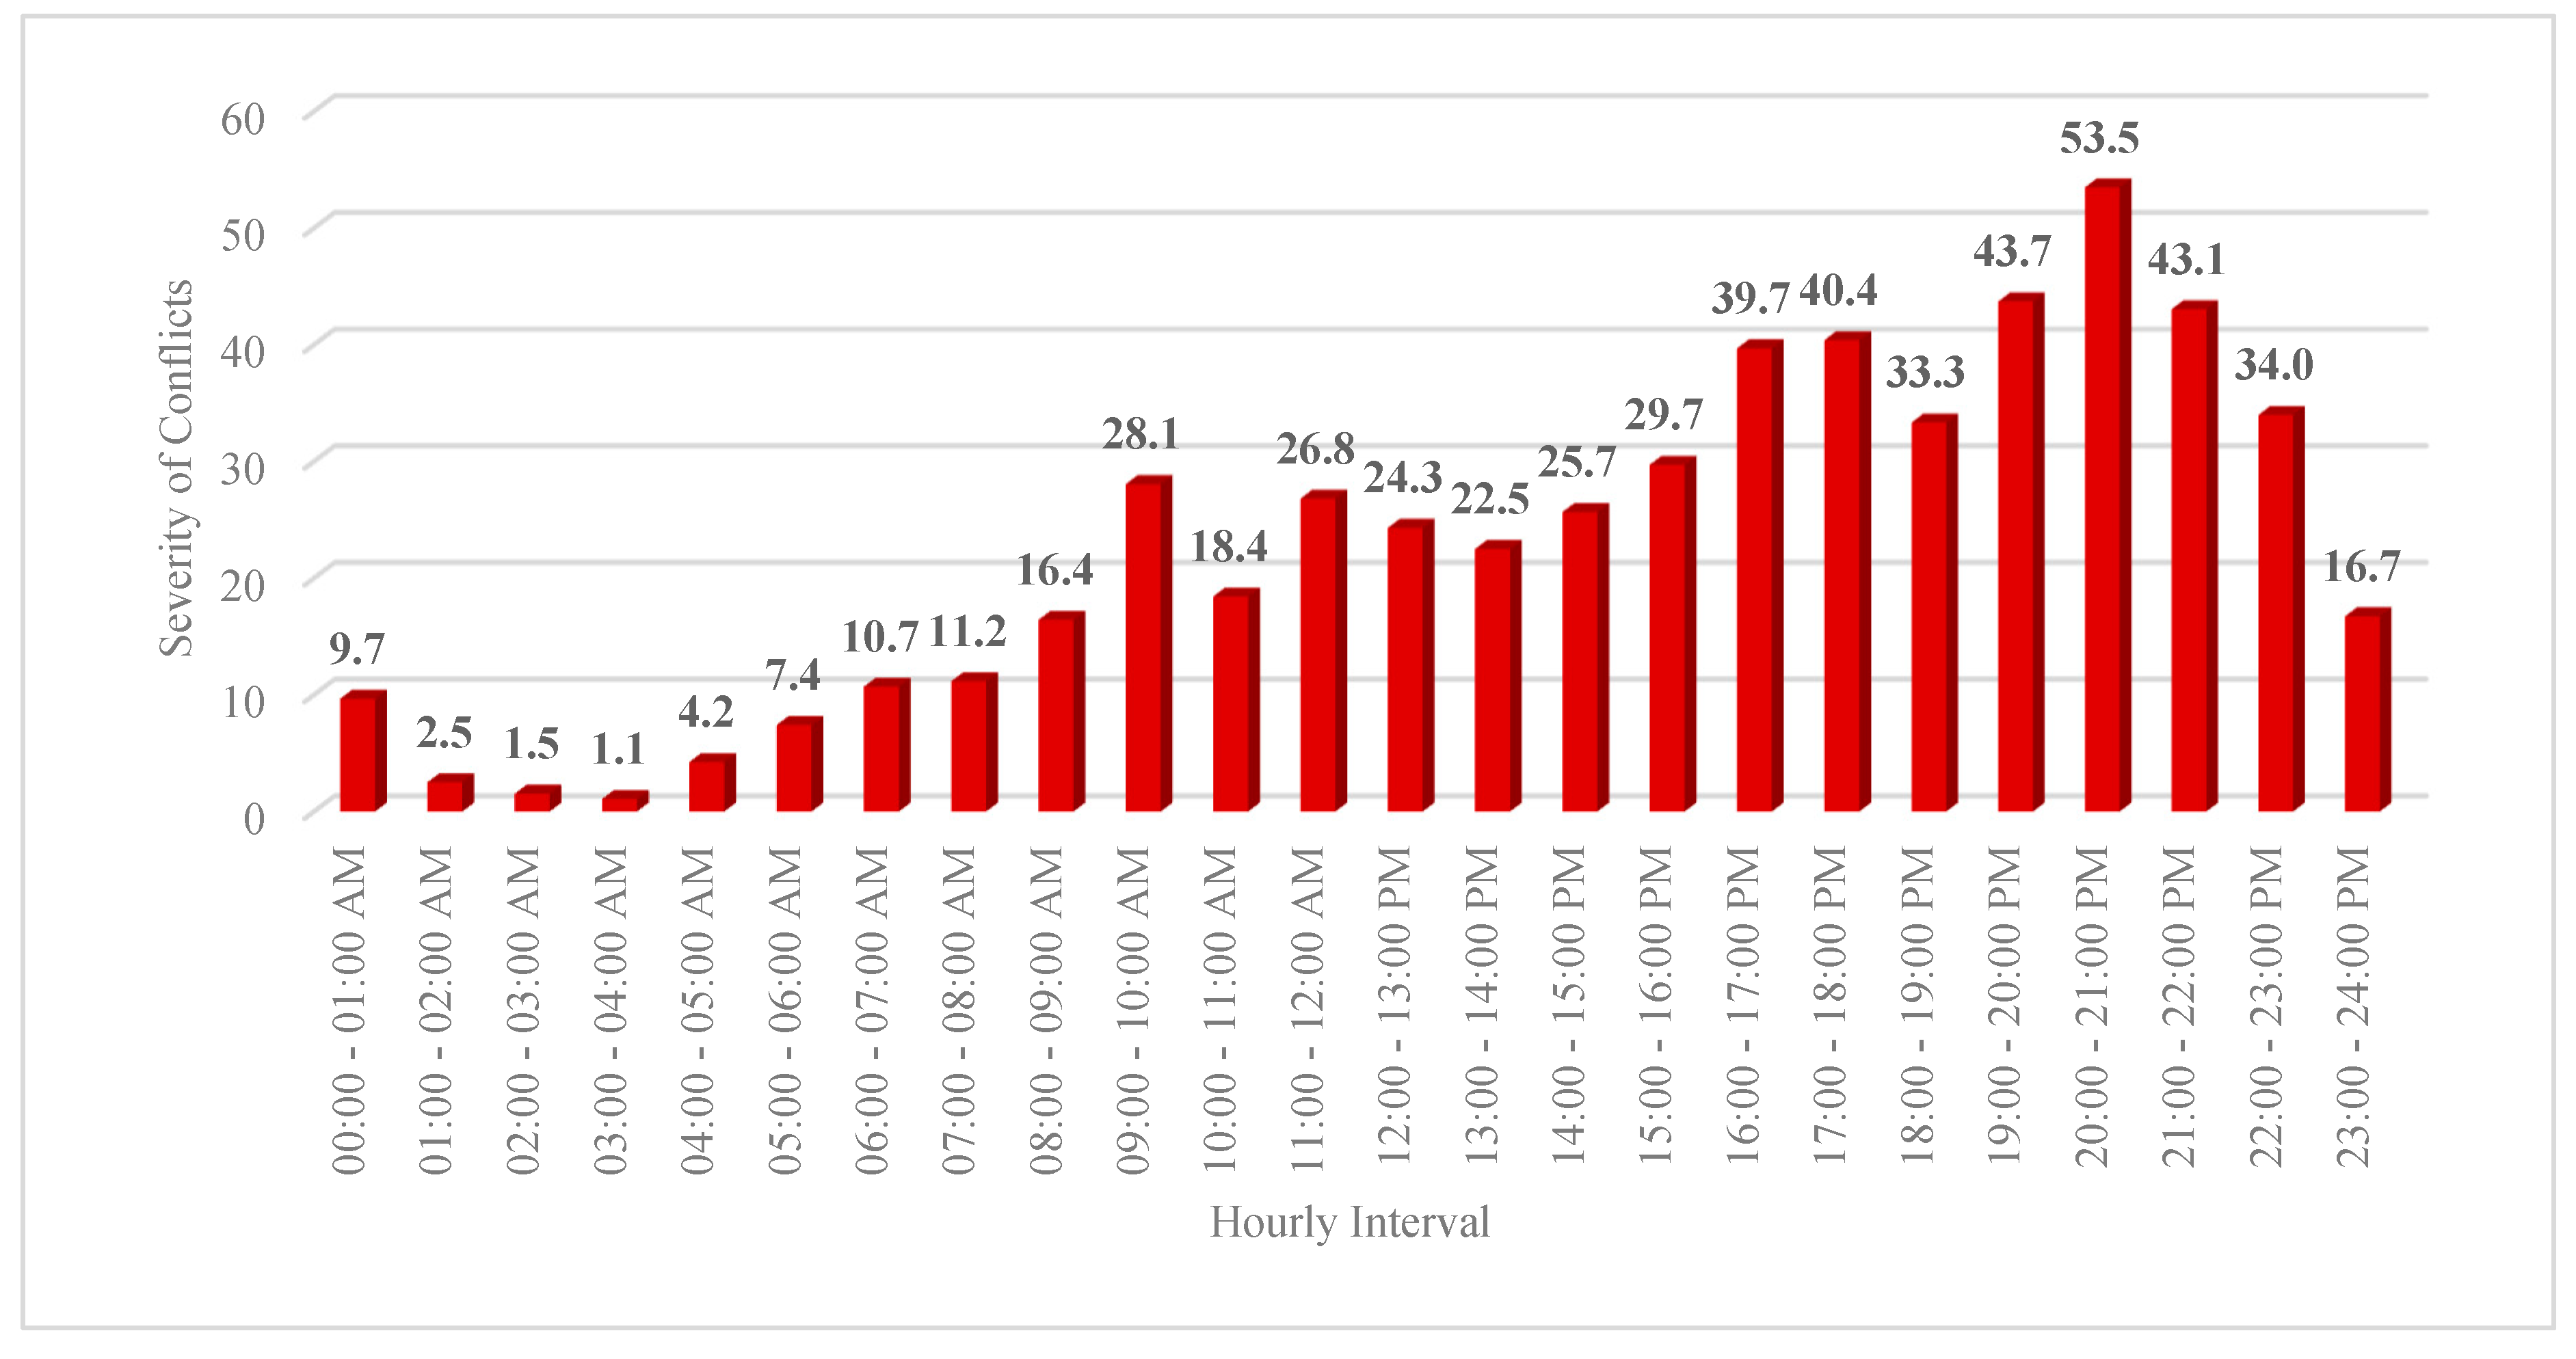
Figure 18.
Normalized Vehicle-Pedestrian Conflicts by Pedestrians Volume.
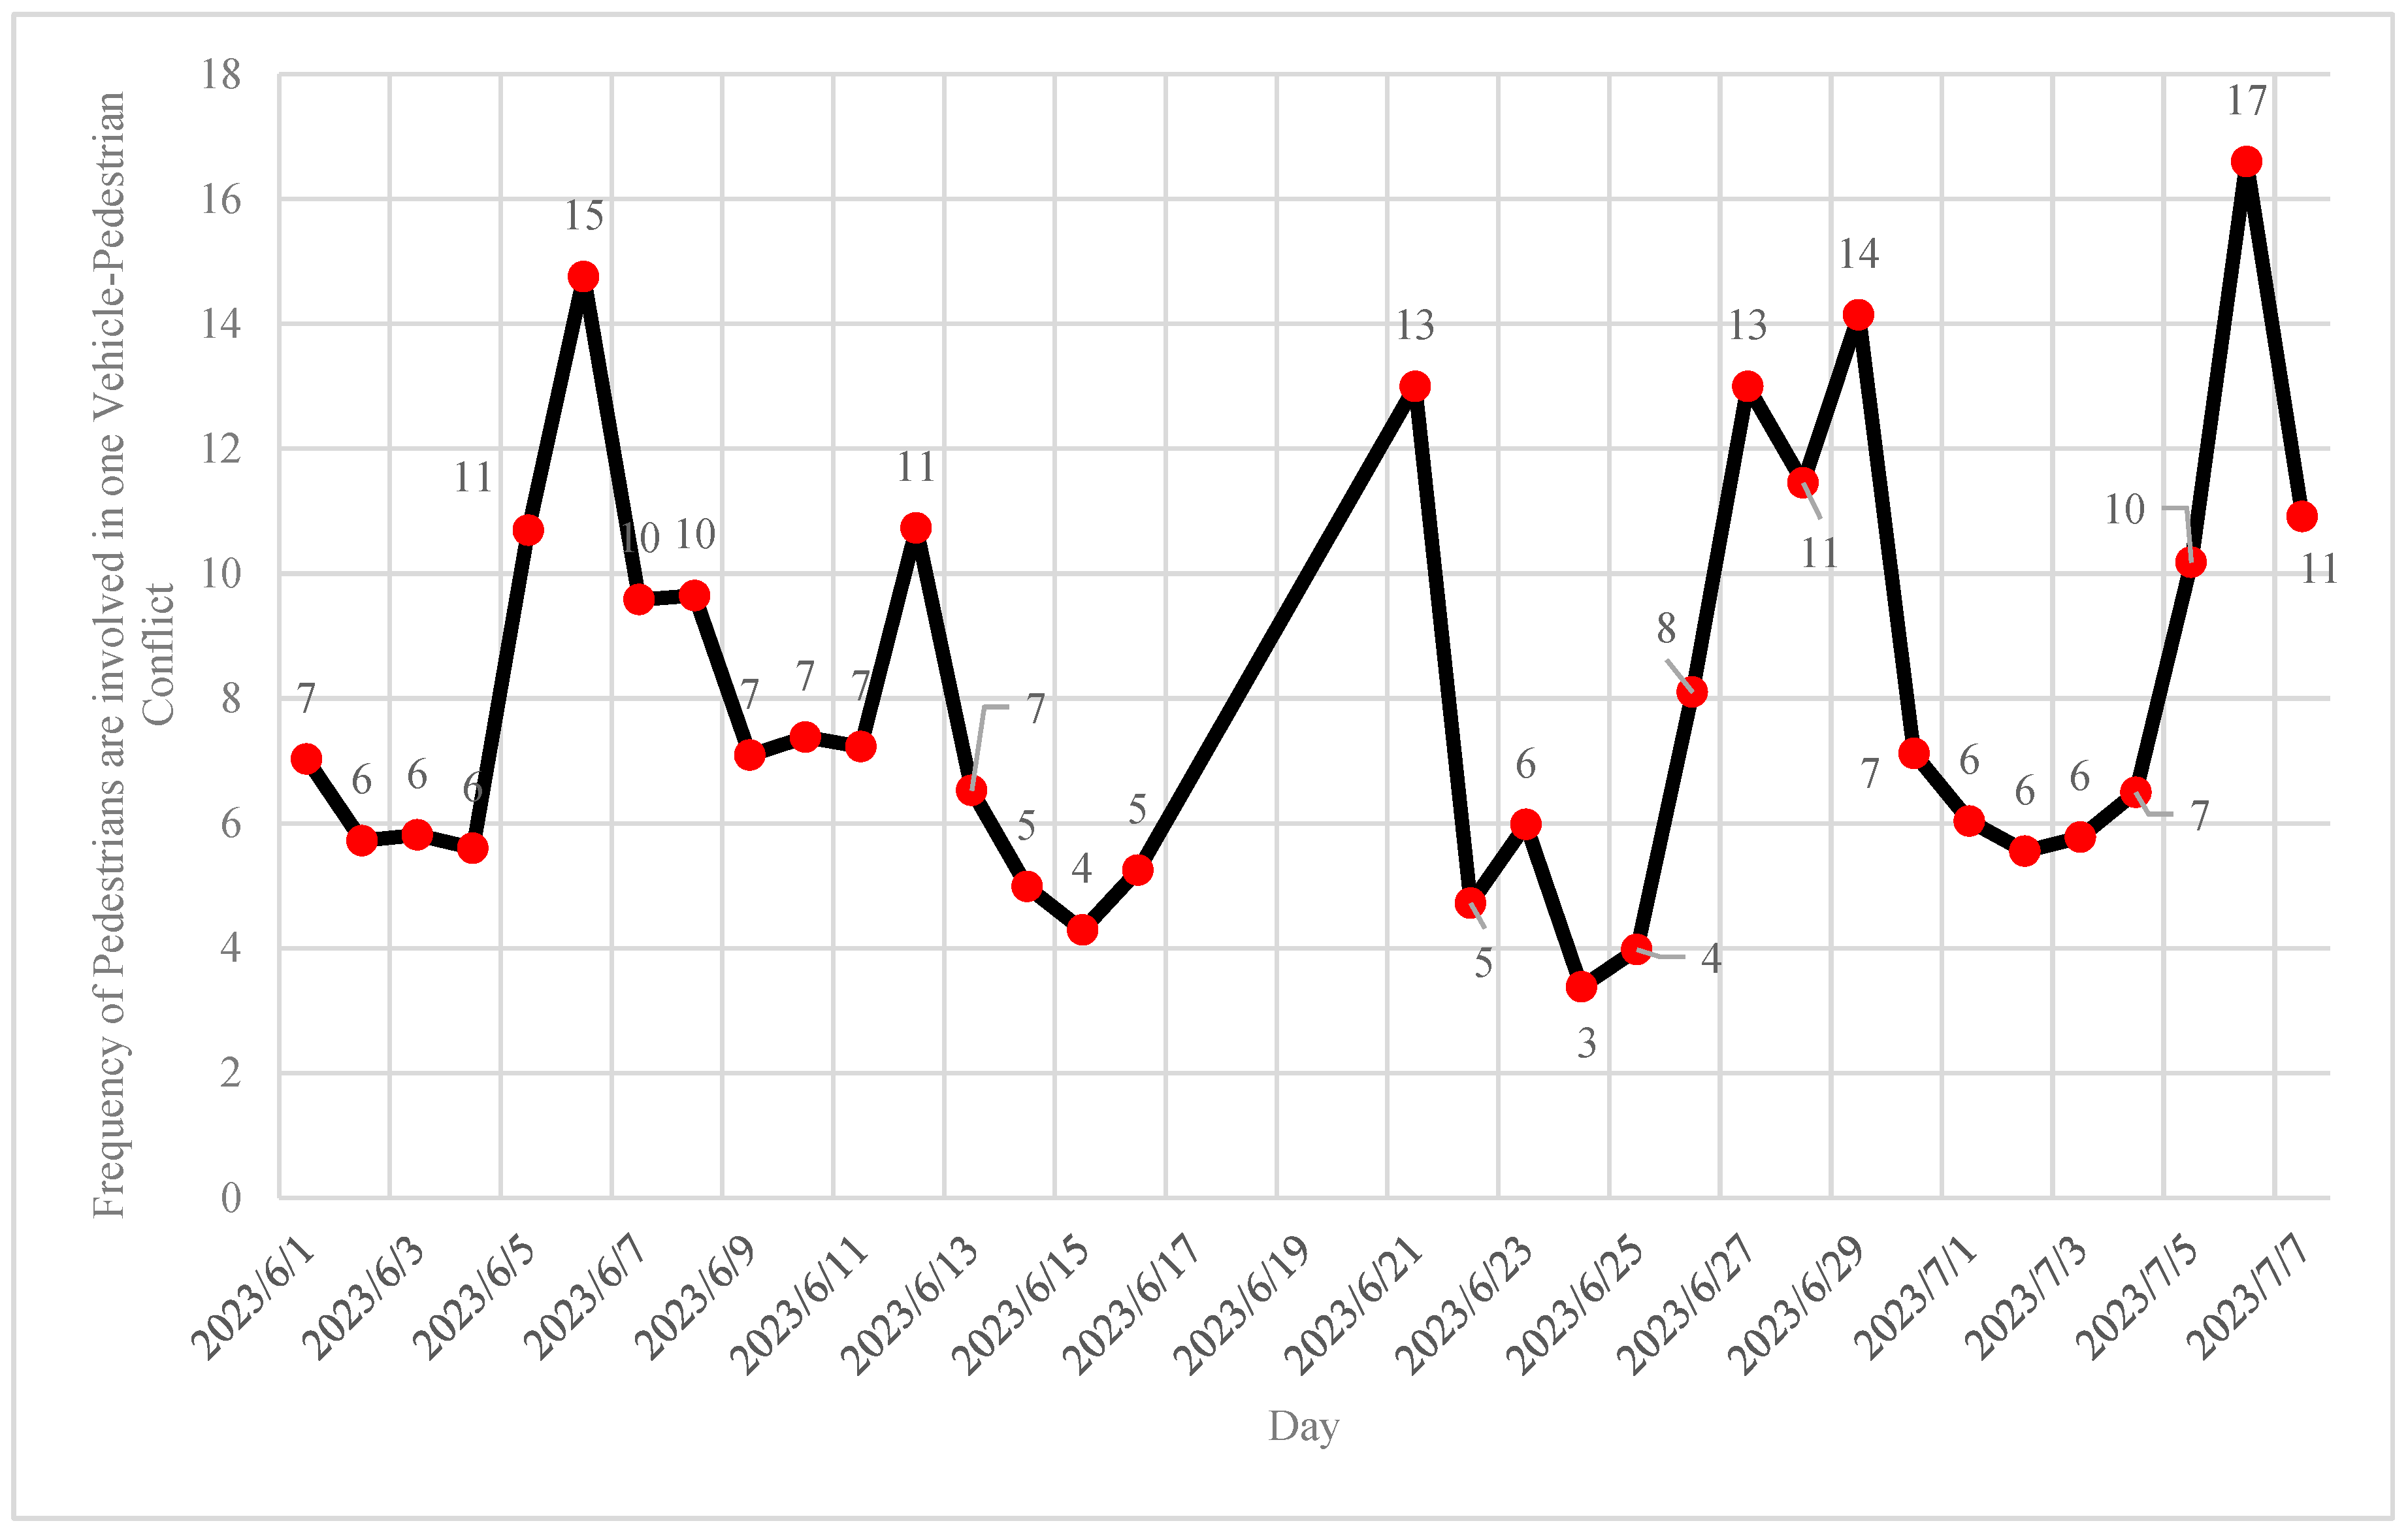
Figure 19.
Normalized Vehicle-Pedestrian Conflicts by Vehicles Volume.
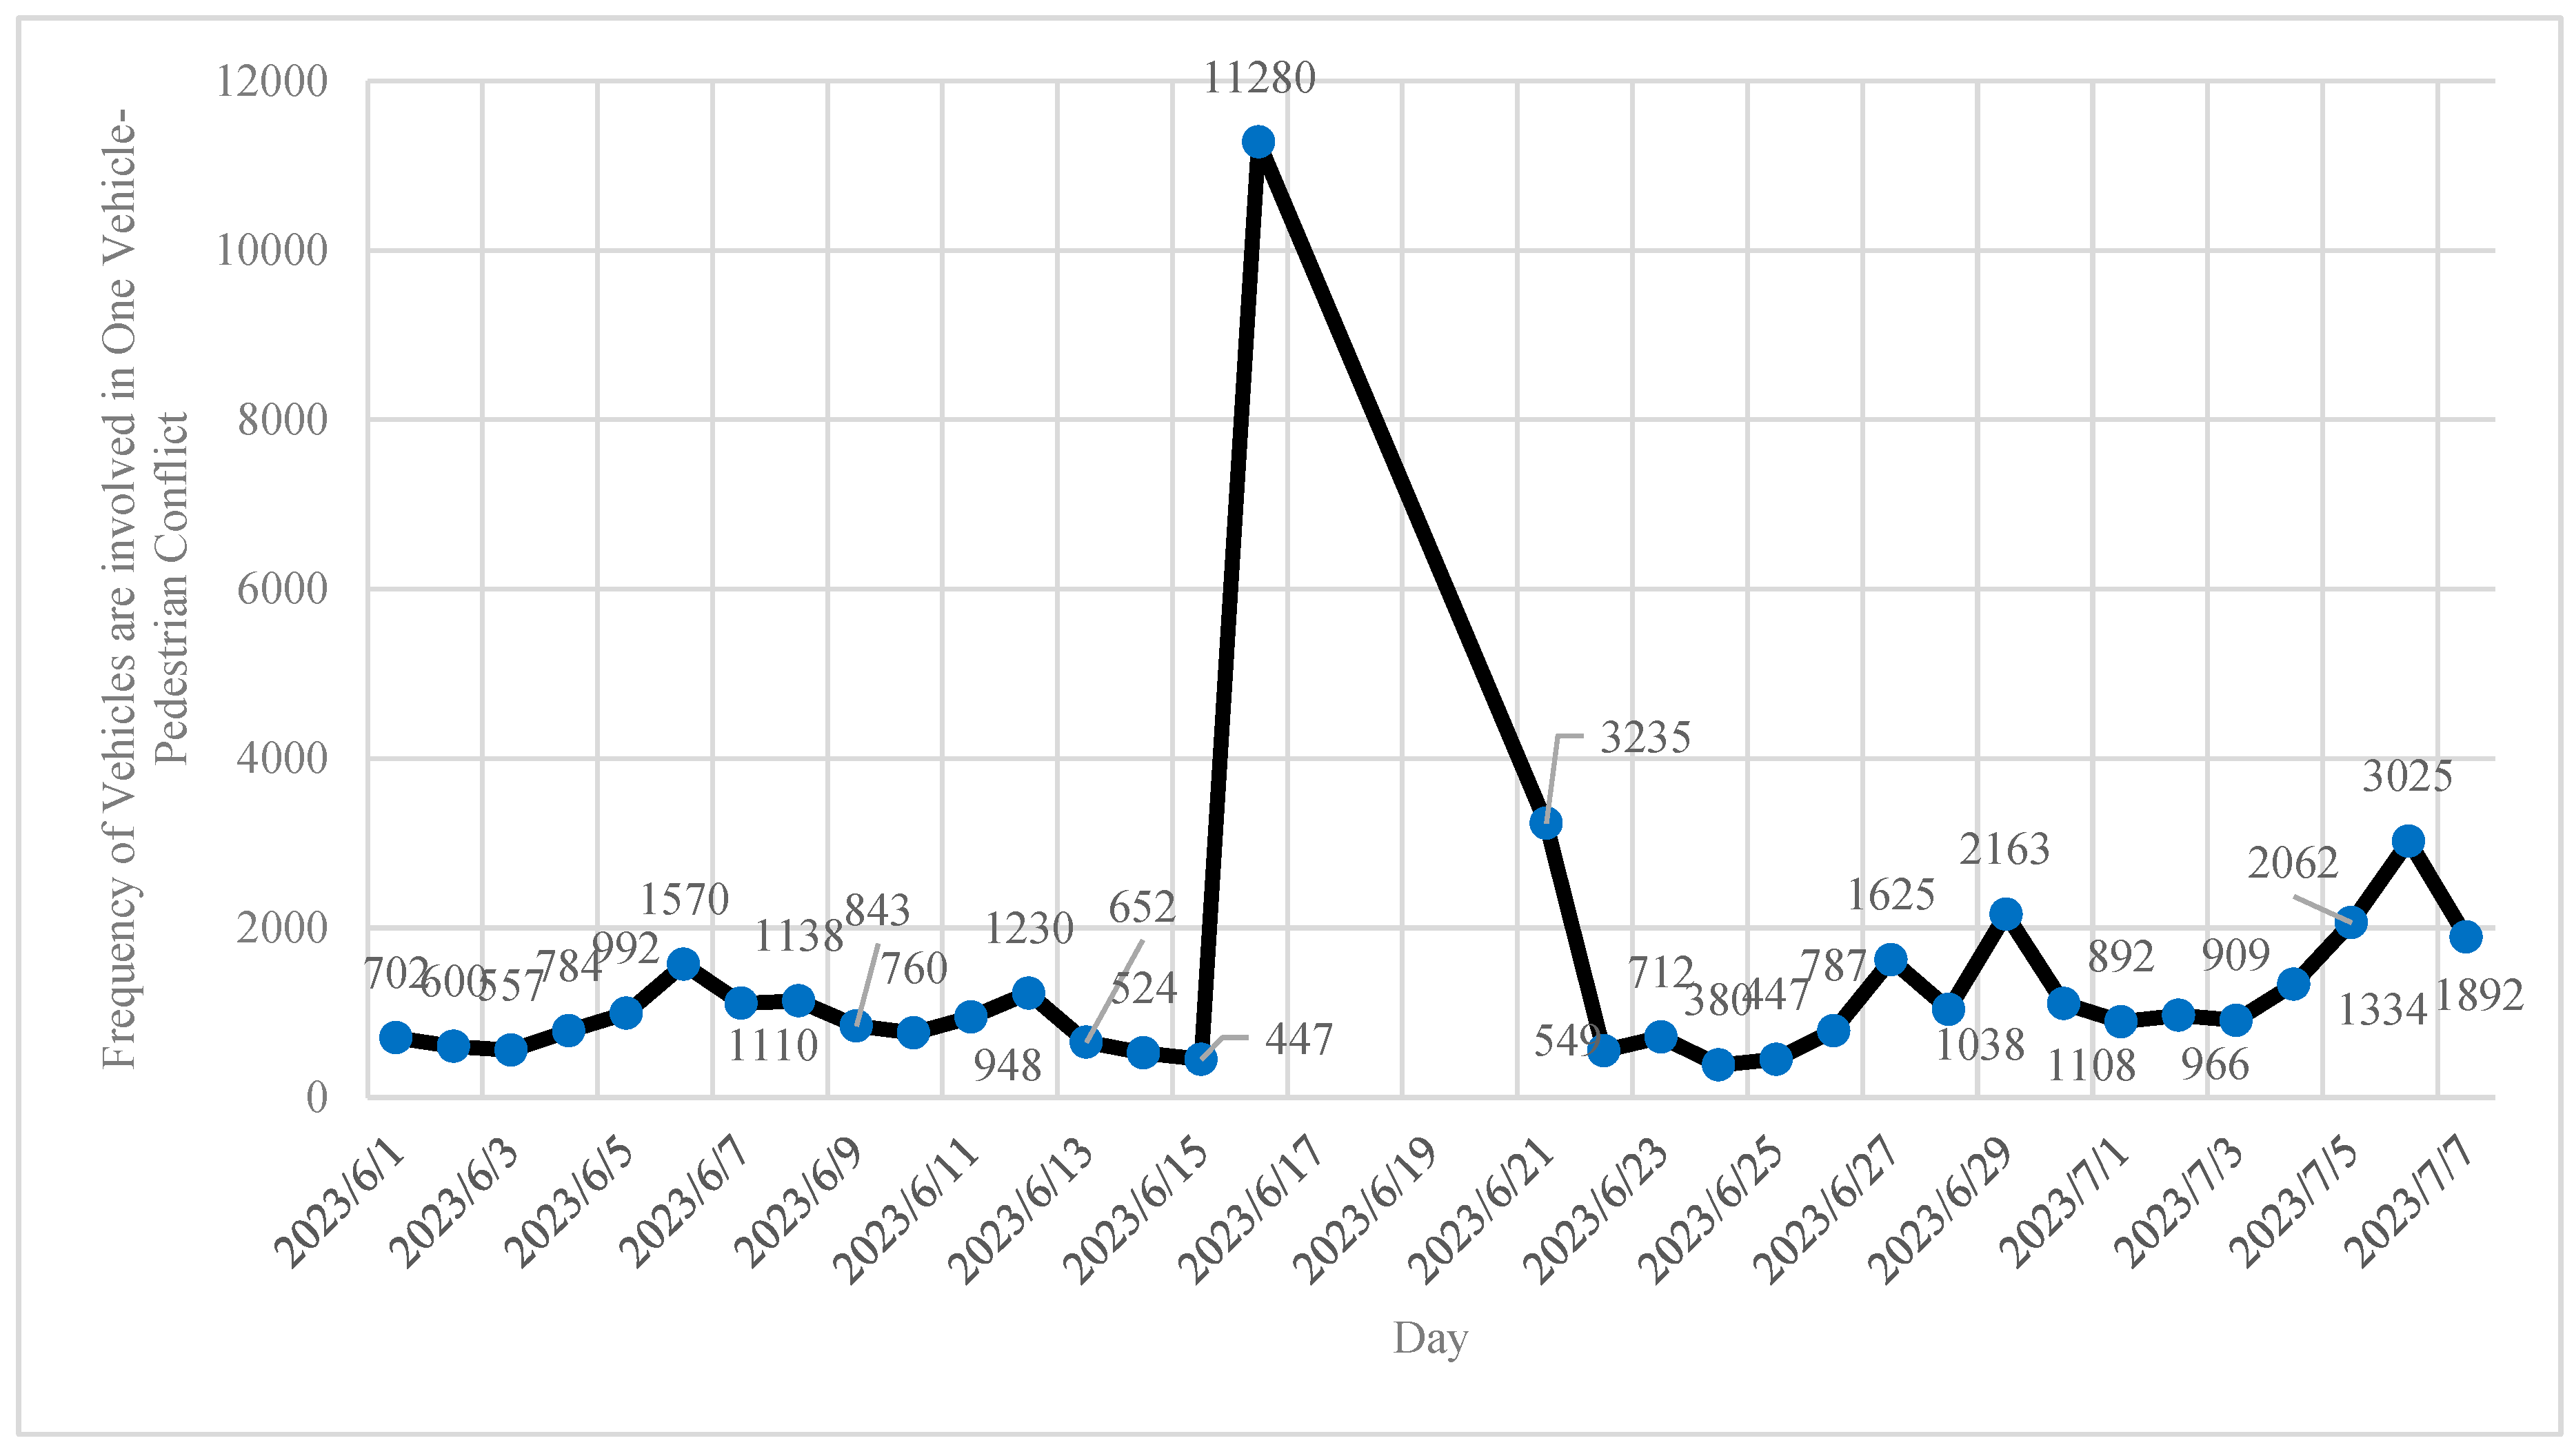
Figure 20.
The Frequency of Pedestrians are involved in one "vehicle-pedestrian" conflict in each approach.
Figure 20.
The Frequency of Pedestrians are involved in one "vehicle-pedestrian" conflict in each approach.
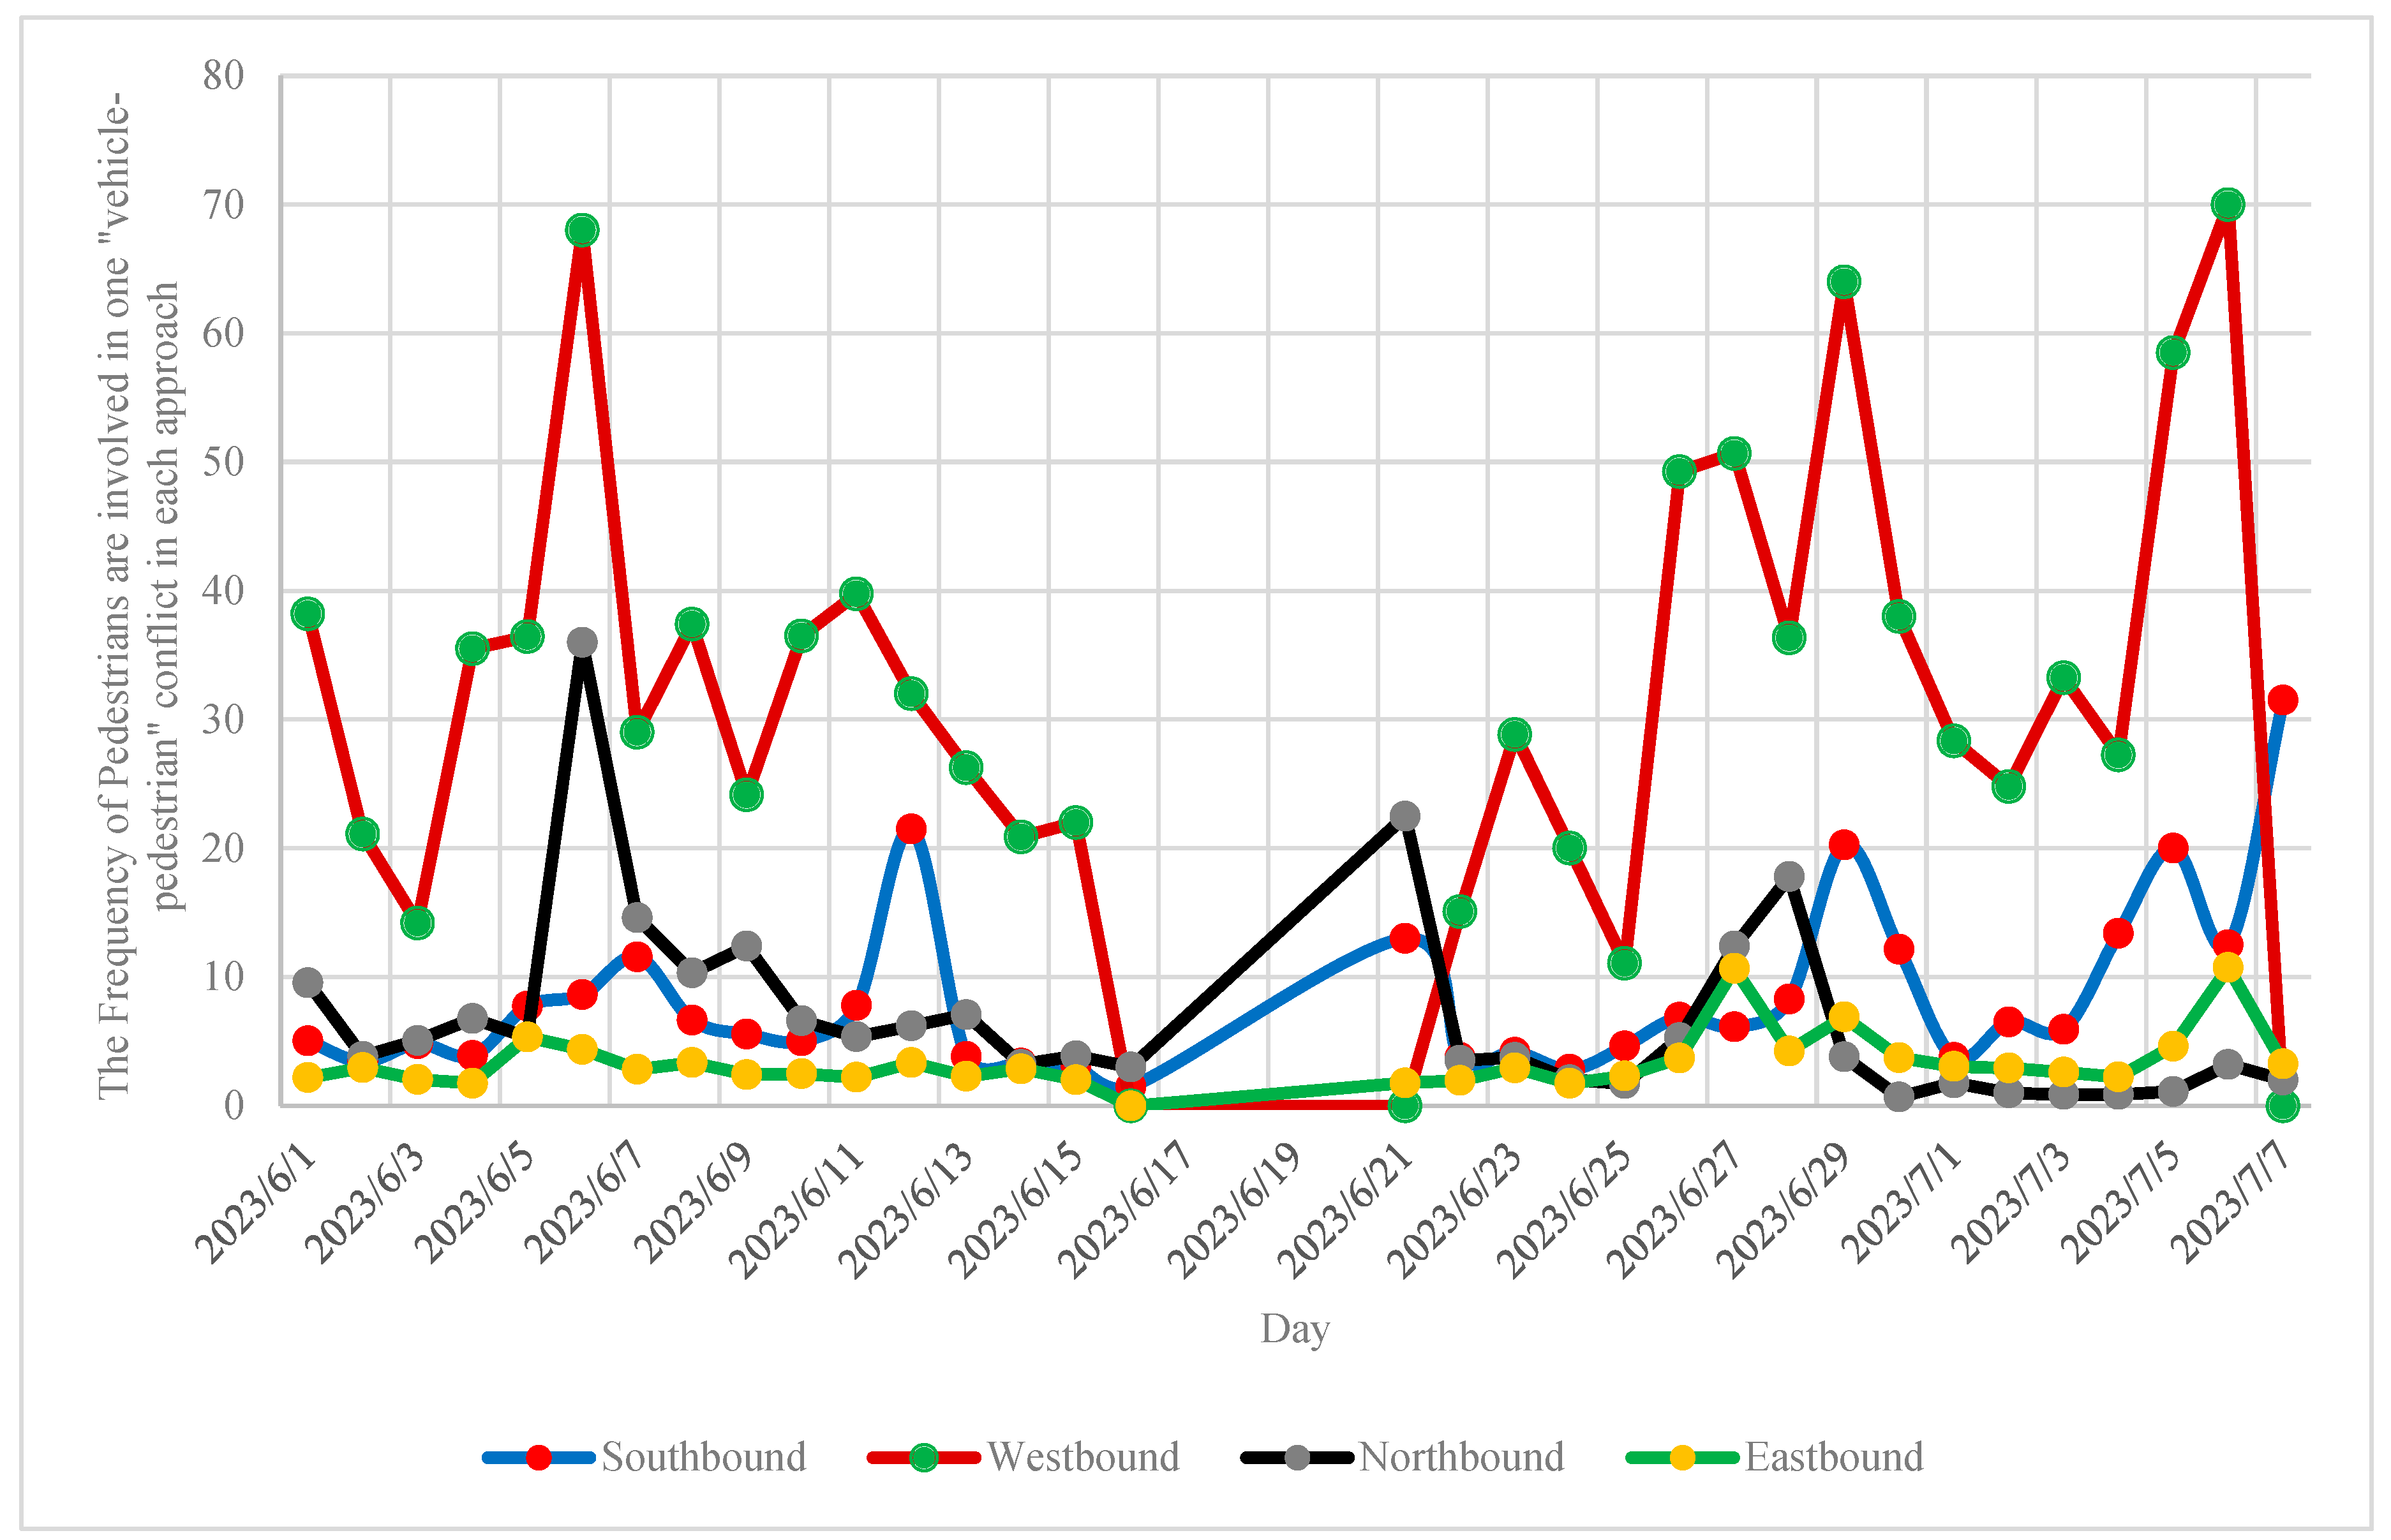
Figure 21.
jaywalking frequency (left) and trajectories (right).
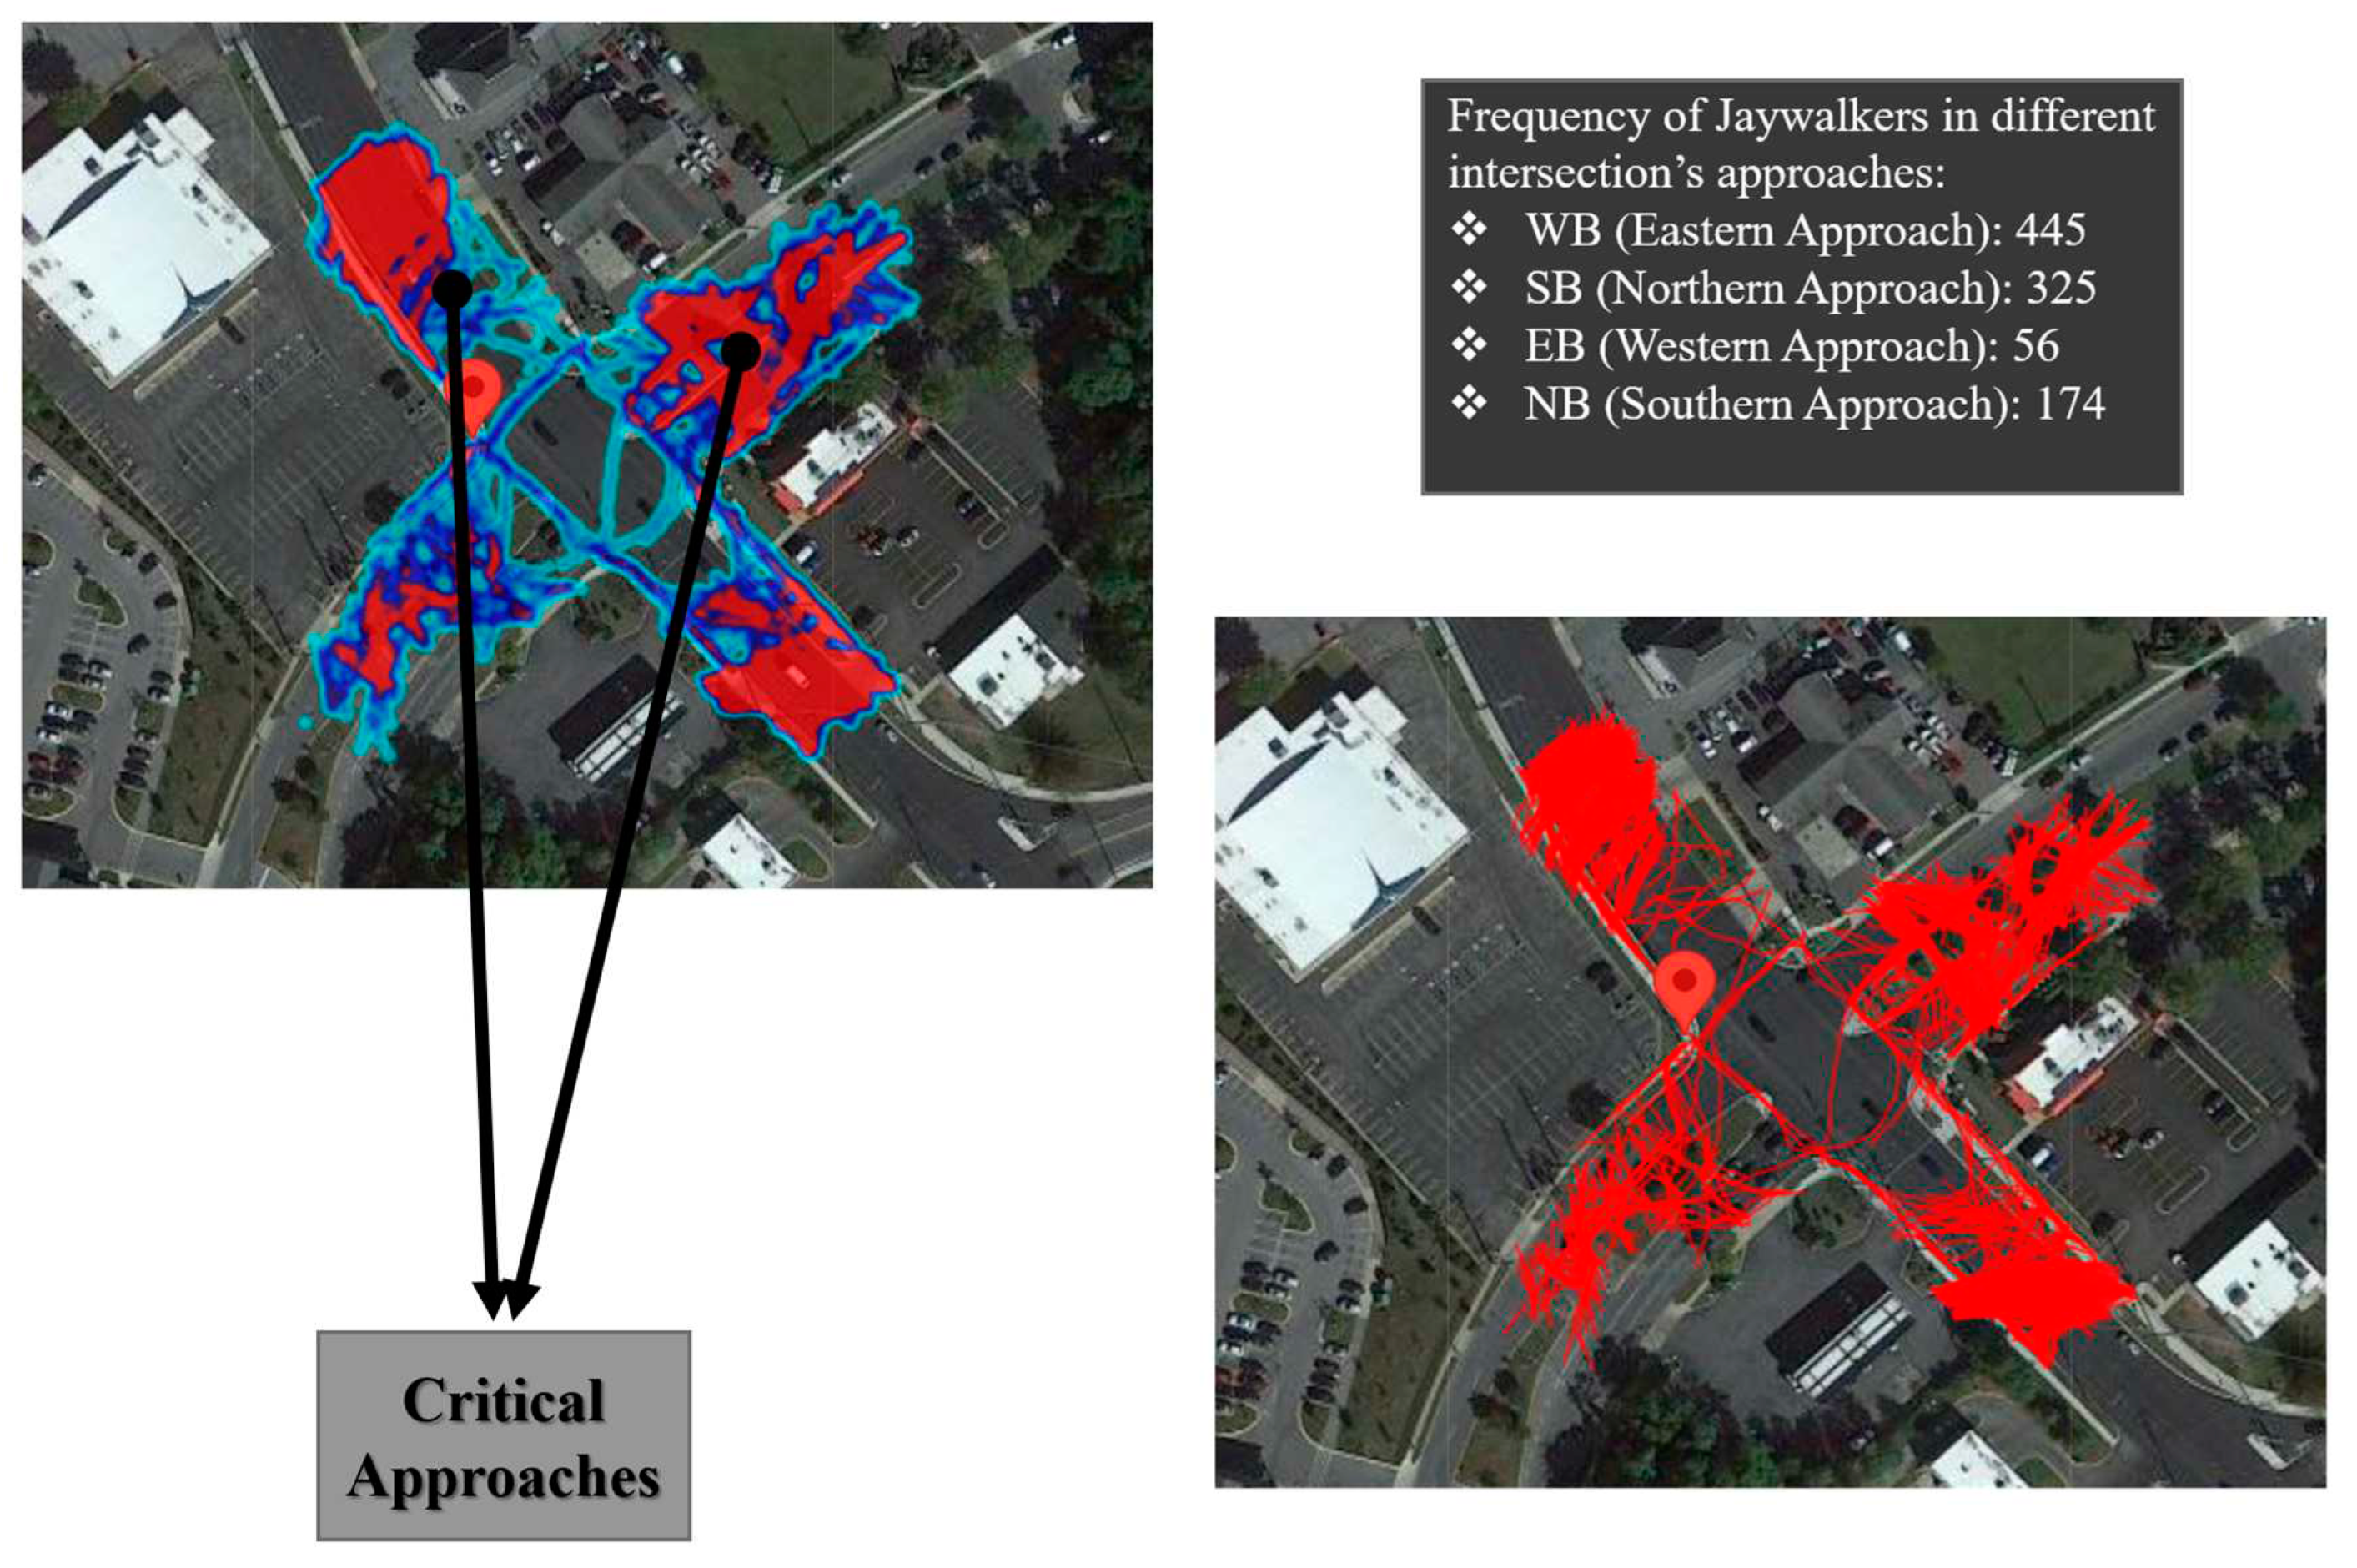
Figure 22.
Hourly Distribution of Jaywalking event’s Frequency.
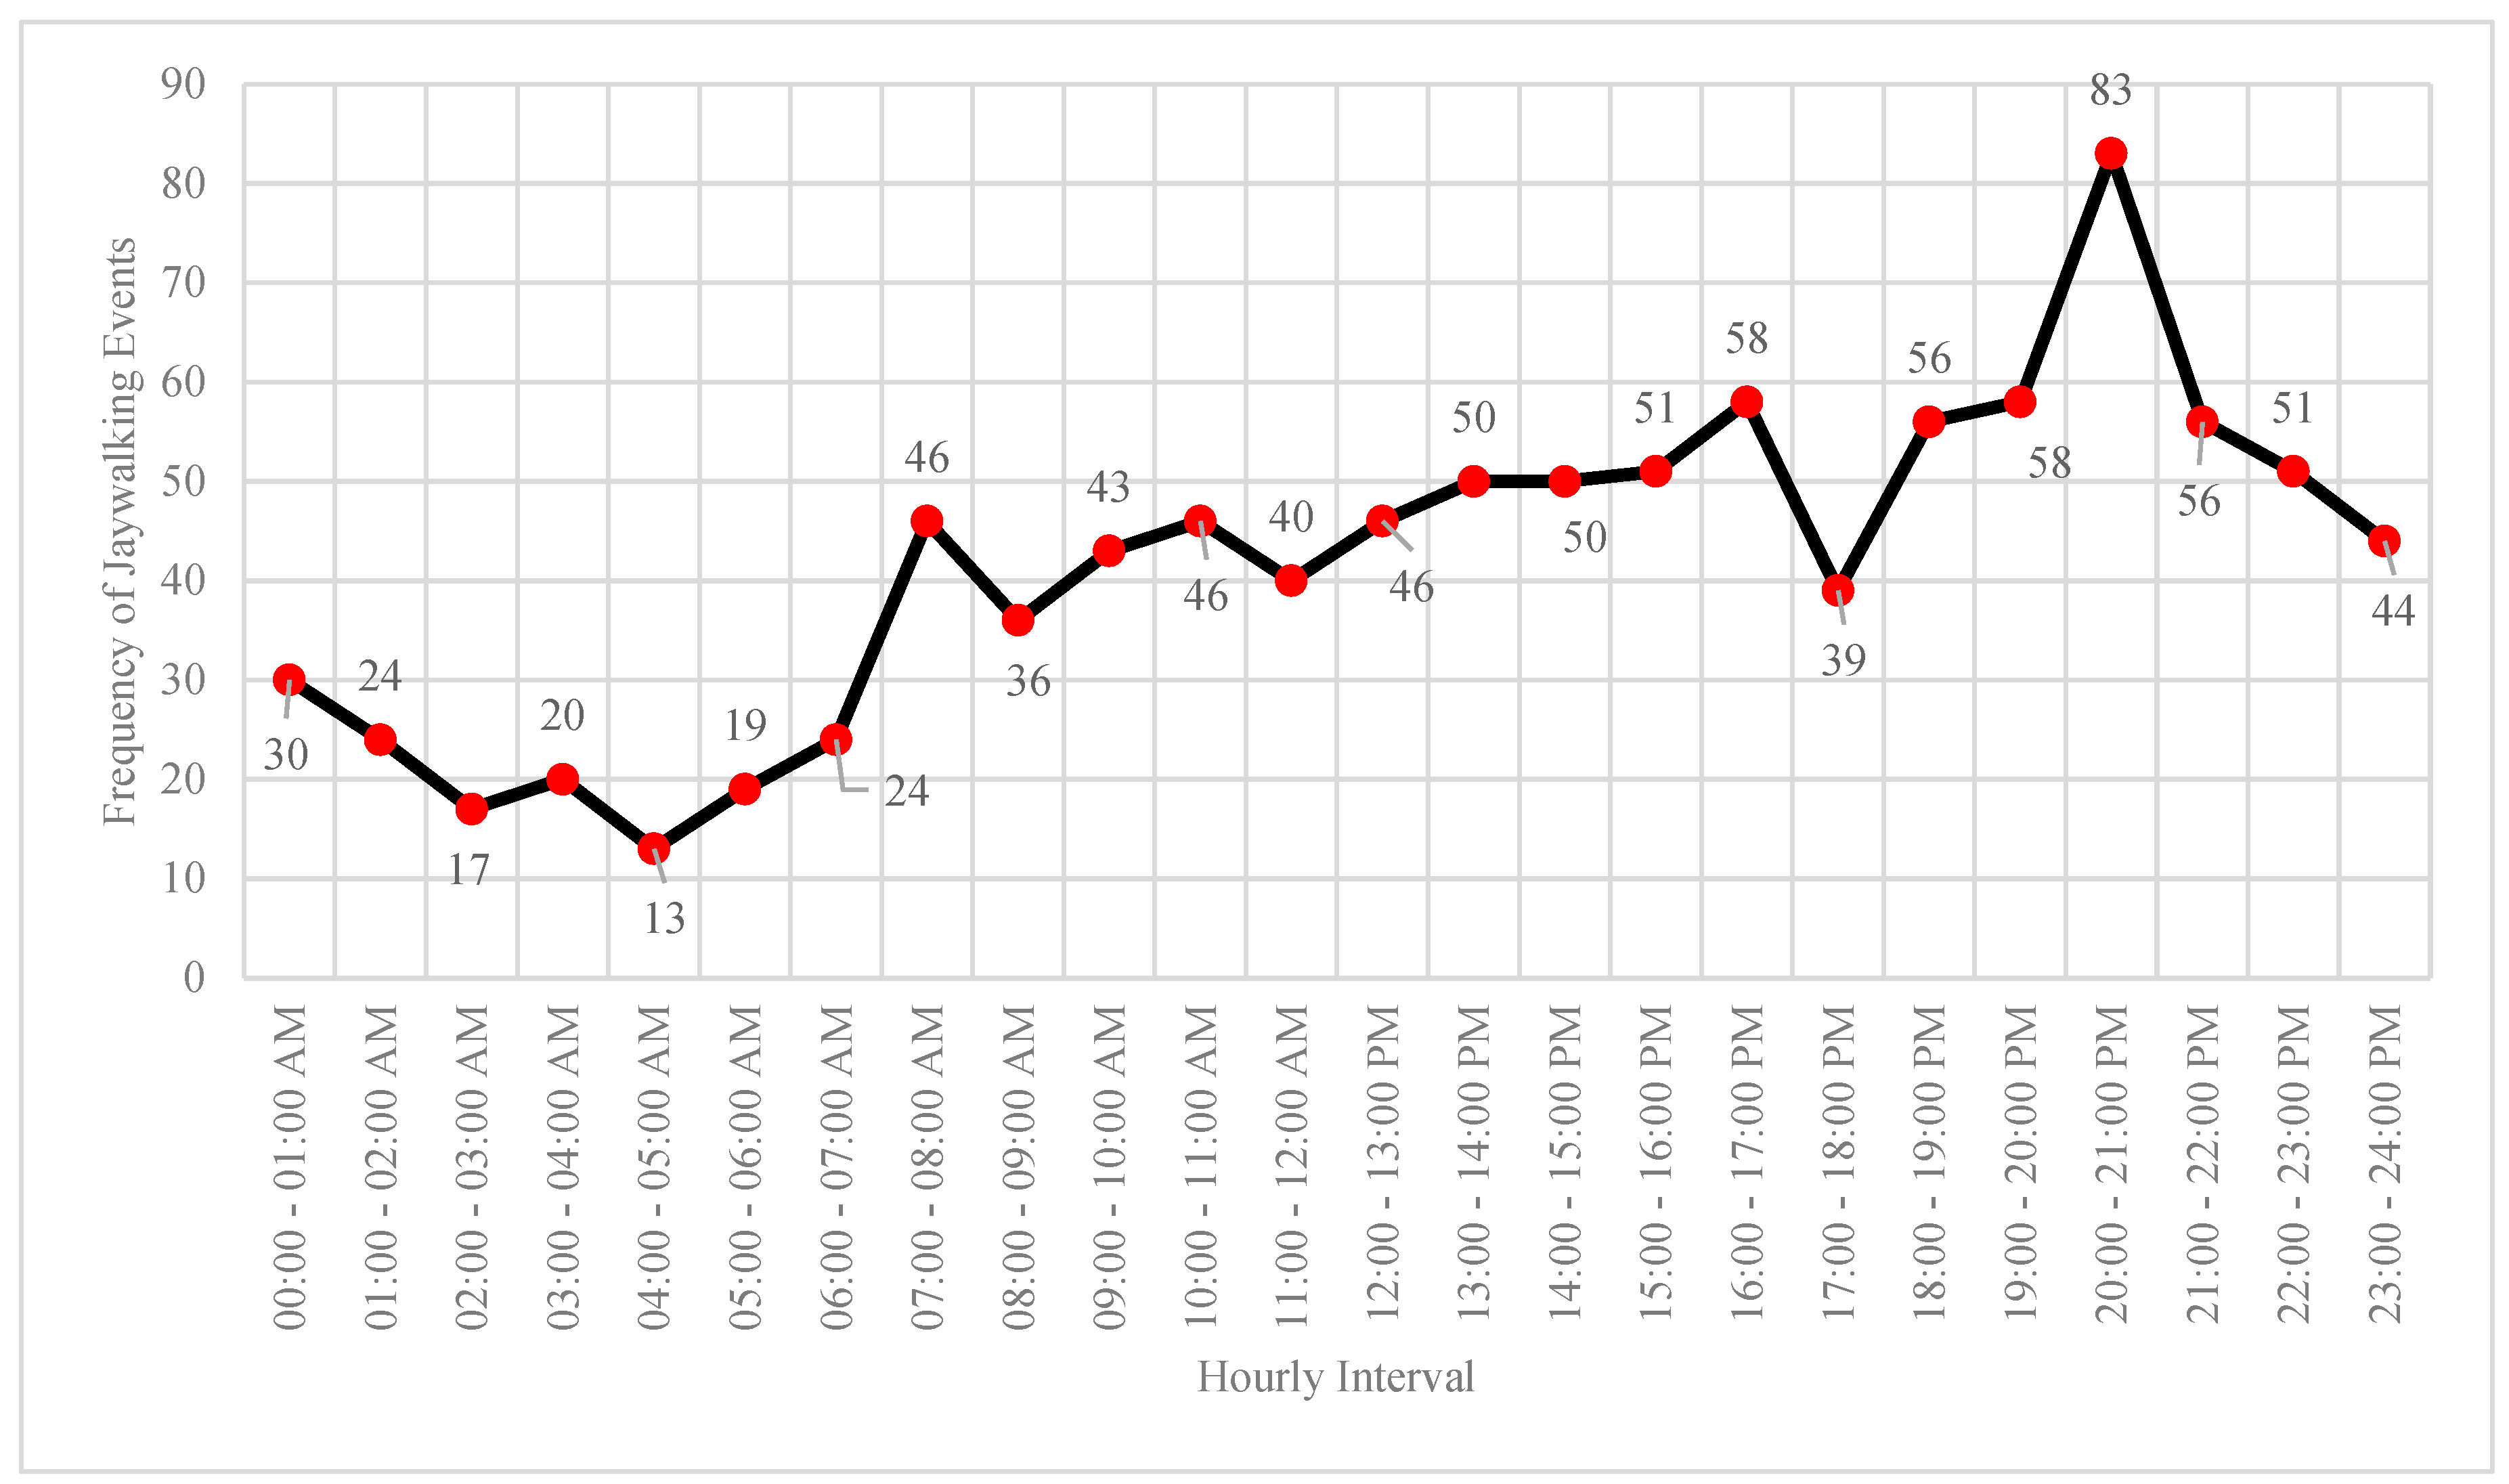
Figure 23.
Jaywalking Events Frequency based on the Jaywalking Duration.
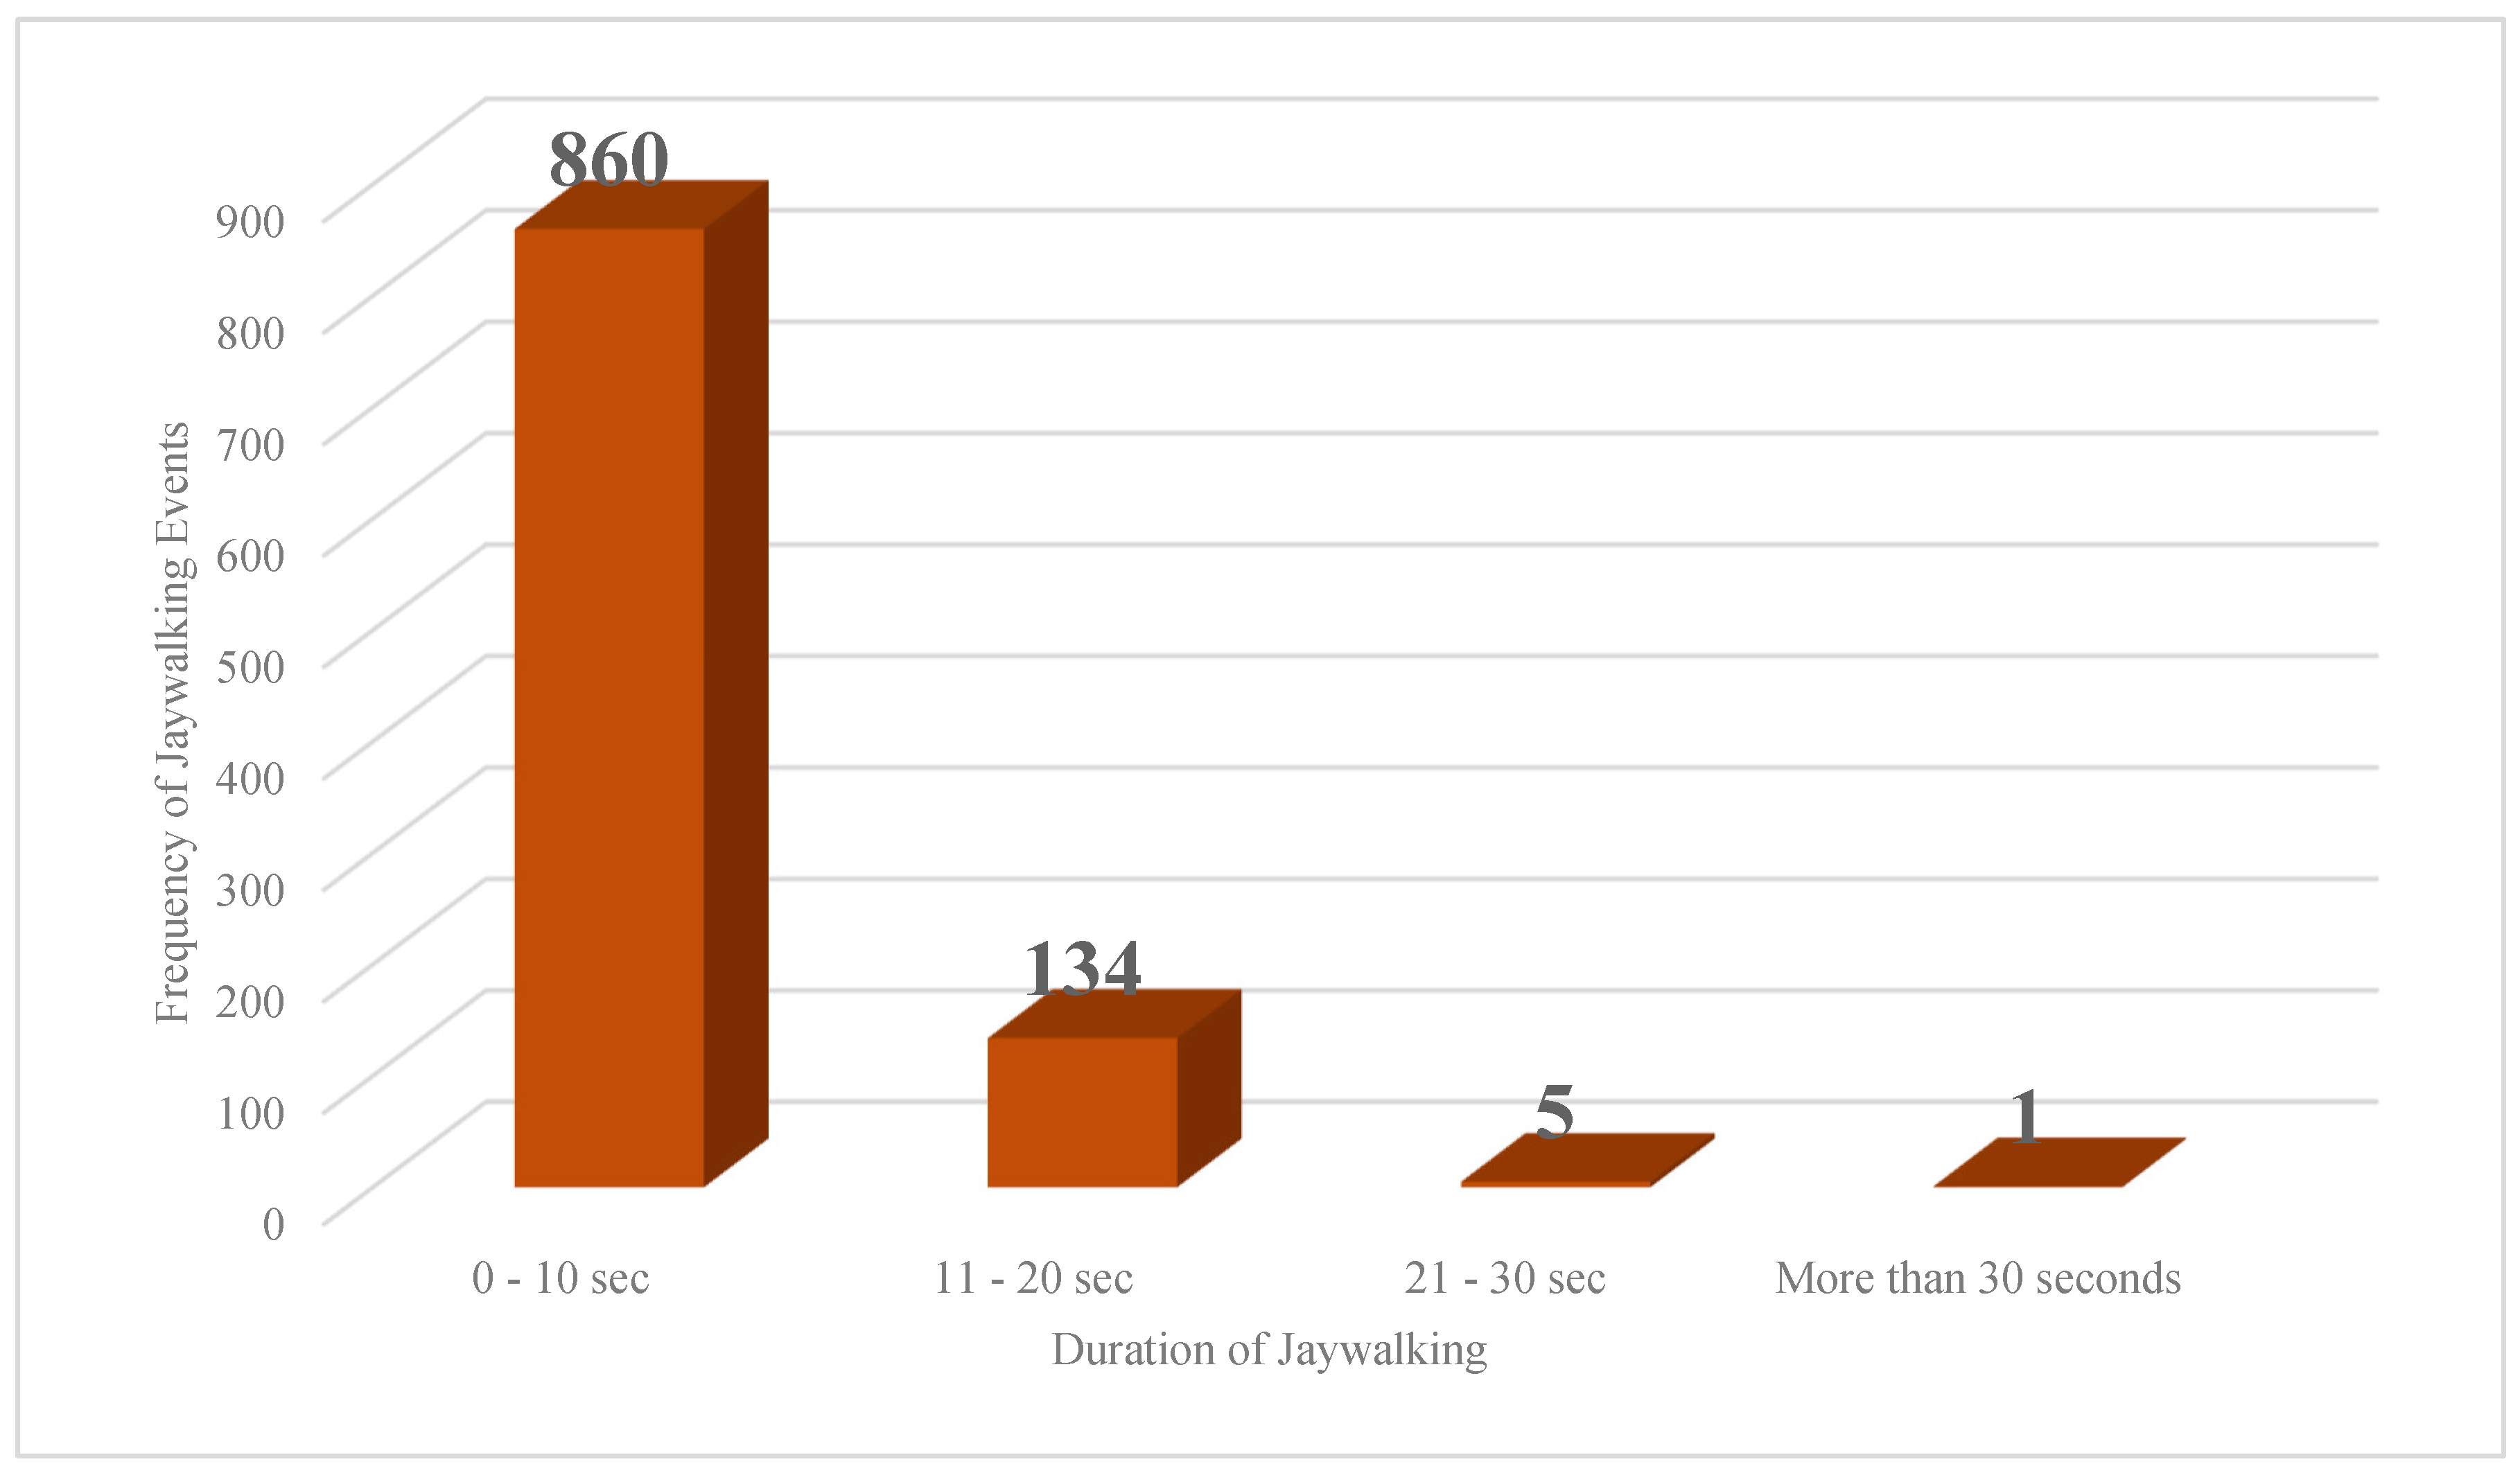
Figure 29.
Two Fatal Crashes Locations.
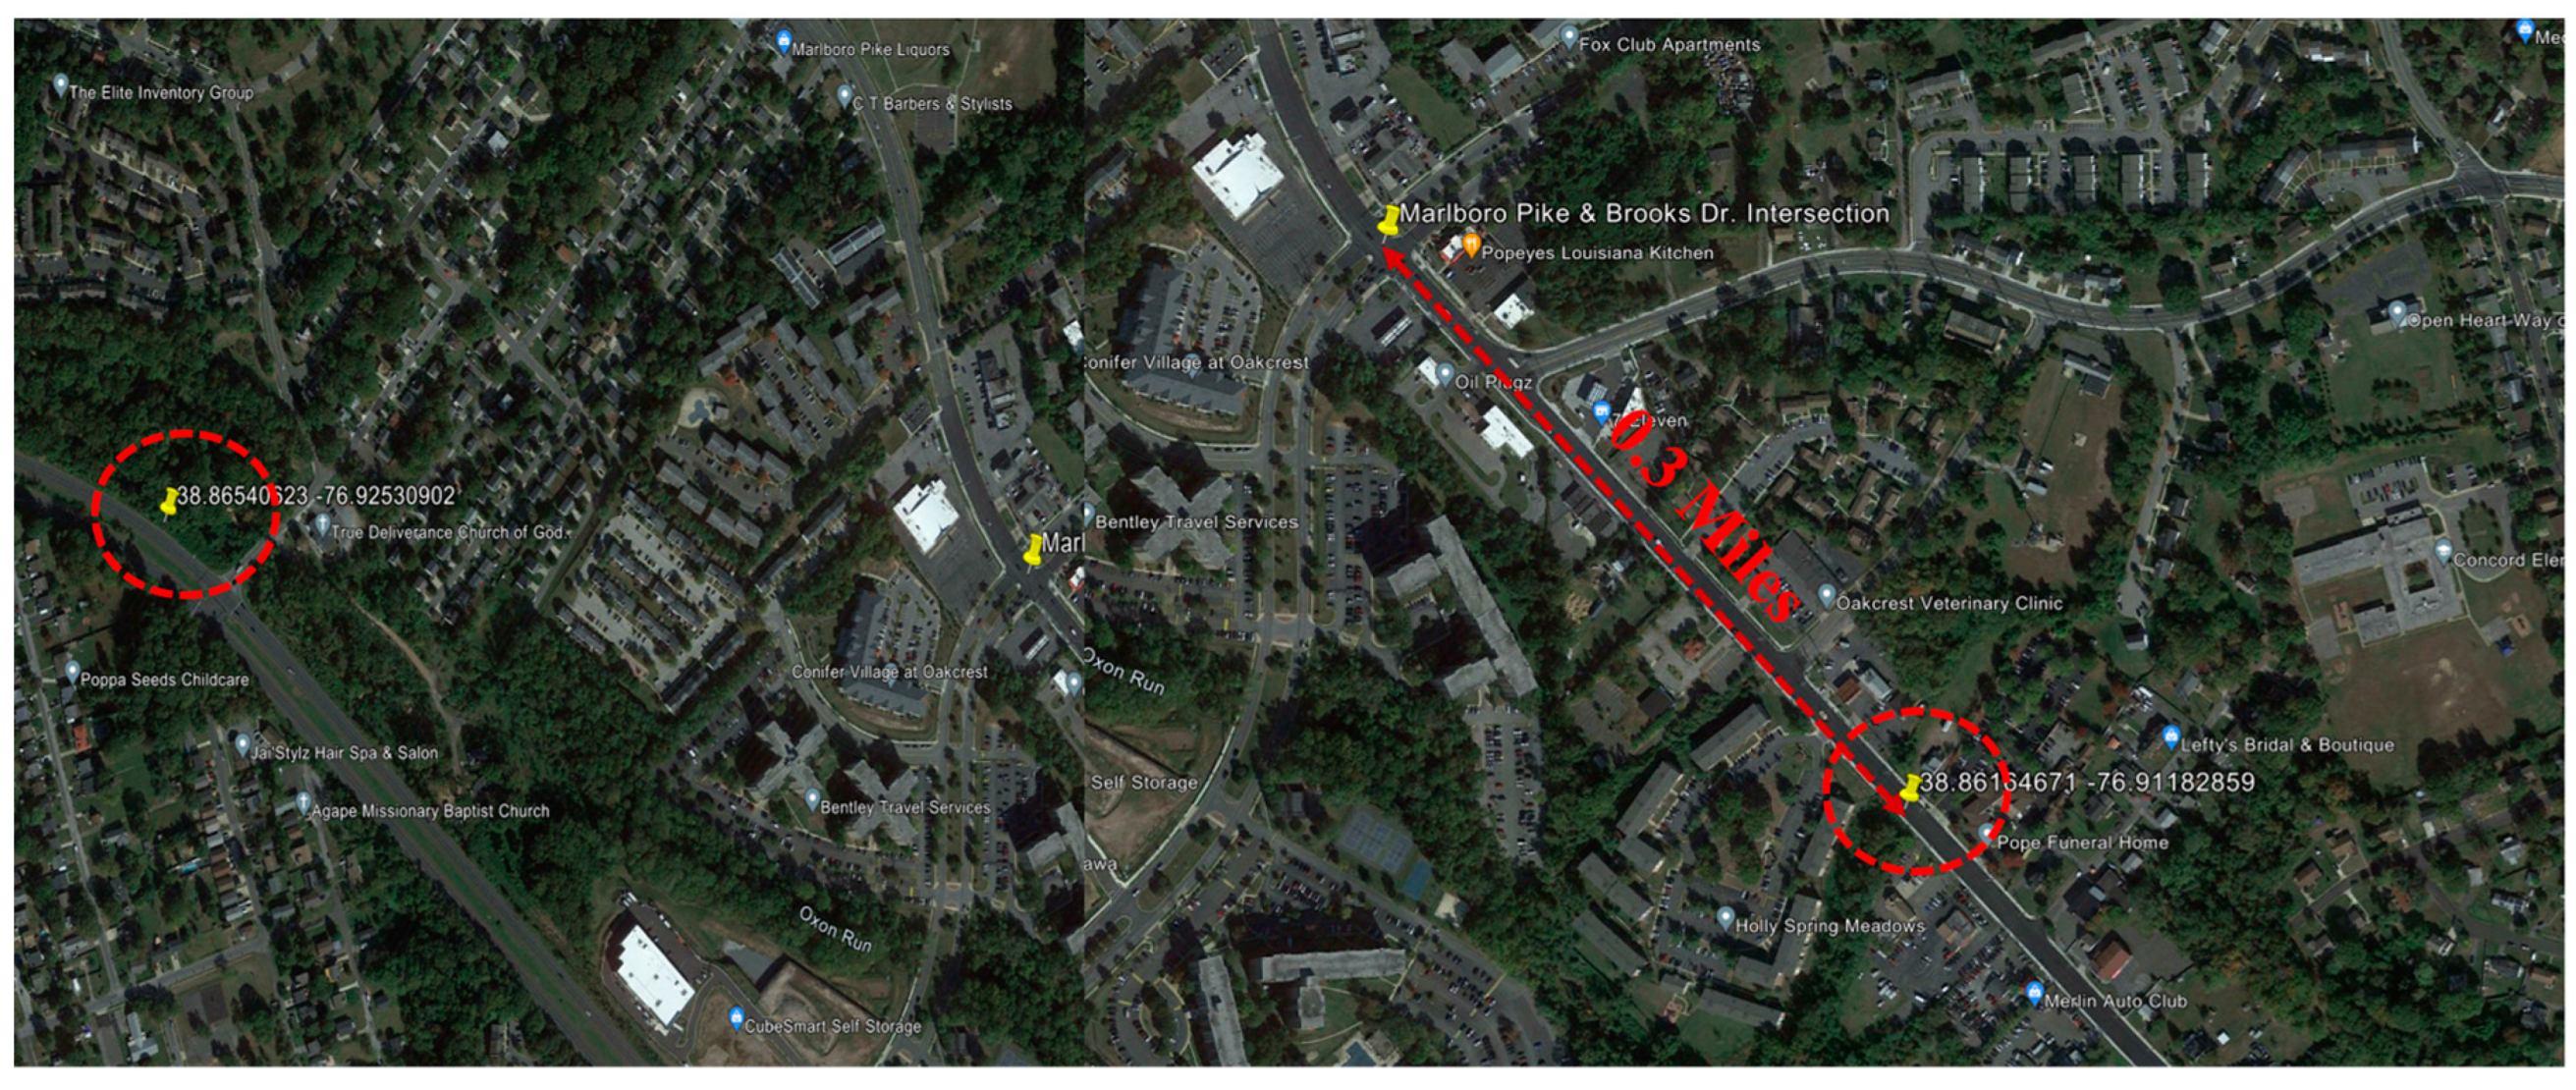
Figure 30.
Injury Crashes Locations.
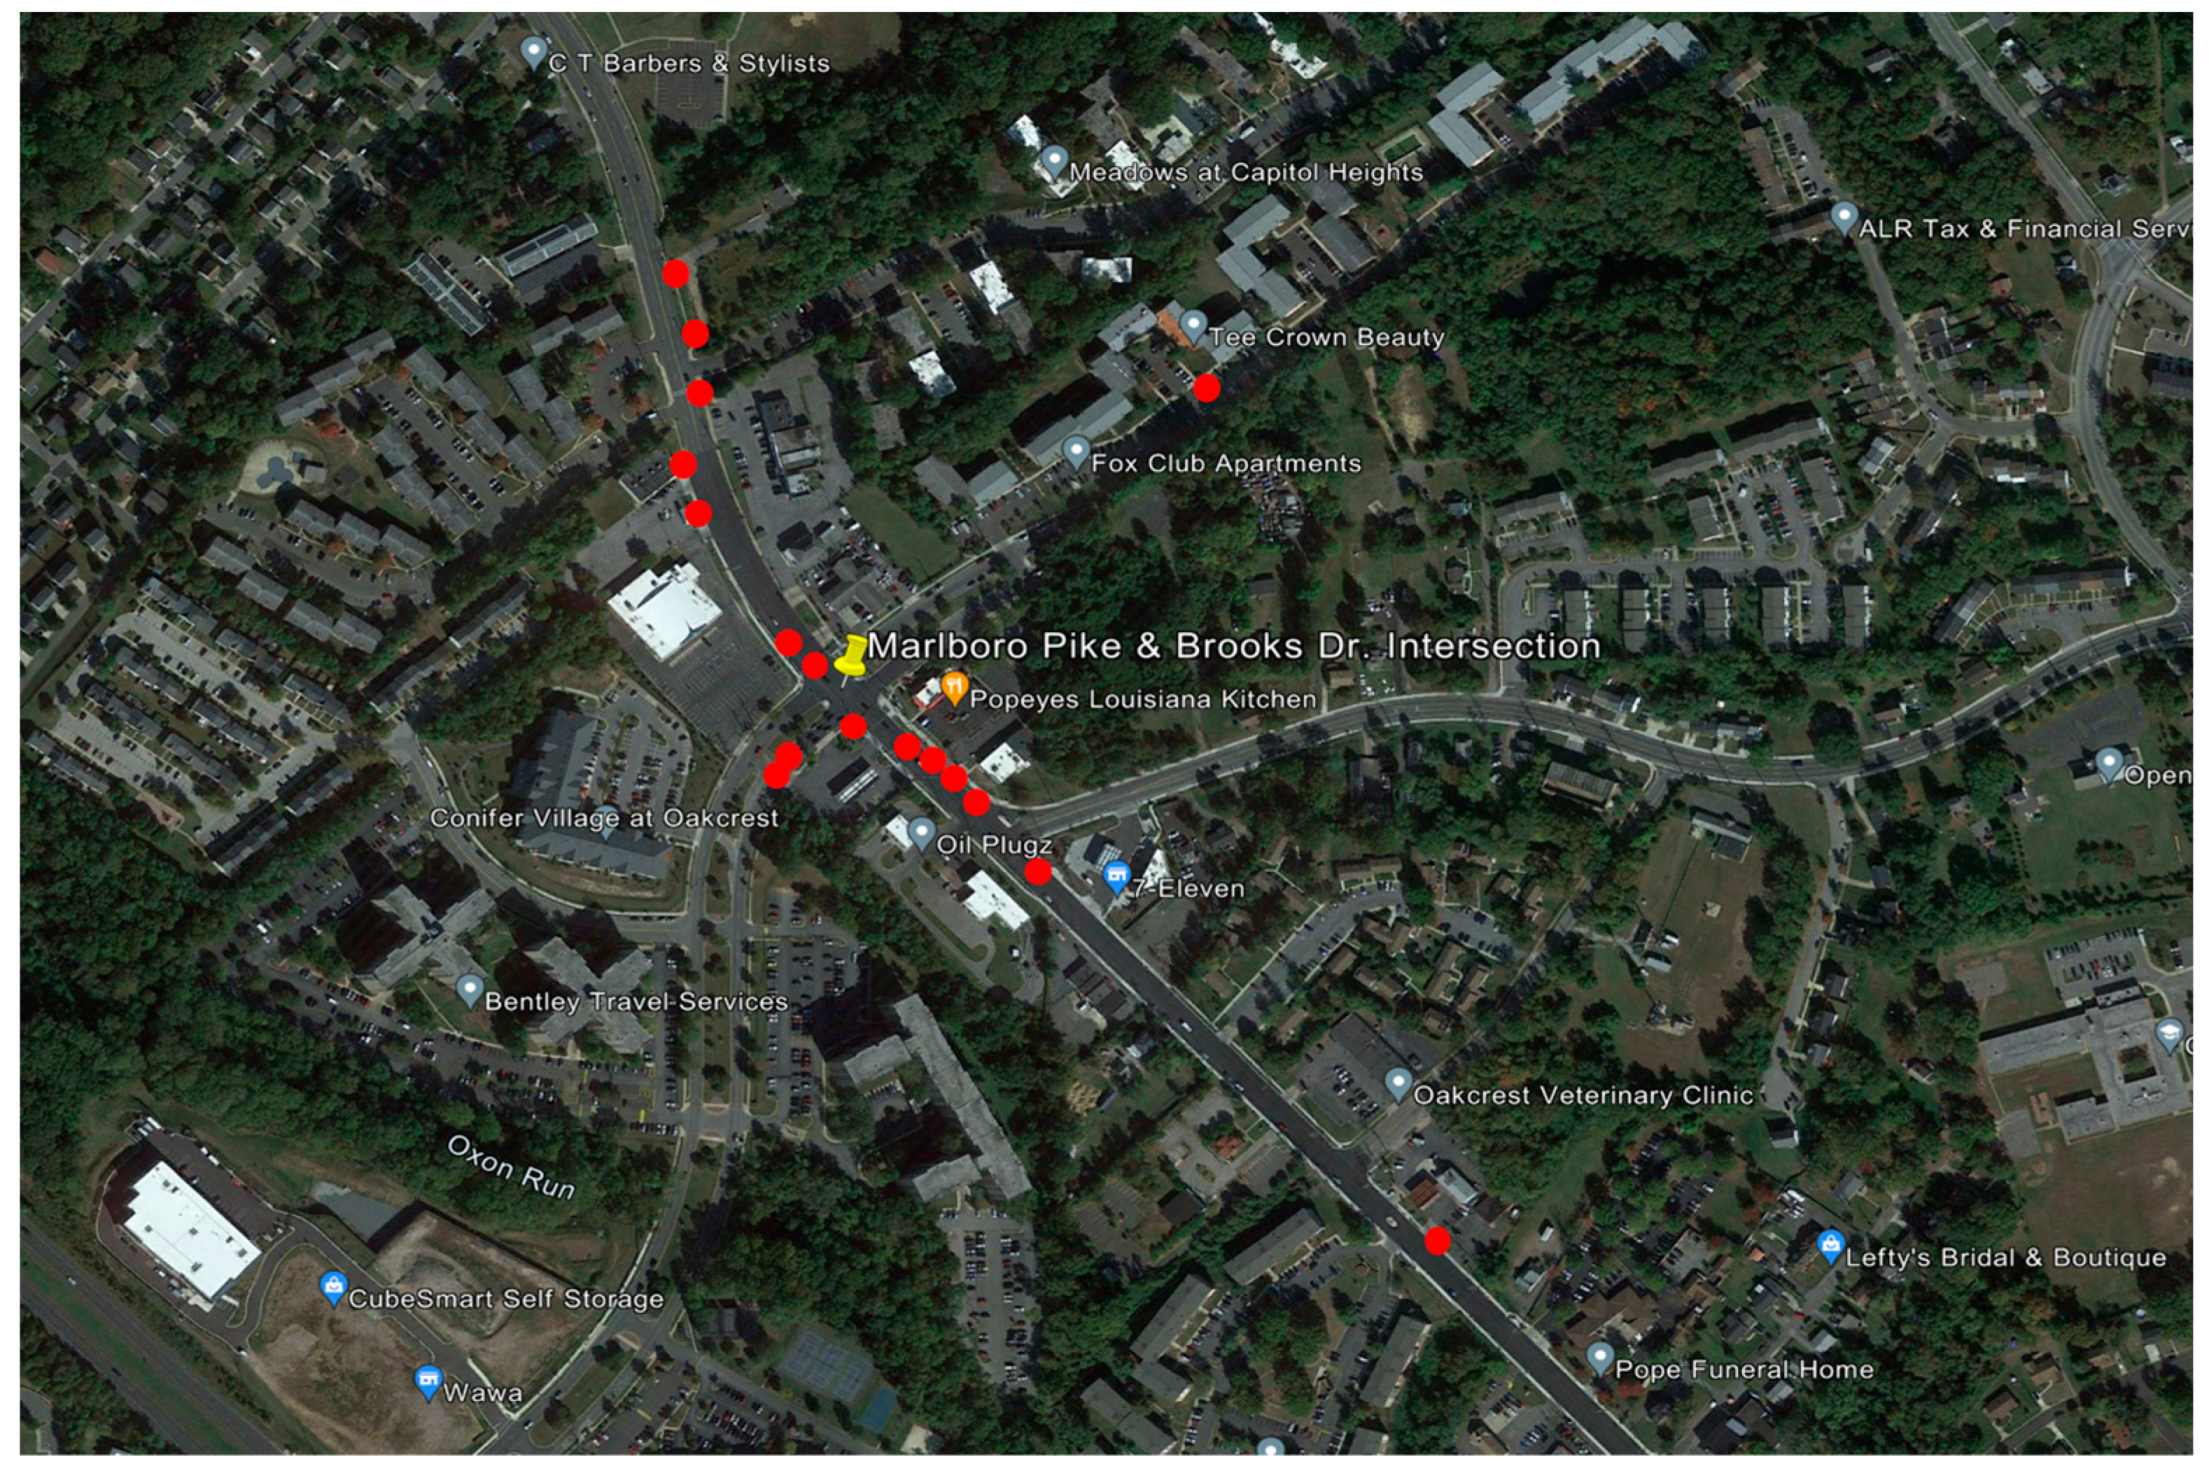
Figure 31.
Property Damage Crash Location.
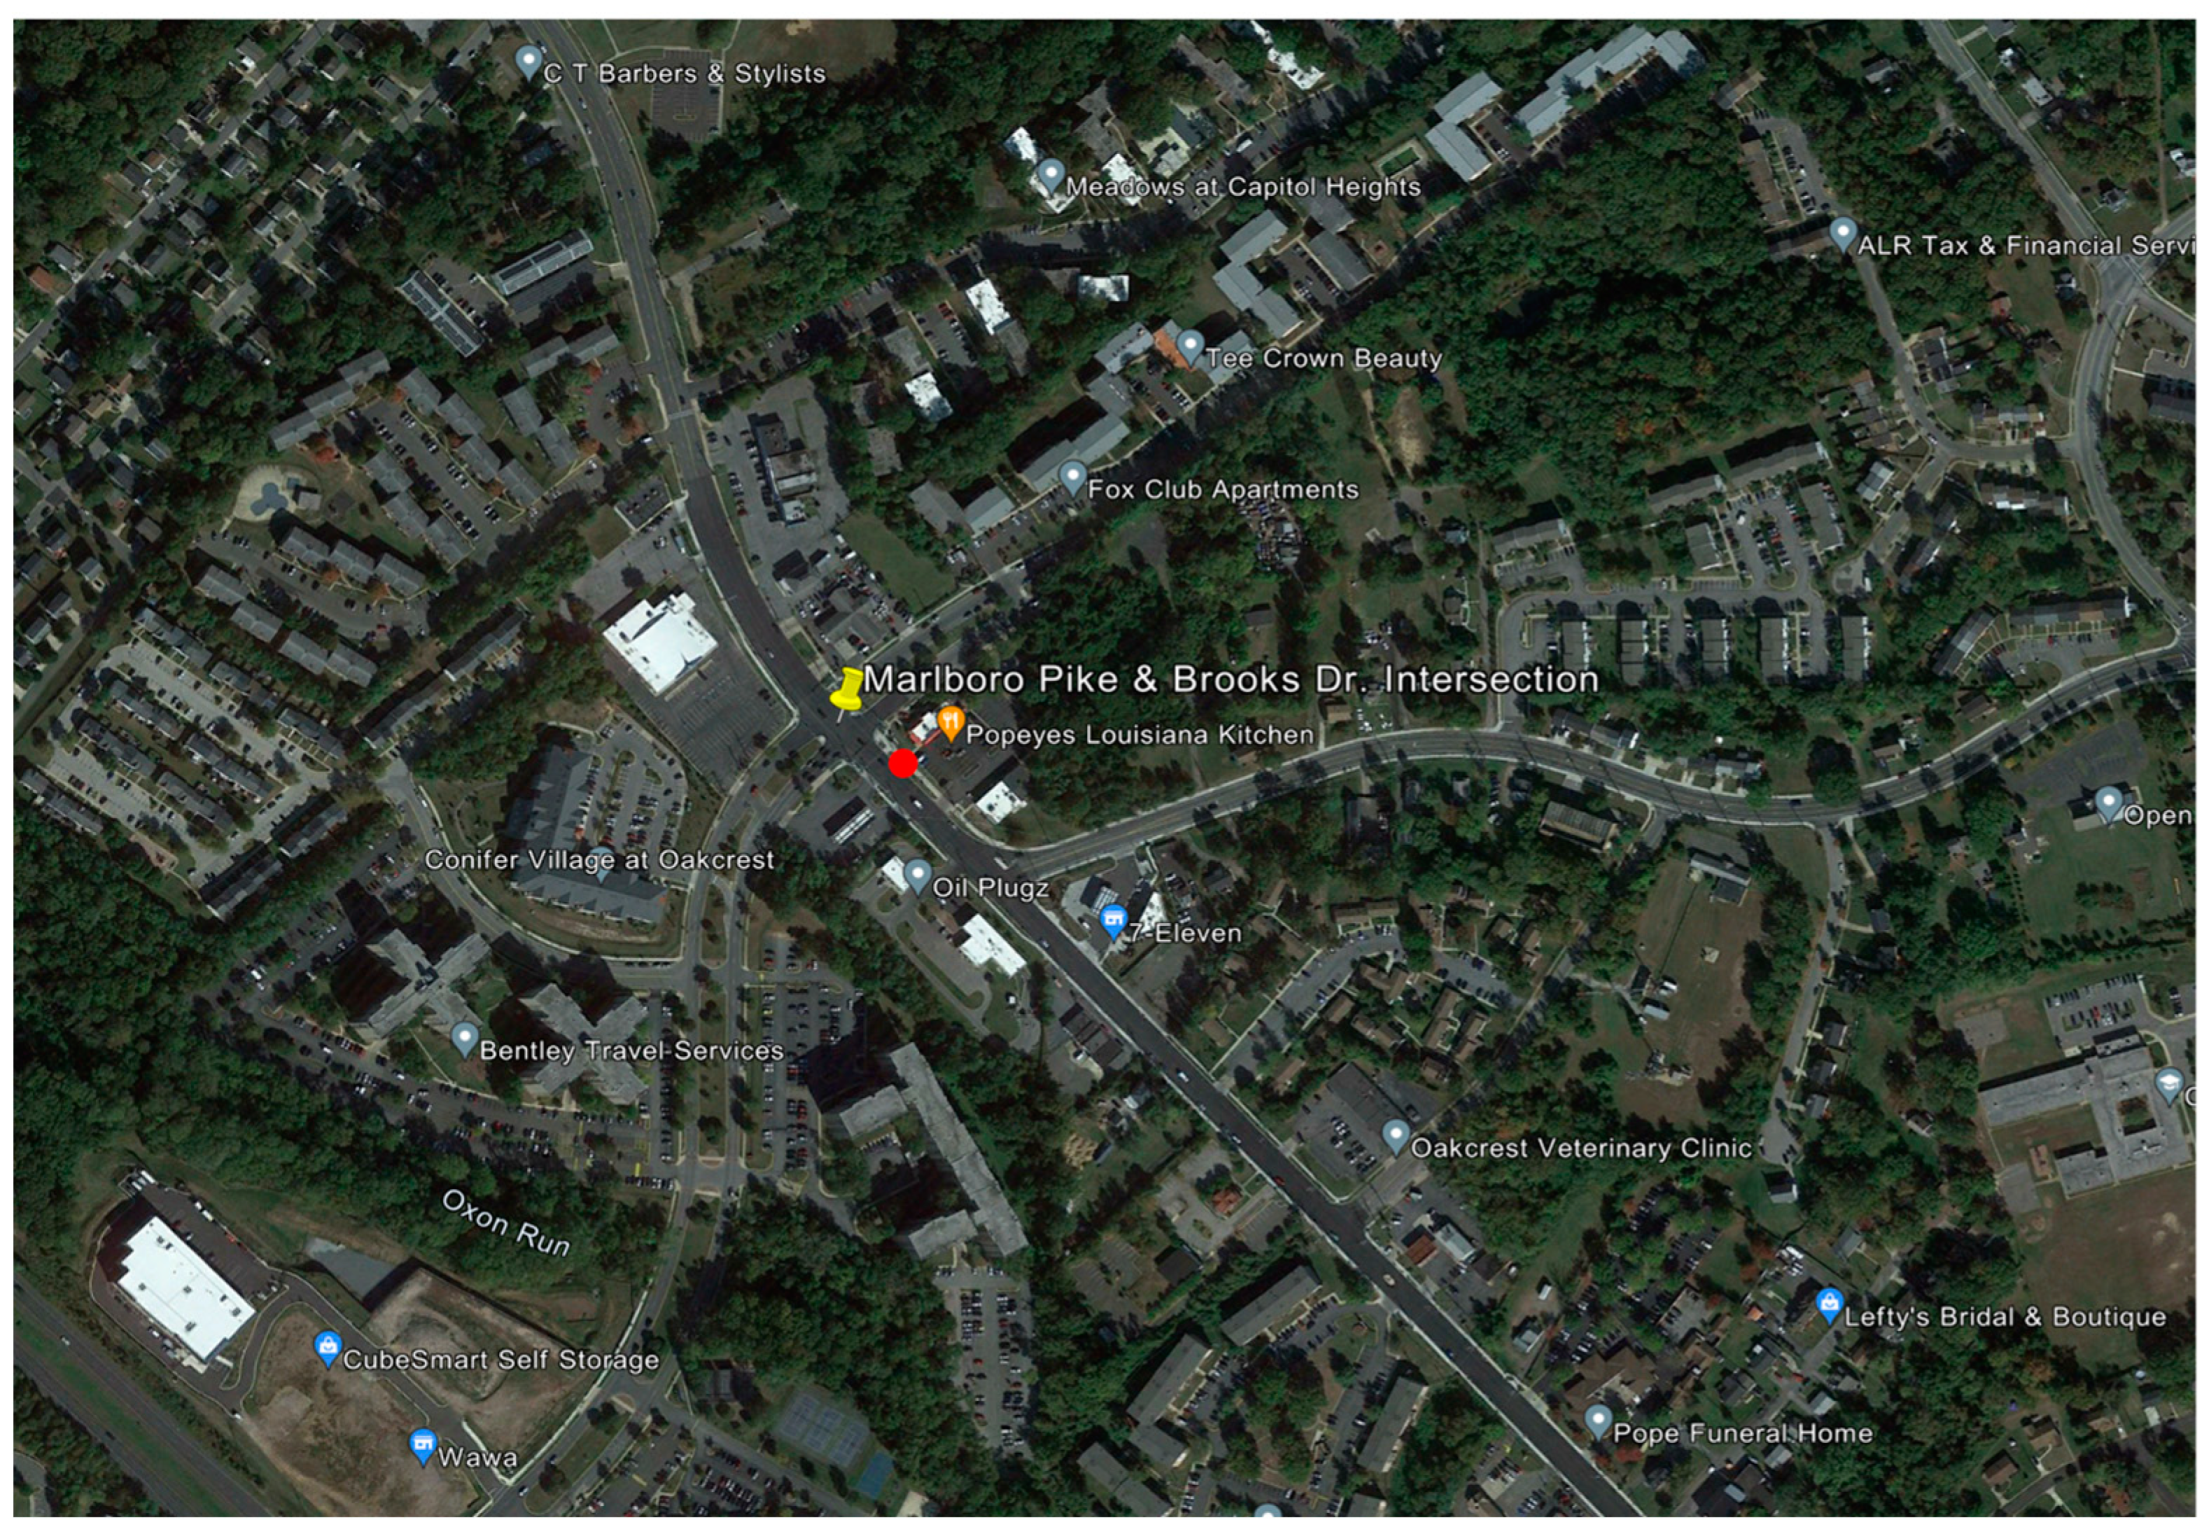

Table 1.
Serious Conflicts Analysis Results (PET <0.7).
| PET Value | 1/PET | Conflict's responsible object's speed (km/h) | Leading Movement | Following Movement | Leading Object Speed (km/h) | Following Object Speed (km/h) | Date |
| 0.5 | 2.0 | 51.1 | NS | WN | 51.1 | 11.5 | 06/07/2023 |
| 0.4 | 2.5 | 14.2 | WN | NE | 12.2 | 14.2 | 06/23/2023 |
| 0.3 | 3.3 | 20.1 | NS | SW | 15 | 20.1 | 06/23/2023 |
| 0.5 | 2.0 | 18.1 | WN | NS | 18.1 | 14.2 | 06/23/2023 |
| 0.6 | 1.6 | 21.3 | NS | SW | 21.3 | 11.2 | 06/24/2023 |
| 0.6 | 1.6 | 18 | ES | SN | 18 | 10.9 | 06/30/2023 |
| 0.5 | 2.0 | 14.9 | WN | NS | 14.9 | 13 | 06/30/2023 |
| 0.5 | 2.0 | 13.4 | EN | NS | 13.4 | 11.2 | 07/02/2023 |
| 0.6 | 1.6 | 15 | NS | EN | 13.2 | 15 | 07/02/2023 |
| 0.4 | 2.5 | 15.3 | WN | NS | 15.3 | 13.4 | 07/04/2023 |
Table 2.
Vehicle-Pedestrian Serious Conflicts (PET <0.7).
| PET Value |
Type of Conflict |
1/PET |
Speed (km/h) |
Leading Movement | Following Movement | Leading Object Speed (Km/h) | Following Object Speed (km/h) | Date |
| 0.4 | Serious Conflict | 2.500 | 15.4 | N/A | NS | 3.9 | 15.4 | 06/09/2023 |
| 0.3 | Serious Conflict | 3.333 | 10.4 | N/A | SE | 3.6 | 10.4 | 06/14/2023 |
| 0.3 | Serious Conflict | 3.333 | 13.7 | NW | N/A | 13.7 | 5.6 | 06/23/2023 |
| 0.5 | Serious Conflict | 2.000 | 11.7 | EW | N/A | 11.7 | 4.5 | 06/23/2023 |
| 0.3 | Serious Conflict | 3.333 | 16.5 | ES | N/A | 16.5 | 2.8 | 07/05/2023 |
Table 3.
Vehicle-Pedestrian General Conflicts (0.7 < PET < 1.31).
| PET Value | 1/PET | Leading Movement | Following Movement | Leading Object Speed (km/h) | Following Object Speed (km/h) | Date |
| 1.1 | 0.909 | SN | N/A | 22.5 | 5.9 | 06/02/2023 |
| 1.1 | 0.909 | NW | N/A | 10.1 | 2.3 | 06/02/2023 |
| 1.1 | 0.909 | SN | N/A | 23.3 | 3.2 | 06/03/2023 |
| 0.8 | 1.250 | WN | N/A | 12.4 | 4.3 | 06/04/2023 |
| 1.2 | 0.833 | WS | N/A | 10.6 | 2.9 | 06/04/2023 |
| 1.3 | 0.769 | SN | N/A | 17.8 | 2.4 | 06/04/2023 |
| 1.2 | 0.833 | WS | N/A | 14.5 | 6.4 | 06/04/2023 |
| 1.3 | 0.769 | SW | N/A | 15.4 | 6.2 | 06/05/2023 |
| 1.1 | 0.909 | WN | N/A | 12.6 | 2.3 | 06/06/2023 |
| 1.3 | 0.769 | ES | N/A | 11.8 | 2.8 | 06/09/2023 |
| 1 | 1.000 | WN | N/A | 13.4 | 2.2 | 06/09/2023 |
| 1.3 | 0.769 | WS | N/A | 12 | 2.8 | 06/11/2023 |
| 1.3 | 0.769 | WN | N/A | 16.9 | 2.3 | 06/11/2023 |
| 1.1 | 0.909 | WS | N/A | 11.4 | 3.3 | 06/13/2023 |
| 1.1 | 0.909 | WS | N/A | 17.3 | 4.1 | 06/13/2023 |
| 1.3 | 0.769 | NE | N/A | 12.3 | 2.3 | 06/13/2023 |
| 1.2 | 0.833 | NS | N/A | 13.8 | 4.3 | 06/14/2023 |
| 1.1 | 0.909 | ES | N/A | 10 | 3.9 | 06/15/2023 |
| 1.2 | 0.833 | NW | N/A | 18.7 | 4.2 | 06/16/2023 |
| 1.3 | 0.769 | NW | N/A | 10.5 | 4.3 | 06/22/2023 |
| 0.8 | 1.250 | N/A | EW | 2.1 | 17.5 | 06/23/2023 |
| 1.3 | 0.769 | NS | N/A | 21.6 | 2.8 | 06/24/2023 |
| 1 | 1.000 | SN | N/A | 25.9 | 6.2 | 06/24/2023 |
| 1.3 | 0.769 | WN | N/A | 13.1 | 3.2 | 06/24/2023 |
| 1 | 1.000 | SN | N/A | 16.3 | 8 | 06/25/2023 |
| 1.3 | 0.769 | NS | N/A | 27.8 | 6.2 | 06/25/2023 |
| 1.3 | 0.769 | SN | N/A | 14.2 | 2.6 | 06/25/2023 |
| 1.3 | 0.769 | NW | N/A | 43.7 | 3.4 | 06/25/2023 |
| 1.3 | 0.769 | EN | N/A | 11.7 | 2.6 | 06/25/2023 |
| 1.3 | 0.769 | WE | N/A | 18.5 | 4 | 06/25/2023 |
| 0.9 | 1.111 | SN | N/A | 23.6 | 7.7 | 06/25/2023 |
| 0.8 | 1.250 | EN | N/A | 14.3 | 4 | 06/26/2023 |
| 1 | 1.000 | WS | N/A | 10.4 | 4.5 | 06/27/2023 |
| 1.2 | 0.833 | WS | N/A | 11 | 3.3 | 06/28/2023 |
| 1.2 | 0.833 | EN | N/A | 19.2 | 2.5 | 06/28/2023 |
| 1.3 | 0.769 | NW | N/A | 11.6 | 3.3 | 06/28/2023 |
| 1.3 | 0.769 | NW | N/A | 11.8 | 5.5 | 06/30/2023 |
| 0.9 | 1.111 | N/A | EW | 3.1 | 13.3 | 06/30/2023 |
| 1.3 | 0.769 | WN | N/A | 10.2 | 3.1 | 07/03/2023 |
Table 4.
General Conflicts – Critical Movements.
| Movement | Leading or Following | Frequency | Severity (1/PET) |
| EN | Leading Object | 3 | 2.852 |
| ES | Leading Object | 2 | 1.678 |
| NE | Leading Object | 1 | 0.769 |
| NS | Leading Object | 3 | 2.371 |
| NW | Leading Object | 6 | 4.818 |
| SN | Leading Object | 7 | 6.467 |
| SW | Leading Object | 1 | 0.769 |
| WE | Leading Object | 1 | 0.769 |
| WN | Leading Object | 6 | 5.466 |
| WS | Leading Object | 7 | 6.086 |
| EW | Following Object | 2 | 2.361 |
Disclaimer/Publisher’s Note: The statements, opinions and data contained in all publications are solely those of the individual author(s) and contributor(s) and not of MDPI and/or the editor(s). MDPI and/or the editor(s) disclaim responsibility for any injury to people or property resulting from any ideas, methods, instructions or products referred to in the content. |
© 2023 by the authors. Licensee MDPI, Basel, Switzerland. This article is an open access article distributed under the terms and conditions of the Creative Commons Attribution (CC BY) license (http://creativecommons.org/licenses/by/4.0/).
Copyright: This open access article is published under a Creative Commons CC BY 4.0 license, which permit the free download, distribution, and reuse, provided that the author and preprint are cited in any reuse.


