Submitted:
05 April 2024
Posted:
08 April 2024
You are already at the latest version
Abstract
In higher education, the cultivation of research competency is pivotal for students’ critical thinking development and their subsequent transition into the professional workforce. While statistics plays a fundamental role in supporting the completion of a research project, it is often perceived as challenging, particularly by students in majors outside mathematics or statistics. The connection between students’ statistical proficiency and their research competency remains unexplored despite its significance. To address this gap, we utilized the supervised machine learning approach to predict students’ research competency, as represented by their performance in a research methods class, with predictors of students’ proficiency in statistical topics. Predictors relating to students’ learning behavior in a statistics course such as assignment completion and academic dishonesty are also included as auxiliary variables. Results indicate that the three primary categories of statistical skills—namely, understanding of statistical concepts, proficiency in selecting appropriate statistical methods, and statistics interpretation skills— can be used to predict students’ research competency, as demonstrated by their final course scores and letter grades. This study advocates for strategic emphasis on the identified influential topics to enhance efficiency in developing students’ research competency. Findings could inform instructors in adopting a strategic approach to teaching the statistical component of research for enhanced efficiency.
Keywords:
research competency
; statistics
; supervised machine learning
1. Background of the Study
In higher education programs, the development of research competency is a major milestone in students’ curriculum due to its potential to instill critical thinking and transition students into the professional workforce [1]. A pivotal aspect of research competency development lies in statistics, given its fundamental role in analyzing data to support research findings [2]. For example, researchers need descriptive statistics to summarize characteristics of the data, while inferential statistics makes inferences of the population from the sample at hand to test hypotheses and answer research questions [2,3]. At a more advanced level, structural equation modeling (SEM), a multivariate statistical technique, is often utilized to examine relationships between variables of interest [4]. Despite its significance, statistics components are often perceived as challenging by students [5]. This difficulty is attributed to the mathematical components inherent in statistics, which might pose comprehension challenges compared to content that focuses on facts and ideas [6,7].
In fact, a considerable number of students who learn statistics belong to majors outside mathematics or statistics, such as political science or psychology [8]. The challenges faced by these students in statistics courses could induce subject-related anxiety, highlighting the struggle in grasping statistical concepts [5,9]. It is established that students’ proficiency in statistics, as represented by their formative assessment scores, can determine their overall performance in the statistics course [9,10]. However, whether students’ statistical proficiency can predict their research competency, as reflected by their final scores in a research methods course, has yet to be examined. In response to this gap, we performed an investigation to identify specific statistical topics that can predict students’ final course grades in a research methods course. This investigation seeks to identify areas of importance, providing a foundation for a strategic approach to emphasize and refine relevant topics in the statistics course.
To fulfill the aim of our research, we employed a supervised machine learning model to identify influential predictors of students’ performance in a research method class. The overarching research question is: " How is the predictability of skills in statistics to students’ research competency?” The predictor variables are students’ formative scores in each topic from a statistics course, as well as their learning behavior in the statistics course as auxiliary variables. The outcome variable is students’ learning performance in the research method class. Results from the analysis include a predictive regression model for students’ final course score in a research method course, a predictive classification model for students’ success in the research method course, and lists of important predictors to the targeted variable as well as their influence on the prediction. While predicting students’ statistical competency is more directly related to the predictors, predicting students’ research competency may allow us to extrapolate the results to examine how well students can practically apply statistical concepts to real-world research scenarios, especially in research-oriented professions [11].
Instead of relying on traditional statistical analysis for retrospective inference, we employed a machine learning approach to predict students’ research competency. This approach offers an algorithm and predictors as a guideline to inform instructors in developing their course designs on the research methods topics [12]. Furthermore, this study contributes to the body of knowledge by identifying topics in statistics that are crucial in determining students’ research competency. Ideally, instructors should ensure that students understand every topic of the course material. However, it is impractical to deliver the entire course content at a detailed yet slow pace, considering the time limit of a standard program. Such a program typically allows a maximum of three teaching hours per day over a 16-week semester [13]. This research could highlight the topics in statistics that need more emphasis to increase efficiency in developing students’ research competency. By investing time and resources into enhancing the accessibility of these topics, instructors could enhance students’ background knowledge in statistics and consequently their competency in the research methods course.
2. Literature Review
2.1. Foundations of Research Competency in Higher Education
Based on the Researcher skill development framework (RSD), research competency is defined as the ability to formulate or respond to a research question, employing rigorous methodologies, and effectively disseminating findings to various audiences [14]. The RSD framework comprises six aspects that contribute to research competency: purpose, data acquisition, credibility evaluation, data organization, knowledge synthesis, and findings dissemination. Although the RSD framework primarily focuses on skills, we argue that its aspects can also be construed as constituting components to research competency. This is because the six components align with the definition of competency, which is the ability to produce observable performance, possess knowledge, and adherence to standards in executing successful research [14,15]. Many higher education programs aim to develop research competency in students to foster critical thinking, enabling students to contribute new knowledge to the academic community [1,16]. In fact, research methods courses at the university level often mandate extensive prerequisite courses for senior students, ensuring that they can translate theoretical knowledge into practical applications through research [17].
The six aspects of research competency outlined in the RSD framework align with the typical components of a research design, which involve background of the topics under investigation, literature review, methods of data collection and analysis, and findings interpretations [2]. These elements enable researchers to identify issues within a chosen topic, formulate research questions, collect pertinent data, and draw conclusions from the analysis results [3]. Students’ mastery of these components is often evaluated through a research project, underscoring that research competency is a skill cultivated through practical experience [2,17]. Such a skill can be represented by their final course scores in a research method course. Developing this competency equips students to integrate the research process mindset into their professional practice, enhancing their effectiveness in addressing challenges in their future careers or advanced academic pursuits [1]. The transferable skills derived from research, such as critical thinking, data analysis, and information organization, can enhance students’ preparedness for a transition to the professional workforce [18].
2.2. The Role of Statistics in Developing Research Competency: Components and Challenges
Within the components of a quantitative research design, statistics serve as a critical link between the research question and the conclusions, playing an instrumental role in developing students’ research competency, particularly in data acquisition, credibility evaluation, data organization, knowledge synthesis, and findings dissemination (5 out of 6) [14]. In the aspect of data acquisition, statistics aids in determining an appropriate sample size through power analysis, estimating the smallest sample size necessary to achieve the required statistical power for hypothesis testing in an experiment [19]. During credibility evaluation, confirmatory factor analysis, a technique within SEM, assesses the quality of data collection instruments, ensuring alignment between the theoretical structure and empirical data gathered from the pilot study phase [4]. In the data organization aspect, descriptive statistics, such as central tendency analysis and data distribution summaries, reveal patterns that may be unavailable through mere observations [19]. In the knowledge synthesis, inferential statistics, like independent/dependent sample t-tests or analysis of variance (ANOVA), test research hypotheses, examining statistical significance and effect size [2,19]. Lastly, in findings dissemination, data visualization is crucial for conveying results in an easily understood manner, showcasing the significance of the knowledge in statistics on key metrics that should be reported [20]. These instances underscore the pivotal role of statistics in shaping students’ research competency.
However, students in higher education, especially those outside mathematics or statistics majors, find statistics difficult to grasp; this struggle could hinder the development of their research competency, given the pivotal role of statistics in this context [5,21]. Specifically, the concepts, rules, and formulas in statistics can be both complex and counter intuitive, discouraging students and inducing anxiety during exams [5,21]. Some students did not achieve learning at the conceptual level as they merely memorized rules and formulas; this learning approach could make their learning less effective [21]. This problem is exacerbated by the fact that some statistics classes are large, making it impractical for instructors to engage students in hands-on projects at the process level [22]. Additionally, students with limited experience in statistics may feel nervous in their practice due to the disorganization of the real-world data that requires skills to handle [21]. To address these challenges, instructors can offer opportunities for students to develop statistical thinking skills through project-based learning, supplemented by innovative teaching materials like web-based platforms for simulating statistical problems [21,22]. However, this solution is more viable in small classes where instructors can provide individualized supervision. In larger classes, covering each student comprehensively becomes impractical. While emphasizing important topics for efficiency is a potential approach, the literature lacks clarity on which statistical topics significantly influence students’ research competency, highlighting a critical gap that necessitates investigation for a deeper understanding of students’ overall research skills development.
3. Current Study
To answer the research question of “How is the predictability of skills in statistics to students’ research competency?”, this study utilized predictors comprising students’ performance in key statistical areas from a statistics course such as analysis methods selection or output interpretation, as well as their learning behavior in the course. These predictors were used to predict students’ research competency as indicated by their learning performance in a research methods course. The study undertook both regression and classification tasks: the former predicted students’ final course scores, while the latter predicted their course success, defined as achieving over 80% of the total course score - equivalent to a grade of B or higher. We also incorporated students’ background variables such as time taken to complete the assignment and cheating behavior in statistics assessments to examine the influence of students’ learning behavior in their statistics class in addition to their statistics skills. Both regression and classification algorithms were fine-tuned for optimal performance and evaluated using metrics appropriate to their respective tasks. Findings of this study offer insights into statistical topics that are influential to students’ research competency, which could inform the development of higher education curriculum.
4. Methods
4.1. Dataset, Feature selection, and Data Preprocessing
The dataset utilized in this study encompasses undergraduate students’ profiles from both a statistics course and a research methods course at a Thai university, totaling N = 385 participants. Data preprocessing and predictive model development primarily relied on the R programming language [23]. The variables of interest were derived as by products of student assessment performance across their university study. Assessments were conducted in Thai, the official language and medium of instruction at the university. Table 1 describes a list of variables utilized in this study and their code. The dataset utilized in this study is classified as secondary data due to its its anonymity to the primary researchers. This ensures minimal ethical concerns as there exists no feasible method for re-identifying the participants.
For feature selection, statistics topics were categorized into three main categories: 1. Interpretation, which includes topics involved in translating and summarizing the analysis results from data (i.e., describing the data distribution, analyzing the relationship between variables using statistical measures and data visualizations, and interpreting results from hypothesis testing such as t-test or ANOVA. 2. Concept, comprising topics involving essential theories and principles of statistical methods such as sampling distributions, estimation, and hypothesis testing. This category also covers the understanding of statistical assumptions for statistical tests, the rationale behind different types of data scales (nominal, ordinal, interval, and ratio), and the conceptual framework for choosing appropriate statistical tests based on research questions and data characteristics. 3. Method Selection, involving the practical application of statistical techniques and decision-making processes to choose the most suitable methods for data analysis based on the nature of data and research objective. Specifically, this category includes selecting the correct types of t-tests (one-sample, independent, or paired-sample), choosing between parametric and non-parametric tests based on data distribution and sample size, deciding on the appropriate correlation coefficients (Pearson, Spearman, or Cramer’s V) to examine the strength and direction of relationships between variables, and selecting the appropriate regression model for predicting outcomes or explaining the relationship between multiple variables.
Predictors that account for students’ background comprised four variables as follows: First, students’ time taken to complete the assignment, represented by their average time of submission. Second, students’ submission rate (whether students submitted the assignment). Third, students’ post-lecture quiz performance, represented by average score of post-class exercise in each lecture. These exercises are designed to assess the understanding of the lecture, providing a measure of students’ attention to the concepts taught in class. Finally, students’ cheating behavior is indicated by the median cosine similarity among their open-ended homework responses. A value close to 1.00 means a student’s work is very similar to others’, hinting at possible plagiarism. In total, seven variables served as predictors in this study. All of these variables were continuous. The outcome variable is students’ final course score in the research method course for the regression task. For the classification task, the score was categorized into two classes, with class 1 represents students who achieve 80% and above in the final research method course grade and class 0 represents students who achieve below 80% in the final research method course grade. All predictors were examined with a correlational analysis to ensure their relationships among each other and relationships to the outcome variable.
In terms of data preprocessing, one case exhibited missing values, which were addressed using bootstrap aggregating trees imputation technique via the recipe package [24]. We conducted the train-test split procedure using the initial split function from the rsample package [24], with a split ratio of 80% for training data and 20% for testing data. For the classification task, there was a 60:248 discrepancy between the number of instances in class 1 and class 0 respectively, indicating a moderate class imbalance issue. To mitigate this, we employed the Synthetic Minority Oversampling Technique (SMOTE) from the themis package [25]. SMOTE synthesized additional instances of the minority class (class 1), resulting in a balanced class proportion of N = 248 for each class in the final dataset used for classification. The final dataset for the classification task comprised 419 instances for training and 77 for testing datasets. For the regression task, the final dataset consisted of 308 instances for training and 77 instances for testing datasets.
4.2. Predictive Algorithm
For predicting the outcome variable, we employed the Elastic-net regularized generalized linear model (GLM) as our predictive algorithm [26,27]. This choice was made after comparing various predictive algorithms for both regression and classification tasks, including Random forest, k-nearest neighbor, support vector machine, and extreme gradient boosting trees. These algorithms yielded comparable results. However, the Elastic-net GLM possesses an advantage of interpretability. Given its linear nature, this model allows for clear interpretation of how predictors influence the outcome variable directionally [26]. Additionally, linear models, like the Elastic-net GLM, have been shown to perform well with small sample sizes compared to ensemble models such as Random Forest [28]. This advantage is further enhanced by the quality of the data, as variables were meticulously selected based on their pairwise relationships [29]. By employing the Elastic-net GLM, our aim is to leverage its interpretability and effectiveness in modeling the relationship between predictors and the outcome variable.
4.3. Hyperparameter Tuning
To optimize both the regression and classification algorithms, the Latin Hypercube grid search method was utilized for its efficiency, offering comparable results to other approaches but at a lower computational cost [30,31]. The tuned hyperparameters are Elastic-net penalty terms and mixing parameters, both possessing the range of 0 to 1. Both algorithms were with 50 sets of random hyperparameter values, through 10-fold cross validation with 5 repetitions method (5x10-fold CV), totalling 2,500 number of trials. Following the identification of the optimal hyperparameter combination, both regressor and classifier model underwent further training, testing, and validation using 5x10-fold CV to ensure optimal performance. The evaluation of the regression algorithm’s effectiveness was based on regression metrics such as root mean squared error (RMSE) and R-squared. For the classification algorithm, classification metrics such as area under curve (AUC), precision, recall, F1 score, and accuracy were consulted.
5. Results
5.1. Pairwise Correlation Results
Figure 1 presents the results of pairwise correlation analysis. Most variables share a significant positive correlation among each other and to the targeted variable (i.e., p < 0.05), with some variables (i.e., average time of submission and cheating behavior) having significant negative relationships to the outcome variable. Specifically, the outcome variable “ResComp” has the highest positive correlation with the “Interpret” variable (.568) and “Concepts” variables (.528). Additionally “ResComp” also shows significant positive correlation with “ChooseMethod” (.323), “SubmitRate” (.307), and LearnPerform (.219). These findings suggested that students’ research competency is positively associated with their performance across the three categories of statistical skills, as well as their completion of assignments and post-lecture quiz performance. On the contrary, variables such as “AvgTimeSubmit” (-.290), and “CheatingBehavior” (-.147) showed a notable negative correlation with “ResComp”. This indicates that students who take a significantly longer time to finish assignments and engage in cheating tend to score lower in research competency.
5.2. Predictive Regression Analysis
After conducting a Latin Hypercube grid search tuning, the optimal hyperparameters for the GLM regressor model are Elastic-net penalty term = 1.147e-05 and Mixing parameter = 2.657e-03. The model yielded an RMSE of 6.654 and an R-squared of 55.073%, indicating satisfactory performance. The RMSE of 6.654 indicates a small margin of error in our predictions, considering the possible range of research competency scores (up to 100). Furthermore, the R-squared value of 55.073% suggests that our model explains over half of the variation in student research competency. Figure 2 illustrates the relative importance of different factors in predicting students’ final scores in the research methods course. The analysis reveals that “Interpret” is the most influential factor, followed by “Concept” and “SubmitRate”. Interestingly, the time taken to complete assignments has the least influence on predicting final scores. Regarding directionality, “Interpret”, “Concepts”, “SubmitRate”, “ChooseMethod” and “LearnPerform” demonstrated positive relationships with the outcome variable, suggesting that higher scores in these areas correspond to greater research competency, as reflected in students’ final course scores. Conversely, “CheatBehavior”, and “AvgTimeSubmit” showed a negative relationship with the outcome variable, implying that factors related to it may impede students’ score in the research method course. These results align with results from the correlational analysis.
Table 2 provides a summary of regression coefficients obtained from a GLM regressor, optimized with hyperparameter tuning. The table presents estimated coefficients, both raw and standardized, along with their standard errors and the 95% quantile intervals, all derived from 50 bootstrap samples. Upon examining the 95% quantile intervals for the regression coefficients, as outlined in the table, nearly all variables are significantly related to the research competency scores. However, “AvgTimeSubmit” is the only variable that lacks a significant relationship, as its quantile interval overlaps the zero region based on its range of -0.160 to 0.015; this indicates uncertainty in its impact on the research competency score.
5.3. Classification Analysis
For the classification model, the optimal hyperparameters for the GLM classifier model are Elastic-net penalty term = 0.383 and Mixing parameter = 0.122. The model achieves performance metrics of AUC = .811 , precision = .407 , recall = .733, F1 score = .524, and accuracy = .740 These metrics indicate that the model is effective at distinguishing between the two classes of students, particularly in accurately identifying students who achieve higher score, as indicated by a higher recall value. In Figure 3, feature importance metrics illustrate the predictors’ relative influence in predicting students’ likelihood of success in the research methods course, defined as achieving a final grade of B or above. Among these predictors, “Interpret” emerged as the most influential, followed by “Concept” and “SubmitRate”, respectively, while “AvgTimeSubmit” exhibited the least influence. These findings parallel those of the regression task.
Similar to the approach taken with the GLM regressor, Table 3 offers a summary of regression coefficients from a tuned GLM classifier. This table shows the estimated coefficients, encompassing both raw score coefficients and standardized coefficients expressed in terms of Odds Ratios, together with their respective standard errors. The table also includes the 95% quantile intervals for each coefficient, all of which are derived from an analysis of 50 bootstrap samples. These results describe the predictive power of the predictors. Notably, "Interpret" and "Concepts" stand out as substantial positive predictors, each demonstrating an over 30% increase in the likelihood of the predicted outcome for every unit increase in their scores. This highlights the significant influence these variables have on research competency. Other variables such as "SubmitRate," "LearnPerform," and "ChooseMethod" also show positive associations, albeit more modest, indicating that enhancements in these areas can slightly improve research competency. In contrast, "CheatBehavior" and "AvgTimeSubmit" exhibit minimal negative impacts, with the former showing an odds ratio close to 1.00, suggesting its negligible effect, and the latter indicating only a slight decrease in the likelihood of the predicted outcome with longer submission times. This analysis underscores the importance of students’ interpretative and conceptual skills in statistics in contributing to their research competency, while also acknowledging the lesser roles of other factors.
6. Discussion
This study aims to identify key predictors among undergraduate students’ statistical skills and learning behavior within a statistics course, with the goal of predicting their research competency as represented by their performance in a research methods course. Employing supervised machine learning techniques, the research performed both regression and classification tasks to predict students’ final course scores and likelihood of achieving a letter grade of B or higher, respectively. The guiding research question is: "How is the predictability of skills in statistics to students’ research competency?" To answer the research question, our findings indicate that three primary categories of statistical skills—namely, understanding of statistical concepts, proficiency in selecting appropriate statistical methods, and statistics interpretation skills— can be used to predict students’ research competency, as demonstrated by their final course scores and letter grades. Additionally, factors related to students’ learning behavior, such as assignment submission rates, post-lecture quiz performance, and academic dishonesty, serve as supplementary predictors. Our analyses reveal that statistics interpretation skills emerge as the most influential predictor, followed by understanding of statistical concepts and method selection proficiency, respectively. These insights hold implications for instructors seeking to enhance the design of research methods courses within higher education contexts.
The findings of this study aligns with various learning theories. Specifically, the statistics interpretation skills are positioned on the evaluating and analyzing levels on Bloom’s revised taxonomy, because they involve the critical process of making sense of statistical outputs by analyzing results and assessing their quality [32]. These two levels on Bloom’s require higher comprehension in the subject matter, and therefore could be inferred that students who mastered the statistics interpretation skills can apply their statistical knowledge more effectively in developing their research competency. Conversely, students’ grasp of statistical concepts resides at the understanding level within Bloom’s framework, which involves the ability to describe the relationship between principles of statistical methods and their underlying assumptions [19]. Similarly, proficiency in selecting appropriate statistical methods operates primarily at the understanding and remembering levels, as students must match suitable data analysis techniques with the characteristics of their data. This skill may entail a lower level of comprehension compared to the understanding of statistical concepts, given its focus on the practical matching of data and methods rather than abstract conceptualization [19,32]. Consequently, it is reasonable to infer that these latter two skills may exhibit comparatively less predictive power regarding students’ research competency, as they require a lower level of comprehension in the subject matter compared to statistics interpretation skills.
The findings of this study also align with the framework of feedback levels proposed by Hattie and Timperley [33], which distinguishes between task-level feedback (i.e., how tasks are performed) and process-level feedback (i.e., the cognitive processes necessary to execute tasks effectively). When instructing students on the selection of statistical analysis methods, the majority of the feedback may concentrate on the task level, emphasizing correct and incorrect answers based on factual knowledge [33]. For instance, instructors might guide students to choose ANOVA for comparing continuous variables across multiple categorical groups, citing its formula and applicability [19]. This task-oriented instruction pertains to concrete and surface-level knowledge, demanding primarily task-level feedback. In contrast, teaching students about statistical principles and the interpretation of statistical results involves a more analytical approach. Here, students must connect underlying statistical principles with the context of their study to derive meaningful interpretations. For example, understanding the nature of an intervention is crucial for interpreting statistical significance between pre-treatment and post-treatment data [19]. Such tasks necessitate process-level instruction and feedback due to the abstract nature of statistical principles and contextual variables involved. Consequently, skills related to understanding statistical concepts and interpreting statistical results may wield greater influence on students’ research competency, as they engage learners in deeper levels of understanding and cognitive processing [33].
The inclusion of behavioral aspects such as submission rates and cheating behavior as predictors of students’ research competency aligns with previous literature in a sense that formative learning activities can be used to predict students’ learning performance [10]. In fact, the negative relationship of cheating behavior and time taken to complete assignments to students’ research competency can be attributed to the concept of self-efficacy, which plays a crucial role in shaping students’ academic outcomes [34,35]. Individuals with low self-efficacy may exhibit reduced effort in their learning endeavors due to diminished motivation and a sense of lack of control over their academic success [34,36]. Consequently, they may perceive themselves as incapable of achieving high scores, leading to behaviors such as procrastination or resorting to academic dishonesty. Conversely, the positive association between students’ submission rates and post-lecture quiz performance reflects their intrinsic motivation and attention to learning [36]. Students with high self-efficacy levels are more likely to be driven by internal motivations to excel academically, resulting in greater engagement and ultimately enhanced proficiency in statistics that contribute to their research competency [36]. Although these behavioral variables serve as auxiliary factors within the scope of this study, they offer valuable insights into students’ learning behaviors and motivations in a broader educational context.
The implications of this study highlights the importance for instructors of statistics courses to prioritize lessons and tasks aimed at cultivating students’ foundational understanding of statistical principles and their skills in interpreting statistical results. In the context of research methods courses, instructors could incorporate review lectures focusing on these areas to reinforce students’ proficiency and readiness for applying statistical concepts to research formulation. This approach has the potential to bolster students’ research competency by equipping them with a robust statistical foundation. Moreover, this study can be viewed through the lens of learning analytics, as it leverages the capability of machine learning alongside students’ learning data encompassing both performance metrics and learning activities [37]. Researchers and instructors can leverage these findings to develop predictive systems that inform teaching and feedback strategies. For instance, instructors could utilize such systems to monitor students’ progress in statistical skills across the three categories of statistical skills and intervene proactively when students show signs of falling behind, thereby ensuring that students maintain a solid grasp of statistics essential for effective learning in research methods courses. By integrating these strategies, instructors can foster a supportive learning environment conducive to enhancing students’ research competency and overall academic success.
This study has limitations to be aware of. Firstly, the small sample size, while common in undergraduate-level courses like statistics and research methods due to the nature of supervision-based learning, may limit the generalizability of the findings, particularly in the context of machine learning studies. Future research could address this limitation by collecting data longitudinally, allowing for a larger sample size that could enhance the robustness of predictive algorithms. Secondly, the constrained sample size also restricts the selection of predictive algorithms, precluding the use of more complex models such as neural networks or random forest ensembles in their most effective form. With a larger dataset, researchers could explore the application of these advanced algorithms, potentially yielding more reliable prediction outcomes suitable for developing predictive systems in educational settings. Lastly, future investigations could expand upon the variables considered, including factors like the implementation of problem-based learning approach. Such an approach could promote knowledge retention and the practical application of skills acquired in higher education, such as statistics and research, within real-world scenarios [38]. By incorporating these additional variables, future studies can provide a more thorough understanding of the factors influencing students’ research competency to inform the design of more effective educational interventions.
Author Contributions
“Conceptualization, T.W., S.S.; methodology, S.S.; validation, S.S.; formal analysis, S.S.; Project administration, T.W.; resources, K.S.; data curation, S.S., K.S.; writing—original draft preparation, T.W.; writing—review and editing, T.W.; visualization, S.S. All authors have read and agreed to the published version of the manuscript.
Funding
This research received no external funding.
Institutional Review Board Statement
Ethical review and approval were waived for this study due to the absence of direct involvement with human subjects, thereby mitigating potential ethical concerns such as invasion of privacy, coercion, or harm to participants. The data utilized in this study is anonymous to the primary researchers, ensuring the protection of individual privacy with no means of re-identification.
Informed Consent Statement
Not applicable
Data Availability Statement
The dataset utilized in this study belongs to the university of one of the authors and therefore is unavailable to the public.
Acknowledgments
The authors acknowledge and appreciate the assistance of the Faculty of education, Chulalongkorn university for the provision of the dataset.
Conflicts of Interest
The authors have no conflicts of interest to declare that are relevant to the content of this article.
Abbreviations
The following abbreviations are used in this manuscript:
| SEM | Structural Equation Modeling |
| RSD | Research Skill Development |
| ANOVA | Analysis of Variance |
| GLM | Generalized Linear Model |
| RMSE | Root Mean Squared Error |
| AUC | Area Under Curve |
References
- Bandaranaike, S. From research skill development to work skill development. Journal of University Teaching & Learning Practice 2018, 15, 7. [Google Scholar]
- Leavy, P. Research design: Quantitative, qualitative, mixed methods, arts-based, and community-based participatory research approaches; Guilford Publications, 2022.
- Cohen, L.; Manion, L.; Morrison, K. Research methods in education, 8 ed.; Routledge: New York, 2018. [Google Scholar] [CrossRef]
- Kline, R.B. Chapter 13: Analysis of confirmatory factor analysis models. In Principles and practice of structural equation modeling, 4 ed.; Methodology in the Social Sciences, The Guilford Place: London, 2016; pp. 300–337. [Google Scholar]
- Macher, D.; Paechter, M.; Papousek, I.; Ruggeri, K.; Freudenthaler, H.; Arendasy, M. Statistics anxiety, state anxiety during an examination, and academic achievement. British Journal of Educational Psychology 2012, 83, 535–549. [Google Scholar] [CrossRef] [PubMed]
- McGrath, A.L. Content, affective, and behavioral challenges to learning: students’ experiences learning statistics. International Journal for the Scholarship of Teaching and Learning 2014, 8. [Google Scholar] [CrossRef]
- Samuel, T.S.; Warner, J. “I can math!”: Reducing math anxiety and increasing math self-efficacy using a mindfulness and growth mindset-based intervention in first-year students. Community College Journal of Research and Practice 2021, 45, 205–222. [Google Scholar] [CrossRef]
- Maravelakis, P. The use of statistics in social sciences. Journal of Humanities and Applied Social Sciences 2019, 1, 87–97. [Google Scholar] [CrossRef]
- Shah Abd Hamid, H.; Karimi Sulaiman, M. Statistics anxiety and achievement in a statistics course among psychology students. The Journal of Behavioral Science 2014, 9, 55–56. [Google Scholar] [CrossRef]
- Bulut, O.; Gorgun, G.; Yildirim-Erbasli, S.N.; Wongvorachan, T.; Daniels, L.M.; Gao, Y.; Lai, K.W.; Shin, J. Standing on the shoulders of giants: Online formative assessments as the foundation for predictive learning analytics models. British Journal of Educational Technology 2022. [Google Scholar] [CrossRef]
- Prosekov, A.Y.; Morozova, I.S.; Filatova, E.V. A case study of developing research competency in university students. European Journal of Contemporary Education 2020, 9. [Google Scholar] [CrossRef]
- Bzdok, D.; Altman, N.; Krzywinski, M. Statistics versus machine learning. Nature Methods 2018, 15, 233–234. [Google Scholar] [CrossRef]
- Sehgal, J. Sample semester schedule, 2023.
- Willison, J.; O’Regan, K.; Kuhn, S.K. Researcher skill development framework, 2018.
- Hoffmann, T. The meanings of competency. Journal of european industrial training 1999, 23, 275–286. [Google Scholar] [CrossRef]
- Willison, J.; Buisman-Pijlman, F. PhD prepared: Research skill development across the undergraduate years. International Journal for Researcher Development 2016, 7, 63–83. [Google Scholar] [CrossRef]
- Thompson Rivers University. RSMT 3501: introduction to research methods.
- Willison, J.W. When academics integrate research skill development in the curriculum. Higher Education Research & Development 2012, 31, 905–919. [Google Scholar] [CrossRef]
- Hahs-Vaughn, D.L.; Lomax, R.G. An introduction to statistical concepts; Routledge, 2020.
- Knaflic, C.N. Storytelling with data: A data visualization guide for business professionals; John Wiley & Sons, 2015.
- Koparan, T. Difficulties in learning and teaching statistics: Teacher views. International Journal of Mathematical Education in Science and Technology 2015, 46, 94–104. [Google Scholar] [CrossRef]
- Puspitasari, N.; Afriansyah, E.A.; Nuraeni, R.; Madio, S.S.; Margana, A. What are the difficulties in statistics and probability? Journal of Physics: Conference Series 2019, 1402, 077092. [Google Scholar] [CrossRef]
- R Core Team. R: A language and environment for statistical computing, 2022.
- Frick, H.; Chow, F.; Kuhn, M.; Mahoney, M.; Silge, J.; Wickham, H. rsample: General Resampling Infrastructure, 2024. R package version 1.2.1, https://github.com/tidymodels/rsample.
- Hvitfeldt, E. themis: Extra Recipes Steps for Dealing with Unbalanced Data, 2023. https://github.com/tidymodels/themis.
- Friedman, J.; Tibshirani, R.; Hastie, T. Regularization paths for generalized linear models via coordinate descent. Journal of Statistical Software 2010, 33, 1–22. [Google Scholar] [CrossRef] [PubMed]
- Tay, J.K.; Narasimhan, B.; Hastie, T. Elastic net regularization paths for all generalized linear models. Journal of Statistical Software 2023, 106, 1–31. [Google Scholar] [CrossRef] [PubMed]
- Smith, P.F.; Ganesh, S.; Liu, P. A comparison of random forest regression and multiple linear regression for prediction in neuroscience. Journal of Neuroscience Methods 2013, 220, 85–91. [Google Scholar] [CrossRef]
- Xu, P.; Ji, X.; Li, M.; Lu, W. Small data machine learning in materials science. npj Computational Materials 2023, 9, 42. [Google Scholar] [CrossRef]
- López, D.; Alaíz, C.M.; Dorronsoro, J.R. Modified grid searches for hyper-parameter optimization. In Hybrid Artificial Intelligent Systems; De La Cal, E.A., Villar Flecha, J.R., Quintián, H., Corchado, E., Eds.; Springer International Publishing: Cham, 2020. [Google Scholar] [CrossRef]
- Mantovani, R.G.; Rossi, A.L.D.; Vanschoren, J.; Bischl, B.; de Carvalho, A.C.P.L.F. Effectiveness of random search in SVM hyper-parameter tuning. 2015 International Joint Conference on Neural Networks (IJCNN), 2015, pp. 1–8. [CrossRef]
- Krathwohl, D.R. A revision of bloom’s taxonomy: An overview. Theory Into Practice 2002, 41, 212–218. [Google Scholar] [CrossRef]
- Hattie, J.; Timperley, H. The power of feedback. Review of Educational Research 2007, 77, 81–112. [Google Scholar] [CrossRef]
- Bandura, A. Self-efficacy mechanism in human agency. American Psychologist 1982, 37, 122–147. [Google Scholar] [CrossRef]
- Finn, K.V.; Frone, M.R. Academic performance and cheating: moderating role of school identification and self-efficacy. The Journal of Educational Research 2004, 97, 115–121. [Google Scholar] [CrossRef]
- Banfield, J.; Wilkerson, B. Increasing student intrinsic motivation and self-efficacy through gamification pedagogy. Contemporary Issues in Education Research (CIER) 2014, 7, 291–298. [Google Scholar] [CrossRef]
- Chen, G.; Rolim, V.; Mello, R.F.; Gašević, D. Let’s shine together!: A comparative study between learning analytics and educational data mining. Proceedings of the Tenth International Conference on Learning Analytics & Knowledge; ACM: Frankfurt Germany, 2020; pp. 544–553. [Google Scholar] [CrossRef]
- Yew, E.H.; Goh, K. Problem-based learning: An overview of its process and impact on learning. Health Professions Education 2016, 2, 75–79. [Google Scholar] [CrossRef]
Figure 1.
Pairwise correlation analysis.
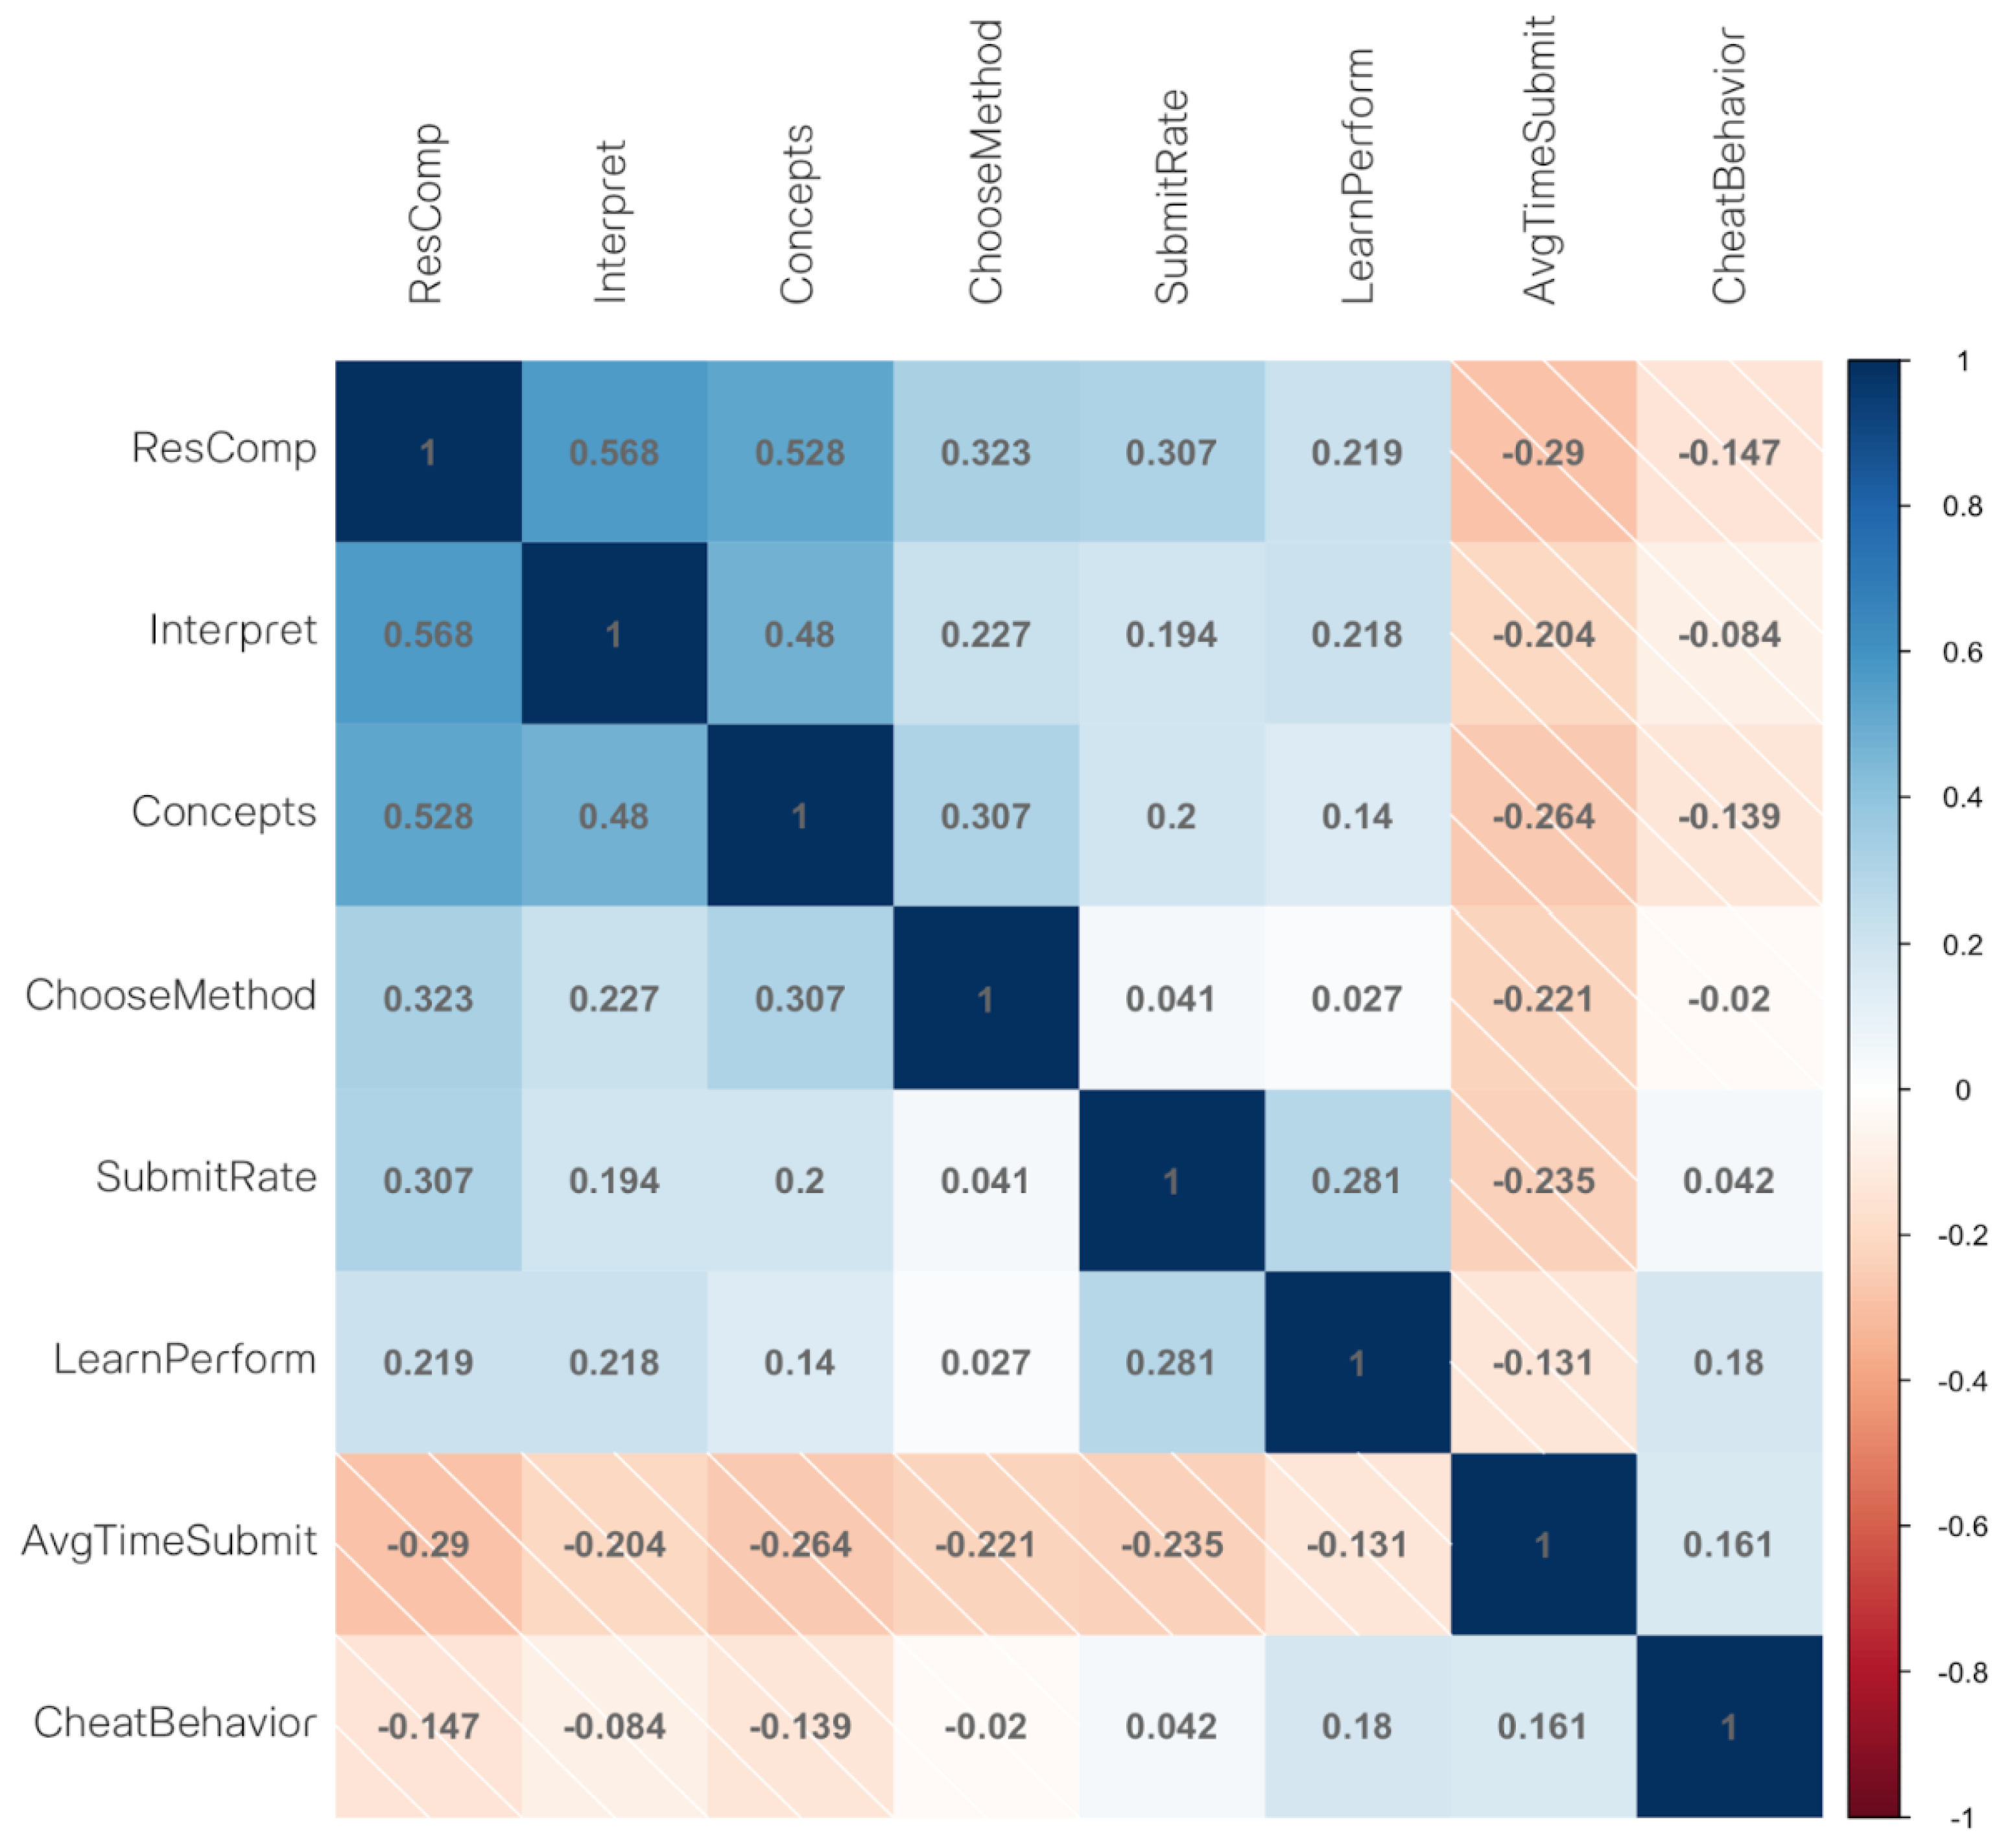
Figure 2.
Feature importance metrics of GLM regressor.
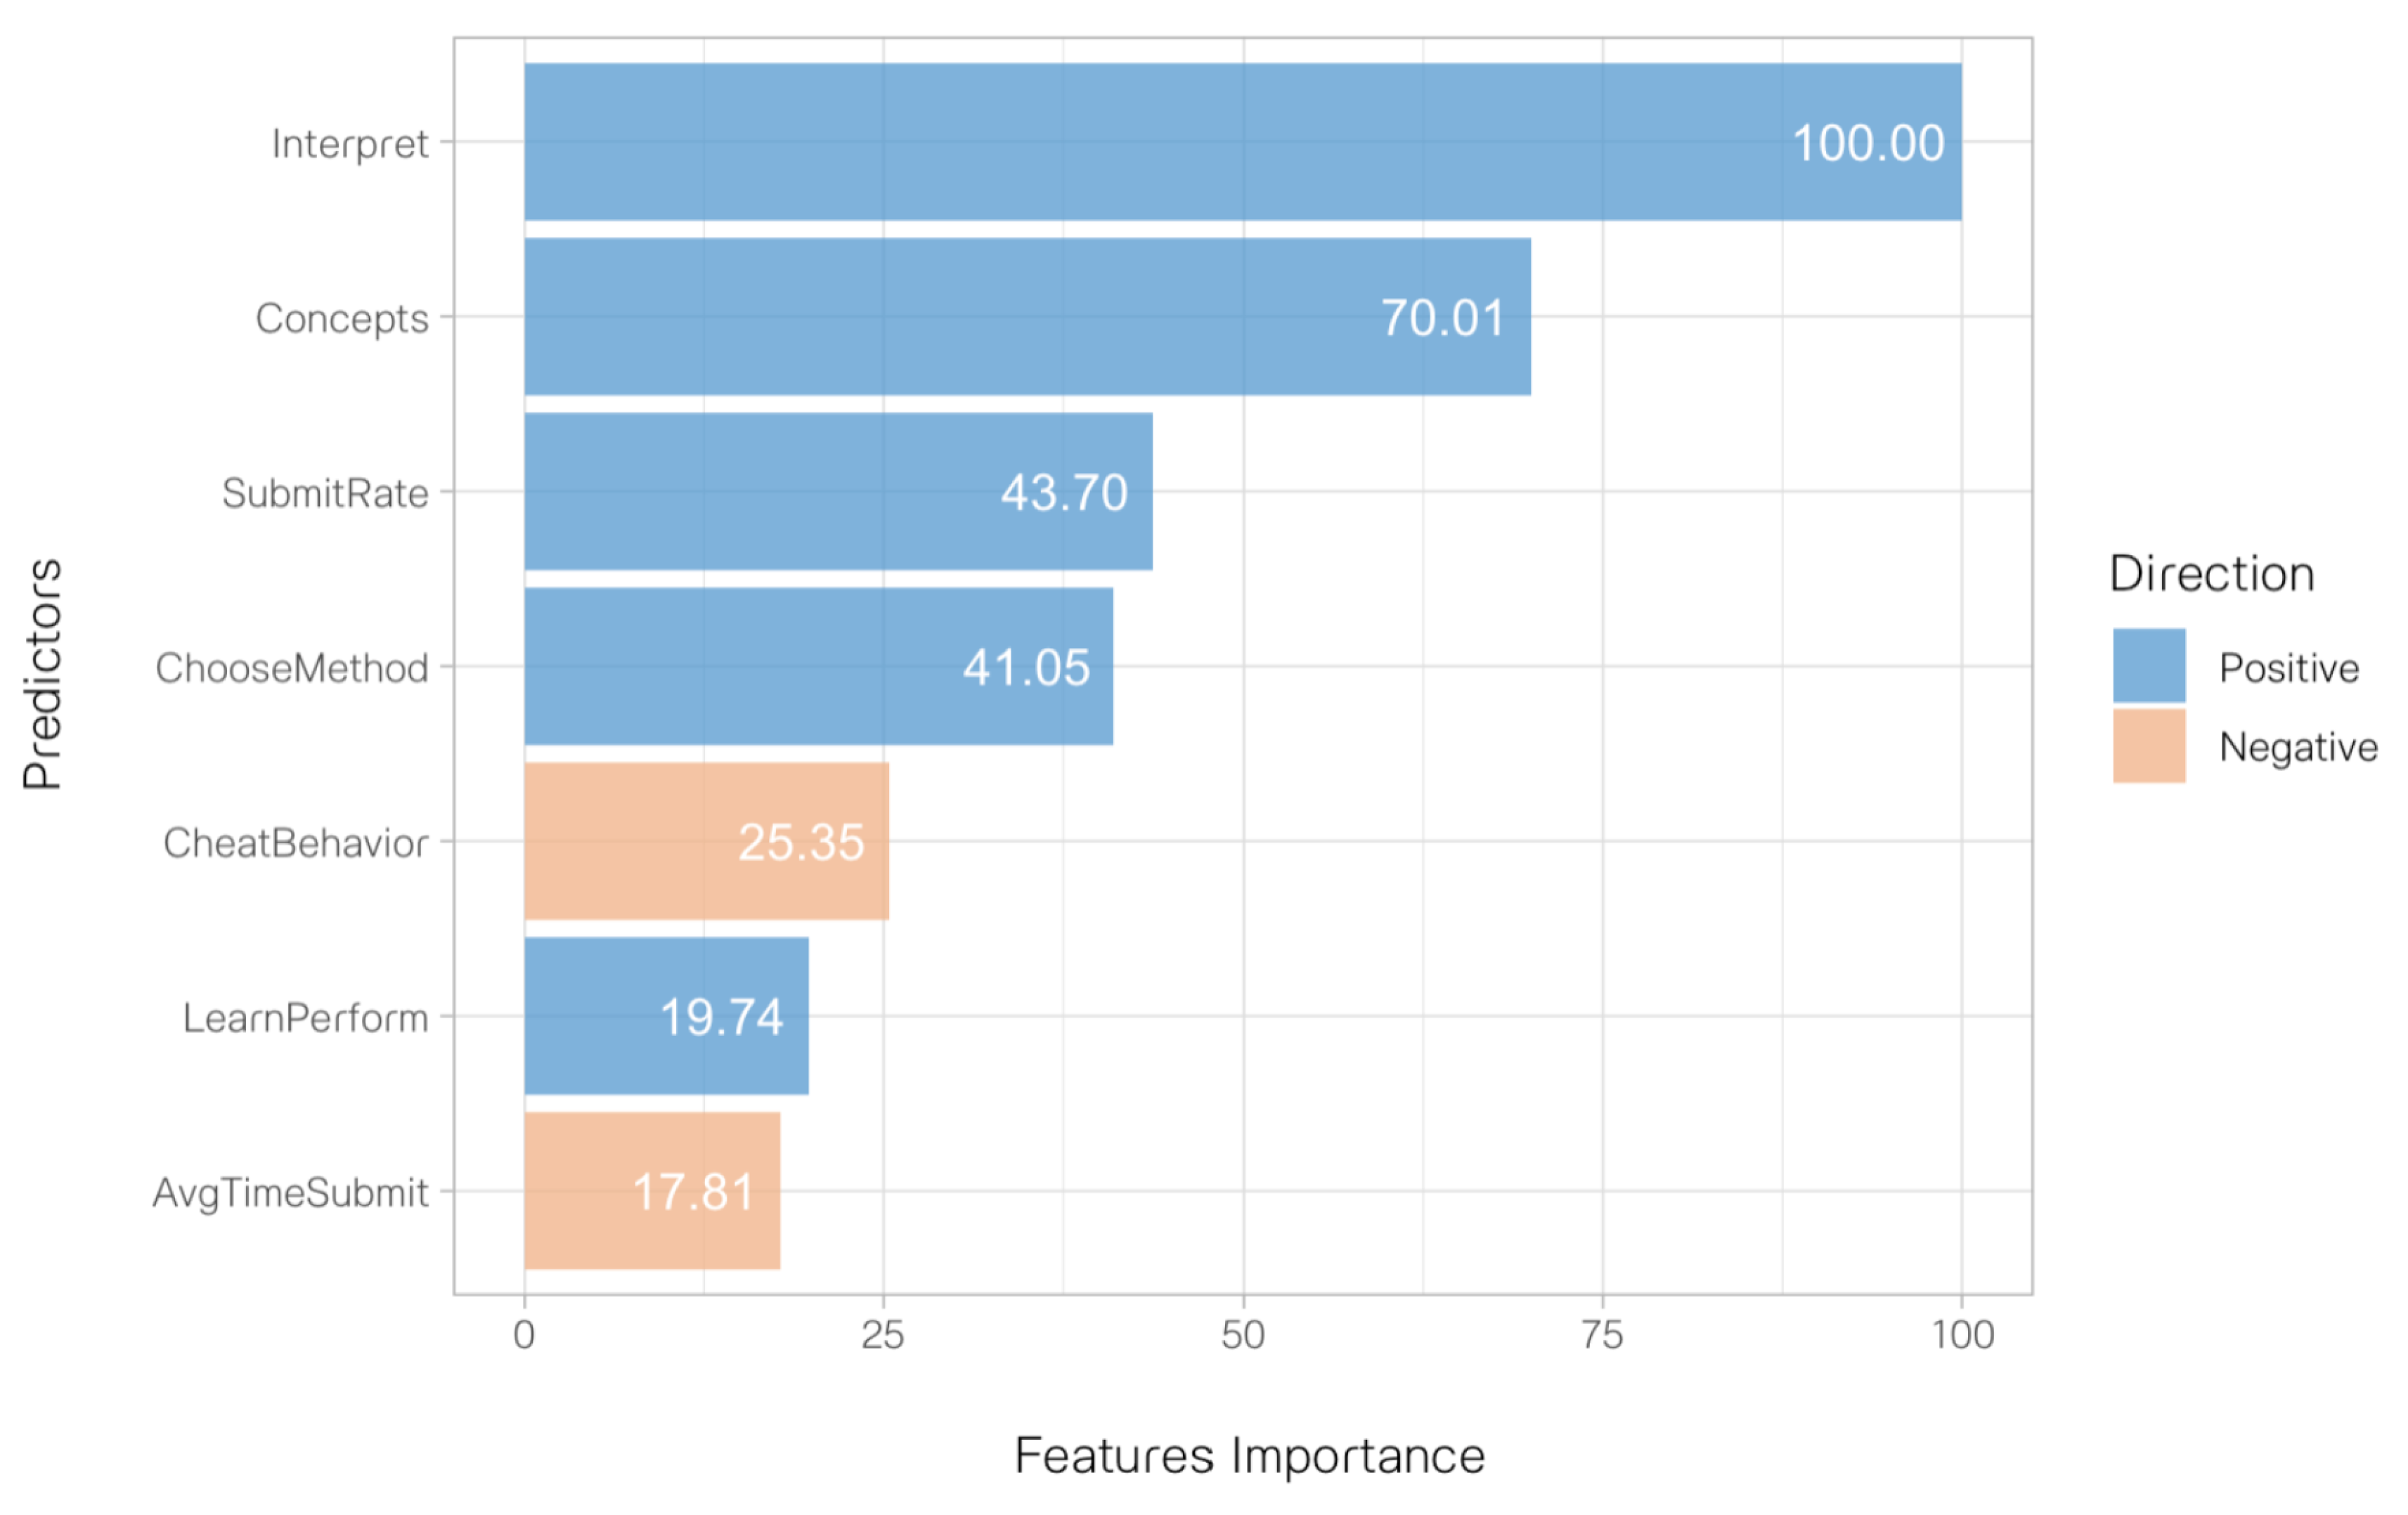
Figure 3.
Feature importance metrics of predictors in the GLM classifier.
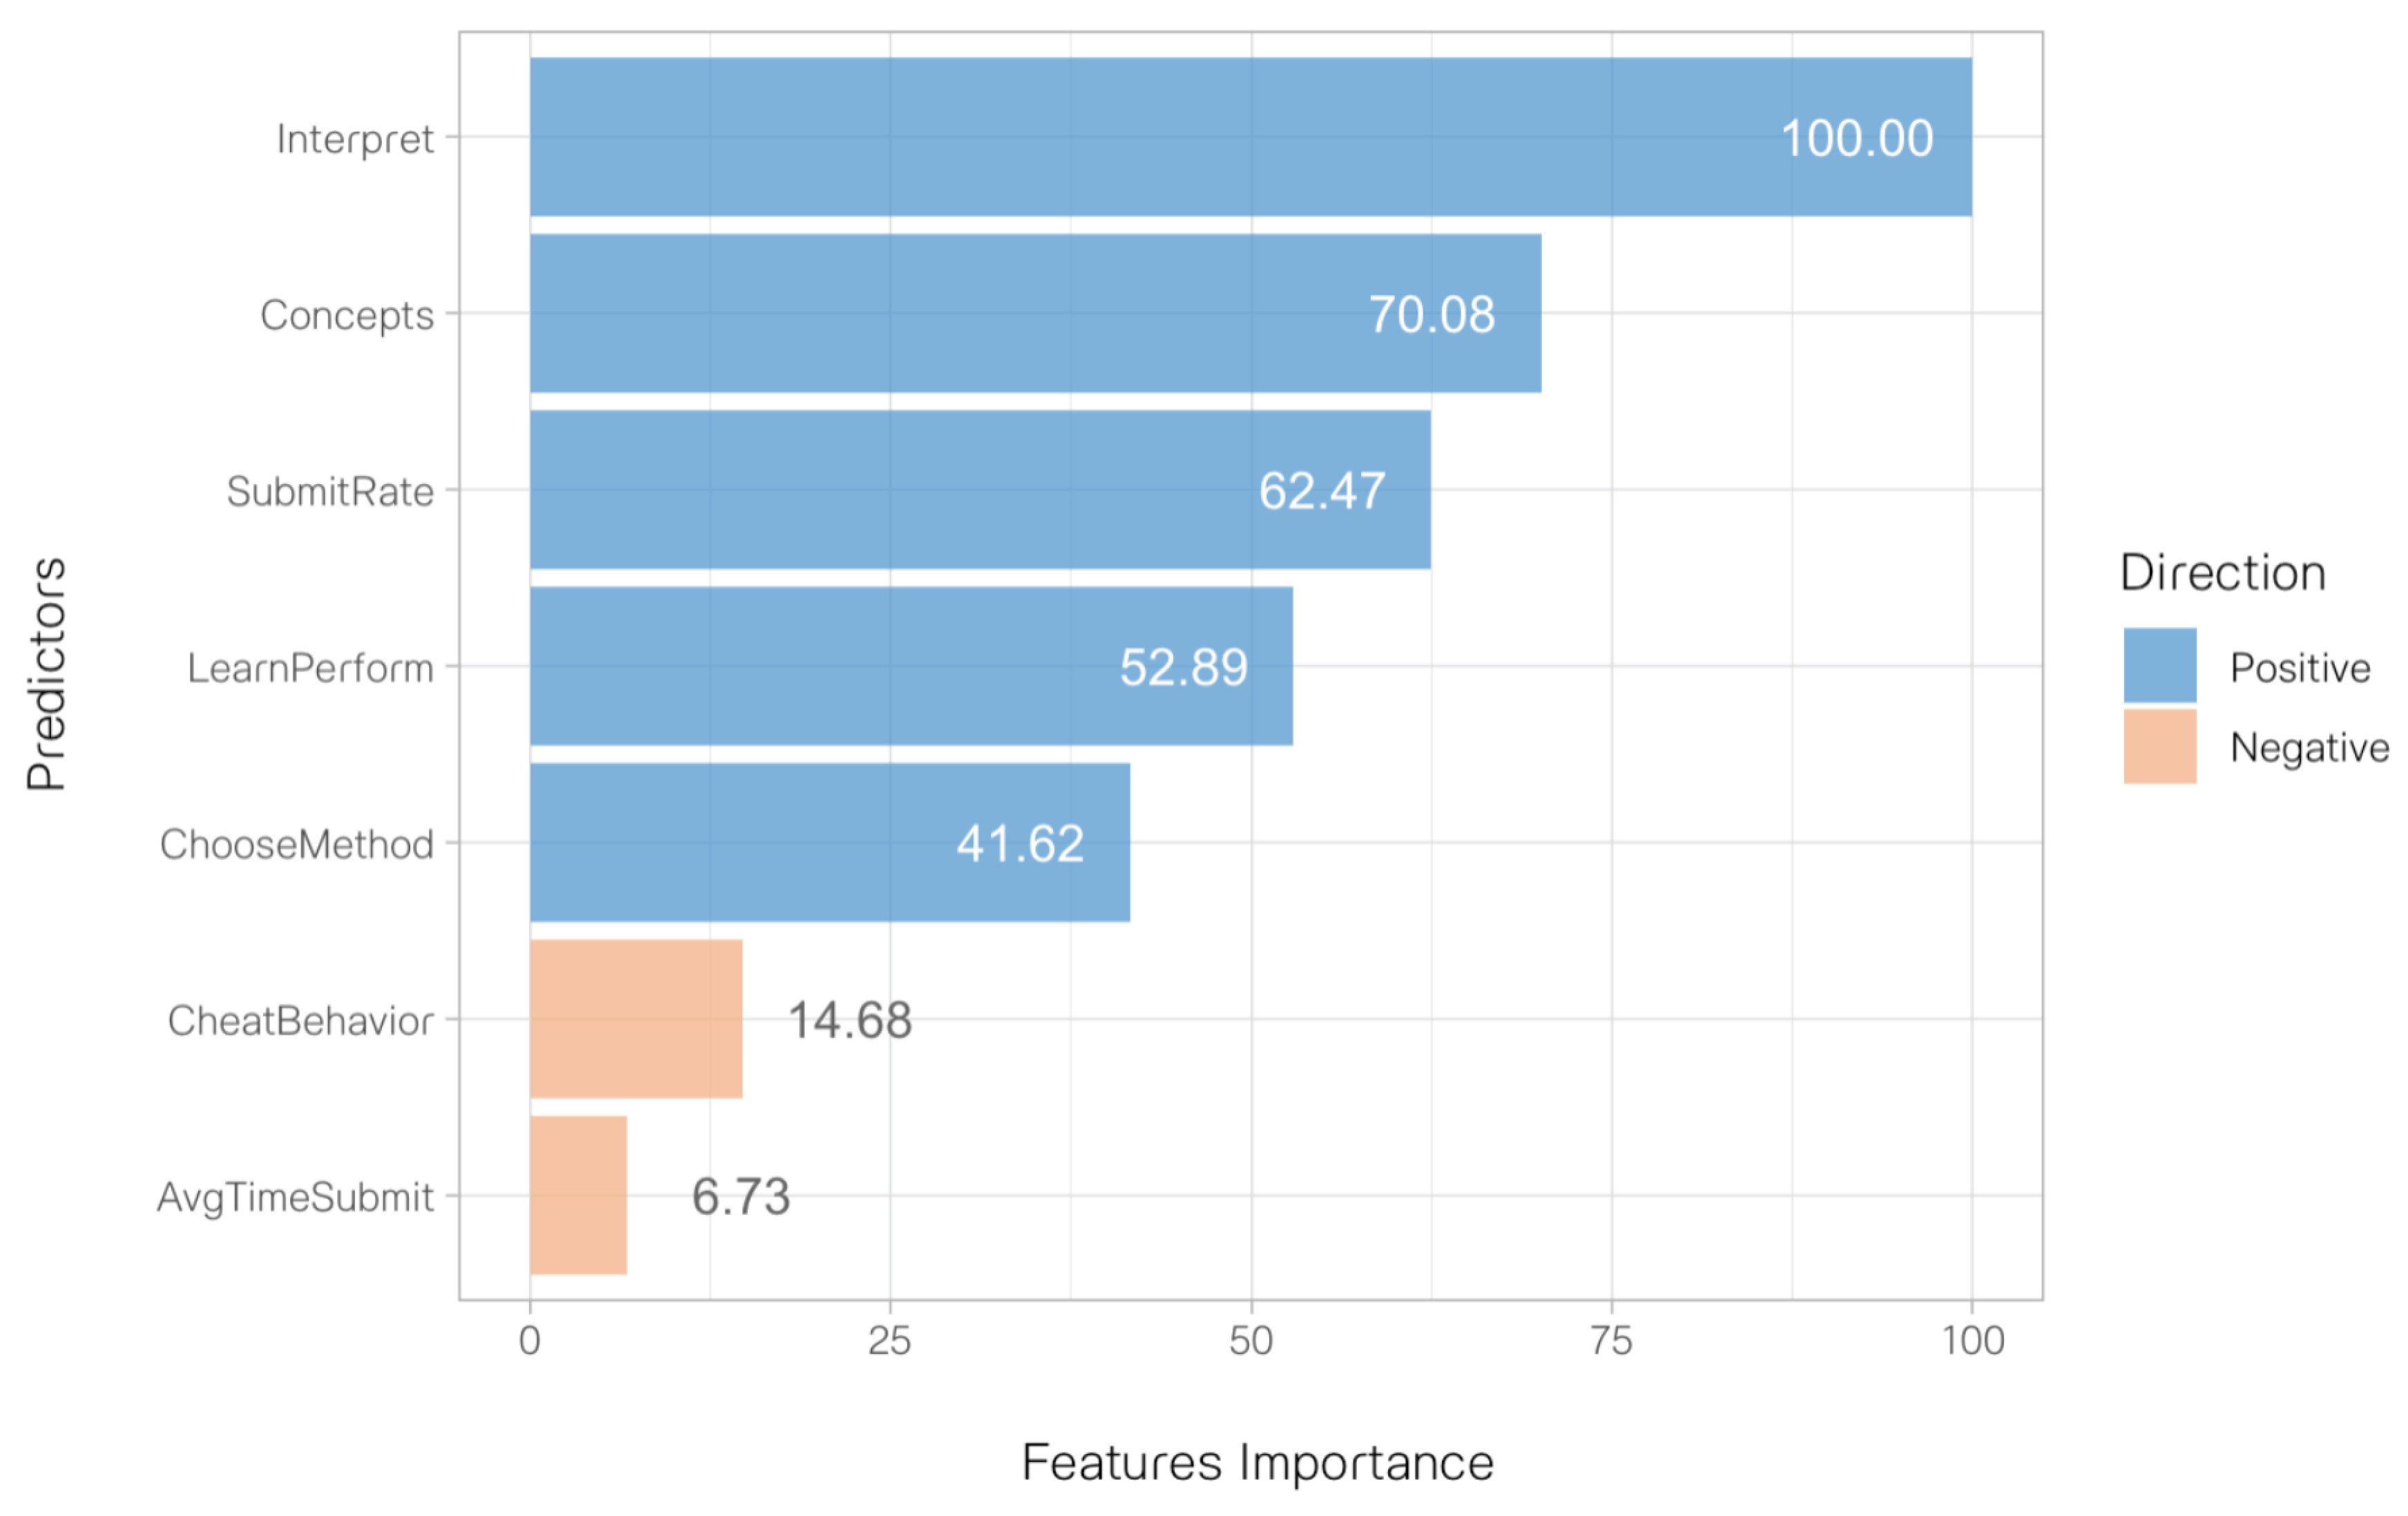

Table 1.
List of utilized variables.
| Variable code | Variable name |
|---|---|
| ResComp | Students’ research competency. |
| Interpret | Students’ statistics interpretation skill. |
| Concepts | Students’ understanding of statistical concepts. |
| ChooseMethod | Students’ skills in statistical method selection. |
| SubmitRate | Students’ assignment submission rate. |
| LearnPerform | Students’ post-lecture quiz performance |
| AvgTimeSubmit | Students’ time taken to complete the assignment. |
| CheatingBehavior | Students’ cheating behavior in assignments. |
Table 2.
Bootstrap regression coefficients of GLM regressor summary.
| Raw Score Coefficient | Standardized Coefficient | ||||
|---|---|---|---|---|---|
| Variable | Estimate | Standard error | Estimate | Quartile 2.5 | Quartile 97.5 |
| Constant | 42.360 | 5.201 | - | - | - |
| Interpret | 0.216 | 0.028 | 0.340 | 0.266 | 0.414 |
| Concepts | 0.142 | 0.031 | 0.255 | 0.165 | 0.341 |
| SubmitRate | 0.130 | 0.027 | 0.149 | 0.073 | 0.223 |
| ChooseMethod | 0.085 | 0.029 | 0.138 | 0.040 | 0.182 |
| CheatBehavior | -4.706 | 2.303 | -0.089 | -0.164 | -0.015 |
| LearnPerform | 0.054 | 0.034 | 0.073 | 0.024 | 0.141 |
| AvgTimeSubmit | -0.015 | 0.019 | -0.067 | -0.160 | 0.015 |
Note. Bootstrap sample = 50 samples.
Table 3.
Bootstrap regression coefficients of GLM classsifier summary.
| Raw Score Coefficient | Standardized Coefficient | ||||
|---|---|---|---|---|---|
| Variable | Beta | Standard error | Odd ratio | Quartile 2.5 | Quartile 97.5 |
| Constant | -3.214 | 0.432 | 0.784 | 0.740 | 0.826 |
| Interpret | 0.016 | 0.003 | 1.310 | 1.198 | 1.420 |
| Concepts | 0.015 | 0.003 | 1.302 | 1.187 | 1.413 |
| SubmitRate | 0.009 | 0.003 | 1.123 | 1.005 | 1.220 |
| LearnPerform | 0.009 | 0.003 | 1.113 | 1.006 | 1.240 |
| ChooseMethod | 0.007 | 0.003 | 1.111 | 1.000 | 1.190 |
| CheatBehavior | -0.009 | 0.083 | 0.997 | 0.938 | 1.000 |
| AvgTimeSubmit | -0.002 | 0.001 | 0.946 | 0.898 | 1.000 |
Note. Bootstrap sample = 50 samples.
Disclaimer/Publisher’s Note: The statements, opinions and data contained in all publications are solely those of the individual author(s) and contributor(s) and not of MDPI and/or the editor(s). MDPI and/or the editor(s) disclaim responsibility for any injury to people or property resulting from any ideas, methods, instructions or products referred to in the content. |
© 2024 by the authors. Licensee MDPI, Basel, Switzerland. This article is an open access article distributed under the terms and conditions of the Creative Commons Attribution (CC BY) license (http://creativecommons.org/licenses/by/4.0/).
Copyright: This open access article is published under a Creative Commons CC BY 4.0 license, which permit the free download, distribution, and reuse, provided that the author and preprint are cited in any reuse.


