

Submitted:
02 April 2024
Posted:
03 April 2024
You are already at the latest version
Abstract
This article proposes a particular strategy to proceed with a progressive electrification of public transport systems in cities. Starting from a bus operation model, the possible electrification of two routes is analysed, one urban and another extra-urban in the city of Pisa. An estimate is made of the energy uses associated with certain operating modes. The maximum level of consumption is estimated at approximately 280 kWh per day per bus for the urban route and excluding some special days, less than 215 kWh per day for the extra-urban route, for which a hybrid bus is proposed. Starting from an estimate of the daily consumption for the management of the two routes, the sizing of a photovoltaic system distributed on some modular shelters which serves to power the same routes is carried out. The resulting system has a power of the order of 190-200 kW. The modular solution is also outlined, and an installation is proposed. The analyzed case lends itself to being easily replicated.
Keywords:
Electrification
; Renewable energy integration
; Public transit
; Photovoltaic systems
; Sustainable urban development
; Energy independence
; Modular solution.
1. Introduction
In the framework of the global energy transition, electric mobility emerges as a topic of profound interest and significance. At present, mobility constitutes approximately one-third of the world’s energy consumption, surpassing two hundred exajoules, according to the International Energy Agency (IEA), [1]. In some European nations, this figure can soar to 40%, underscoring the urgency of transitioning to sustainable transportation systems.
According to more specific data diffused in [2] analyzing the average share of final energy consumption in cities for the European Union countries, the specific voice connected to Transport accounts for more than 30% of the total (31%), namely the most relevant use followed by residential (27%).
Electric mobility embodies the vision of gradually transitioning energy consumption from fossil fuels to renewable sources, envisioning a future where renewable energy penetration is maximized.
While the adoption of electric vehicles (EVs) for private use faces formidable challenges, particularly regarding infrastructure and technology parity with conventional vehicles, the realm of public mobility presents a compelling avenue for progress. Unlike the monumental task of swiftly replacing entire private vehicle fleets, public transit systems offer a more feasible path towards electrification. Electrification of bus fleets in most cities is expected to rise due to its significant environmental benefits, [3].
Central to this vision is the integration of electric mobility with renewable energy generation, notably through photovoltaic systems, enabling scalable and replicable solutions. Although the wholesale replacement of entire bus fleets remains a formidable undertaking, incremental progress through route-specific electrification holds promise. By systematically renewing buses and installing photovoltaic arrays linked to charging infrastructure, cities can work towards self-sufficient and sustainable public transit networks. This approach not only reduces emissions but also fosters resilience and energy independence within urban transportation systems. In the pursuit of greener, smarter cities, the convergence of electric mobility and renewable energy production represents a transformative opportunity for sustainable urban development.
The topic of electric mobility, particularly electric public mobility, has been approached from various perspectives. In addition to a purely technical and energy standpoint, as evidenced in works such as [4,5], there have been examinations of environmental impacts in different context, as described in [6,7], and socio-economic outlooks, as discussed in [8]. These analyses consider the implications of transitioning existing systems to electric mobility. However, the topic is often addressed either in a very broad or overly specific manner, leaving room for a more comprehensive investigation.
While electric mobility is a topic widely discussed in general and in the technical literature across various domains, the original attempt of this work is represented by the fact that it aims to integrate three priority aspects—energy considerations, electric vehicle analysis, and architectural design for charging infrastructure—to propose scalable solutions. By synthesizing these key elements, our approach facilitates the development of replicable strategies for advancing public mobility systems on a broader scale. Through this integration, we envision the gradual transformation of urban transportation networks towards sustainability.
The structure of this work is outlined as follows. Section 2 presents an overview of Electric Public Mobility, encompassing an examination of the current state of art, along with an exploration of current trends and prospects. Section 3 provides the methodology developed in the article for integration of a bus fleet with renewable energy system. In Section 4, a case study is conducted, focusing on the electrification of both urban and extraurban routes connected to a specific town. Section 4 delves into the potential integrated design of Photovoltaic (PV) plant and charging infrastructure. Section 5 endeavors to distill key findings from the case study analysis, while also offering reflections on prospects for the development of green-powered electric public mobility in both urban and interurban settings. Finally, the conclusions drawn from this study are presented.
2. Overview of Electric Public Mobility
Over the years, there has been a shift from a highly sectoral view of energy, where each flow was considered separately, often keeping the three most significant energy uses - thermal, mobility, and electric - distinct from each other to a perspective promoting greater integration among various energy streams (Figure 1), according to the vision developed in [9]. In this vision, the electrification of transportation plays a pivotal role. Within this context of enhanced integration, the concept of electric mobility, and electric vehicles in general, undoubtedly holds significance.
Electric vehicles and electric mobility represent compelling avenues for achieving progressive decarbonization of transportation. They facilitate a transition towards powering transportation systems, albeit indirectly, with renewable sources, while also contributing to load leveling in electrical grids. Moreover, their functionality in reducing environmental impacts, particularly in urban centers, is of paramount importance. Talking about electric vehicles in general is limiting. There are at least four distinct types, described in the table below using their ubiquitous acronyms, which are summarized in Table 1. A first significant difference is between a hybrid vehicle and an electric vehicle, can be simply explained, [10,11]. A hybrid vehicle is a vehicle equipped with a propulsion system with two or more components: an electric motor and a combustion engine that work in synergistic way. Hybrid electric vehicles consist of:
- -
- Internal combustion engine (ICE);
- -
- Fuel tank: primary source of the vehicle;
- -
- Electric machines: one or more electric machines that function both as motors and generators for energy recovery. The presence of electric motors typically helps the ICE to increase efficiency and reduce emissions;
- -
- Battery: secondary energy storage system on board the vehicle.
However, there are at least three different types of hybrid vehicles from the functional point of view, namely the Mild Hybrid Electric Vehicle (MHEV), the full, e.g., intermediate, Hybrid Vehicle (HEV) and the Plug-in Hybrid Electric Vehicle (PHEV). In addition to this classification relating to functionality, there is also a classification “by architecture” in the literature (e.g., parallel hybrid, series hybrid, etc.), [12].
The general difference concerns the electrical fraction that can be used. If a MHEV type vehicle will work almost exclusively on small amount of energy recovery, HEV and PHEV vehicles are distinguished by different charging methods, in the first case the battery can only be recharged internally, while in the second case the battery can also be recharged by an external Electric Vehicle Supply Equipment (EVSE). Proceeding from the MHEV type to the PHEV type, the percentage of electric operation of the engine will increase significantly.
The electric vehicle itself, conventionally called Battery Electric Vehicle (BEV), does not have an internal combustion engine and the name highlights what is the key element, namely the battery, which is nothing other than the “tank” of energy to run the engine.
The battery supplies direct current but, given that in general, alternating current motors are used, for this reason a DC/AC converter is inserted between the two systems.
Thinking about vehicles ranging from MHEV to BEV, a degree of hybridization of the engine can be defined, which can be identifiable both in terms of power and in terms of energy. If conventionally the degree of hybridization, [13] of the totally electric vehicle is 100 and that of the internal combustion engine is 0, for the others the degree of hybridization (DOH) can be defined with the following equations, depending on the considered hybrid architecture:
Where PICE and PEM are the power of internal combustion engine and of the electric motor, respectively.
From a conceptual point of view, the advantage of the electric car is clear. In a car with an internal combustion engine only part of the fuel energy is needed.
More than half is dissipated, either through exhaust gases or in the cooling system. In fact, if the engine’s “thermal control” system does not work, it melts in a few minutes.
The performance of the engine certainly depends on its operating conditions. In the case of the electric motor, however, all the energy is used to move the vehicle. However, it is also susceptible to variations, also depending on the type of driving.
3. Methodological Analysis
Companies that offer urban transport services are among the most energy-intensive companies and for them the problem of sustainability often arises, both from an energy and economic point of view. The service depends on:
- Orography of the territory served;
- Size and number of the fleet;
- Type of fleet (8-metre buses, 12-metre buses and 18-metre buses);
- Variety of fuels used (diesel, natural gas, hybrids and fully electric traction);
- Typical annual mileage of each vehicle.
In Italy, it is estimated that there are approximately 100,000 buses. Of these, about 44,000 are owned by companies that provide public transport services. These companies use the vehicles quite intensively, with mileage ranging from 33,000 km per year per bus to over 58,000 km in some cities such as Milan. Just to give an idea, in the urban area of Pisa, 27 buses are used. Just as example and to understand the relevance, the fleets of buses in service in different cities and the different distances are reported below, thanks to which you can get an idea of the energy uses associated with the companies of transport and how “energy-intensive” (Table 2). Furthermore, approximately 2/3 of the buses in service (66.8%) are more than 10 years old and therefore could be replaced in a fairly short time horizon [14].
The methodological part of the activity aims to evaluate the uses of energy necessary to cover specific urban and one extra-urban routes, taking into consideration the service currently provided and the availability of means required to carry out this type of service.
The methodology we will develop is divided into a series of levels.
The first level is that of defining the routes to be electrified. In this regard, we will take as reference a case of a totally urban route, to be covered with BEV type buses and an extra-urban one, to be covered with a plug-in hybrid bus, PHEV. In this last case we can think of a possible electric operation in urban areas at the beginning and end of the route and an operation by internal combustion engine in the connecting route. With the aim of maintaining the current level of service, analyzing the current situation, i.e., the route, the number of stops, the number of trips that are carried out, their frequency and the type of service (load level, traffic conditions, etc.). Necessary data for the lines are:
- -
- Distances and travel times (current configuration);
- -
- Timetables of the lines involved;
- -
- Position (Gauss-Boaga coordinates) of the stops in the route;
- -
- Commercial speed;
- -
- Transit intervals.
As a second level of the analysis, it will be necessary to insert the bus operating model; this is aimed at evaluating the energy uses needed to cover the routes examined and understanding the size of the storage systems needed for the bus. Figure 2 represents a possible operating model of the bus, represented by acceleration and deceleration phases, stop and restart phases and the route between stops hypothesized at cruising speed. As regards the values relating to the acceleration and deceleration of the bus and the cruising speed of the vehicles, useful for the definition of the characteristic equations of motion, as no measured data are available, the following estimates were considered reasonable:
- -
- Acceleration and deceleration: 0,8 m/s2 (as per technical literature)
- -
- Cruising speed, va: 30-50 km/h in urban areas
- -
- Cruising speed, vb: 50-70 km/h for extra-urban areas
Based on the model of the buses chosen, convert them into BEV and HEV architectures, trying to understand the sizes of the accumulations and the energy they must provide during the cycle, and therefore during the day, in the most unfavorable case possible (for example fully loaded bus of passengers, auxiliary devices at maximum power and route without traffic). Determine annual consumption based on application scenarios in which variables related to traffic, season and passenger load are present. To do that, a dynamic simulation model designed in Modelica language [15] has been developed in the past by some co-authors of the present paper, [16] and reused for the purpose of this study.
The hybrid and pure electric propulsion systems has been therefore modelled, and working condition examined under dynamic speed vs time profiles, both including auxiliary consumptions. Additionally, variable efficiency for electric machines and storage systems were taken into consideration. The third level of the analysis concerns the definition of the charging infrastructure, including the photovoltaic plant and the re-charge stations. The different steps of the methodology are summarized in Table 3.
The problem that arises in this case is to identify the sizing methodology of the systems themselves. The approach followed is to maximize summer production, assuming total coverage and reducing the charge level during the intermediate and winter seasons.
4. Analysis of Two Case Studies
In this section, two real cases are analyzed. The analysis refers to the city of Pisa, a medium-sized city representative of the Tuscan coastal strip and a city with some peculiarities. Two specific routes are examined for the study of the possible electrification hypothesis, one typically urban and one extra-urban. The first route (urban) is active every day of the year and connects the railway station with the famous leaning tower area, while the second route is a mixed extra-urban route, which connects the central station area with the coast, serving three several seaside locations, namely Marina di Pisa, Tirrenia and Calambrone. While the urban line is designed for a service that is the same throughout the year, 3 different types of service are provided for the extra-urban line:
- -
- typical weekday representative of 235 days/year (ordinary service level);
- -
- typical summer weekdays and holidays with activation for 70 days/year (maximum service level);
- -
- public holiday in the winter and intermediate station with activation for 60 days/year (reduced service level).
The idea is of covering the urban route using a totally electric bus (BEV) and instead covering the extra-urban route using a hybrid bus with direct battery charging (HEV plug-in) capable of operating in electric mode in urban areas and in conventional mode on the extra-urban route. The model of the electric or hybrid buses used, combined with the characteristics of the service to be carried out in the two cases and with a mathematical model of the electric or hybrid bus, will allow the energy consumption of the buses to be estimated with reference to different traffic and load conditions of the bus itself. This daily energy consumption will be used in the first instance to size the storage capacity of the batteries that will have to be placed on board the buses considering different means and different management methods. In section 5 we will proceed with the sizing of photovoltaic systems and charging columns capable of generating the energy necessary to totally or partially (depending on the seasons!) support the operation of the vehicles.
4.1. Analysis of Urban-Route
The first case examined is that of a completely urban route with a length of approximately 7.3 km. The service period covered is from 7:30 to 20:30 (13 hours) and transit intervals are 15 minutes. Considering that each bus takes approximately 25 minutes to cover the entire route in generally favorable conditions and that up to a maximum of 5 minutes stops are expected at the terminus to consider any delays in travel (obviously, if the journey lasts more than 25 minutes, the stop will be reduced so that the bus can leave again at the thirtieth minute). There are 26 stops on the route and many of these are used during normal operation. Figure 3 represents the route, while Table 4 summarizes the main data necessary to exactly identify the route, considering the total length, the number of intermediate stops, the duration of the travel from start to the end and the period of operation of the service. To evaluate the electrical uses of the route we used a self-built model of bus operation, based on the methodology described in Section 3. To proceed with the simulation and transform the travel data into energy consumption results, some technical parameters of the bus were necessary, which we defined by starting from existing commercial models of the buses under consideration, which were not necessarily electric.
For the urban route it was decided to simulate the operation of a bus, similar in size to the «Mercedes Citaro C2» with a length of 12,135 m, a fully loaded mass of 19,000 kg and tire size of 275/70 R22.5, which will be appropriately converted to the hypothetical form of electric vehicle BEV. Considering the developed bus model, it is possible to simulate a typical urban route, lasting approximately 25 minutes (1500 seconds) with 5 minutes of rest at the terminal. Figure 4 provides a specific case of full load, in which 23 of the 26 stops planned along the route are active, from which the energy consumption can be obtained.
Table 5 shows the typical consumption defined in an urban route. 4 different operating conditions were simulated, which try to put together the load condition (number of people in the bus, level of urban traffic) and the season, identifying the most extreme and intermediate seasons. Considering the winter and summer seasons, a suitable air conditioning system for the bus must also be used. In consideration of the available technical literature, 2 kW of auxiliary systems are envisaged in the intermediate season, in which no air conditioning is provided, and 9 kW of auxiliary systems, including the air conditioning system, the operation of which will subtract further energy from the battery. The values are quite in line with the common literature data, which identify consumption data for 12 m urban electric buses, in the range between 0,9 and 1,4 kWh/km, with a slightly higher level obtained for the extreme conditions.
To evaluate the real energy use of the bus in urban service, it will be necessary to take into account the fact that in a typical daily cycle, obviously not all trips will be in full load conditions; in a realistic scenario we will be able to consider that of the 26 daily cycles performed by the single bus in service on the line, 50% could be considered at full load and 50% at reduced load. Table 6 summarizes the total daily energy use with reference to some cases. In the table, approximately 4 operating conditions are highlighted, from the one that uses the most energy (A) to the one with the least energy impact (D). The analysis of the data in Table 6 is interesting because it provides an estimate of the size of the batteries that must be placed on board the vehicles to carry out the service for the whole day without any supplementary recharge during the day. Considering the value of 280 kWh as the upper limit and because a lithium type battery can be used up to a maximum of 80% of its charging capacity, in normal conditions a battery with a capacity of 279,78/0.8 = 350 kWh. This can be considered a standard size that can already be found in some commercial buses already available in the market (as the model BYD K9UB, [17]).
4.2. Analysis of the Extra-Urban Route
The second case examined is that of a mixed route with a high extra-urban component, approximately 45 km long. The service period covered is from 7:00 to 21:00 and transit intervals are 30 minutes. Considering that each bus takes approximately 1 and a half hours to cover the entire route in generally favorable conditions and that up to a maximum of 30 minutes of stopping at the terminus are expected to consider any delays in travel. There are 94 stops on the route; some of these are in the suburban area and are not used much, but a good number of them are still used. Figure 5 provides an overview of the Table 5 summarizes the key data necessary to cover the route. The operation shown in Table 2 refers to the summer season. In the winter period and in the intermediate season the service is reduced, and courses are reduced from 7 to 5 for each day and for each bus.

Table 7.
Data about the extra-urban route (during summer period).
| Title 1 | Title 2 |
|---|---|
| Length of the route | 44819 m |
| Ride duration | 2 h (1h 30 min plus 30 min at terminus) |
| Number of stops | 94 |
| Service hours | 7:00-21:00 |
| Transit interval | 1 hour (30 min) |
| Number of travels for each bus | 7 |
| Number of buses for the route | 2 (4) |
To analyze the extra-urban route, it was instead decided to simulate the operation of a commercial bus with a length of 18,125 m, like the “Mercedes Citaro O 530 G” bus with a full load mass of 28 000 kg and tire size of 275/70 R22.5. This bus will also then be appropriately converted into the hypothetical form of a plug-in hybrid bus (PHEV) considering the appropriate constraint on the maximum permissible mass, equal to 28 000 kg. To evaluate the energy uses of the bus, approximately 20 km of service were considered, considering the city route and the coastal route (Figure 5) covered by the electric motor and the remaining 24,8 with the internal combustion engine. Table 8 reports estimates related to energy uses in different operating conditions. The authors have not considered algorithms currently implemented on-board existing vehicles; therefore, they have considered a heuristic strategy, in which, in hybrid mode, the ICE works in slowly variable maximum efficiency zones, with correction on battery State-Of-Charge (SOC), to avoid drifts over time. Results indicated as “HEV mode” in the next Table 8, relate on this working condition. On the other hand, when the ICE is switched-off, battery remains the only energy source on-board. In this way, results regarding “Pure electric mode” are always indicated in Table 8.
From the results, it must be considered that when the bus stops at the terminal for 30 minutes before starting a new journey, this time could be used to recharge the storage on-board. This allows the battery to be sized with a lower nominal energy, compared to the daily energy required to complete the route. Therefore, a value of 150 kWh can be considered sufficient to meet the energy requirements during the route, where the bus operates in pure electric mode.
4.3. Analysis of the Energy Required for Electrification of the Two Routes
At this point, by jointly analyzing the two urban and extra-urban routes, considering the need to cover the routes with two buses each, it is quite simple to make an estimate of the necessary daily electricity requirement, which will then be necessary for the sizing of the system photovoltaic and charging infrastructure, which will be taken into consideration in the next section. Table 9 reports in particular some general estimates, taking the most interesting cases as reference and referring them to specific seasons, considering the two buses involved in both the routes. Obviously, the data reported in the table only represent reference data values of the 5 main clusters into which the load has been divided on the basis of a realistic operating hypothesis, as intermediate data can also be verified.
Therefore, it can be seen that the daily load can vary from approximately 600 kWh per day, in the case of reduced loads, which occur especially in the intermediate seasons, up to approximately 2050 kWh per day, which occurs on some days of the summer season, when the marine service is active at full load and even the urban route is still at maximum load, due to the high tourist flows in the town. The data reported in Table 9 can also lead to a general evaluation of the uses of electricity that can be made on an annual basis with this strategy, thinking about a distribution of the days of activity based on a hypothesis of the different types of days. In fact, one can think that only a few days will be those attributable to cases of maximum energy use (10 days), a good number will be attributable to the conditions reported in rows 3, 4 and 5 of Table 9 (290 days) and the remaining 75 days of year may be considered with full service loads (rows 1 and 2 of Table 9).
5. Sizing of the PV Plant and Definition of Recharge Infrastructure
In this section we attempt to size a photovoltaic system capable of powering buses sized based on the previous evaluations. A schematic architecture of the energy system, including the recharge structure is schematized in a simple way in the following Figure 6. The connection to the national electricity grid is obviously necessary to guarantee the possibility of recharging even in the phases in which the productivity of the photovoltaic system will not be sufficient to cover the daily energy demand.
The concept is to insert an appropriate charging structure in which the 4 buses can be recharged during the evening and night phases (period from 9 p.m. to 7 a.m.) powered by a photovoltaic system of appropriate size. Obviously, a partial supply of mobility systems can be envisaged, so a solar fraction, sf, can be defined as.
A separate consideration would require the sizing of the storage system to be arranged in connection with the plant. From a conceptual point of view, since the production period of the photovoltaic system is totally out of phase with the charging phase, as this occurs during the night, the dimensions of the storage system should be of the order of the maximum producibility of the system. However, other possible solutions cannot be ruled out, which provide for a different daytime use of the energy produced by the photovoltaic system. We will not delve into this specific aspect.
5.1. Sizing of PV Plant
The criterion that was considered is the following: the sizing of the system is done assuming that 100% coverage can be obtained during the summer period excluding the period of Full Service evidenced in Table 9. This methodology also ensures significant load coverage in many periods of the intermediate season. Obviously, the coverage produced by the system may be reduced during the winter period, while during the intermediate season the coverage of the energy demand may still be significant, being able to benefit from the reduction in the average consumption of buses. In general, the connection with the electrical grid permits to obtain the required energy supply during the whole period, including cloudy and days with bad climatic conditions during the summer period.
The energy produced by a PV power plant can be estimated as the product of the solar irradiation typical for the specific place at a given exposure, HSN, (the daily value can be considered) and the balance of system efficiency, BOS, the coefficient of shading kSHADE, considering the various electrical losses in the system, and the peak power of the PV plant, PPV.
So, the sizing of the system is quite simple, assuming that the productivity for each kW of peak power can be estimated knowing the solar irradiation in the specific site and considering an appropriate value of the balance of system efficiency, in the range between 0,75 and 0,85 (for example 0.8) and assuming a defined value of the shading coefficient.
The level of solar irradiation in the city of Pisa and the typical daily producibilities are shown for example in Table 10. During the summer season we can consider the maximum level of producibility of the photovoltaic system, and this is of the order of 5,4 kWh for each peak kW installed.
Obviously not all the energy generated by the photovoltaic system will go to recharge the bus battery, since, as also shown in Figure 6 there are several steps, and it is necessary to consider the efficiencies of the different subsystems. In general, a “roundtrip efficiency”, of the system can be defined as the ratio between the total energy coming out of the photovoltaic system and that which will reach the bus batteries, taking into account any battery in the system, which will still be necessarily have as production is done on a daily basis, and the charging station. In general, this can therefore be defined as the product of the efficiency of the battery, and the efficiency of the charging station, i.e.,:
Considering that a suitable round-trip efficiency will have to be taken into account for the structure, linked to the various transfers, assuming that this can be maintained at levels of the order of 0.8, in order to have at least 850 kW of useful daily power (typical energy required in the summer season when four buses are used for the service, it will be necessary a production of at least 1050 kWh per day, which can be generated by a plant with peak power of the order of 190-200 kW. The productivity of the photovoltaic system will obviously reduce on days when the climate is unfavorable and in the remaining months of the year. The value of the reduced productivity can be easily estimated by considering the insolation values reported in Table 10.
5.2. Definition of the Structure
The structure of the facilities in the form of shelters is also defined. There are several solutions in the literature that attempt to summarize vehicle charging stations and architectural elements, such as canopies and shelters, suitable among other things for the insertion of components of systems powered by renewable sources (such as photovoltaic systems). The solutions are divided between complete charging stations, to be installed at the terminus of the routes, where the bus can park for relatively long periods, and “booster” type charging stations, which can be inserted along the bus route and where it can recharge quickly. It was decided not to take this opportunity into consideration, however analyzing an intermediate solution.
The structure defined is represented in the different perspectives in Figure 7 and Figure 8. It has dimensions of the order of 4 m in width and approximately 20-22 m in length, capable of accommodating without problems both 12-meter buses and 18 m buses (the width of the two buses is approximately 2.55 m), like those analyzed in the work.
This structure is conceived to connect 30-33 PV modules of dimensions of about 1-75-2 m2 of total surface, the typical size of commercial modules of 400-430 W peak power. Considering this, each shelter is designed for 12-14,2 kW power plant, with minimum difference in the exposed surface. Figure 7 and Figure 8 provides the dimensional details too. For example, using 410 W commercial modules, such as those available in [15], each shelter allows you to generate a power of approximately 12,30-13,53 kW (the first is referred to the version with 30 modules and the second to the version with 33 modules) and 14 shelters (a total of 462 modules) or 16 shelters (a total of 480 modules) can allow you to create a system of approximately 190 kW or 196,8 kW, which can be considered sufficient to power the 4 charging columns for the 4 buses involved in the more conventional service. As regards the charging columns, given the quite long time available for charging (around 10 hours from 21 p.m. to 7.a.m), four conventional 50 kW charging columns may be sufficient to carry out the operations. If four shelters are adjacent to the four charging stations, the other 10 or 12 can be used for the other buses (non electric). Figure 9 and Figure 10 illustrate from a qualitative point of view both the arrangement of close-by shelters (Figure 9) and provide an idea of the arrangement of the 16 shelters on a parking area (Figure 10).
The methodology developed, although tested in the city of Pisa, can be easily extrapolated to other cities and other situations, to begin to systematically structure electric mobility systems. Even if it is not conceivable to electrify in a systematic and rapid manner, the idea developed in this article is to proceed with a progressive decommissioning of older buses and replace them with electric vehicles and progressively develop a photovoltaic infrastructure that will be able to progressively implement electric to be used especially in urban centers, contributing to a progressive energy transition.
6. Conclusions
The work analyzed the possibility of proceeding with a progressive electrification of urban mobility routes, starting from the analysis of two real cases, a completely urban route, and an extra-urban route, both with reference to the city of Pisa.
After a rapid analysis of the mobility companies and the complexity of the cases and the number of vehicles, an initial electrification of two routes relating to the city of Pisa was attempted.
Using a bus operation model, the first step was to adapt the electric buses to the routes. We have seen how for both urban and extra-urban routes the sizes that have emerged are in line with those of the vehicles that are marketed today. In fact, as regards energy use, for urban routes a daily consumption has been estimated which can range from the minimum level of just over 200 kWh per day to around 280 kWh per day in the case of the heaviest loads, values which allow to use vehicles that are already available on the market, equipped with a battery with a capacity of approximately 350 kWh.
As regards the extra-urban route, it was decided to use plug-in hybrid vehicles. In this case, electricity uses range from less than 100 kWh per day to approximately 144 kWh per day. Overall, considering the 4 vehicles used, a daily energy requirement was estimated, which turned out to be of the order of approximately 850 kWh.
Once the requirement had been established, the charging infrastructure was sized, defining the size of the photovoltaic system, which was just under 200 kW, and creating a modular structure (of 12-14 kW of power) capable of fixing the necessary modules.
With this solution it will be possible to achieve almost total coverage of the energy required at least in the summer months and in the months of the mid-season (from April to October included), limiting significant energy withdrawals from the grid to the winter months.
This solution can be easily implemented in other contexts and is configured as a very general solution. Replacing this modular section of the plant, it is possible to obtain various power plant, idoneous to provide, if opportunely connected to the various components of the plant, energy for bus charge.
Author Contributions
Conceptualization, A.F. and G.L.; methodology, A.F., G.L.,M.G.B.; software, G.L., F.G.Q., M.V.; validation, A.F., G.L., F.G.Q.; formal analysis, A.F., G.L., F.G.Q., M.V.; investigation, A.F., G.L. M.G.B., F.G.Q., M.V.; resources, A.F., G.L., M.G.B, F.G.Q, M.V; data curation, A.F., F.G.Q., M.V.; writing—original draft preparation, A.F.; writing—review and editing, A.F., G.L., M.G.B, F.G.Q, M.V.; visualization, F.G.A., M.V.; supervision, A.F., G.L, M.G.B; project administration, A.F.; funding acquisition, A.F. All authors have read and agreed to the published version of the manuscript.
Funding
The authors gratefully acknowledge the financial support of the University of Pisa (UNIPI), in the framework of the Research Project PRA 2022_31: MetOdi per riDurre gli usi di EneRgiA Termica ed Elettrica in ambito civile e industriale (MODERATE).
Acknowledgments
The authors would like to thank Prof. Massimo Dringoli, and eng. Cesare Vallini of the Municipality of Pisa, and the Engineers Andrea D’Addario and Luca Bersaglini of company “Autolinee Toscane”, for sharing some information relating to the urban and extra-urban routes of the Municipality of Pisa and technical data about vehicles, very useful for the development of the paper.
Conflicts of Interest
The authors declare no conflicts of interest.
References
- IEA. World Energy Outlook 2023, IEA, Paris, 2023. https://www.iea.org/reports/world-energy-outlook-2023, Licence: CC BY 4.0 (report); CC BY NC SA 4.0 (Annex A).
- IEA. World energy balances and statistics. World Energy Balance 2019. 2019. https://www.iea.org/subscribe-to-data-services/world-energy-balances-and-statistics.
- Perumal, S.S.; Lusby, R.M.; Larsen, J. Electric bus planning & scheduling: A review of related problems and methodologies. European J. Oper. Res. 2022, 301, 395–413. [Google Scholar] [CrossRef]
- Manzolli, J.A.; Trovao, J.P.; Antunes, C.H. A review of electric bus vehicles research topics–Methods and trends. Renew. Sustain. Energy Rev. 2022, 159, 112211. [Google Scholar] [CrossRef]
- Al-Ogaili, A.S.; Al-Shetwi, A.Q.; Al-Masri, H.M.; Babu, T.S.; Hoon, Y.; Alzaareer, K.; Babu, N.P. Review of the estimation methods of energy consumption for battery electric buses. Energies 2021, 14, 7578. [Google Scholar] [CrossRef]
- Pietrzak, K.; Pietrzak, O. Environmental effects of electromobility in a sustainable urban public transport. Sustainability 2020, 12, 1052. [Google Scholar] [CrossRef]
- Holland, S.P.; Mansur, E.T.; Muller, N.Z.; Yates, A.J. The environmental benefits of transportation electrification: Urban buses. Energy Policy 2021, 148, 111921. [Google Scholar] [CrossRef]
- Quarles, N.; Kockelman, K.M.; Mohamed, M. Costs and benefits of electrifying and automating bus transit fleets. Sustainability 2020, 12, 3977. [Google Scholar] [CrossRef]
- Franco, A.; Salza, P. Strategies for optimal penetration of intermittent renewables in complex energy systems based on techno-operational objectives. Renew. Energy 2011, 36, 743–753. [Google Scholar] [CrossRef]
- Denton, T. Electric and hybrid vehicles. Routledge. 2020.
- Hannan, M.A.; Azidin, F.A.; Mohamed, A. Hybrid electric vehicles and their challenges: A review. Renew. Sustain. Energy Rev. 2014, 29, 135–150. [Google Scholar] [CrossRef]
- Ehsani, M.; Gao, Y.; Emadi, A. Electric and Hybrid Vehicles: Design Fundamentals, 2nd ed.CRC Press: Boca Raton, FL, USA.
- Maddumage, W.U.; Abeyasighe, K.Y.; Perera MS, M.; Attalage, R.A.; Kelly, P. Comparing fuel consumption and emission levels of hybrid powertrain configurations and a conventional powertrain in varied drive cycles and degree of hybridization. Наука и техника. [CrossRef]
- https://www.isfort.it/wp-content/uploads/2023/01/221215_RapportoMobilita2022_Def-1.pdf.
- Fritzson, P. Principles of Object-Oriented Modeling and Simulation with Modelica 3.3: A Cyber-Physical Approach, 2nd ed.Wiley-IEEE Press: Hoboken, NJ, USA.
- Huria, T.; Lutzemberger, G.; Pede, G.; Sanna, G. (2010) Systematic development of series-hybrid bus through modelling”, Vehicle Power and Propulsion Conference (VPPC), 2010 IEEE, 1-3 Sept. 2010, Lille.
- https://bydeurope.com/pdp-bus-model-12.
- https://www.solarenergypoint.it/shop/eging-pv-eg-410m54-hlv-modulo-fotovoltaico-monocristallino-410w.
Figure 1.
The transition from a sectoral vision to an integrated vision of energy systems.
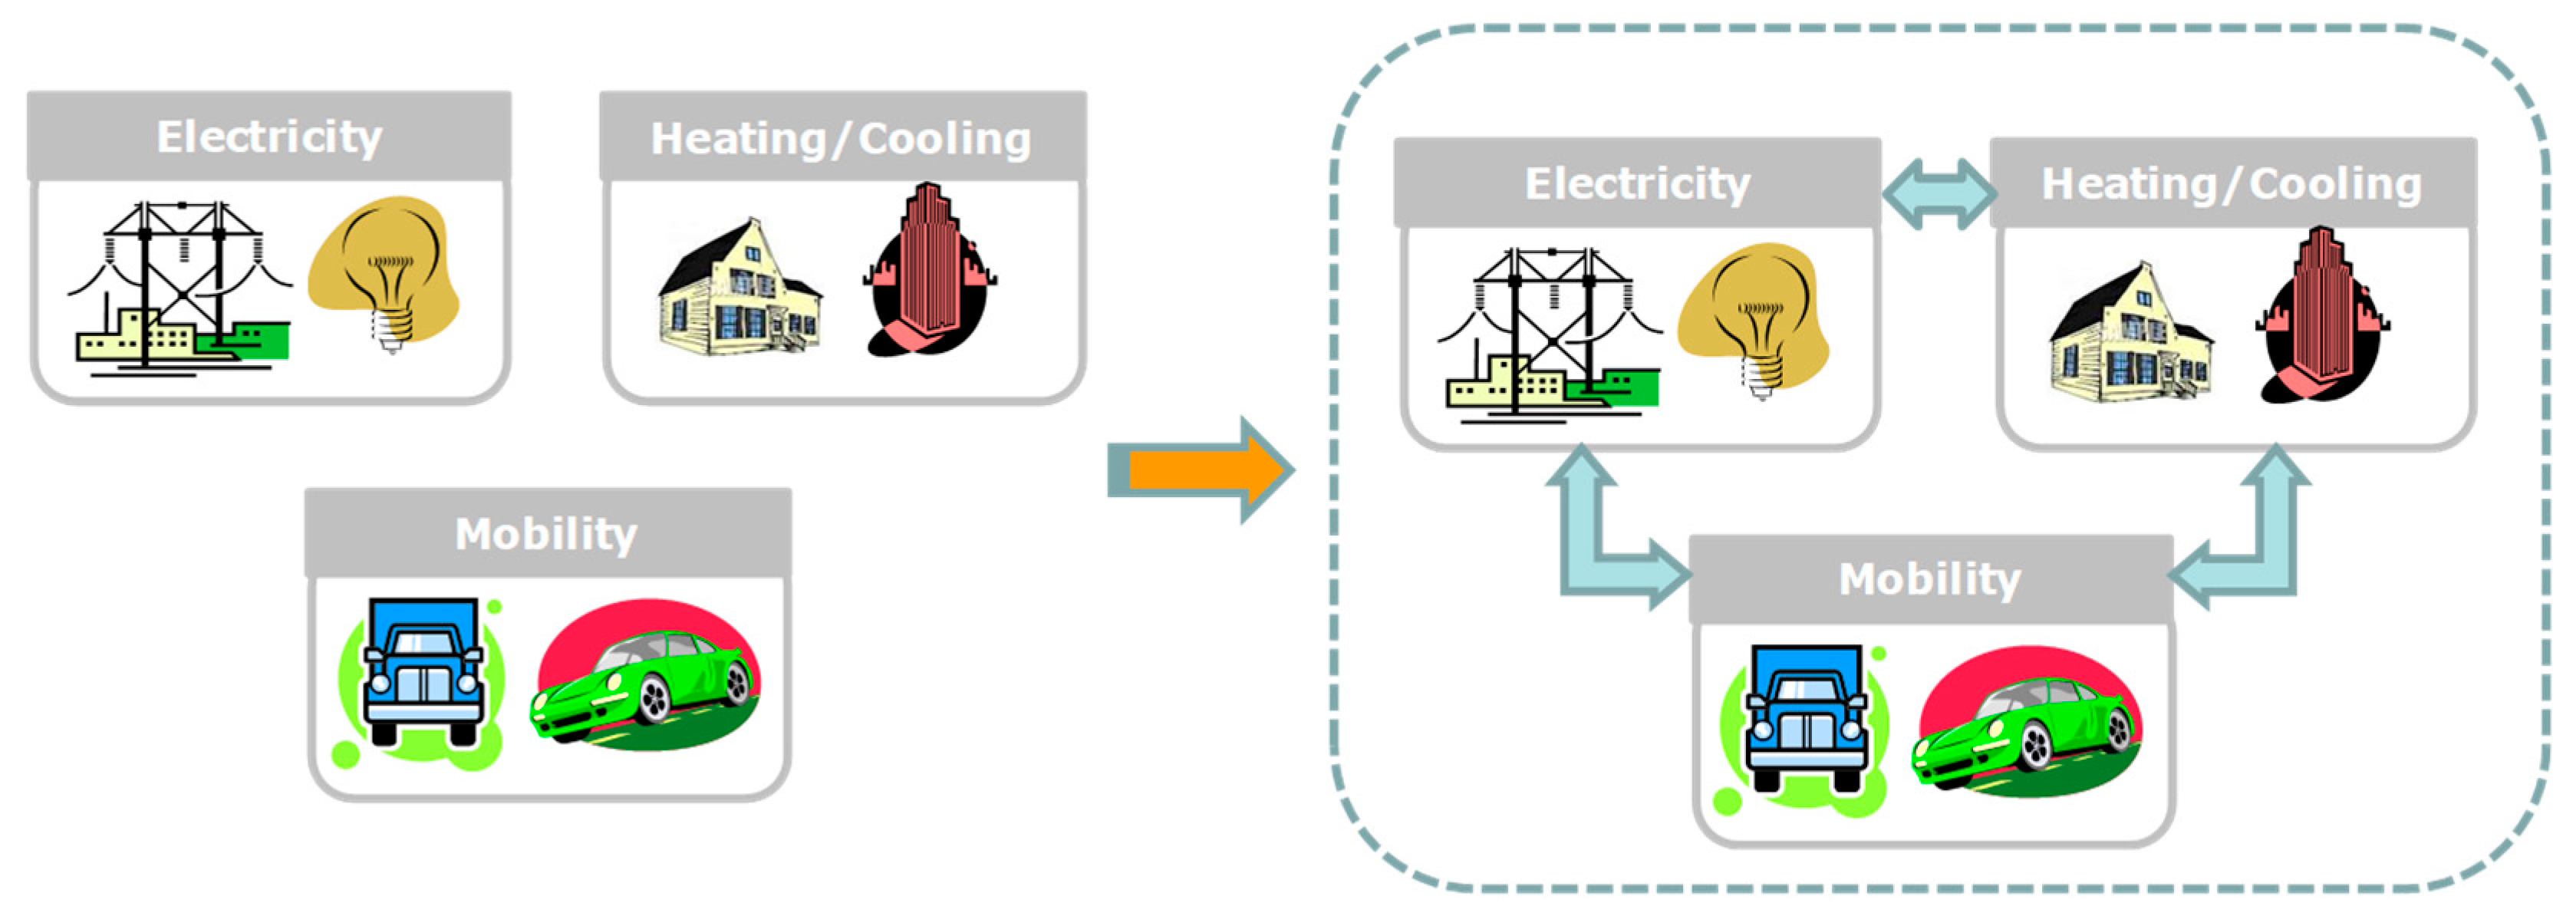
Figure 2.
A typical operating model of the bus.
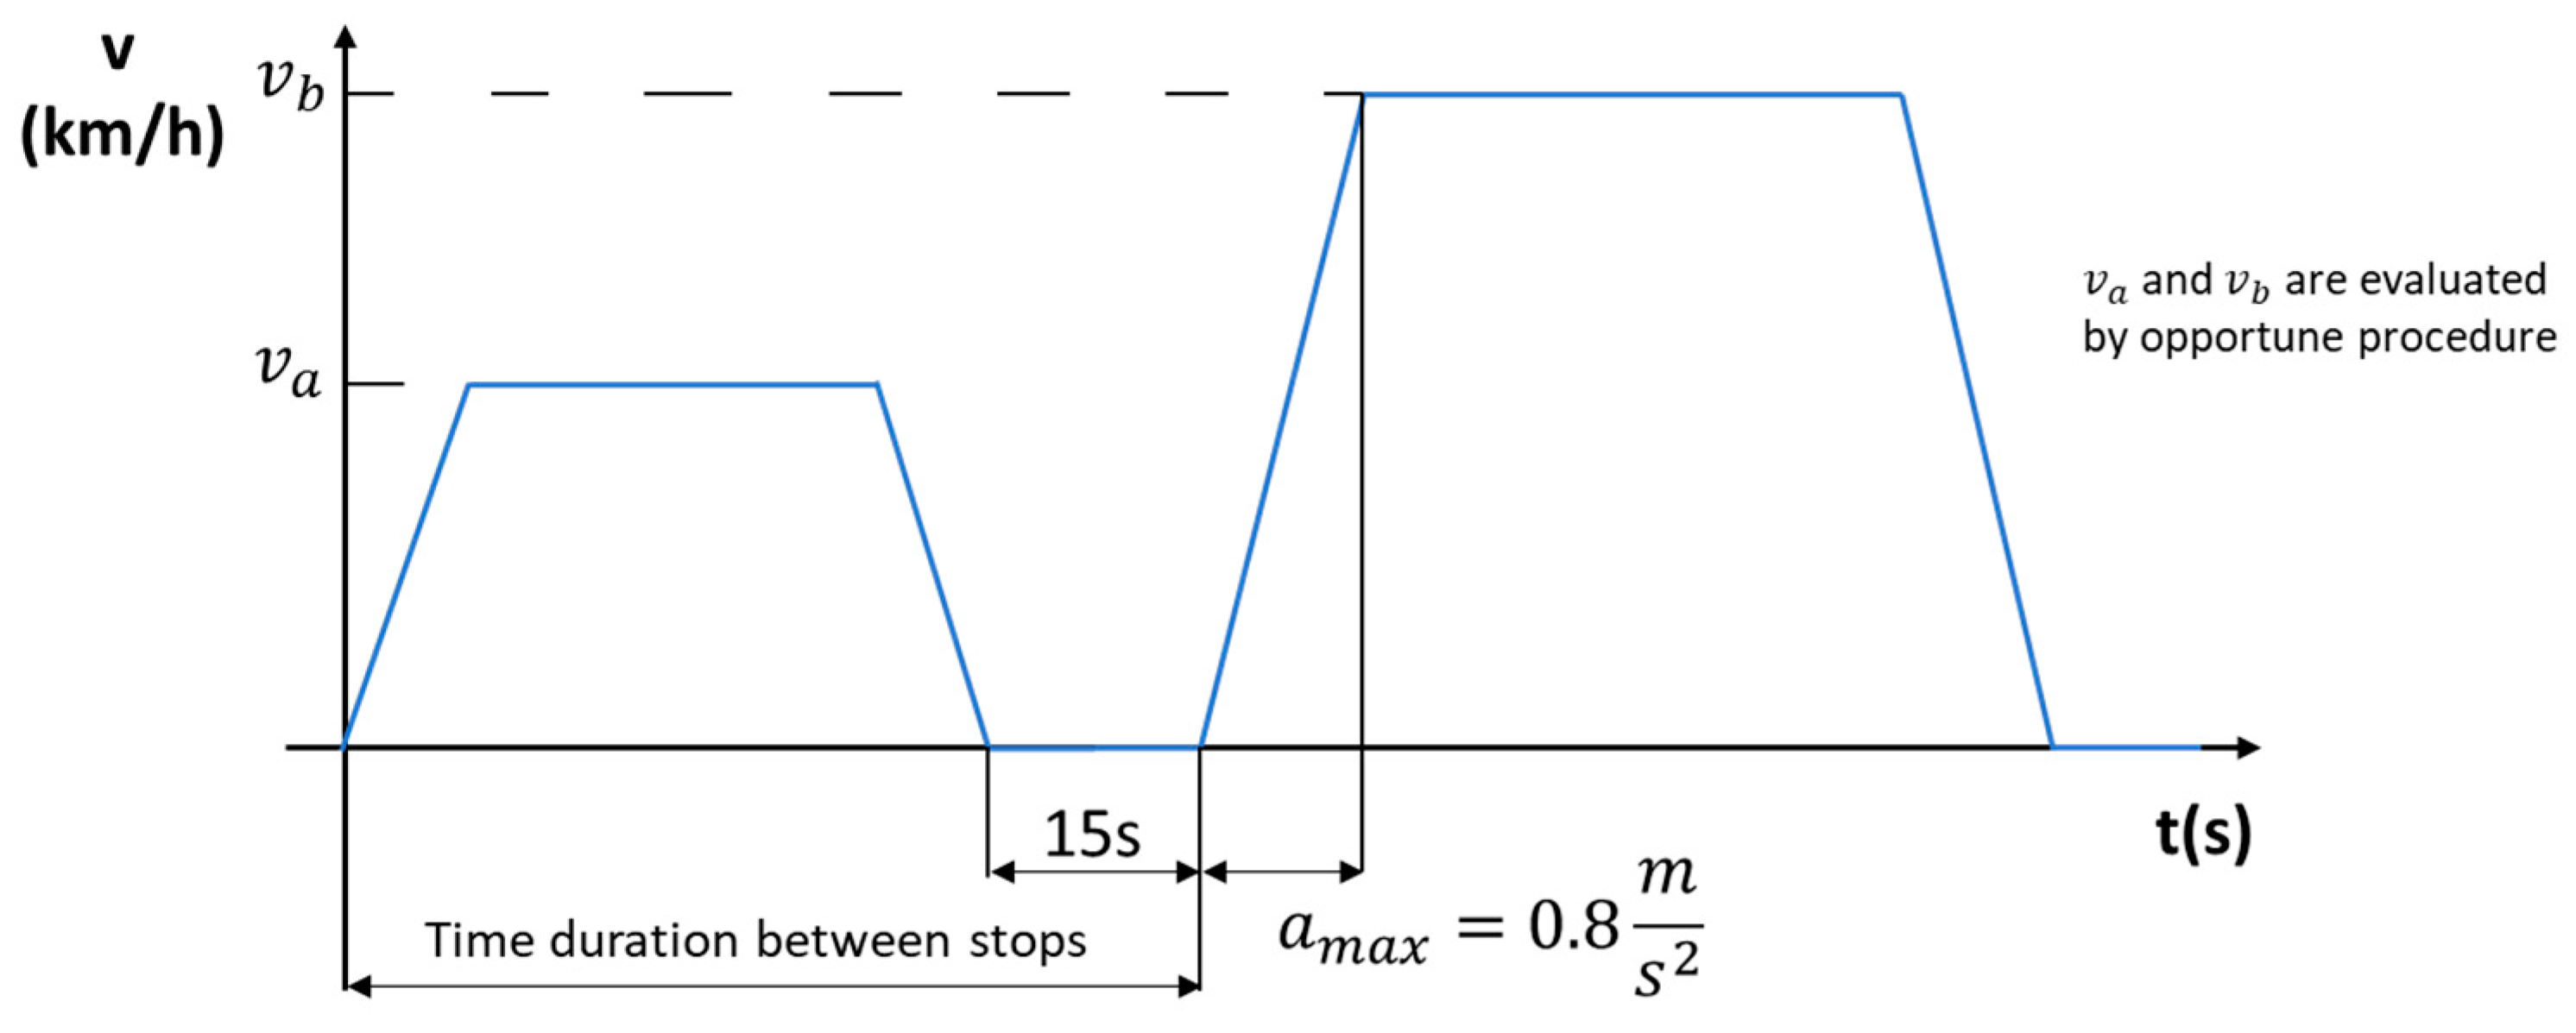
Figure 3.
Representation of the urban route round trip with Terminus and the two different ways.
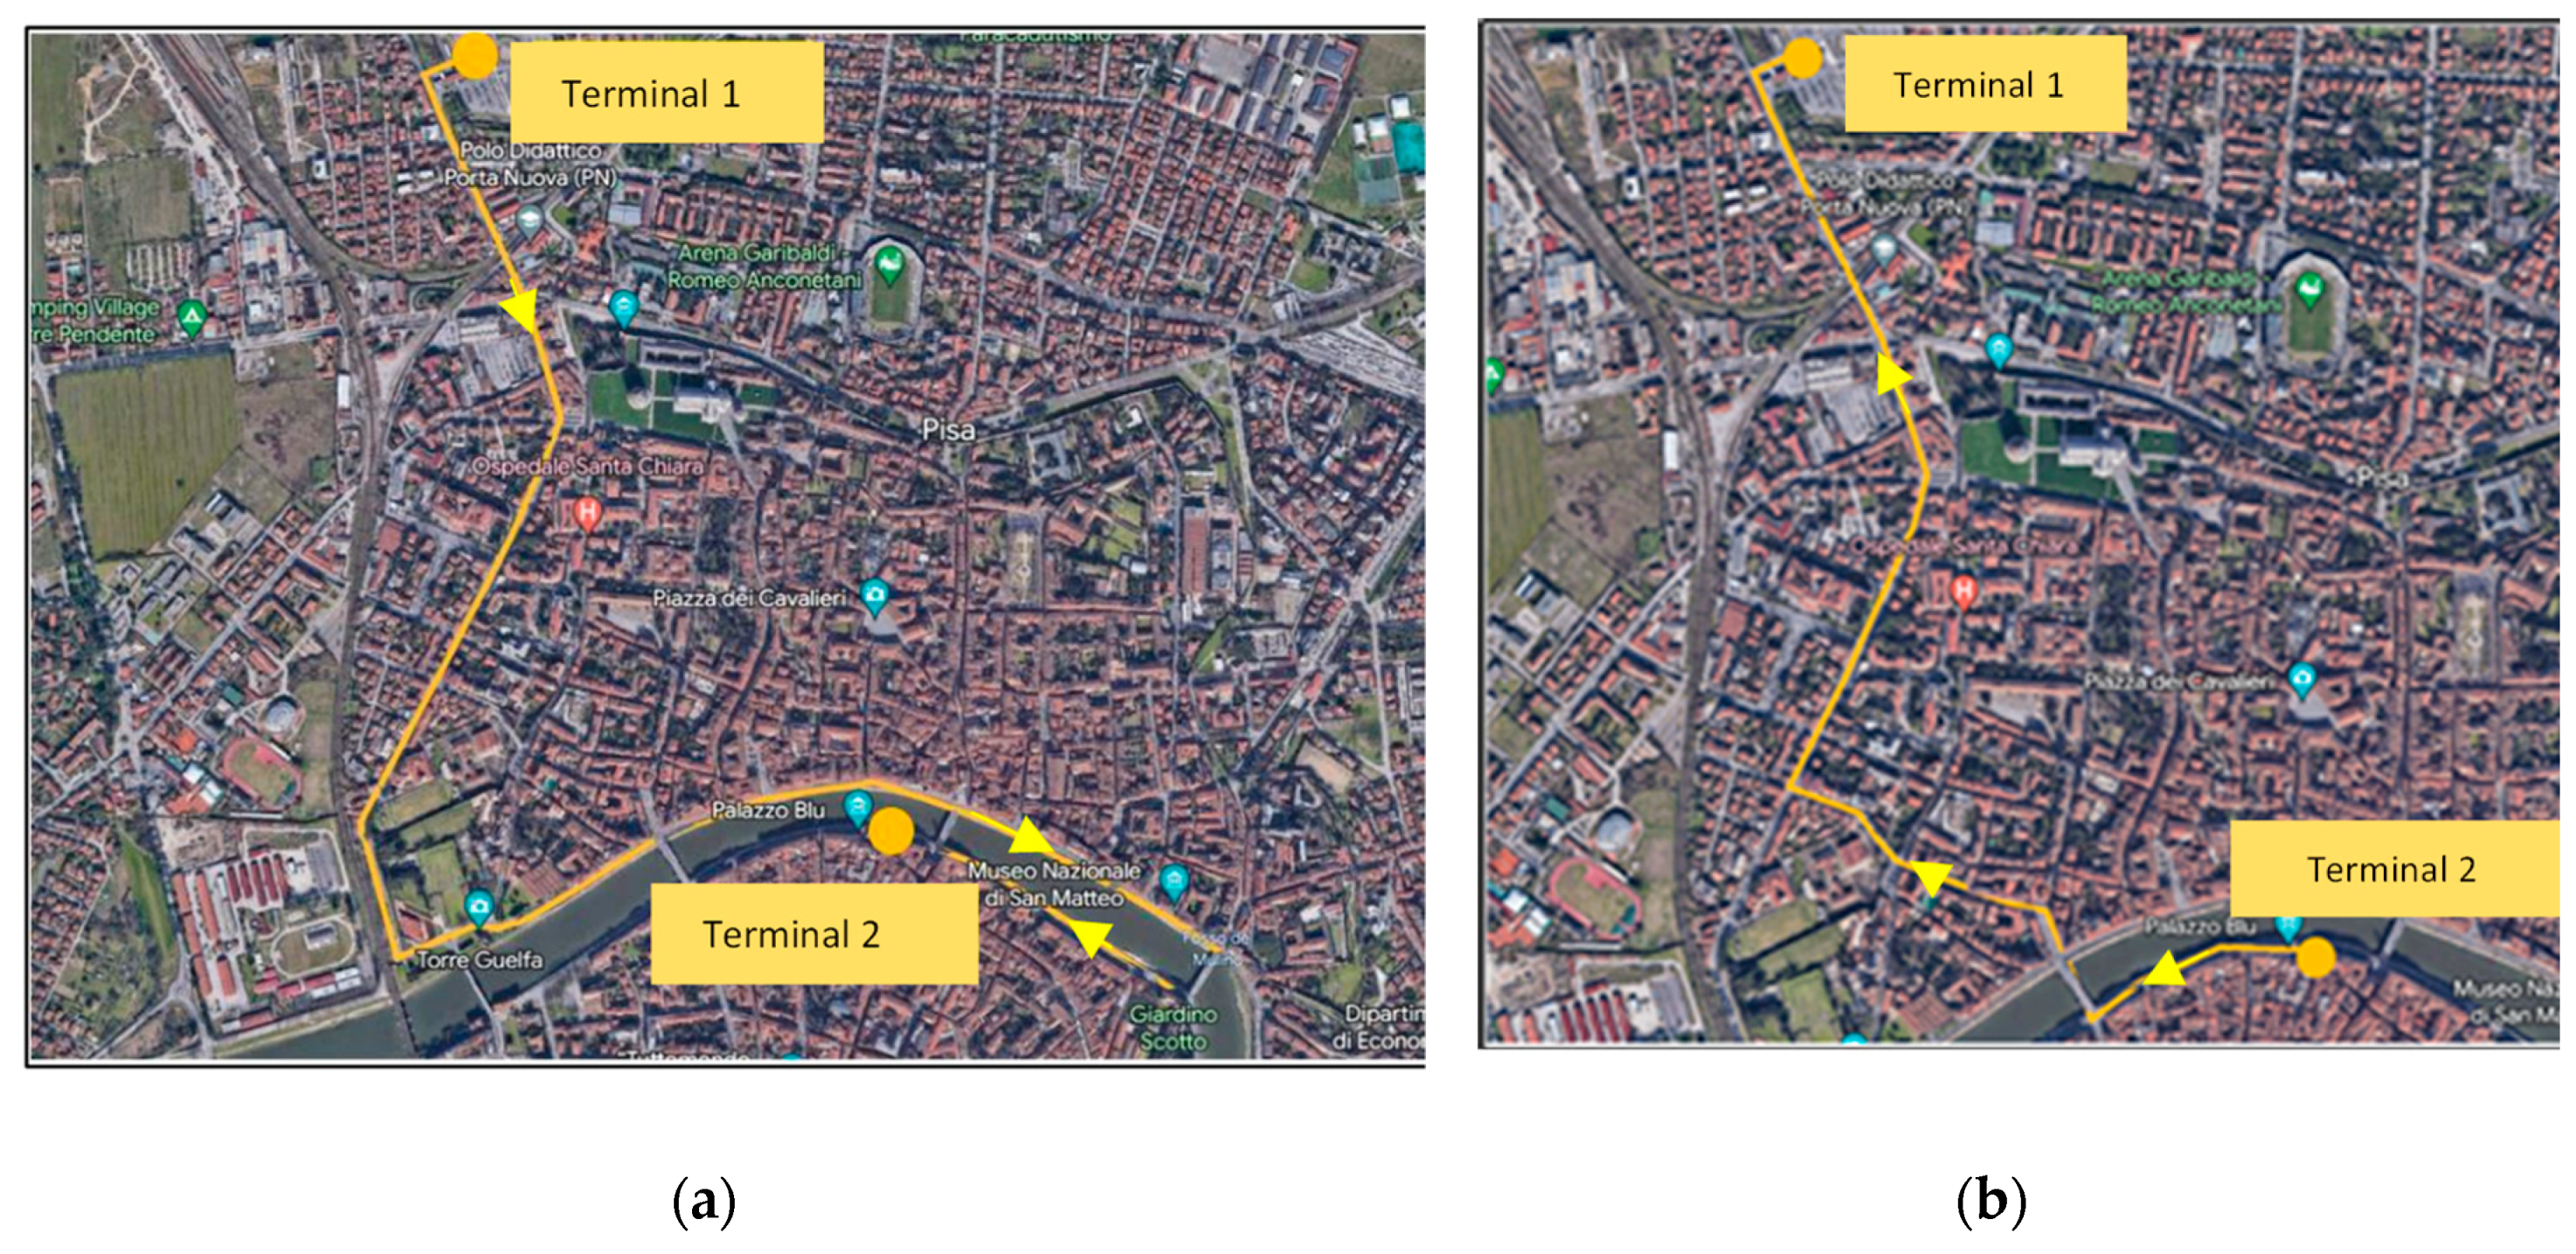
Figure 4.
Model for the urban route.
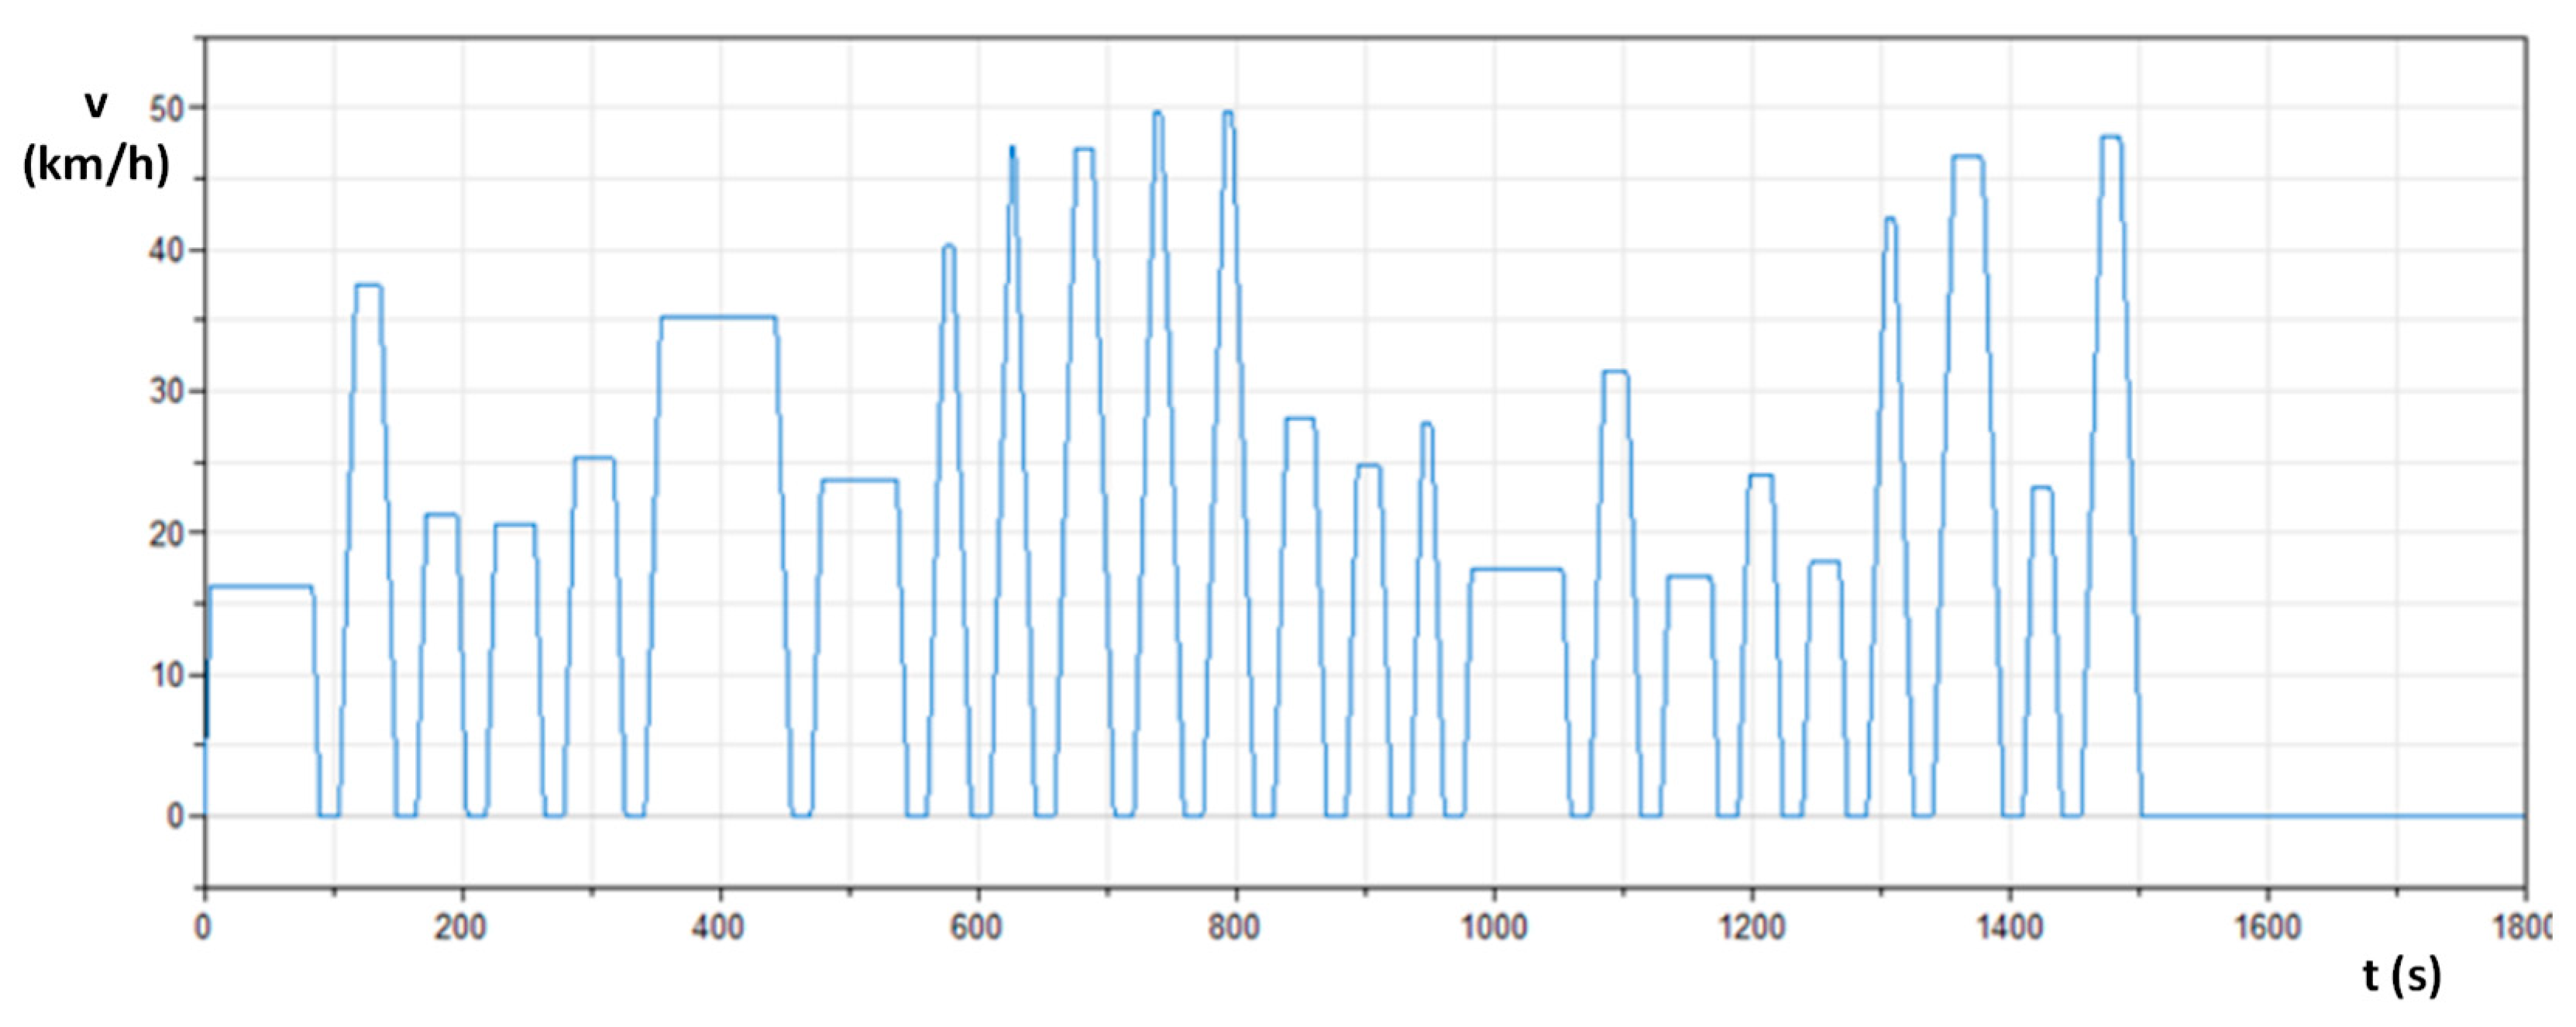
Figure 5.
This is a figure. Schemes follow the same formatting.
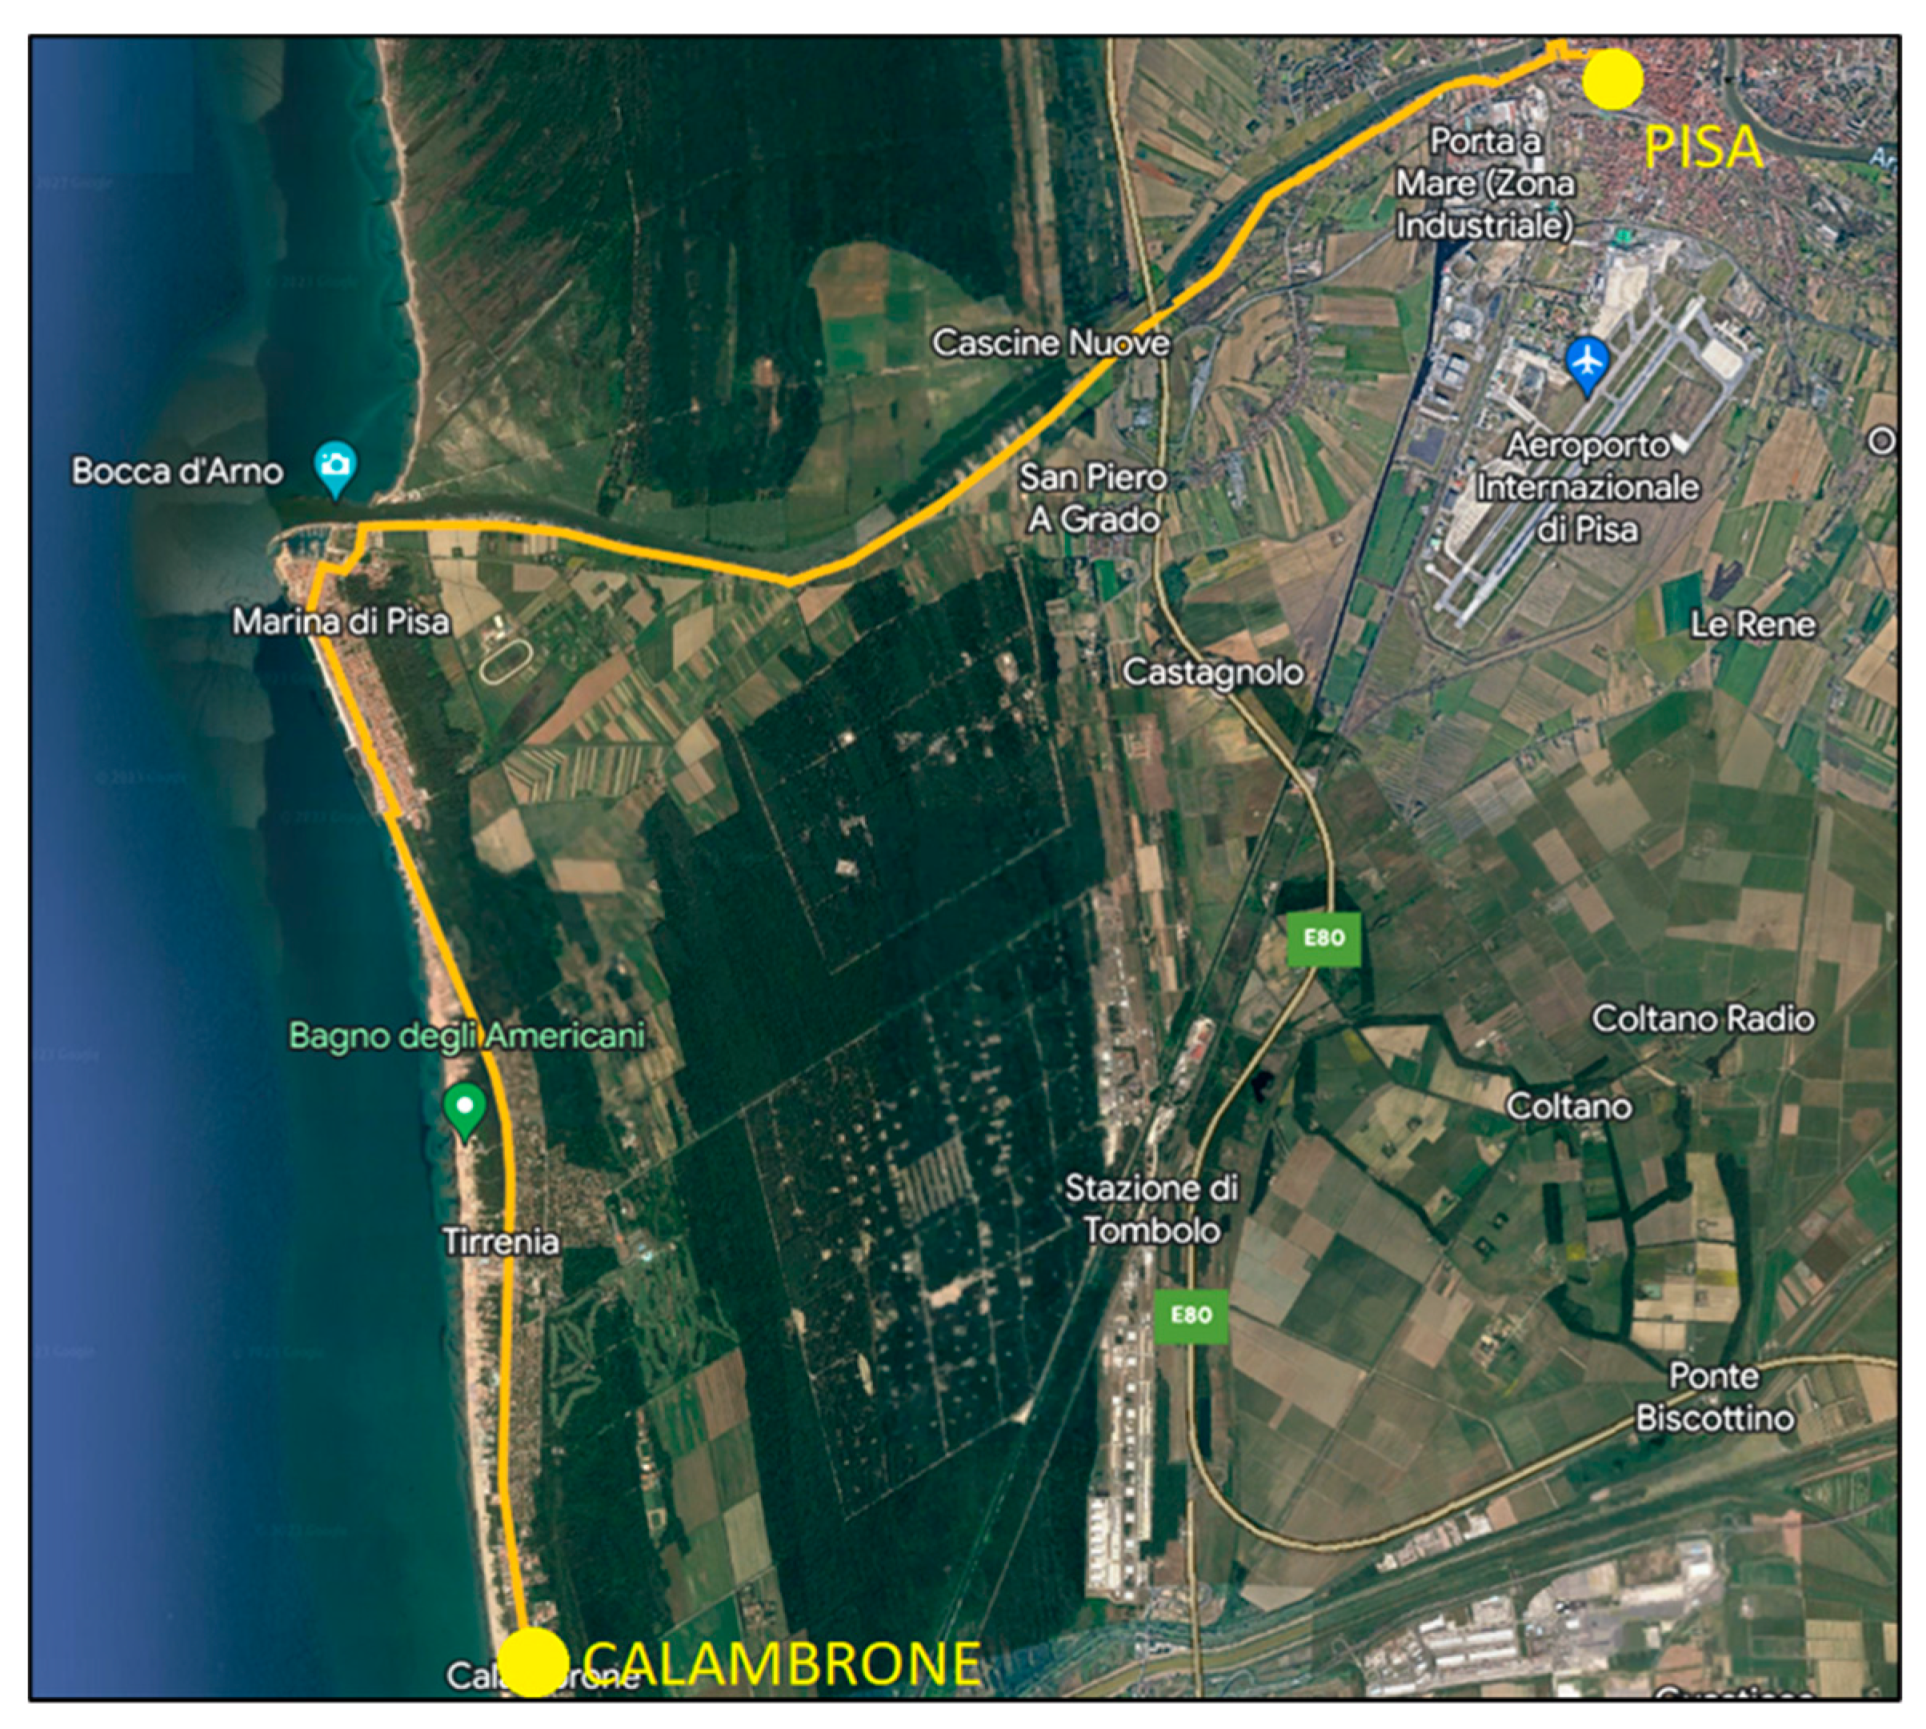
Figure 6.
Simplified schematic architecture of the charging infrastructure, consisting of a photovoltaic system, storage system, charging column and connection to the electricity grid.
Figure 6.
Simplified schematic architecture of the charging infrastructure, consisting of a photovoltaic system, storage system, charging column and connection to the electricity grid.
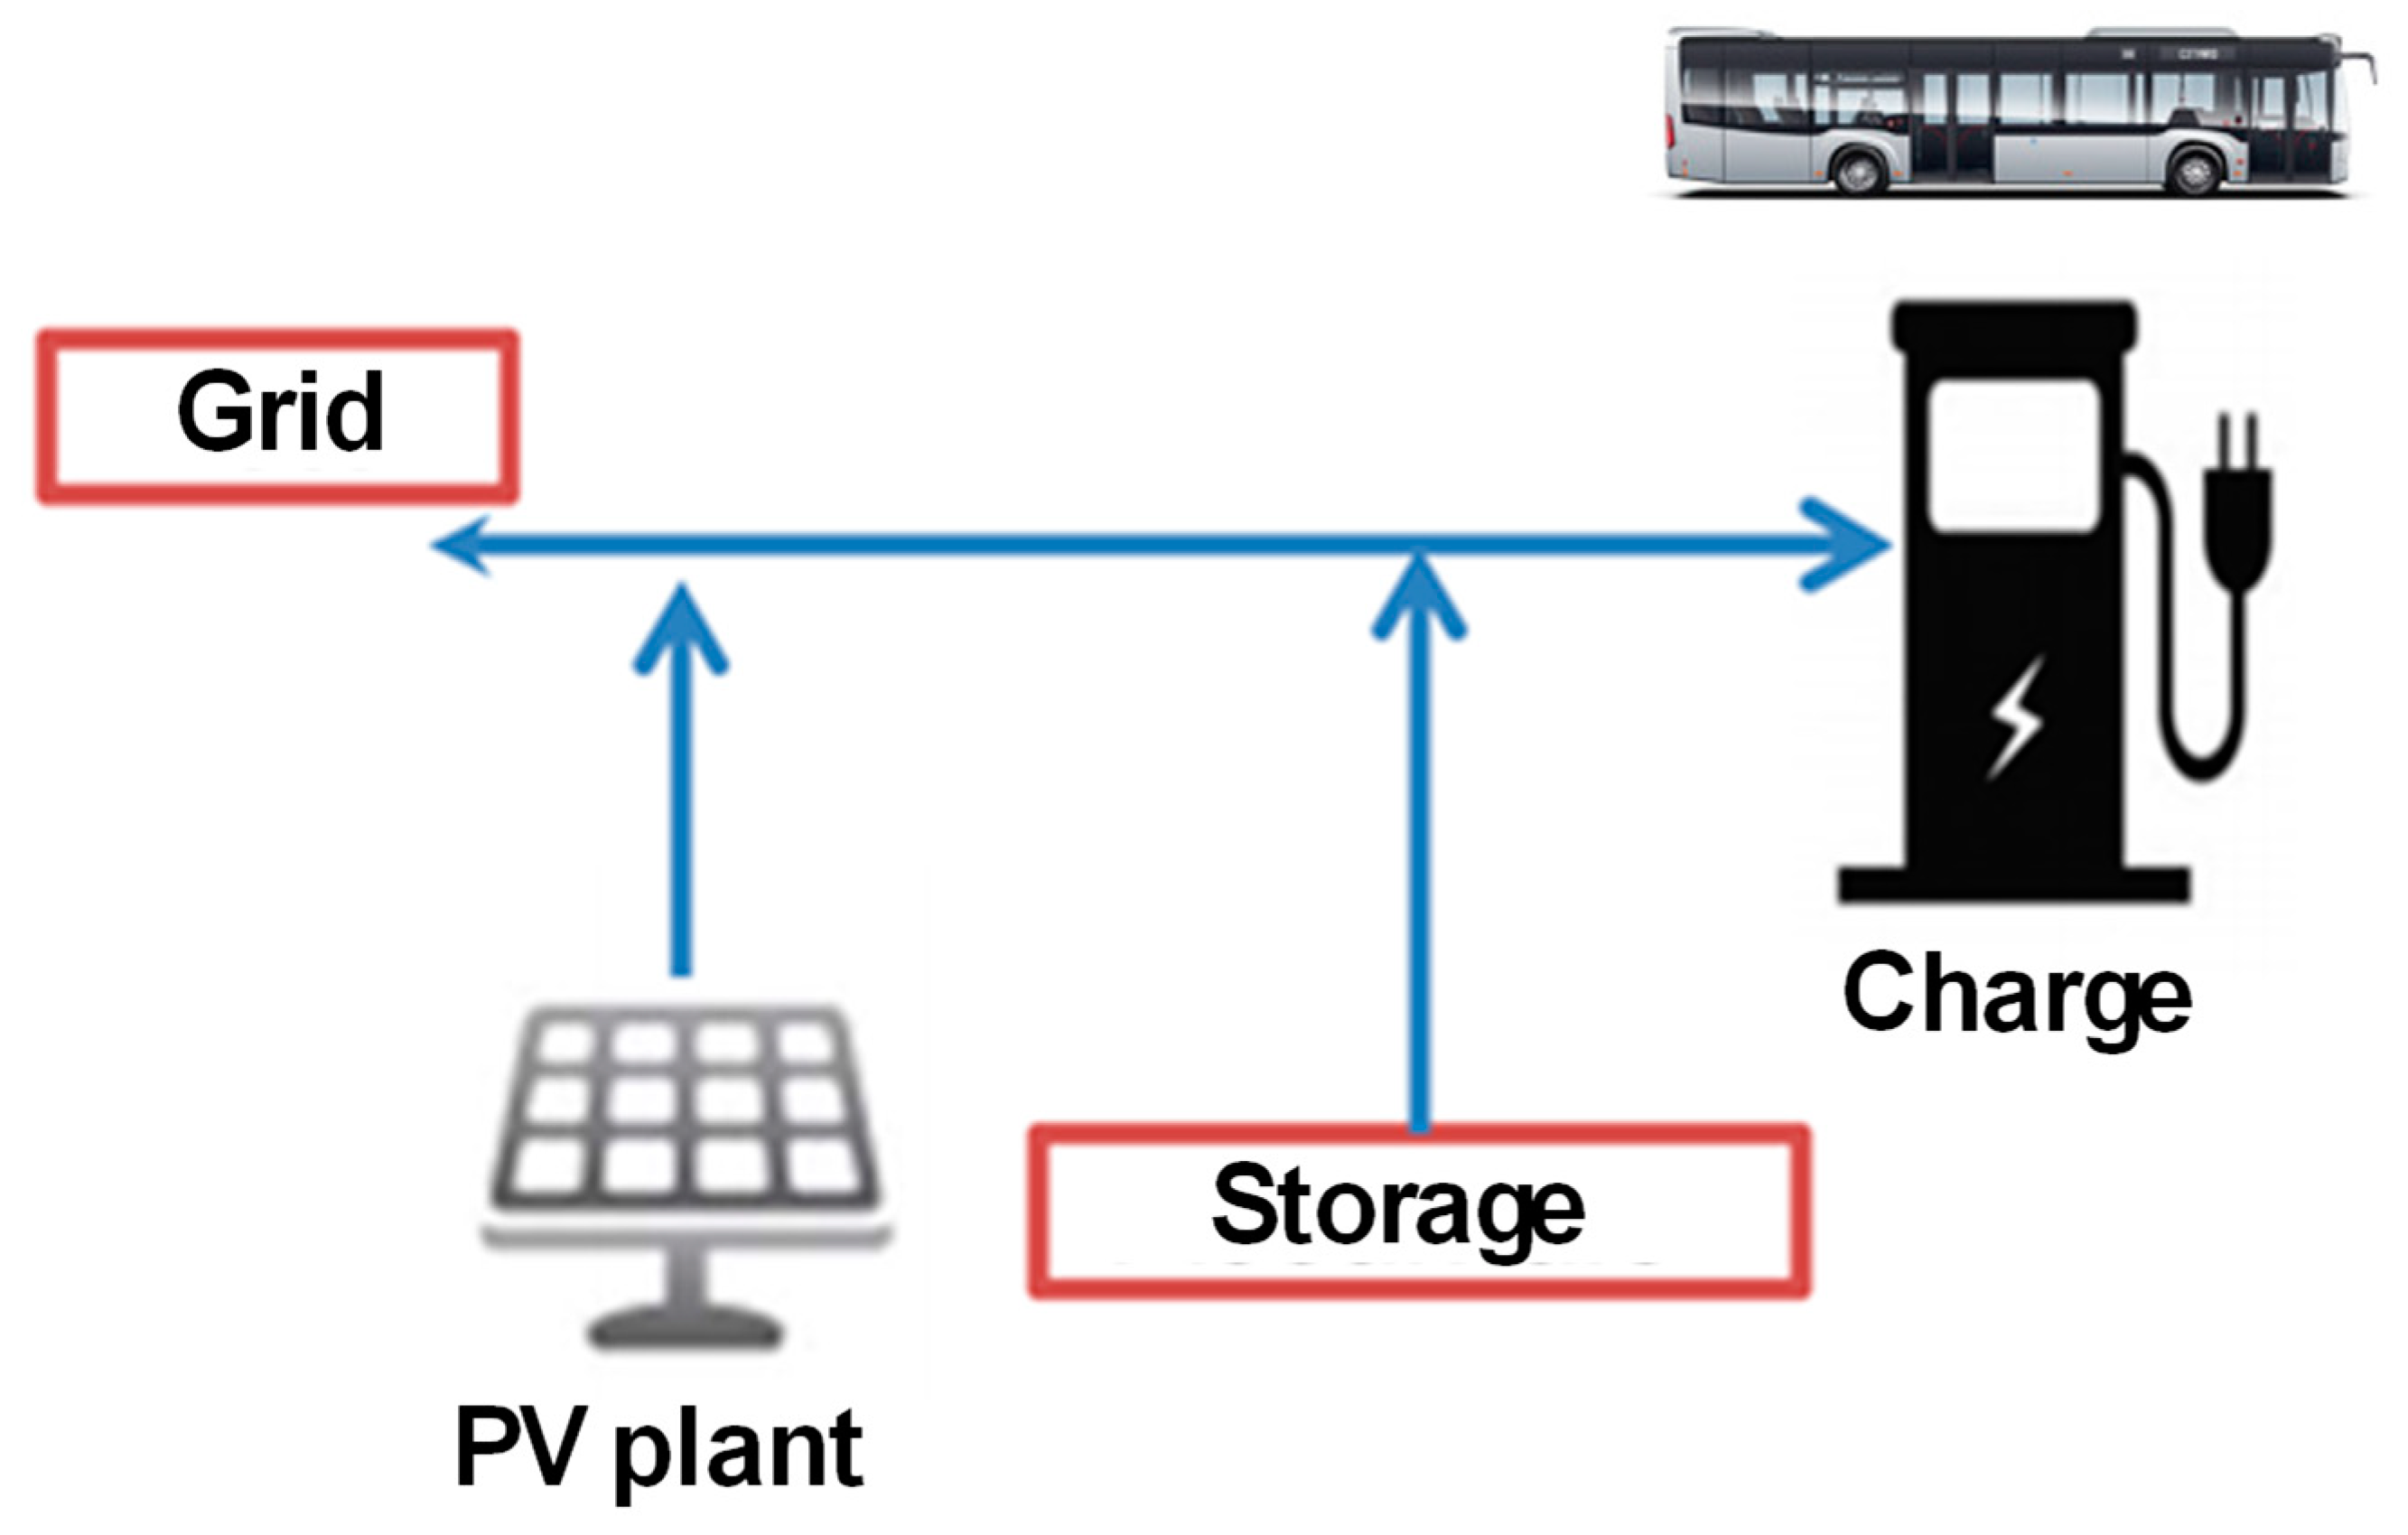
Figure 7.
View of the shelter and typical size compared to the dimensions of the buses.
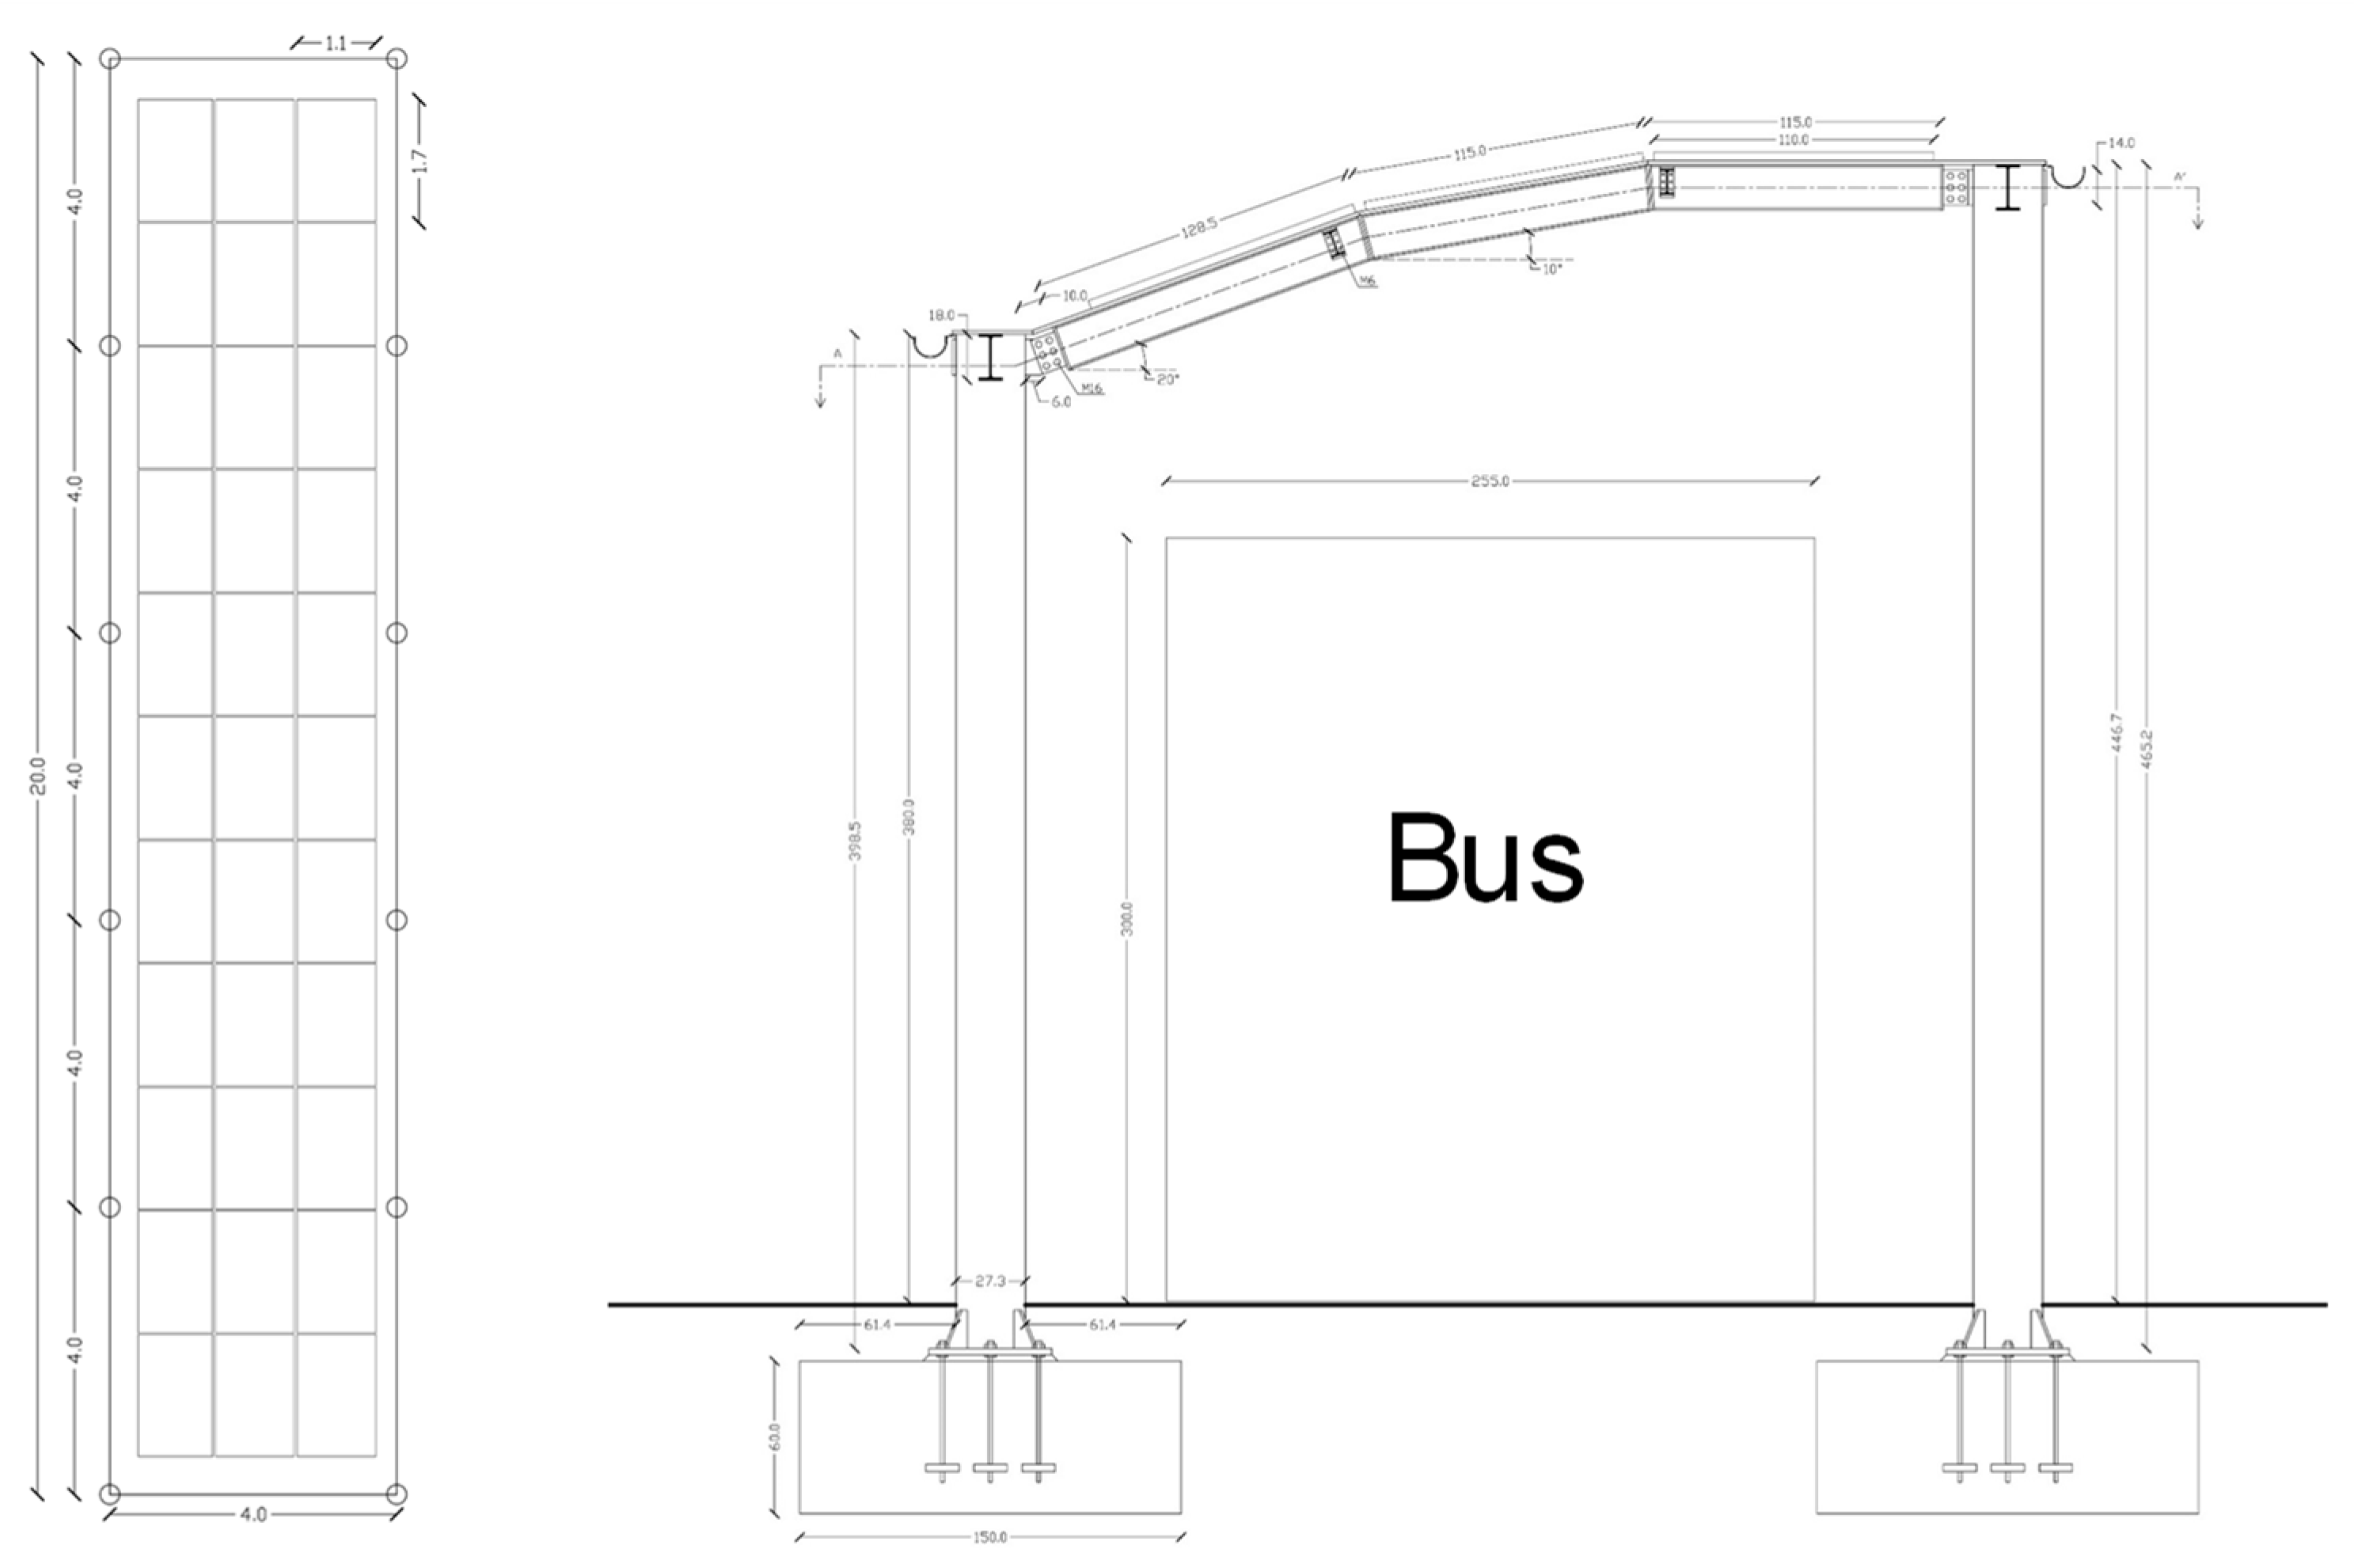
Figure 8.
Detail of the structure defined for the modular shelter.
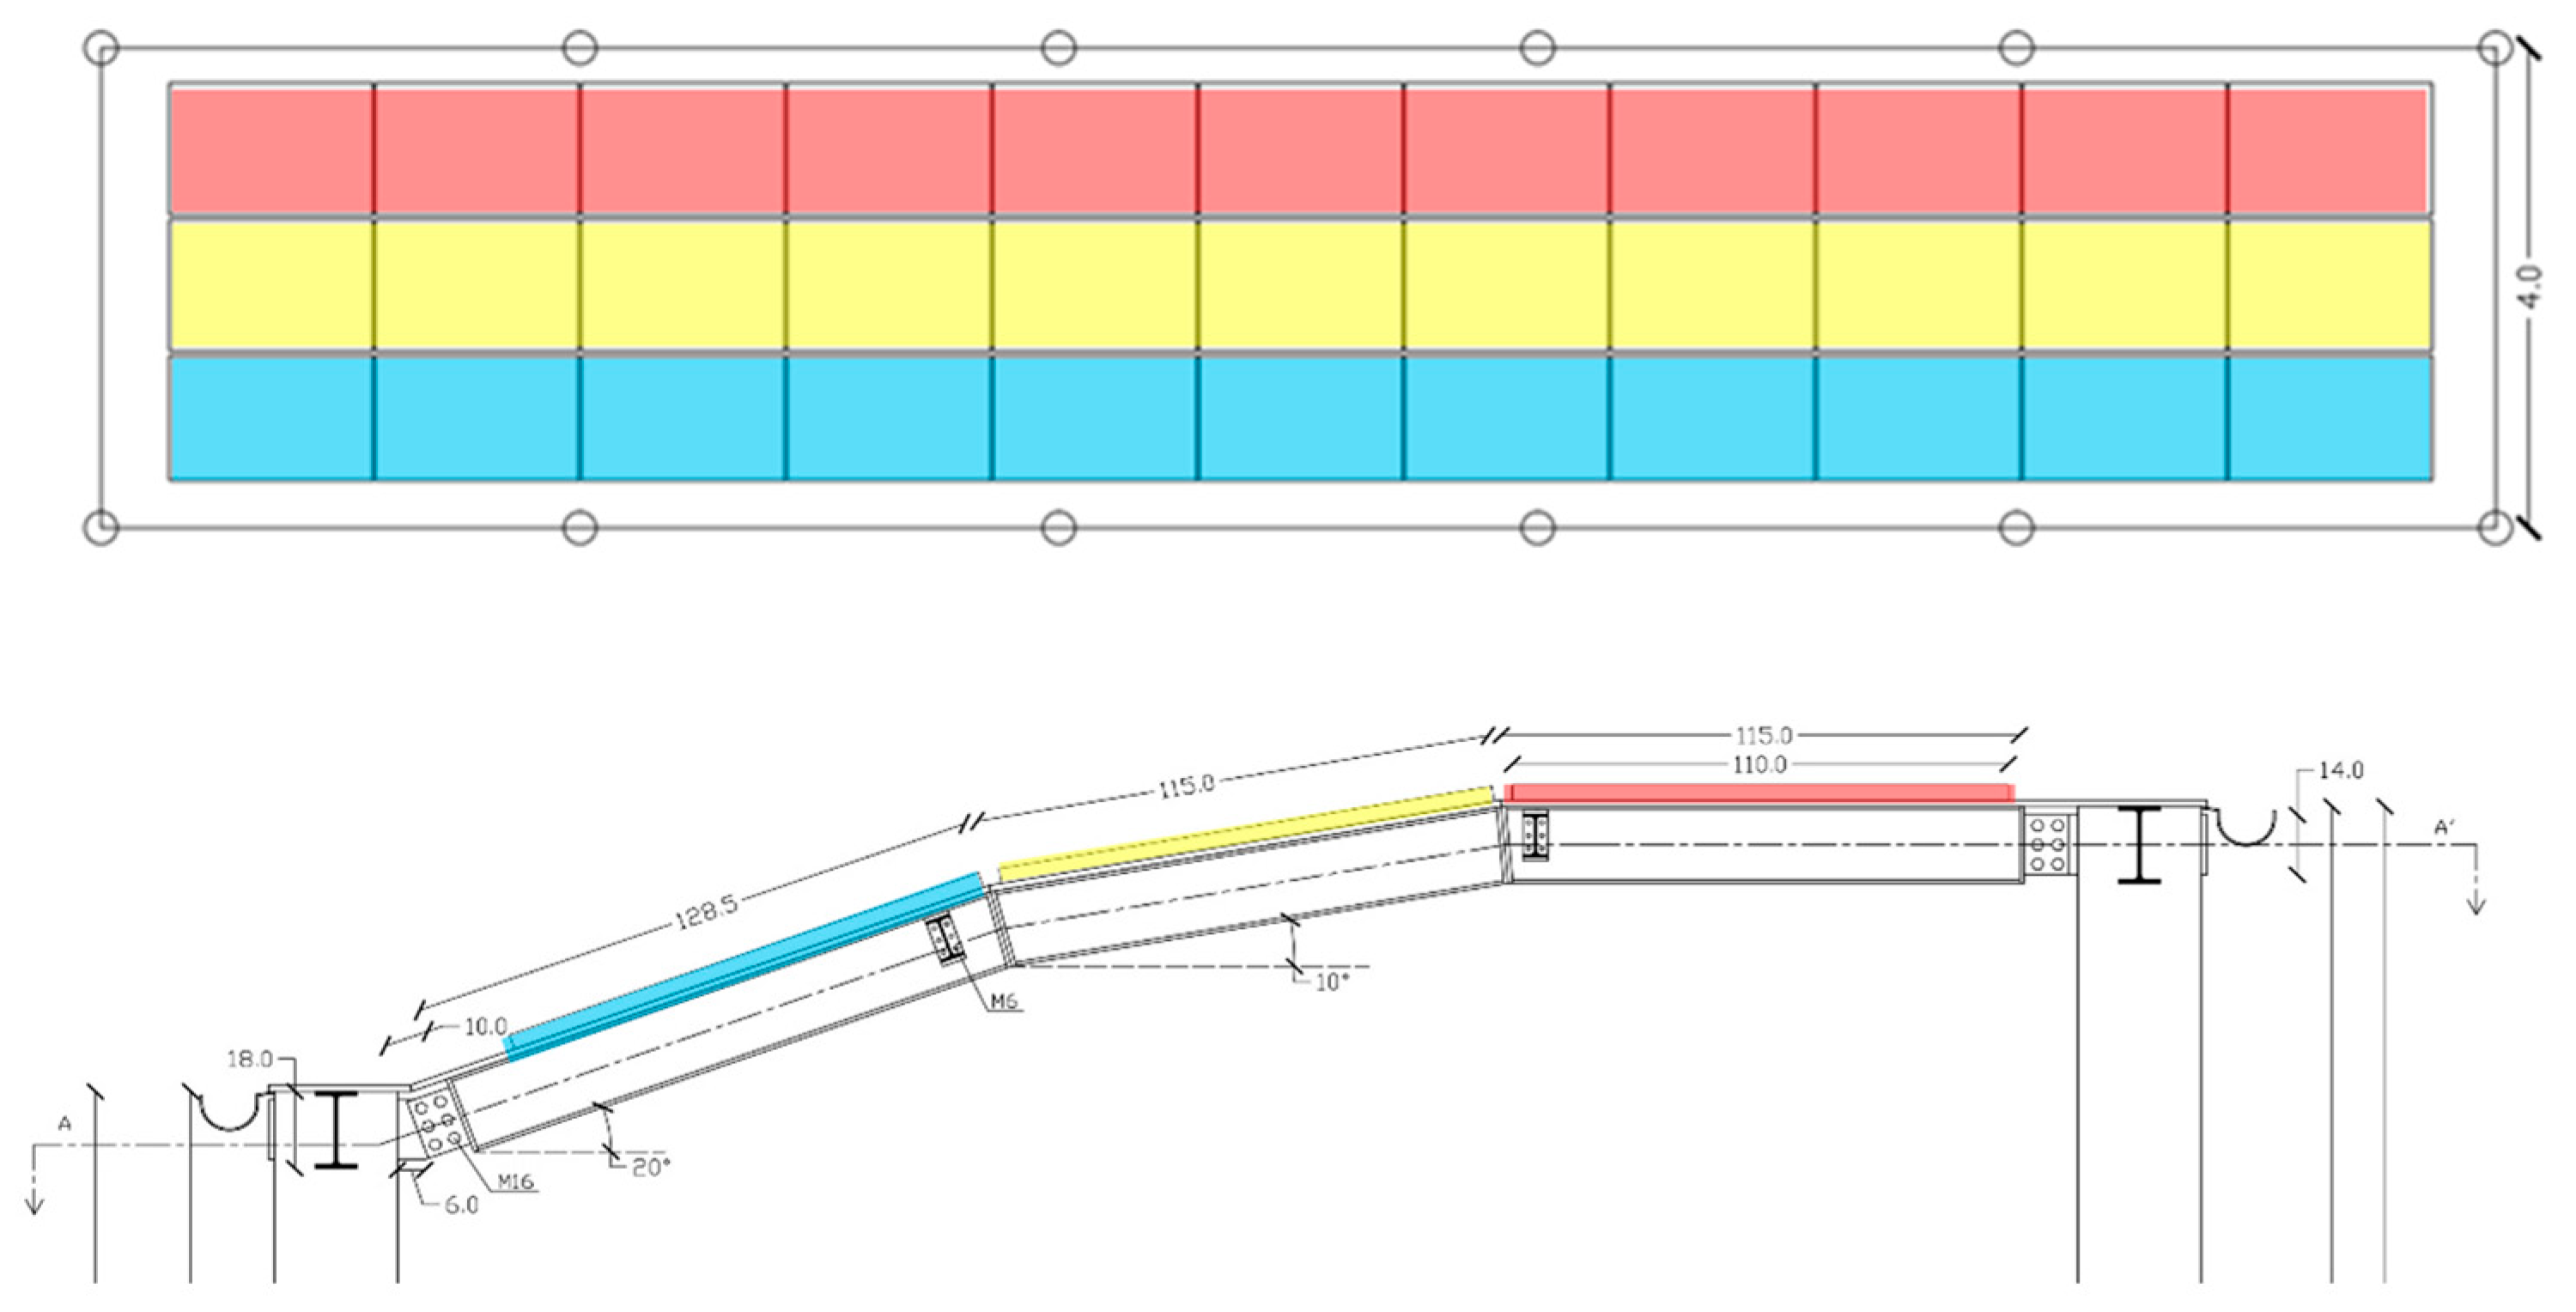
Figure 9.
A schematic view of the original effect of shelters.
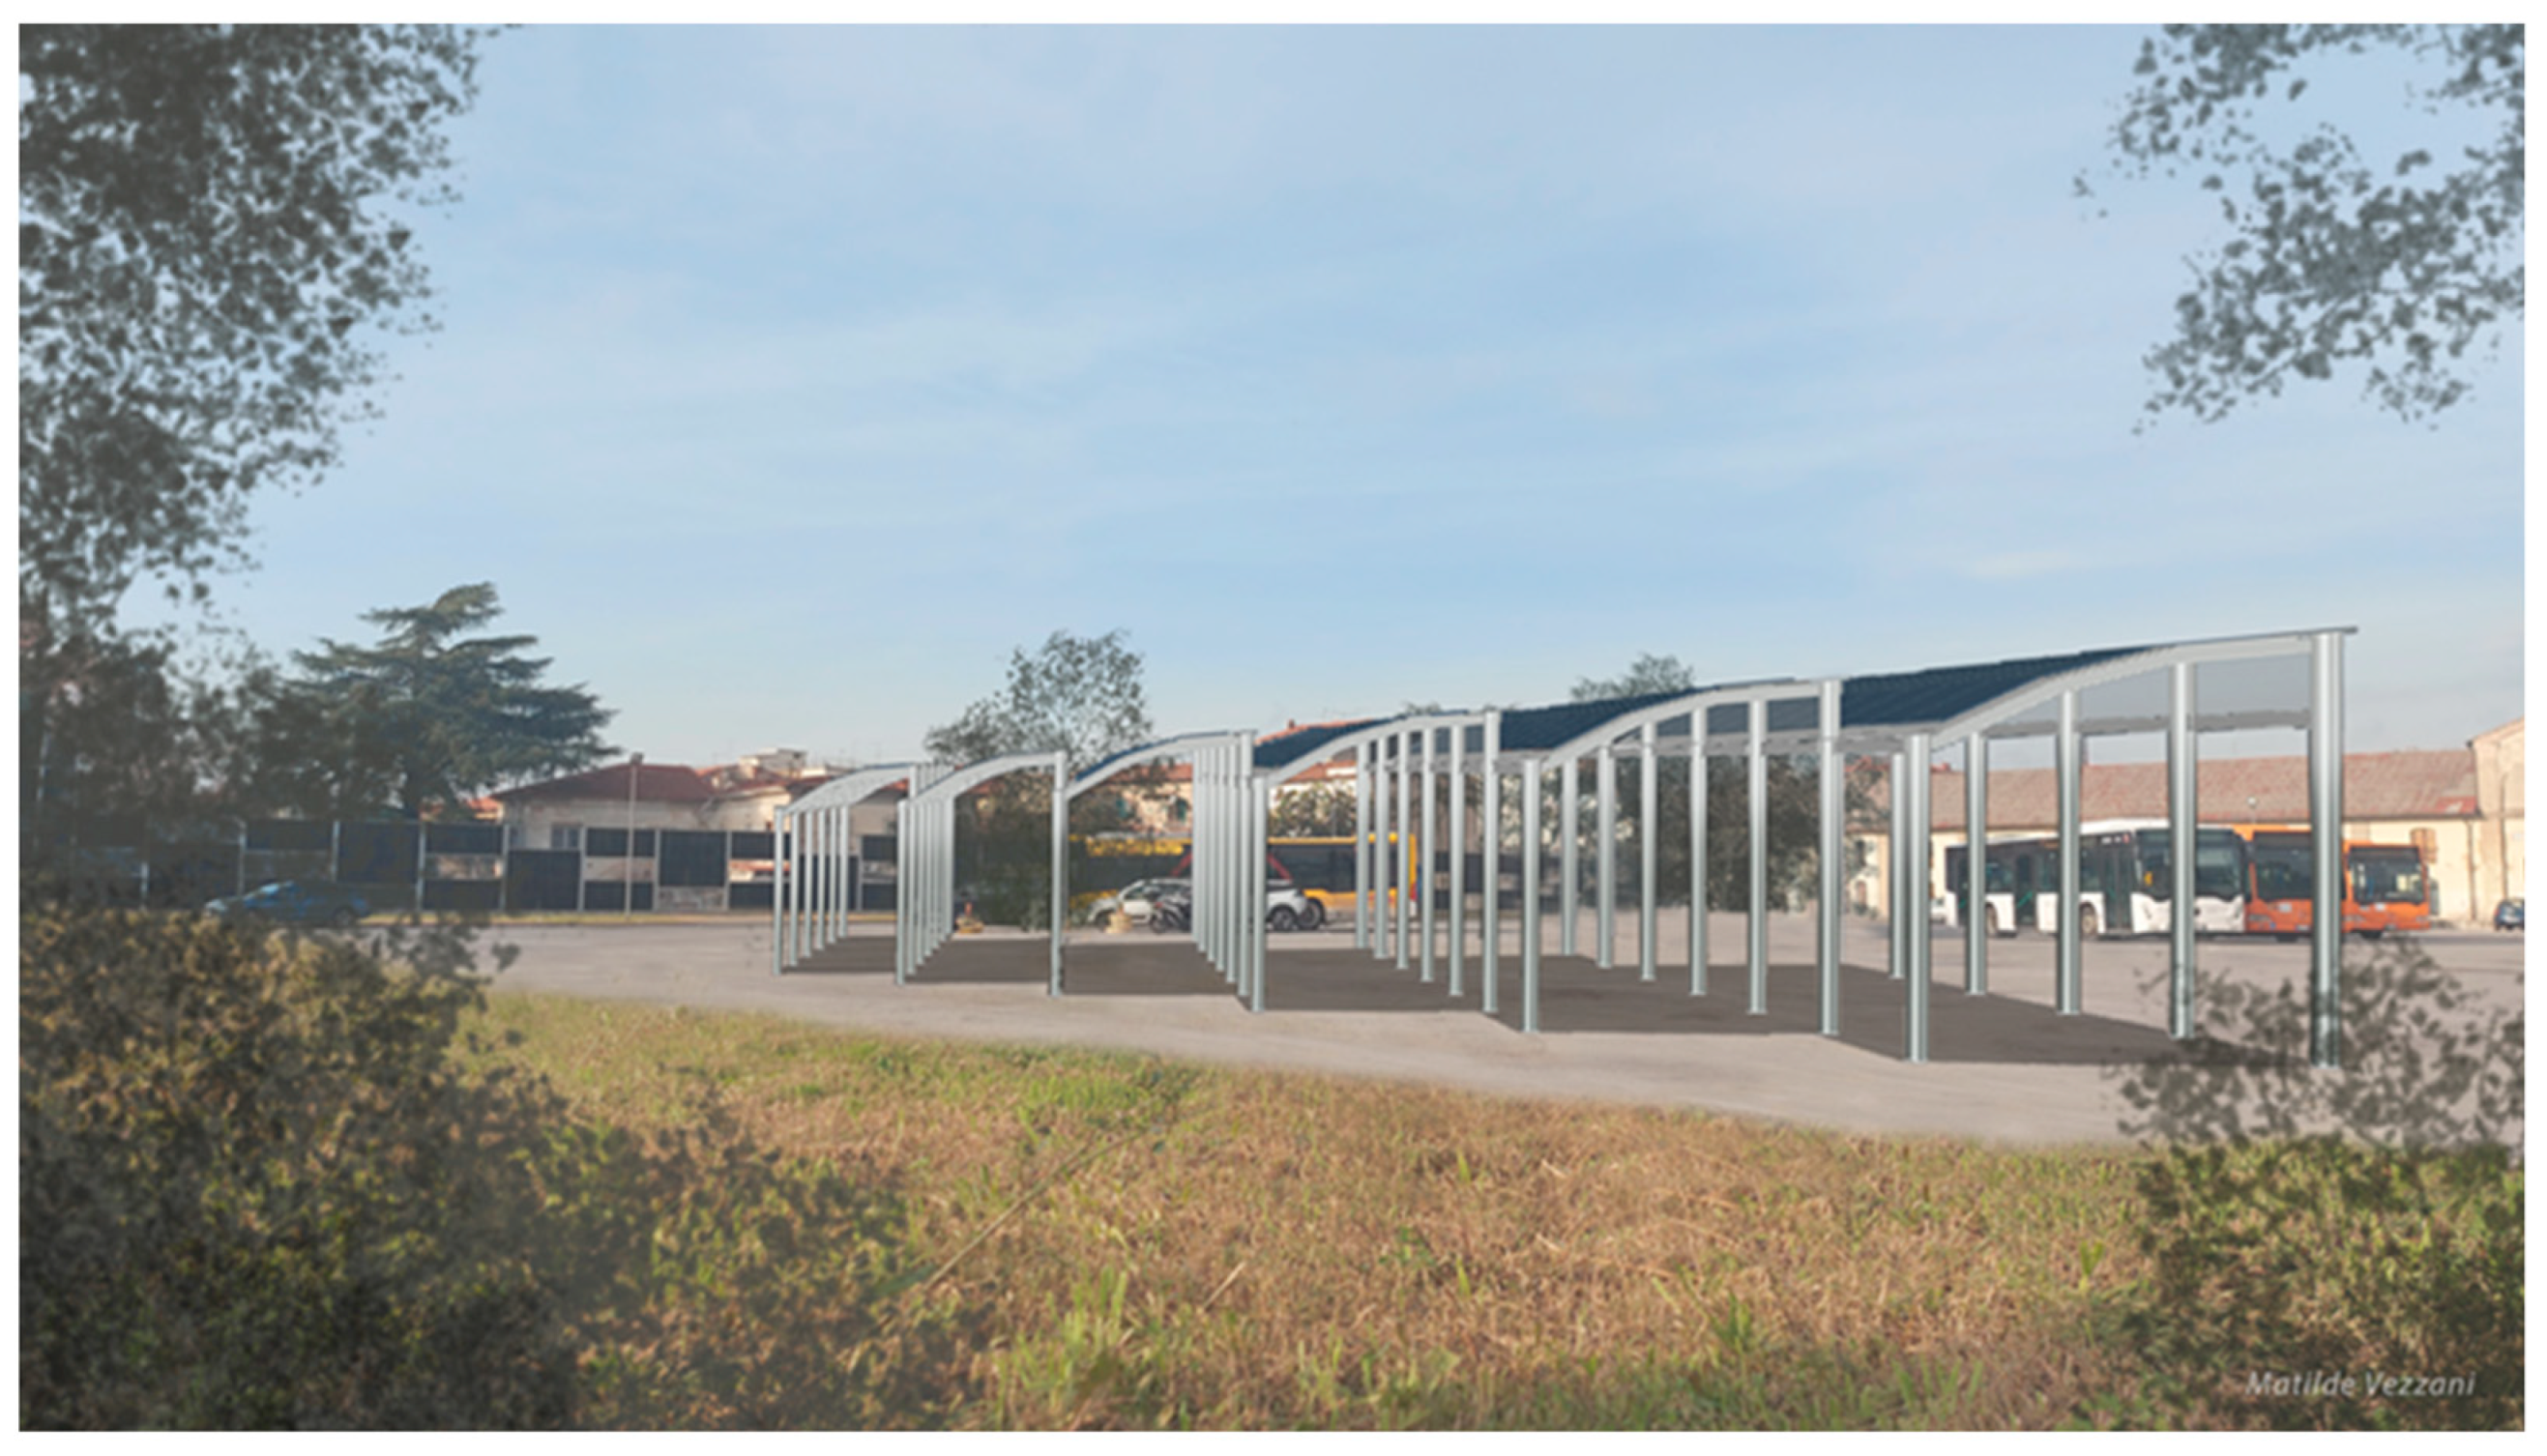
Figure 10.
Disposition of adjacent shelters to obtain a plant of power of the order of 190-200 kW and area of the plant.
Figure 10.
Disposition of adjacent shelters to obtain a plant of power of the order of 190-200 kW and area of the plant.
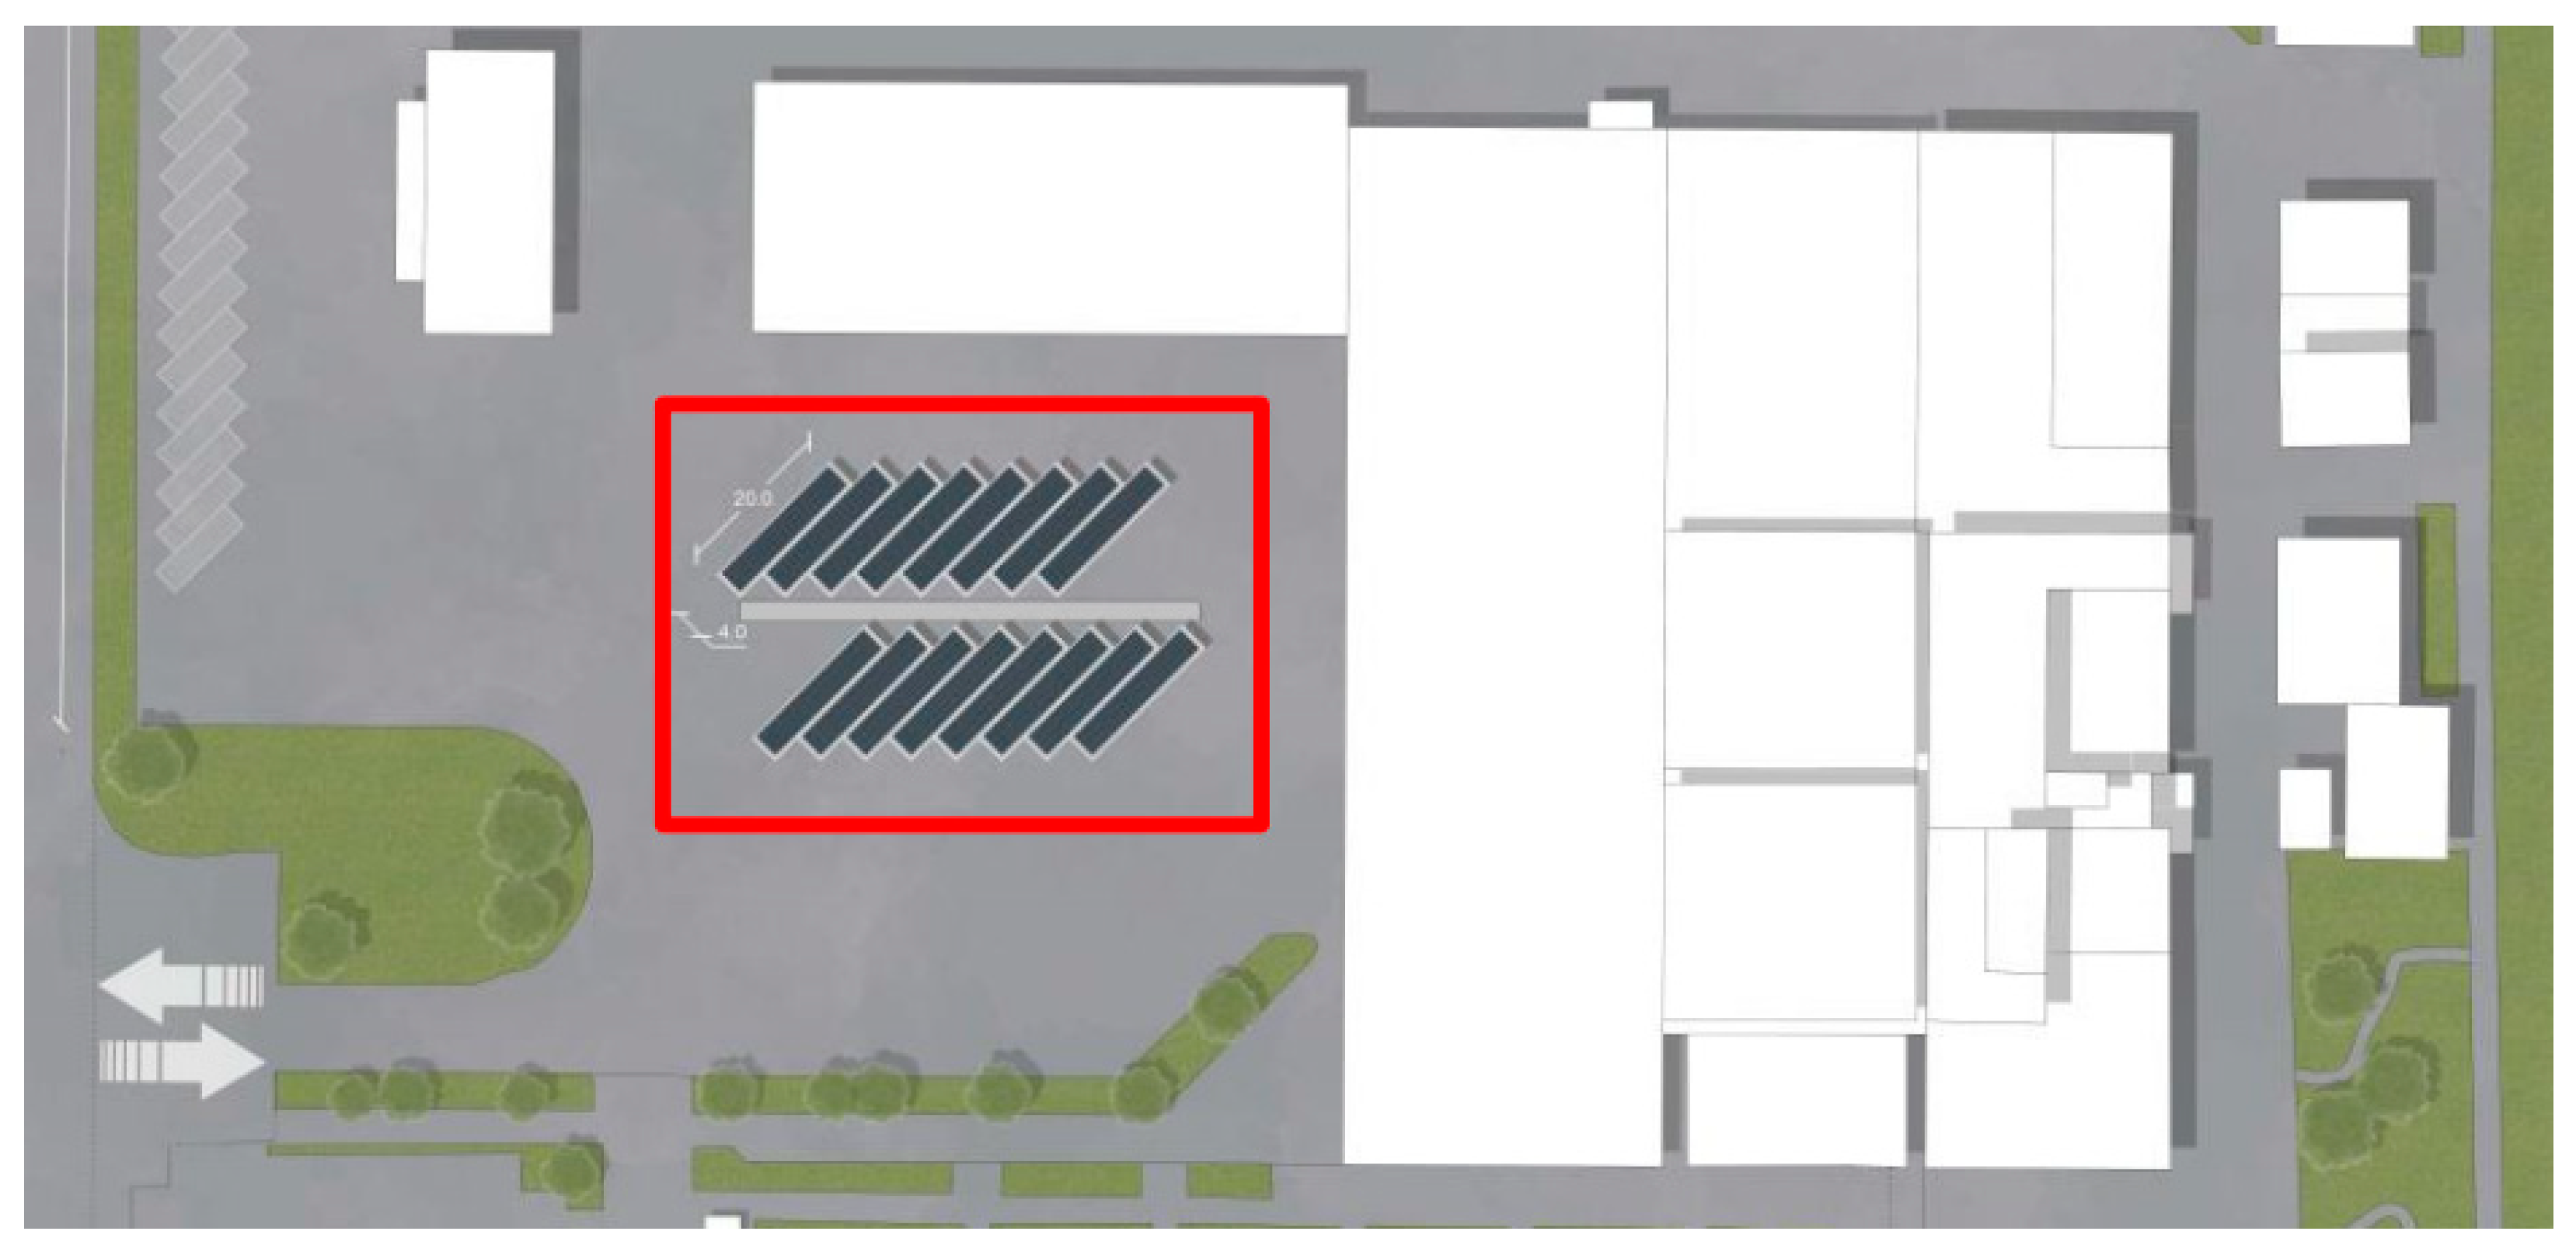
Table 1.
The diverse types of electric vehicles based on the degree of electrification.
| Typology of vehicle | Main characteristics | Share of electric operation |
|---|---|---|
| MHEV | Electrical sector (engine plus battery) is smaller in size and complexity than hybrids | |
| HEV | Electric motor and a heat engine work in synergy | |
| PHEV | Vehicles are “rechargeable” not only in the deceleration phases but also by using charging infrastructures | Up to 50-60 km |
| BEV | There is no internal combustion engine, and the key element is the battery | 100% |
Table 2.
Typical characteristics of the bus in transport companies in Italy and in some typical Italian town of different size.
Table 2.
Typical characteristics of the bus in transport companies in Italy and in some typical Italian town of different size.
| Town | Inhabitants | Number of buses and coaches in transport companies | Service level of each bus |
|---|---|---|---|
| Bozen (district area) | 521000 | 100 | 42257 km |
| Milan (district area) | 3.250000 | 1200 | 58695 km |
| Bergamo (district area) | 1.115000 | 150 | 38467 km |
| Italy | 58.940000 | 44000 | 36363 km |
Table 3.
The methodology for the electrification of the route assisted by PV plant.
| Step | Objective |
|---|---|
| 1 | For each of the two routes taken into consideration, transformation of the times and distances relating to the stops into an appropriate speed cycle; |
| 2 | Based on the model of the buses selected, convert them into BEV and HEV architectures, trying to understand the sizes of the battery and the energy they must provide during the cycle, and therefore during the day, in the most unfavorable case possible (for example fully loaded bus of passengers, auxiliary devices at maximum power and route with traffic); |
| 3 | Based on the results obtained, define the size of the photovoltaic system capable of powering the buses and propose a modular project for the charging infrastructure |
Table 4.
Data about the urban route.
| Variable | Value |
|---|---|
| Length of the route | 7296 m |
| Ride duration | 30 m (25 min plus 5 min at the terminus) |
| Number of stops | 26 |
| Service hours | 7:30-20:30 |
| Transit interval | 15 min |
| Number of travels for each bus | 26 |
| Number of buses for the route | 2 |
Table 5.
Estimate of consumption relating to the different routes in the urban cycle in different seasonal and load conditions.
Table 5.
Estimate of consumption relating to the different routes in the urban cycle in different seasonal and load conditions.
| Service | Specific consumption [kWh/km] |
Cycle consumption [kWh/cycle] |
Daily consumption [kWh/day] |
|---|---|---|---|
| Full load (summer/winter) Reduced load (summer/winter) |
1,633 | 11,91 | 309,66 |
| 1,292 | 9,42 | 244,92 | |
| Full load (mid-season) Reduced load (mid-season) |
1,219 | 8,89 | 231,14 |
| 0,878 | 6,40 | 166,55 |
Table 6.
Daily energy use for single bus operating on the urban route.
| Seasonal service | Energy use at full load (14 full – 12 reduced) [kWh] |
Energy use at medium load (8 full – 18 reduced) [kWh] |
|---|---|---|
| Winter and Summer | 279,78 (A) | 264,84 (B) |
| Mid-season | 201,26 (C) | 186,32 (D) |
Table 8.
Typical energy use for the extra-urban route in the different case of services.
| Pure electric mode kWh/km |
HEV mode Diesel litre/km |
Pure electric mode Energy/cycle kWh |
HEV mode Diesel/cycle litre |
Pure electric mode Daily energy kWh |
|
|---|---|---|---|---|---|
| Full load (summer) Reduced load (winter) |
2,724 | 0,522 | 54,48 | 12,95 | 381,4 |
| 1,589 | 0,467 | 31,78 | 11,58 | 158,9 | |
| Full load (mid-season) Reduced load (mid-season) |
2,134 | 0,494 | 42,68 | 12,25 | 213,4 |
| 1,116 | 0,436 | 22,32 | 10,81 | 111,6 |
Table 9.
Daily energy requirements in the different situations.
| Case | Urban route kWh |
Extra urban route [kWh] |
Daily load [kWh] |
Estimated days of service |
|---|---|---|---|---|
| Full service (Max) | 2 x 264,68 | 4 x 381,4 | 2055,0 | 10 |
| Full service (Summer) | 2 x 279,78 | 2 x 381,4 | 1322,4 | 45 |
| Full service (Winter) | 2 x 279,78 | 2 x 158,9 | 877,4 | 80 |
| Medium service | 2 x 201,26 | 2 x 213,4 | 829,3 | 110 |
| Low service | 2 x 186,32 | 2 x 111,6 | 595,8 | 120 |
Table 10.
Typical value of solar energy irradiation and corresponding specific production of PV plant in a typical south-west-oriented surface.
Table 10.
Typical value of solar energy irradiation and corresponding specific production of PV plant in a typical south-west-oriented surface.
| Jan | Feb | Mar | Apr | May | Jun | Jul | Aug | Sep | Oct | Nov | Dec | |
|---|---|---|---|---|---|---|---|---|---|---|---|---|
| ES [kWh/m2] | 1,6 | 2,3 | 3,3 | 4,3 | 5,9 | 6,4 | 6,8 | 5,9 | 4,4 | 2,6 | 1,9 | 1,4 |
| PV prod [kWh/kW] | 1,28 | 1,84 | 2,64 | 3,44 | 4,72 | 5,12 | 5,44 | 4,72 | 3,52 | 2,08 | 1,52 | 1,12 |
Disclaimer/Publisher’s Note: The statements, opinions and data contained in all publications are solely those of the individual author(s) and contributor(s) and not of MDPI and/or the editor(s). MDPI and/or the editor(s) disclaim responsibility for any injury to people or property resulting from any ideas, methods, instructions or products referred to in the content. |
© 2024 by the authors. Licensee MDPI, Basel, Switzerland. This article is an open access article distributed under the terms and conditions of the Creative Commons Attribution (CC BY) license (http://creativecommons.org/licenses/by/4.0/).
Copyright: This open access article is published under a Creative Commons CC BY 4.0 license, which permit the free download, distribution, and reuse, provided that the author and preprint are cited in any reuse.


