
Submitted:
02 April 2024
Posted:
02 April 2024
You are already at the latest version
Abstract
The Imbalance Cost Pass-Through (ICPT) is a flexible component of the Incentive Regulation (IBR) that empowers power producers to adjust tariffs in response to variable fuel prices, thereby enhancing the economic resilience of electricity generation. However, the cost of electricity generation is significantly influenced by the volatility of commodity prices, including coal, gas and LNG. In Malaysia, the Energy Commission has conducted biannual reviews of fuel and other generation costs. Any cost savings or increases identified during these reviews will be passed on to customers in the form of rebates or surcharges. Due to that reason, this study proposes ICPT price forecasting for the electricity market in Peninsular Malaysia. The study aims to construct an ICPT-related baseline model for the peninsular generation data by employing three forecasting methods. The forecasting performance is analysed by a Mean Absolute Percentage Error (MAPE). In findings, the ARIMA method is one of the most accurate forecasting methods for fuel prices compared to the Moving Average (MA) and LSSVM methods. The observed price differences between the ARIMA and LSSVM models for ICPT are minimal. The ICPT price for July-December 2022 and January-June 2023 is MYR 0.21/ kWh for ARIMA and MYR 0.18/kWh for LSSVM, which are close to the actual TNB’s ICPT tariff. As for the forecasting, the ICPT price is expected to drop for the next announcement. The findings of this study may contribute to a positive impact on the sustainability of the energy sector in Malaysia.
Keywords:
Electricity price
; Incentive Based Regulation
; Electricity Market
; Forecasting
; Time Series
; Machine Learning
1. Introduction
Malaysian Electricity Supply Industry (MESI) 1.0, which took place from 2010 to 2014, was approved by the government in 2009. The objectives were to improve the tariff mechanism, fuel supply, and security and achieve effective governance in power sector management. The ring-fenced single-buyer model was established due to those initiatives [1]. Additionally, the Single Buyer (SB) and grid system operator (GSO) divisions joined the MESI following their separation from Tenaga National Berhad (TNB). In 2015, the Energy Commission launched the New Enhanced Dispatched Agreement (NEDA) to provide the opportunity for the power sector to increase its efficiency and be more cost-effective in generating electricity. The new method can reduce power production costs while benefiting consumers in the long run. NEDA regime has implemented short-run competition in daily generating dispatch among Independent Power Producers (IPPs) with Power Purchase Agreements (PPA), TNB generation with Service Level Agreements (SLA), and merchant generators without PPA. The System Marginal Price (SMP) has been used to be referred by all generation players. The introduction of MESI and NEDA has resulted in some positive industry impacts. Still, more is needed to sustain the tariff, as the efficiency of operations needs to be improved to protect against exposure to fuel price volatility.
Thus, in 2018, MESI 2.0 was introduced with the core idea of redesigning MESI 1.0 [2]. The MESI 2.0 reform was designed to be more efficient, transparent, sustainable, and competitive to be effective [3]. In addition to managing Power Purchase Agreements (PPAs) and settlements, the SB department oversees the least-cost dispatch scheduling and managing the forecasting of electricity demand and planning generation capacity. Whereas the Energy Commission (EC) is entrusted explicitly with acquiring additional generation capacity identified previously by SB [4]. In all cases, power plants will sell energy to the SB at the PPA pricing. The producing company will be compensated in two ways: the capacity payment and the energy payment [5]. Besides, GSO is a ring-fenced department within TNB accountable for operational planning, real-time rescheduling, dispatch, and management of the grid system following grid code requirements. GSO is also responsible for coordinating all parties involved in the grid system, including electricity generation, transmission, and distribution networks across multiple countries or continents [6].
However, fuel and generating expenses have increased around 70% of overall tariff costs paid by consumers, with the remaining 30% is made up of operations and maintenance costs [7]. TNB and the government cannot prevent changes in electricity tariffs because the adjustment depends on global fuel price changes, including coal and natural gas prices. Around 70% of the coal is bought from Indonesia, and the remaining is imported from Australia, South Africa and Russia [8]. Due to that reason, MESI reform initiatives began has introduced incentive-based regulation (IBR) which are consist of two types of fundamental tariff, a) base tariff and b) the imbalance cost pass-through (ICPT) mechanism, which has helped keep electricity tariffs stable through Malaysia's single-buyer model. The base tariff was set at 39.45sen/kWh and remain the same price until now. Fuel price assumptions are used to calculate the base tariff. For instance, if coal would cost US$87.50 (MYR337.3)/ton, LNG would cost MYR 41.68/mmBtu, and regulated gas would cost MYR15.20/mmBtu. The Energy Commission (EC) continues to audit and review past performance while accommodating new utility company requests. The utility must provide its expected revenue requirement for the next three to four years based on forecasted capital expenditure (CAPEX), operational expenditure (OPEX) and expected return. The three to four years is known as a regulatory period (RP), during which the utility must operate within the allowed CAPEX and OPEX to deliver the required service. The cost of coal was about MYR 250 per metric ton when the ICPT was introduced. The cost of coal had risen to more than MYR 370 per metric ton at the beginning of 2018 [9]. That indicates a 47% increase in price. Since the ICPT price depends on the fuel price and other generation costs, the Energy Commission will conduct biannual reviews with any cost savings or increases identified during these reviews will be passed on to customers in the form of rebates or surcharges. The ICPT charge on electricity bills differs for each consumer as the ICPT charge is based on monthly energy consumption (kWh) [10]. Thus, Figure 1 illustrates the complexity of the MESI in peninsular Malaysia where the integrity and transparency of the electricity market has been set to be main objective for the framework design.
Unfortunately, the forecasting of the ICPT charge is not available to be referred by the consumers. As the ICPT forecasting approach that the EC adopted is not publicly available, it is a crucial need for an ICPT forecasting mechanism so that consumers are able to manage energy consumption and operation cost-efficiently. Hence, in this study, the forecasting model has been introduced based on Time Series (Moving Average), ARIMA Model, and LSSVM to reflect the most popular techniques in the past literature that will be explained detail in next section. There is list of the contribution for the paper:
- Presents the novel of the forecasting formulation model for the ICPT regime in Malaysia where the accuracy of the model has configured and tested with time series and machine learning techniques.
- Provides comprehensive analysis of the data collected from the real generation system while putting much widespread discussion on the three-baseline model for the ICPT main component.
- Contributes to provide valuable forecasting ICPT price information for the electricity consumers in Peninsular Malaysia where the sustainable electricity market can be enhanced significantly.
The remainder of the paper is organized as follows. In Section 2, the related previous work of forecasting model is introduced. In Section 3, formulation of the ICPT based on IBR regime is explained while Section 4 demonstrates the implementation of the forecasting techniques. Section 5 discusses the findings and last conclusion section will be section 6.
2. Related Previous Work of Forecasting Model
The ARIMA forecasting model is the most common type of linear time series model based on Box–Jenkins methodology as presented in [11]. In most cases, the methodology does not require the estimation of many parameters to make the final choice of model [12]. As an adaptation of this model, the author in [13] has applied it for short-term forecasting of Spanish day-ahead electricity market prices. Meanwhile, using the Reference Price Data (RPD) from the UK energy market, the authors in [14] describe and analyses the ARIMA and ANN models for predicting the price of electricity up to three steps (1.5 hours) ahead. Based on the root-mean-square error (RMSE), the results show that the ARIMA (4,1,2) model was more accurate when compared to the ANN model. Hence, the application of the ARIMA model had able to investigate the dollar-per-day price of gold during short-term and long-term periods [15]. It is observed that ARIMA is deemed the most effective result for predicting gold dollar prices and in other related electricity pricing forecasting as explained in [8]. On the other hand, the well-known statistical test of analysis of variance (ANOVA) was conducted in [16] and [17] for forecasting electricity prices one day and is based on the best possible synthesis of a few univariate and multivariate approaches. Even though the ANN model was less accurate, the improvement model was able to predict better as explained in [14] where the application of it in predicting long-term oil and real-time electricity prices was able to fulfil the standard accuracy percentage [18] and [19]. Instead of the time series forecasting method, the machine learning method has been applied in various fields including in the electricity market. The study in [20] and [21] explores the application of a hybrid forecasting model known as Grey Wolf Optimizer-Least Squares Support Vector Machines (GWO-LSSVM) in the context of price prediction. Authors in [22] and [23] proposes a novel method for forecasting electricity prices that combines clustering and Least Squares Support Vector Machines (LSSVM). There was proposed methodology that combines the advantages of clustering and LSSVM to improve the precision of electricity price forecasts. These advancements are crucial for consumers to manage energy consumption and operation cost-efficiently [24], [25].
In Malaysia's context, the application of the forecasting method in the electricity market has been explored and discussed in various studies. These studies have focused on developing more accurate and efficient forecasting models rather than considering the ICPT charge. Hence, to the best of our knowledge, there are no presented findings that have been published in a past study to discuss the ICPT prediction for the IBR regime in Malaysia. Even though Asia countries may have different electricity markets the formulation of ICPT in this study can benefit them to manage a single buyer-based market where the southern ASEAN countries are able to enhance their generation market too. Therefore, the findings of this study are significant to the body of knowledge since they provide a method of forecasting ICPT pricing. Electricity consumers can use this information to make more informed decisions regarding their energy consumption. The findings of the study may also help power consumers become more aware of the volatility of ICPT costs. This data can assist consumers in making more informed financial decisions about their energy consumption and operation costs. Thus, this paper aims to establish a baseline model for the peninsular generation data while comparing the performance of Mean Absolute Percentage Error (MAPE) by using Time Series Forecasting (Moving Average), ARIMA and Least Square Support Vector Machine (LSSVM) techniques. Meanwhile, at the end of the study, the ICPT price prediction for peninsular Malaysia under the IBR regime is proposed congruently.
3. Formulation of ICPT
The single buyer tariff has two components: (1) the Single Buyer Generation, which accounts for all generation costs, including fuel, capacity payments, and other expenses related to the terms and conditions of PPAs, SLAs, and other fuel procurement contracts, and (2) SBO component, which accounts for all other operational and capital costs associated with SB operations and allocates joint costs (if any). The SB will forecast the generation cost for the generation-specific component using the current gas and coal prices. The profitability of the generation utility may be impacted by the extremely volatile nature of fuel prices. Therefore, an adjustment to the fuel price is permitted to protect TNB from this inconsistency. The ICPT is made up of two parts: Fuel Cost Pass-Through (FCPT) accounts for changes in gas and coal costs due to changes in fuel prices, availability, foreign exchange rates, etc. And other Generation Specific Cost Pass-Through (GSCPT) accounts for changes in other fuels (such as distillate and medium fuel oil (MFO)) and all costs incurred by the Single Buyer under PPAs and SLAs (incentive or bonus payments, liquidated damages, savings, etc.). Hence, Figure 2 describes the components considered for ICPT tariff.
Every six months, SB will evaluate the generation-specific component of its actual revenue against the cost of electricity acquisition. SB will have to provide thorough analysis and supporting evidence to prove the fuel price changes. Customers will be informed of any overage or under abundance of the actual figure within the ensuing six months by the government through energy commission.
The formulation of the electricity tariff in Malaysia has adopted ), Incentive Based-Regulation (IBR) as in Equation (1):
where is base tariff and is Imbalanced Cost-Pass Through (ICPT). Meanwhile, ICPT has two components which are generation cost adjustment for the six-month period (cent/kWh) ( and fund contribution for the six-month period (cent/kWh) ( as described in Equation (2).
For the Part 1 of Equation (2), the details of consideration can be expressed by the following equations:
where, A is the first fuel cost pass-through adjustment in the six-month period (cent/kWh). 𝐼𝐹𝑈𝐶𝑠 is interim fuel cost pass-through adjustment for the six-month period(cent/kWh); AFULP is the average Fuel Cost for Regulatory Period ‘P’ (cent/kWh). Meanwhile, m represents month, which the ICPT adjustment takes effect; Cm is estimated total fuel cost for month ‘m’ (MYR); Dm is the actual total fuel cost for month ‘m’ (MYR); Fm is estimated total qualifying sales (kWh); and Em is an audited total qualifying sales month ‘m’ (kWh). The FFULS is forecast fuel cost for six-month period ‘s’ (MYR); WACCP is an allowed weighted average cost of capital of RBE for the Regulatory Period ‘P’ (%); FSALt is forecasted total electricity sales in year 't' as made at the time of setting the Base Average Tariff (in kWh).
On the other hand, B is the first other generation cost pass-through adjustment in the six months’ period ‘s’ (cent/kWh). In conjunction to the interim other generation cost past-through adjustment, the symbol IGSCS is demonstrated in the six-month period ‘s’ (cent /kWh); AGSCP is an average other generation cost for Regulatory Period ‘P’ (cent/kWh) that finally contribute to the second fuel cost and other generation costs pass-through adjustment in the six-month period (cent/kWh), A1 and B1, congruently. Meanwhile, Gm and Hm represent estimated total other generation cost for month, m (MYR) and actual total other generation cost for month, m (MYR), respectively. On the other hands, for the Part 2 of Equation (2), the details of consideration can be expressed by the following Equation (12):
where, the FUNTm is an approved payment from the Electricity Industry Fund (EIF) to the Single Buyer, related to the ICPT adjustment, for month, m (MYR) while FUNPm is the Payment by the Single Buyer into the EIF, related to the ICPT an adjustment, for month, m (MYR). The amount of the calculation has been divided to estimated total qualifying sales (kWh), Fm accordingly. Basically, the value of the Fx was considered fix during the adjustment and really depending on the banking announcement, especially on the overnight policy rate (OPR) values.
Since introducing the ICPT mechanism, consumers have received rebates worth MYR 6.3 billion [3]. Successfully implementing sixteen (16) ICPT cycles since 2015, the government has protected MYR 11.7 billion from the effects of rising fuel prices. That includes the most recent MYR 5.8 billion in subsidies for the ICPT implementation period of July to December 2022. In addition, all Peninsular Malaysia consumers received an MYR 9.35 billion ICPT cost rebate from the government. The average price of coal has risen dramatically, which has led to this ICPT surcharge. Since coal is used for 59% of Peninsular Malaysia's generation, the increase in coal prices between January 2022 and June 2022 has significantly impacted the overall cost of generation [15]. From 1st July until 31st December 2022, all residential customers received their current rebate of 2.00 cent/kWh. However, from 1st February 2019 through 30th June 2022, all non-domestic customers were subjected to an ICPT surcharge of 3.70 cent/kWh. Details ICPT tariff is illustrated in Figure 3 (green colour indicates rebate while red colour indicates surcharge). Since the July 2023, the surcharge to commercial and industrial consumers has been increased to 20 cent/kWh.
4. Methodology
4.1. Forecasting Formulation
The formulation of those forecasting method with objective function of MAPE are presented in the following Equation (13)-(18) accordingly. However, for the ARIMA model, the equation contains three terms:
- (1)
- Auto Regression (AR): Regression analysis is used to compare the time series to its prior values, such as y(t-1), y(t-2) etc. The letter p stands for the lag order.
- (2)
- Integration (I): Differencing is used to make the time series stationary. The difference's order is indicated by the letter d.
- (3)
- Moving Average (MA): Regression is performed on the time series using residuals from previous observations, such as error ε(t-1), error ε(t-2) etc. The error lag order is indicated by the letter q. In the equation above, y^' is the differenced series, ϕ1 is the first AR term's coefficient, p is the AR term's order, θ11 is the first MA term's coefficient, q is the MA term's order, and εt is the error.
The performance evaluation of MA, ARIMA, and LSSVM models was conducted using the mean absolute percentage error (MAPE). MAPE is frequently used to display the error percentage of a prediction result as in Equation (18).
MA,
ARIMA,
MAPE,
where, is seasonalize component, is moving average, is seasonal component, is irregular component, and is trend component. Meanwhile, the FS is LSSVM output, b is a scalar threshold, N is number of the data and X(norm) is data normalization.
4.2. Data Set Collection
The dataset utilized in this study comprises fuel price data for coal, gas, and LNG. The objective is to employ this dataset to forecast the fuel prices for a three-year period. The dataset utilized for modelling and model validation spans from January 2012 to December 2022. The data were acquired from the Energy Commission and online sources pertaining to fuel prices. In this study, the modelling techniques of MA, ARIMA and LSSVM were employed to forecast three-year out-of-sample data points for the purpose of calculating the ICPT price. This section provides a comprehensive overview of the implementation process for fuel price forecasting. There are many available methods in the relevant literature for price forecasting. The most common models for this purpose are the autoregressive integrated moving average (ARIMA), and LSSVM models.
4.3. Implementation of Techniques
The standard procedure for fuel price forecasting using the MA method is illustrated in Figure 4. The flowchart illustrates the procedure for time series forecasting using the MA method in Microsoft Excel. The forecasting process commenced by gathering historical data. The primary data utilized for forecasting fuel prices include coal, LNG and gas prices. The data is subsequently visualized during the pre-processing stage. Consequently, the data appears to be random or irregular in nature. MA was utilized as a data preparation technique due to its ability to decrease random variation in observations and reveal the more accurate structure of the underlying causal processes. The calculation involves determining the average of the most recent 12 data points. The smoothness of the trend cycle prediction is determined by the order of the moving average (MA). The subsequent phase involves identifying the seasonal component. The data is subsequently subjected to a process of di-seasonalized order to eliminate irregularities and seasonal patterns. This is achieved by dividing the actual data by the seasonal value. The application of simple linear regression is subsequently employed to identify the trend component, which is then utilized for forecasting the future price of fuel. When evaluating the model outputs that were acquired, the mean absolute percentage error (MAPE) for the time series model was employed as evaluation criteria.
Different to MA, the goal of the LSSVM algorithm is to locate a hyperplane that best separates or fits the data that has been provided for training. To learn the underlying patterns and relationships that exist between input variables and output variables (forecasted), LSSVM makes use of past data. After that, it builds a model that, based on the observed patterns in the training data, can be utilized to make accurate predictions regarding future values. The process of predicting using the LSSVM approach is illustrated in Figure 4.
It is necessary to perform the necessary preprocessing on the historical data pertaining to fuel prices in order to train the LSSVM model. After it has been collected, the data must then undergo preprocessing, during which any outliers or inconsistencies must be resolved. In order to guarantee that the data is presented in a format that is suitable for the LSSVM method, the data must first be normalised. Data normalisation was conducted prior to training by employing Min Max Normalisation, a technique that normalises each feature component to a specific range [26]. This ensures that larger input values do not overpower or overshadow the smaller ones. Following that step, the dataset is segmented into a training set and a testing set. The LSSVM model will be trained using the training set, and the testing set will be used to evaluate the model's performance in terms of predicting. The whole dataset of 132 sample points for coal, gas, and LNG is split into two sub-sets: (a) the training dataset, which includes 84 sample points necessary for training the model; and (b) the testing dataset, which includes 48 sample points to evaluate the performance of a model. There is a distinction in performance between the LSSVM when being tested and when being trained. Because of overtraining, LSSVM typically displays superior performance during the training phase as compared to the testing phase. Training for the LSSVM model is done with the help of historical data. The LSSVM method determines which hyperplane is the most accurate prediction based on the training data and then optimises that hyperplane. The strategy of least squares is used to solve a constrained optimisation issue, which enables this result to be obtained. After the model has been trained, the performance of the model is evaluated using MAPE [27]. The LSSVM model that has been trained is given the input variables for the upcoming time periods, and the model then gives forecasts for the years 2023, 2024, and 2025.
On the other hand, the ARIMA model takes historical data and divides it into three components, autoregression (AR) which shows a changing variable regress on its own lagged, integrated (I), which represents linear or polynomial trends and Moving Average (MA), which represents dependency between and observation and residual error. As a result, the model has three model parameters: AR(p), I(d), and MA(q), which are all combined to form the ARIMA (p, d, q) model parameters: AR(p), I(d), and MA(q), where, p is autocorrelation order (lag), d is differencing order, q is moving average order.
The ARIMA model attempts to ensure that the future value of time series data has a practical connection with the current and historical values. ARIMA model building consists of four major steps, which are identification, estimation, diagnostic and forecasting [28]. With the help of these four steps, the tentative model parameters are first identified using graphs of the auto-correlation function (ACF) and partial auto-correlation function (PACF) after which the coefficient is calculated, and the likely model is determined. The model must then be validated and to assess the forecast's veracity and monitor the model's performance, simple statistics were applied. The time series must be stationary before using ARIMA or any of its extensions. If a time series possesses all three of the following characteristics which are constant mean, variance, and covariance, it is said to be stationary. There are two methods to check for stationarity which are i) The autocorrelation to check the stationary and ii) The autocorrelation to check the stationarity.
Based on the analysis of Figure 5, Figure 6 and Figure 7, it can be observed that the autocorrelation function (ACF) for coal, gas, and LNG exhibits a positive value with a consistent and gradual decrease over time. The lagging issues extend beyond the designated blue highlighted area. This suggests that there is a lack of zero correlation between observations at different lags for all fuel types. The presence of additional spikes beyond the blue range indicates that the series does not exhibit characteristics of 'White Noise'. An illustration of a stationary time series is the phenomenon known as 'White Noise'. Based on the analysis, it can be inferred, that the time series data for coal, LNG, and regulated gas exhibits non-stationarity.
Another method for assessing stationarity is the Augmented Dickey Fuller Test (ADF Test). This statistical test belongs to the subcategory of Unit Root tests. The analysis aims to determine the presence of non-stationarity and the existence of a unit root in the time series. The assumptions are a) Null hypothesis b) Ho is the time series is non-stationary and there is a unit root. And, Alternate Hypothesis H1 is the time series is stationary and there is no unit root.
The ADF assessment is carried out using the original dataset. The p-value from the ADF test is 0.951480 for coal and 0.267107 for gas, both of which are greater than 0.05. At 5% significance, the null hypothesis cannot be rejected. As a result, the test does not reject the null hypothesis. According to ADF, the series has a unit root and is non-stationary. The p-value for LNG is 0.012868, which is less than 0.05. As a result, the null hypothesis was rejected, and the series was determined to be stationary. The differential was done on non-stationary data, and the smoothness of the data was then assessed using the ADF test. The d-value in the ARIMA (p, d, q) model was chosen after passing the stationary test [29]. The next step is to identify a suitable model. The p and q values of the ARIMA model must be determined. Using the auto ARIMA function to examine the range of the best model, the values of p and q were obtained by observing the sample's auto correlation function (ACF) and partial auto correlation function (PACF). For coal, LNG, and gas, the selected ARIMA models are (1,1,1), (1,0,1), and (2,0,1). An autoregressive order of 1 for coal and LNG, and an autoregressive order of 2 for gas, specify the value of the series one and two time periods in the past to be used to predict the current value. Predictions are made and compared with the testing data set to validate the model after fitting input data with a suitable ARIMA model.
Thus, the Imbalance Cost Pass-Through (ICPT) is a mechanism employed to transfer the expenses associated with fuel and other generation-related costs to consumers of electricity. The ICPT, or the Imbalance Cost Pass-Through, is assessed biannually to determine whether a rebate or a surcharge is applicable. This determination is based on a comparison between the actual fuel costs and the scheduled fuel costs. The ICPT is typically calculated on a semi-annual basis. The adjustment for each type of cost is divided into two components. The initial segment utilises the current data for the two most recent months that are available, along with estimated data for the subsequent four months. The second part corrects for differences between actual outcomes and the estimated data used to calculate the first adjustment. The process for calculating the ICPT for commercial customers involves the following steps:
- 1)
- The initial step in calculating ICPT involves determining the interim fuel cost pass through adjustment for a six-month period (IFUCS) using Equation (6). The estimated and actual total fuel costs (Cm, Dm) were derived from the projected fuel cost using the ARIMA and LSSVM models. The data for Dm was not accessible due to limited resources. As a result, forecasted data was utilised instead. The estimated total qualifying sales (Fm) were acquired from websites of Single Buyers (SB). The audited total qualifying sales, to which the ICPT adjustment is applied, was obtained from the Grid System Operator (GSO) website. By using Equation (5), the average fuel cost for was calculated. The total forecasted fuel cost (FFULs) for six months is derived from the previously forecasted fuel cost. The weighted average cost of capital of Regulatory Period 3 (RP3) is set by the government at 7.3%. The forecasted total electricity sales in year 2021 as made at the time of setting the Base Average Tariff was obtained from SB.
- 2)
- Then, using Equation (6), the first fuel cost pass-through adjustment (As) was determined.
- 3)
- Next, Equation (7) was used to determine the interim other generation cost pass-through adjustment (IGSCs). System marginal pricing (SMP) at SB websites was used to determine the estimated and actual total other generation cost (Gm, Hm).
- 4)
- To determine the average other generation cost (AGSCs) using Equation (8), the forecasted other generation cost is obtained by subtracting the generation margin (Gm) from the forecasted fuel and fuel-related costs (FFULs).
- 5)
- Equation (7) is then used to compute the first other generation cost pass-through adjustment (Bs) in the six-month period.
- 6)
- The next part involves calculating the secondary fuel and additional generation cost pass-through adjustment within the designated six-month timeframe. This can be achieved by utilising Equation (10)-(11).
- 7)
- The remuneration rates for ICPT adjustment, specifically IARRs-1 and IARRs-2, are constantly set at 2.8738 and 2.86, respectively.
- 8)
- The six-month generation cost adjustment was determined using Equation (3).
- 9)
- Equation (12) was used to compute the fund contribution (FUNDs). The approved payment (FUNPm) from the Electricity Industry Fund (EIF) and the payment by the Single Buyer (FUNTm) into the EIF are fixed at MYR 1.6 billion and MYR 1.3 billion, respectively.
- 10)
- The ICPT price was then determined using Equation (2).
Even though, the ICPT is a controversial mechanism, but it is an important part of the electricity market. The ICPT helps to ensure that consumers pay the true cost of electricity, and it can help to protect consumers from large fluctuations in fuel prices. Thus, the summary of the method process flow to find the forecast ICPT is demonstrated as in Figure 8 congruently.
5. Results and Discussion
This section presents an analysis of different fuel price forecasting methods, specifically the implementation of MA, ARIMA, and LSSVM. This section also covers an analysis of MAPE for different forecasting methods, as well as the implementation of ARIMA and LSSVM models in estimating the ICPT price for commercial customers.
5.1. Moving Average (MA) Forecasting Profile
One approach for predicting fuel prices is through the implementation of the moving average method. The data is smoothed by calculating the average of 12 data points as depicted in Figure 9 (a-c). The moving average method for predicting fuel prices has proven to be unreliable. For coal, the actual price in January 2012 was MYR 9.18/mmBtu, nearly double the predicted MYR 4.50/mmBtu. This trend of significant differences continued until December 2022. For gas, the predicted price in January 2012 was MYR 8.65/mmBtu, slightly higher than the actual MYR 7.78/mmBtu. The largest discrepancy was in August 2022, with the actual price being MYR 40.71/mmBtu, more than double the predicted MYR 17.74/mmBtu. For LNG, the predicted price in January 2012 was MYR 37.05/mmBtu, slightly higher than the actual MYR 35.9/mmBtu. The largest difference was in November 2015, with the actual price being MYR 69.89/mmBtu, more than double the predicted MYR 30.95/mmBtu.
5.2. LSSVM Forecasting Profile
LSSVM forecasting method, as depicted in Figure 10 (a-c), shows significant disparities between predicted and actual prices. In the coal market (Figure 10 (a)), the January 2022 prediction of MYR 13.55/mmBtu was notably lower than the actual MYR 25.53/mmBtu, with this trend persisting until December 2022. The actual coal price reached MYR 44.62/mmBtu, whereas the prediction was only RM 16.26/mmBtu, resulting in a substantial MYR 28.36 difference. These findings cast doubt on the reliability of the LSSVM model for coal price forecasting. Figure 10 (b) presents gas price variations, mirroring the coal market's discrepancy. In January 2022, the actual gas price was MYR 20.71/mmBtu, contrasting with the predicted MYR 10.76/mmBtu, a 9.95/mmBtu difference. May 2022 saw a substantial gap, with the actual price at MYR 36.05/mmBtu and the predicted at MYR 10.8/mmBtu. Figure 10 (c) illustrates LNG prices, with January 2022 predictions surpassing actual prices by MYR 0.88/mmBtu. The actual prices then surged, reaching MYR 36.42 in February 2022, while predictions stood at MYR 22.23/mmBtu. October 2022 saw a significant spike to MYR 65.47/mmBtu, far exceeding the predicted MYR 25.50/mmBtu, resulting in a MYR 39.97 difference. By December 2022, the predicted price was MYR 43.09, but the actual price was MYR 54.23.
5.3. ARIMA Forecasting Profile
The second method of forecasting involves the implementation of the ARIMA model. According to Figure 11 (a-c), the forecasted fuel price are closely aligned with the actual trend. Coal price predictions closely matched actual prices, with minor deviations starting in February 2012. For example, in December 2012, the forecasted gas price was MYR 7.18/mmBtu, nearly matching the actual MYR 7.21/mmBtu. However, in March 2019, a slight overestimation occurred with a predicted price of MYR 21.13/mmBtu compared to an actual MYR 20.99/mmBtu. The forecast for December 2022 closely aligned with the actual MYR 44.62/mmBtu. Gas prices showed discrepancies between predictions and actual outcomes. From January 2012 to November 2013, predicted prices consistently exceeded actuals. Notably, in January 2012, the actual gas price was MYR 7.78/mmBtu, while the prediction for November 2013 reached MYR 12.64/mmBtu. The highest recorded gas price in August 2022 was MYR 40.71/mmBtu, whereas the prediction was MYR 37.66/mmBtu. LNG price predictions exhibited disparities, with occasional overestimations and underestimations compared to actual prices. In January 2022, the actual price stood at MYR 35.9/mmBtu, slightly higher than the predicted MYR 35.24/mmBtu. Predictions began at MYR 28.67/mmBtu in May 2015, peaking at MYR 35.68/mmBtu in November 2021. However, predictions fell below actual prices afterward. December 2022 presents an actual price of MYR 54.23/mmBtu, while the expected price settled at MYR 50.87/mmBtu.
5.4. Analysis of the MAPE
The performance of the MA, LSSVM, and ARIMA models in predicting is presented in Table 1. The ARIMA model demonstrated superior performance compared to the MA and LSSVM models. As the forecast horizon extends, the predictive accuracy of both the MA and ARIMA models diminishes. The findings suggest a decrease in error (MAPE) and an improvement in prediction accuracy when utilizing the ARIMA model. The Mean Absolute Percentage Error (MAPE) values obtained from the ARIMA model for coal are 1.63%. This is in contrast to the MA value of 29.79% and LSSVM value of 26.28%. The MAPE values for the gas dataset are 32.94%, 5.47%, and 34.46% for the MA, ARIMA and LSSVM models, respectively. The ARIMA model demonstrates the lowest error percentage at 5.09% in comparison to the MA model with an error percentage of 39.78% and the LSSVM model with an error of 36.9%.
Based on the observed trend, it can be concluded that the ARIMA model outperforms both the MA and LSSVM models in the current case. This conclusion is drawn from the fact that the relative error of the model prediction increases as the forecast period extends. The ARIMA model demonstrated superior performance compared to the LSSVM model, potentially attributed to the limited amount of data available to train the LSSVM model. The limitations of the ARIMA model lie in its ability to predict fuel prices solely based on its own time series data. Consequently, the model's validity is contingent upon the absence of significant changes in the external factors that influence fuel prices. The analysis and forecasting of fuel pricing, specifically coal, gas, and LNG, are influenced by a range of factors [30]. These factors include supply and demand dynamics, currency exchange rates, regulatory frameworks, and international political situations. Furthermore, these factors exhibit interdependencies and exert a substantial influence on the fuel expenditure.
5.5. Discussion of the Forecast ICPT
The prices of ICPT are measured using the ARIMA and LSSVM forecasting models because these two models have minimal MAPE values. A smaller MAPE value indicates a more accurate model. The ARIMA model is slightly more accurate than the LSSVM model in the present case. The ICPT pricing for commercial customers in Malaysia is displayed in Figure 12 for the period spanning July–December 2022 through January–June 2024 as predicted by ARIMA and LSSVM. Both ARIMA and LSSVM predict that the ICPT price will decline in 2024. From July 2022 to June 2023, according to the ARIMA forecast, the ICPT tariff for commercial customers is anticipated to remain unchanged at MYR 0.21/kWh. This price is roughly the same as the price determined by the energy commission at MYR 0.20/kWh. The ICPT price is anticipated to increase to MYR 0.23/kWh in July-December 2023. According to the LSSVM forecast, the ICPT price will increase from MYR 0.18/kWh in Jul-Dec 2022 to MYR 0.21/kWh in July-Dec 2023.
The anticipated ICPT for July-December 2023, however, is not close to the government-set ICPT price of MYR 0.17/kWh. This is partly, due to the limited number of resources in determining the ICPT price. According to the ARIMA and LSSVM forecasts, the ICPT price is expected to decline in 2024. In Jan-Jun 2024, the ARIMA forecast predicts the ICPT surcharge price will decrease to MYR 0.07/kWh, while the LSSVM forecast predicts the ICPT surcharge price will decrease to MYR 0.06/kWh. A number of factors, which includes the continuous decline in fuel prices and the government's efforts to reduce the cost of energy for consumers, are predicted to contribute to the ICPT price decline in 2024. In the upcoming years, the ICPT price for commercial customers is anticipated to fluctuate. As the government continues to intervene in the energy market and implement policies to reduce fuel prices, the long-term trend is anticipated to be downward.
6. Conclusion
In conclusion, this study introduces Imbalance Cost Pass-Through (ICPT) price forecasting as a critical tool within Malaysia's incentive-based regulation (IBR) framework, allowing power producers to adapt tariffs to variable fuel prices, thus enhancing economic resilience in electricity generation. Emphasizing the influence of commodity prices, such as coal, gas, and LNG, on generation costs, the study highlights the need for proactive forecasting to aid large consumers, eliminating dependency on semi-annual ICPT price releases. Employing ARIMA, Moving Average (MA), and LSSVM methods, the research finds that ARIMA outperforms in fuel price forecasting, with minimal differences from LSSVM for ICPT prices. Notably, the ARIMA and LSSVM models closely align with actual ICPT tariffs for specific periods, predicting a decrease in ICPT prices for January-June 2024, offering valuable insights for budgeting and planning. This study implicates the extension for future research, particularly in refining the forecasting methods. These will ultimately be benefiting consumers through more predictable and stable electricity prices, fostering economic growth, and enhancing energy security in the region. The future research can also explore the latest powerful forecasting method that appropriate to be applied.
Author Contributions
Fatin Khairunnisa Khairuddin: Methodology, Writing-original draft preparation, Software. Mohamad Fani Sulaima: Supervision, writing, visualization. Farah Anishah Zaini: Software, methodology, validation. Mohd Shahrin Abu Hanifah: Writing review and editing. Nur Hazahsha Shamsudin: Results validation, investigation.
Funding
This research received no external funding.
Acknowledgments
The authors would like to thank Universiti Teknikal Malaysia Melaka (UTeM) for all the support given.
Conflicts of Interest
The authors declare no conflicts of interest.
References
- Y. Chen, M. Li, Y. Yang, C. Li, Y. Li, and L. Li, “A hybrid model for electricity price forecasting based on least square support vector machines with combined kernel,” Journal of Renewable and Sustainable Energy, vol. 10, no. 5, 2018. [CrossRef]
- M. Sibeperegasam, V. K. Ramachandaramurthy, F. Li, and S. Walker, “De-Regulation of Electricity Industry: A Malaysian Perspective,” International Journal of Electronics and Electrical Engineering, vol. 8, no. 2, pp. 17–23, 2020. [CrossRef]
- M. F. Sulaima, S. A. A. Hanipah, N. R. A. Razif, I. A. W. A. Razak, A. F. A. Kadir, and Z. H. Bohari, “Industrial Energy Load Profile Forecasting under Enhanced Time of Use Tariff (ETOU) using Artificial Neural Network,” International Journal of Advanced Computer Science and Applications, vol. 11, no. 12, pp. 204–209, 2020. [CrossRef]
- N. Z. Z. Abidin and J. B. Ibrahim, “Embracing renewables - Overcoming integration challenges from Malaysia’s utility perspective,” 2015 IEEE Eindhoven PowerTech, PowerTech 2015, 2015. [CrossRef]
- M. Sibeperegasam, V. K. Ramachandaramurthy, S. Walker, and J. Kanesan, “Malaysia’s electricity market structure in transition,” Utilities Policy, vol. 72, no. July, p. 101266, 2021. [CrossRef]
- C. Kuster, Y. Rezgui, and M. Mourshed, “Electrical load forecasting models: A critical systematic review,” Sustainable Cities and Society, vol. 35, no. June, pp. 257–270, 2017. [CrossRef]
- M. Imani and H. Ghassemian, “Electrical Load Forecasting Using Customers Clustering and Smart Meters in Internet of Things,” 9th International Symposium on Telecommunication: With Emphasis on Information and Communication Technology, IST 2018, pp. 113–117, 2019. [CrossRef]
- J. Aguilar, A. Garces-jimenez, M. D. R-moreno, and R. García, “A systematic literature review on the use of artificial intelligence in energy self-management in smart buildings,” Renewable and Sustainable Energy Reviews, vol. 151, no. May, p. 111530, 2021. [CrossRef]
- R. Porteiro and S. Nesmachnow, “Forecasting hourly electricity demand of Uruguay for the next day using artificial neural networks,” 2020 IEEE PES Transmission and Distribution Conference and Exhibition - Latin America, T and D LA 2020, pp. 8–13, 2020. [CrossRef]
- T. N. B. TNB, “Integrated Annual Report 2020,” Annual Report 2020, p. 360, 2020.
- N. Singh and S. R. Mohanty, “A Review of Price Forecasting Problem and Techniques in Deregulated Electricity Markets,” Journal of Power and Energy Engineering, vol. 03, no. 09, pp. 1–19, 2015. [CrossRef]
- P. Hendikawati, Subanar, Abdurakhman, and Tarno, “A survey of time series forecasting from stochastic method to soft computing,” Journal of Physics: Conference Series, vol. 1613, no. 1, 2020. [CrossRef]
- Cruz A., A. Muñoz, J. L. Zamora, and R. Espínola, “The effect of wind generation and weekday on Spanish electricity spot price forecasting,” Electric Power Systems Research, vol. 81, no. 10, pp. 1924–1935, 2011. [CrossRef]
- G. Gao, K. Lo, and F. Fan, “Comparison of ARIMA and ANN Models Used in Electricity Price Forecasting for Power Market,” Energy and Power Engineering, vol. 09, no. 04, pp. 120–126, 2017. [CrossRef]
- E. Almeshaiei and H. Soltan, “A methodology for Electric Power Load Forecasting,” Alexandria Engineering Journal, vol. 50, no. 2, pp. 137–144, 2011. [CrossRef]
- Abedinia O., N. Amjady, and H. Zareipour, “A New Feature Selection Technique for Load and Price Forecast of Electrical Power Systems,” IEEE Transactions on Power Systems, vol. 32, no. 1, pp. 62–74, 2017. [CrossRef]
- T. J. Sturgeon, “Proceedings 59th ISI World Statistics Congress, 25-30 August 2013, Hong Kong (Session STS024) p.1550,” no. August, pp. 25–30, 2013.
- V. E. Ali Azadeh, Mohsen Moghaddam, Mehdi Khakzad, “54. A flexible neural network-fuzzy mathematical programming algorithm for improvement of oil price estimation and forecasting _ Elsevier Enhanced Reader.pdf.”.
- J. Mei, D. He, R. Harley, T. Habetler, and G. Qu, “A random forest method for real-time price forecasting in New York electricity market,” IEEE Power and Energy Society General Meeting, vol. 2014-October, no. October, 2014. [CrossRef]
- Z. Mustaffa, M. H. Sulaiman, and M. N. M. Kahar, “Training LSSVM with GWO for price forecasting,” 2015 4th International Conference on Informatics, Electronics and Vision, ICIEV 2015, pp. 1–6, 2015. [CrossRef]
- J. Zhang, Z. Tan, and S. Yang, “Day-ahead electricity price forecasting by a new hybrid method,” Computers and Industrial Engineering, vol. 63, no. 3, pp. 695–701, 2012. [CrossRef]
- L. Z. Li Xie, Hua Zheng, “Electricity Price Forecasting by Clustering-LSSVM,” pp. 697–702, 2007.
- Q. Ge et al., “Industrial Power Load Forecasting Method Based on Reinforcement Learning and PSO-LSSVM,” IEEE Transactions on Cybernetics, vol. 52, no. 2, pp. 1112–1124, 2022. [CrossRef]
- Emhamed A. A. and J. Shrivastava, “Electrical load distribution forecasting utilizing support vector model (SVM),” Materials Today: Proceedings, vol. 47, pp. 41–46, 2021. [CrossRef]
- Ali A. N. F., M. F. Sulaima, I. A. W. A. Razak, A. F. A. Kadir, and H. Mokhlis, “Artificial Intelligence Application in Demand Response: Advantages, Issues, Status, and Challenges,” IEEE Access, vol. 11, no. December 2022, pp. 16907–16922, 2023. [CrossRef]
- Z. Mustaffa, Y. Yusof, and S. S. Kamaruddin, “Gasoline Price Forecasting: An Application of LSSVM with Improved ABC,” Procedia - Social and Behavioral Sciences, vol. 129, pp. 601–609, 2014. [CrossRef]
- M. H. L. Lee et al., “A Comparative Study of Forecasting Electricity Consumption Using Machine Learning Models,” Mathematics, vol. 10, no. 8, 2022. [CrossRef]
- G. Bandyopadhyay, “Gold Price Forecasting Using ARIMA Model,” Journal of Advanced Management Science, no. March, pp. 117–121, 2016. [CrossRef]
- S. Singh, K. S. Parmar, S. J. S. Makkhan, J. Kaur, S. Peshoria, and J. Kumar, “Study of ARIMA and least square support vector machine (LS-SVM) models for the prediction of SARS-CoV-2 confirmed cases in the most affected countries,” Chaos, Solitons and Fractals, vol. 139, p. 110086, 2020. [CrossRef]
- “Malaysia Energy Statistics Handbook,” Department of Energy Management and Industrial Development Suruhanjaya Tenaga (Energy Commission), vol. 1, p. 86, 2020.
Figure 1.
The general description of the MESI structure in Peninsular Malaysia comes with two types of tariffs which are ICPT and base under IBR.
Figure 1.
The general description of the MESI structure in Peninsular Malaysia comes with two types of tariffs which are ICPT and base under IBR.
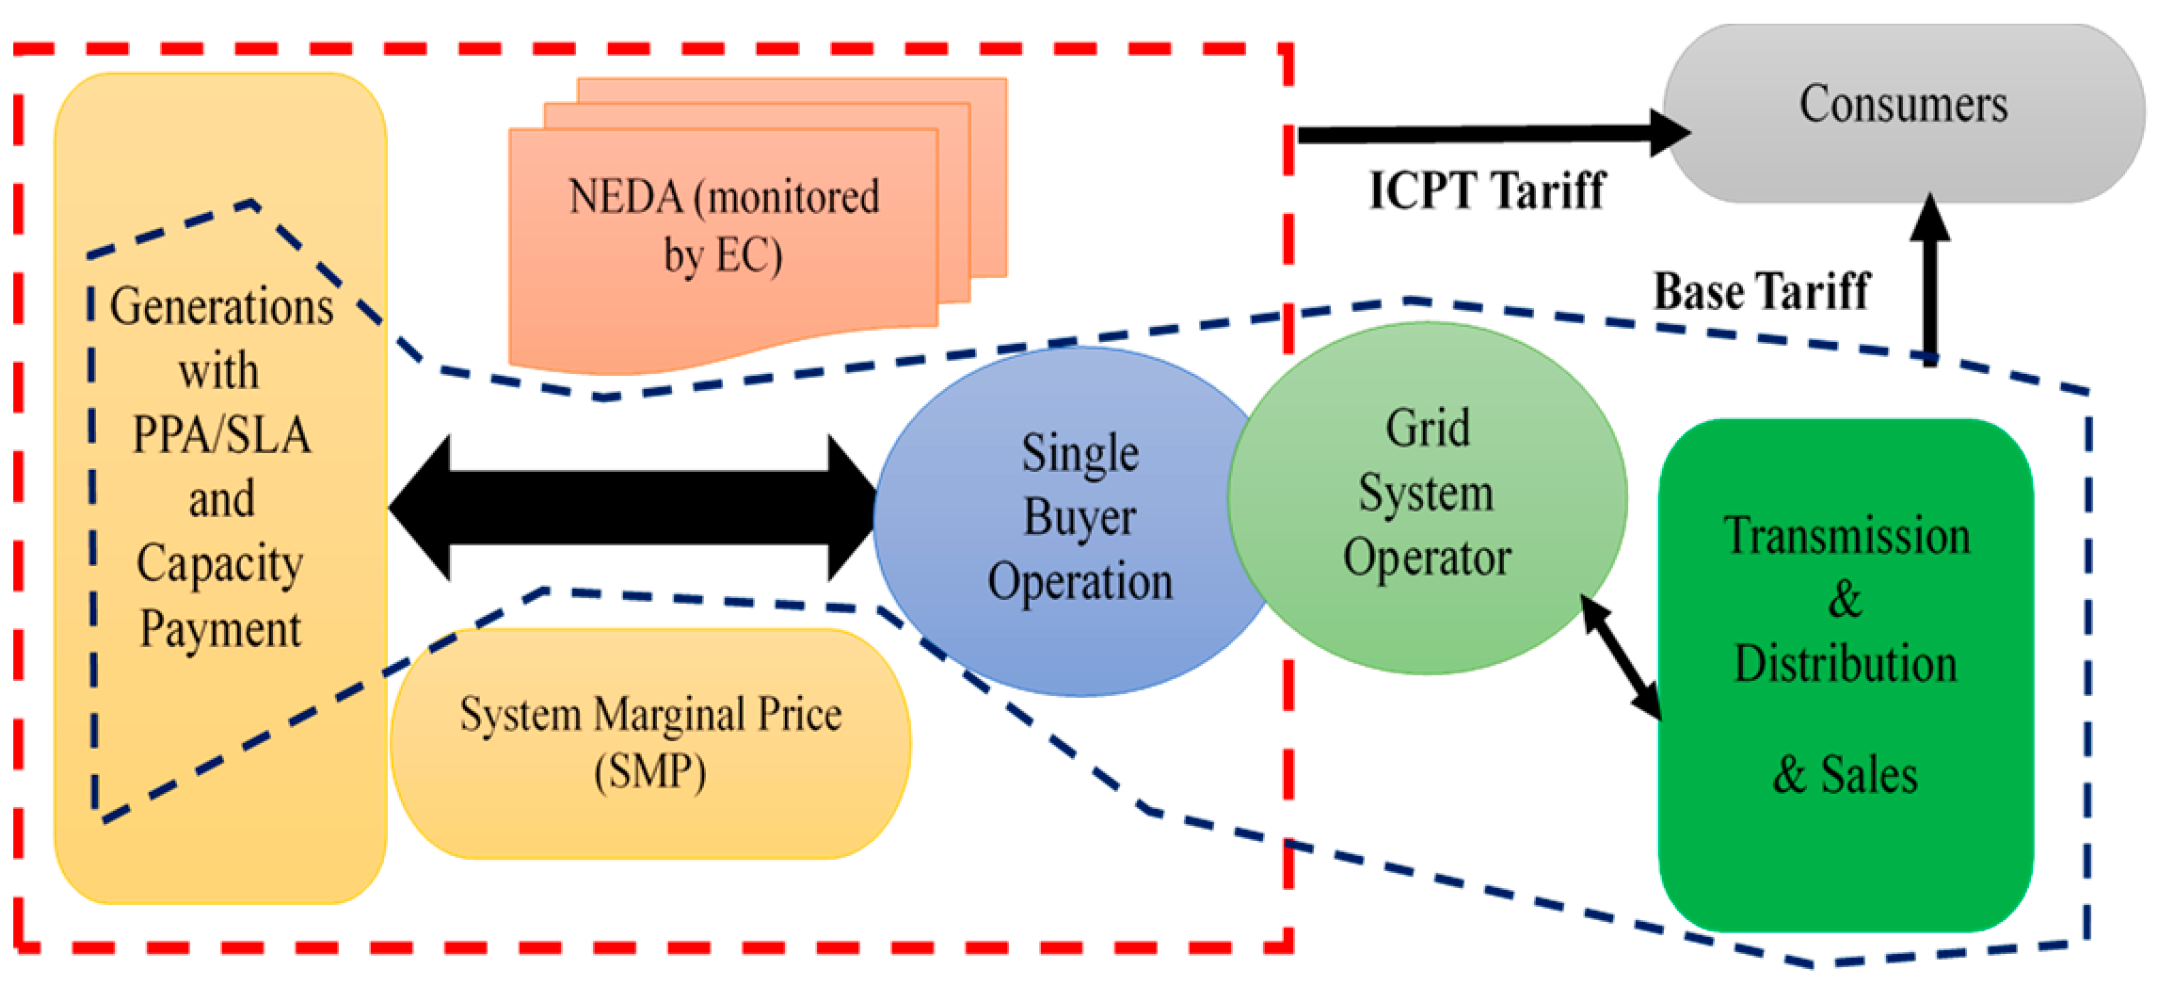
Figure 2.
Considered ICPT components under IBR.
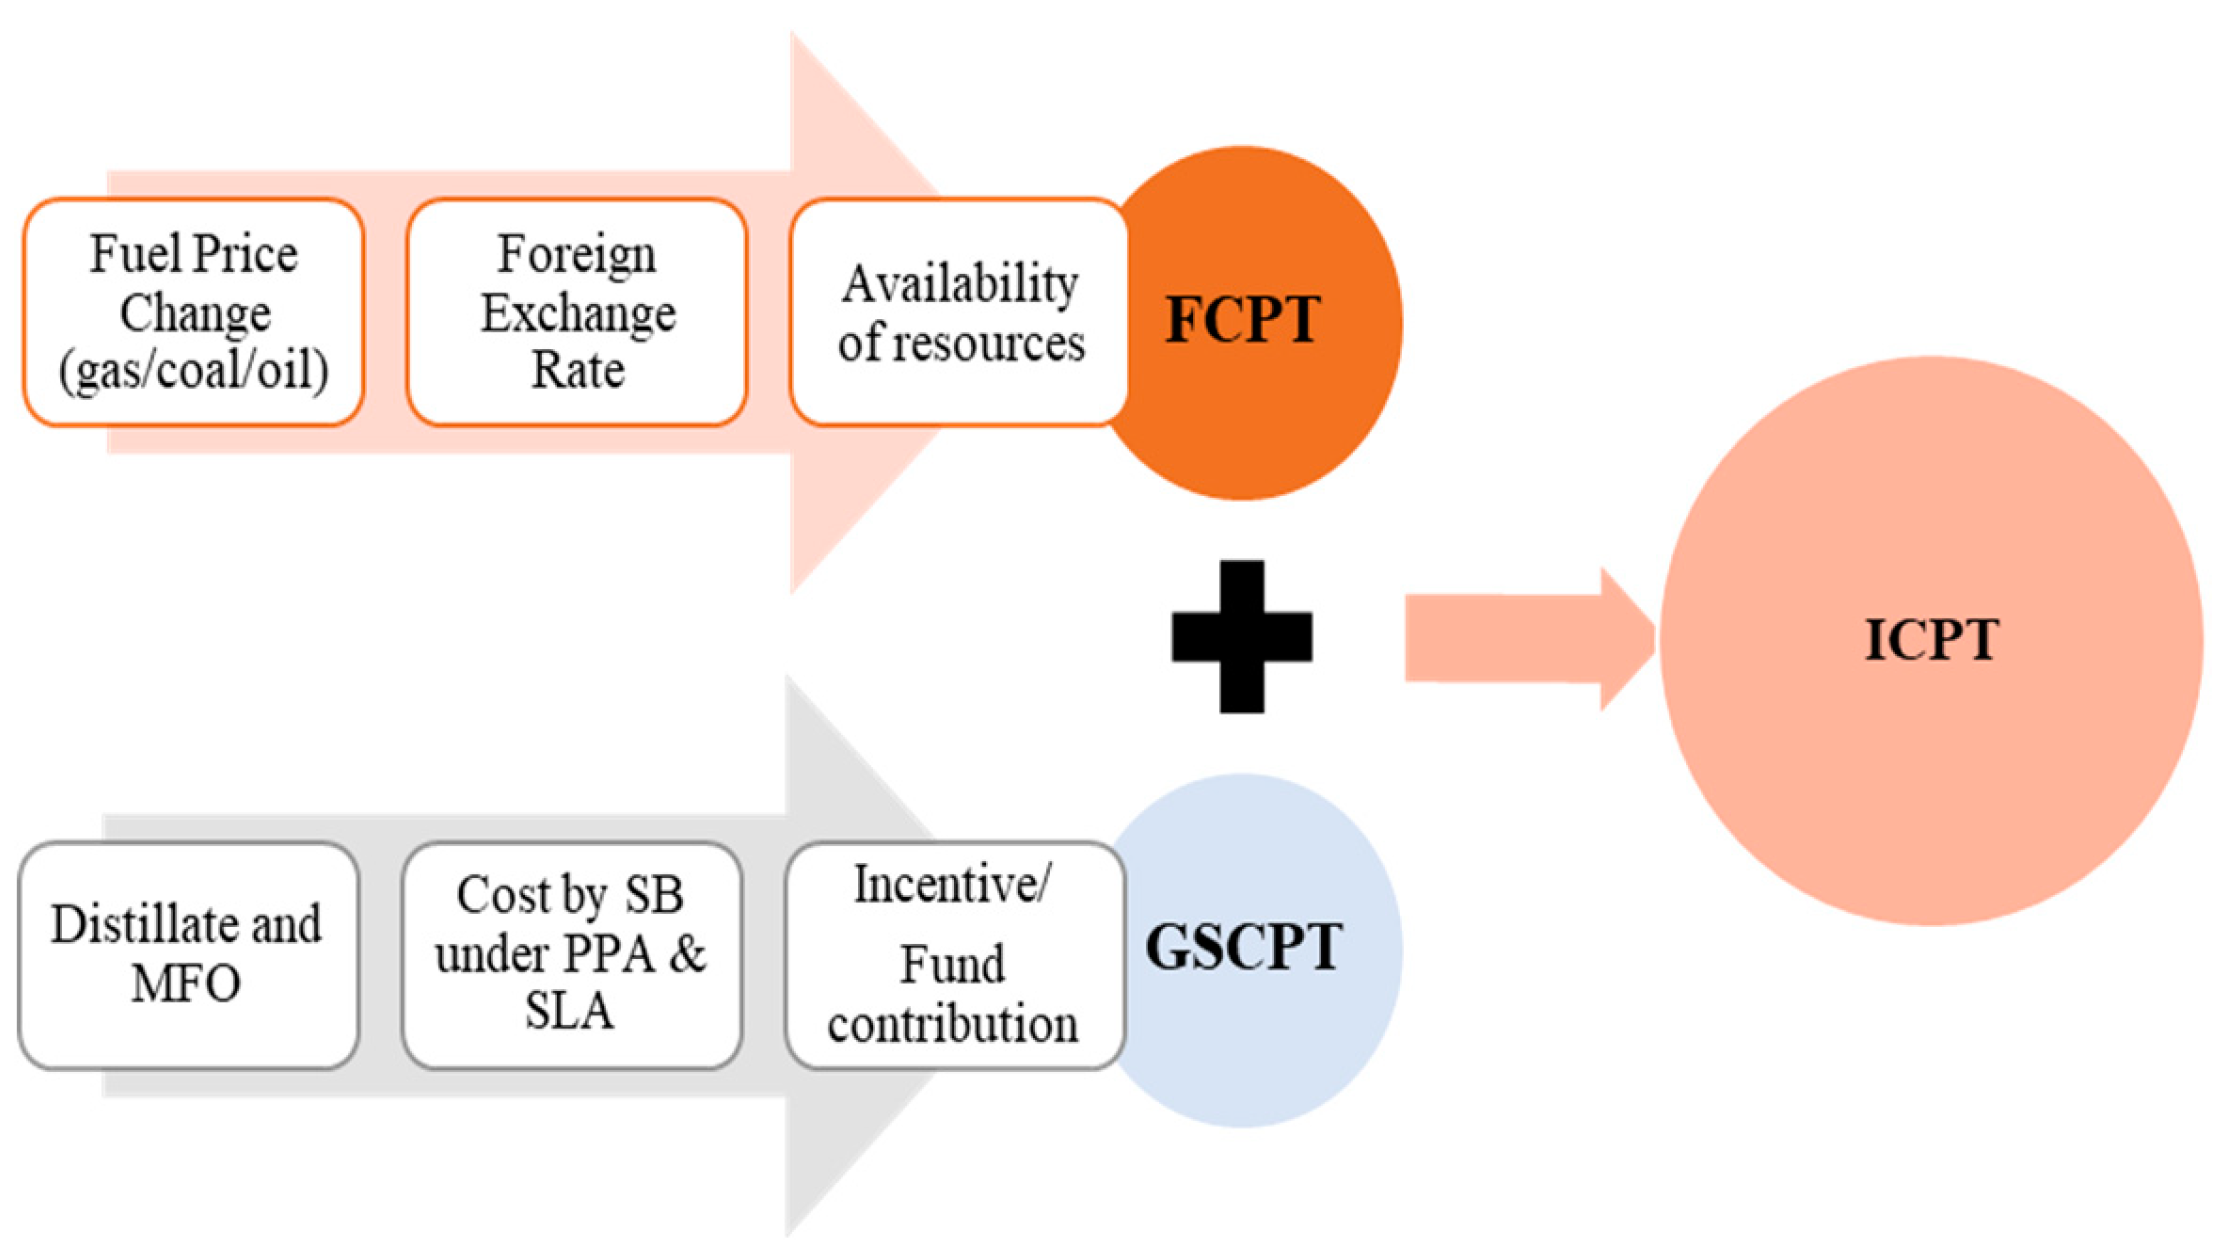
Figure 3.
Previous ICPT price.
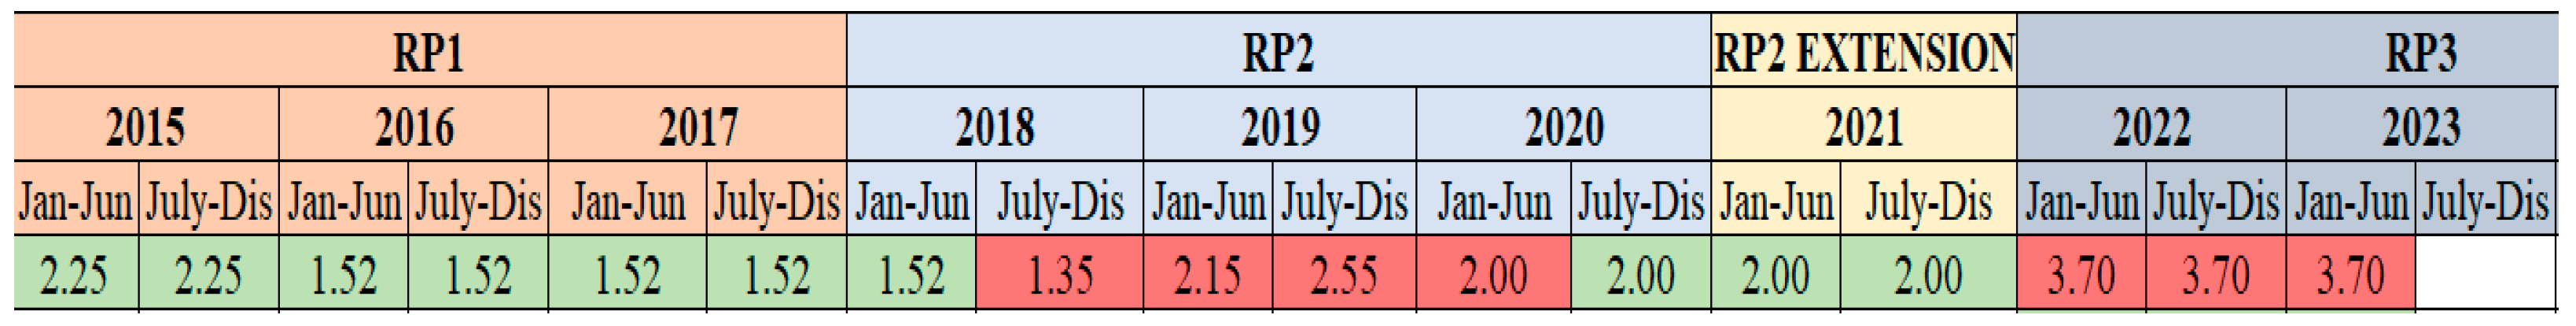
Figure 4.
Flowchart of (a) LLSVM and (b) Moving Average process.
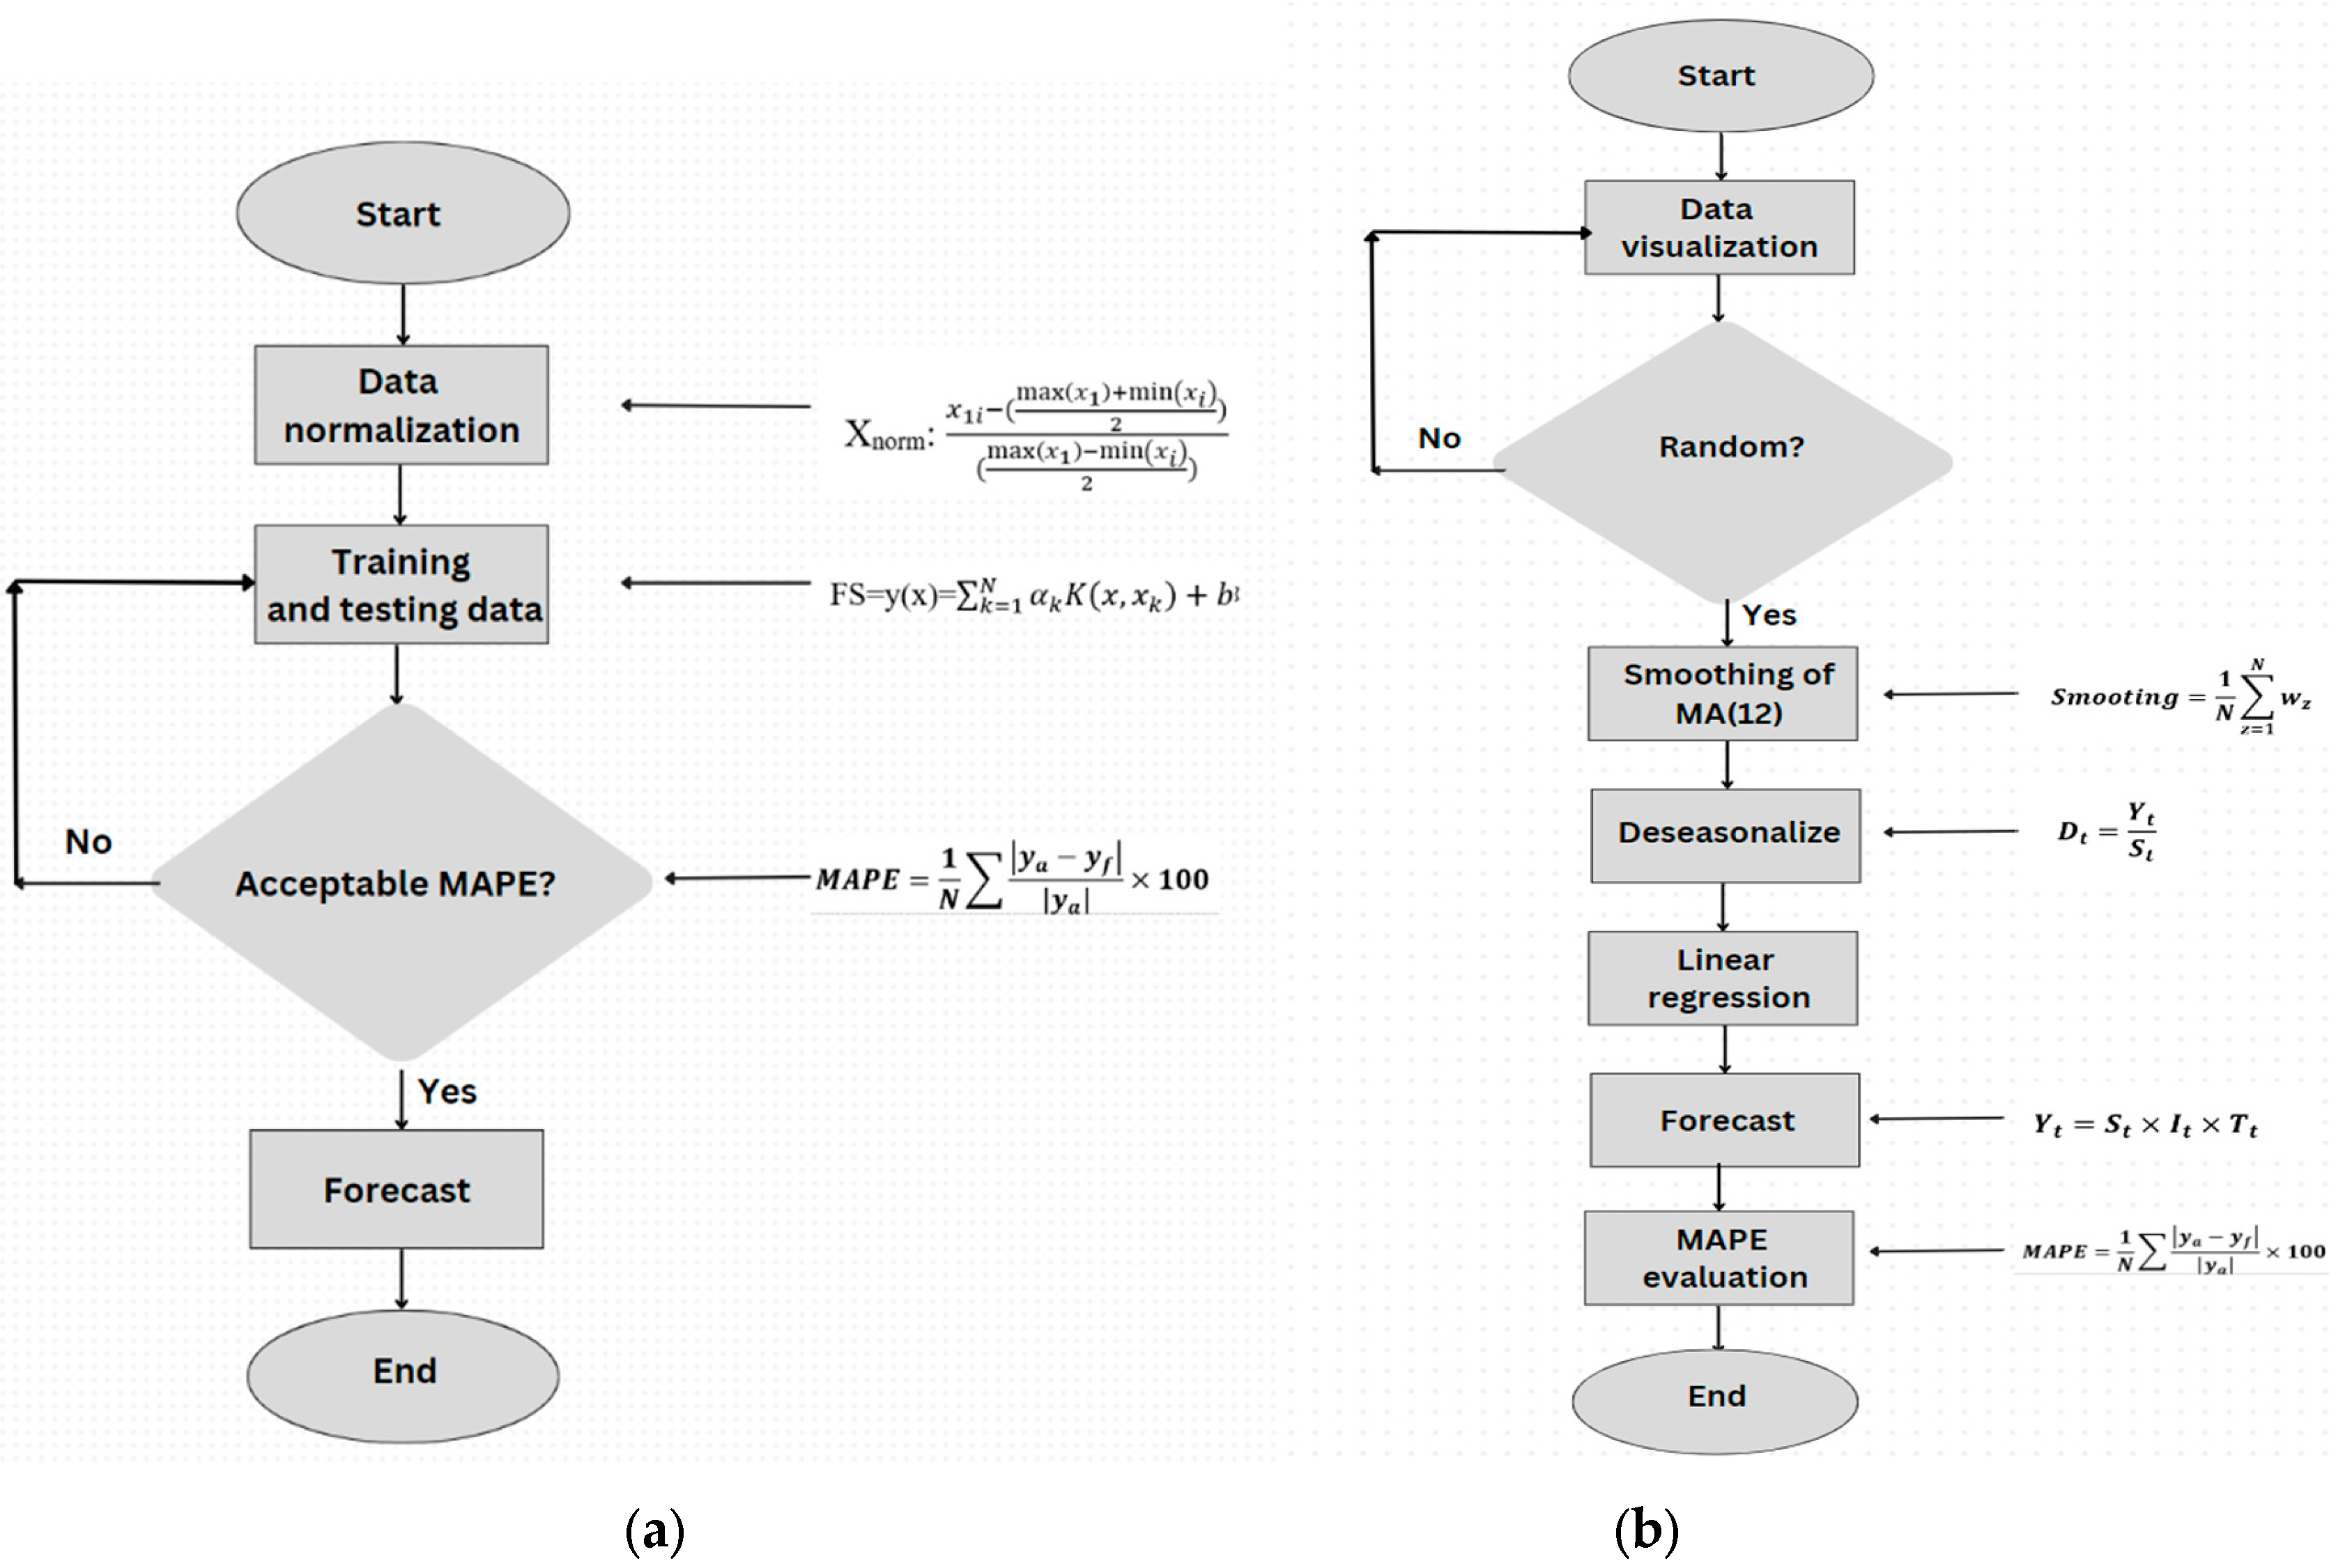
Figure 5.
(a) ACF and (b) PACF of coal.
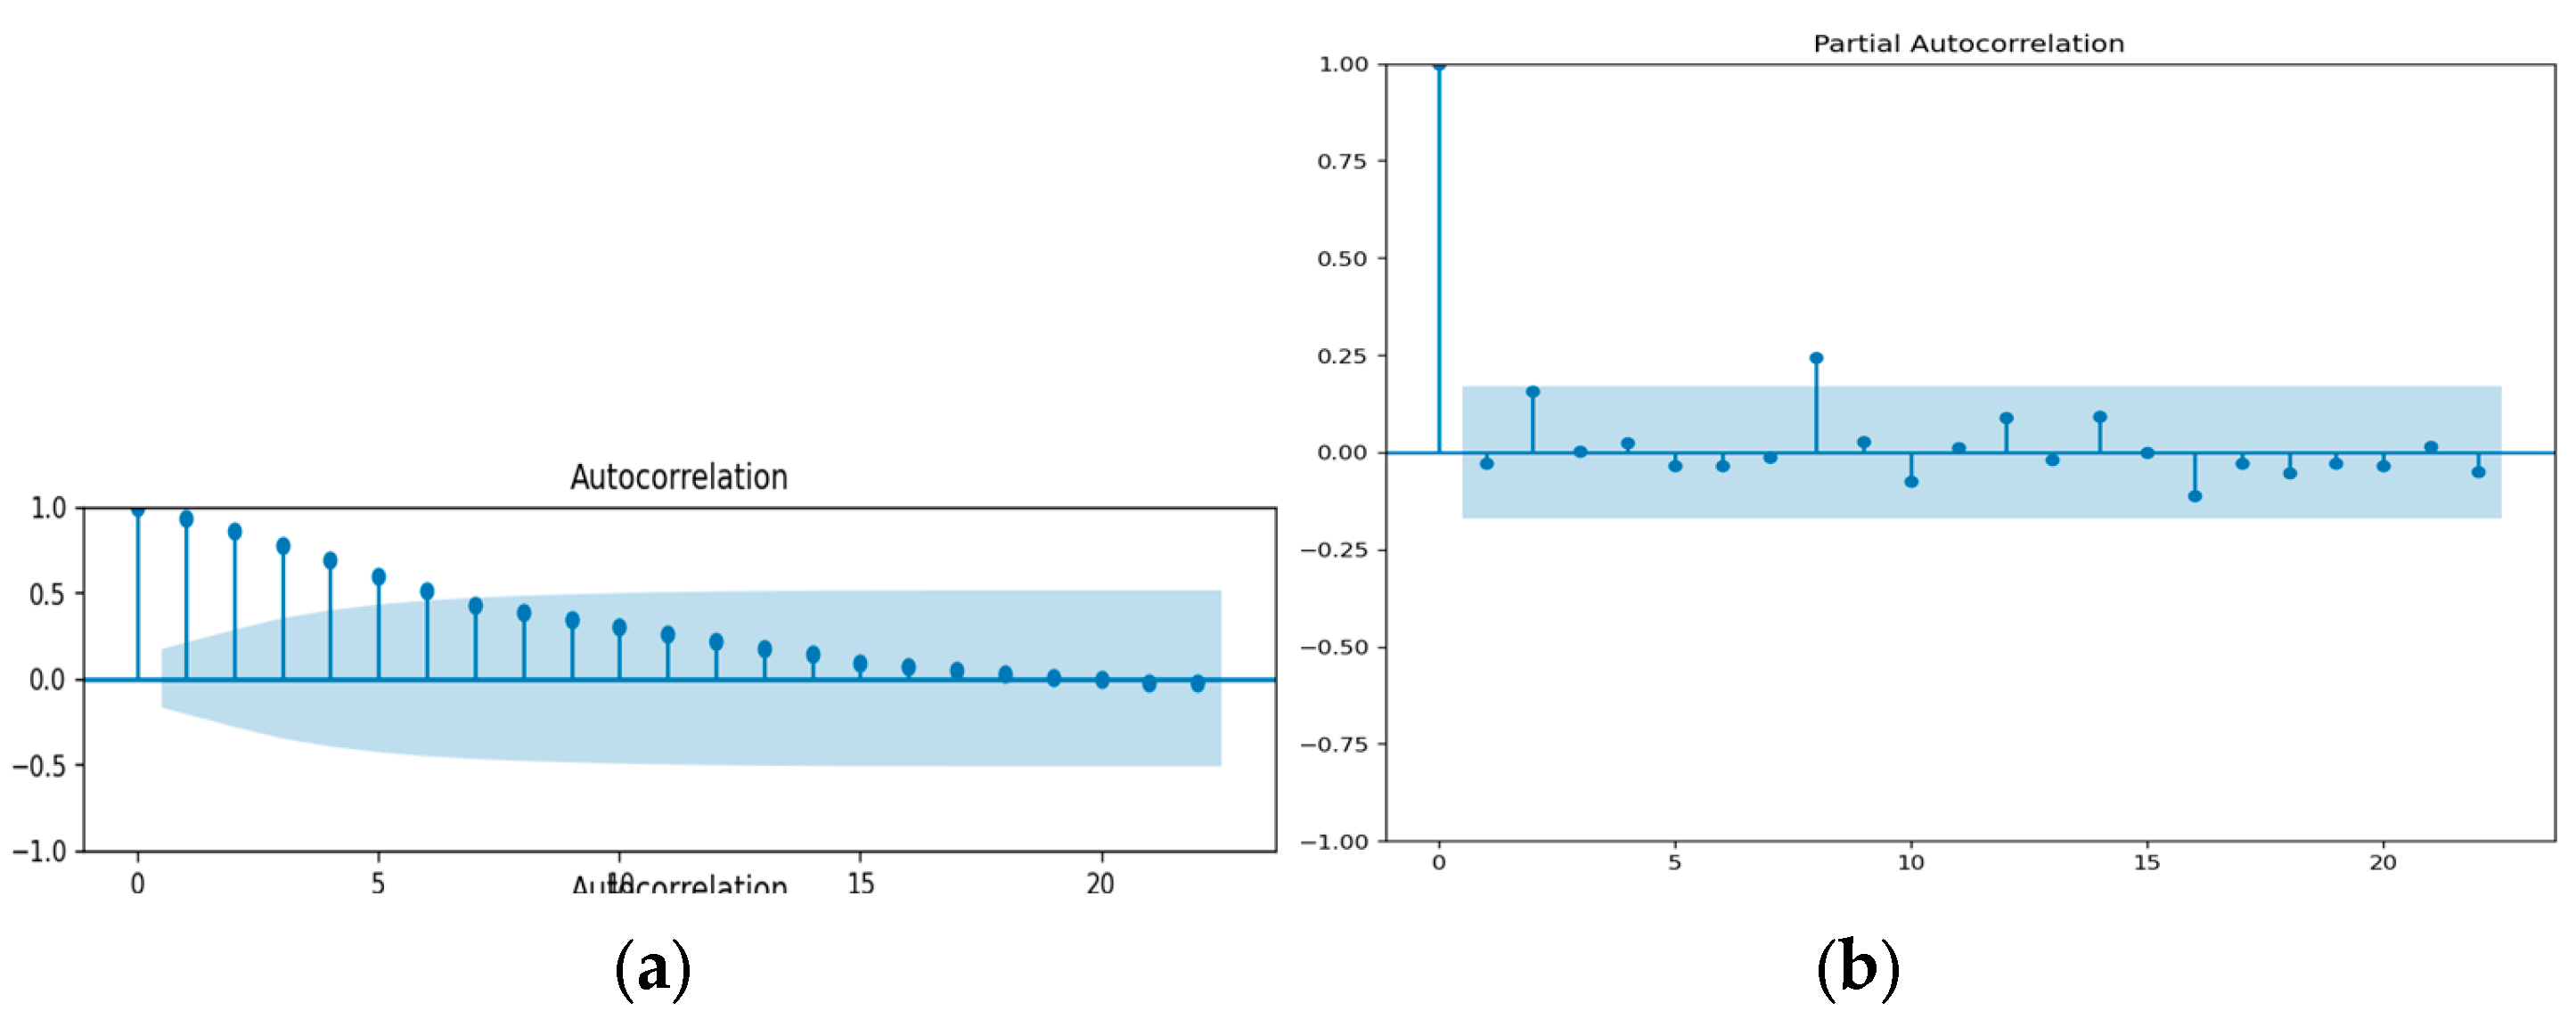
Figure 6.
(a) ACF and (b) PACF of gas.
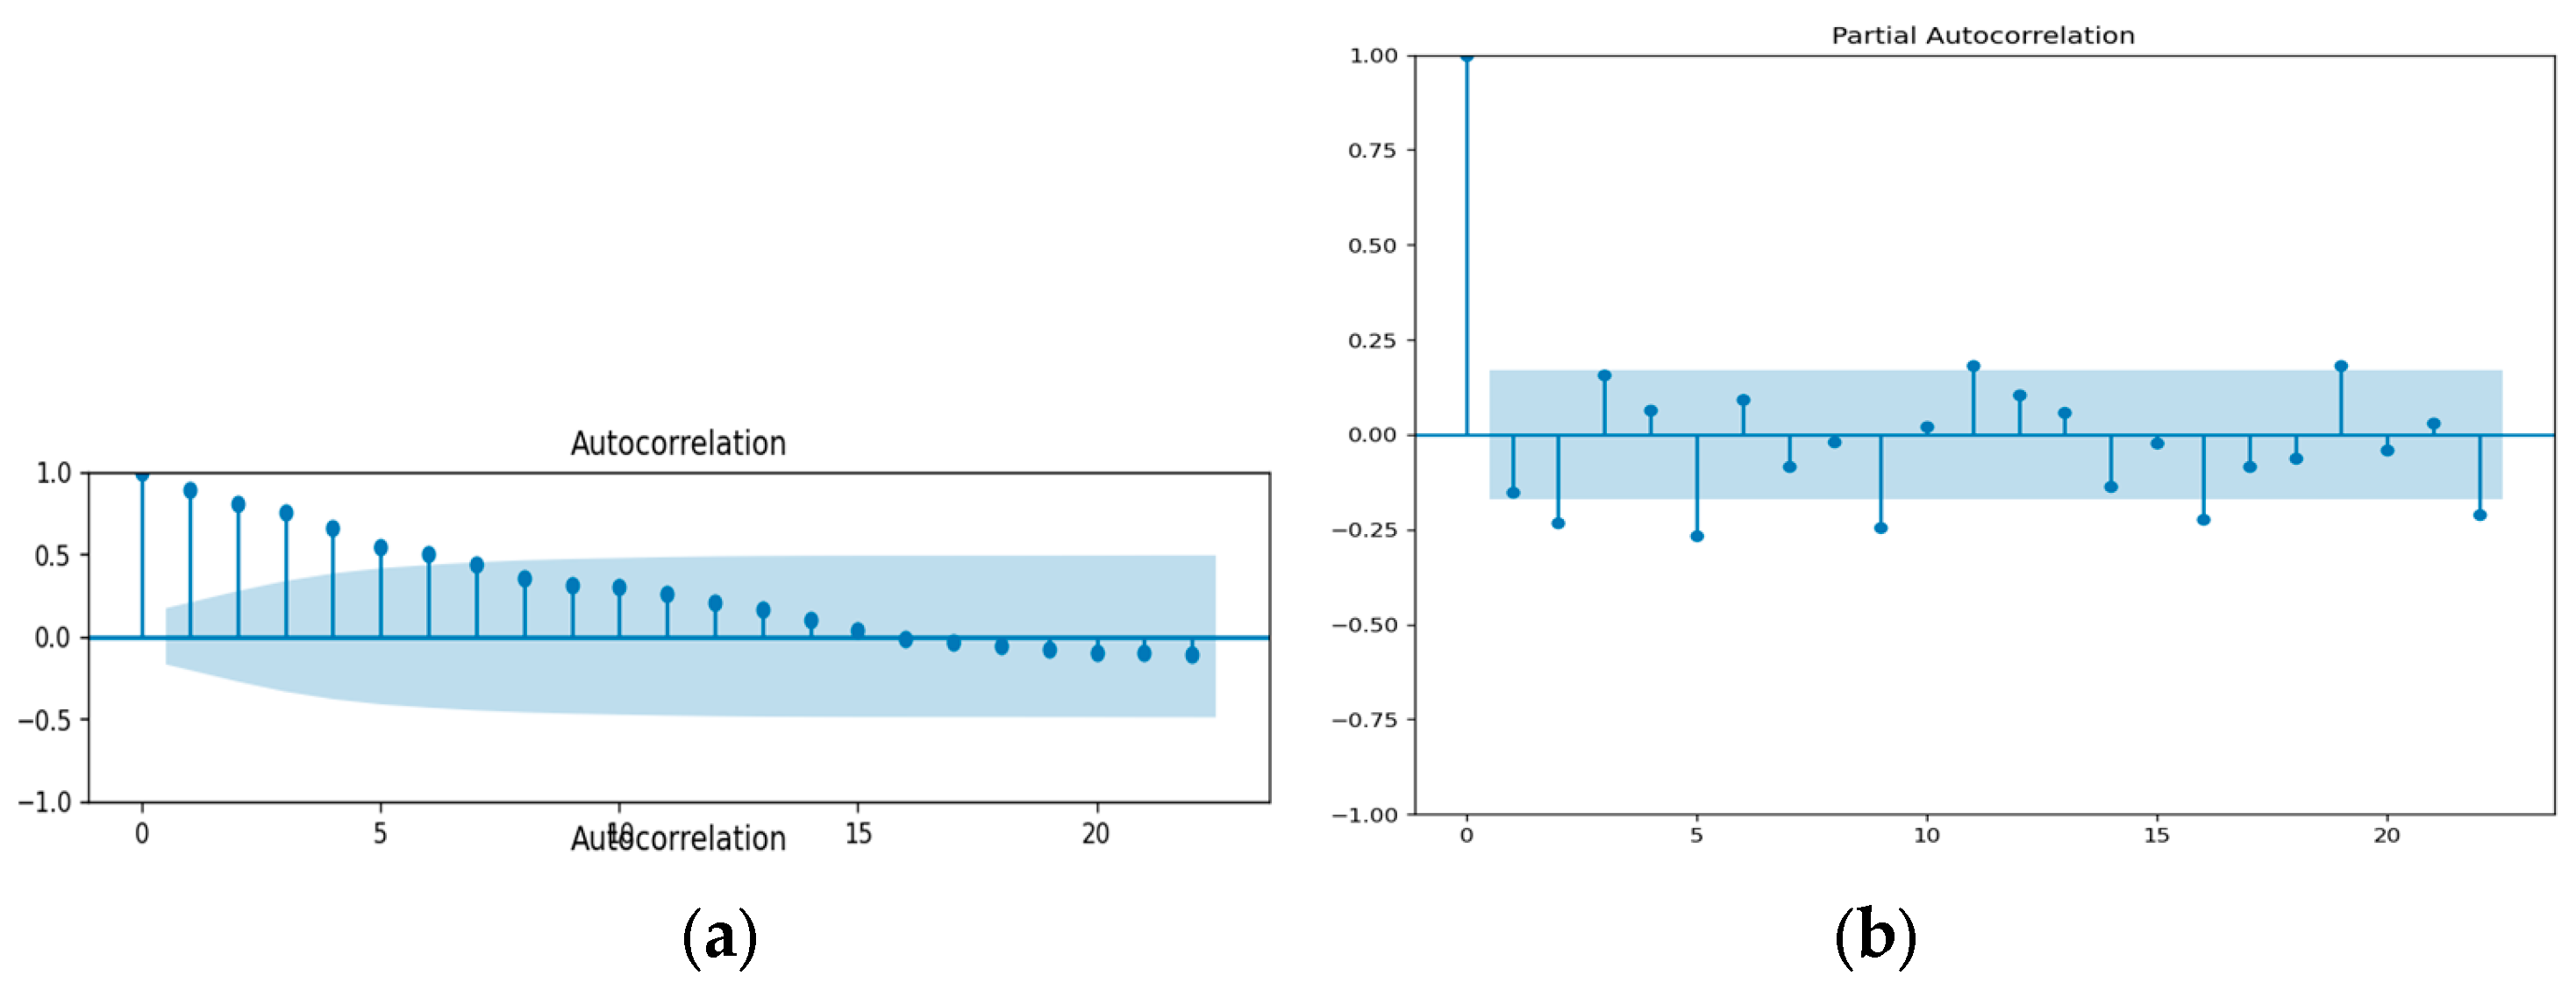
Figure 7.
(a) ACF and (b) PACF of LNG.
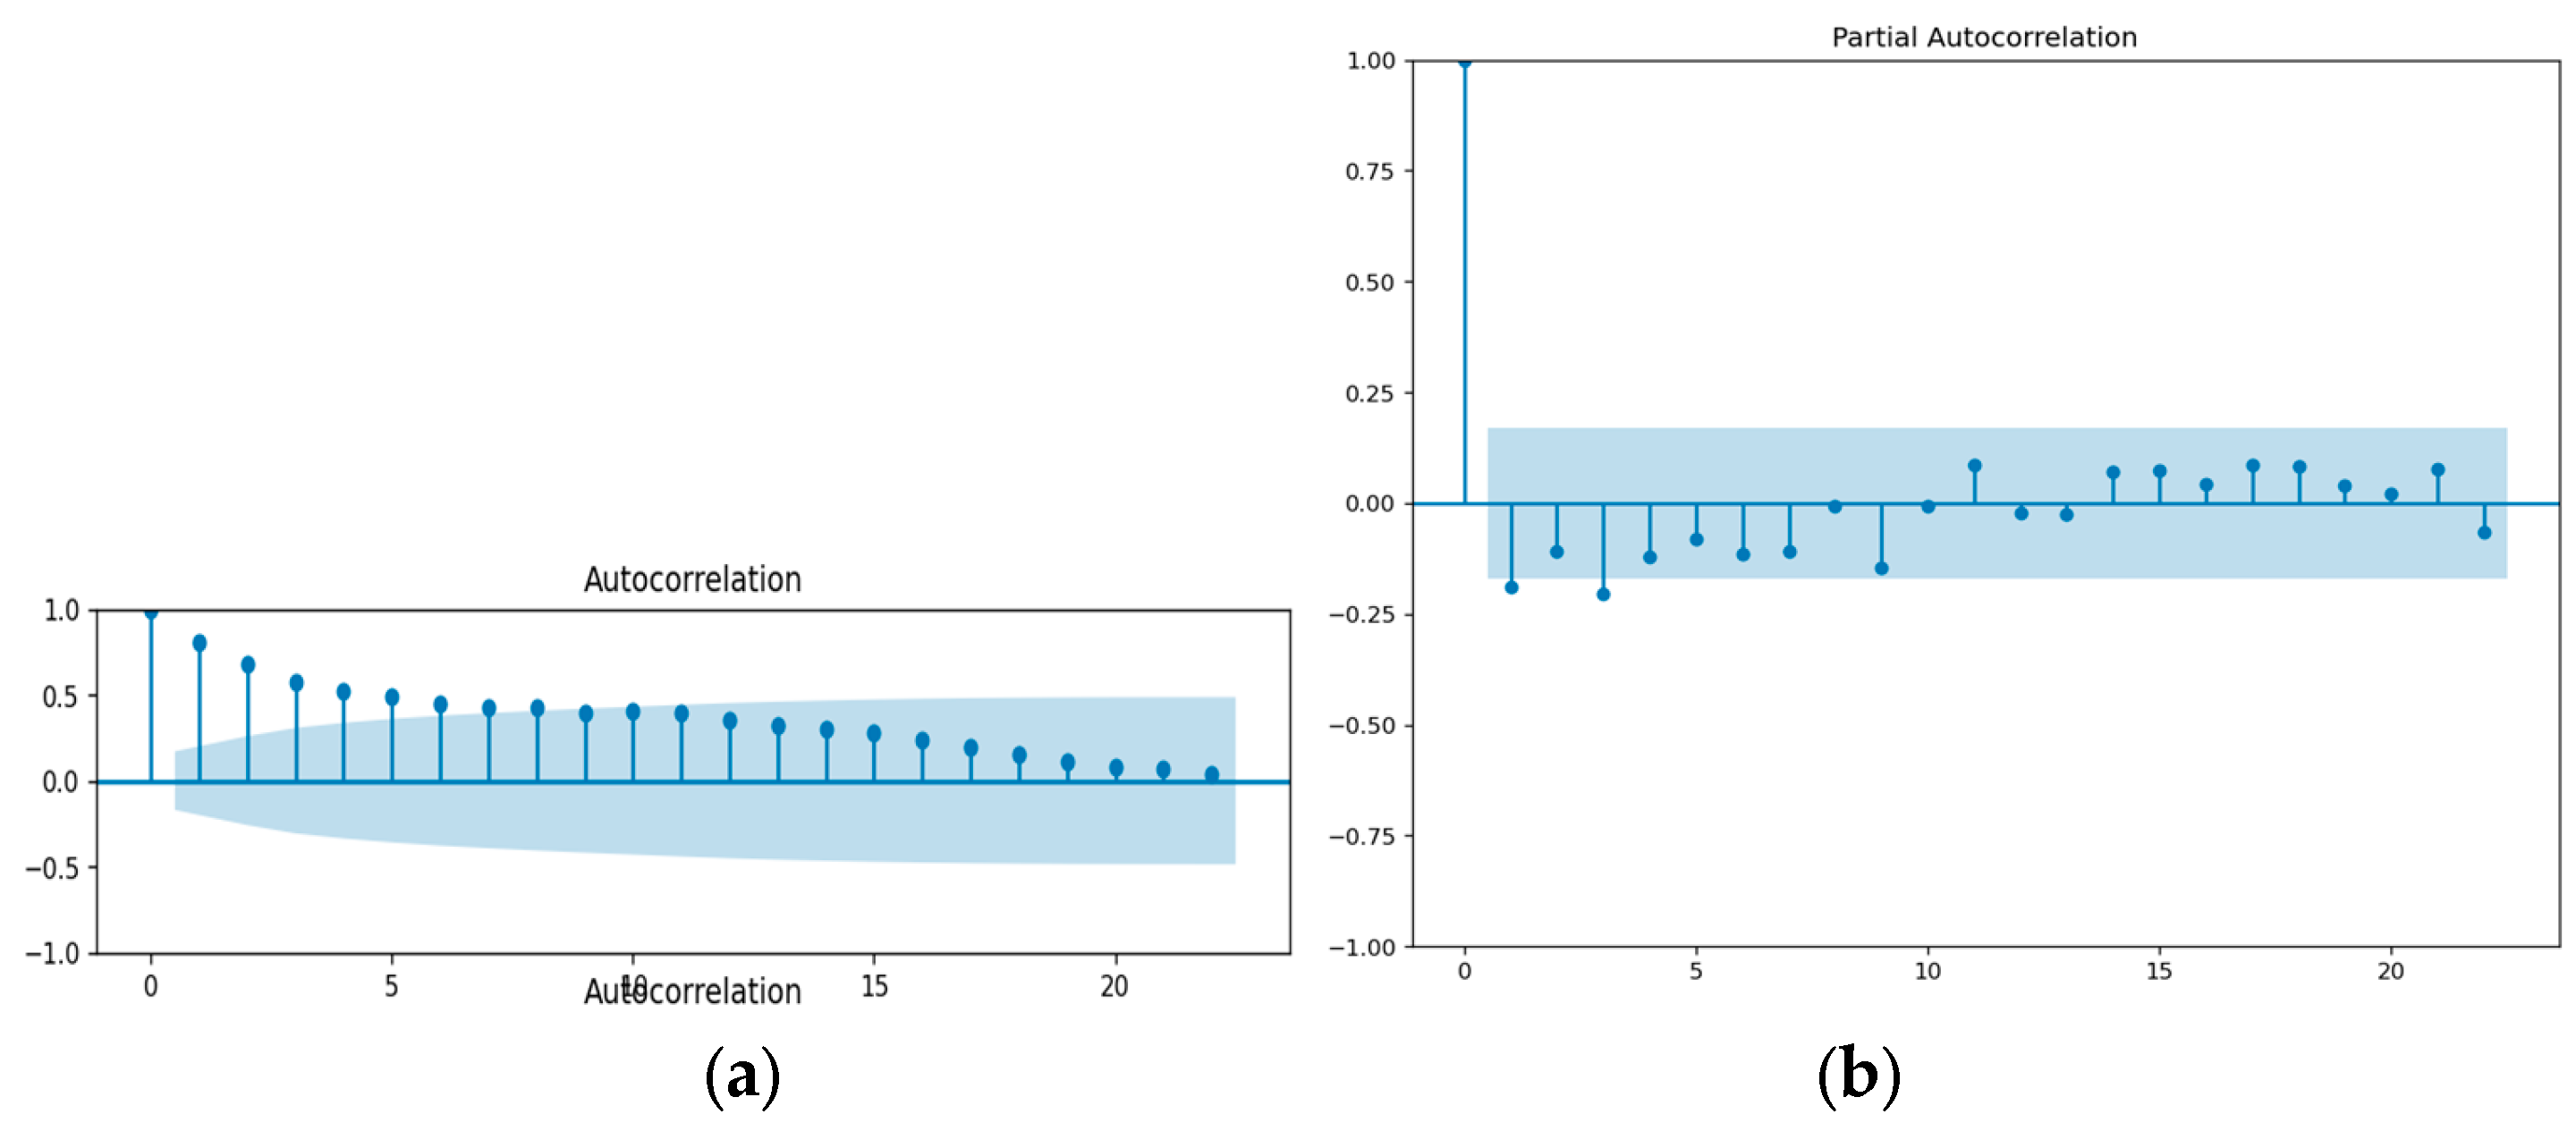
Figure 8.
Summary study flow to get the best value of ICPT forecasting.
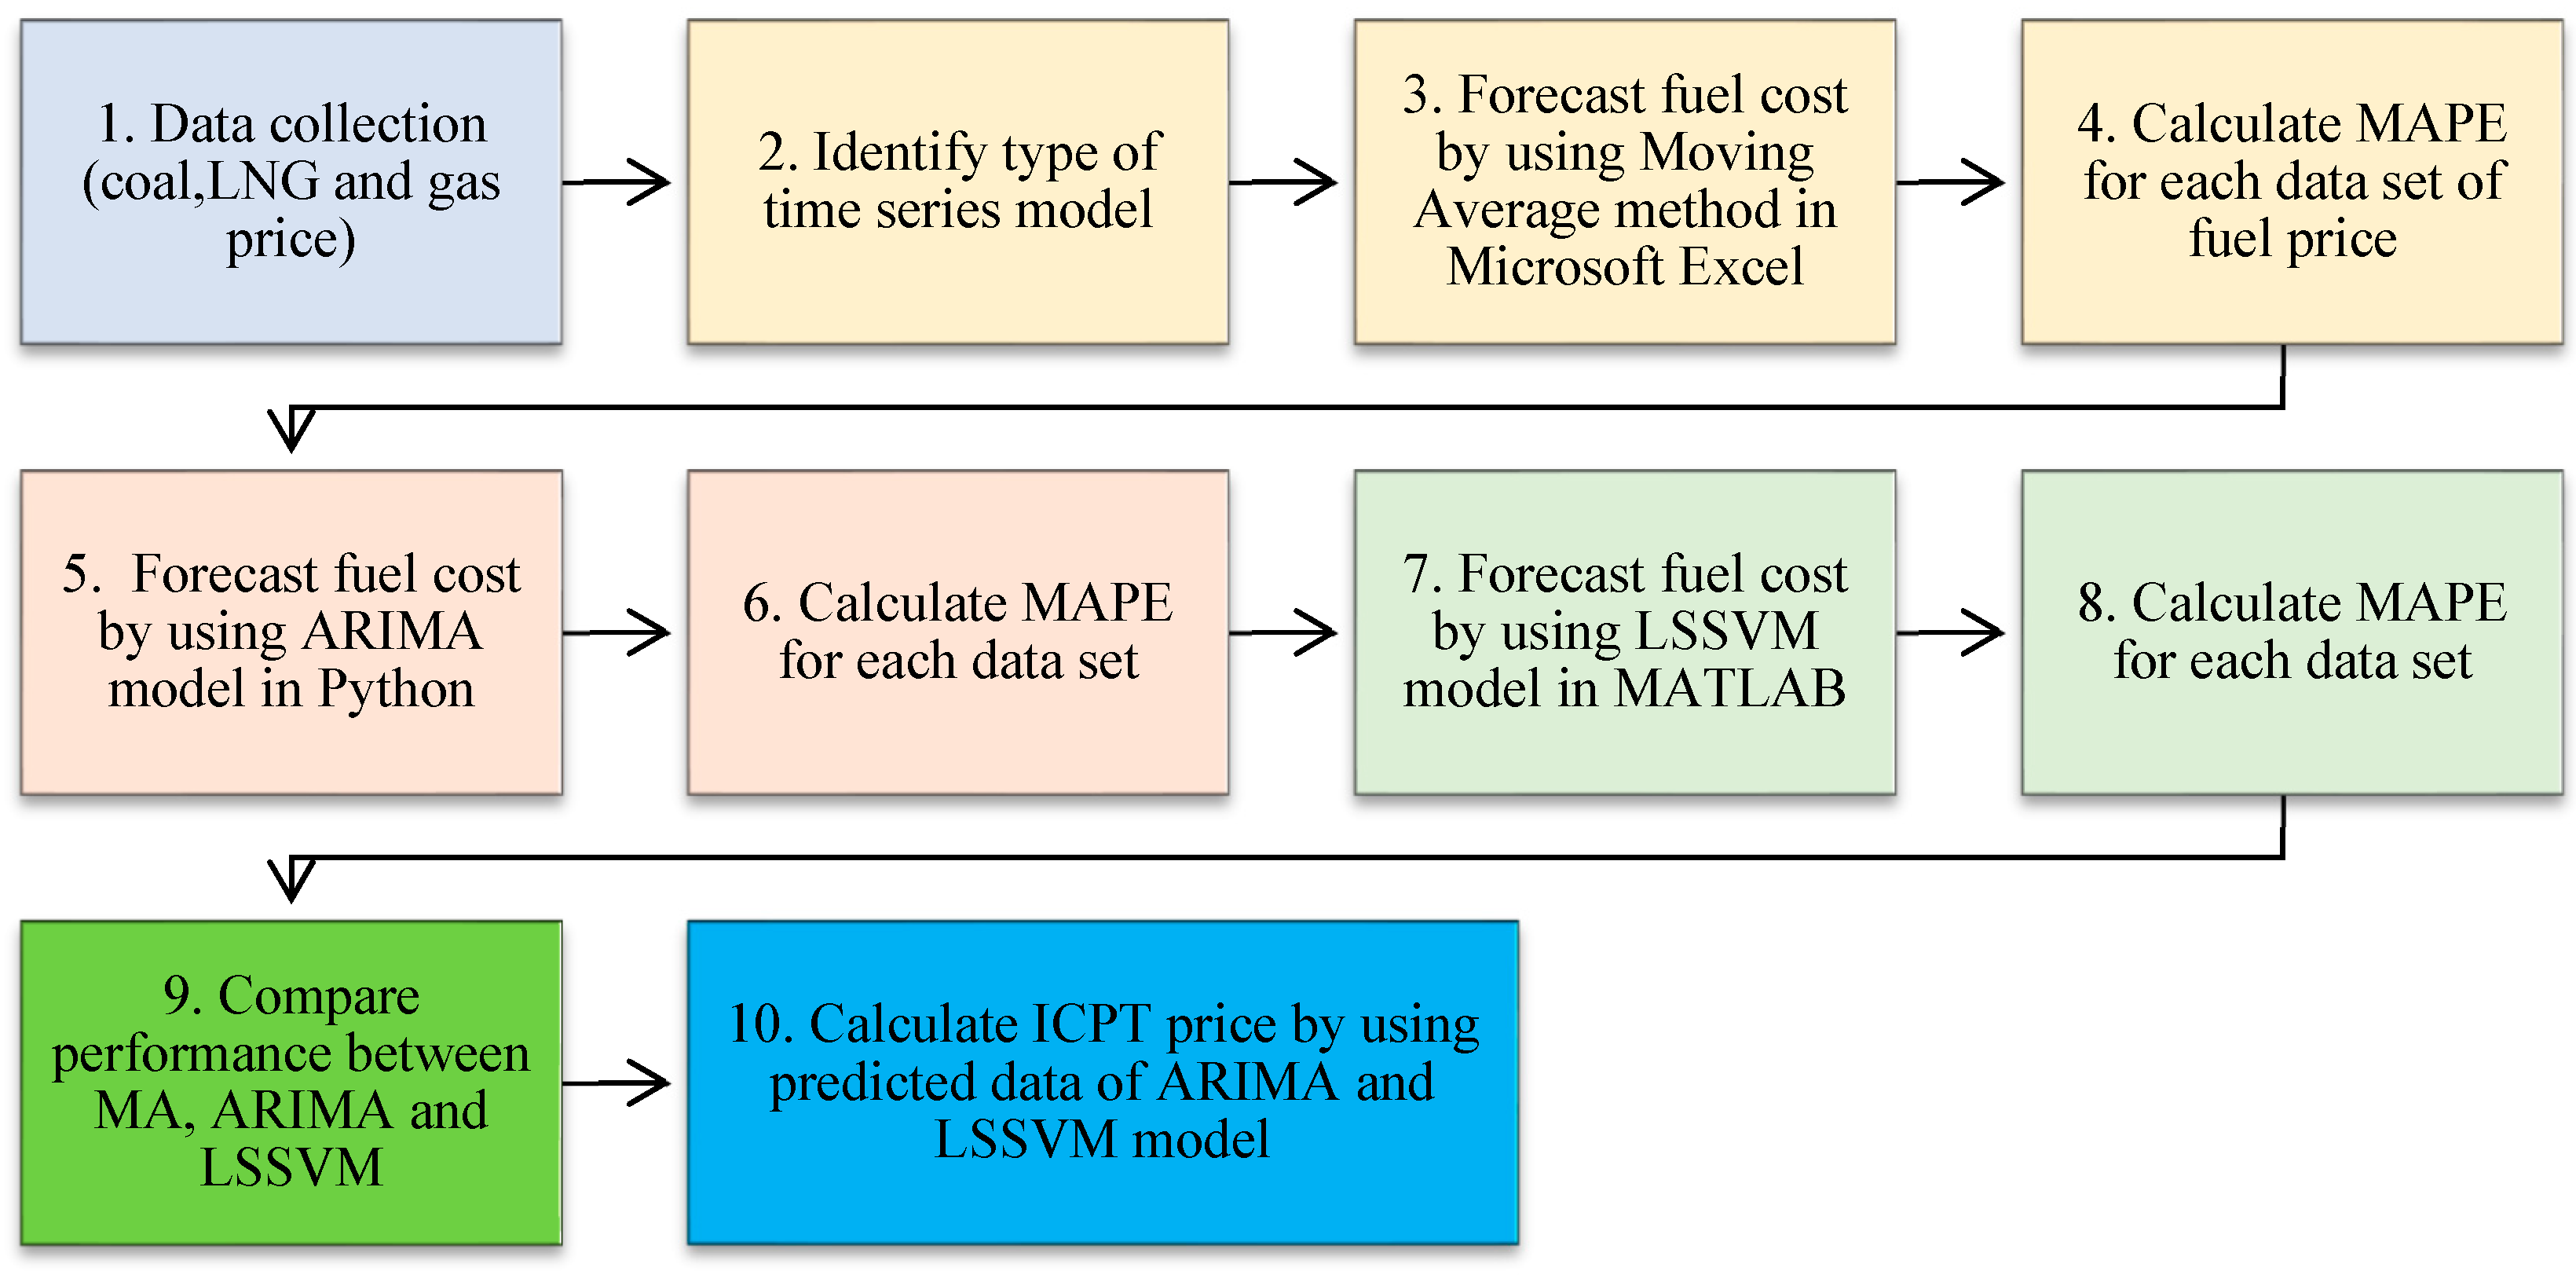
Figure 9.
MA fuel price forecasting (a)-coal price; (b) gas price; (c) LNG price.
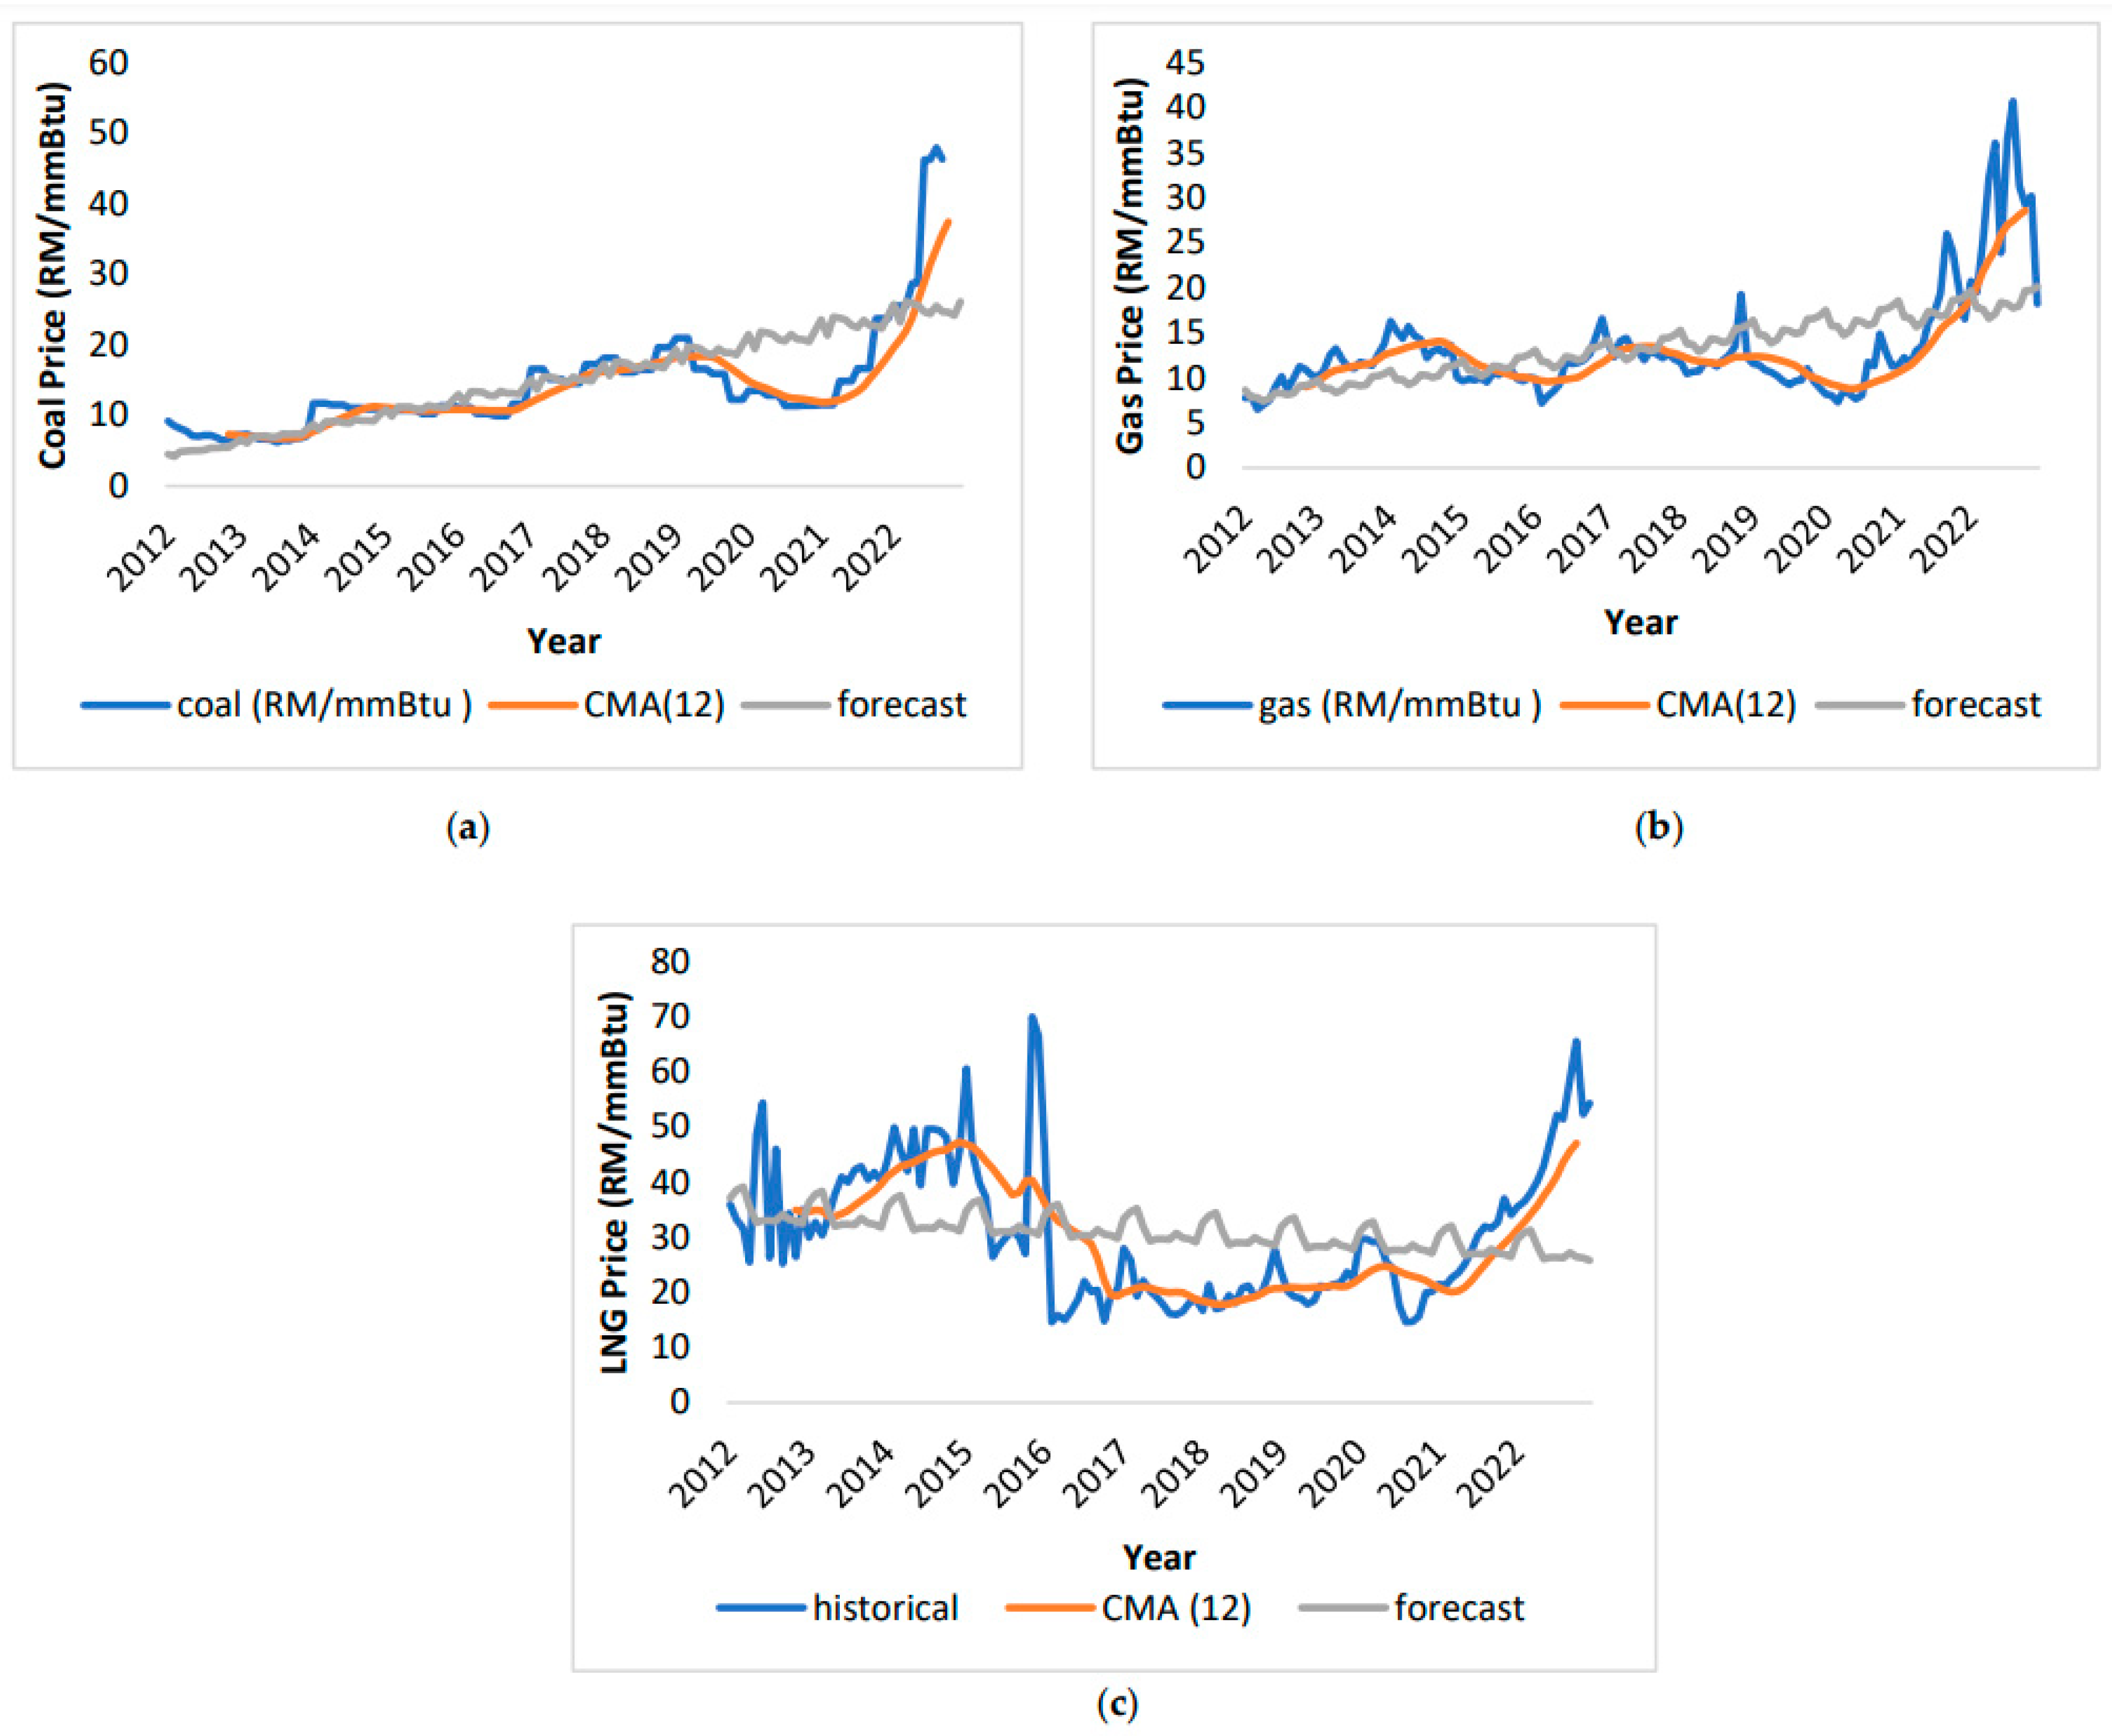
Figure 10.
LSSVM fuel price forecasting (a)-coal price; (b) gas price; (c) LNG price.
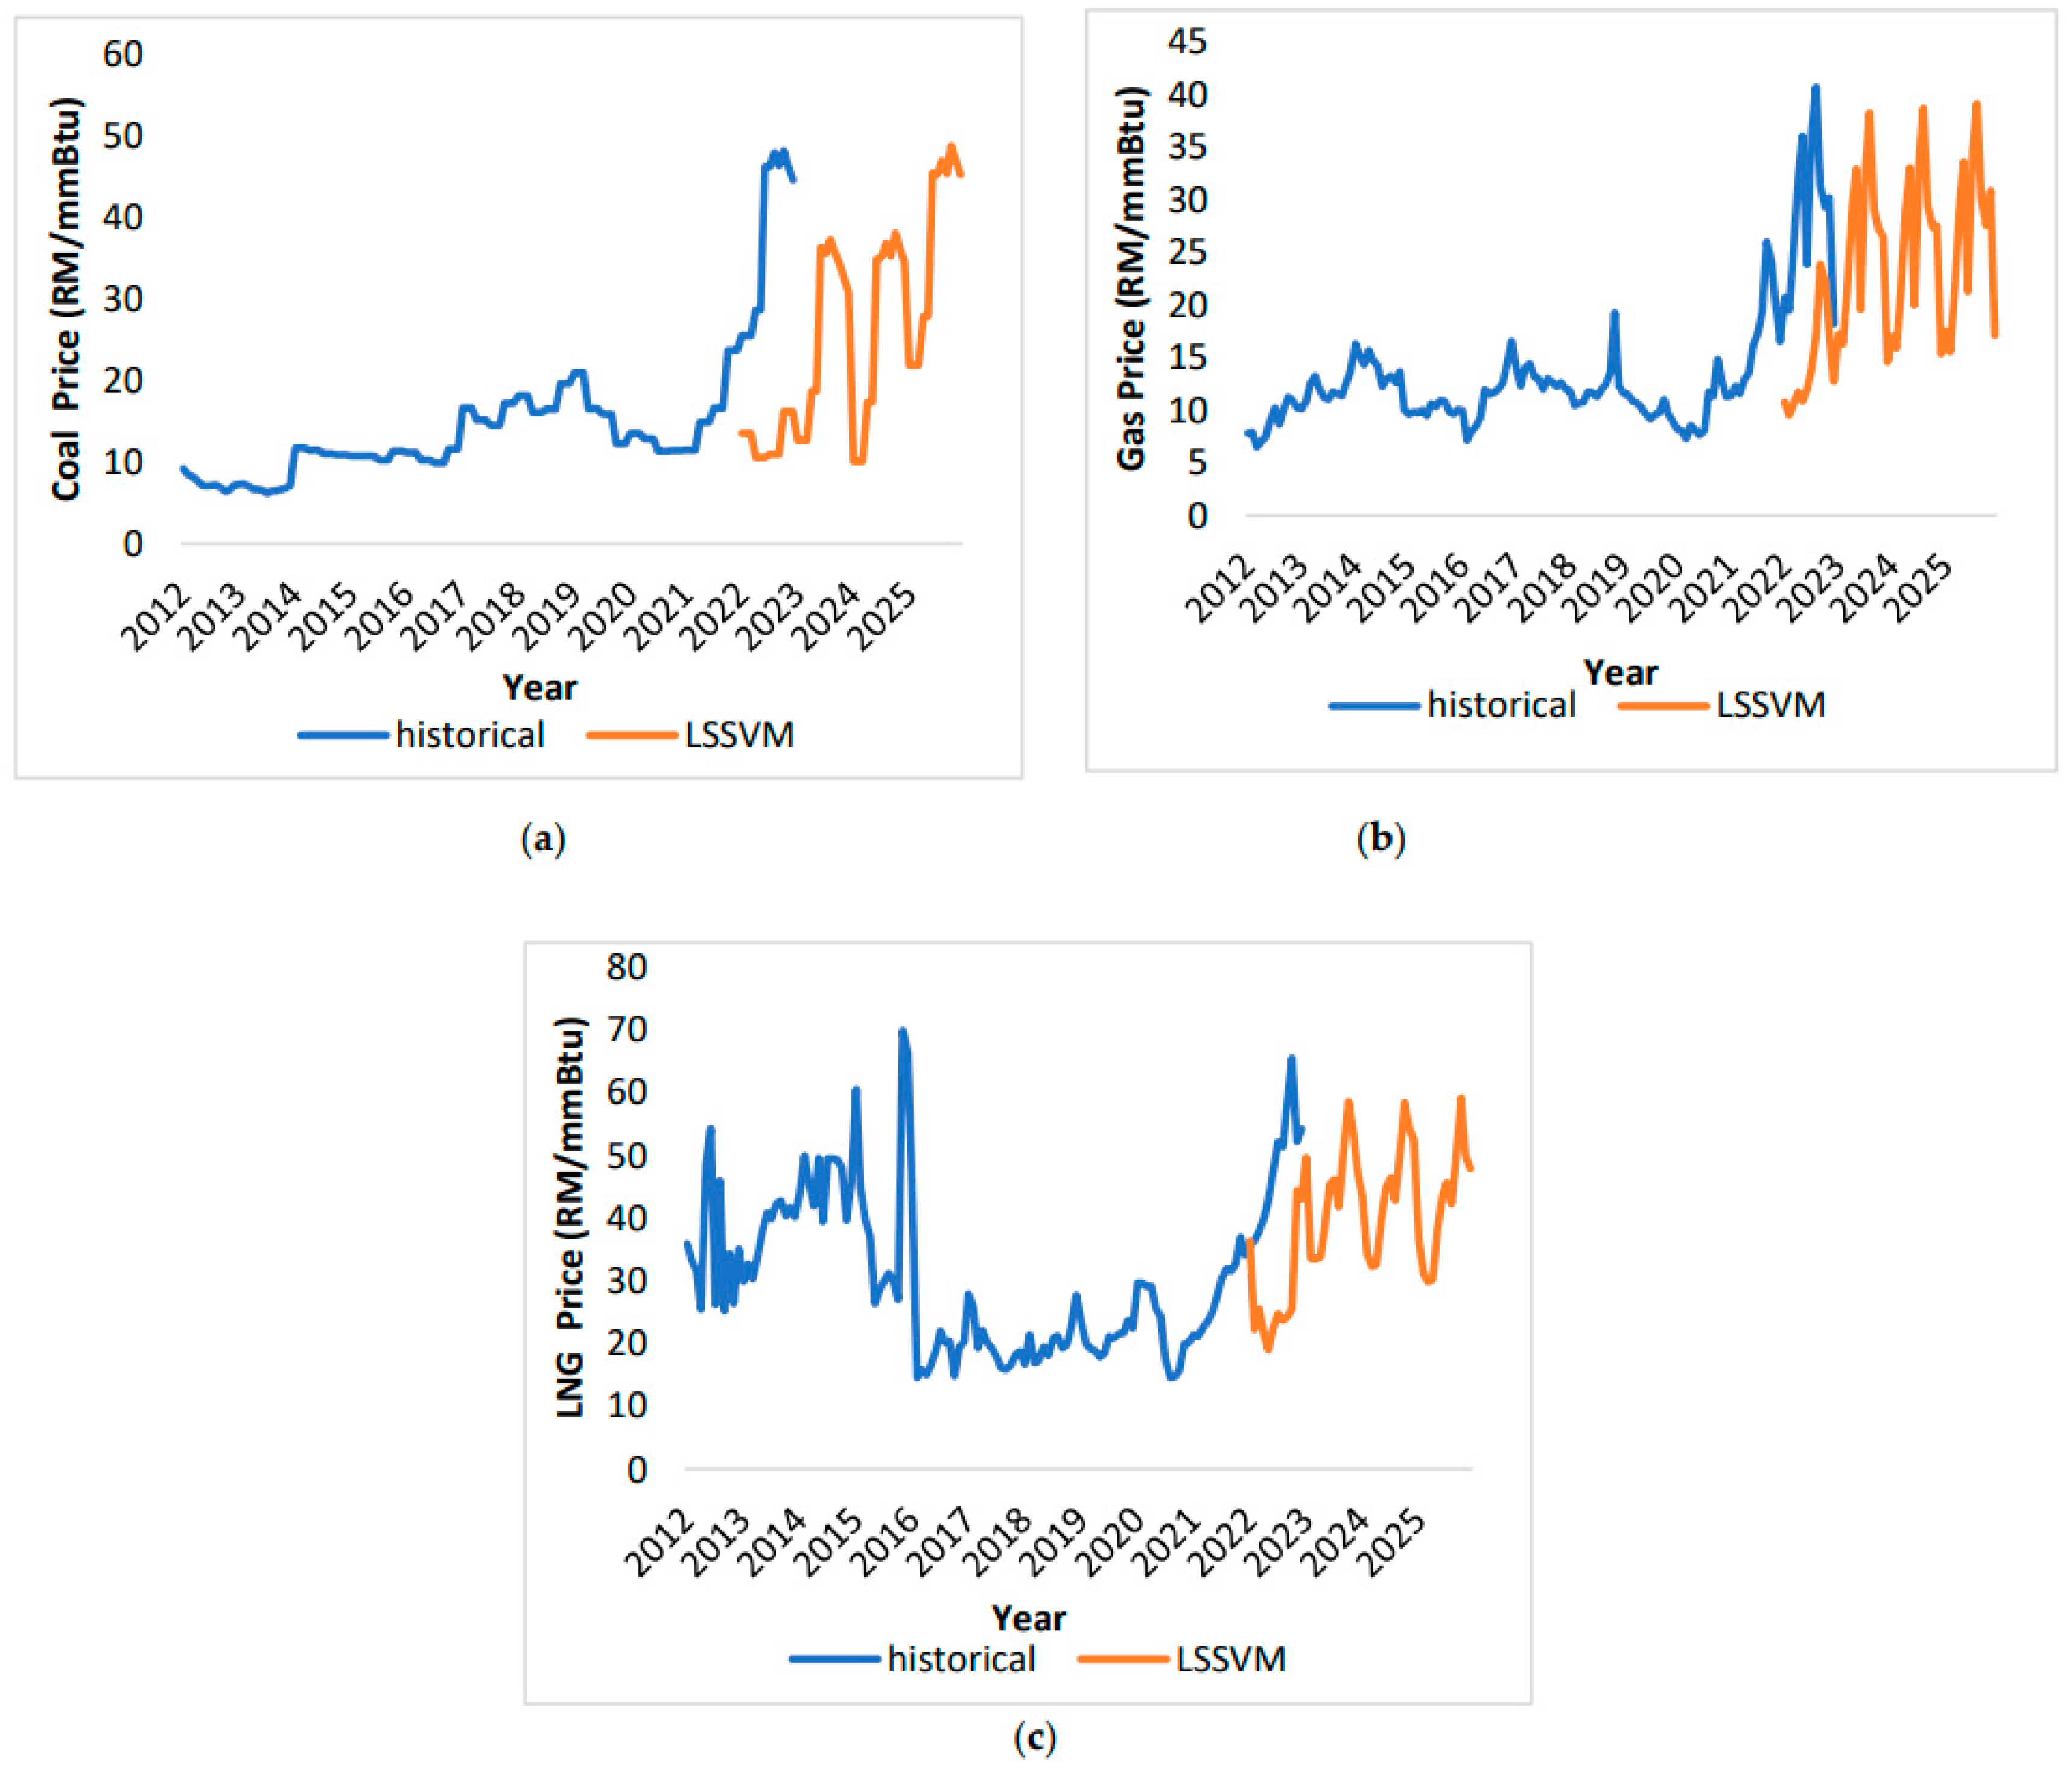
Figure 11.
ARIMA fuel price forecasting (a)-coal price; (b) gas price; (c) LNG price.
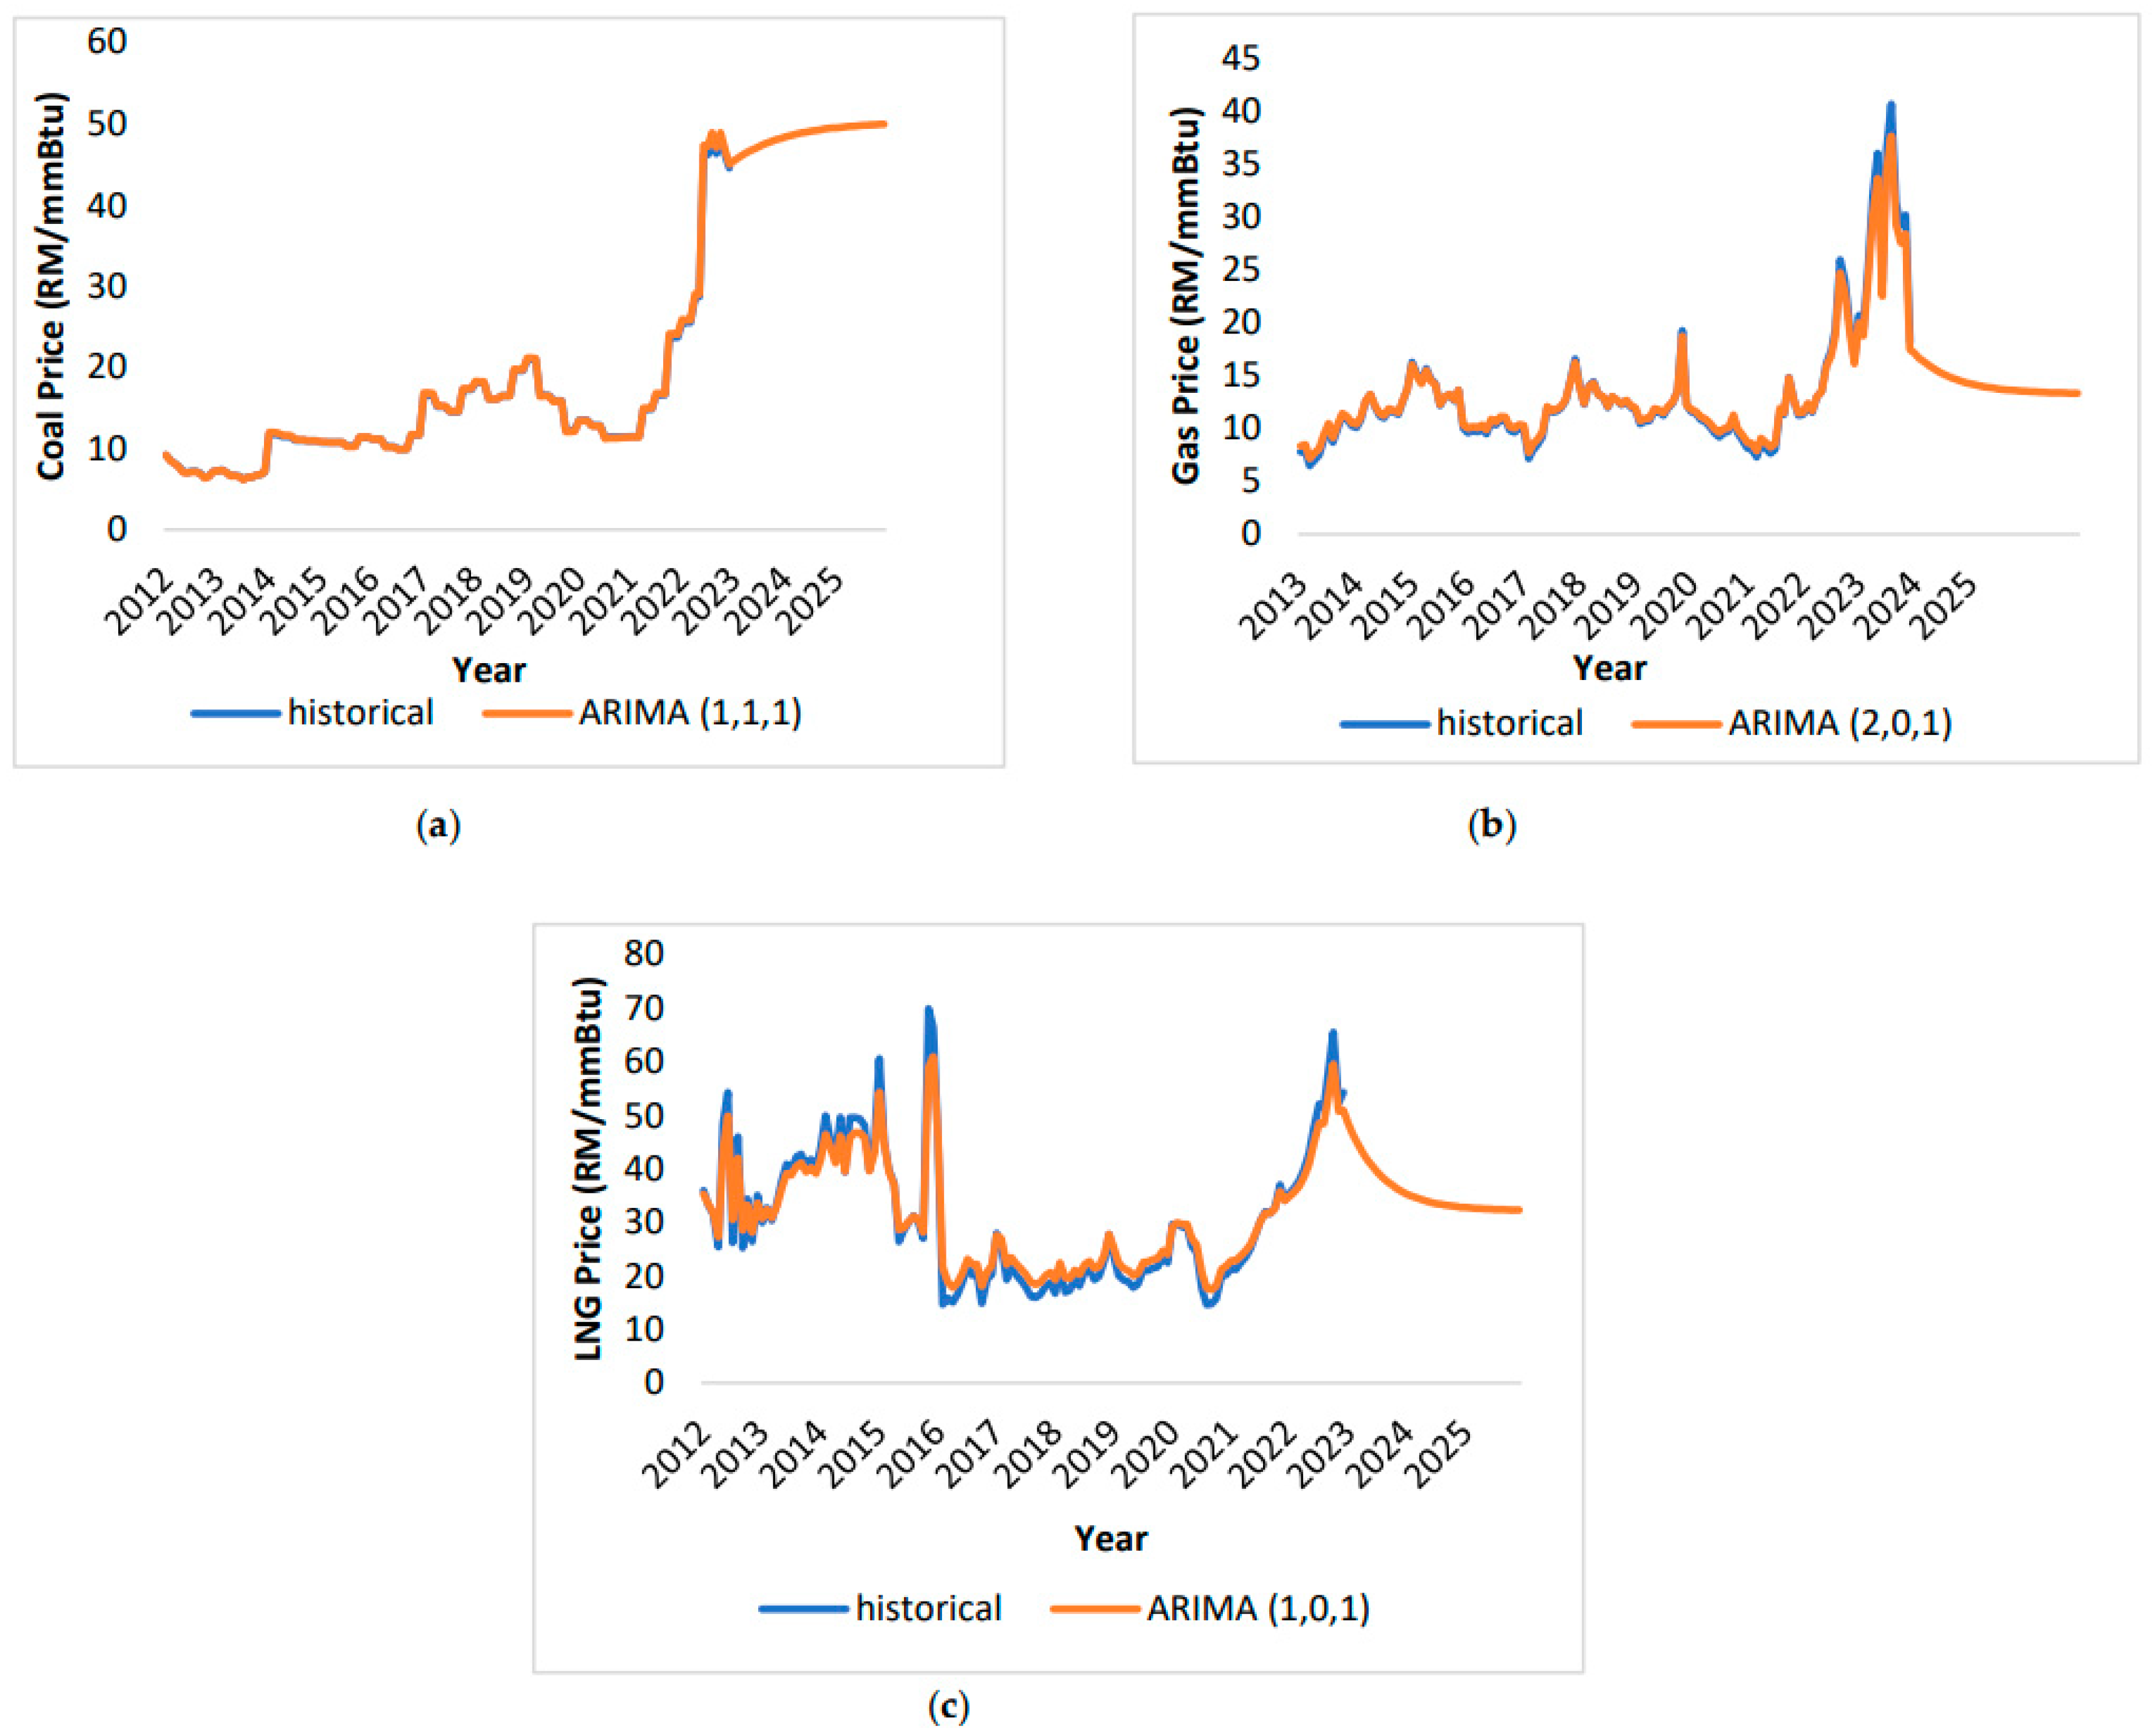
Figure 12.
ICPT price for commercial customer.
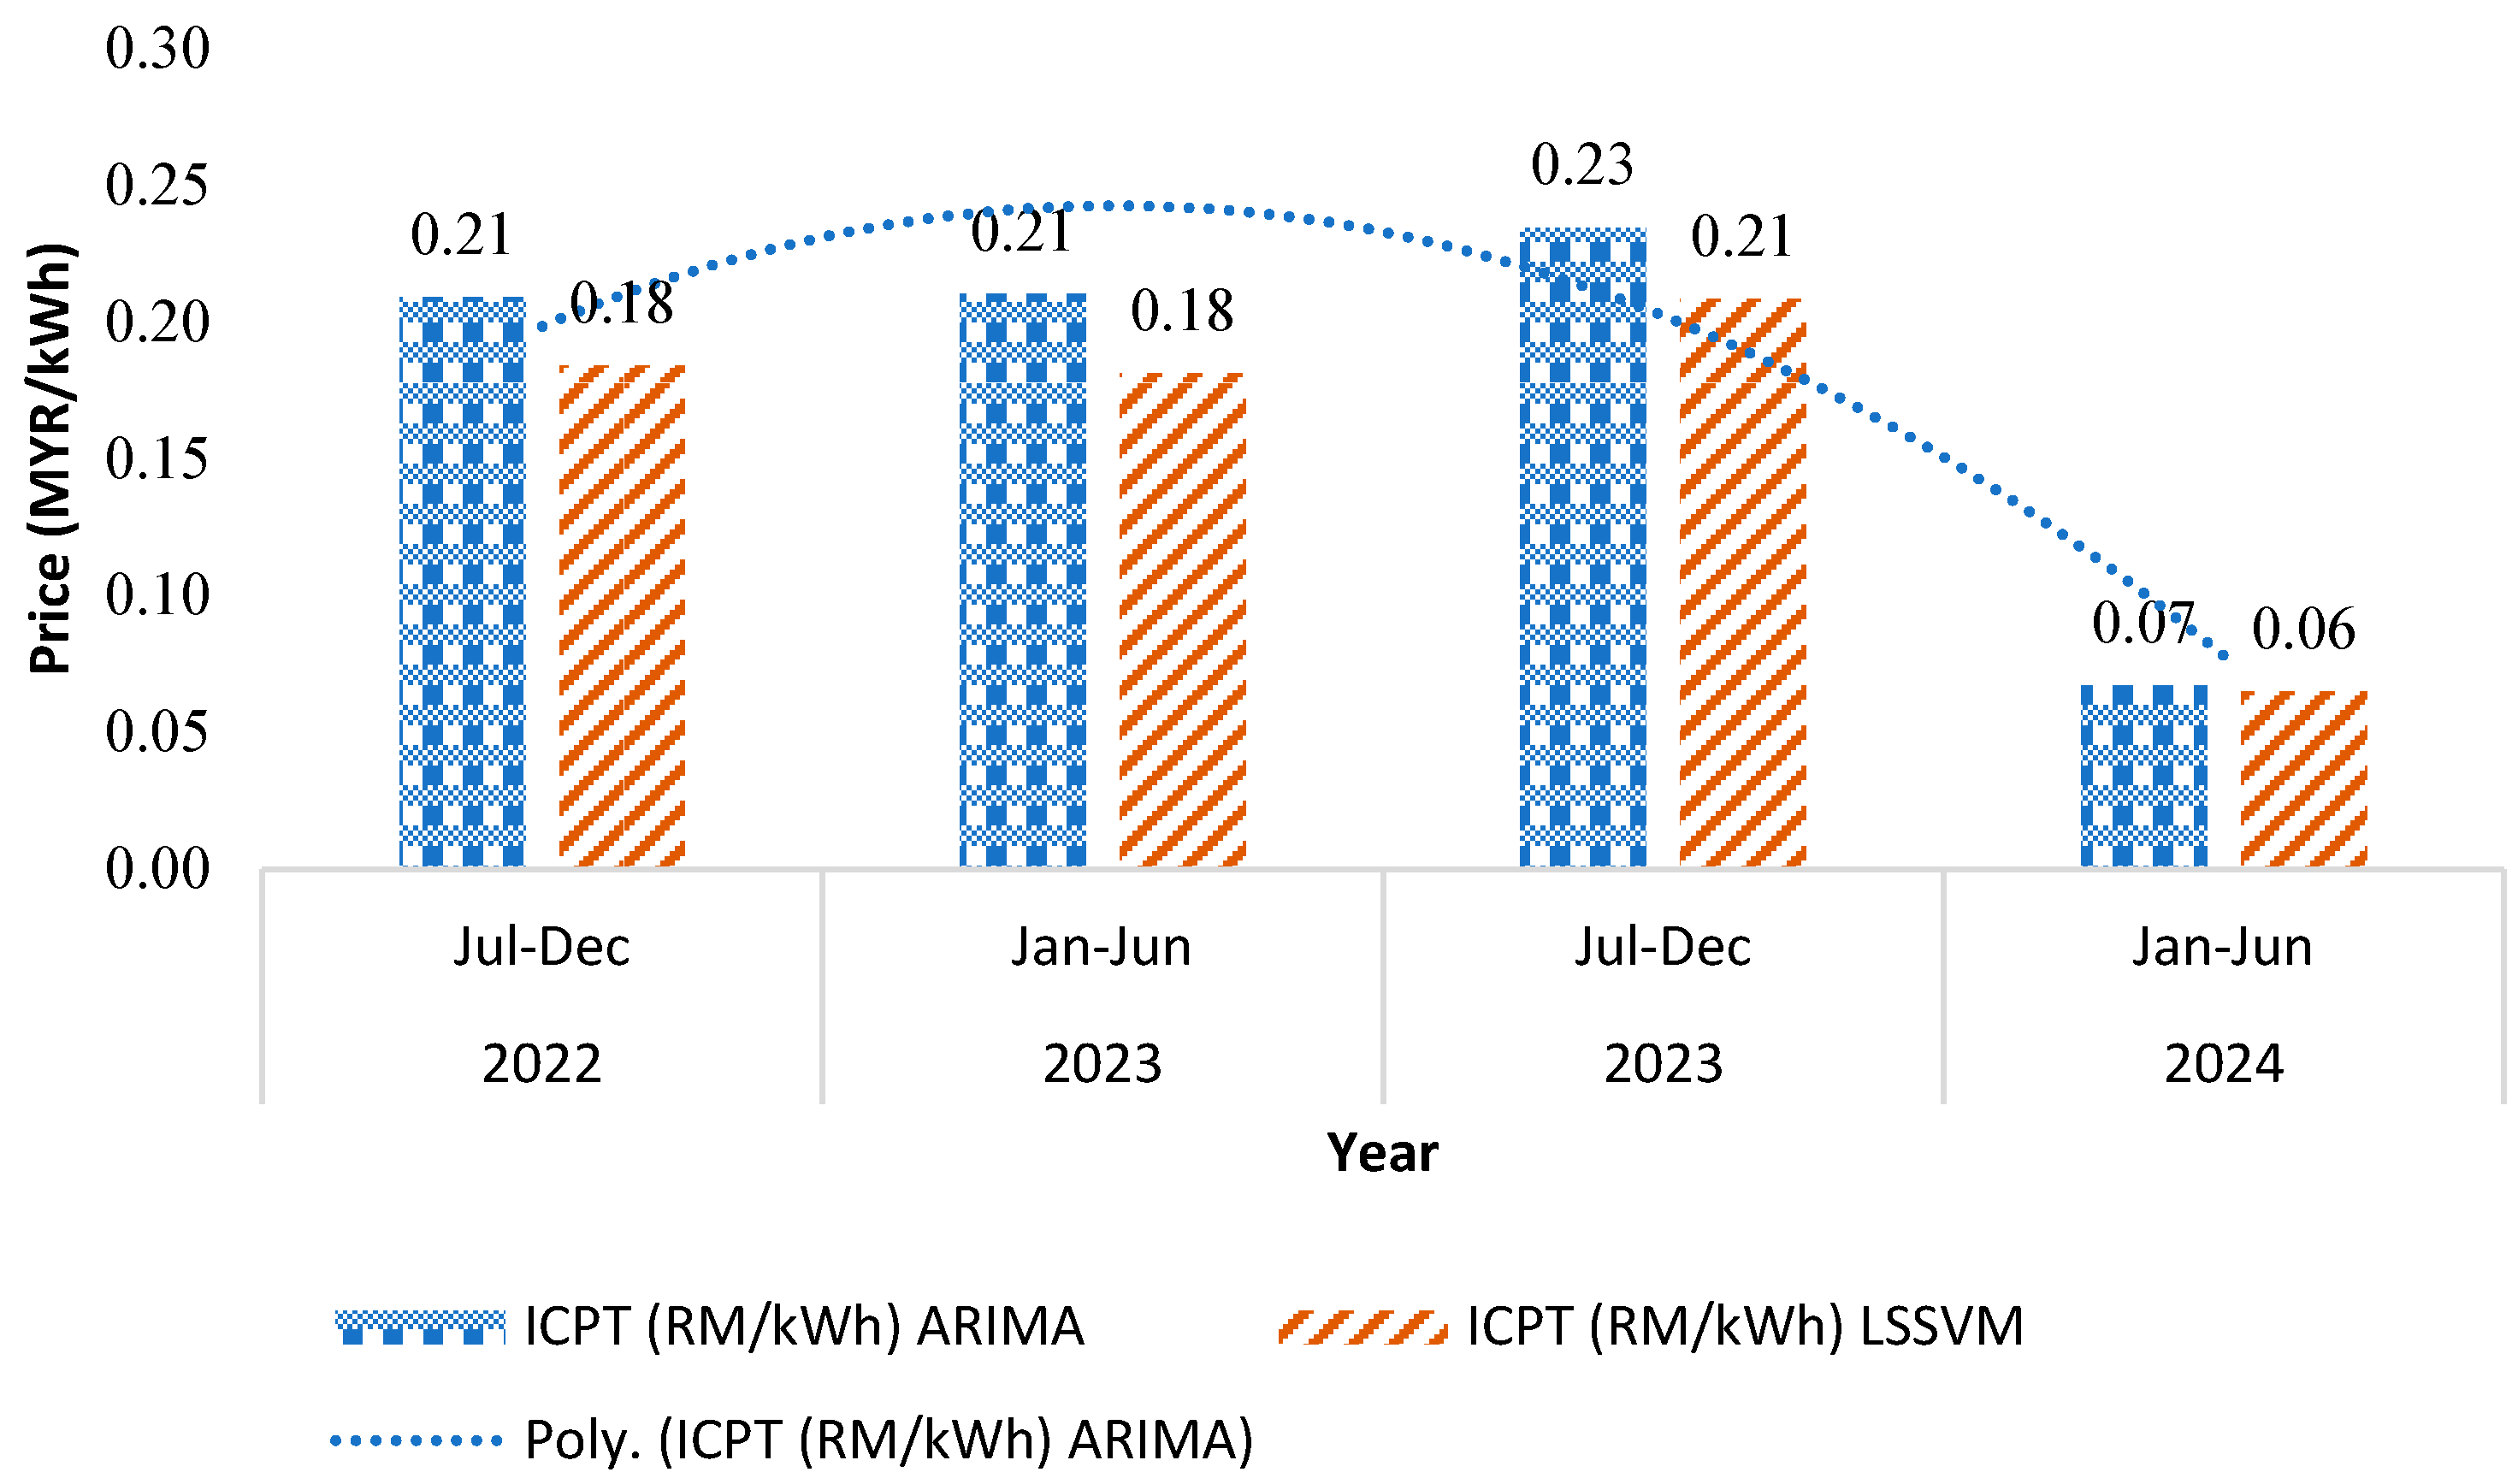

Table 1.
Comparison of MAPE for price forecasting method.
| Year | Fuel Type | MAPE (%) | |||
|---|---|---|---|---|---|
| MA | ARIMA | LSSVM | |||
| 2022 | Coal | 29.79 | 1.63 | 26.28 | |
| 2022 | Gas | 32.94 | 5.47 | 34.46 | |
| 2022 | LNG | 39.78 | 5.09 | 36.90 | |
Disclaimer/Publisher’s Note: The statements, opinions and data contained in all publications are solely those of the individual author(s) and contributor(s) and not of MDPI and/or the editor(s). MDPI and/or the editor(s) disclaim responsibility for any injury to people or property resulting from any ideas, methods, instructions or products referred to in the content. |
© 2024 by the authors. Licensee MDPI, Basel, Switzerland. This article is an open access article distributed under the terms and conditions of the Creative Commons Attribution (CC BY) license (http://creativecommons.org/licenses/by/4.0/).
Copyright: This open access article is published under a Creative Commons CC BY 4.0 license, which permit the free download, distribution, and reuse, provided that the author and preprint are cited in any reuse.


