
Submitted:
29 March 2024
Posted:
02 April 2024
You are already at the latest version
Abstract
Currently, obesity is a critical global public health burden. Numerous studies have demonstrated the regulation of the pathogenesis of obesity and metabolic abnormalities by the gut microbiota and microbial factors; however, their involvement in the various degrees of obesity is not yet understood well. Previously, obesity has been shown to be associated with decreased levels of vitamin B12. Considering exclusive microbial production of vitamin B12, we hypothesised that a decrease in cobalamin levels in obese individuals may be at least partially caused by its depleted production in the intestinal tract by the commensal microbiota. In the present study, our aim was to estimate the abundance of enzymes and metabolic pathways for vitamin B12 synthesis in the gut microbiota of mouse models of alimentary and genetically determined obesity, to evaluate the contribution of the obesogenic microbiome to vitamin B12 synthesis in the gut. We have defined a significantly lower representation of enzymes and metabolic pathways for vitamin B12 biosynthesis in obese mice compared to non-obese mice, wherein enzyme depletion was more pronounced in lepr(-/-) (db/db) mice, which developed severe obesity. The representation of enzymes involved in cobalamin synthesis is strongly correlated with representation of several microbes in high-fat diet fed mice, whereas there were almost no correlations in db/db mice. Therefore, the degree of obesity and the composition of the correspondent microbiota are the main contributors to the representation of genes and pathways for cobalamin biosynthesis in the mouse gut.
Keywords:
gut microbiota
; obesity
; cobalamin
; vitamin b12
; db/db mice
1. Introduction
Recent decades have been marked by extensive research on intestinal microbiota metabolic activity and its impact on host health [1]. The concept of obesogenic microbiome, which is characterised by compositional and metabolic changes in the gut microbiota that are detrimental to the host, has been formed [2]. Although the characteristics of such an obesogenic microbiome may vary significantly, which is confirmed by contradictory results of microbiota analysis in different studies, some common trends have been described. Enrichment by enzymes for improved energy extraction from nutrients, decreased production of short chain fatty acids, increased production of lipopolysaccharides stimulating proinflammatory response by the host immune system are some common signs of obesogenic microbiota [3]. Furthermore, it has been observed that the obese state of the host is associated with a decrease in the level of vitamin B12 in the blood, although the underlying mechanisms are unclear [4,5,6]. Furthermore, it has been suggested that the primary cause of B12 malabsorption in certain human diseases, including blind loop syndrome, is the gut microbiota's depletion of B12 [7].
Cobalamin (vitamin B12) production is restricted to microorganisms, specifically anaerobes, and cannot be achieved by plants, animals, or fungi [8]. Although it is still not known whether the host uses microbially produced B12 in the gut [9], it was shown that human commensal gut microbes can produce extracellular vesicles containing multiple high-affinity vitamin B12 binding proteins, suggesting that the vesicles play a role in the elimination of micronutrients and their transfer to bacterial and host cells [10]. Many commensal gut bacteria have been indicated as vitamin B12 producers [11]. Vitamin B12 synthesis is a complex multistep process and requires a lot of enzymes (Figure 1)
We hypothesised that the decrease in the level of cobalamin in obese individuals may be at least partly caused by its depleted production in the intestine by the commensal microbiota. In our study, our aim was to estimate the abundance of enzymes and metabolic pathways for vitamin B12 synthesis in the gut microbiota of mouse models of alimentary and genetically determined obesity, to evaluate the contribution of the obesogenic microbiome to vitamin B12 synthesis in the gut. To this end, we performed high-throughput metagenome sequencing analysis followed by reconstruction of gut microbiota metabolic activity for a high-fat diet fed C57BL/6SPF mice (which are used as a model of alimentary obesity), a regular diet fed db/db mice (leptin receptor deficient mice) (are used as a model of genetically determined obesity), and a regular diet fed C57BL/6SPF mice (are used as a control group).
2. Materials and Methods
2.1. Experimental Animals
C57BL/6SPF mice (n = 40, males) (were bred at the Nursery of Laboratory Animals in Puschino, Puschino, Russia) and db/db (n = 20, males) mice (were bred at JAX-East and JAX-West Nurseries of Laboratory Animals, Sacramento, CA, USA) were acclimated to housing conditions (22 °C, 55% humidity, 12 h:12 h light: dark cycle) in SPF level animal centre of I.M. Sechenov First Moscow State Medical University (Moscow, Russia) with ad libitum access to sterile food (Altromin 1324 FORTI, Lage, Germany) and water for 1 week prior to formal study. Following the adaption phase, the mice were split into groups based on genotype, with each group consisting of ten individual animals. The mice were 8 weeks old and weighed 19 ± 2 g on average at the start of the experiment. Laboratory animals were fed a high-fat diet enriched with triglycerides derived from animals, up to 30% of total calories (Altromin C 1090-30, Lage, Germany; the food includes: 13.3% crude fat, 21.1% crude protein, 5.1% crude fiber, 3.9% crude ash, 50.8% nitrogen-free extractives, and 5.8% moisture), beginning at 8 weeks of age and continuing for 14 or 90 days until the end of the experiment. This allowed for the replication of the alimentary obesity model.
For the duration of the experiment, the mice in the db/db group and the animals in the control group (C57BL/6SPF) were fed a standard chow diet (Altromin 1324 FORTI, Lage, Germany). The mice were anesthetized with isofurane and euthanised after 14 or 90 days of feeding (RWD Life Science, Chenzhen, Guangdong, China). Sterile colon tissues were obtained. Tissue samples were immediately frozen in liquid nitrogen and stored at -80 °C until analysis. The colon samples were sent for high-throughput sequencing analysis after being divided into 1-cm sections under sterile conditions, deposited into different sterile Eppendorf tubes, and maintained on dry ice (10 samples for each group).
All animal experiments were approved by the Ethics Committee for Animal Research, I.M. Sechenov First Moscow State Medical University, Russia (protocol number 96 from 2 September 2021).
2.2. Measurement of Serum Insulin, Leptin, and Adiponectin Levels
Mice were fasted for 8 hours. Blood samples were collected after fasting from anaesthetised mice using the eyeball enucleation method. Blood was collected in sterile collection tubes immediately. Serum was spun down at 8,000 g. for 8 minutes at 4°C to remove remaining cellular debris. Insulin concentration was measured using the Mouse Insulin ELISA Kit (Abcam, ab277390), leptin concentration was measured using Duo Set ELISA Development system Mouse Leptin (R&DSystem, DY495-05), adiponectin concentration was measured using Adiponectin/Acrp30 DuoSet ELISA (R&DSystem, DY1119) according to the manufacturer’s instructions.
2.3. High-throughput Sequencing Analysis and Reconstruction of Intestinal Microbiota Metabolic Activity
The scientific research laboratory «Mul-tiomics technologies of living systems» (Kazan, Russia) performed the microbiota analysis. Mouse stool samples were treated with the FastDNATM Spin Kit for Faeces (MP Biomedicals, Santa Ana, CA, USA) to extract genomic DNA. The bacterial 16S rRNA gene's V3–V4 region was amplified using specific primers (see Supplementary Table S1). The PCR product purification process using AMPure XP Beads (Beckman Coulter, Brea, CA, USA, CB55766755) to barcode each sample was followed by secondary round PCR amplification utilizing index primers. Using a Qubit 2.0 Fluorometer and the Qubit dsDNA High Sensitivity Assay Kit (Invitrogen, Carlsbad, CA, USA), the concentration of amplicons was determined. Prior to sequencing, the samples were mixed in an identical mole ratio to complete the sample preparation.
The libraries were then high-throughput sequenced (2 × 300 bp reads) (Illumina Miseq, Illumina, CA, USA). The raw reads were processed using QIIME2 v2023.7.0 [18] and PICRUSt2 v2.5.2 softwares [19] (accessed on 12 September 2023). According to the results of data sequencing using PICRUSt2 v2.5.2 software, the microbial metabolic pathways encoded by the detected bacterial genomes were scored and the most abundant pathways were detected by multiple t-test analysis.
2.4. Statistical Data Analysis
Statistical processing of the data was carried out using the method of nonparametric statistics using the GraphPad Prism 10 v10.0.2 (171) statistical software package. The mean and standard deviation were used to present all data. All in vivo experimental data were analysed using Welch’s one-way analysis of variance (ANOVA) or multiple Mann–Whitney tests using the two-stage step-up method (Benjamini, Krieger, and Yekutieli) (false discovery rate Q = 5%). P values less than 0.05 were considered statistically significant (* P < 0.05, ** P < 0.01, *** P < 0.001). A correlation analysis was performed according to Spearman with an assessment of the statistical significance of the correlation coefficient.
3. Results
3.1. Body Weight and Hormonal Status
Three groups of mice with (males, n=10 for each group) fed a standard or high-fat diet for 90 days. The dynamics of weight gain is shown in Figure 2a. At the end of the experiment the final weights of the mice were compared (Figure 2b). Mice from both obesity models showed significantly higher body weight compared to the control group. The mean weight of the mice in control group was 28.5±2.5g, in a high fat diet fed mice group was 34.7±1.4 g, and in db/db mice – 59.2±4.1 g.
To confirm the genetically determined character of obesity, we compared the levels of insulin, leptin, and adiponectin in the blood serum of mice of all experimental groups. We established that Insulin (Figure 3a) and leptin (Figure 3b) levels were significantly higher in db/db mice compared to C57Bl6 mice (15-fold higher for insulin and 21-fold higher for leptin), while the level of adiponectin decreased in mice fed a high-fat diet, but not in db/db mice (Figure 3c). Furthermore, the level of leptin in a high-fat-diet-fed mice also increased compared to a control group, but not such crucial as in db/db mice. Significantly increased levels of insulin and leptin in db/db mice confirmed strong insulin resistance developed due to leptin receptor deficiency.
Therefore, the dynamics of body weight and hormonal status of mice can approve the development of alimentary or genetically determined obesity with characterised metabolic changes in the studied mouse groups.
Microbiota Analysis
Taxonomy Composition and Alpha Diversity
To characterise the composition of the mouse gut microbiota, we performed a high-throughput metagenome sequencing analysis of 30 microbiota samples taken from all experimental animals. After OTUs annotation we compared the differences in alpha diversity and microbial community structures. We established that the alpha diversity indexes (Observed OTUs, PD whole tree, Chao1, Simpson, and Shannon) were significantly lower (p<0.05) in db/db mice compared to the control group (Figure 4a-e), which indicates a decrease in richness and diversity of microbial species in severely obese mice. The microbiota of mice fed a high fat diet has also shown a decrease in alpha diversity, however, only PD whole tree and Shannon indexes were lower in the BL/HFD group compared to a control group (Figure 4b, e).
We have also investigated the taxonomic structure of bacterial communities (Figure 5a, 6a-c). At the phylum level we observed a significant decrease in representation of Verrucomicrobia and Actinobacteria in db/db mice compared with HFD and SD feeding mice (Figure 5b, c). Furthermore, the representation of Bacillota in db/db mice was higher than in the HFD feeding group (Figure 5b).
At the family level, we observed a significant increase in the representation of Prevotellaceae with a simultaneous decrease in the representation of Verrucomicrobiaceae in microbiota od db/db mice compared to HFD-fed mice. These changes are known to be associated with an obese phenotype [12], although the representation of Verrucomicrobiaceae has increased in HFD fed mice compared to SD fed mice.
Figure 6.
Taxonomy structure of mouse gut microbial communities at family level: a – diagram of families’ representation in C57Bl6 mice fed a standard diet; b – diagram of families’ representation in C57Bl6 mice fed a high fat diet; c - diagram of families’ representation in db/db mice fed a standard diet. BL/SD, C57Bl6/spf mice fed a standard diet; BL/HFD, C57Bl6/spf mice fed a high fat diet; DB/SD, db/db mice fed a standard diet.
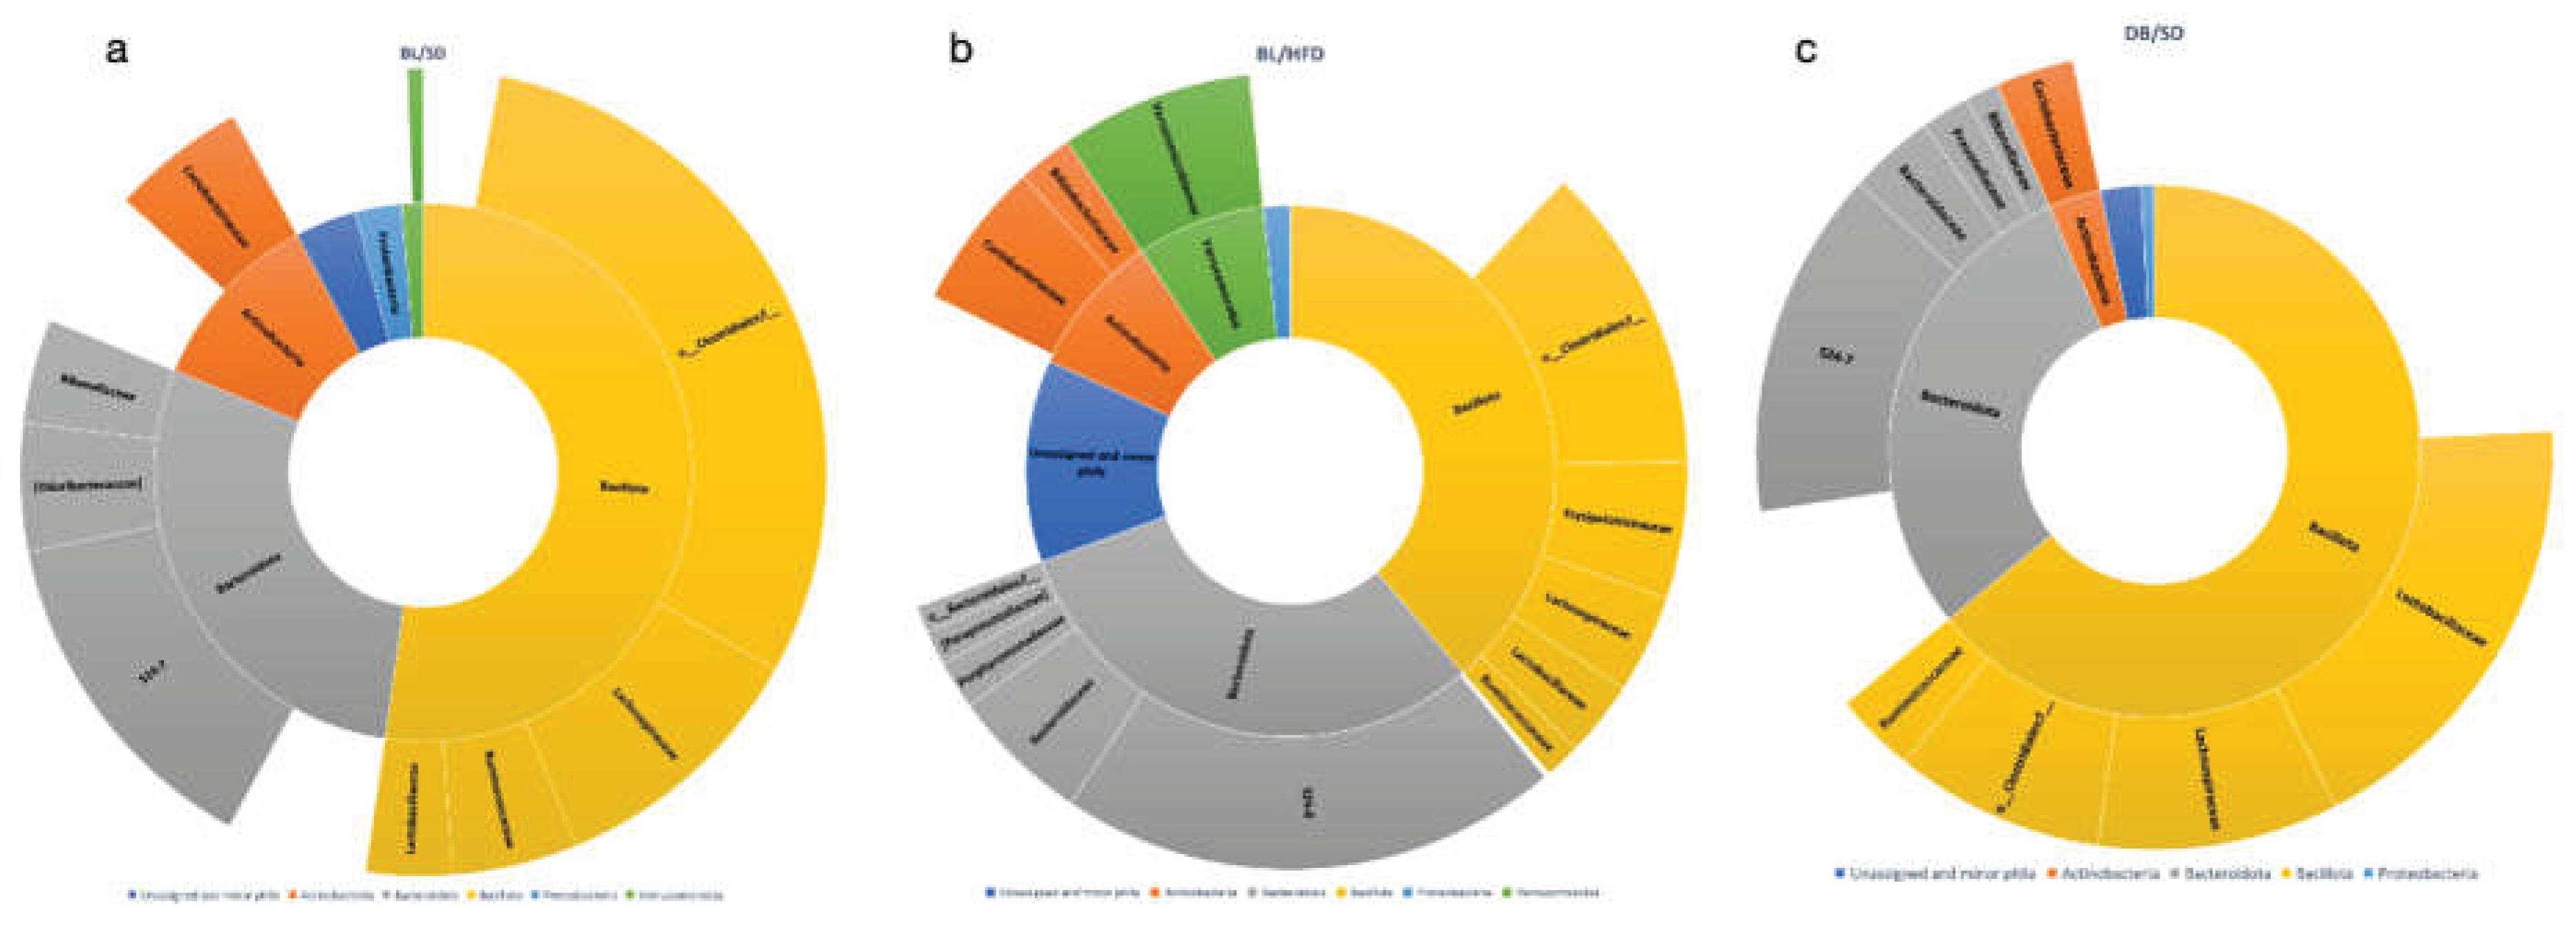
At the species level we have found an increase in Bacteroides acidifaciens in db/db mice compared to BL/SD and BL/HFD mice, while the representation of beneficial for host health Bifidobacterium pseudolongum, Akkermansia muciniphila, Adlercreutzia sp. was decreased in db/db mice only compared to HFD fed mice, but not SD fed mice (Table 1).
All these findings confirm the existence of specific obesogenic changes in the gut microbiota communities of mice, which is more pronounced in db/db mice than in HFD-fed mice, which is in concordance with the higher body weight and hormonal disturbances of db/db mice.
Reconstruction of the Metabolic Activity of the Mouse Gut Microbiota and Representation of the Pathways Responsible for Vitamin B12 Biosynthesis
To establish whether enzymes and metabolic pathways for B12 synthesis are less abundant in obese mice compared to mice fed a standard diet, we carried out reconstruction of microbiota metabolic activity by using PICRUSt2 analytic tool based on metagenome sequencing data analysis, which allowed us to estimate the representation of bacterial genes in mouse gut microbial communities.
According to the results of PICRUSt2, among the 423 metabolic pathways analysed, we revealed some differences in the representation of the cobalamin synthesis pathways of mice fed db/db and HFD compared to C57Bl6 mice fed SD. Namely, the representation of six pathways for vitamin B12 synthesis in db/db mice and four pathways in C57Bl6 mice fed an HFD was decreased (Table 2).
Abundance of Enzymes for Vitamin B12 Synthesis in Gut Bacteria According to the Results of the Metagenome Sequencing
PICRUSt2 analysis was also used to estimate the representation of enzymes involved in cobalamin synthesis. To this aim, we have chosen 37 enzymes required for cobalamine synthesis (Figure1) among more than 8000 enzymes represented in investigated microbiomes. Only three enzymes (EC 1.16.1.4, EC 1.16.1.6, [EC 2.1.2.272]) were not presented in our data and were not investigated.
We found that the representation of almost all enzymes (except of adenosylcobalamine hydrolase and vitamin B12-transporting ATPase) needed for vitamin B12 synthesis is decreased in db/db mice compared to C57Bl6 mice fed SD (Table 3), while there was no difference in enzyme representation in other comparisons.
These observations may point to depletion of vitamin B12 synthesis in the gut of obese mice, mainly in db/db mice.
Correlation Analysis
To establish the role of individual species in cobalamin synthesis, we made Spearmen correlation analysis, which revealed some important trends. We noticed that the representation of enzymes involved in cobalamin biosynthesis is strongly correlated in a positive and negative way with the representation of several species in the microbiota of C57Bl6 mice fed a high-fat diet (Table 4). For example, we observed strong negative correlations between the representation of Akkermansia sp. and strong positive correlations between the representation of Lachnospiraceae bacteria and most of the enzymes issued. According to our results, bacteria of Verrucomicrobia phyla were significantly higher represented in the microbiota of HFD-fed mice, but not in SD-fed mice. Furthermore, it has previously been shown that in obese people, dietary vitamin B12 intake was inversely correlated with Akkermansia muciniphila species and species of the Verrucomicrobia phylum, while it was positively correlated with Bacteroides species [13].
At the same time, we observed almost complete loss of correlations in the microbiota of db/db mice, except for positive correlations for species of the Lachnospiraceae family (Table 5). This fact is apparently caused by a significant decrease in alpha diversity of microbiota communities and a loss of microbes involved in cobalamine synthesis.

Table 5.
Spearmen correlations evaluated for the representation of bacteria species in the microbiota of db/db mice and enzymes for cobalamin biosynthesis according to the data from metagenome sequencing. Green cells show positive correlations (P < 0.05), pink cells show negative correlations (P < 0.05), black cells show nonsignificant correlations (P > 0.05).
| s__Burkholderia_sp. | s__Muribacter_muris | s__Pseudomonas_sp. | f__Lachnospiraceae; g__uncultured; s__uncultured_bacterium | g__Colidextribacter; s__uncultured_bacterium | |
| Cobalt-precorrin-6A reductase | -0,43 | 0,65 | 0,33 | 0,84 | 0,75 |
| Precorrin-6A reductase | -0,43 | 0,65 | 0,33 | 0,84 | 0,75 |
| Precorrin-2 dehydrogenase | -0,77 | 0,88 | 0,11 | 0,23 | 0,79 |
| Uroporphyrinogen-III C-methyltransferase | -0,77 | 0,88 | 0,11 | 0,23 | 0,79 |
| Precorrin-2 C(20)-methyltransferase | -0,58 | 0,74 | 0,54 | 0,78 | 0,79 |
| Precorrin-3B C(17)-methyltransferase | -0,52 | 0,74 | 0,71 | 0,84 | 0,61 |
| Precorrin-6B C(5,15)-methyltransferase (decarboxylating) | -0,67 | 0,74 | 0,71 | 0,74 | 0,64 |
| Precorrin-4 C(11)-methyltransferase | -0,52 | 0,74 | 0,71 | 0,84 | 0,61 |
| Cobalt-factor II C(20)-methyltransferase | -0,58 | 0,74 | 0,54 | 0,78 | 0,79 |
| Precorrin-6A synthase (deacetylating) | -0,21 | 0,12 | -0,93 | -0,35 | 0,20 |
| Cobalt-precorrin-5B (C(1))-methyltransferase | -0,67 | 0,74 | 0,65 | 0,74 | 0,61 |
| Cobalt-precorrin-4 methyltransferase | -0,52 | 0,74 | 0,71 | 0,84 | 0,61 |
| Nicotinate-nucleotide--dimethylbenzimidazole phosphoribosyltransferase | -0,86 | 0,77 | 0,37 | 0,63 | 0,50 |
| Cob(I)yrinic acid a,c-diamide adenosyltransferase | -0,73 | 0,88 | 0,07 | 0,51 | 0,64 |
| Adenosylcobinamide kinase | -0,82 | 0,77 | 0,31 | 0,56 | 0,54 |
| Adenosylcobinamide-phosphate guanylyltransferase | -0,82 | 0,77 | 0,31 | 0,56 | 0,54 |
| Adenosylcobinamide-GDP ribazoletransferase | -0,86 | 0,77 | 0,37 | 0,63 | 0,50 |
| Cobalt-precorrin 5A hydrolase | -0,52 | 0,74 | 0,77 | 0,84 | 0,64 |
| Threonine-phosphate decarboxylase | -0,67 | 0,74 | 0,65 | 0,74 | 0,61 |
| Sirohydrochlorin cobaltochelatase | -0,52 | 0,74 | 0,71 | 0,84 | 0,61 |
| Sirohydrochlorin ferrochelatase | -0,77 | 0,88 | 0,17 | 0,23 | 0,82 |
| Cobalt-precorrin-8 methylmutase | -0,52 | 0,74 | 0,71 | 0,84 | 0,61 |
| Precorrin-8X methylmutase | -0,52 | 0,74 | 0,71 | 0,84 | 0,61 |
| Adenosylcobinamide-phosphate synthase | -0,67 | 0,74 | 0,65 | 0,74 | 0,61 |
| Adenosylcobyric acid synthase (glutamine-hydrolyzing) | -0,67 | 0,74 | 0,65 | 0,74 | 0,61 |
| Cobyrinate a,c-diamide synthase (glutamine-hydrolyzing) | -0,52 | 0,74 | 0,71 | 0,84 | 0,61 |
| Hydrogenobyrinic acid a,c-diamide synthase (glutamine-hydrolyzing) | -0,52 | 0,74 | 0,71 | 0,84 | 0,61 |
| Cobaltochelatase | 0,09 | 0,12 | -0,85 | -0,20 | -0,07 |
4. Discussion
Vitamin B12 is an essential component for pro- and eucaryotic living organisms. Because it is synthesised exclusively in bacterial cells, it can accumulate in animals that receive it with food. Many species of commensal bacteria inhabiting the mammalian gut are capable of synthesising vitamin B12, however, it is not reliably known whether this microbiota-derived vitamin can be effectively absorbed into the host's circulation and contribute to the systemic level of cobalamin. In mammalian cells, vitamin B12 is used for the methionine synthase reaction and for the metabolism of amino and fatty acids. Vitamin B12 deficiency is associated with the development of megaloblastic anemia and neurological complications. Furthermore, obese state and other dysmetabolic conditions have been found to be associated with decreased levels of vitamin B12 [6]. The fact that obesity is coupled with disturbances in intestinal microbiota composition and metabolic activity also points to possible disturbances in cobalamin synthesis by commensal microbes in obesity. Interestingly, there may be a reciprocal relationship between the gut microbiota and vitamin B12 levels [14]. Vitamin B12 deficiency can alter the balance and functional interaction of the gut microbial community [15]. Therefore, by changing the microbial composition of the gut, interactions between vitamin B12 and the gut microbiota can prevent the development of obesity [16]. Thus, there may be a relationship between obesity, intestinal flora, and vitamin B12 levels [14].
To our knowledge, there are few studies investigating the ability of the intestinal microbiota to synthesise vitamin B12 in association with obesity.
Mice deficient in the leptin receptor (db/db) develop severe obesity with corresponding hormonal changes, such as hyperinsulinemia and hyperleptinemia, are widely used as a model of hyperphagia, obesity, and type 2 diabetes mellitus [17]. Furthermore, as we have shown in the present investigation, the gut microbiota of db/db mice differ significantly compared to the microbiota of C57Bl6 mice. That is, we observed a dramatic decrease in alpha diversity and representation of ‘obesoprotective’ microbes, such as Akkermansia miciniphila, Bifidobacterium pseudolongum along with an increase in the abundance of ‘obesogenic’ Prevotella in db/db mice, in contrast to C57Bl6 mice fed a high fat diet. Mice received HFD showed an increased representation of Verrucomicrobia and Actinobacteria phyla, which may be associated with increased fuel sources for bacterial growth. However, the alpha diversity of the gut microbiota community of HFD-fed mice decreased as well, as is confirmed by the Shannon and PD whole tree indexes.
For the first time, we have shown that severe obesity with corresponding metabolic disturbances, which are developed in db/db mice, is associated with a decrease in the representation of enzymes and metabolic pathways for the synthesis of cobalamin. However, C57Bl6 mice were fed a high-fat diet and also developed obesity, although they gained less weight than db/db mice, showed no differences in enzyme representation and fewer pathways with a lower representation of vitamin B12 synthesis. Furthermore, strong associations between the representation of gut microbes of cobalamin biosynthetic enzymes were described for HFD fed mice. For example, we have seen strong negative correlations for the genera Colidextribacter, Akkermansia, Bacteroides, and Faecalibacterium, while the genera Muribaculaceae, Enterococcus, Butyricoccus and the uncultured genus of the Lachnospiraceae family were negatively associated with enzyme representation. On the other hand, in db/bd mice only positive correlations have been observed with the uncultured genus of the Lachnospiraceae family, whereas other mocrobes showed no or unitary correlations with enzyme representatiom.
Therefore, the degree of obesity and the composition of the correspondent microbiota are the main contributors to the representation of genes and pathways for cobalamin biosynthesis in the gut of mice. It can be proposed that the 'obesogenic' microbiota community is dwindling with vitamin B12 microbe producers, which can lead to the formation of a more aberrant microbial community and lower levels of vitamin B12 in the host. However, this hypothesis should be confirmed by studying serum levels of cobalamin in association with the degree of obesity and intestinal microbiota composition as well as by studying the direct contribution of separate microbes in cobalamin synthesis.
5. Conclusions
In this study, we performed a high-throughput metagenome sequencing analysis followed by reconstruction of the metabolic activity of the gut microbiota for a high-fat diet of C57BL/6SPF mice, a regular diet of db/db mice, and a regular diet of C57BL/6SPF mice. We observed a specific obesogenic shift in mouse gut microbiota communities, which was more pronounced in db/db mice than in HFD-fed mice, that was consistent with higher body weight and hormonal disturbances of db/db mice. We have defined a significantly lower representation of enzymes and metabolic pathways for vitamin B12 biosynthesis in obese mice compared to non-obese mice, where enzyme depletion was more pronounced in db/db mice, which developed severe obesity. The representation of enzymes involved in cobalamin synthesis is strongly correlated with the representation of several microbes in HFD fed mice, whereas there were almost no correlations in db/db mice. Therefore, the obesogenic gut microbiota can be implicated in decreased vitamin B12 synthesis in the gut, which in turn can influence host levels of cobalamin and can make obese mice more prone to the development of cobalamin deficiency.
Supplementary Materials
The following supporting information can be downloaded at the website of this paper posted on Preprints.org, Figure S1: title; Table S1: title; Video S1: title.
Author Contributions
Conceptualization, A.A.Z. and A.V.S.; methodology, I.M.K.; validation, I.Yu.V. and T.V.G; formal analysis, A.A.Z. and I.Yu.V.; investigation, I.M.K.; data curation, T.V.G.; writing—original draft preparation, A.A.Z.; writing—review and editing, A.V.S.; visualization, A.A.Z.; resources, S.A.R.; supervision, A.V.S. and S.A.R.; project administration, A.V.S.; funding acquisition, A.V.S. and S.A.R. All the authors have read and agreed to the published version of the manuscript.
Funding
This research was funded by the Ministry of Science and Higher Education of the Russian Federation (grant number 075-15-2022-310).
Institutional Review Board Statement
The animal study protocol was approved by the Institutional Review Board (or Ethics Committee) of the Ethics Committee for Animal Research of I.M. Sechenov First Moscow State Medical University, Russia (protocol number 96 from 2 September 2021).
Informed Consent Statement
Not applicable.
Data Availability Statement
The data presented in this study are available upon request from the corresponding author.
Acknowledgments
In this section, you can acknowledge any support given which is not covered by the author contribution or funding sections. This may include administrative and technical support, or donations in kind (e.g., materials used for experiments).
Conflicts of Interest
The authors declare no conflicts of interest.
References
- Hou, K.; Wu, Z.-X.; Chen, X.-Y.; Wang, J.-Q.; Zhang, D.; Xiao, C.; Zhu, D.; Koya, J.B.; Wei, L.; Li, J.; et al. Microbiota in Health and Diseases. Signal Transduct Target Ther 2022, 7, 135. [Google Scholar] [CrossRef] [PubMed]
- Van Hul, M.; Cani, P.D. The Gut Microbiota in Obesity and Weight Management: Microbes as Friends or Foe? Nat Rev Endocrinol 2023, 19, 258–271. [Google Scholar] [CrossRef] [PubMed]
- Muscogiuri, G.; Cantone, E.; Cassarano, S.; Tuccinardi, D.; Barrea, L.; Savastano, S.; Colao, A. Gut Microbiota: A New Path to Treat Obesity. Int J Obes Suppl 2019, 9, 10–19. [Google Scholar] [CrossRef] [PubMed]
- Baltaci, D.; Kutlucan, A.; Turker, Y.; Yilmaz, A.; Karacam, S.; Deler, H.; Ucgun, T.; Kara, I.H. Association of Vitamin B12 with Obesity, Overweight, Insulin Resistance and Metabolic Syndrome, and Body Fat Composition; Primary Care-Based Study. Med Glas (Zenica) 2013, 10, 203–210. [Google Scholar] [PubMed]
- Sun, Y.; Sun, M.; Liu, B.; Du, Y.; Rong, S.; Xu, G.; Snetselaar, L.G.; Bao, W. Inverse Association Between Serum Vitamin B12 Concentration and Obesity Among Adults in the United States. Front Endocrinol (Lausanne) 2019, 10. [Google Scholar] [CrossRef] [PubMed]
- Boachie, J.; Adaikalakoteswari, A.; Samavat, J.; Saravanan, P. Low Vitamin B12 and Lipid Metabolism: Evidence from Pre-Clinical and Clinical Studies. Nutrients 2020, 12, 1925. [Google Scholar] [CrossRef] [PubMed]
- Polter, D.E.; Boyle, J.D.; Miller, L.G.; Finegold, S.M. Anaerobic Bacteria as Cause of the Blind Loop Syndrome. Gastroenterology 1968, 54, 1148–1154. [Google Scholar] [CrossRef] [PubMed]
- Gille, D.; Schmid, A. Vitamin B12 in Meat and Dairy Products. Nutr Rev 2015, 73, 106–115. [Google Scholar] [CrossRef] [PubMed]
- Kundra, P.; Geirnaert, A.; Pugin, B.; Morales Martinez, P.; Lacroix, C.; Greppi, A. Healthy Adult Gut Microbiota Sustains Its Own Vitamin B12 Requirement in an in Vitro Batch Fermentation Model. Front Nutr 2022, 9. [Google Scholar] [CrossRef] [PubMed]
- Juodeikis, R.; Jones, E.; Deery, E.; Beal, D.M.; Stentz, R.; Kräutler, B.; Carding, S.R.; Warren, M.J. Nutrient Smuggling: Commensal Gut Bacteria-derived Extracellular Vesicles Scavenge Vitamin B12 and Related Cobamides for Microbe and Host Acquisition. Journal of Extracellular Biology 2022, 1. [Google Scholar] [CrossRef]
- Guetterman, H.M.; Huey, S.L.; Knight, R.; Fox, A.M.; Mehta, S.; Finkelstein, J.L. Vitamin B-12 and the Gastrointestinal Microbiome: A Systematic Review. Advances in Nutrition 2022, 13, 530–558. [Google Scholar] [CrossRef] [PubMed]
- Dong, T.S.; Guan, M.; Mayer, E.A.; Stains, J.; Liu, C.; Vora, P.; Jacobs, J.P.; Lagishetty, V.; Chang, L.; Barry, R.L.; et al. Obesity Is Associated with a Distinct Brain-Gut Microbiome Signature That Connects Prevotella and Bacteroides to the Brain’s Reward Center. Gut Microbes 2022, 14. [Google Scholar] [CrossRef] [PubMed]
- Al-Musharaf, S.; Aljuraiban, G.S.; Al-Ajllan, L.; Al-Khaldi, N.; Aljazairy, E.A.; Hussain, S.D.; Alnaami, A.M.; Sabico, S.; Al-Daghri, N. Vitamin B12 Status and Gut Microbiota among Saudi Females with Obesity. Foods 2022, 11, 4007. [Google Scholar] [CrossRef] [PubMed]
- Guetterman, H.M.; Huey, S.L.; Knight, R.; Fox, A.M.; Mehta, S.; Finkelstein, J.L. Vitamin B-12 and the Gastrointestinal Microbiome: A Systematic Review. Advances in Nutrition 2022, 13, 530–558. [Google Scholar] [CrossRef] [PubMed]
- Sharma, V.; Rodionov, D.A.; Leyn, S.A.; Tran, D.; Iablokov, S.N.; Ding, H.; Peterson, D.A.; Osterman, A.L.; Peterson, S.N. B-Vitamin Sharing Promotes Stability of Gut Microbial Communities. Front Microbiol 2019, 10. [Google Scholar] [CrossRef] [PubMed]
- Voland, L.; Le Roy, T.; Debédat, J.; Clément, K. Gut Microbiota and Vitamin Status in Persons with Obesity: A Key Interplay. Obesity Reviews 2022, 23. [Google Scholar] [CrossRef] [PubMed]
- Wang, B.; Chandrasekera, P.; Pippin, J. Leptin- and Leptin Receptor-Deficient Rodent Models: Relevance for Human Type 2 Diabetes. Curr Diabetes Rev 2014, 10, 131–145. [Google Scholar] [CrossRef] [PubMed]
- Bolyen, E.; Rideout, J.R.; Dillon, M.R.; Bokulich, N.A.; Abnet, C.C.; Al-Ghalith, G.A.; Alexander, H.; Alm, E.J.; Arumugam, M.; Asnicar, F.; et al. Reproducible, Interactive, Scalable and Extensible Microbiome Data Science Using QIIME 2. Nat Biotechnol 2019, 37, 852–857. [Google Scholar] [CrossRef] [PubMed]
- Douglas, G.M.; Maffei, V.J.; Zaneveld, J.R.; Yurgel, S.N.; Brown, J.R.; Taylor, C.M.; Huttenhower, C.; Langille, M.G.I. PICRUSt2 for Prediction of Metagenome Functions. Nat Biotechnol 2020, 38, 685–688. [Google Scholar] [CrossRef] [PubMed]
Figure 1.
The scheme of vitamin B12 synthesis in bacteria. The representation of all enzymes, except EC 1.16.1.4, 1.16.1.6, [2.1.1.272] (red font), was investigated in the present study.
Figure 1.
The scheme of vitamin B12 synthesis in bacteria. The representation of all enzymes, except EC 1.16.1.4, 1.16.1.6, [2.1.1.272] (red font), was investigated in the present study.
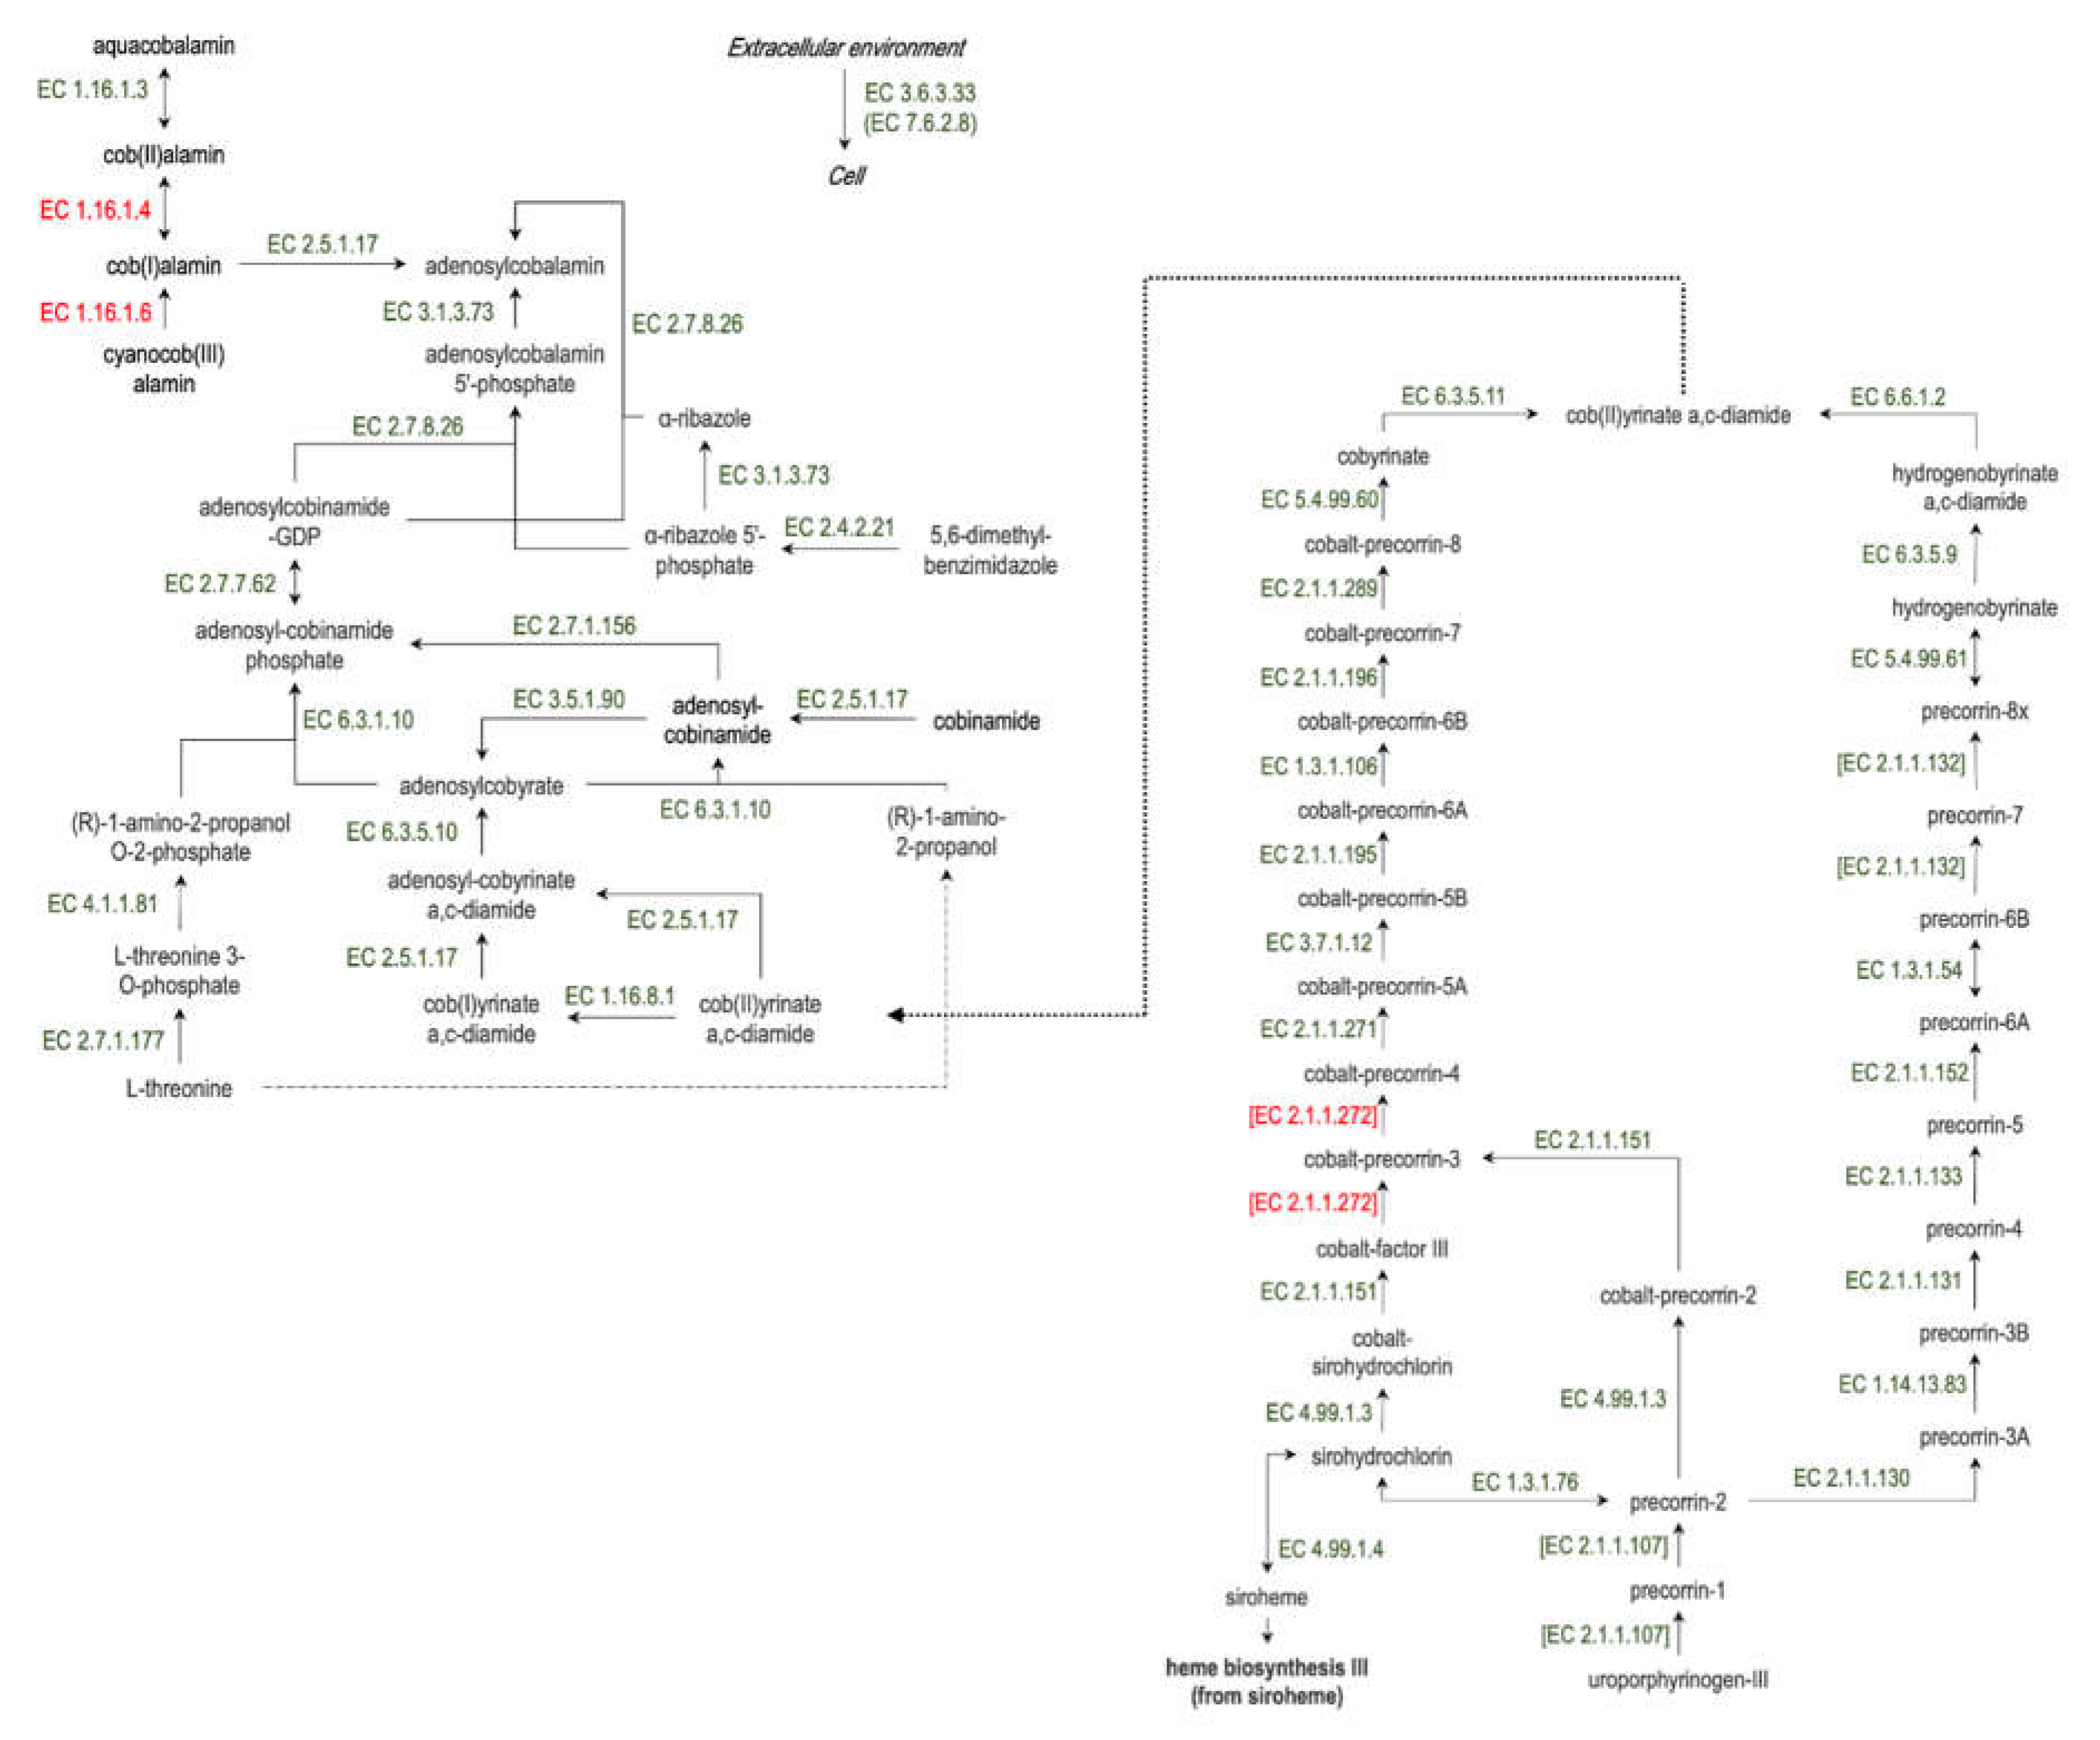
Figure 2.
Changes in mouse body weight during the course of the experiment: a - mouse BW dynamics during the 90 day feeding experiment in different study groups; b - ANOVA of mouse BW in different experimental groups did not reveal any differences after 4 weeks of feeding (****P<0.0001). BL/SD, C57Bl6/spf mice fed a standard diet; BL/HFD, C57Bl6/spf mice fed a high-fat diet; DB/SD, db/db mice fed a standard diet.
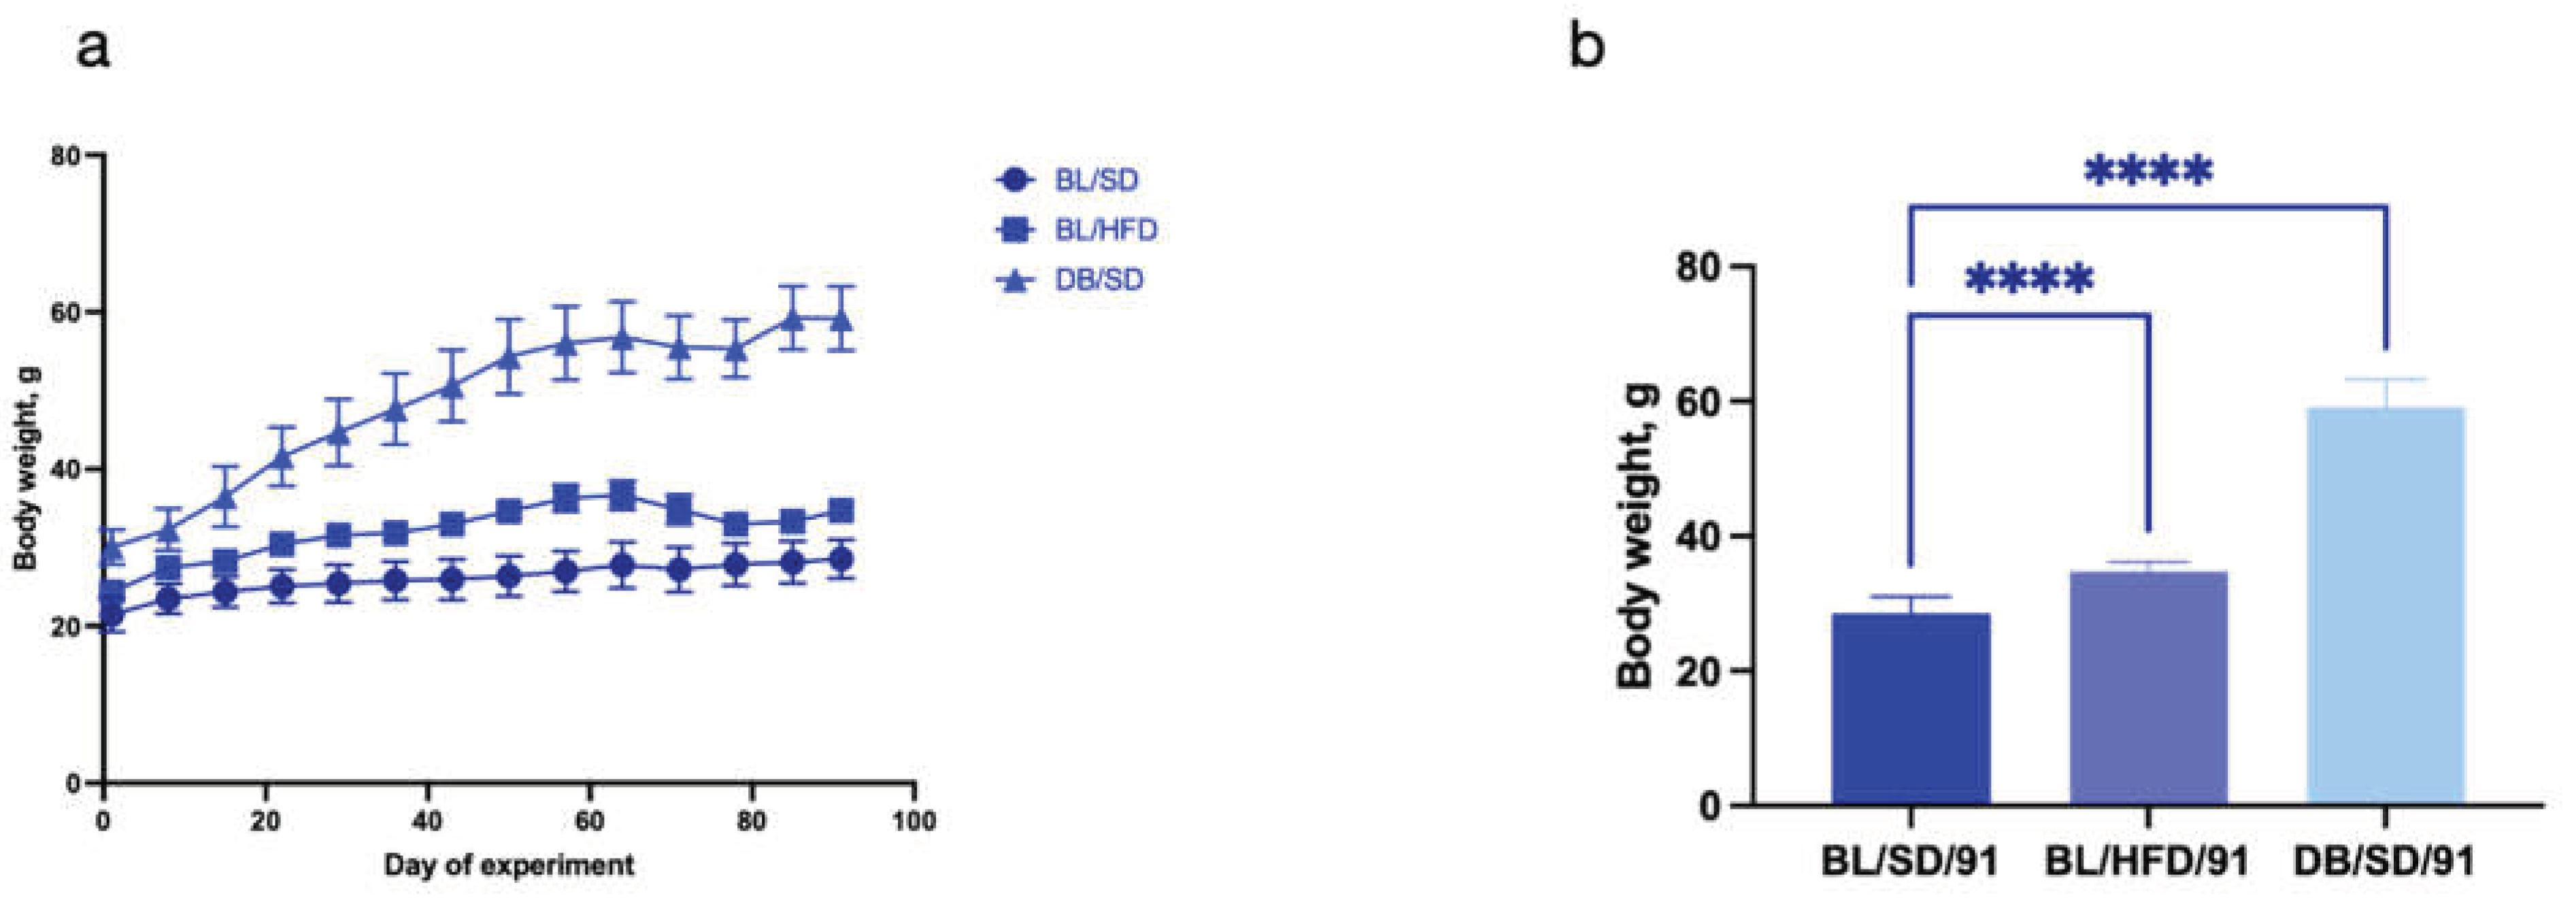
Figure 3.
Results of serum insulin (a), leptin (b), and adiponectin (c) levels in different groups of mice at the end of the experiment. Comparisons were carried out using one-way analysis of variance followed by Tukey’s multiple comparison test (***P<0.001, ****P<0.0001). BL/SD, C57Bl6/spf mice fed a standard diet; BL/HFD, C57Bl6/spf mice fed a high-fat diet; DB/SD, db/db mice fed a standard diet.
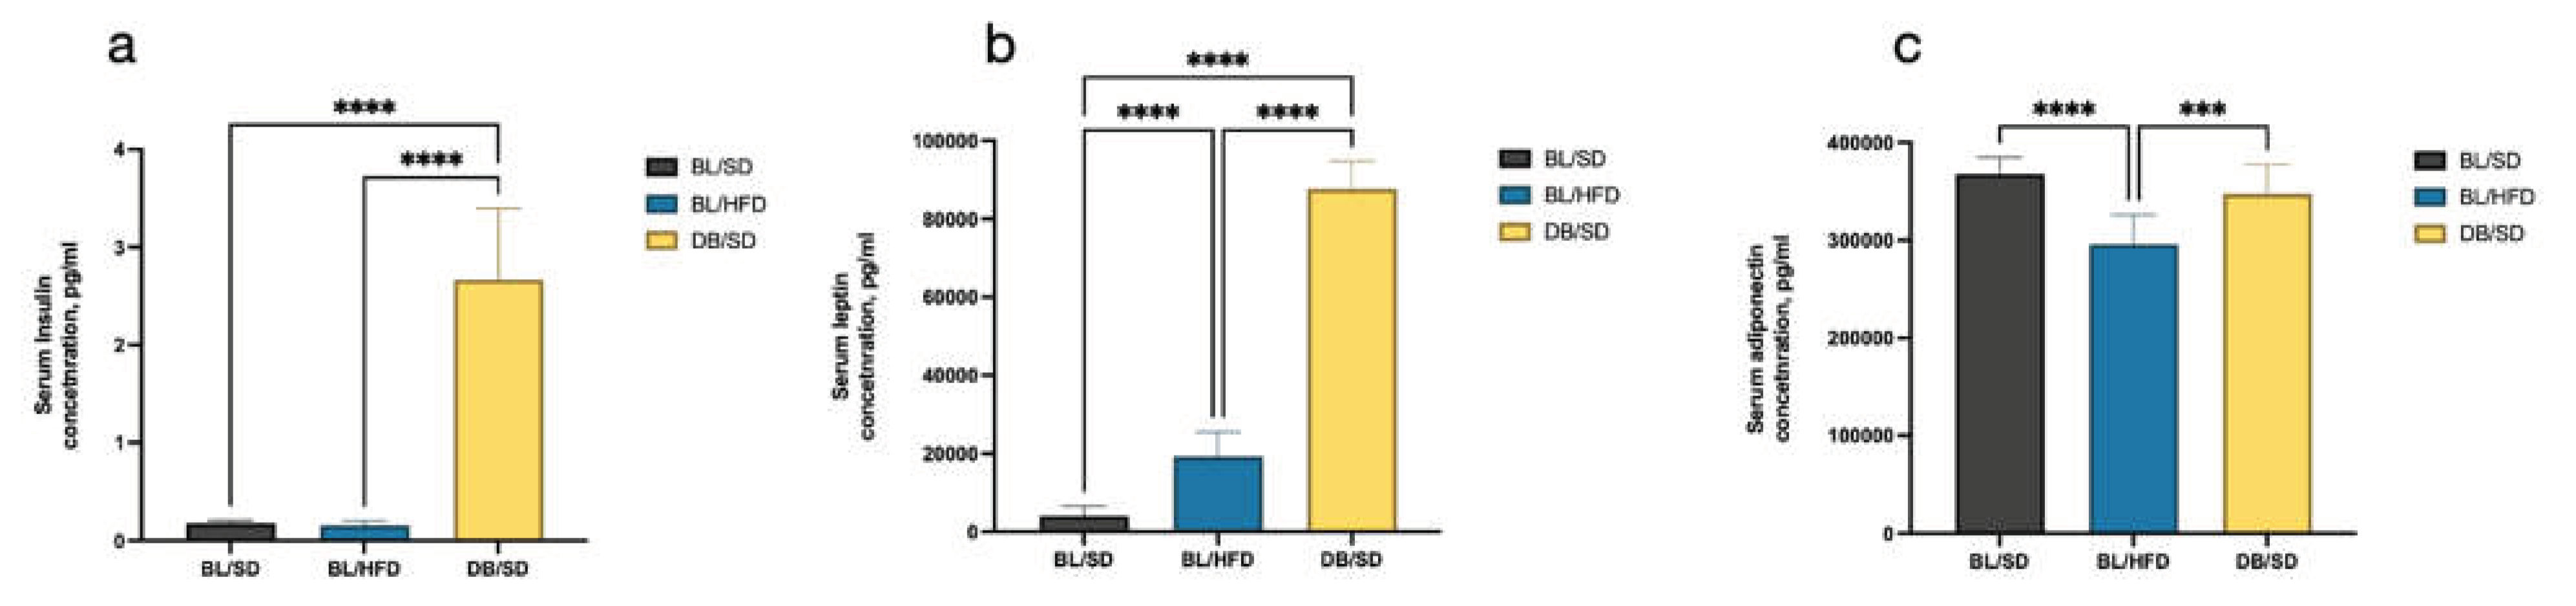
Figure 4.
Results of one-way ANOVA followed by Tukey’s multiple comparison test for alpha diversity indices (a – for observed OTUs, b – for PD whole tree, c – for Chao1, d – for Simpson, e – for Shannon), in different groups of mice. *P<0.05, **P<0.01. BL/SD, C57Bl6/spf mice fed a standard diet; BL/HFD, C57Bl6/spf mice fed a high-fat diet; DB/SD, db/db mice fed a standard diet.
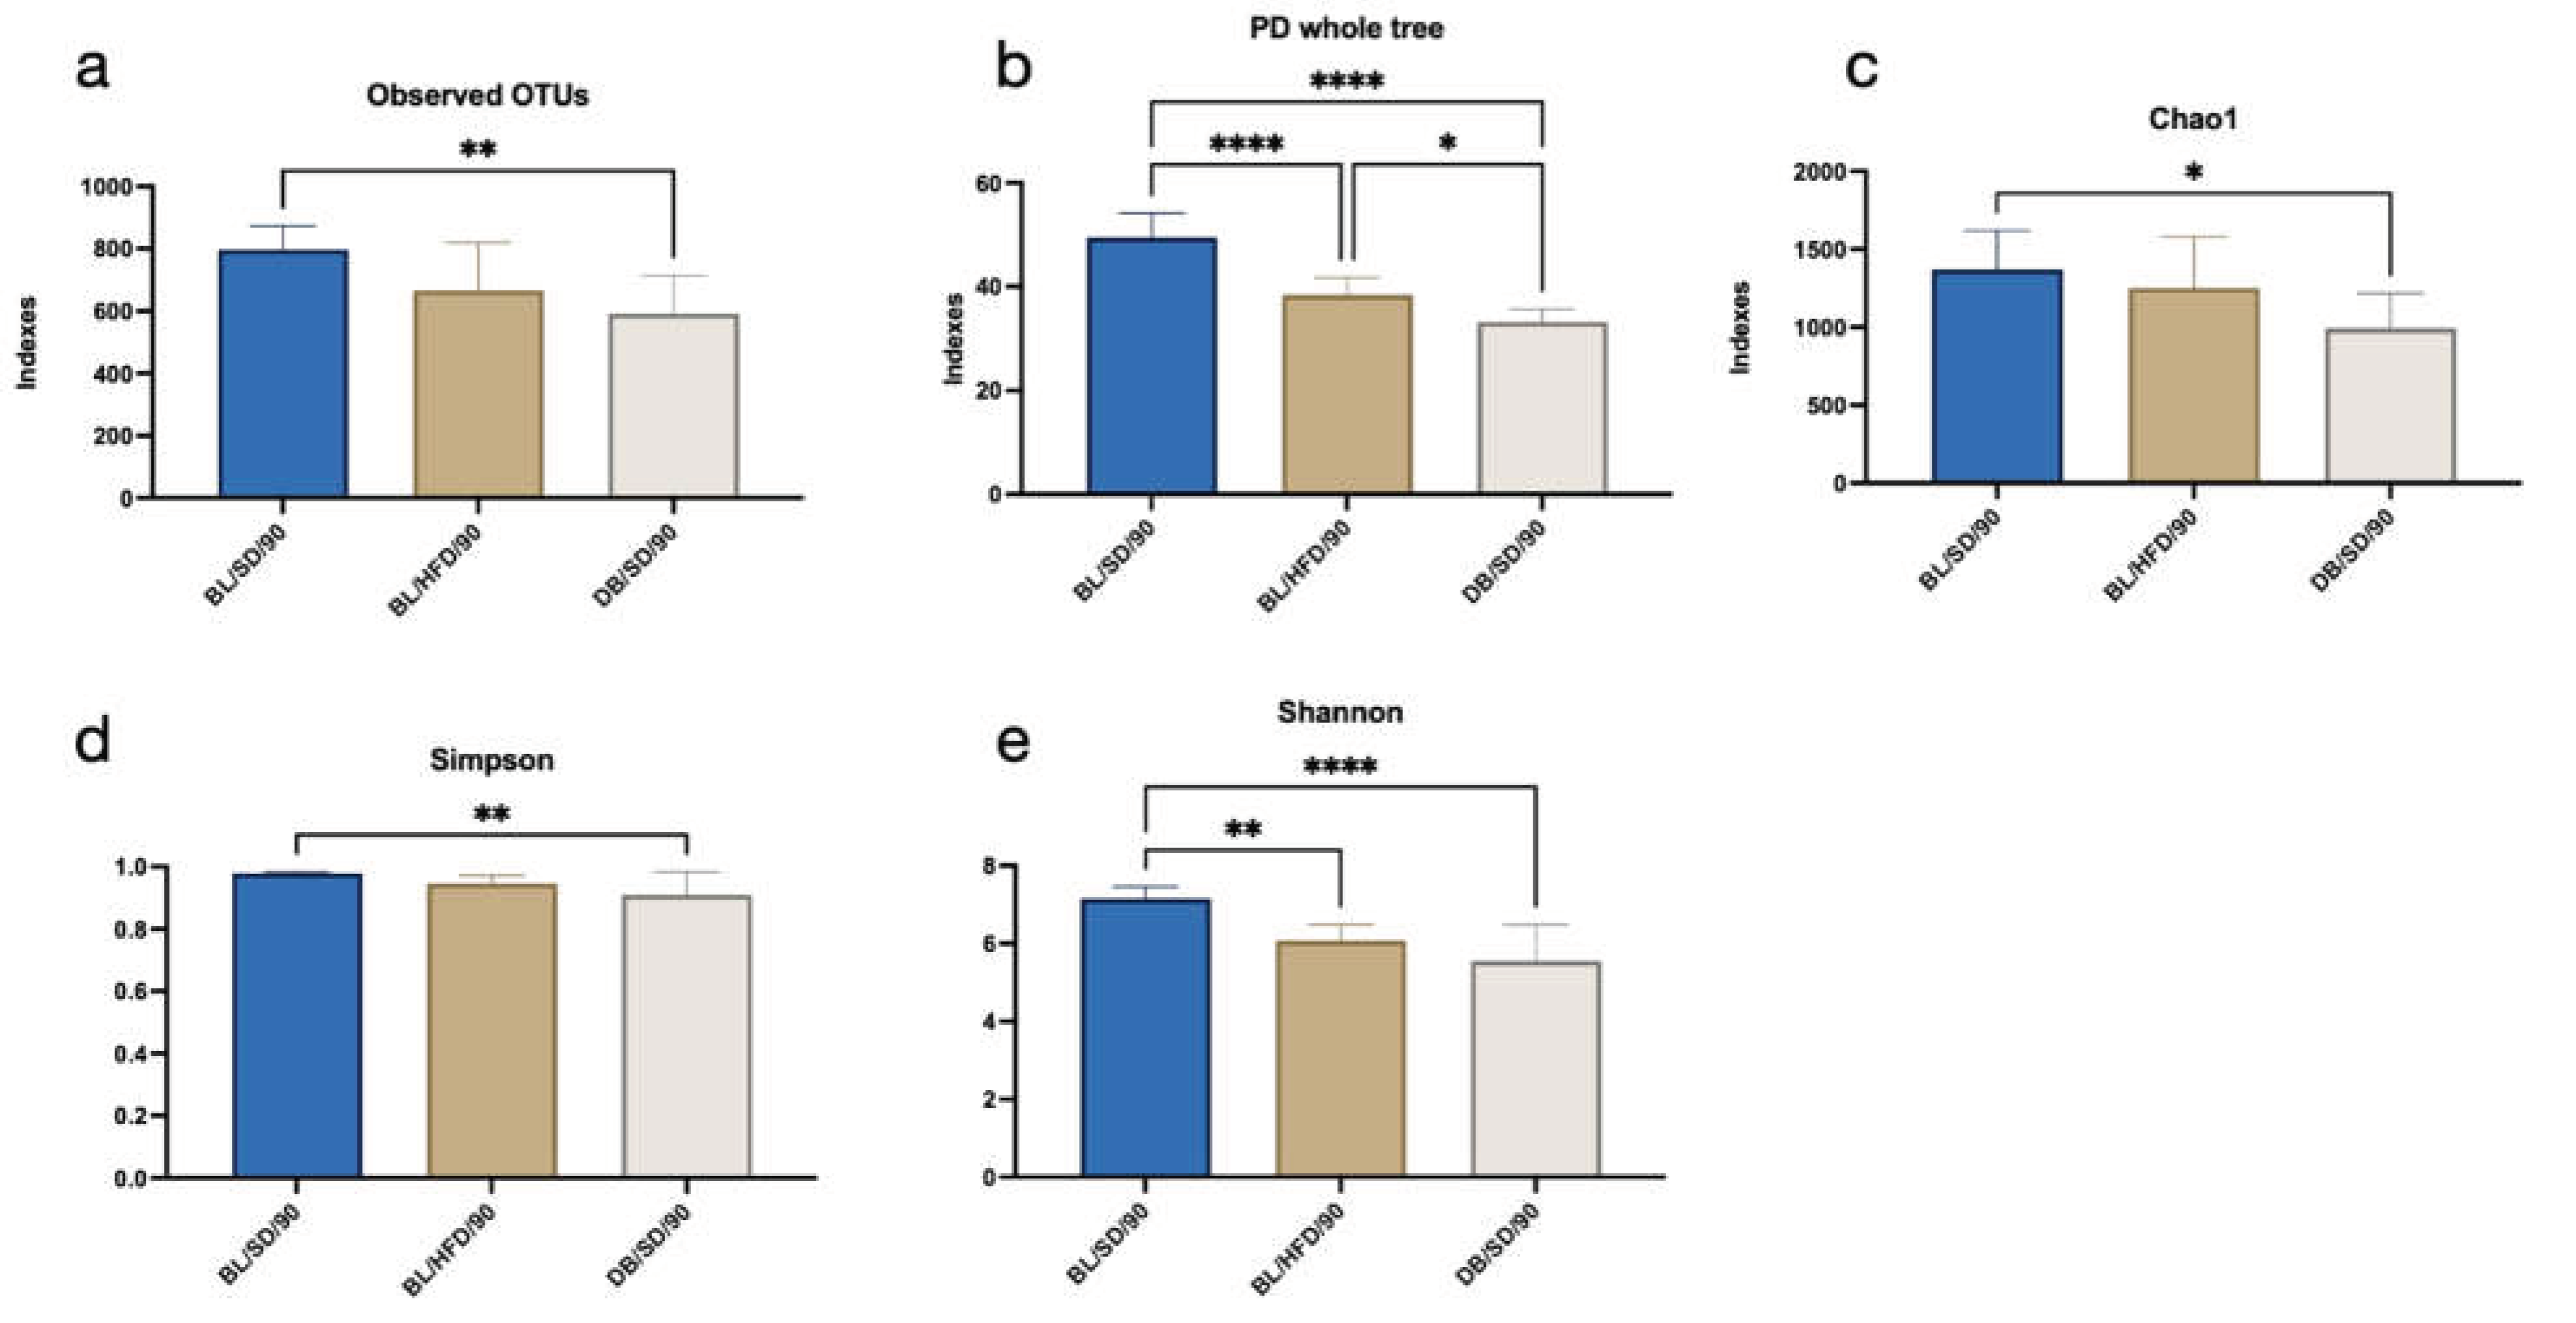
Figure 5.
Taxonomy structure of mouse gut microbial communities at the phylum level: a – diagrams of comparative phyla representation in three groups of mice; b – volcano plot demonstrating differences in the representation of bacterial phyla in C57Bl6 mice fed a standard or a high fat diet; c - volcano plot demonstrating differences in the representation of bacterial phyla in C57Bl6 and db/db mice fed a standard diet; d - volcano plot demonstrating differences in the representation of bacterial phyla in C57Bl6 mice fed a high fat diet and in db/db mice fed a standard diet. The Q value reflects a false discovery rate of 5%. The mean rank difference values reflect the direction of changes in the abundance of bacterial phyla (values less than zero indicate an increased representation of phyla, while values greater than zero indicate a decreased representation of phyla in the microbiota of db/db mice (b and c) or an HFD fed mice (d). Statistically significant values (P<0.01) are indicated. BL/SD, C57Bl6/spf mice fed a standard diet; BL/HFD, C57Bl6/spf mice fed a high-fat diet; DB/SD, db/db mice fed a standard diet.
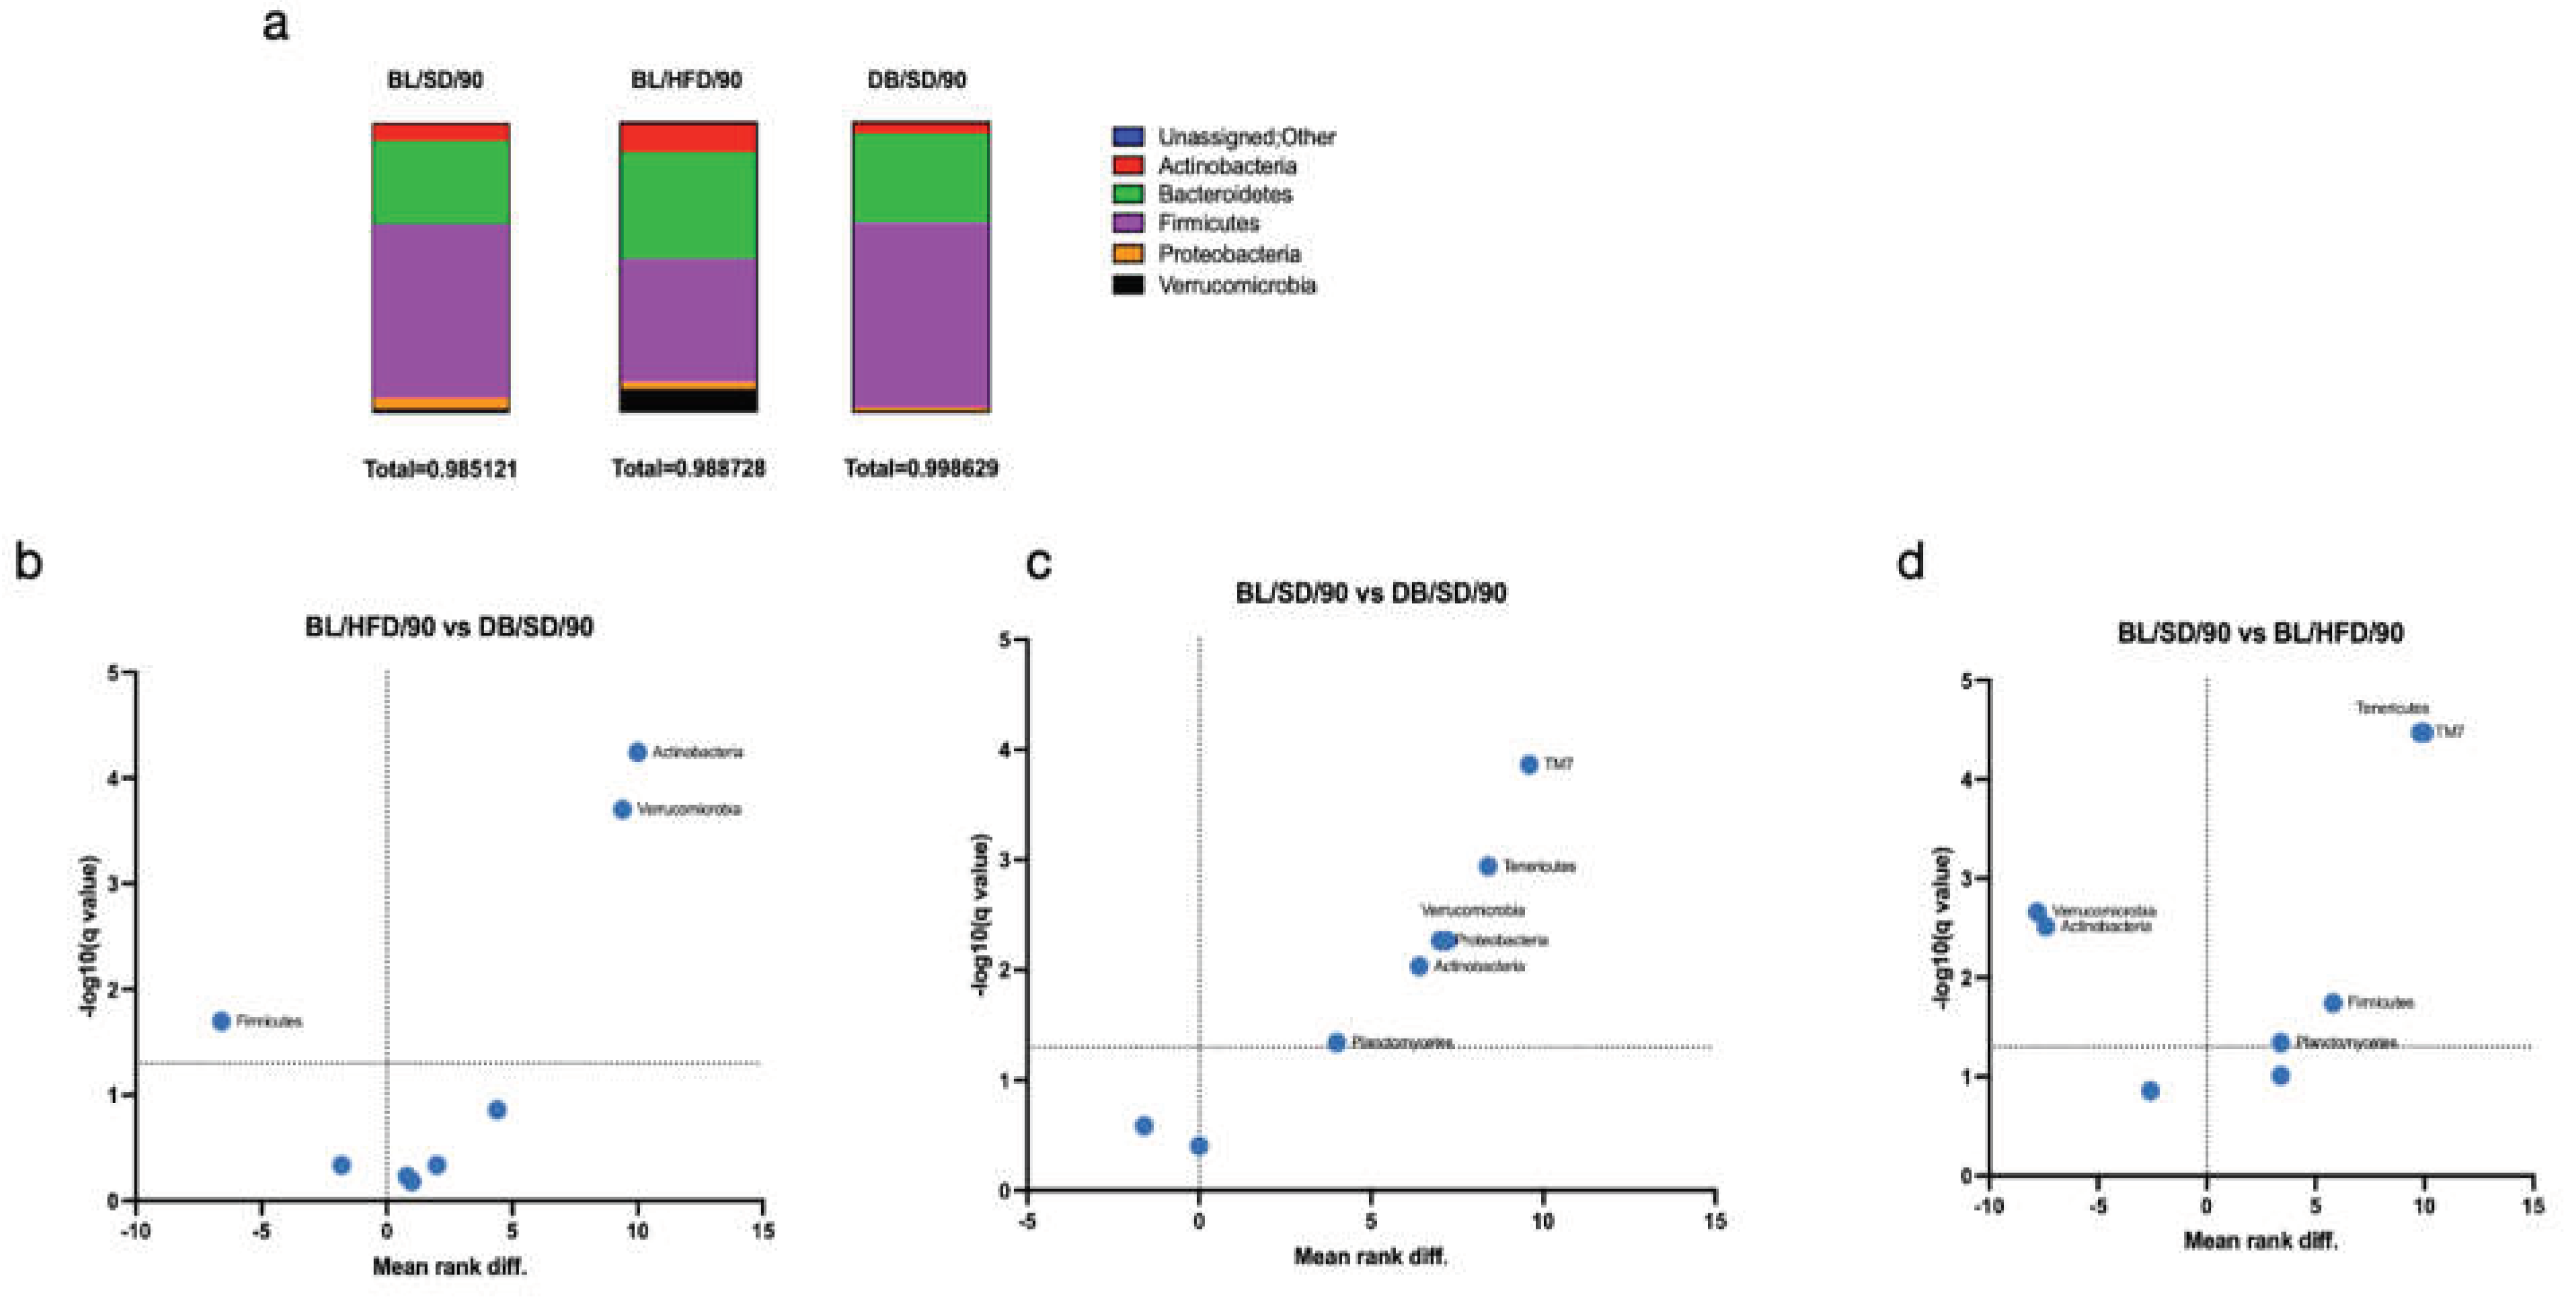
Table 1.
Differentially represented bacterial species in different groups of mice according to multiple Mann–Whitney tests with the two-stage step-up method (Benjamini, Krieger, and Yekutieli) (false discovery rate Q = 5%). P values less than 0.05 were considered to indicate statistical significance. a. Comparison in BL/HFD and DB/SD groups; arrows show increased or decreased microbe representation in db/db mice; b. Comparison in BL/SD and DB/SD groups; arrows show increased or decreased microbe representation in db/db mice; c. Comparison in BL/SD and BL/HFD groups; arrows show increased or decreased microbe representation in HFD fed mice. BL/SD, C57Bl6/spf mice fed a standard diet; BL/HFD, C57Bl6/spf mice fed a high fat diet; DB/SD, db/db mice fed a standard diet.
| a. BL/HFD vs DB/SD | b. BL/SD vs DB/SD | c. BL/SD vs BL/HFD | |||
| Bifidobacterium pseudolongum | ↓ | AF12 sp. | ↓ | AF12 sp. | ↓ |
| Bacteroides sp. | ↓ | Streptococcus sp. | ↓ | Rikenella sp. | ↓ |
| Parabacteroides distasonis | ↓ | Clostridium sp. | ↓ | Ruminococcus sp. | ↓ |
| Allobaculum sp. | ↓ | Coprobacillus sp. | ↓ | Clostridium sp. | ↓ |
| Akkermansia muciniphila | ↓ | Dorea sp. | ↓ | Sutterella sp. | ↓ |
| Streptococcus sp. | ↓ | Sutterella sp. | ↓ | Anaeroplasma sp. | ↓ |
| Adlercreutzia sp. | ↓ | Odoribacter sp. | ↓ | Coprobacillus sp. | ↓ |
| Clostridium sp. | ↓ | Parabacteroides distasonis | ↓ | Odoribacter sp. | ↓ |
| Ureaplasma sp. | ↓ | [Ruminococcus] gnavus | ↓ | Enterococcus sp. | ↓ |
| Anaeroplasma sp. | ↑ | Bacteroides acidifaciens | ↑ | Coprococcus sp. | ↓ |
| Bacteroides acidifaciens | ↑ | Dorea sp. | ↓ | ||
| Anaerotruncus sp. | ↑ | Akkermansia muciniphila | ↑ | ||
| Ruminococcus sp. | ↑ | Parabacteroides sp. | ↑ | ||
| Prevotella sp. | ↑ | Bacteroides sp. | ↑ | ||
| Rikenella sp. | ↑ | Parabacteroides distasonis | ↑ | ||
| Bifidobacterium pseudolongum | ↑ | ||||
| Allobaculum sp. | ↑ | ||||
Table 2.
Differentially represented metabolic pathways involved in vitamin B12 synthesis according to the results of multiple Mann–Whitney tests with the two-stage step-up method (Benjamini, Krieger, and Yekutieli) (false discovery rate Q = 5%). P-values less than 0.05 were considered to indicate statistical significance.
| Pathways with decreased representation in db/db mice fed a regular chow diet compared to a control group (p<0.01, q<0.01) | Pathways with decreased representation in C57Bl6/spf mice fed a high fat diet compared to a control group (p<0.001, q<0.001) |
|---|---|
|
|
Table 3.
Differentially represented enzymes involved in vitamin B12 synthesis in different groups of mice according to the results of multiple Mann–Whitney tests with the two-stage step-up method (Benjamini, Krieger and Yekutieli) (false discovery rate Q = 5%). P values less than 0.05 were considered to indicate statistical significance. a. Comparison in BL/SD and BL/HFD groups; red cells indicate decreased enzyme representation in HFD fed mice; b. Comparison in BL/SD and DB/SD groups; red cells indicate decreased enzyme representation in db/db mice; c. Comparison in BL/HFD and DB/SD groups; red cells indicate decreased enzyme representation in db/db mice. BL/SD, C57Bl6/spf mice fed a standard diet; BL/HFD, C57Bl6/spf mice fed a high fat diet; DB/SD, db/db mice fed a standard diet.
| Enzymes | a.SD vs. HFD |
b.SD vs. DB |
c.HFD vs. DB |
| Precorrin-3B synthase | |||
| Aquacobalamin reductase | |||
| Cob(II)yrinic acid a,c-diamide reductase | |||
| Cobalt-precorrin-6A reductase | |||
| Precorrin-6A reductase | |||
| Precorr in-2 dehydrogenase | |||
| Uroporphyrinogen-III C-methyltransferase | |||
| Precorrin-2 C(20)-methyltransferase | |||
| Precorrin-3B C(17)-methyltransferase | |||
| Precorrin-6B C(5,15)-methyltransferase (decarboxylating) | |||
| Precorrin-4 C(11)-methyltransferase | |||
| Cobalt-factor II C(20)-methyltransferase | |||
| Precorrin-6A synthase (deacetylating) | |||
| Cobalt-precorrin-5B (C(1))-methyltransferase | |||
| Cobalt-precorrin-6B (C(15))-methyltransferase (decarboxylating) | |||
| Cobalt-precorrin-4 methyltransferase | |||
| Cobalt-precorrin-7 (C(5))-methyltransferase | |||
| Nicotinate-nucleotide--dimethylbenzimidazole phosphoribosyltransferase | |||
| Cob(I)yrinic acid a,c-diamide adenosyltransferase | |||
| Adenosylcobinamide kinase | |||
| L-threonine kinase | |||
| Adenosylcobinamide-phosphate guanylyltransferase | |||
| Adenosylcobinamide-GDP ribazoletransferase | |||
| Adenosylcobalamin/alpha-ribazole phosphatase | |||
| Adenosylcobinamide hydrolase | |||
| Vitamin B12-transporting ATPase | |||
| Cobalt-precorrin 5A hydrolase | |||
| Threonine-phosphate decarboxylase | |||
| Sirohydrochlorin cobaltochelatase | |||
| Sirohydrochlorin ferrochelatase | |||
| Cobalt-precorrin-8 methylmutase | |||
| Precorrin-8X methylmutase | |||
| Adenosylcobinamide-phosphate synthase | |||
| Adenosylcobyric acid synthase (glutamine-hydrolyzing) | |||
| Cobyrinate a,c-diamide synthase (glutamine-hydrolyzing) | |||
| Hydrogenobyrinic acid a,c-diamide synthase (glutamine-hydrolyzing) | |||
| Cobaltochelatase |
Table 4.
Spearmen correlations evaluated for the representation of bacteria species in microbiota of HFD fed mice and enzymes for cobalamin biosynthesis according to the data of metagenome sequencing. Green cells show positive correlations (P < 0.05), pink cells show negative correlations (P < 0.05), black cells show non-significant correlations (P > 0.05).
| g__Bacteroides; s__uncultured_bacterium | g__Muribaculaceae; s__uncultured_bacterium | g__Muribaculaceae; s__uncultured_bacterium | g__Faecalibaculum; s__uncultured_bacterium | s__Enterococcus_sp. | s__Lactobacillus_plantarum | f__Lachnospiraceae; g__uncultured; s__uncultured_bacterium | f__Lachnospiraceae; g__uncultured; s__uncultured_bacterium | g__Butyricicoccus; s__uncultured_bacterium | g__Colidextribacter; s__uncultured_bacterium | g__Colidextribacter; s__uncultured_bacterium | g__Colidextribacter; s__uncultured_bacterium | f__Oscillospiraceae; g__uncultured; s__uncultured_bacterium | g__Akkermansia; s__uncultured_bacterium | g__Akkermansia; s__uncultured_bacterium | |
| Adenosylcobalamin/alpha-ribazole phosphatase | -0,92 | 0,97 | 0,55 | -0,87 | 0,48 | 0,67 | 0,83 | -0,82 | 0,70 | -0,90 | -0,63 | -0,83 | -0,90 | -0,89 | -0,90 |
| Adenosylcobinamide kinase | -0,78 | 0,97 | 0,55 | -0,83 | 0,63 | 0,66 | 0,83 | -0,68 | 0,81 | -0,82 | -0,77 | -0,72 | -0,86 | -0,85 | -0,86 |
| Adenosylcobinamide-GDP ribazoletransferase | -0,77 | 0,97 | 0,60 | -0,87 | 0,65 | 0,70 | 0,85 | -0,70 | 0,70 | -0,82 | -0,82 | -0,75 | -0,86 | -0,85 | -0,86 |
| Adenosylcobinamide-phosphate guanylyltransferase | -0,78 | 0,97 | 0,55 | -0,83 | 0,63 | 0,66 | 0,83 | -0,68 | 0,81 | -0,82 | -0,77 | -0,72 | -0,86 | -0,85 | -0,86 |
| Adenosylcobinamide-phosphate synthase | -0,80 | 0,97 | 0,67 | -0,85 | 0,70 | 0,68 | 0,90 | -0,73 | 0,70 | -0,82 | -0,78 | -0,80 | -0,83 | -0,83 | -0,83 |
| Adenosylcobyric acid synthase (glutamine-hydrolyzing) | -0,87 | 0,97 | 0,63 | -0,77 | 0,70 | 0,57 | 0,90 | -0,73 | 0,81 | -0,82 | -0,65 | -0,78 | -0,83 | -0,83 | -0,83 |
| Cob(I)yrinic acid a,c-diamide adenosyltransferase | -0,82 | 0,97 | 0,25 | -0,62 | 0,34 | 0,32 | 0,61 | -0,62 | 0,59 | -0,90 | -0,28 | -0,63 | -0,90 | -0,89 | -0,90 |
| Cobalt-factor II C(20)-methyltransferase | -0,68 | 0,97 | 0,77 | -0,73 | 0,85 | 0,69 | 0,90 | -0,65 | 0,67 | -0,79 | -0,88 | -0,72 | -0,71 | -0,74 | -0,71 |
| Cobalt-precorrin 5A hydrolase | -0,58 | 0,82 | 0,72 | -0,68 | 0,82 | 0,72 | 0,78 | -0,55 | 0,74 | -0,75 | -0,93 | -0,58 | -0,71 | -0,74 | -0,71 |
| Cobalt-precorrin-4 methyltransferase | -0,58 | 0,82 | 0,72 | -0,68 | 0,82 | 0,72 | 0,78 | -0,55 | 0,74 | -0,75 | -0,93 | -0,58 | -0,71 | -0,74 | -0,71 |
| Cobalt-precorrin-5B (C(1))-methyltransferase | -0,72 | 0,97 | 0,68 | -0,82 | 0,79 | 0,72 | 0,92 | -0,68 | 0,67 | -0,82 | -0,90 | -0,75 | -0,76 | -0,79 | -0,76 |
| Cobalt-precorrin-6A reductase | -0,68 | 0,82 | 0,48 | -0,93 | 0,21 | 0,80 | 0,63 | -0,75 | 0,34 | -0,79 | -0,72 | -0,77 | -0,83 | -0,80 | -0,83 |
| Cobalt-precorrin-6B (C(15))-methyltransferase (decarboxylating) | 0,60 | -0,05 | -0,17 | 0,67 | -0,12 | -0,51 | -0,57 | 0,50 | -0,81 | 0,60 | 0,55 | 0,45 | 0,64 | 0,67 | 0,64 |
| Cobalt-precorrin-8 methylmutase | -0,58 | 0,82 | 0,72 | -0,68 | 0,82 | 0,72 | 0,78 | -0,55 | 0,74 | -0,75 | -0,93 | -0,58 | -0,71 | -0,74 | -0,71 |
| Cobyrinate a,c-diamide synthase (glutamine-hydrolyzing) | -0,82 | 0,97 | 0,68 | -0,67 | 0,83 | 0,53 | 0,91 | -0,68 | 0,81 | -0,79 | -0,67 | -0,73 | -0,76 | -0,78 | -0,76 |
| Cobaltochelatase | 0,52 | -0,87 | -0,82 | 0,62 | -0,76 | -0,70 | -0,71 | 0,62 | -0,29 | 0,74 | 0,82 | 0,67 | 0,69 | 0,72 | 0,69 |
| Hydrogenobyrinic acid a,c-diamide synthase (glutamine-hydrolyzing) | -0,82 | 0,97 | 0,68 | -0,67 | 0,83 | 0,53 | 0,91 | -0,68 | 0,81 | -0,79 | -0,67 | -0,73 | -0,76 | -0,78 | -0,76 |
| Nicotinate-nucleotide--dimethylbenzimidazole phosphoribosyltransferase | -0,85 | 0,97 | 0,60 | -0,75 | 0,76 | 0,55 | 0,93 | -0,72 | 0,81 | -0,82 | -0,68 | -0,77 | -0,81 | -0,83 | -0,81 |
| Precorrin-2 C(20)-methyltransferase | -0,68 | 0,97 | 0,77 | -0,73 | 0,85 | 0,69 | 0,90 | -0,65 | 0,67 | -0,79 | -0,88 | -0,72 | -0,71 | -0,74 | -0,71 |
| Precorrin-2 dehydrogenase | -0,73 | 0,67 | 0,67 | -0,58 | 0,85 | 0,48 | 0,87 | -0,57 | 0,95 | -0,65 | -0,68 | -0,62 | -0,60 | -0,62 | -0,60 |
| Precorrin-3B C(17)-methyltransferase | -0,58 | 0,82 | 0,72 | -0,68 | 0,82 | 0,72 | 0,78 | -0,55 | 0,74 | -0,75 | -0,93 | -0,58 | -0,71 | -0,74 | -0,71 |
| Precorrin-3B synthase | -0,27 | 0,36 | -0,20 | -0,17 | -0,75 | 0,06 | -0,12 | -0,30 | -0,02 | -0,09 | 0,42 | -0,23 | -0,07 | -0,01 | -0,07 |
| Precorrin-4 C(11)-methyltransferase | -0,58 | 0,82 | 0,72 | -0,68 | 0,82 | 0,72 | 0,78 | -0,55 | 0,74 | -0,75 | -0,93 | -0,58 | -0,71 | -0,74 | -0,71 |
| Precorrin-6A reductase | -0,68 | 0,82 | 0,48 | -0,93 | 0,21 | 0,80 | 0,63 | -0,75 | 0,34 | -0,79 | -0,72 | -0,77 | -0,83 | -0,80 | -0,83 |
| Precorrin-6B C(5,15)-methyltransferase (decarboxylating) | -0,68 | 0,97 | 0,67 | -0,83 | 0,69 | 0,74 | 0,80 | -0,65 | 0,67 | -0,82 | -0,88 | -0,70 | -0,86 | -0,85 | -0,86 |
| Precorrin-8X methylmutase | -0,58 | 0,82 | 0,72 | -0,68 | 0,82 | 0,72 | 0,78 | -0,55 | 0,74 | -0,75 | -0,93 | -0,58 | -0,71 | -0,74 | -0,71 |
| Sirohydrochlorin cobaltochelatase | -0,57 | 0,67 | 0,78 | -0,62 | 0,90 | 0,61 | 0,79 | -0,50 | 0,81 | -0,65 | -0,87 | -0,57 | -0,64 | -0,66 | -0,64 |
| Sirohydrochlorin ferrochelatase | -0,73 | 0,67 | 0,67 | -0,58 | 0,85 | 0,48 | 0,87 | -0,57 | 0,95 | -0,65 | -0,68 | -0,62 | -0,60 | -0,62 | -0,60 |
| Threonine-phosphate decarboxylase | -0,88 | 0,97 | 0,73 | -0,68 | 0,70 | 0,59 | 0,90 | -0,78 | 0,81 | -0,82 | -0,62 | -0,82 | -0,71 | -0,73 | -0,71 |
| Uroporphyrinogen-III C-methyltransferase | -0,72 | 0,97 | 0,68 | -0,82 | 0,79 | 0,72 | 0,92 | -0,68 | 0,67 | -0,82 | -0,90 | -0,75 | -0,76 | -0,79 | -0,76 |
Disclaimer/Publisher’s Note: The statements, opinions and data contained in all publications are solely those of the individual author(s) and contributor(s) and not of MDPI and/or the editor(s). MDPI and/or the editor(s) disclaim responsibility for any injury to people or property resulting from any ideas, methods, instructions or products referred to in the content. |
© 2024 by the authors. Licensee MDPI, Basel, Switzerland. This article is an open access article distributed under the terms and conditions of the Creative Commons Attribution (CC BY) license (http://creativecommons.org/licenses/by/4.0/).
Copyright: This open access article is published under a Creative Commons CC BY 4.0 license, which permit the free download, distribution, and reuse, provided that the author and preprint are cited in any reuse.


