Submitted:
29 March 2024
Posted:
29 March 2024
You are already at the latest version
Abstract
Shafts with a stepped shoulder are particularly well known in the field of drive technology. In combination with a form-fit shaft–hub connection, the shaft shoulder fixes the hub on the shaft as well as the absorption of the axial forces. With profiled shafts, there is a notch overlay in the shaft shoulder, involving the shaft shoulder and profile. If the hub is also connected with the profiled shaft, the hub edge acts as an additional notch in the shaft shoulder area. The multiple resulting notches have not previously been part of research activities in the field of innovative trochoidal profile connections. Compared to conventional positive-locking connections, such as the keyway connection or the involute splined shaft profile, the favourable features of trochoidal profiles have only been based on connections with smooth shafts without a shoulder in previous studies. Accordingly, this article addresses the numerical and experimental investigations of trochoidal profile connections with offset shafts for pure torsional loading. Focusing on a hybrid trochoid with four eccentricities and six drivers, a well-founded numerical and experimental investigation was carried out with numerous fatigue tests. In addition, the influence of a shaft shoulder was also demonstrated on simple epi- and hypotrochoidal profiles.
Keywords:
shaft shoulder
; form-fit shaft and hub connections
; trochoidal profiled shafts
; torsional loaded connection
; fretting fatigue
1. Introduction
The trochoidal shaft-hub-connections have great mechanical advantages compared to the conventional form-fit connections and have found industrial interest / applications in the recent years. Numerous works e.g. [1,2,3,4,5,6] have investigated the properties of such professional connections, which have focused on the profile contour for the prismatic shape without of the shaft shoulder (smooth shaft).
In practical applications, shaft shoulders are provided due to the design of the shaft. These cause an additional notch, which influences the strength of the shaft or the connection. The shoulder effects can be superimposed with the effects of fretting corrosion in the connection, which can be varied depending on the distance between the hub edge and the shaft shoulder as well as profile geometry [7].
In the present work, the numerical and the experimental investigations of trochoidal shaft-hub connections were carried out and the influences of a shaft shoulder on the stresses and on the fatigue limit were studied.
1.1. Profile Geometry
The geometric description of different types of trochoids was presented in detail in [8]. Figure 1 shows the high geometric variability in the hybrid trochoids when changing the profile parameters main eccentricity e0 (top row) and number of flights n (bottom row). Increasing both profile parameters results in an increasing degree of positive locking when the profile is used as a form-fit shaft and hub joints.
The geometric generation of hybrid trochoids was described in detail in [8], which is why it will not be discussed in detail here (see also [1] and [3]).
The so-called M-profiles, as representatives of the hybrid trochoids, can be described in general according to Eq. (1) and Eq. (2) for the Cartesian x- and y-coordinates:
Here,
- r: nominal radius;
- fx1(e0) … fxi(e0) and fy1(e0) … fyi(e0): single eccentricities as functions of the main eccentricity e0;
- α1… αi: functions of the parameter angle t and the number of corners n.
Due to any number of individual eccentricities e1 to ei, which, in turn, represent functions of the main eccentricity e0 and the number of carriers n (see [1]), the hybrid trochoids have the already mentioned high geometric adaptability compared to trochoids with only one profile eccentricity. The profile contour shown in Figure 2 represents a hybrid trochoid with four single eccentricities and is the focus of this article. The results for this profile type largely originate from a DFG (Deutsche Forschungsgemeinschaft )project [7].
This profile was optimized for an application in relation to a feather key connection [7]. Accordingly, the profile in Figure 2 with the designation M6-T04_e0.131 used in the following procedure has n = 6 drivers with four individual eccentricities depending on a main eccentricity of e0 = 0.131 mm.
The results of the numerical investigations on the influence of a shaft shoulder on the stress state in the connection under static torsional load are presented below. The dynamic load-bearing behaviour is also discussed in a direct comparison of connections with a smooth shaft (without shoulder) and a stepped shaft on the basis of component tests using Hück's stair-step method [9].
2. Numerical Investigations of Static Torsional Load
In order to determine the influence of a shaft shoulder on the mechanical stress load, connections with smooth and stepped M-profile shafts were simulated and the obtained results were compared. The term smooth shaft is used here for a shaft without a shaft shoulder. The basis for this comparison was the M6-T04_e0.131 profile shown in Figure 2. For the simulation, a static torsional load was used.
2.1. FE Model Structure
In order to reduce the computational effort, only one symmetry unit of the connection was modelled for the FEA (here, one-sixth of the complete connection). Figure 3 shows the basic model structure.
It is known from numerous numerical studies, e.g., [5] and [6], that the maximum stress occurs in the contact between the shaft and the hub in the area of the hub edge in the case of pure torsion load. With this in mind, the mesh density was increased in this area, as shown in Figure 3. The FE model was mainly meshed with fully integrated hexahedral elements. The core of the shaft and small areas on the outer diameter of the hub, which are not relevant for evaluation, have pentahedron elements ("wedge" elements). The shaft was clamped across all nodes on the end face (see no. 1 in Figure 3). However, the nodal displacements in the z-coordinate direction were left free due to the curvature of the profile cross-section. For a stable calculation, all nodal displacements on the shaft axis in the three coordinate directions were blocked (see no. 2). The static torsional moment Mt was introduced into the connection by means of a reference node, which was connected to all nodes on the outer diameter of the hub via rigid body elements (see No. 3). Due to the thick-walled nature of the hub, there was no influence of the boundary condition on the outer diameter on the stress state in the joint. A coefficient of friction of µ = 0.12 was simulated in the contact. The fit between shaft and hub has an influence on the mechanical stress in the contact area, as shown by the authors of [7]. However, this influencing parameter is not part of this article, which is why an idealized zero clearance between the shaft and hub was simulated in the FEA. Consequently, a node-on-node modelling of the shaft and hub was applied in the contact area.

Table 1.
This is a table. Tables should be placed in the main text near to the first time they are cited.
Table 1.
This is a table. Tables should be placed in the main text near to the first time they are cited.
| No. | geometry | boundary conditions |
| 1 | nodes on end face of shaft | ux=uy=0 |
| 2 | nodes on end face of shaft | ux=uy= uy =0 |
| 3 | nodes on outer diameter of the hub | torsional moment Mt) |
| 4 | contact surface | µ = 0,12 |
On the basis of typical damage patterns on trochoidal profile joints, as shown for example on an M6 profile on the basis of dynamic component tests in [7], the following stress variables were selected for numerical investigations:
- -
- Von Mises stress σv,mises;
- -
- Maximum principal stress σ1;
- -
- Contact normal stress σnn.
2.2. Load Condition in the Connection with Smooth Profile Shaft
In the first step, the M6 profile connection with a smooth shaft was simulated. It formed the reference for the following comparative tests. A static torsional moment of Mt = 600 Nm and linear–elastic material behaviour was selected. As can be seen in Figure 4, based on the numerical distribution of the equivalent stress σv,mises, there was a localized increase in stress in the joint between the shaft and the hub in the hub edge area. This was caused by the stiffness leap due to the hub, which overlayed the flank intervention between the shaft and hub at this point.
Figure 5 shows the curves of the relevant stress variables in the circumferential direction via a symmetry unit for the shaft. Due to the symmetrical stress distribution in pure torsion, this representation is sufficient. The arc length L of a symmetry unit and the curvilinear coordinate ω were introduced for visualization purposes. The evaluation was at the axial position of the hub edge.
The normal contact stress σnn shows the range in which there is flank contact between the shaft and hub. Values of σnn > 0 N/mm² correspond to a contact. Outside this range, the connection opens up. Shortly before the flank engages, a maximum of the maximum principal stress σ1 is formed on the side of the flank subject to tensile stress. The comparative stress σv,mises is also shown. Only the shaft was analysed numerically, as it generally fails in combination with a sufficiently thick-walled hub, as in this study. The curves from Figure 5 serve as reference for the following procedure.
2.3. Superimposed Influence of the Hub Edge and the Shaft Shoulder
On the real component, the modelled smooth profiled shaft transitions into the cylindrical part via a bonded run-out, as shown in Figure 6 (left). The shape of the run-out depends on the underlying manufacturing process for the trochoidal profile. In the case of a bonded run-out, however, no defined axial alignment of the hub on the profiled shaft is possible. In technical applications, the shaft shoulder therefore becomes established as a contact shoulder for a pushed-on hub, as can be seen for the M6-T04_e0.131 profile in Figure 6 on the right. The profile-following rounding radius in the shaft shoulder here is rs = 1 mm. This results in a double notch from the M6 profile contour and shaft shoulder, which is part of the investigations below. A profile-following (see e.g., DIN 509 [10]) undercut may also be conceivable at this point.
As the hub is shifted up to the shaft shoulder, this double notch is superimposed by the hub edge as a further notch. In order to determine the local stress superimposition in the shaft shoulder without the influence of the hub under static torsional load, the distance a of the hub edge from the shaft shoulder was defined according to Figure 7. At a = 0 mm, the hub comes into contact with the shoulder.
Figure 8 shows the distribution of the failure-critical maximum principal stress σ1 with a torsional load and a distance of a = 4 mm between the hub edge and the shaft shoulder. It can be seen here that there is an overstressing in the area of the driver foot of the M6 profile in the fillet radius rs. Furthermore, there is a local stress maximum at the hub edge analogous to the result from Section 3.2. The spatial separation of the two notch locations is clearly visible here.
In Figure 9 (left), the axial course of the maximum principal stress σ1 in the z direction (see also Figure 7 on the right) is shown by the maximum of σ1,max = 207.7 N/mm² in the fillet radius rs of the shaft shoulder right into the joint. The two extreme points in the fillet radius rs and in the area of the hub edge at z = 4 mm are clearly recognisable. Here, the shaft shoulder represents a more critical notch point.
Figure 9 on the right shows the dependence of the global stress maximum σ1,max on the entire shaft as a function of variable distance a. A convergence can be realized here. The most critical stress state occurs at a distance of a = 1 mm. The further the hub edge is pushed in the direction of the shaft shoulder, resulting in an increasing overlap of the notch points, the higher the mechanical stress load becomes.
Figure 10 also provides an insight into the curves of the relevant stress variables in the circumferential direction over a symmetry unit at the hub edge (left) and in the fillet radius rs of the shaft shoulder (right) at a distance of a = 4 mm. The significantly higher level of failure-critical maximum principal stress σ1 in the shaft shoulder is clearly recognisable. Compared to the smooth shaft in Figure 5 on the right, there is even a slight reduction in the maximum principal stress σ1, max at the hub edge. It is assumed that the shaft shoulder represents a kind of relief notch for the stress at the hub edge. However, this does not play a role in the failure of the M6 profiled shaft, as the more critical point is the shaft shoulder.
Based on the numerical results shown, the distance a between the hub edge and the shaft shoulder has a major influence on the maximum stress. However, as the technical application requires the hub edge to be in contact with the shaft shoulder, this distance can be achieved by means of a sufficiently large chamfer on the hub edge. However, a chamfer represents a large geometric difference to the sharp-edged modelled hub edge, which must be investigated in further projects. In addition, the resulting stress increase in the rounding radius rs heavily depends on the profile eccentricity e e0 and the number of drivers n. It can be assumed that a reduction in the eccentricity e, for example, leads to a reduction in the load on the shaft shoulder and, therefore, more favourable behaviour. In the area of the connection, however, this reduction in eccentricity leads to a poorer degree of positive locking and, therefore, to greater slip between the shaft and hub. This results in higher fretting corrosion under dynamic load. However, the component tests of the M6 profile presented below show that the connection fails primarily due to a fretting-initiated crack. This would shift the point of failure from the shaft shoulder into the joint. This conflict of objectives must therefore be analysed in more detail in further investigations.
3. Experimental Investigations
In addition to the extensive FE simulations, dynamic component tests were carried out on the M6-T04_e0.131 profile shown in Figure 2. Besides the influencing parameter shaft shoulder, other parameters such as shaft material, fit between shaft and hub and the manufacturing technology used to produce the profiled shafts were analysed as part of these tests. The comparison of the connection variants was carried out on the basis of fatigue strengths and the resulting notch coefficients determined in accordance with DIN 743 - Part 1 [11]. The results are presented below and provide a good insight into the dynamic torsional load-bearing behaviour of the M6 profile as a function of the mentioned influencing parameters.
3.1. Test Bench and Test Parameters
The dynamic component tests were carried out on the electromechanical unbalance mass test bench shown in Figure 11. The dynamic torsional moment Mt is generated by means of two rotating unbalance masses on the left and right of the oscillating arm. The load amplitude is a function of the speed of the unbalance masses, which are driven purely electrically by a toothed belt drive directly with an electric motor. Furthermore, the connection to be tested is connected to the main shaft via a metal bellows coupling and firmly clamped to the foundation via the hub bolted to the bearing pedestal. The torsional moment Mt is measured with a torque-measuring shaft, which is located between the hub and the bearing block bolted to the foundation, and the torsional angle is measured using a torsional angle sensor at the end of the main shaft. The speed of the electric motor is determined using a speed sensor. The test stand is switched off after the specimen has been cracked when a previously defined limit angle of twist is reached, which is detected by the angle of rotation sensor.
A stress ratio of R = 0.2 was selected for the component tests, which corresponds to a pulsating torsional load. The obtained results are thus comparable to those of prior research, such as [12] and [13]. The test frequencies of the tests documented below corresponded to the set load horizon and were, therefore, variable. Furthermore, the shaft and hub were joined dry and tested without oil lubrication. However, technically relevant lubrication represents a further influencing parameter, which was left out in the present case.
3.2. Influence of a Shaft Shoulder on the Dynamic Transmission Capacity
The dynamic strength limit was determined on the basis of stair-step tests according to Hück [8]. The method will not be discussed in detail here, as it is well documented in [8]. The limit load cycle number was set to NG = 10 million load cycles. This value has become established in the field of positive-locking connections, which fail due to frictional fatigue [4]. In the following procedure, the torsional notch effect numbers βτ could be determined from the achieved endurance limit τtADK by recursively applying the calculation procedure in DIN 743 - Part 1 [10].
In analogy to Section 3, the focus of these investigations is on the shaft shoulder. Connections with smooth M6 profile shafts and stepped shafts were compared, as shown in Figure 12. A uniform joint length of lF = 46 mm and a sufficiently thick-walled hub with a hub outer diameter of daN = 70 mm were selected as the specimen geometry.
As can be seen in Figure 12, a fixed distance of a = 4 mm between the hub edge and the shaft shoulder was set for the stepped shaft. The background to this specification is the notch superposition already discussed in Section 3.3. The numerical investigations at a sufficient distance “a” have shown that the greatest chip mechanical stress is present in the rounding radius rs with a stepped shaft (see also Figure 10). However, as considerable fretting corrosion is to be expected in the dynamic process, particularly due to the tests carried out without oil lubrication, the exact failure location, i.e., shaft shoulder or joint area, should be determined in this way. If the hub had been pushed up to the shaft shoulder, it would not have been possible to clearly determine the cause of failure, i.e., mechanical stresses or frictional loading.
Figure 13 shows the comprehensive results of the step tests. The achieved torsional dynamic strength limits are shown on the left and the calculated torsional notch coefficients βτ on the right. Hubs made of normalized C45R+N were mainly paired with shafts made of the same material.
First of all, the major influence of the underlying manufacturing technology of the M6 profiled shafts is noticeable in the connections with smooth shafts. The hobbed shafts exhibit a 29% increase in endurance limit τtADK compared to the shafts manufactured using the oscillating non-circular turning process. This is reflected in a lower notch coefficient βτ of the hobbed shafts seen on the right in Figure 13. The hubs were all uniformly wire-cut.
The connection with the stepped and non-round turned shaft results in an increase of 16 % with τtADK = 85 N/mm². This comparison confirms the numerical results from Section 3.3, whereby the shaft shoulder represents a relief notch from a stress mechanics point of view. Compared to the FEA results, however, there is an even greater gap here. The tribological stress in the joint provides an explanation for this. Due to the shaft shoulder, the torsional rigidity of the M6 profiled shaft is greater than that of the smooth shaft. This increased torsional rigidity leads, in less relative movement, to the joint between the shaft and hub, which is why the tribological stress is reduced at this point and also has a strength-enhancing effect.
3.3. Interference between Shaft and Hub
It is known from numerical investigations in [14] that a slight interference U between the shaft and hub has a positive effect on the stress state of the joint. In order to confirm this finding purely experimentally, a connection variant with a slight oversize U of ξ = U/da = 0.5 ‰ related to the tip circle diameter da (see Fig 2) was also investigated. Here, too, the FE simulation was confirmed with a slight increase in the endurance limit τtADK by 6 %. In line with this result, the notch coefficient βτ decreases for the oversize variant.
Varying the shaft material from low-strength C45R+N to a hardened and tempered 42CrMoS4+QT results in a 7% reduction in the impact strength, which was not expected. However, tests on simple hypotrochoids in [7] provided a comparable result. The high-strength material is significantly more sensitive to friction loading, which is why the increased strength cannot be utilized under dynamic stress during contact.
Figure 14 shows examples of the load-bearing patterns of three M6 profiled shafts subjected to endurance testing. The smooth shaft in Figure 14 on the left shows the typical crack initiation within the friction-corrosive damaged zone in the area of the hub edge. The crack initially develops in an axial direction. As the dynamic load progresses, a mechanical stress-induced crack growth typical of torsion sets in at an angle of 45° to the shaft axis, as can be seen in the example in the middle. The failure of the smooth shafts therefore occurs in the contact area around the hub edge. The stepped shaft in Figure 14 on the right shows a failure in the rounding radius rs of the shaft shoulder and is thus a purely mechanical stress failure. The distance of a = 4 mm between the hub edge and the shoulder is clearly visible on the basis of the friction-corrosive damaged zone.
The failure modes thus confirm the numerical results from Section 3.2 and Section 3.3 very well. With a stepped shaft, the rounding radius rs is subjected to significantly higher stresses than the joint area, provided that a sufficient distance a is present.
4. Epi- and Hypotrochoidal Connections with Stepped Shaft
In addition to the M6-T04_e0.131 profile, which is a representative of the hybrid trochoids, a simple epi- and a hypotrochoid were also investigated. The term "simple" in this context means that only one profile eccentricity is present. The following section presents purely experimental results for these profiles.
4.1. Geometry of Specimen
The hypotrochoid with n = 3 flights shown in Figure 15 on the left is taken from the standard DIN 3689 - Part 1 [15]. The generation of this profile geometry is not discussed in detail here, as it is well documented in the aforementioned standard [16,17]. A uniform tip circle diameter of da = 40 mm was selected to ensure comparability between the two profiles. The simple epitrochoid in Figure 15 on the right also has n = 3 carriers and was fitted into the same installation space. Its special feature is the flat profile flanks, which have an infinitely large radius of curvature in the driver base. A detailed description of this profile type, including the parameter equations for the Cartesian x- and y-coordinates, can be found in [16,17].
When comparing the two profile cross-sections, the larger root diameter di and, thus, the lower driver height of the E profile is particularly evident. In combination with the more strongly shaped corners, this results in a larger cross-sectional area A. However, the high geometric variability in the trochoids with a constant installation space becomes apparent. Table 2 summarizes an overview of the selected profile parameters for both profile types. The results of the endurance tests are presented in the following section.
4.2. Dynamic Strength under Swelling Torsion
The dynamic tests were carried out in analogy to the M6 profile using the stair-step method for the E and H profile connections, each with three sides and a smooth profile shaft. The test parameters here correspond to those from chapters 3.1 and 3.2. Hubs made of normalized steel C45R+N were paired with shafts made of high-strength steel 42CrMoS4+QT. Furthermore, these profile variants were provided with a slight interference fit due to the geometrically lower degree of form fit. The oversize U in relation to the tip circle diameter da is ξ = U/ da = 0.25 ‰. These are thick-walled hubs with a joint length of lF = 40 mm.
Figure 16 shows the achieved impact strengths and notch action coefficients of both profile types for the load case of pulsating torsion.
Compared to the E3 profile, the H3 profile has an about 3.5 % higher endurance limit of τtADK = 90 N/mm² and, thus, a slightly lower notch effect compared to the E3 profile, as can be seen on the right in Figure 16 in the comparison of the notch effect number βτ. However, as mentioned, these results relate to a profile connection with a smooth shaft.
For the connections with a stepped shaft, however, only three connections were available in the project, which is why it was not possible to run a sequence of steps here and, thus, validly determine the endurance limit τtADK. Based on Figure 17, the procedure for determining the influence of a shaft shoulder on these profile variants is explained using three stitch tests
In Figure 17, the achieved endurance limit τtADK of the stair-step test with smooth shaft (Figure 16) for the H3 profile on the left and E3 profile on the right is marked as a green reference line. In addition, the three stitch tests of the stepped shafts were added. In each case, two tests were carried out with the hub pushed up to the shaft shoulder, corresponding to a distance of a = 0 mm, and one test with a distance of the hub edge to the shoulder of a = 4 mm (analogous to the M6 profile).
For the H3 profile, the load horizon with a torsional stress amplitude of τta = 80 N/mm² resulted in one survivor (0), which reached the number of load cycles N = 10 million, and one fracture (x). This means that this load horizon is no longer in the fatigue strength range, which results in a significant reduction in the endurance limit of τtADK = 90 N/mm² of the smooth shaft. The fracture of the test with a distance a = 4 mm at N = 3.1 million load cycles does not initially suggest any strength-increasing influence of the distance a either. However, the number of samples is not sufficient for a reliable statement in this context.
The E3 profile on the right in Figure 17 shows a similar behaviour when the hub edge is in contact with the shaft shoulder. However, the test for the distance a = 4 mm resulted in a survivor, which indicates an increase in strength.
The experimental results from Figure 17 show a significant reduction in strength for both profile types when the hub edge is in contact with the shaft shoulder and thus confirm the numerically determined exponential increase in the maximum principal stress σ1,max with decreasing distance a in Figure 9 (right). The resulting multiple notches represent the most critical condition. However, the two stitch tests do not replace the complete stair-step test with a valid endurance limit τtADK, which should be determined in further research activities. However, they do indicate a general trend behaviour in this context.
A comparison of the number of load cycles N achieved in the test with stepped shafts generally shows improved notch behaviour with the E3 profile. On average, the number of load cycles N of the three tests is greater here compared to the H3 profile.
5. Conclusion and Outlook
This article addresses the influence of a shaft shoulder on the fatigue strength of trochoidal shaft and hub connections. The results discussed in previous publications on trochoidal profile connections with smooth shafts were evaluated primarily as an idealized reference. The numerical and experimental results discussed here show a large dependence of the static and dynamic torsional transmission capacity on the hub positioning on the offset shaft. The further the hub is pushed in the direction of the shaft shoulder, the more notch overlapping occurs and, thus, the greater the stress increase, which leads to a significant reduction in the endurance limit τtADK under swelling torsional load. It was found that there is a characteristic distance between the hub and the shaft shoulder which results in an inverse, i.e., an increase in the dynamic transmission capacity. However, this characteristic distance is highly dependent on the current trochoidal profile geometry, as shown by the results of the M6 profile compared to the simple epi- and hypotrochoidal profile. It was also proven that the diameter ratio of the shaft shoulder is of great importance. This issue must be investigated more closely in further research efforts in the field of trochoidal connections.
In addition to the shaft shoulder, the shaft material was also varied for the M6 profile. Contrary to expectations, this resulted in a higher notch coefficient βτ for the higher-strength shaft material. As a result, due to the frictional corrosive damage in dynamic operation, the potential of the higher-strength material cannot be utilized due to its greater sensitivity to frictional corrosion.
In addition, a considerable increase in dynamic transmission capability was shown when using a slight interference between the shaft and hub and when using hobbing process to manufacture the profiled shafts.
Compared to the hypotrochoidal profile, the E3 profile has a slightly higher torsional notch coefficient βτ and, therefore, a slightly worse dynamic torsional load-bearing behaviour. In terms of the effect of a shaft shoulder on strength, however, the H3 profile has a slight disadvantage due to its geometry
6. Formula Symbols
| a | Distance of the hub edge to the shaft shoulder |
| A | Surface area |
| da | Tip diameter |
| daN | Outer diameter of the hub |
| di | Root diameter |
| e | Eccentricity |
| e0 | Main eccentricity |
| e1… ei | Single eccentricity |
| lF | Joining length |
| L | Arc length |
| Mt | Torsional moment |
| Mta | Torsional moment amplitude |
| n | Number of corners |
| N | Number of load cycles |
| NG | Limit number of load cycles |
| QA | Diameter ratio |
| r | Nominal radius |
| rs | Fillet radius |
| R | Stress ratio (min/max) |
| t | Parameter angle |
| T | Idealized zero fit |
| ux,y,z | Displacements in the spatial directions |
| U | Interference fit |
| x | Cartesian coordinate |
| y | Cartesian coordinate |
| βτ | Notch coefficient |
| µ | Coefficient of friction |
| ξ | Related oversize |
| σnn | Contact normal stress |
| σv,mises | Von Mises stress |
| σ1 | Maximum principal stress |
| τta | Torsional stress amplitude |
| τtADK | Fatigue strength |
| ω | Running coordinate |
Acknowledgments
The author thanks the German Research Foundation (Deutsche Forschungsgemeinschaft DFG) for funding the research project DFG ZI 1161/3 as well as SEW-Eurodrive GmbH & Co KG DTC Ost for the good co-operation.
References
- Ziaei, M.: Optimale Welle-Nabe-Verbindung mit mehrfachzyklischen Profilen, 5. VDI-Fachtagung "Welle-Nabe-Verbindungen" in Nürtingen, 25./26. September 2012.
- Ziaei, M.: Berechnung der Torsions- und Kontaktspannungen in den neuen nichtevolventischen M-Profilen und Vergleichen mit den genormten evolventischen Zahnprofilen nach DIN 5480, VDI-Verlag GmbH Düsseldorf, 4. Fachtagung Welle-Nabe-Verbindungen VDI-Berichte 2114, 2010, ISSN 0083-5560.
- Ziaei, M. Neue zyklische Profilkonturen – die optimale Alternative für die genormten Zahnprofilverbindungen. Konstruktion 2012, 10. [Google Scholar]
- Ziaei, M.; Selzer M.: Entwicklung kontinuierlicher unrunder Innen- und Außenkonturen für formschlüssige Welle-Nabe-Verbindungen und Ermittlung analytischer Lösungsansätze, Forschungsvorhaben DFG-ZI1161-1/2, Abschlussbericht, Westsächsische Hochschule Zwickau, 2015.
- Selzer, M.; Ziaei, M. Zykloiden höherer Stufe - Alternative für formschlüssige Welle-Nabe-Verbindungen - Teil 1. antriebstechnik Heft 2016, 10. [Google Scholar]
- Selzer, M.; Ziaei, M. Zykloiden höherer Stufe - Alternative für formschlüssige Welle-Nabe-Verbindungen - Teil 2. antriebstechnik Heft 2017, 03. [Google Scholar]
- Ziaei, M.; Sommer H.: Einsetzen der trochoidischen Konturen für formschlüssige Welle-Nabe-Verbindungen in der Antriebstechnik, Forschungsvorhaben DFG-ZI1161-3, Abschlussbericht, Westsächsische Hochschule Zwickau, 2023.
- Ziaei, M. Bending Stresses and Deformations in Prismatic Profiled Shafts With Noncircular Contours Based on Higher Hybrid Trochoids. Applied Mechanics 2022, 3(3). [Google Scholar] [CrossRef]
- Hück, M. Ein verbessertes Verfahren für die Auswertung von Treppenstufenversuchen. Zeitschrift für Werkstofftechnik, Heft 1983, 14, 406–417. [Google Scholar] [CrossRef]
- DIN 509:2022-12, Technical product documentation – Relief grooves – Types dimensions and tolerances, Beuth-Verlag, Berlin 2022-12.
- [11] DIN 743-1:2012-12, Calculation of load capacity of shafts and axles – Part 1: General, Beuth-Verlag, Berlin 2012-12.
- [12] Forbrig, F., Ziaei, M., Selzer M.: Hochfeste formschlüssige Verbindungen unter dynamischer Belastung - Einfluss von Profilkontur, Werkstoff und Fertigung. FVA-Nr. 898-I, IGF-Vorhaben Nr. 21098 BR, Abschlussbericht Heft Nr. 1595, Frankfurt am Main, 2023.
- Abschlussbericht Optimierung des Zahnwellenprofils primär zur Drehmomentübertragung unter Berücksichtigung wirtschaftlicher Fertigungsmöglichkeiten. Forschungsvorhaben Nr. 742 I der Forschungsvereinigung Antriebstechnik e.V., (AiF 18406 BG), Frankfurt/Main, 2018 (FVA-Heft 1316).
- Selzer, M., Ziaei, M.: Rechnerische Ermittlung der Kerbwirkungszahl von Unrundprofilen unter reiner Torsionsbelastung und Vergleich mit dem genormten Zahnwellenprofil nach DIN 5480, VDI-Berichte 2238, Karlsruhe 2014.
- DIN 3689-1:2021-11, Shaft to collar connection - Hypotrochoidal H-profiles - Part 1: Geometry and dimensions. Beuth-Verlag, Berlin 2021-12.
- Ziaei, M.: Torsionsspannungen in prismatischen, unrunden Profilwellen mit trochoidischen Konturen. Forschung im Ingenieurwesen, Springer-Verlag GmbH, 2021. [CrossRef]
- Ziaei, M. Bending and Torsional Stress Factors in Hypotrochoidal H-Profiled Shafts Standardised According to DIN 3689-1. Eng 2023, 4, 829–842. [Google Scholar] [CrossRef]
Figure 1.
Geometric variability in the hybrid trochoid. Increase in the form-fit degree by varying the main eccentricity e0 (top row) and the number of sides number n (bottom row).
Figure 1.
Geometric variability in the hybrid trochoid. Increase in the form-fit degree by varying the main eccentricity e0 (top row) and the number of sides number n (bottom row).
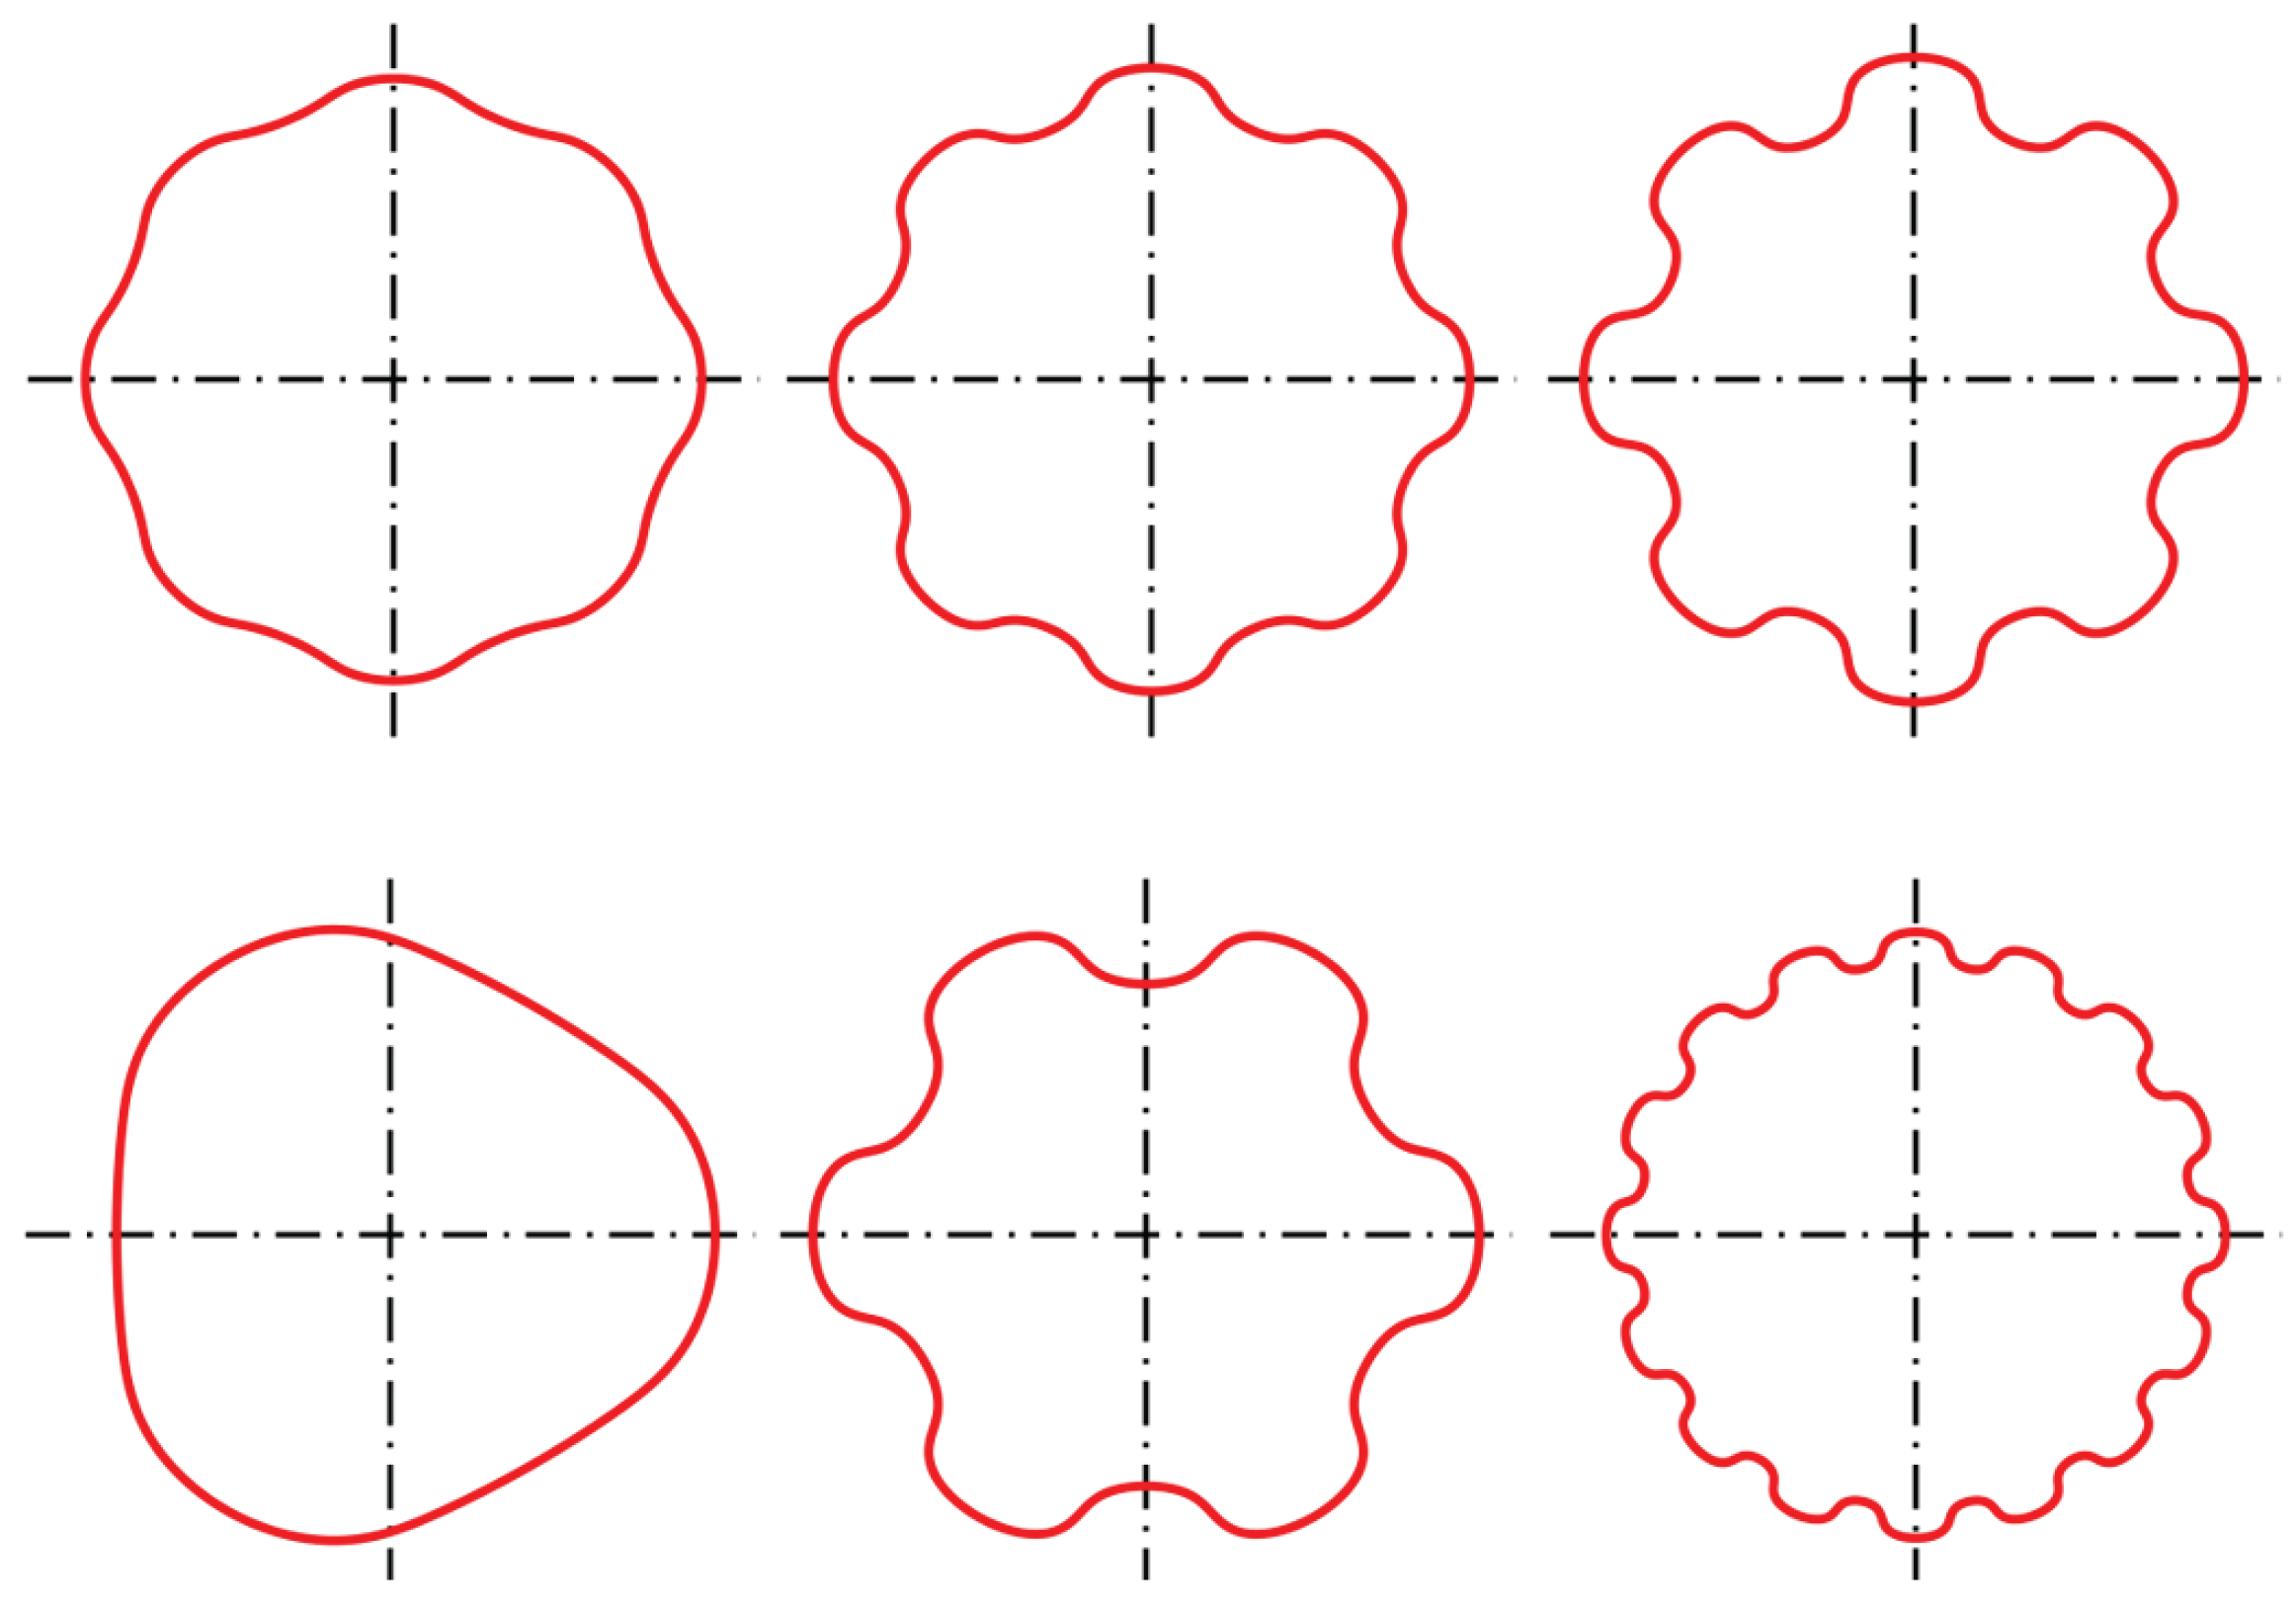
Figure 2.
Geometry of the hybrid trochoid for the numerical and experimental investigations [7].
Figure 2.
Geometry of the hybrid trochoid for the numerical and experimental investigations [7].
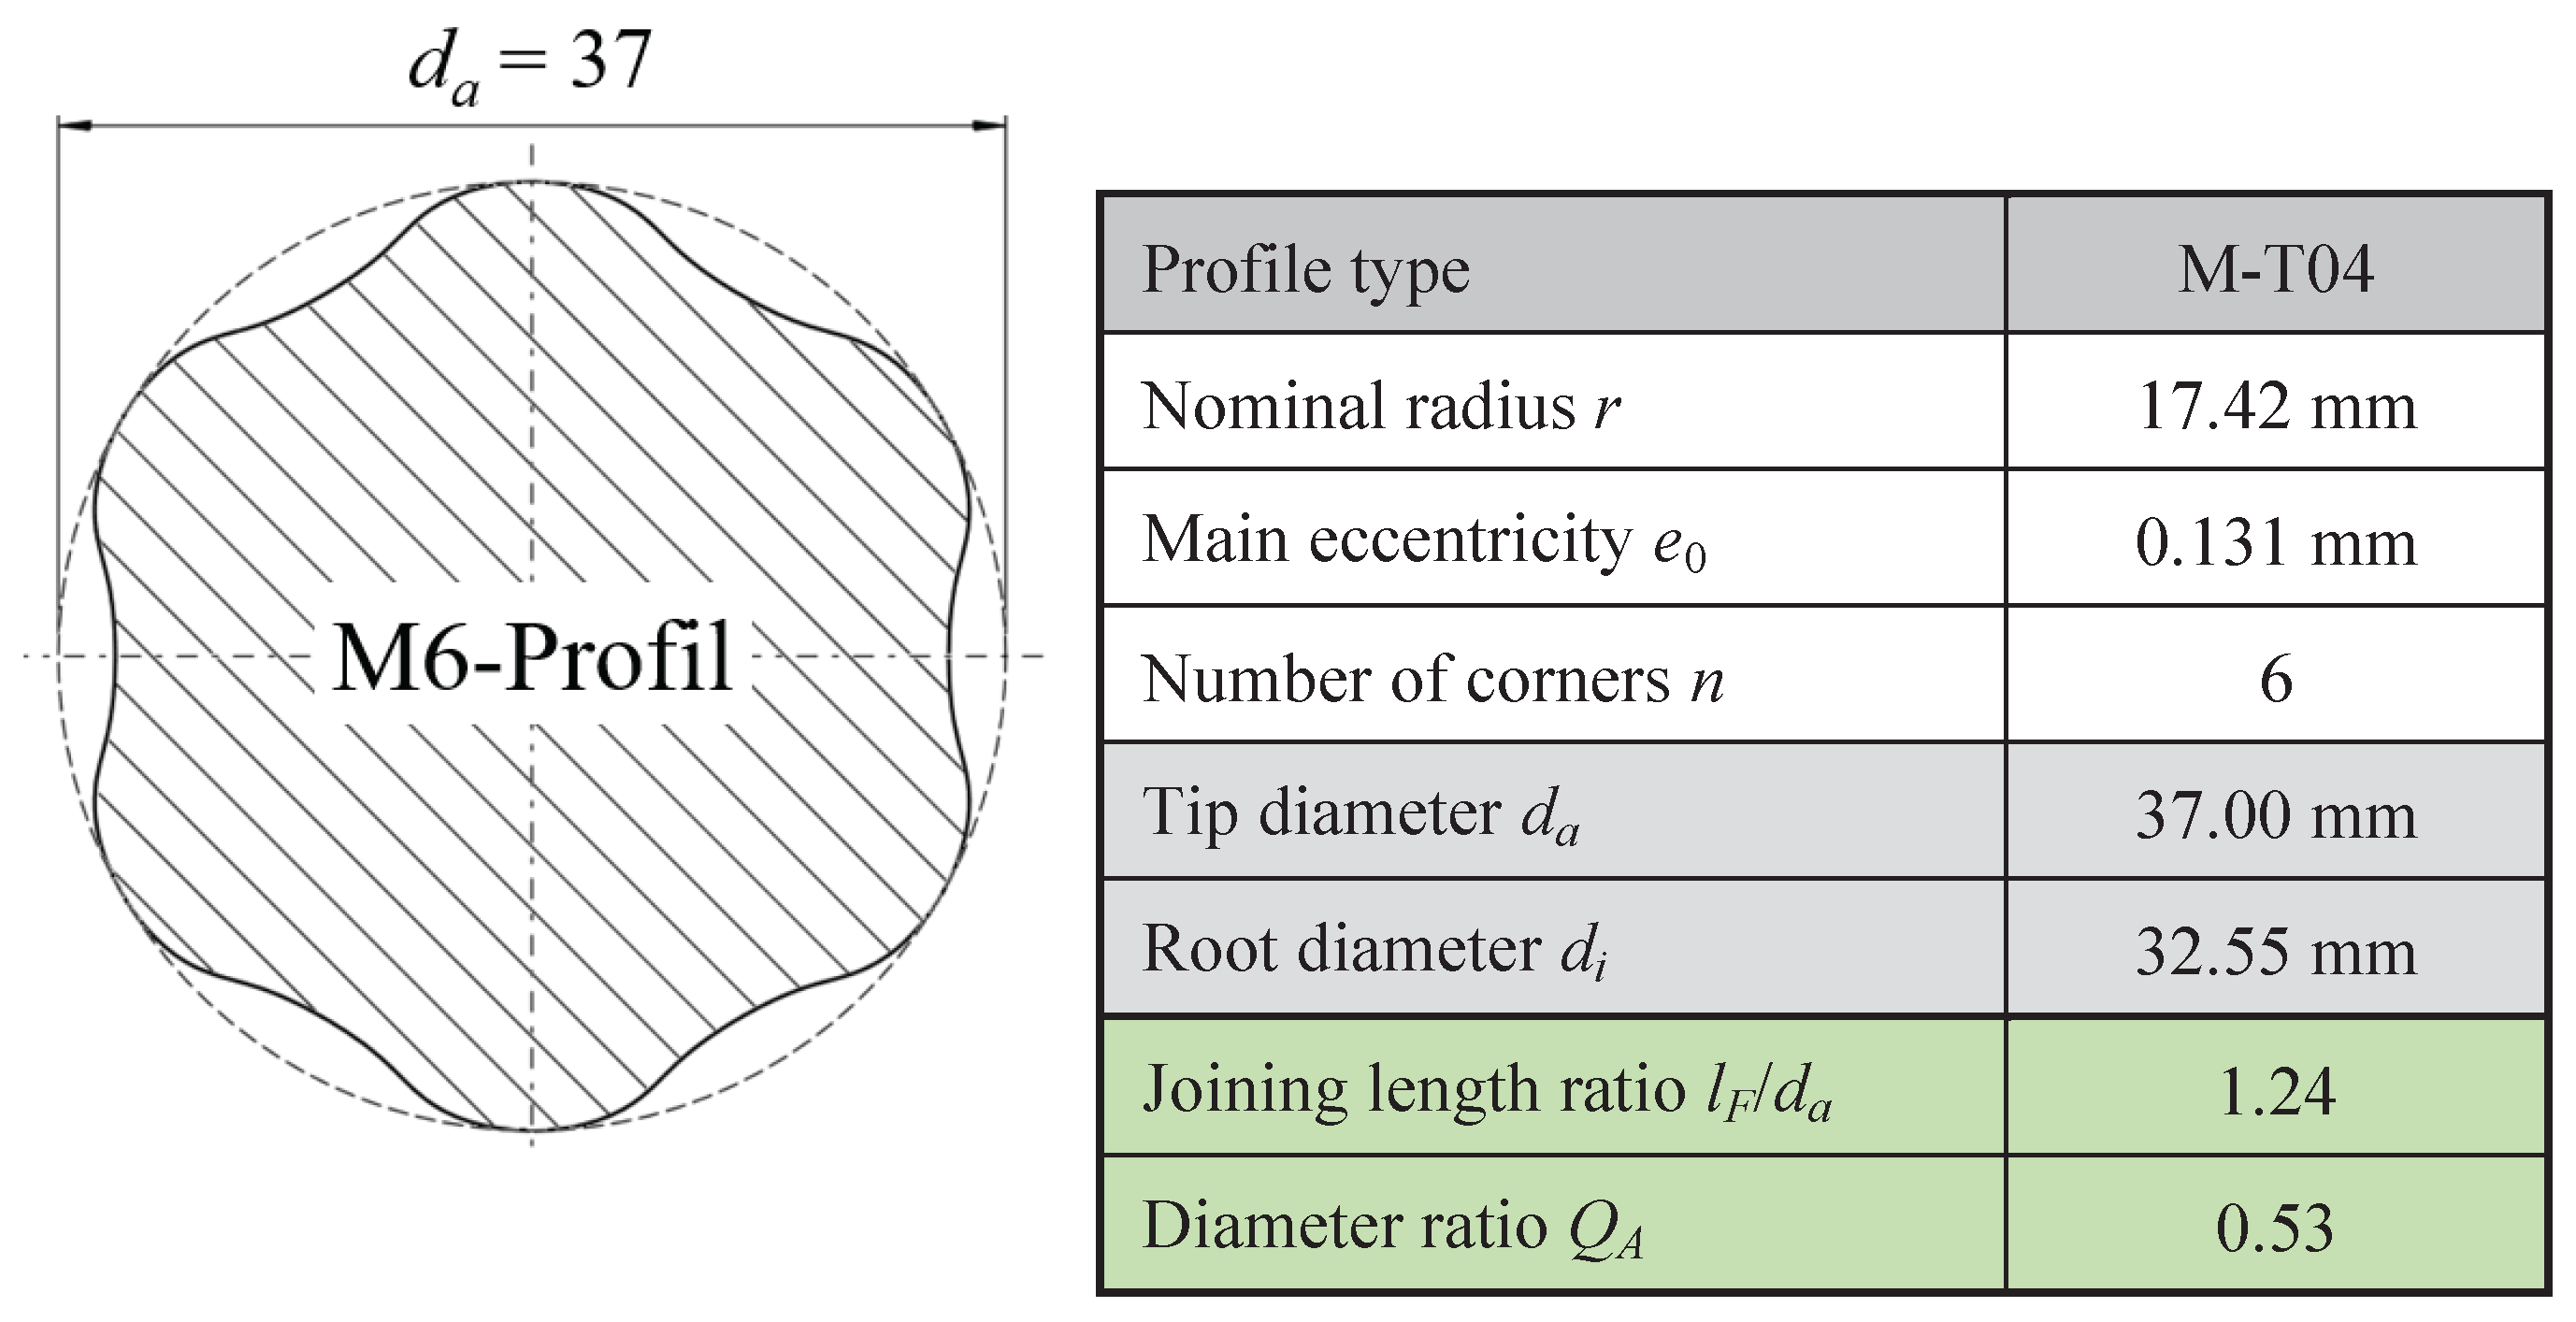
Figure 3.
Illustration of the FE model structure with the boundary conditions, simplified for a sector for the load case of pure torsion.
Figure 3.
Illustration of the FE model structure with the boundary conditions, simplified for a sector for the load case of pure torsion.
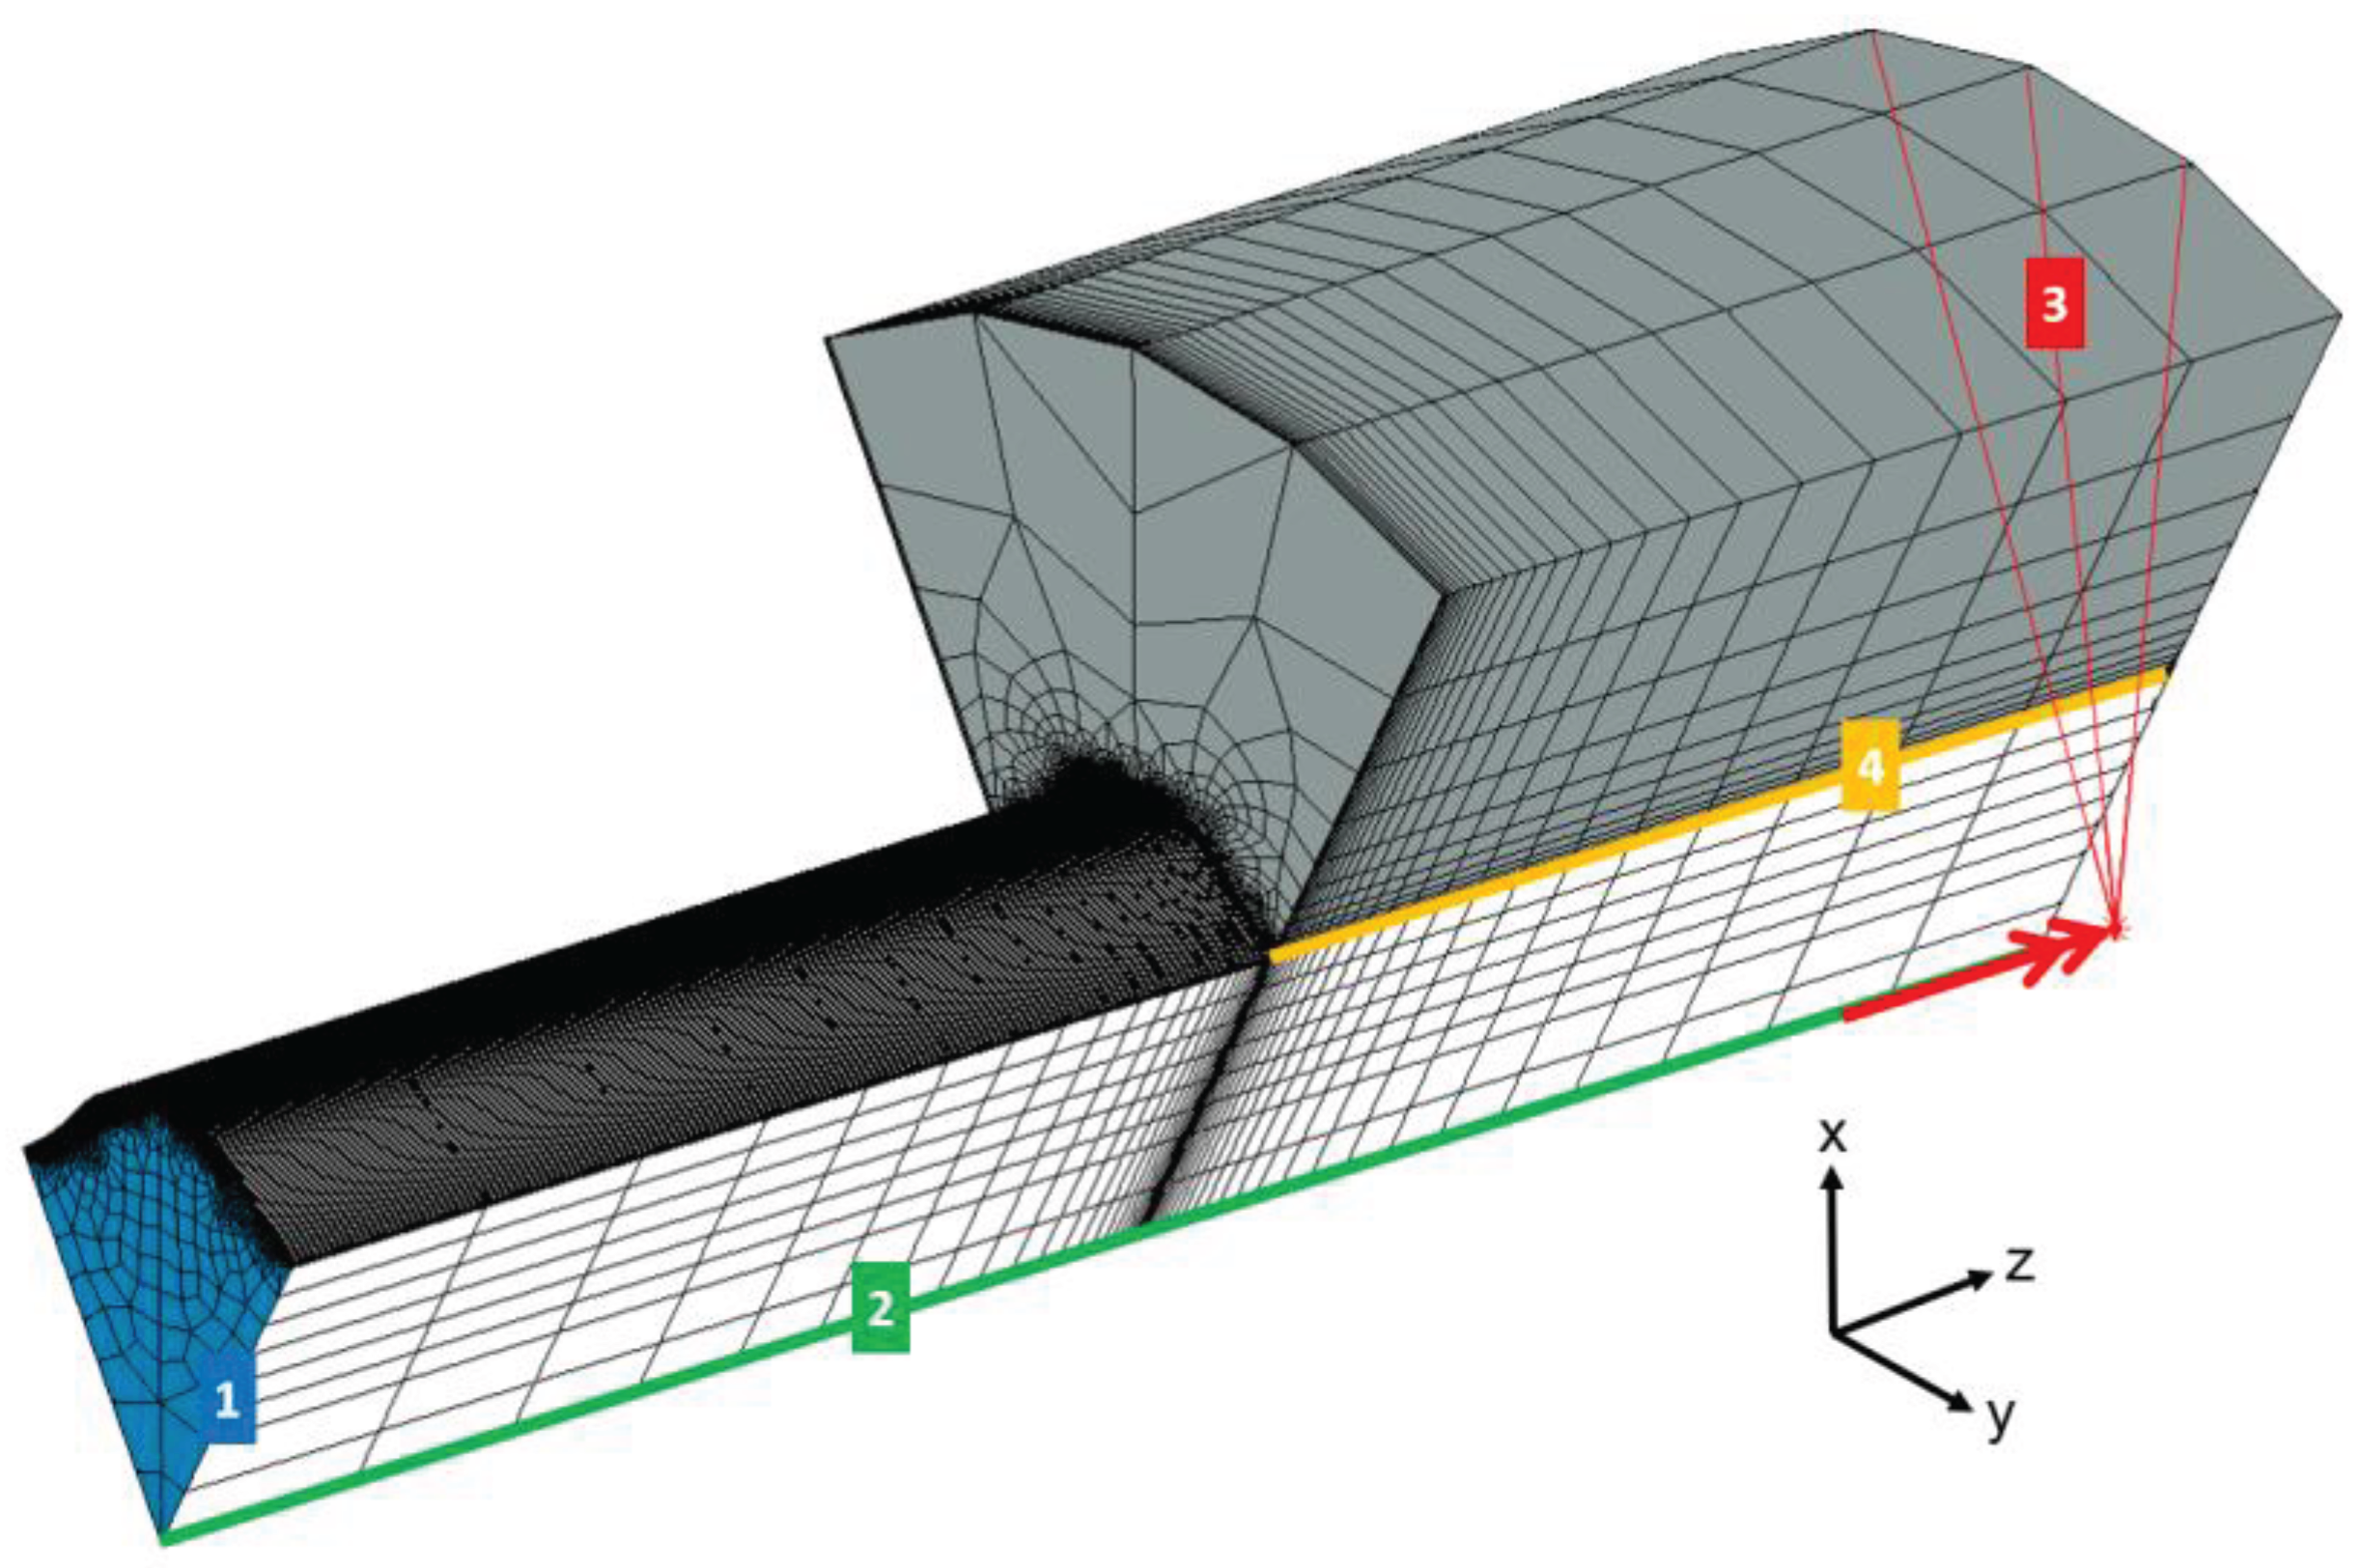
Figure 4.
Local stress increase in the joint between shaft and hub in the area of the hub using the example of the equivalent stress according to Mises σv,mises.
Figure 4.
Local stress increase in the joint between shaft and hub in the area of the hub using the example of the equivalent stress according to Mises σv,mises.
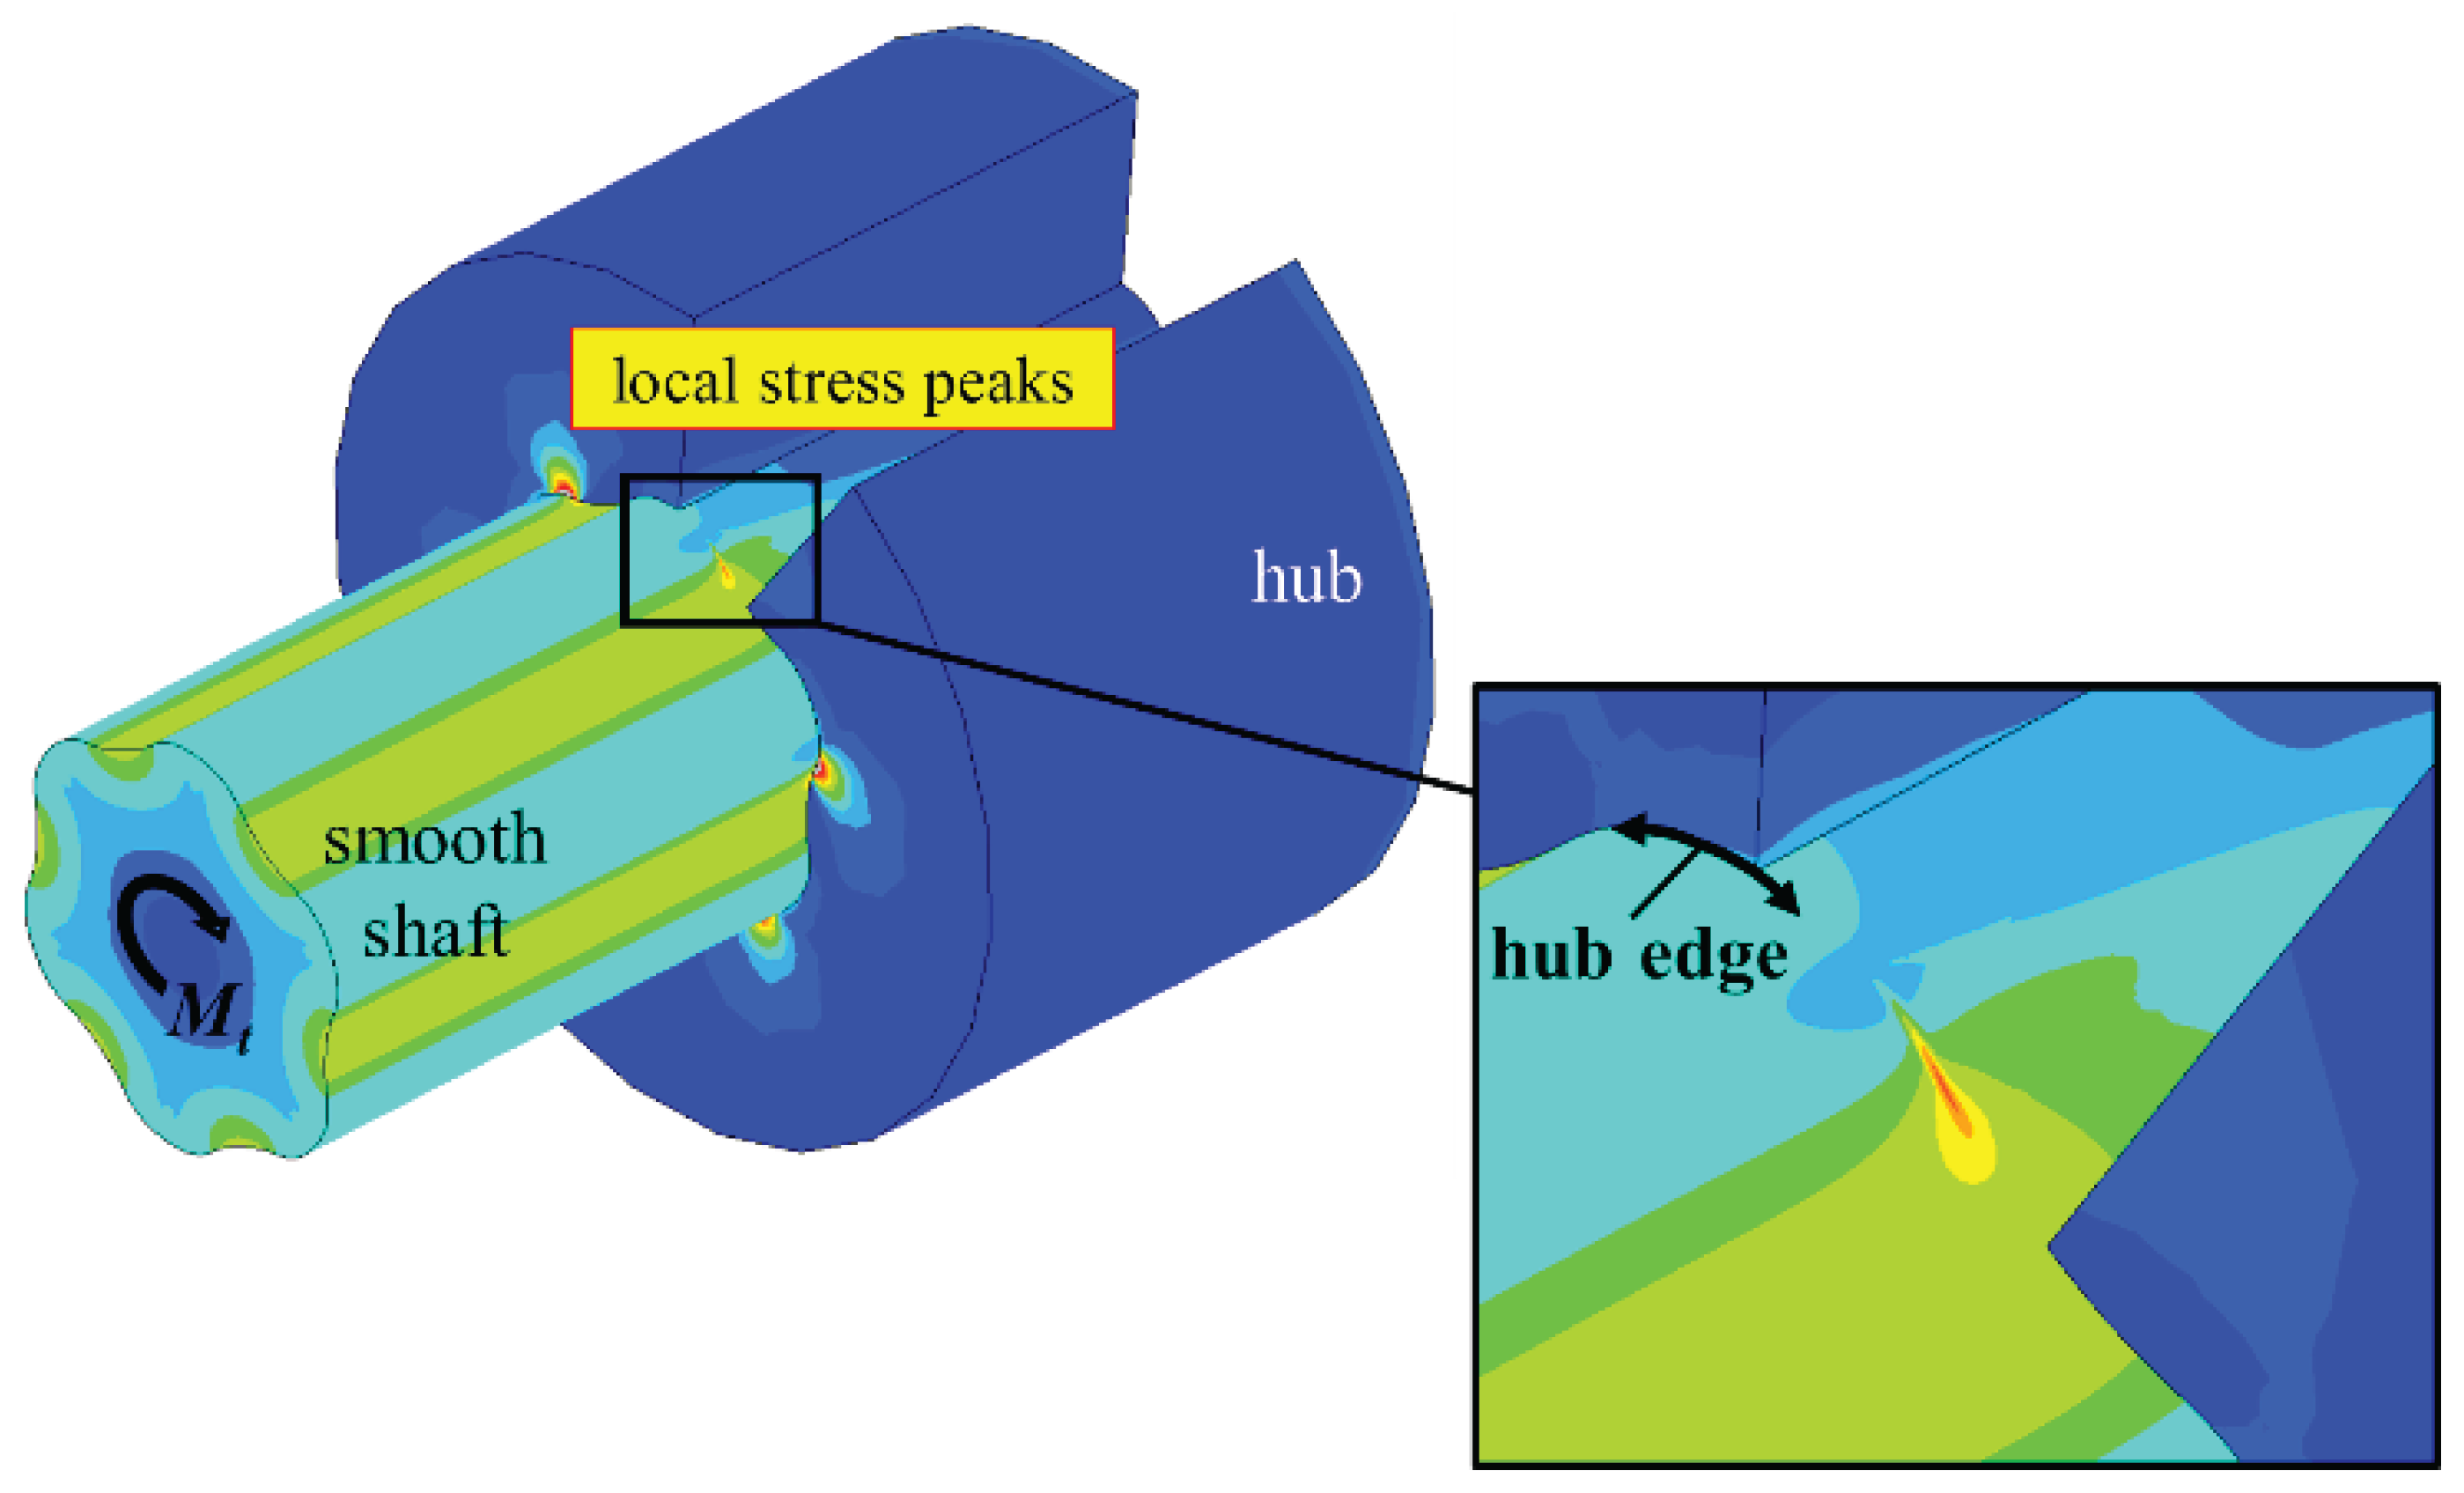
Figure 5.
Curve of the evaluation path between two driver heads of the shaft (left) and representation of the normal contact stress σnn and the maximum principal stress σ1 and the equivalent stress according to Mises σv,mises (right), for Mt = 600 Nm, linear–elastic material behaviour, idealized zero clearance T = 0 µm.
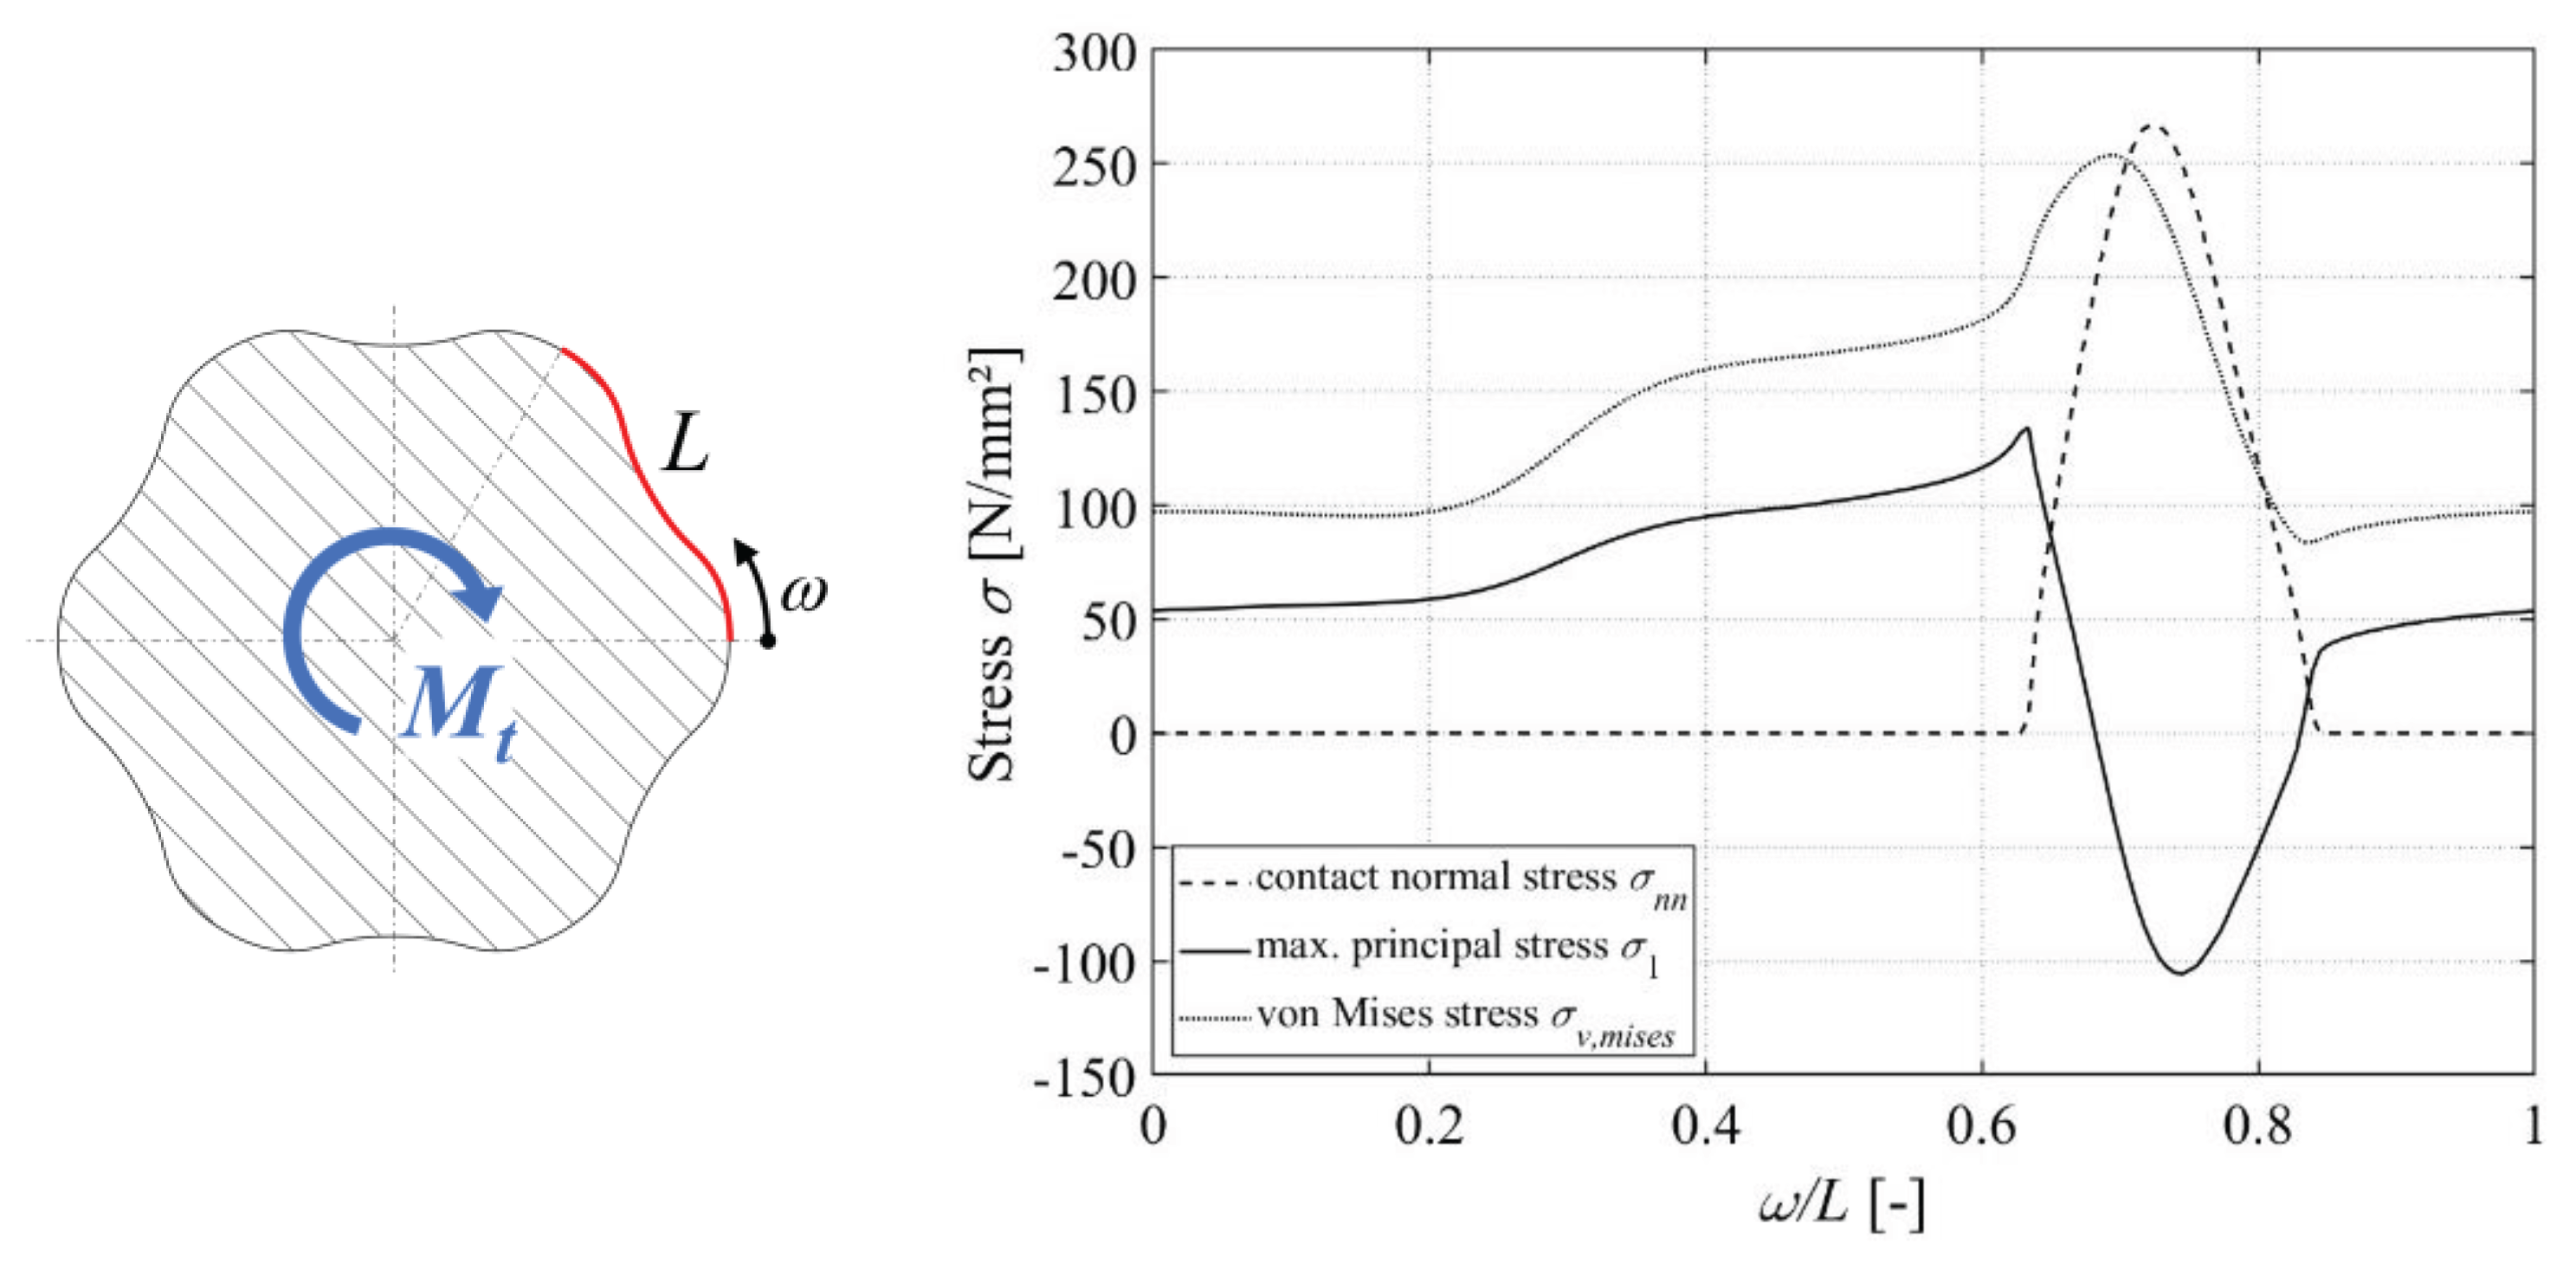
Figure 6.
Smooth shaft with bonded outlet without shoulder (left) and profile-following rounding radius of rs = 1 mm in the shaft shoulder (right).
Figure 6.
Smooth shaft with bonded outlet without shoulder (left) and profile-following rounding radius of rs = 1 mm in the shaft shoulder (right).
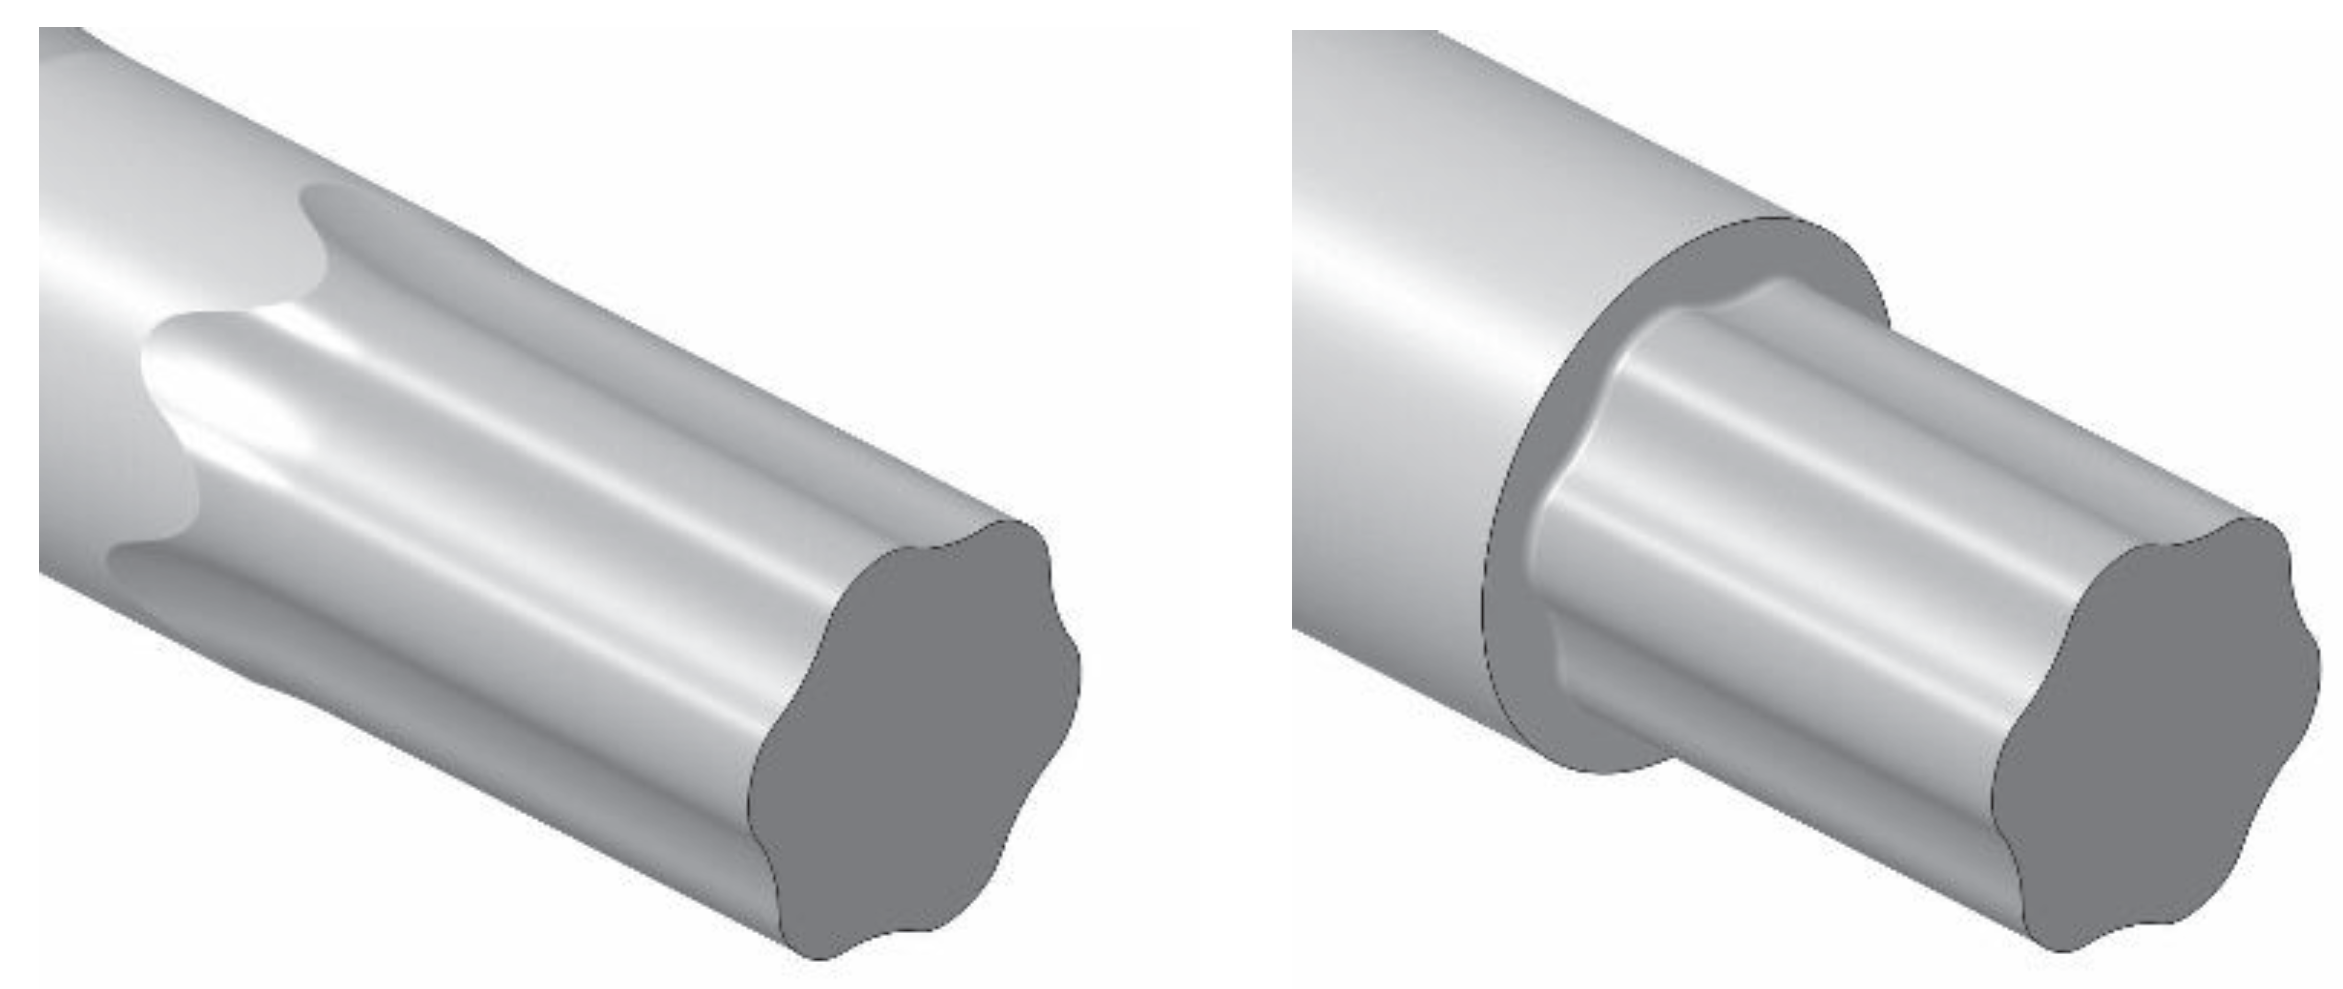
Figure 7.
Hub with stepped M6 profiled shaft indicating the distance a of the hub edge from the shaft shoulder and the fillet radius rs.
Figure 7.
Hub with stepped M6 profiled shaft indicating the distance a of the hub edge from the shaft shoulder and the fillet radius rs.
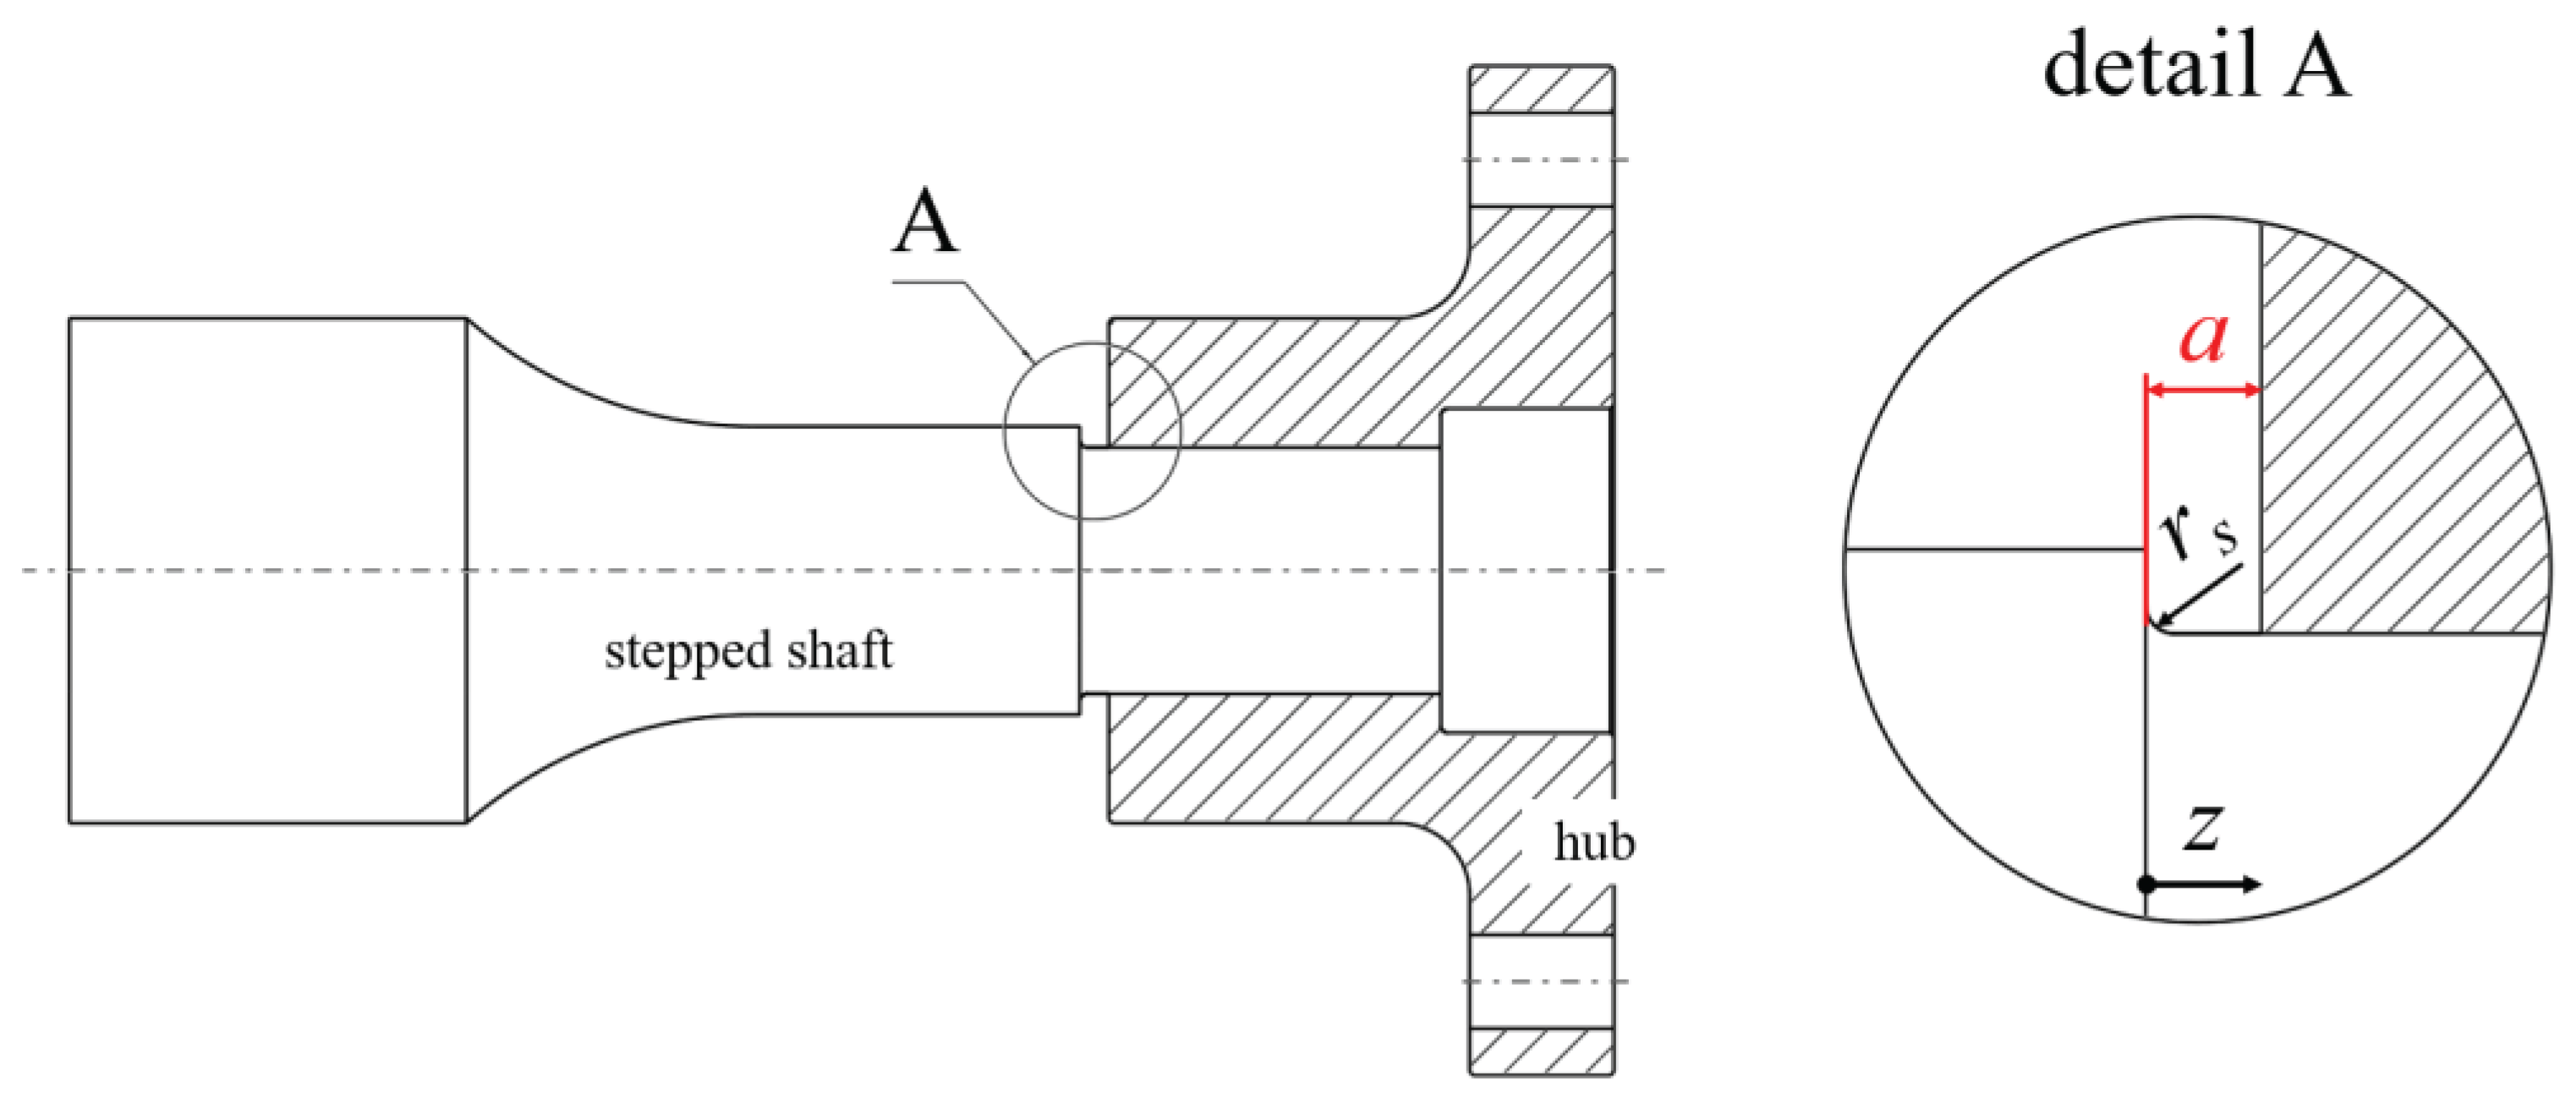
Figure 8.
Distribution of the maximum principal stress σ1 for a stepped M6 profiled shaft with a significant increase in stress in the fillet radius rs of the shaft shoulder and in the area of the hub edge, distance a = 4mm.
Figure 8.
Distribution of the maximum principal stress σ1 for a stepped M6 profiled shaft with a significant increase in stress in the fillet radius rs of the shaft shoulder and in the area of the hub edge, distance a = 4mm.
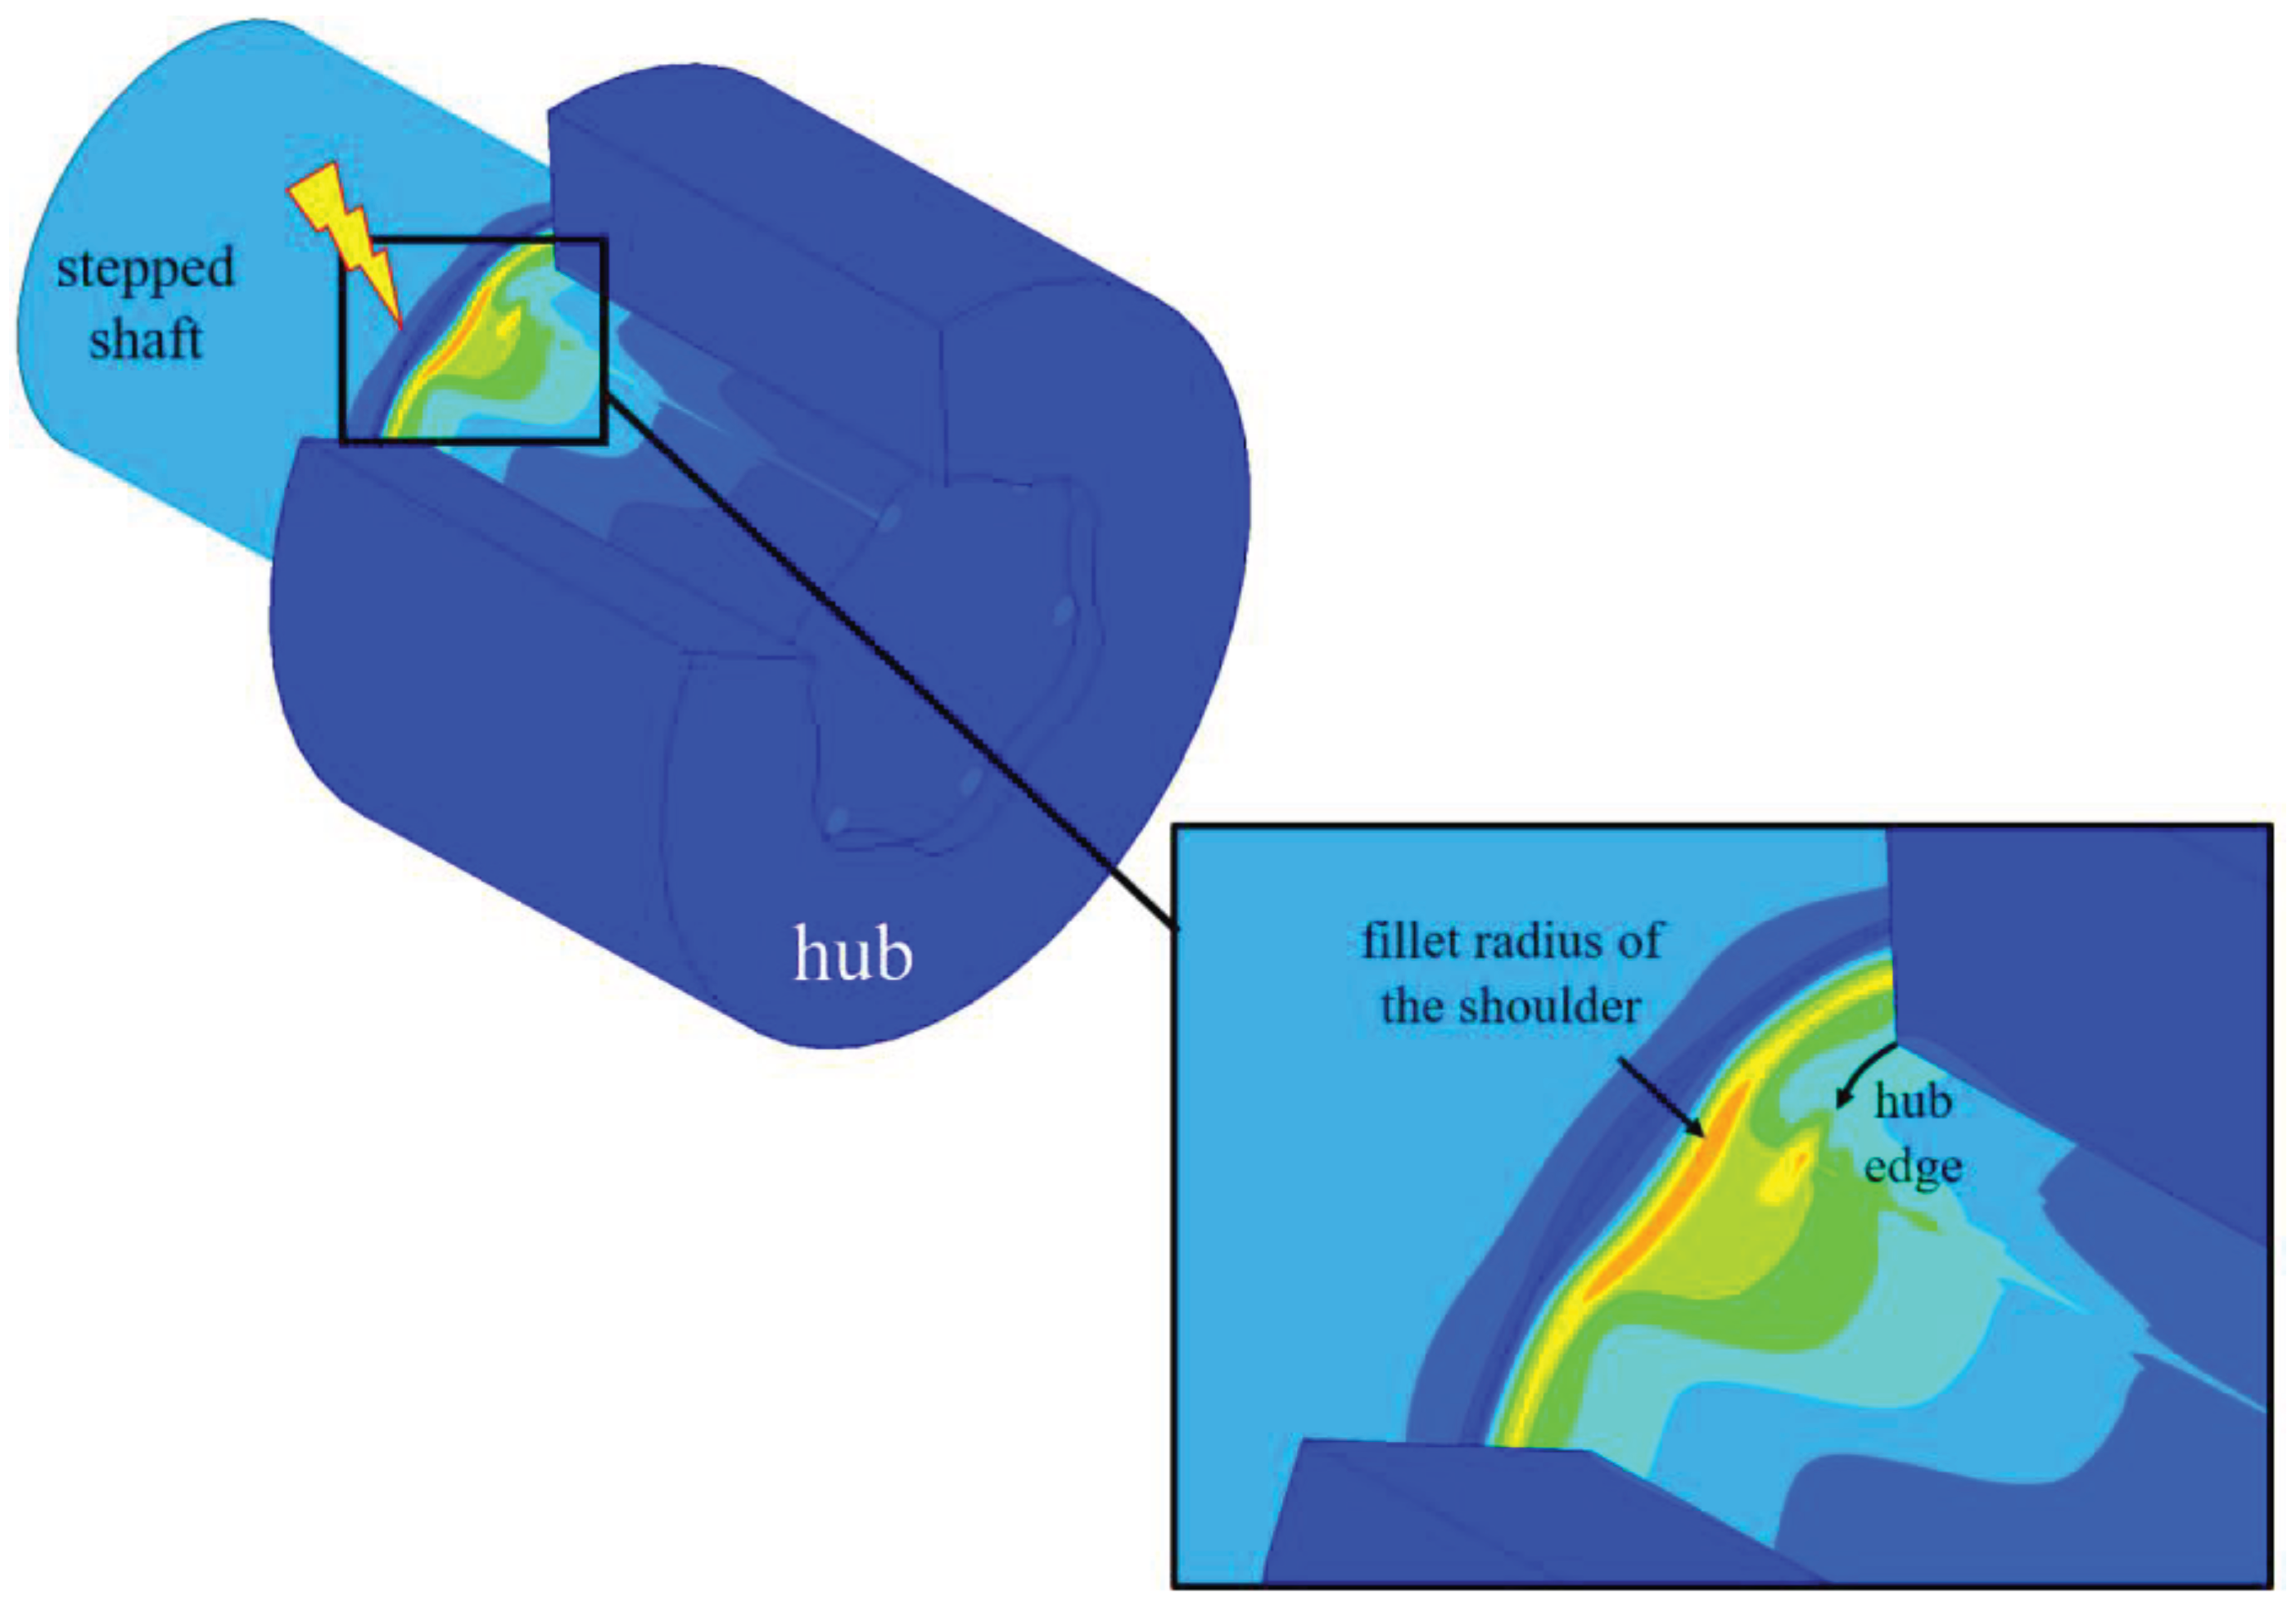
Figure 9.
Axial curve of the maximum principal stress σ1 due to the maximum stress in the rounding radius rs of the shaft shoulder (left) and maximum stress σ1, max as a function of variable distances a of the hub edge from the shaft shoulder (right), Mt = 600 Nm, linear–elastic material behaviour, idealized zero clearance T = 0 µm.
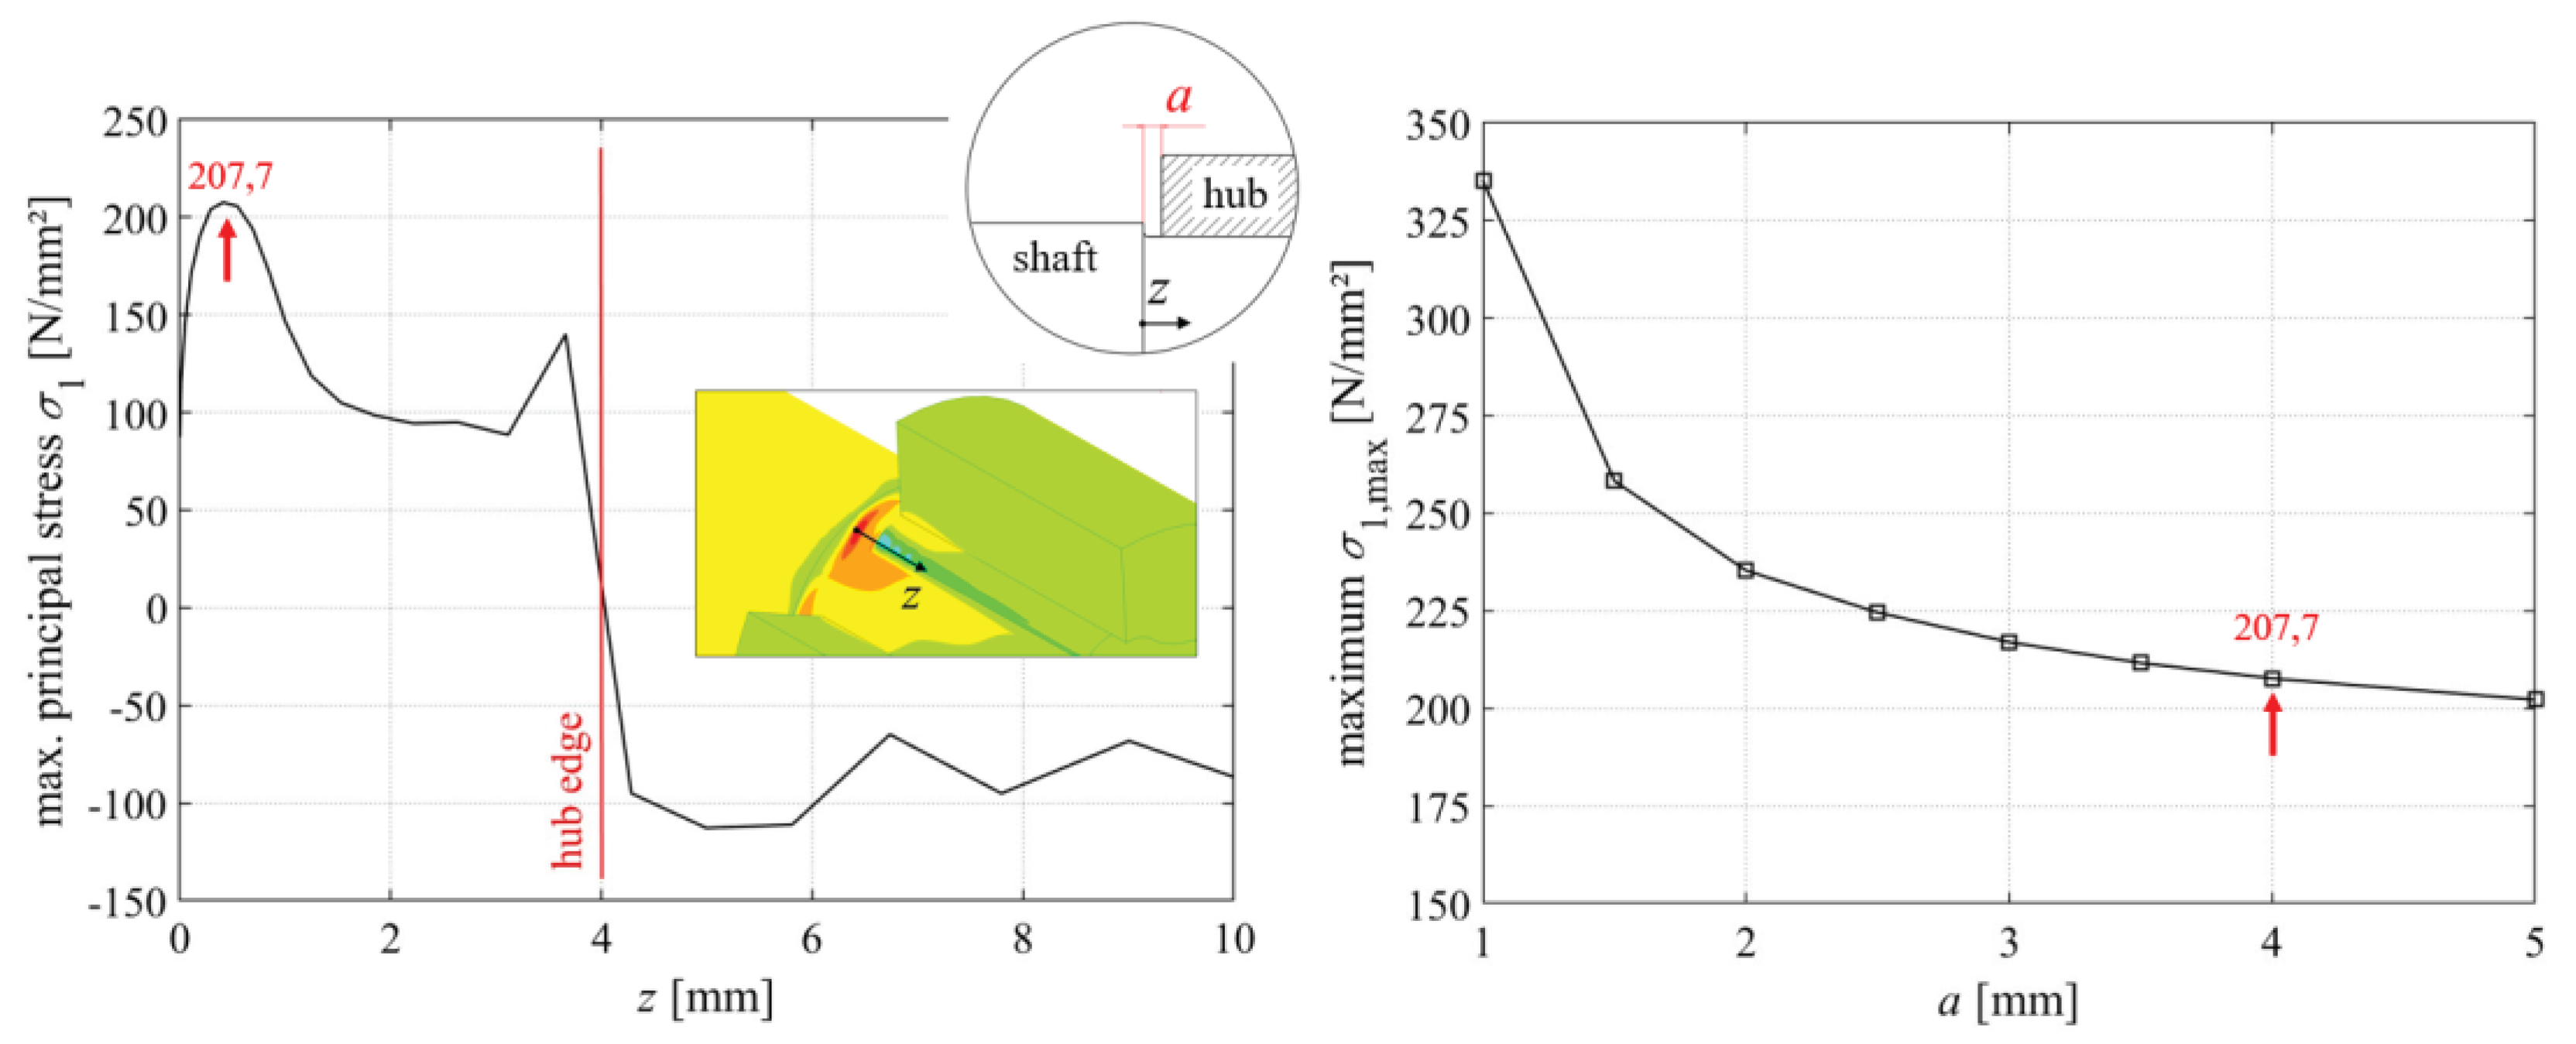
Figure 10.
Comparison of the stress curves between two driver heads directly at the hub edge (left) and in the rounding radius of the shaft shoulder (right), Mt = 600 Nm, linear–elastic material behaviour, idealized zero clearance T = 0 µm, distance a = 4 mm.
Figure 10.
Comparison of the stress curves between two driver heads directly at the hub edge (left) and in the rounding radius of the shaft shoulder (right), Mt = 600 Nm, linear–elastic material behaviour, idealized zero clearance T = 0 µm, distance a = 4 mm.
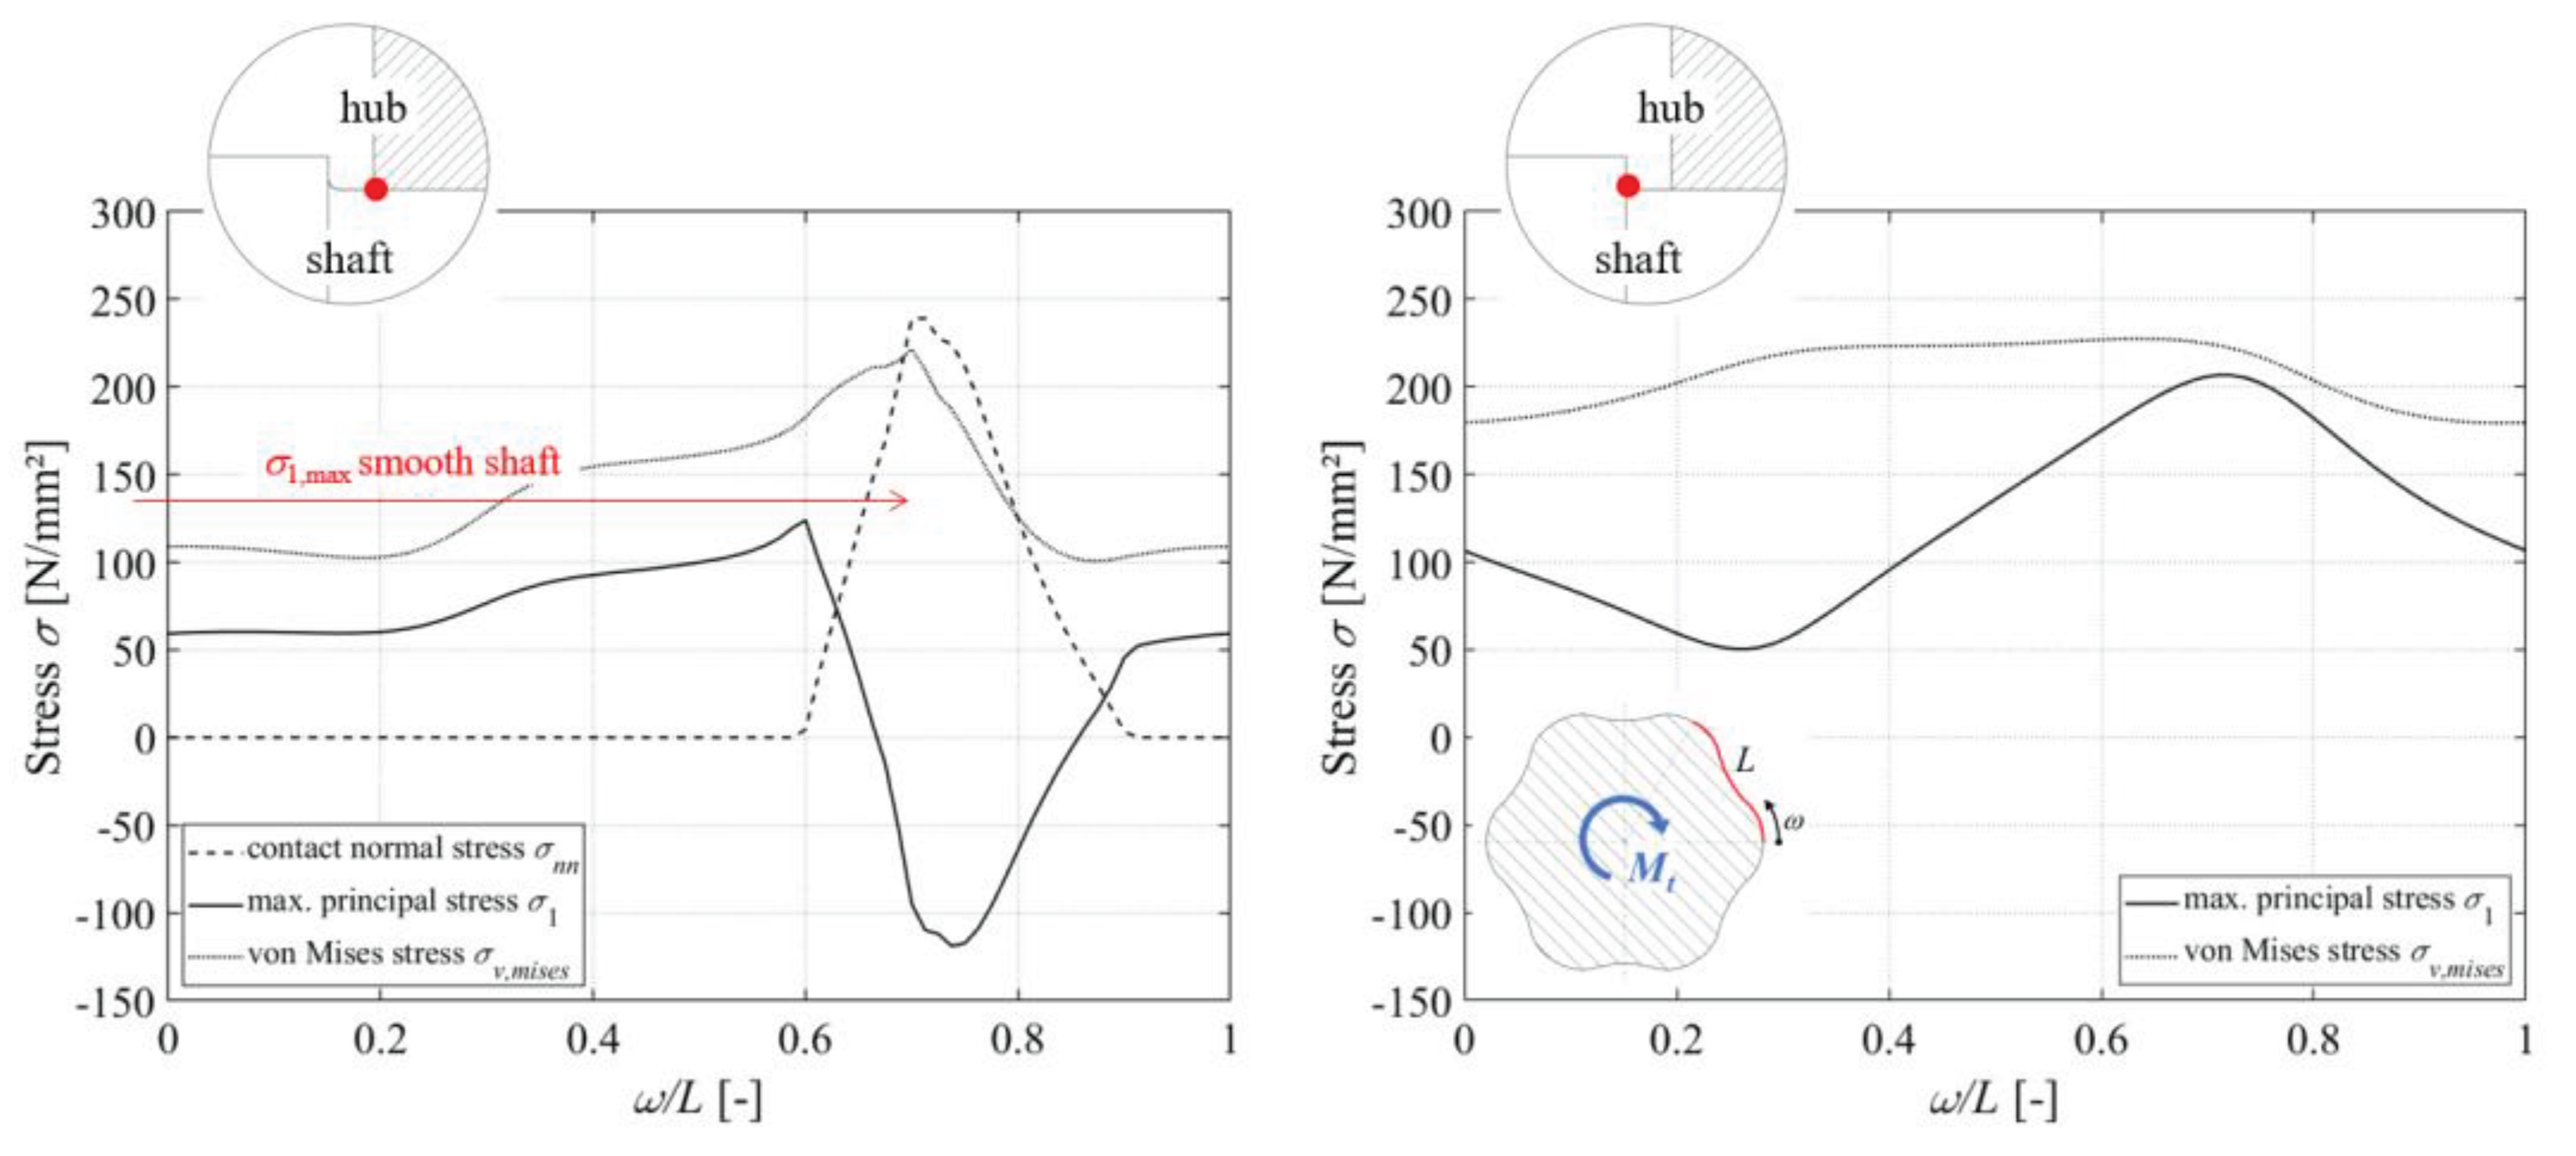
Figure 11.
Electromechanical unbalance mass test rig for generating alternating and pulsating torsional loads.
Figure 11.
Electromechanical unbalance mass test rig for generating alternating and pulsating torsional loads.
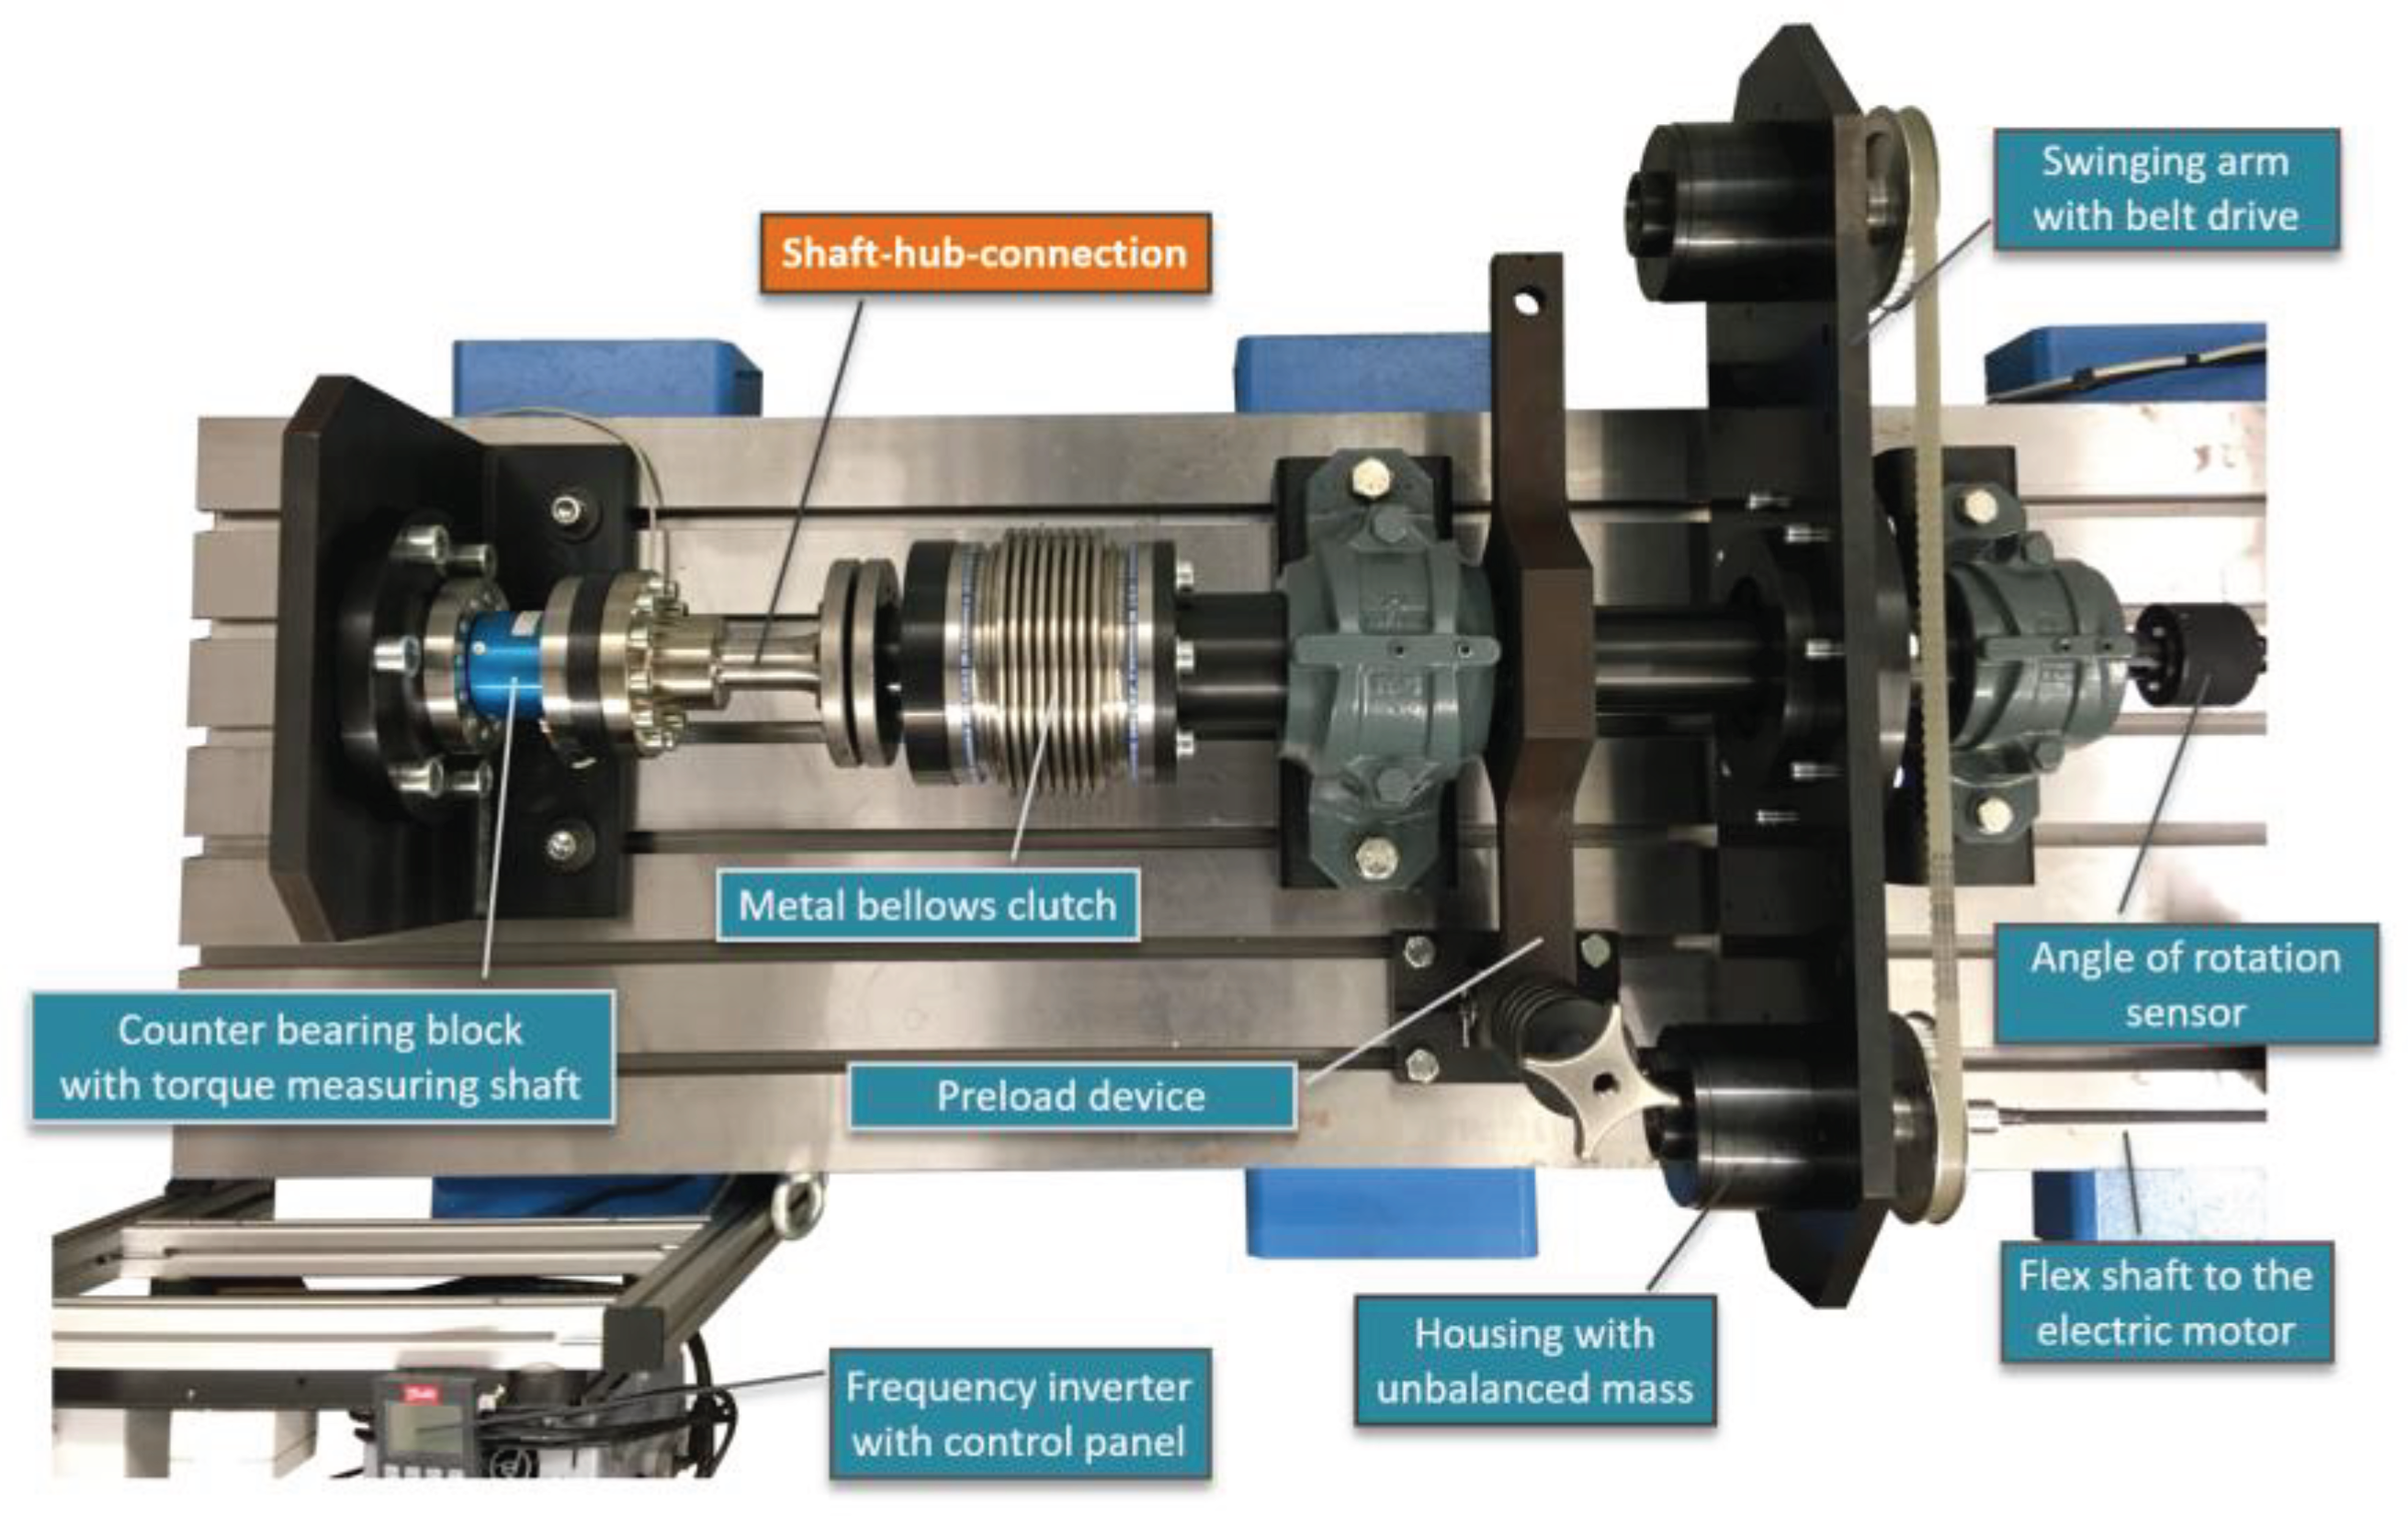
Figure 12.
Specification of the hub geometry and position in conjunction with a smooth (left) and stepped (right) M6 profile shaft for the dynamic component tests.
Figure 12.
Specification of the hub geometry and position in conjunction with a smooth (left) and stepped (right) M6 profile shaft for the dynamic component tests.
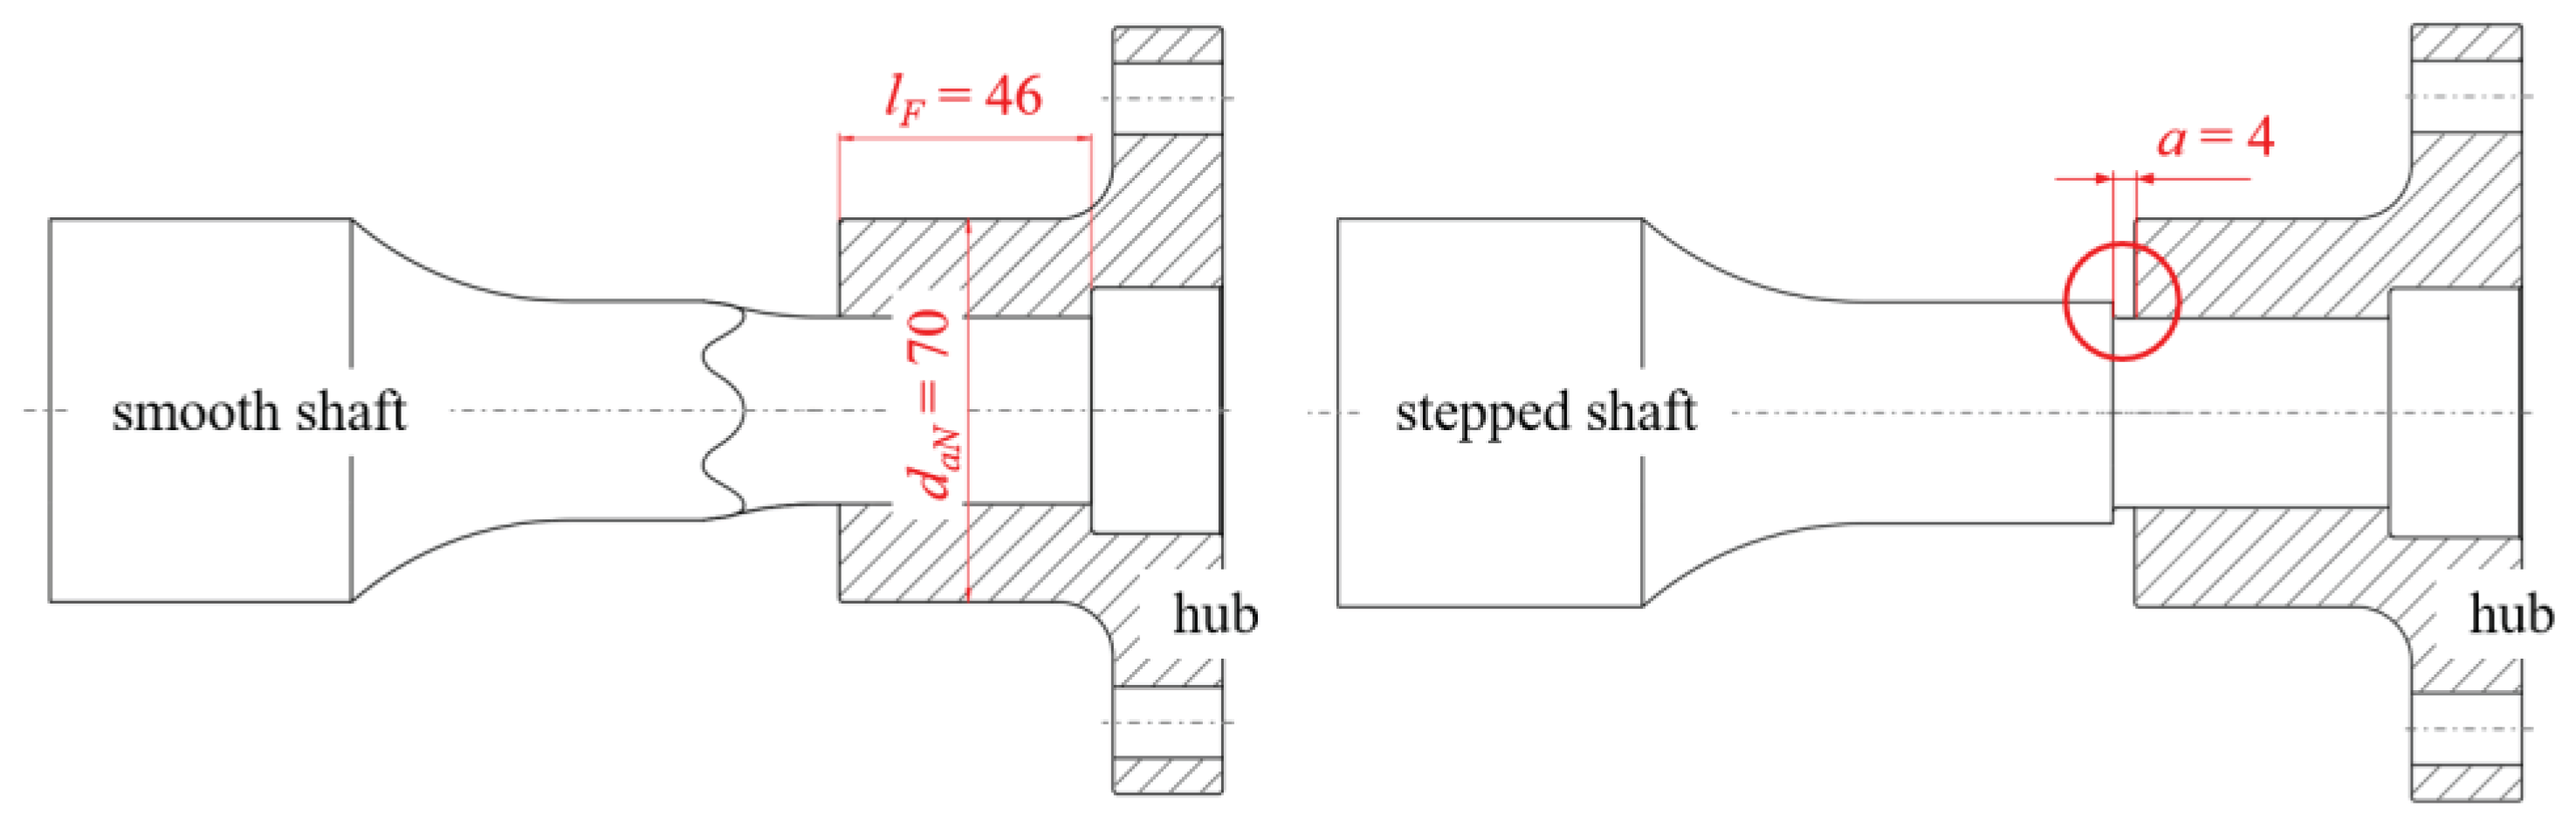
Figure 13.
Dynamic strength τtADK (left) and notch coefficient βτ (right) of the smooth M6 profiled shaft in direct comparison with the stepped shaft and depiction of the influences of manufacturing technology, fitting and material.
Figure 13.
Dynamic strength τtADK (left) and notch coefficient βτ (right) of the smooth M6 profiled shaft in direct comparison with the stepped shaft and depiction of the influences of manufacturing technology, fitting and material.
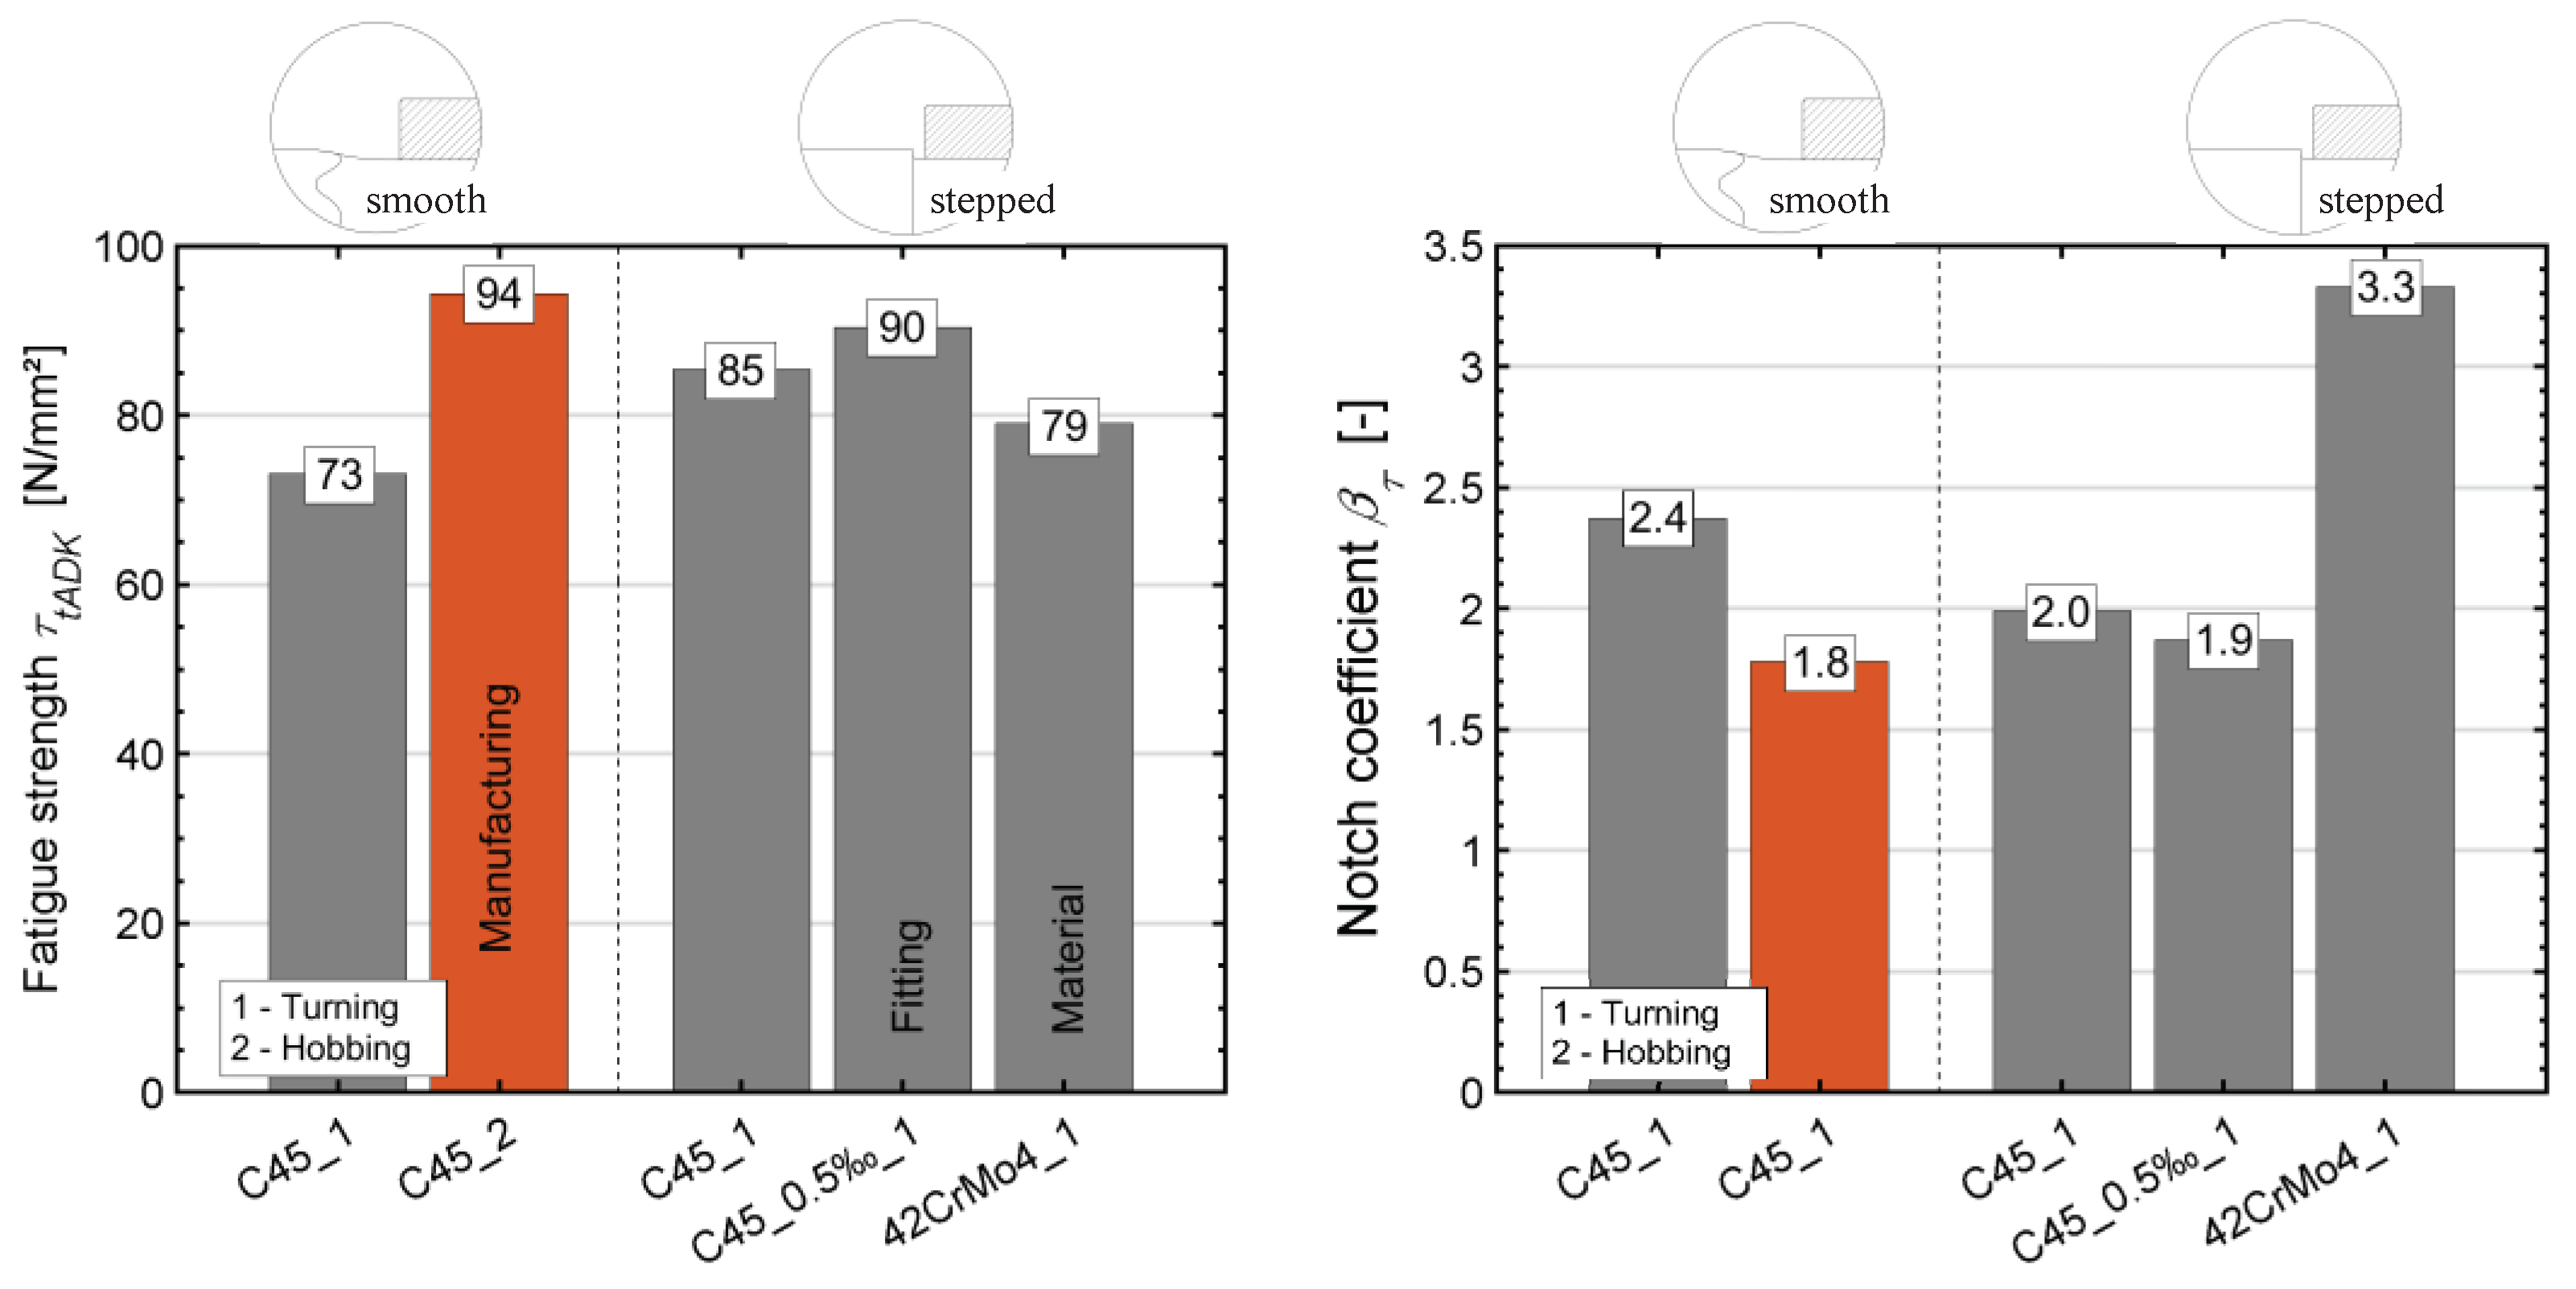
Figure 14.
Initial crack in the area of the friction-corrosive damaged zone (left) and further growth of the friction fatigue fracture (centre) of the smooth M-profile shaft under torsional swelling loading, purely mechanical stress crack initiation in the rounding of the shaft shoulder when the hub is positioned at a distance of a = 4 mm from the shaft shoulder (right).
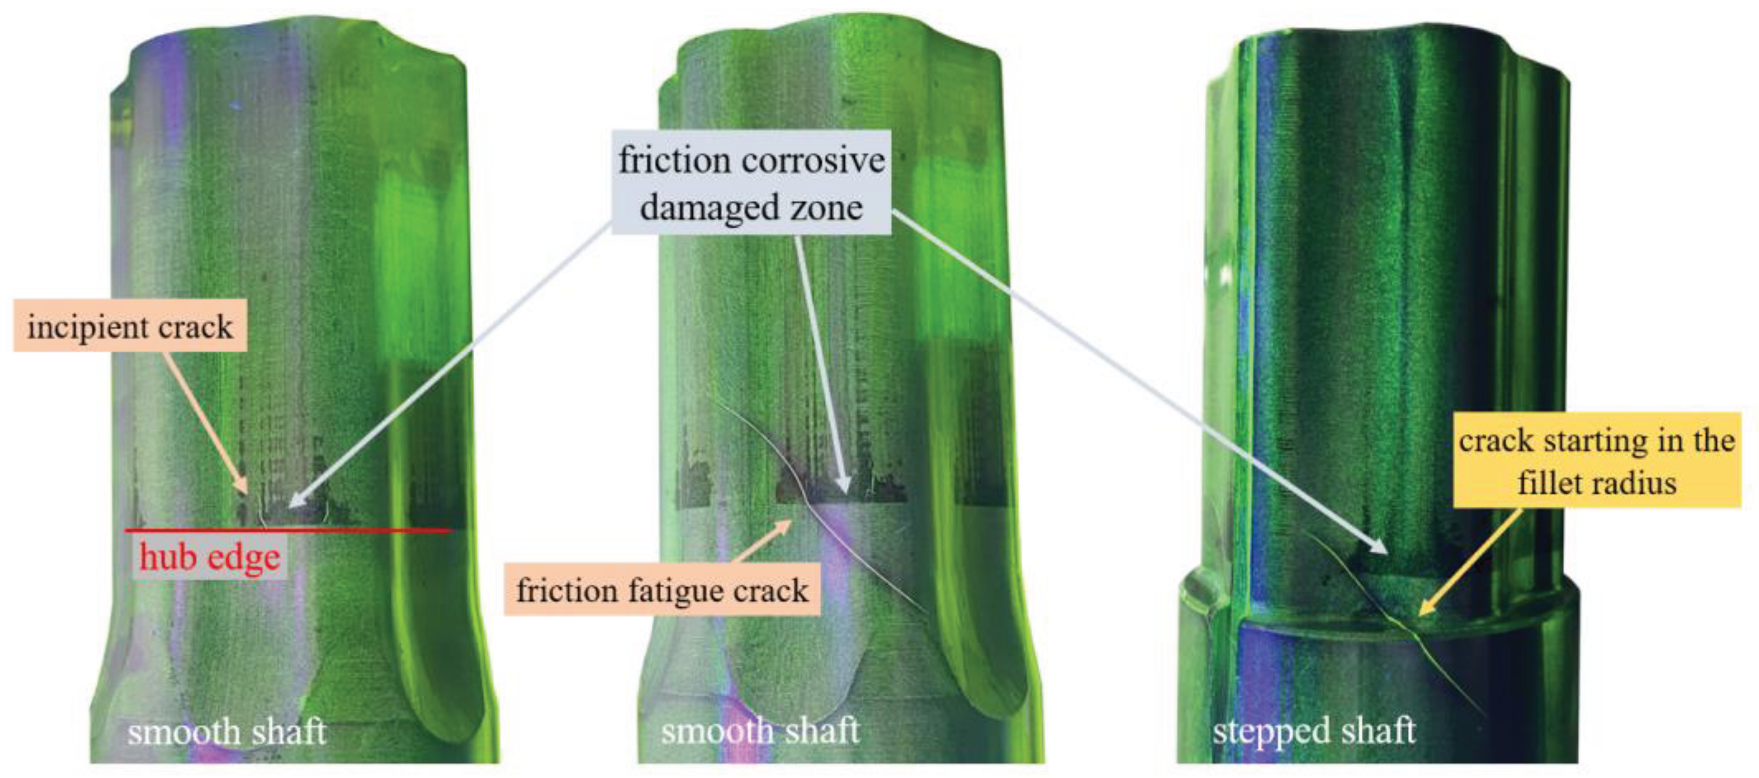
Figure 15.
Hypotrochoidal profile contour standardized according to DIN 3689-1 (left) and epitrochoidal profile (right), both with n = 3 drivers and identical tip diameter of da = 40 mm.
Figure 15.
Hypotrochoidal profile contour standardized according to DIN 3689-1 (left) and epitrochoidal profile (right), both with n = 3 drivers and identical tip diameter of da = 40 mm.
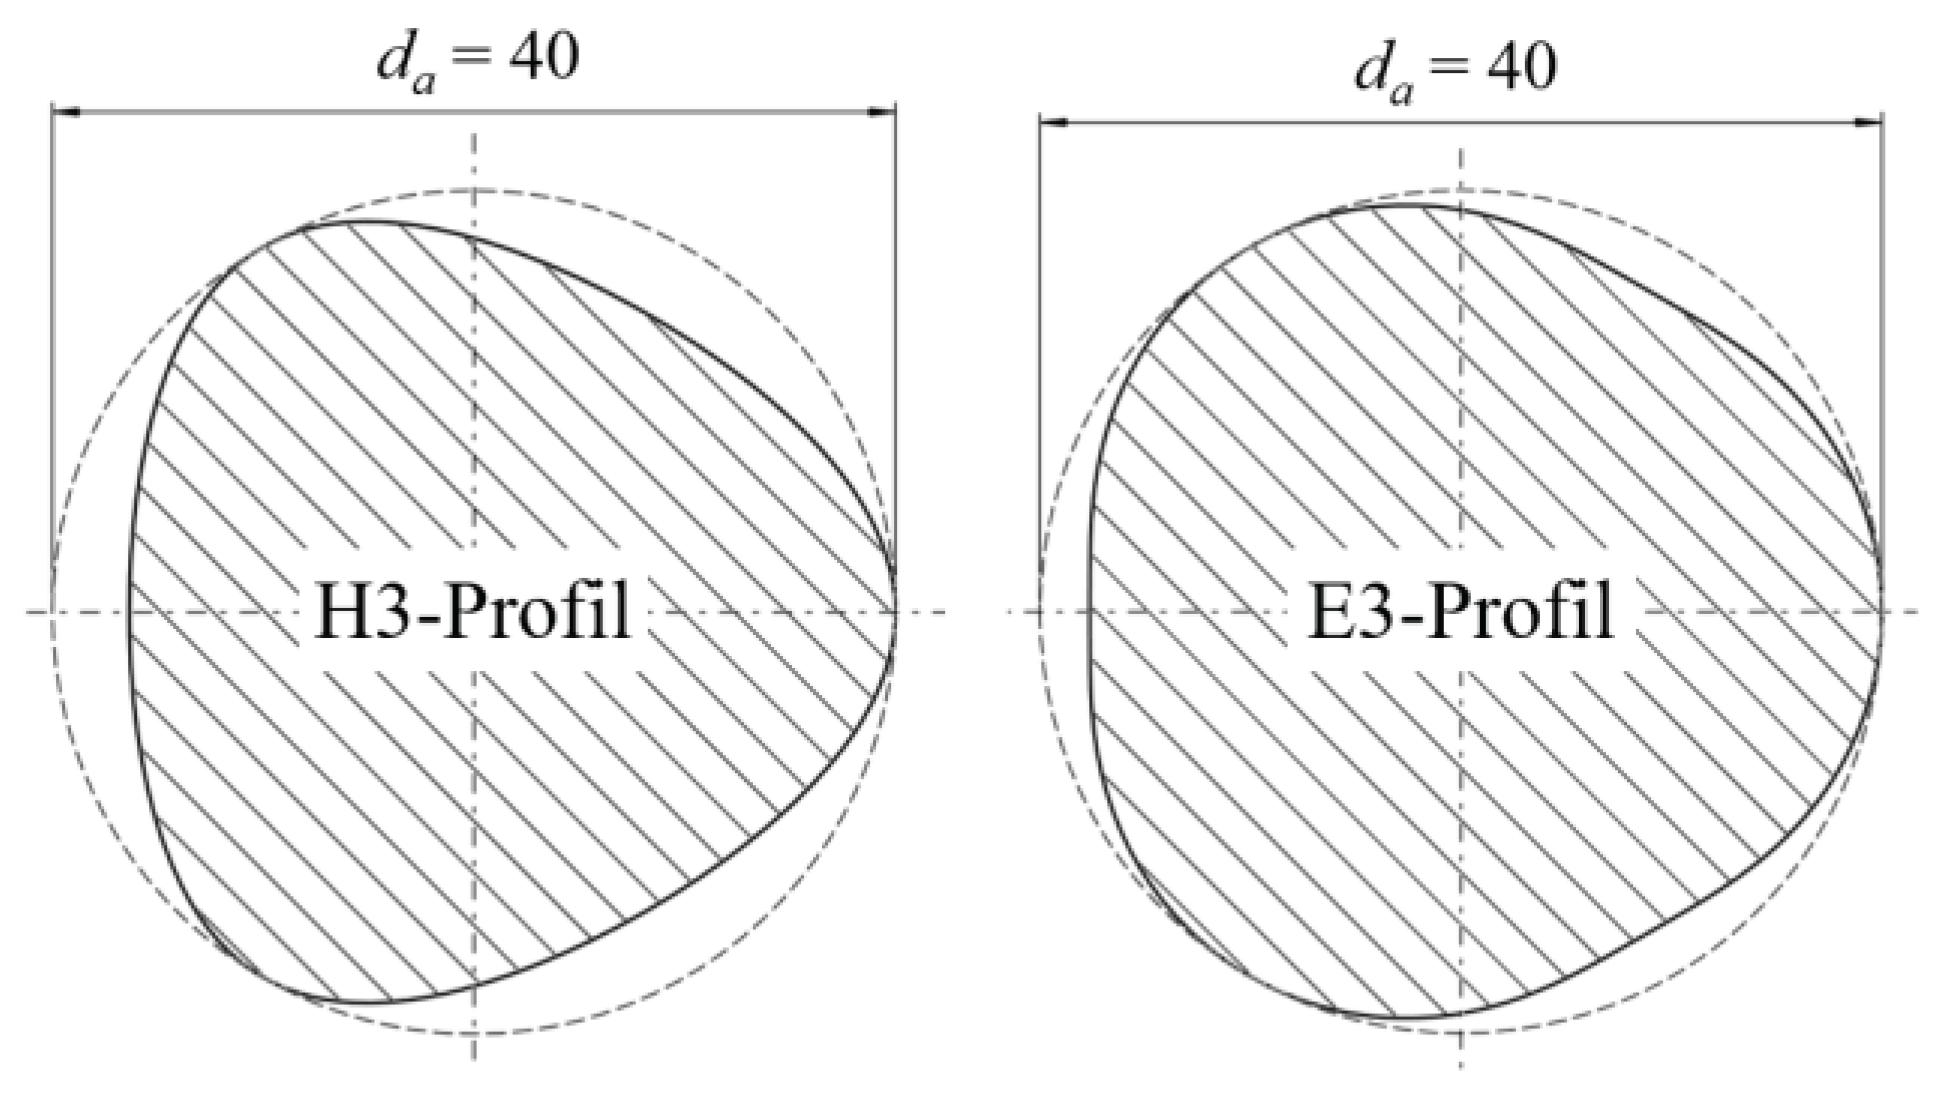
Figure 16.
Endurance limit τtADK (left) and notch coefficient βτ (right) of the H3 and E3 profiles, determined on the basis of a connection with a smooth shaft.
Figure 16.
Endurance limit τtADK (left) and notch coefficient βτ (right) of the H3 and E3 profiles, determined on the basis of a connection with a smooth shaft.
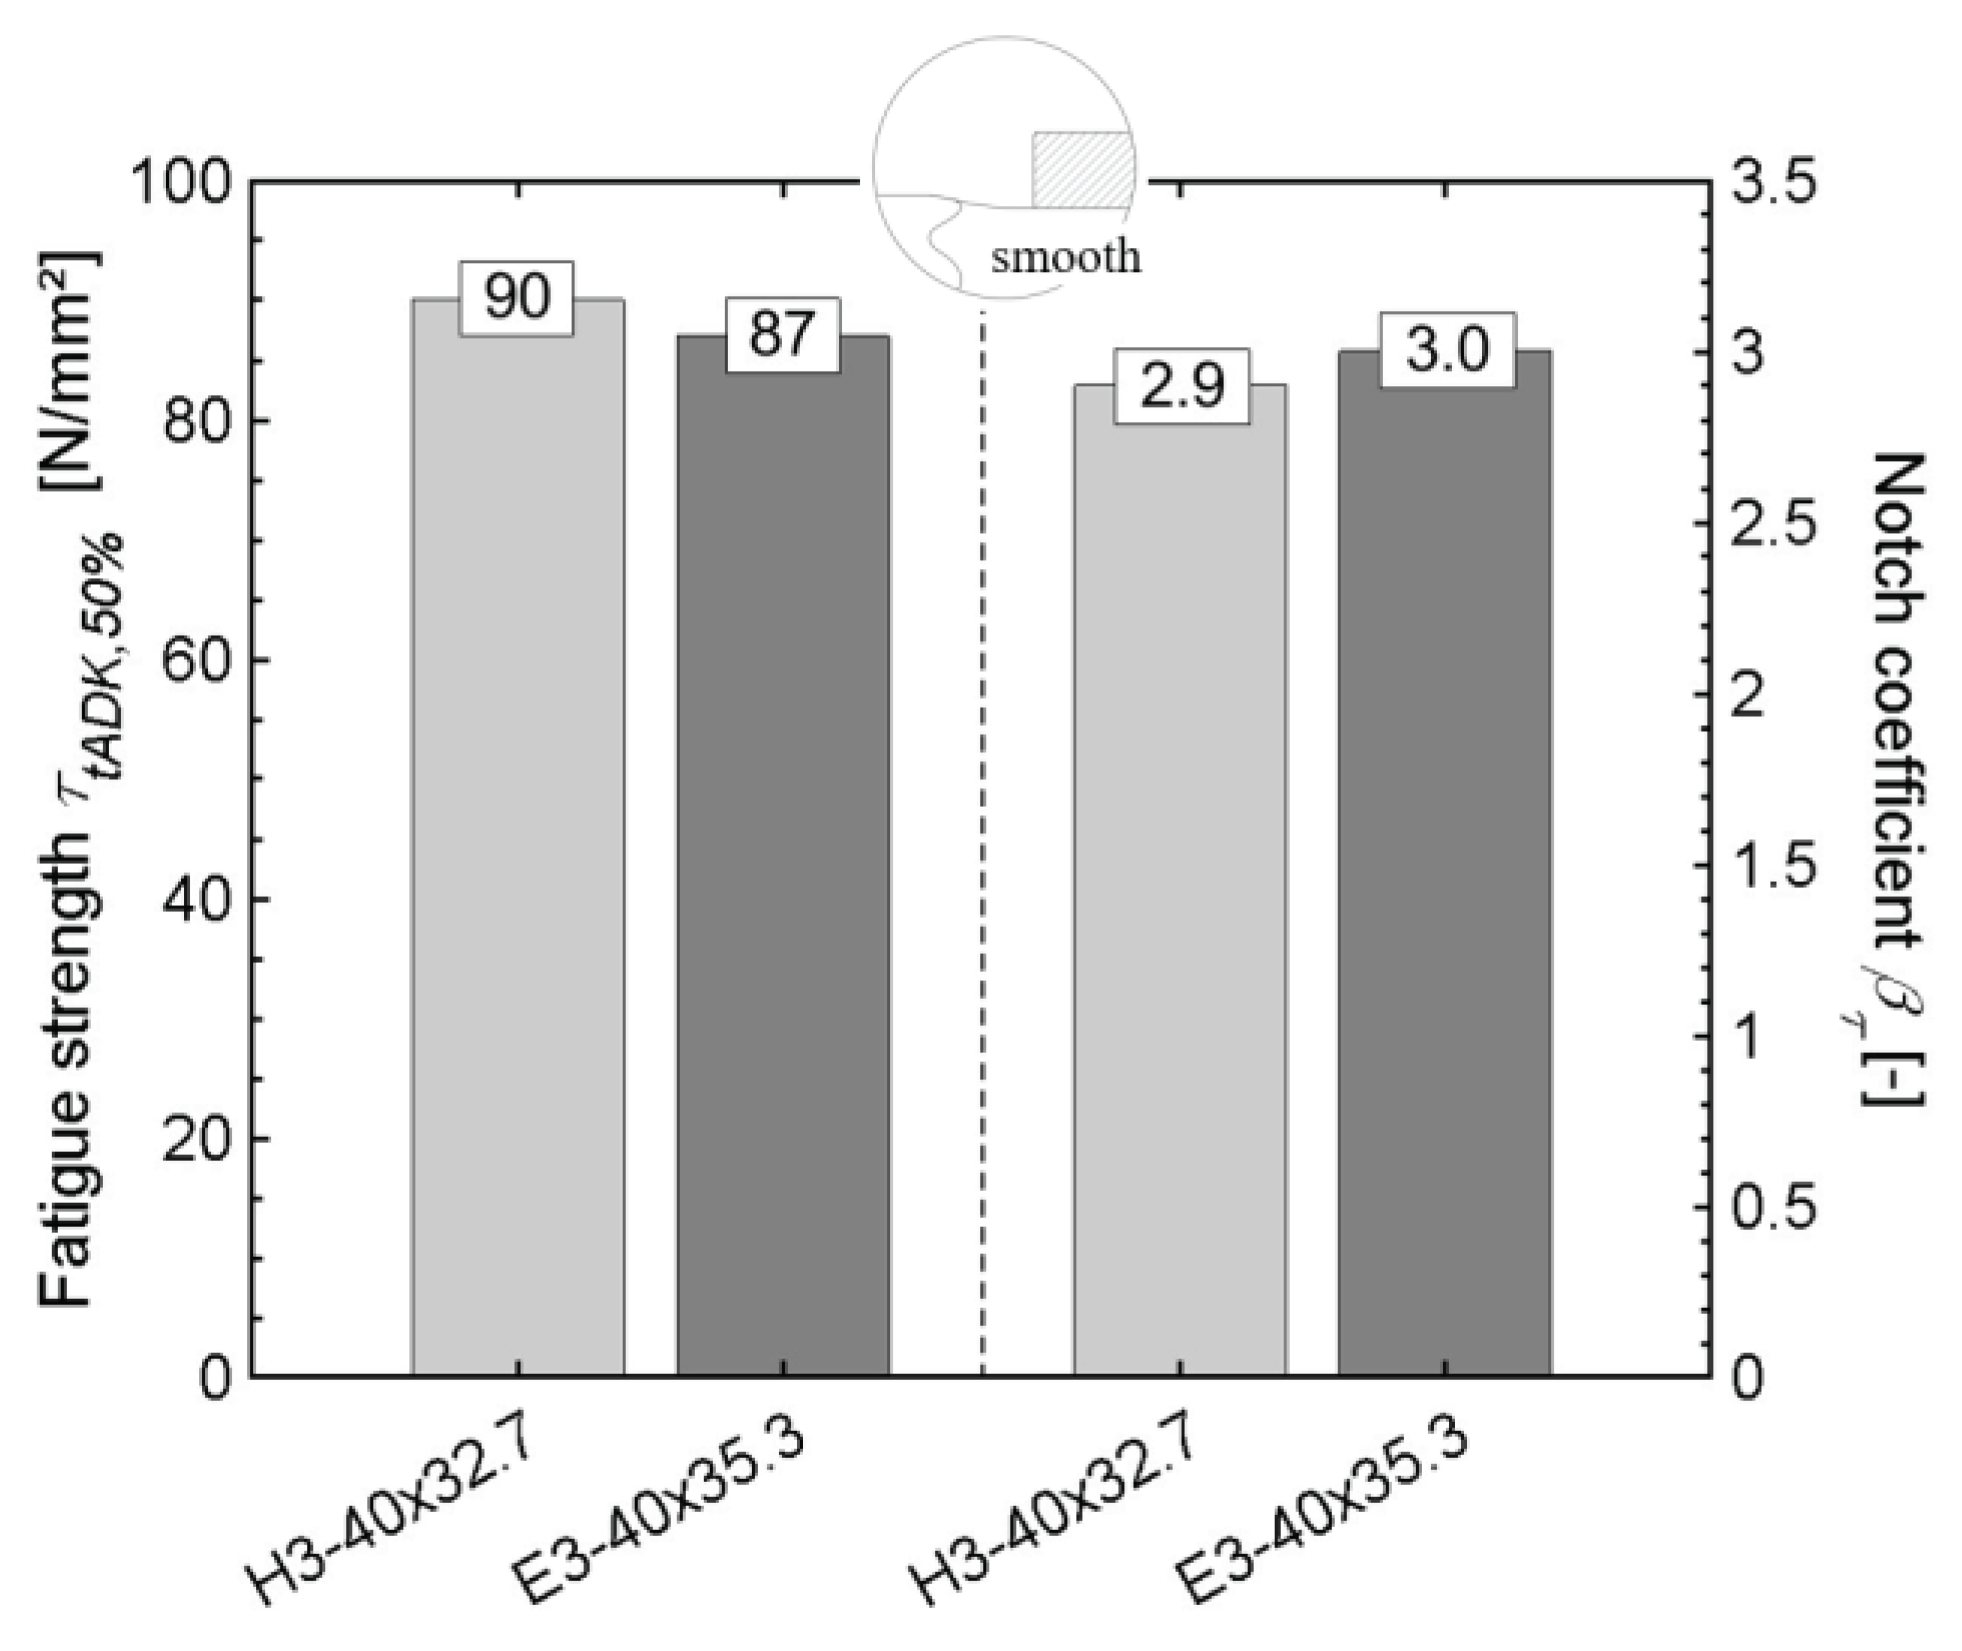
Figure 17.
Influence of the shaft shoulder on the achieved number of load cycles N for a given torsional stress amplitude τta for the H3 profile (left) and E3 profile (right), breaks marked with "x" and run-outs with "0".
Figure 17.
Influence of the shaft shoulder on the achieved number of load cycles N for a given torsional stress amplitude τta for the H3 profile (left) and E3 profile (right), breaks marked with "x" and run-outs with "0".
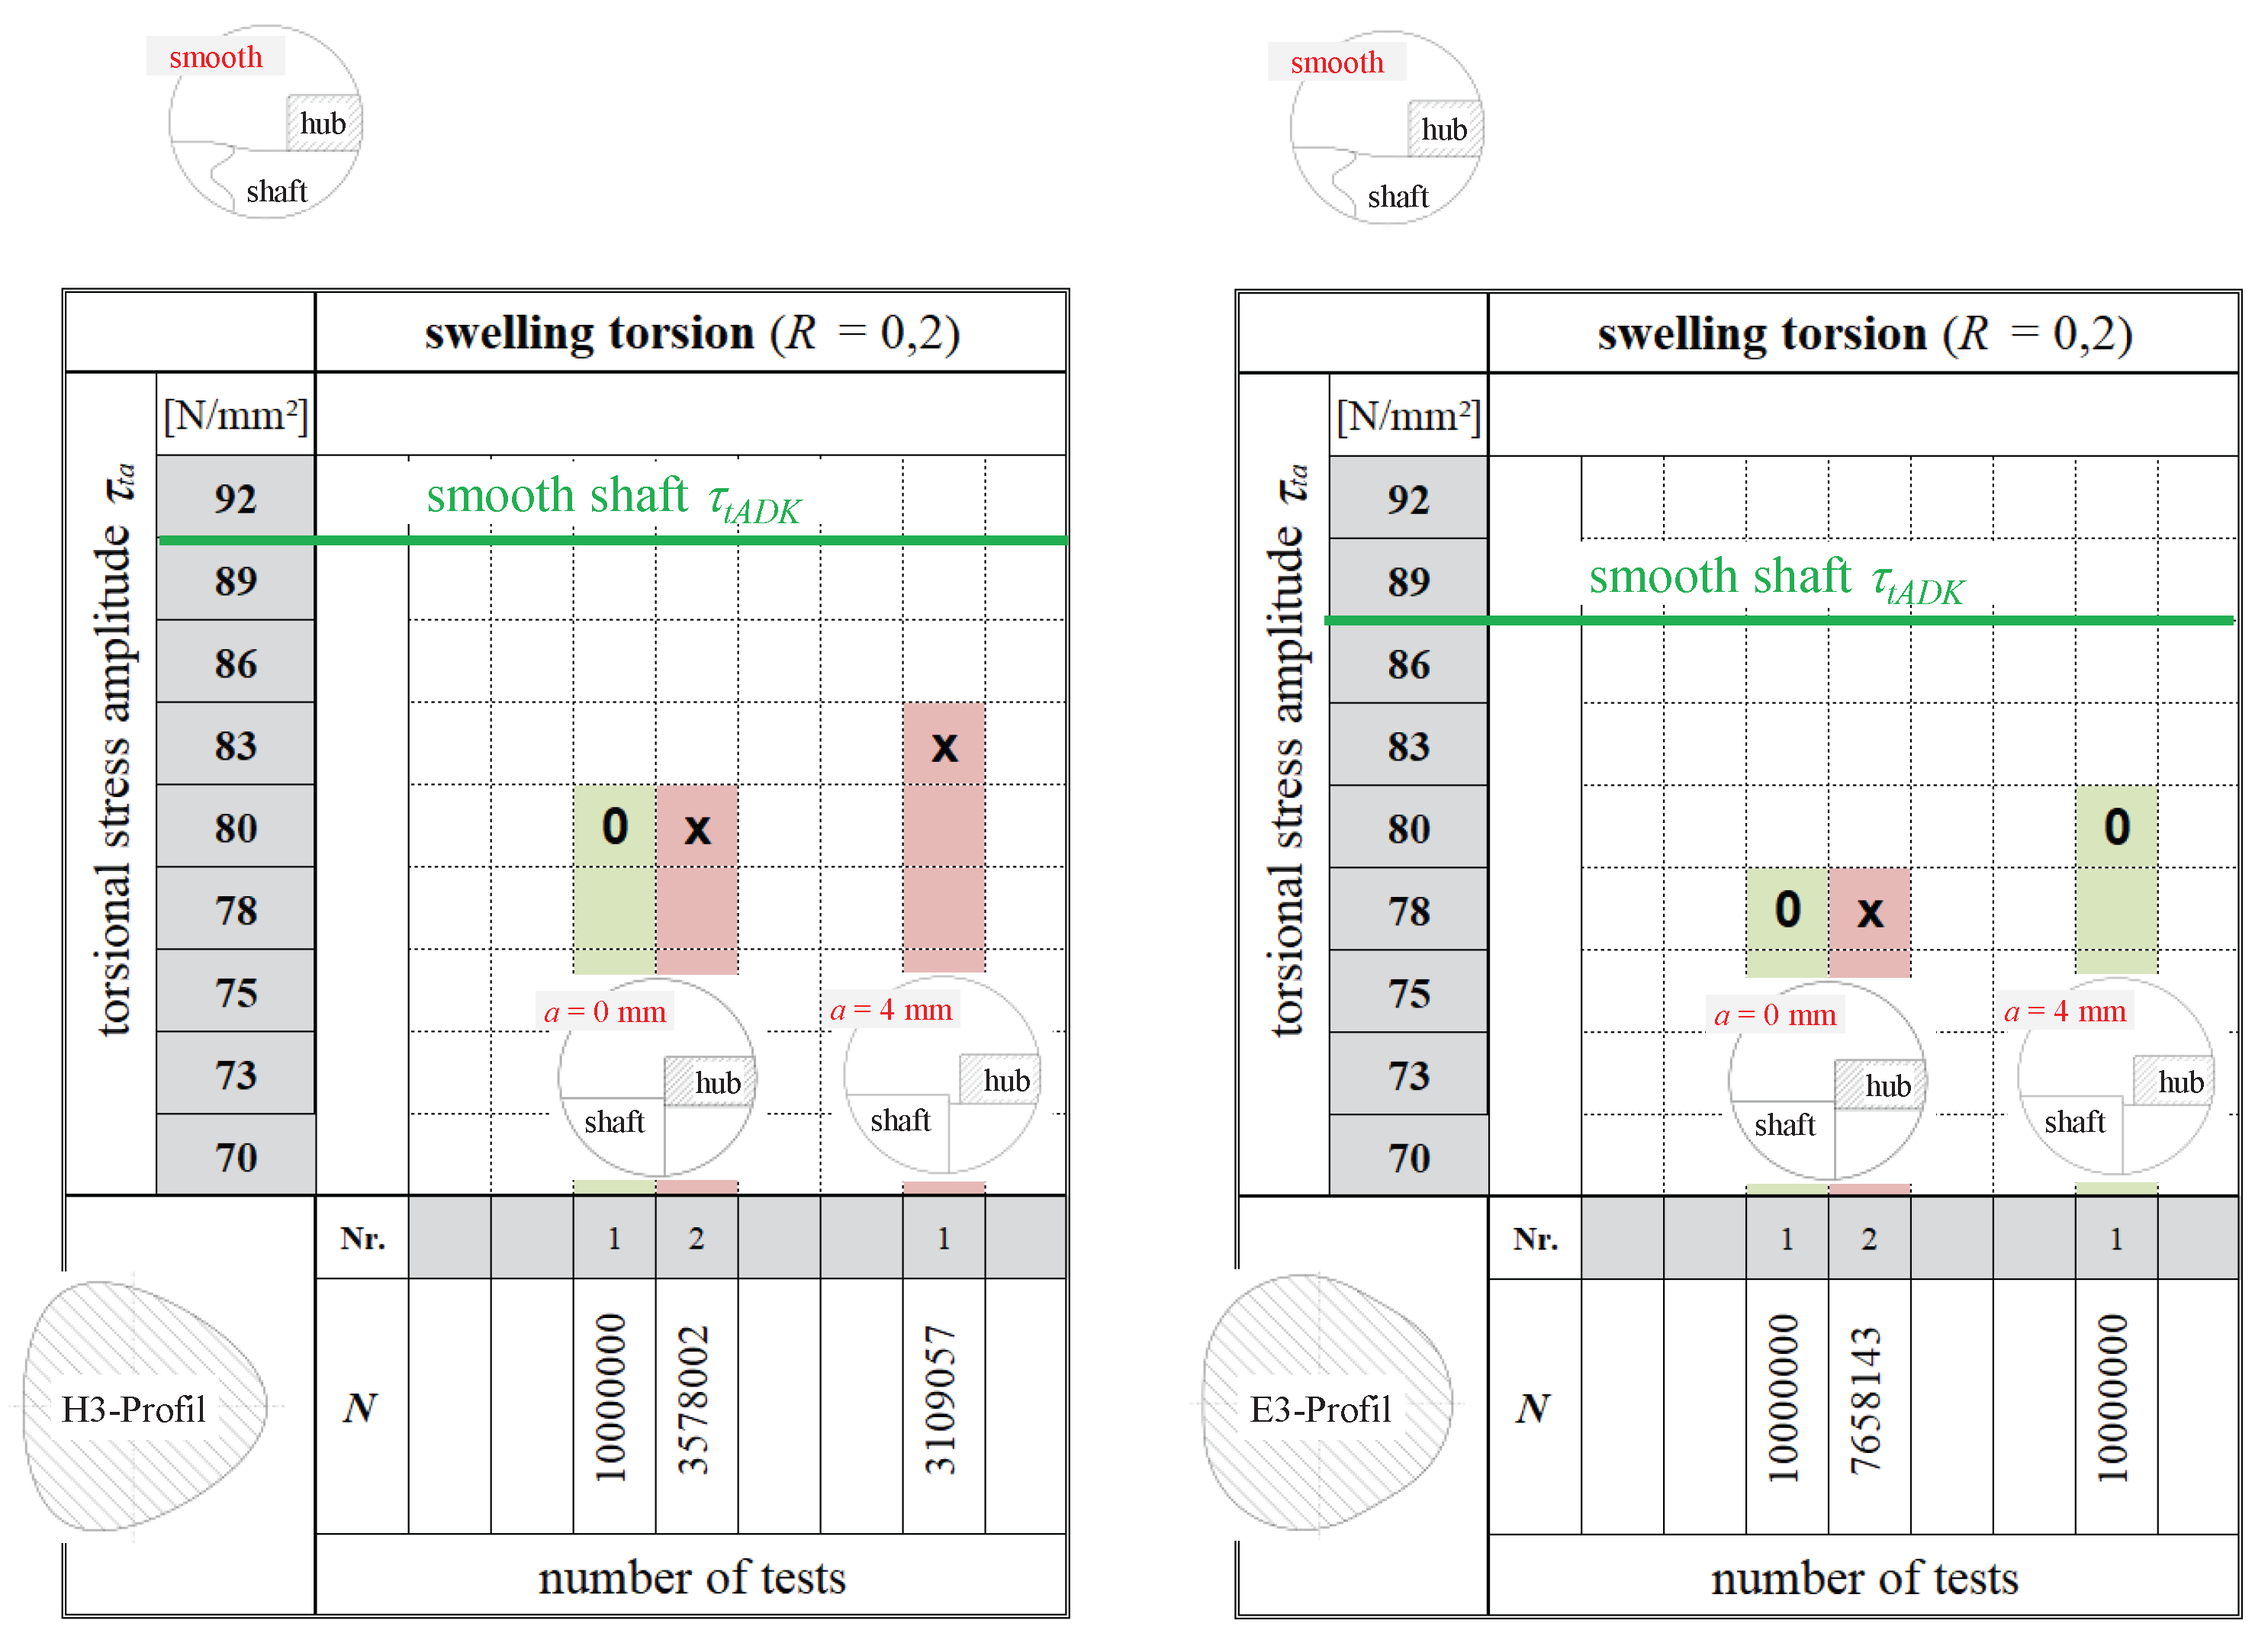
Table 2.
Profile parameters of the E3 and H3 profiles Profilparameter des E3- und H3-Profils.
| Profile type | H-Profil | E-Profil |
| Nominal Profile Radius r | 18.181 mm | 18.824 mm |
| Eccentricity e | 1.818 mm | 1.177 mm |
| Number of corners n | 3 | 3 |
| Tip diameter da | 40.00 mm | 40.00 mm |
| Root diameter di | 32.73 mm | 35.29 mm |
Disclaimer/Publisher’s Note: The statements, opinions and data contained in all publications are solely those of the individual author(s) and contributor(s) and not of MDPI and/or the editor(s). MDPI and/or the editor(s) disclaim responsibility for any injury to people or property resulting from any ideas, methods, instructions or products referred to in the content. |
© 2024 by the authors. Licensee MDPI, Basel, Switzerland. This article is an open access article distributed under the terms and conditions of the Creative Commons Attribution (CC BY) license (http://creativecommons.org/licenses/by/4.0/).
Copyright: This open access article is published under a Creative Commons CC BY 4.0 license, which permit the free download, distribution, and reuse, provided that the author and preprint are cited in any reuse.


