
Submitted:
16 December 2024
Posted:
17 December 2024
You are already at the latest version
Abstract
In this study, a simple machine learning-based quantitative structure-activity relationship (QSAR) model has been developed to predict the inhibitory potency (pIC50 values) of FLT3 tyrosine kinase inhibitors, crucial for the treatment of acute myeloid leukemia. Distinctively, our model leverages an extensive and diverse dataset, 14 times larger than those employed in prior studies within this field, enabling an unparalleled scope of compound analysis. This vast dataset, combined with further exploration of molecular descriptors, allows for more accurate and efficient predictions than previous studies. The Random Forest Regressor algorithm, selected for its excellent predictive performance, was trained on a dataset comprising 1080 compounds and subjected to rigorous validation. Internal validation, performed through Leave-One-Out (LOO) cross-validation, yielded an Q2LOO value of 0.92, demonstrating the model's internal consistency and predictive reliability. Additionally, external validation using 270 independent compounds not included in the training set achieved an R2 of 0.941, with a standard deviation of 0.237, outperforming previous approaches in terms of simplicity and precision. Key molecular descriptors have been identified, enhancing the understanding of structural requirements for inhibitor potency. Additionally, a user-friendly computational tool has been developed, enabling rapid predictions of pIC50 values. Using this tool, potential FLT3 inhibitors have been identified via ligand-based virtual screening. This study represents a significant advancement in FLT3 inhibitor discovery using a simplified QSAR-machine learning model, enabling more precise and practical identification of potential drug candidates at an early stage, promising faster development of targeted therapies and streamlining the ligand-based drug design process.
Keywords:
FLT3 Inhibitors
; Ligand-based Drug Design
; Computer-Aided Drug Design
; QSAR Modeling
; AML Treatment
1. Introduction
Acute Myeloid Leukemia (AML) represents a formidable challenge in oncology, characterized by the uncontrolled proliferation of clonal cells within the hematopoietic system, leading to extensive tissue infiltration and disease progression. A pivotal player in the pathophysiology of AML is the Fms-like tyrosine kinase 3 (FLT3) receptor gene [1]. This gene, when mutated, particularly through internal tandem duplications (ITD), endows leukemic cells with a significant proliferative advantage. This is achieved by activating multiple signaling pathways, which are crucial in both the progression of the disease and its prognosis. FLT3 mutations are thus a key factor in the aggressive nature of AML and have been extensively studied for their role in the development and outcomes of the disease [2,3,4].
For decades, the treatment landscape for AML has predominantly relied on a conventional regimen of continuous-infusion of cytarabine combined with anthracycline drugs [5]. The effectiveness of this traditional approach is influenced by factors such as the genetic profile of the leukemia and patient age; with older patients often showing markedly lower response rates. This realization established an urgent need for novel therapeutic strategies that could improve outcomes across different patient demographics [3]. In response, the AML treatment paradigm has evolved, marked by the introduction of FLT3 inhibitors such as midostaurin and gilteritinib, targeting specific mutations, and sorafenib, quizartinib. This shift towards customized therapy, including the development of new combinations like CPX-351 and gemtuzumab ozogamicin, reflects an ongoing effort to match treatment strategies with the molecular characteristics of the disease [6]. The advent of such targeted therapies and the expansion of the treatment arsenal signify a substantial step towards more effective and tailored treatment approaches for AML, offering hope for improved outcomes in a wider range of patient groups [7,8,9].
The understanding and development of FLT3 inhibitors has greatly benefited from the implementation of Quantitative Structure-Activity Relationships (QSAR) and molecular docking [10,11,12,13,14,15,16]. The study by Sandoval et al. [16] exemplifies the use of QSAR in predicting with notable accuracy the anti-leukemic activity of compounds, employing linear discriminant and multilinear regression analyses. Similarly, Shih and Bhujbal et al. [11,13] identified key structural features and designing novel compounds with enhanced FLT3 inhibitory activity by integrating molecular docking with 3D-QSAR approaches. Ghosh et al. [15] further demonstrated the efficacy of computational modeling, including molecular dynamics and 3D-QSAR, in understanding the structure-activity relationship of FLT3 inhibitors. These methodologies, endorse by studies like those of Fernandes and Islam et al. [14,17], have provided invaluable insights into the molecular interactions and binding affinities of potential FLT3 inhibitors, emphasizing the significance of these approaches in the realm of drug discovery and development for AML.
Additionally, the integration of machine learning (ML) in drug discovery has revolutionized the identification and prediction of kinase inhibitors; including those targeting FLT3. Nasimian et al. [18] demonstrated the potential of a machine learning-based model in predicting drug sensitivity, revealing crucial insights into AXL dependency in AML. Janssen et al. [19] introduced the Drug Discovery Maps (DDM) model, employing algorithms like t-SNE to visualize and predict interactions across the kinase family, leading to the discovery of potent FLT3 inhibitors. Furthermore, Zhao et al. [20] applied ML methods to classify and analyze the structure-activity relationship of a vast number of FLT3 inhibitors, uncovering key structural features associated with high inhibitory activity. These advancements, as discussed by Eckardt et al. [21], highlight the growing importance of ML in managing AML, from diagnosis to therapy optimization. Such ML-based approaches offer a promising avenue for enhancing the efficacy and precision of FLT3 inhibitor development, signifying a paradigm shift in the treatment strategies for AML.
Despite significant strides in FLT3 inhibitor development, unresolved challenges persist, notably in the predictive accuracy of current QSAR models. These models often exhibit limited predictive performance, suggesting a need for enhanced precision and simplicity. A common limitation is the reliance on a narrow range of molecular data for model training, which hampers the ability to generalize findings across a broader chemical space. The lack of molecular diversity and heterogeneity in these datasets fails to fully capture the complexity of potential FLT3 inhibitors. Furthermore, there is a notable absence of user-friendly models that provide rapid and reliable results, stressing the necessity for more practical and trustworthy methodologies in drug discovery.
In response to these challenges, our research introduces an innovative QSAR-ML model. This model is trained on a more extensive and diverse dataset, encompassing a wider range of molecules to improve robustness and generalizability. Integrating advanced machine learning techniques with sophisticated molecular descriptors, this model aims to surpass the predictive limitations of current QSAR models. Additionally, our QSAR-ML model is designed for user accessibility, offering quick and reliable outcomes. This approach promises to enhance the identification of new FLT3 inhibitors for AML treatment, setting a precedent for more efficient and accessible drug discovery tools, potentially revolutionizing the development of FLT3 inhibitors and accelerating progress towards more effective, personalized AML treatments.
2. Results and Discussion
2.1. Molecular Diversity of the Dataset
To evaluate the molecular diversity of the dataset, a clustering analysis was performed using RDKit [22] to calculate MACCS keys fingerprints [23] for each molecule. The clustering algorithm applied was Butina [24], with a Tanimoto similarity threshold of 0.3, indicating that molecules within the same cluster had a similarity of at least 0.7. The distribution of molecules across clusters is illustrated in Figure 1.
The Figure 1 presents the clustering results of the molecular dataset based on MACCS keys fingerprints and the Butina clustering algorithm [23,24]. The x-axis represents the cluster IDs, while the y-axis shows the number of molecules in each cluster. Larger clusters indicate groups of molecules with high structural similarity, suggesting redundancy in the dataset. Smaller clusters represent more unique molecular structures, indicating greater diversity.
The analysis revealed a balanced distribution of molecular similarities and diversities, indicating the dataset encompasses both highly similar and uniquely diverse molecular structures. The cluster with the highest similarity comprises 20% of the total molecules, while the second largest cluster comprises 13.6%. The remaining clusters each contain less than 6% of the total molecules. This dataset contains 124 clusters, which is greater than the total number of molecules used in previous studies.[10,11,12,13,14,15] This highlights the extensive diversity employed in this work compared to prior research, offering a broader chemical space for analysis and model development. This diversity is crucial for developing robust and generalizable machine learning models for predicting the activity of FLT3 inhibitors in AML treatment.
2.2. Benchmarking Machine Learning Methods
We explore the performance of various machine learning (ML) models in predicting pIC50 values of 1350 FLT3 tyrosine kinase inhibitor compounds, based on 1269 descriptors. The models compared include Random Forest Regressor (RFR) [25], Gradient Boosting Regressor (GBR) [26], Kernel Ridge Regression (KRR) [27], Gaussian Process Regressor (GPR) [28], Bagging with Random Forest (BRF) [29], and two Artificial Neural Network (ANN) architectures implemented using Keras (ANN-K) [30] and PyTorch (ANN-P) [31].
In Table 1, we present a comprehensive comparison of the machine learning models in predicting pIC50 values of FLT3 tyrosine kinase inhibitor compounds across various metrics including R2 (coefficient of determination), MAE (mean absolute error), SD (standard deviation), and RMSE (root mean square error) for both the training and testing datasets.
2.3. Model Performance Overview
2.3.1. Training Performance
The training performance of various machine learning models was evaluated on 1080 compounds using metrics such as R2, MAE, SD, and RMSE, providing insights into their effectiveness (see Table 1). The RFR and ANN-K models distinguish themselves with exceptional R2 scores of 0.988. Both models demonstrate remarkable precision, evidenced by low MAE, SD, and RMSE values (0.082, 0.102, and 0.102 for RFR; 0.070, 0.101, and 0.103 for ANN-K, respectively). This indicates that both models possess the ability to capture the variability in the training data across predictions.
The GBR also demonstrates high efficacy, with an R2 of 0.973, positioning it as a robust model, though it exhibits slightly higher MAE (0.126) and a broader spread of SD (0.154) and RMSE (0.154) compared to RFR and ANN-K (see Table 1). This indicates that while GBR is generally accurate, its predictions are not as consistently close to the actual values as those of the RFR and ANN-K.
Conversely, the KRR and GPR exhibit moderate to low R2 values of 0.546 and 0.641, respectively (Table 1). These suggest a weaker ability to predict the training data accurately. The relatively high MAE, SD, and RMSE values for these models (0.489, 0.638, and 0.638 for KRR; 0.469, 0.526, and 0.568 for GPR, respectively) further illustrate this point, indicating not only larger average errors but also a greater variability in these errors.
Overall, while RFR and ANN-K show promise for applications requiring high reliability and accuracy, GBR remains a viable choice for scenarios where a slight decrease in prediction accuracy is acceptable. In contrast, KRR and GPR might require further tuning or reconsideration of their applicability. This analysis highlights the importance of selecting the right model based on specific performance metrics and the particular needs of the deployment environment.
2.3.2. Testing Performance
When the machine learning models were evaluated using the same metrics on external and independent data (270 compounds)—not included in the training dataset—both the RFR and GBR exhibited strong testing performance, with R2 values close to 0.94 (see Table 1). This underscores their robustness in handling new data. Additionally, their low MAE (0.197 for RFR and 0.195 for GBR) and RMSE (0.246 for RFR and 0.239 for GBR) values further highlight their precision and reliability in making predictions. These results suggest that ensemble methods, particularly those based on decision trees, are adept at predicting pIC50 values for FLT3 inhibitors using the QSAR approach.
In contrast, the GPR shows significantly poorer performance in the testing phase, with a negative R2 value of -0.228. This indicates not just a failure to generalize but actually performing worse than a model that would simply predict the mean of the dataset, likely due to overfitting to the training data or inappropriate model assumptions for the type of data used. The exceedingly high MAE and RMSE values for GPR confirm this, reflecting large errors in prediction and high variability, which diminish its practical utility.
Meanwhile, the KRR shows moderate performance with an R2 of 0.592 (Table 1). Although better than GPR, it still falls short compared to RFR and GBR, suggesting that while it captures some of the variance in the data, it is not as effective or reliable. The Artificial Neural Networks, whether implemented in Keras (ANN-K) or PyTorch (ANN-P), also show a decline in performance from training to testing, indicating potential overfitting issues as well. Their respective R2 values of 0.907 and 0.895, coupled with higher error metrics, underscore the challenges of neural networks in maintaining performance consistency across different datasets.
This varied testing performance across models highlights the critical importance of selecting and tuning models based on their ability not only to fit the training data but also to generalize well to new, unseen data. RFR and GBR stand out as the more reliable models for consistent application, while the use of GPR, KRR, and to some extent, the ANN models might necessitate more careful handling to ensure robustness and accuracy in practical applications.
2.4. The Model
This section presents an analysis of the component optimization through feature selection, focusing on the efficacy of RFR as the chosen method for predicting FLT3 tyrosine kinase inhibitor activity. Our findings, illustrated in Figure 2, stress the paramount importance of the initial five molecular descriptors. These descriptors exhibit a combined R2 test score of 0.893, indicating their critical role in model accuracy and interpretability (see below "Model Interpretation"). Subsequent inclusion of descriptors up to the nineth markedly improves the R2 test to 0.930, with a significant but diminishing return on predictive performance with each additional descriptor. Beyond the incorporation of 41 descriptors, the R2 test plateaus at 0.941, suggesting that further addition of descriptors does not substantially enhance the model’s predictive capability.
An essential aspect of this analysis is understanding the intercorrelations among descriptors, as illustrated in the correlation matrix in Figure 3. This matrix displays the pairwise correlation coefficients among the 41 descriptors and their relationship with the inhibitory activity (pIC50). The color palette ranges from -1 (dark blue), indicating a strong negative correlation, to 1 (dark red), indicating a strong positive correlation, with neutral correlations represented by white. A threshold of 0.90 was used to identify highly correlated descriptor pairs, which were subsequently removed during model construction. As a result, Figure 3 only contains correlations less than 0.90. Identifying and removing these highly correlated pairs is crucial, as descriptors with correlations above this threshold may contribute redundant information to the model. By examining these correlations, we ensure that the selected descriptors provide unique and valuable contributions to the predictive performance of the RFR model.
This observation emphasizes the effectiveness of RFR in capturing the complex nonlinear relationships between a manageable number of descriptors and pIC50 values, thus optimizing the balance between model simplicity and predictive accuracy. This outcome reaffirms the superiority of ensemble methods like RFR in handling high-dimensional data [32], while underlining the importance of a judicious feature selection process in the development of efficient and reliable predictive models for drug discovery applications.
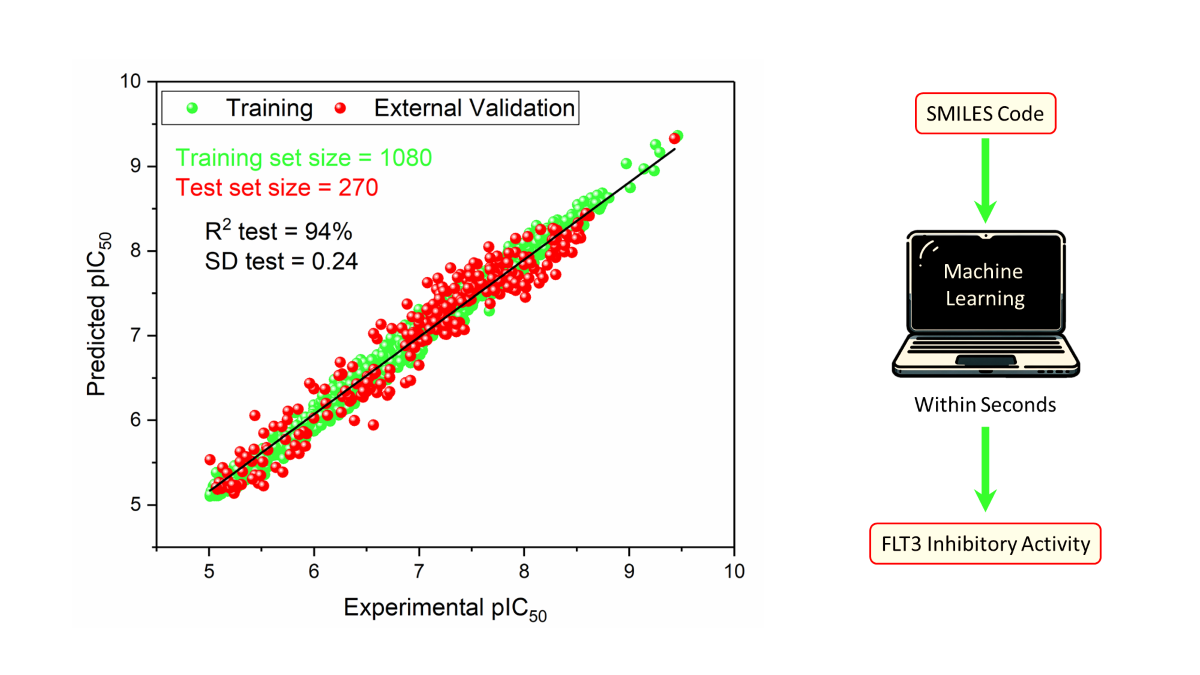
The results shown in Table 2 and illustrated in Figure 4A demonstrate the predictive capability of the RFR model for FLT3 tyrosine kinase inhibitor compounds when optimized with 41 descriptors. With a remarkable R2 value of 0.989 for training and 0.941 for testing, the model showcases exceptional accuracy and robustness in capturing the complex relationships between the descriptors and the pIC50 values of 270 inhibitors. The error metrics, including MAE, SD, and RMSE, further affirm the model’s precision across both training and test datasets. The value of 0.926 indicates strong predictive reliability through leave-one-out cross-validation, emphasizing consistency in the model.
2.5. Comparative Analysis: QSAR Modeling
The RFR model, employing 41 descriptors, was compared to prior QSAR studies that examined FLT3 tyrosine kinase inhibitors, as detailed in Table 3. It significantly improved the accuracy of predicting pIC50 values for unseen compounds, achieving an R2 of 0.941 and a SD of 0.237 in the test set. These results are notable considering that previous studies achieved an R2 of no more than 0.891 and an SD of at least 0.3. The enhanced performance of our model not only reflects its increased accuracy but also its application to a broader and more diverse dataset of 270 compounds, which is critical for reliable predictions of FLT3 tyrosine kinase inhibition. Moreover, the value of 0.926, in contrast to 0.802 or lower in earlier studies, suggests that the predictive accuracy of the model is not overly dependent on specific data points or features, compared to models prior to this work.
These findings underscore the effectiveness of a design that relies exclusively on the characteristics of the ligand when supported by a large and diverse dataset, rendering the ligand-based model a practical and dependable tool.
2.6. Model Interpretation
The interpretability of model can be achieved by conceptually analyzing the five most influential descriptors on its performance. The five descriptors, detailed in Table 4, are recognized for their paramount importance: SHBd, MLFER_S, nBase, MaxsssN, and MLFER_BH.
2.6.1. SHBd
The relationship between SHBd values and pIC50 scores, as depicted in Figure 5A, reveals the nuanced interplay crucial for the design of FLT3 tyrosine kinase inhibitors. A specific configuration, encompassing both the quantity and the electronic and topological quality of hydrogen bond donors, is crucial for effective FLT3 inhibition. Achieving optimal inhibitory activity requires SHBd values to be within the range of 1 to 1.5. Deviations from this range lead to diminished efficacy, indicating that both insufficient and excessive hydrogen bonding capabilities can adversely affect the performance of inhibitors. This observation emphasizes the importance of molecular descriptors in guiding the optimization of therapeutic compounds, where adjusting the hydrogen bond donor capacity to a targeted range can significantly enhance the potency and selectivity of inhibitors.
2.6.2. MLFER_S
An analysis of Figure 5B reveals the optimal MLFER_S range for FLT3 tyrosine kinase inhibitors to be between 3.1 and 4.5. Within this specific interval, compounds exhibit peak inhibitory efficacy, while values outside this range result in decreased inhibitor performance. This observation emphasizes the importance of solvophobic energy contributions in determining the effectiveness of these compounds, indicating a pivotal role of solvatophilic interactions in the design of optimal inhibitors.
2.6.3. nBase, MaxsssN and MLFER_BH
The observed trends in nBase, MaxssN, and MLFER_BH, as depicted in Figure 5C, Figure 5D, and Figure 5E, collectively underscore the intricate relationship between molecular structure and FLT3 inhibitory activity. A peak un inhibitory activity is observed when molecules contain 2 basic groups (see Figure 5C). This would suggest a role of basic nitrogenous groups in enhancing interactions with FLT3, possibly through a combination of electrostatic attractions and hydrogen bonding. This is further supported by the findings related to MaxssN, where compounds exhibiting values greater than 1.5 show enhanced activity, with a more pronounced effect observed beyond 2.2. This indicates that not only the presence of nitrogen atoms, but their specific electronic configuration, characterized by three single bonds, is crucial for optimal FLT3 binding and inhibition. Meanwhile, MLFER_BH extends the discussion beyond nitrogenous groups to encompass the overall hydrogen bond acceptor capacity of the molecule. The observation that compounds with MLFER_BH values greater than 3.1 exhibit the best inhibitory activity underline the universal importance of hydrogen bond interactions in the activity of FLT3 inhibitors. Although nBase and MaxssN focus on the role of nitrogenous groups, the inclusion of MLFER_BH broadens the scope to include all potential hydrogen bond acceptors, suggesting that the ability to engage in hydrogen bonding, irrespective of the atom involved, is fundamental to the inhibitory mechanism.
2.7. Novel FLT3 Inhibitors Identified by Ligand-Based Screening
After applying Ligand-Based Virtual Screening (LBVS) using our customized cheminformatics model, we identified a series of promising compounds with potential inhibitory effects against FLT3 tyrosine kinase. The top five are presented in Table 5. This approach enabled the selection of new candidates exhibiting structures similar to Gilteritinib, a next-generation inhibitor [38]. This methodology highlights the utility of LBVS in efficiently identifying compounds with desired biological activity without direct physical interactions with the biological target. The identification of these pyrazinecarboxamide derivatives, with pIC50 values close to that of Gilteritinib (9.39) [39], emphasizes the potential of this computational approach in the discovery and development of new FLT3 inhibitors for treating AML with FLT3 mutations. These findings expand our understanding of the structure-activity relationships of FLT3 inhibitors and provide a tool for the future experimental validation of these compounds.
The relationship between the compounds identified in Table 5 and the descriptors SHBd, MLFER_S, nBase, MaxsssN, and MLFER_BH highlights the connection between substructure and potency. In the identified molecules, such as 6-Ethyl-3-[3-methoxy-4-[4-(1-methylpiperidin-4-yl)piperazin-1-yl]anilino]-5-(oxan-4-ylamino)pyrazine-2-carboxamide, high SHBd values are due to the presence of multiple hydrogen bond donor groups, which enhance their inhibitory activity. For molecules like 3-[4-[4-(1-Methylpiperidin-4-yl)piperazin-1-yl]anilino]-5-(oxan-4-ylamino)-6-propan-2-ylpyrazine-2-carboxamide, high MLFER_S values reflect the presence of solvatophilic groups that improve solubility and interaction with the target protein. Basic groups (nBase), such as amines and piperidine rings, are prevalent in identified molecules. For instance, the structure of 6-Ethyl-3-[4-[4-(4-methylpiperazin-1-yl)piperidin-1-yl]-3-propan-2-yloxyanilino]-5-(oxan-4-ylamino)pyrazine-2-carboxamide features several nitrogen atoms contributing to its basicity. Molecules such as 6-(1-Methyl-3,6-dihydro-2H-pyridin-4-yl)-3-[4-[4-(4-methylpiperazin-1-yl)piperidin-1-yl]anilino]-5-(oxan-4-ylamino)pyrazine-2-carboxamide exhibit high MaxsssN values due to the presence of tertiary nitrogen atoms within piperazine rings. Finally, MLFER _BH sums the hydrogen bond basicity of all potential hydrogen bond acceptor sites. Compounds like the pyrazinecarboxamide derivatives possess multiple hydrogen bond acceptor sites, enhancing their overall hydrogen bond basicity and binding affinity to the FLT3 tyrosine kinase.
2.8. Script-Like Tool Description
To enhance the user experience with our model, we have created a script-based tool that automates the prediction of pIC50 and IC50 values for any compound using its SMILES code (Figure 4B). Access the tool via the following link: https://github.com/Jacksonalcazar/Prediction-of-FLT3-Inhibitory-Activity. This tool is user-friendly, delivering results swiftly within seconds.
3. Materials and Methods
3.1. Data Curation
Data on FLT3 inhibitor compounds with published IC50 values were systematically extracted from the PubChem database [40,41] using the Requests library [42] and subsequently organized in a tabular format with the Pandas library [43] in Python 3. The dataset underwent rigorous cleaning where duplicate entries were removed. We focused on compounds with an IC50 value under 10 µM to prioritize higher potency for our analysis.
In the final stage of data preparation, we implemented feature scaling to standardize the range of independent variables, ensuring that our ANN algorithms could perform optimally. This process was vital for maintaining data integrity and compatibility of ANN-K and ANN-P that are sensitive to the scale of input data. We employed the Standard Scaler method from the scikit-learn library (sklearn) [44], which standardizes features by removing the mean and scaling to unit variance. This normalization technique was applied to the training data using the fit_transform method, which computes the mean and standard deviation of each feature. Importantly, these parameters were then used to scale the test data using the transform method. This approach ensures that the model is not biased by any information from the test dataset, adhering strictly to the principles of statistical learning.
3.2. Molecular Descriptor Calculation
Initially, 1511 molecular descriptors were computed using PaDEL-Descriptor 2.21 [45] and RDKit [22]. The dataset was curated to exclude descriptors either incompatible with all compounds or constant across the dataset, reducing the number of descriptors to 1269. This curation was essential to ensure data quality and relevance for the machine learning model, focusing on meaningful descriptors for interpretability and accuracy.
3.3. Benchmarking Machine Learning Methods with External Validation
The dataset, which includes 1350 compounds and 1269 descriptors, was imported using Python 3 in conjunction with the Pandas library [43]. The experimental pIC50 values served as our target variable. To ensure a balanced representation of the dataset, we split it into training and testing sets in an 80:20 ratio using ’train_test_split’ function of sklearn [44], with the ’random state’ parameter set to 11 for reproducibility.
The machine learning models deployed in this study, implemented using sklearn [44], included the Random Forest Regressor (RFR) [25], Gradient Boosting Regressor (GBR) [26], Support Vector Machine (SVM) [27], Kernel Ridge Regression (KRR) [27], Gaussian Process Regressor (GPR) [28], Bagging with Random Forest (BRF) [29]. Additionally, two Artificial Neural Network (ANN) architectures were implemented using Keras (ANN-K) [30] and PyTorch (ANN-P) [31]. Consistency in random state settings was maintained across the applicable models. Specific hyperparameters were carefully chosen to optimize model performance: the number of base estimators in BRF was set to 10; the alpha parameter in KRR and GPR was set to 100 and 1x10⁻¹⁰, respectively.
3.3.1. ANNs Architecture
The ANN-K was designed as a sequential model, consisting of three dense layers: a first layer with 500 neurons to handle the large number of features; a smaller intermediate layer with 5 neurons for abstract data representations; and a final single-neuron output layer, which was used for pIC50 value regression. The ReLU activation function was used in the first two layers, with linear activation in the output layer, and weights initialized using the HeNormal initializer. This architecture was mirrored in the PyTorch implementation (ANN-P), which also featured an input layer with 500 neurons, an intermediate layer with 5 neurons, and a single-neuron output layer, utilizing ReLU activation and default initializers of PyTorch. Both models underwent data normalization using StandardScaler of sklearn and were trained for 100 epochs to balance learning and prevent overfitting. They were compiled using the Adam optimizer and the mean squared error loss function.
3.3.2. Model Evaluation and Validation
Model performance was evaluated using coefficient of determination (R2), Mean Absolute Error (MAE), Standard Deviation (SD), and Root Mean Squared Error (RMSE) on both training and testing datasets. These metrics were derived using the ’sklearn.metrics’ module, which offers robust tools for model evaluation. The testing datasets were specifically used for external validation, providing a comprehensive view of predictive accuracy and error characteristics for each model. Ensuring reproducibility was a fundamental aspect of this methodology. This was achieved by using random seeds (set to 11) consistently across numpy, TensorFlow-Keras/PyTorch, and sklearn models, thereby maintaining a reliable and consistent assessment of performance.
3.4. Component Optimization through Feature Selection
3.4.1. Individual Descriptor Evaluation
To ascertain the influence of each molecular descriptor on the prediction of FLT3 inhibitor activity, the analysis was conducted within the established framework (80:20 training:test split, random state = 11). Each descriptor was examined utilizing the RFR model, which was identified as the most effective in our earlier benchmarking. The evaluation centered on the coefficient of determination within the test set (R2 test). This metric was crucial as it quantitatively reflected the relevance of the descriptor, directly linking its presence to the precision of the predictions of the model.
3.4.2. Analysis and Feature Selection Process
The next step entailed analyzing the top 100 descriptors using the R2 test metric to understand their correlation with FLT3 inhibitory activity. This analysis led to a selective inclusion of descriptors, starting with the most correlated and progressively adding less correlated ones. This process aimed to find an optimal balance between model complexity and predictive accuracy.
3.5. Internal Validation
After the benchmarking phase and component optimization, the optimal model underwent internal validation using a Leave-One-Out Cross-Validation technique. This method, implemented via the LeaveOneOut class from the ‘sklearn.model_selection’ module in Python, involves training the model on all data points except for one, which is reserved for testing. This process is systematically repeated for each data point in the dataset. During this comprehensive validation process, the prediction accuracy of the model was quantified using the R2 metric (). This key parameter enables the comparison of the performance of our selected method with that of previous studies, ensuring its robustness beyond a fixed dataset.
3.6. Ligand-Based Virtual Screening
In the search for new and potential FLT3 tyrosine kinase inhibitors, a virtual screening was conducted using the PubChem database [40]. The analysis was performed by referencing structural similarity with the top 100 most active compounds, comparing each one individually. In other words, each of the top 100 most active compounds was compared using the Tanimoto coefficient [46] with 10.2 million molecules from PubChem [40,47], setting a similarity threshold of 90%. This analysis was carried out using the Request library and the Similarity operation from PubChem’s PUG-REST data. Finally, the obtained SMILES codes were filtered, eliminating known FLT3 tyrosine kinase inhibitors.
The filtered list of SMILES codes was then processed through the model using the developed script. By predicting the pIC50 values, the model facilitated the prioritization of the five most promising compounds, streamlining the path towards experimental validation and accelerating the discovery of potent FLT3 tyrosine kinase inhibitors.
4. Conclusions
This study has successfully demonstrated the applicability and efficacy of a QSAR-ML hybrid model in predicting the pIC50 values of FLT3 tyrosine kinase inhibitors, based on the structural intricacies of ligands. This success is possible thanks to training with a wide variety of molecules, capturing the intrinsic factors involved with their activity. The comprehensive dataset, extensive molecular descriptor analysis, and meticulous benchmarking of various machine learning algorithms have culminated in a model that showcases superior predictive capabilities based on its accuracy and simplicity. Notably, the Random Forest Regressor emerged as the most effective model, validated through rigorous external and internal validation methods. This model serves as a simple and reliable tool for identifying potential FLT3 inhibitors, as evidenced by its of 0.926 across a broad and heterogeneous dataset. Additionally, it demonstrates an R2 of 0.941 and an SD of 0.237 in predicting the pIC50 values for 270 FLT3 tyrosine kinase inhibitor compounds outside the training set.
Moreover, the component optimization and feature selection process have highlighted the critical importance of specific molecular descriptors in FLT3 inhibitor efficacy, providing valuable insights into the structural features that influence inhibitor activity. This understanding facilitates the rational design of new FLT3 inhibitors, consequently streamlining the drug discovery process by focusing on compounds that exhibit these key structural characteristics.
Furthermore, the development of a user-friendly, script-like tool for the prediction of pIC50 values represents a significant contribution to the cheminformatics toolbox, offering researchers a practical and efficient means of evaluating the FLT3 inhibitory potential of new compounds, including the application of ligand-based virtual screening.
In summary, our study provides a simple model for predicting the pIC50 values of FLT3 tyrosine kinase inhibitors and sets a new benchmark in the integration of machine learning and QSAR methodologies for drug discovery. This approach offers enhanced predictive accuracy and user-friendly access, facilitating the rapid identification of new therapeutic candidates against AML via FLT3 inhibition.
Author Contributions
JJA Formal analysis, Methodology, Project administration and Lead of contribution; JJA and PRC Validation of results; JJA, IS, CM, BM, GS, DM and FD Investigation; Data curation and Writing of original draft. All authors reviewed the manuscript. All authors have read and agreed to the published version of the manuscript.
Funding
This research was funded by by FONDEQUIP EQM150093, which provided essential computational resources.
Data Availability Statement
We have made the prediction model publicly available. You can access the script at the following GitHub repository: https://github.com/Jacksonalcazar/Prediction-of-FLT3-Inhibitory-Activity.
Acknowledgments
J.J.A. and P.R.C. thank the Vicerectoria de Investigación y Doctorado (VRID) and Instituto de Ciencias e Innovación en Medicina (ICIM) at the Universidad del Desarrollo for their invaluable support. Special appreciation is extended to Alessandra Misad for proofreading the manuscript.
Conflicts of Interest
The authors declare no conflicts of interest. The funders had no role in the design of the study; in the collection, analyses, or interpretation of data; in the writing of the manuscript; or in the decision to publish the results.
References
- Birg, F.; Courcoul, M.; Rosnet, O.; Bardin, F.; Pébusque, M.J.; Marchetto, S.; Tabilio, A.; Mannoni, P.; Birnbaum, D. Expression of the FMS/KIT-like gene FLT3 in human acute leukemias of the myeloid and lymphoid lineages. Blood 1992, 80, 2584–2593. [Google Scholar] [CrossRef] [PubMed]
- Small, D. FLT3 mutations: biology and treatment. Hematology / the Education Program of the American Society of Hematology. American Society of Hematology. Education Program 2006, 2006, 178–184. [Google Scholar] [CrossRef] [PubMed]
- Barley, K.; Navada, S.C. Acute myeloid leukemia. Oncology 2019, 373, 308–318. [Google Scholar] [CrossRef]
- Kazi, J.U.; Rönnstrand, L. FMS-like tyrosine kinase 3/FLT3: From basic science to clinical implications. Physiological Reviews 2019, 99, 1433–1466. [Google Scholar] [CrossRef] [PubMed]
- Kantarjian, H.M.; Short, N.J.; Fathi, A.T.; Marcucci, G.; Ravandi, F.; Tallman, M.; Wang, E.S.; Wei, A.H. Acute Myeloid Leukemia: Historical Perspective and Progress in Research and Therapy Over 5 Decades. Clinical Lymphoma, Myeloma and Leukemia 2021, 21, 580–597. [Google Scholar] [CrossRef] [PubMed]
- Wei, A.H.; Tiong, I.S. Midostaurin, enasidenib, CPX-351, gemtuzumab ozogamicin, and venetoclax bring new hope to AML. Blood 2017, 130, 2469–2474. [Google Scholar] [CrossRef]
- Daver, N.; Wei, A.H.; Pollyea, D.A.; Fathi, A.T.; Vyas, P.; DiNardo, C.D. New directions for emerging therapies in acute myeloid leukemia: the next chapter. Blood Cancer Journal 2020, 10, 1–12. [Google Scholar] [CrossRef]
- Kantarjian, H.; Kadia, T.; DiNardo, C.; Daver, N.; Borthakur, G.; Jabbour, E.; Garcia-Manero, G.; Konopleva, M.; Ravandi, F. Acute myeloid leukemia: current progress and future directions. Blood Cancer Journal 2021, 11, 1–25. [Google Scholar] [CrossRef]
- Jaramillo, S.; Schlenk, R.F. Update on current treatments for adult acute myeloid leukemia: To treat acute myeloid leukemia intensively or non-intensively? That is the question. Haematologica 2023, 108, 342–352. [Google Scholar] [CrossRef]
- Kumar Kar, R.; Suryadevara, P.; Roushan, R.; Chandra Sahoo, G.; Ranjan Dikhit, M.; Das, P. Quantifying the Structural Requirements for Designing Newer FLT3 Inhibitors. Medicinal Chemistry 2012, 8, 913–927. [Google Scholar] [CrossRef]
- Shih, K.C.; Lin, C.Y.; Chi, H.C.; Hwang, C.S.; Chen, T.S.; Tang, C.Y.; Hsiao, N.W. Design of novel FLT-3 inhibitors based on dual-layer 3D-QSAR model and fragment-based compounds in silico. Journal of Chemical Information and Modeling 2012, 52, 146–155. [Google Scholar] [CrossRef] [PubMed]
- Abutayeh, R.F.; Taha, M.O. Discovery of novel Flt3 inhibitory chemotypes through extensive ligand-based and new structure-based pharmacophore modelling methods. Journal of Molecular Graphics and Modelling 2019, 88, 128–151. [Google Scholar] [CrossRef] [PubMed]
- Bhujbal, S.P.; Keretsu, S.; Cho, S.J. Design of New Therapeutic Agents Targeting FLT3 Receptor Tyrosine Kinase Using Molecular Docking and 3D-QSAR Approach. Letters in Drug Design & Discovery 2019, 17, 585–596. [Google Scholar] [CrossRef]
- Fernandes, Í.A.; Resende, D.B.; Ramalho, T.C.; Kuca, K.; Da Cunha, E.F.F. Theoretical studies aimed at finding FLT3 inhibitors and a promising compound and molecular pattern with dual aurora B/FLT3 activity. Molecules 2020, 25, 1726. [Google Scholar] [CrossRef]
- Ghosh, S.; Keretsu, S.; Cho, S.J. Molecular modeling studies of n-phenylpyrimidine-4-amine derivatives for inhibiting FMS-like tyrosine kinase-3. International Journal of Molecular Sciences 2021, 22, 12511. [Google Scholar] [CrossRef]
- Sandoval, C.; Torrens, F.; Godoy, K.; Reyes, C.; Farías, J. Application of Quantitative Structure-Activity Relationships in the Prediction of New Compounds with Anti-Leukemic Activity. International Journal of Molecular Sciences 2023, 24, 12258. [Google Scholar] [CrossRef]
- Islam, M.R.; Osman, O.I.; Hassan, W.M. Identifying novel therapeutic inhibitors to target FMS-like tyrosine kinase-3 (FLT3) against acute myeloid leukemia: a molecular docking, molecular dynamics, and DFT study. Journal of Biomolecular Structure and Dynamics 2023. [Google Scholar] [CrossRef]
- Nasimian, A.; Al Ashiri, L.; Ahmed, M.; Duan, H.; Zhang, X.; Rönnstrand, L.; Kazi, J.U. A Receptor Tyrosine Kinase Inhibitor Sensitivity Prediction Model Identifies AXL Dependency in Leukemia. International Journal of Molecular Sciences 2023, 24, 3830. [Google Scholar] [CrossRef]
- Janssen, A.P.; Grimm, S.H.; Wijdeven, R.H.; Lenselink, E.B.; Neefjes, J.; Van Boeckel, C.A.; Van Westen, G.J.; Van Der Stelt, M. Drug Discovery Maps, a Machine Learning Model That Visualizes and Predicts Kinome-Inhibitor Interaction Landscapes. Journal of Chemical Information and Modeling 2019, 59, 1221–1229. [Google Scholar] [CrossRef]
- Zhao, Y.; Tian, Y.; Pang, X.; Li, G.; Shi, S.; Yan, A. Classification of FLT3 inhibitors and SAR analysis by machine learning methods. Molecular Diversity 2023, 1, 1–17. [Google Scholar] [CrossRef]
- Eckardt, J.N.; Bornhäuser, M.; Wendt, K.; Middeke, J.M. Application of machine learning in the management of acute myeloid leukemia: Current practice and future prospects. Blood Advances 2020, 4, 6077–6085. [Google Scholar] [CrossRef] [PubMed]
- Landrum, G. RDKit: Open-source cheminformatics 2022_9_5 (Q3 2022). 2023. Available online: http://www.rdkit.org. [CrossRef]
- Durant, J.L.; Leland, B.A.; Henry, D.R.; Nourse, J.G. Reoptimization of MDL keys for use in drug discovery. Journal of chemical information and computer sciences 2002, 42, 1273–1280. [Google Scholar] [CrossRef] [PubMed]
- Butina, D. Unsupervised data base clustering based on daylight’s fingerprint and Tanimoto similarity: A fast and automated way to cluster small and large data sets. Journal of Chemical Information and Computer Sciences 1999, 39, 747–750. [Google Scholar] [CrossRef]
- Breiman, L. Random forests. Machine Learning 2001, 45, 5–32. [Google Scholar] [CrossRef]
- Friedman, J.H. Greedy function approximation: A gradient boosting machine. Annals of Statistics 2001, 29, 1189–1232. [Google Scholar] [CrossRef]
- Hearst, M.A.; Dumais, S.T.; Osuna, E.; Platt, J.; Scholkopf, B. Support vector machines. IEEE Intelligent Systems and their applications 1998, 13, 18–28. [Google Scholar] [CrossRef]
- Williams, C.; Rasmussen, C. Gaussian processes for regression. Advances in neural information processing systems 1995, 8. [Google Scholar]
- Altman, N.; Krzywinski, M. Ensemble methods: bagging and random forests. Nature pubchemds 2017, 14, 933–935. [Google Scholar] [CrossRef]
- Chollet, F. Keras. Github Repos. 2015. Available online: https://github.com/fchollet/keras.
- Paszke, A.; Gross, S.; Massa, F.; Lerer, A.; Bradbury, J.; Chanan, G.; Killeen, T.; Lin, Z.; Gimelshein, N.; Antiga, L.; others. Pytorch: An imperative style, high-performance deep learning library. Advances in neural information processing systems 2019, 32. [Google Scholar]
- Marino, S.; Zhao, Y.; Zhou, N.; Zhou, Y.; Toga, A.W.; Zhao, L.; Jian, Y.; Yang, Y.; Chen, Y.; Wu, Q.; Others. Compressive Big Data Analytics: An ensemble meta-algorithm for high-dimensional multisource datasets. Plos one 2020, 15, e0228520. [Google Scholar] [CrossRef]
- Hall, L.H.; Kier, L.B. Electrotopological State Indices for Atom Types: A Novel Combination of Electronic, Topological, and Valence State Information. Journal of Chemical Information and Computer Sciences 1995, 35, 1039–1045. [Google Scholar] [CrossRef]
- Euldji, I.; Si-Moussa, C.; Hamadache, M.; Benkortbi, O. QSPR Modelling of the Solubility of Drug and Drug-like Compounds in Supercritical Carbon Dioxide. Molecular Informatics 2022, 41, 2200026. [Google Scholar] [CrossRef] [PubMed]
- Platts, J.A.; Butina, D.; Abraham, M.H.; Hersey, A. Estimation of molecular linear free energy relation descriptors using a group contribution approach. Journal of Chemical Information and Computer Sciences 1999, 39, 835–845. [Google Scholar] [CrossRef]
- Lin, C.; Xiaoxiao, Z. Optimizing Drug Screening with Machine Learning. 2022 19th International Computer Conference on Wavelet Active Media Technology and Information Processing, ICCWAMTIP 2022; 2022. [Google Scholar] [CrossRef]
- Ibrahim, Z.Y.; Uzairu, A.; Shallangwa, G.; Abechi, S. QSAR and molecular docking based design of some indolyl-3-ethanone-α-thioethers derivatives as Plasmodium falciparum dihydroorotate dehydrogenase (PfDHODH) inhibitors. SN Applied Sciences 2020, 2, 1–12. [Google Scholar] [CrossRef]
- Lee, L.Y.; Hernandez, D.; Rajkhowa, T.; Smith, S.C.; Raman, J.R.; Nguyen, B.; Small, D.; Levis, M. Preclinical studies of gilteritinib, a next-generation FLT3 inhibitor. Blood 2017, 129, 257–260. [Google Scholar] [CrossRef]
- Shimada, I.; Kurosawa, K.; Matsuya, T.; Iikubo, K.; Kondoh, Y.; Kamikawa, A.; Tomiyama, H.; Iwai, Y. Patent US8969336, 2015. Available online: https://patents.google.com/patent/US8969336B2.
- PubChem Substructure Fingerprint. 2023. (accessed on 10 December 2023).
- Kim, S.; Chen, J.; Cheng, T.; Gindulyte, A.; He, J.; He, S.; Li, Q.; Shoemaker, B.A.; Thiessen, P.A.; Yu, B.; others. PubChem 2023 update. Nucleic acids research 2023, 51, D1373–D1380. [Google Scholar] [CrossRef]
- Kenneth Reitz. Requests: HTTP for Humans™ — Requests 2.26.0 documentation, 2021. Available online: https://docs.python-requests.org/en/latest/.
- McKinney, W.; Team, P.D. Pandas - Powerful Python Data Analysis Toolkit. 2015. Available online: https://pandas.pydata.org.
- Fabian Pedregosa.; Gaël Varoquaux.; Alexandre Gramfort.; Vincent Michel.; Bertrand Thirion.; Olivier Grisel.; Mathieu Blondel.; Peter Prettenhofer.; Ron Weiss.; Vincent Dubourg.; Jake Vanderplas.; Alexandre Passos.; David Cournapeau.; Matthieu Brucher.; Matthieu Perrot.; Édouard Duchesnay. Scikit-learn: Machine Learning in Python. Journal of Machine Learning Research 2011, 12, 2825–2830. [Google Scholar]
- Yap, C.W. PaDEL-descriptor: An open source software to calculate molecular descriptors and fingerprints. Journal of Computational Chemistry 2011, 32, 1466–1474. [Google Scholar] [CrossRef]
- Bajusz, D.; Rácz, A.; Héberger, K. Why is Tanimoto index an appropriate choice for fingerprint-based similarity calculations? Journal of Cheminformatics 2015, 7, 1–13. [Google Scholar] [CrossRef]
- PubChem, 2023. [Accessed November 28, 2023].
Figure 1.
Molecular Diversity Clustering Analysis.
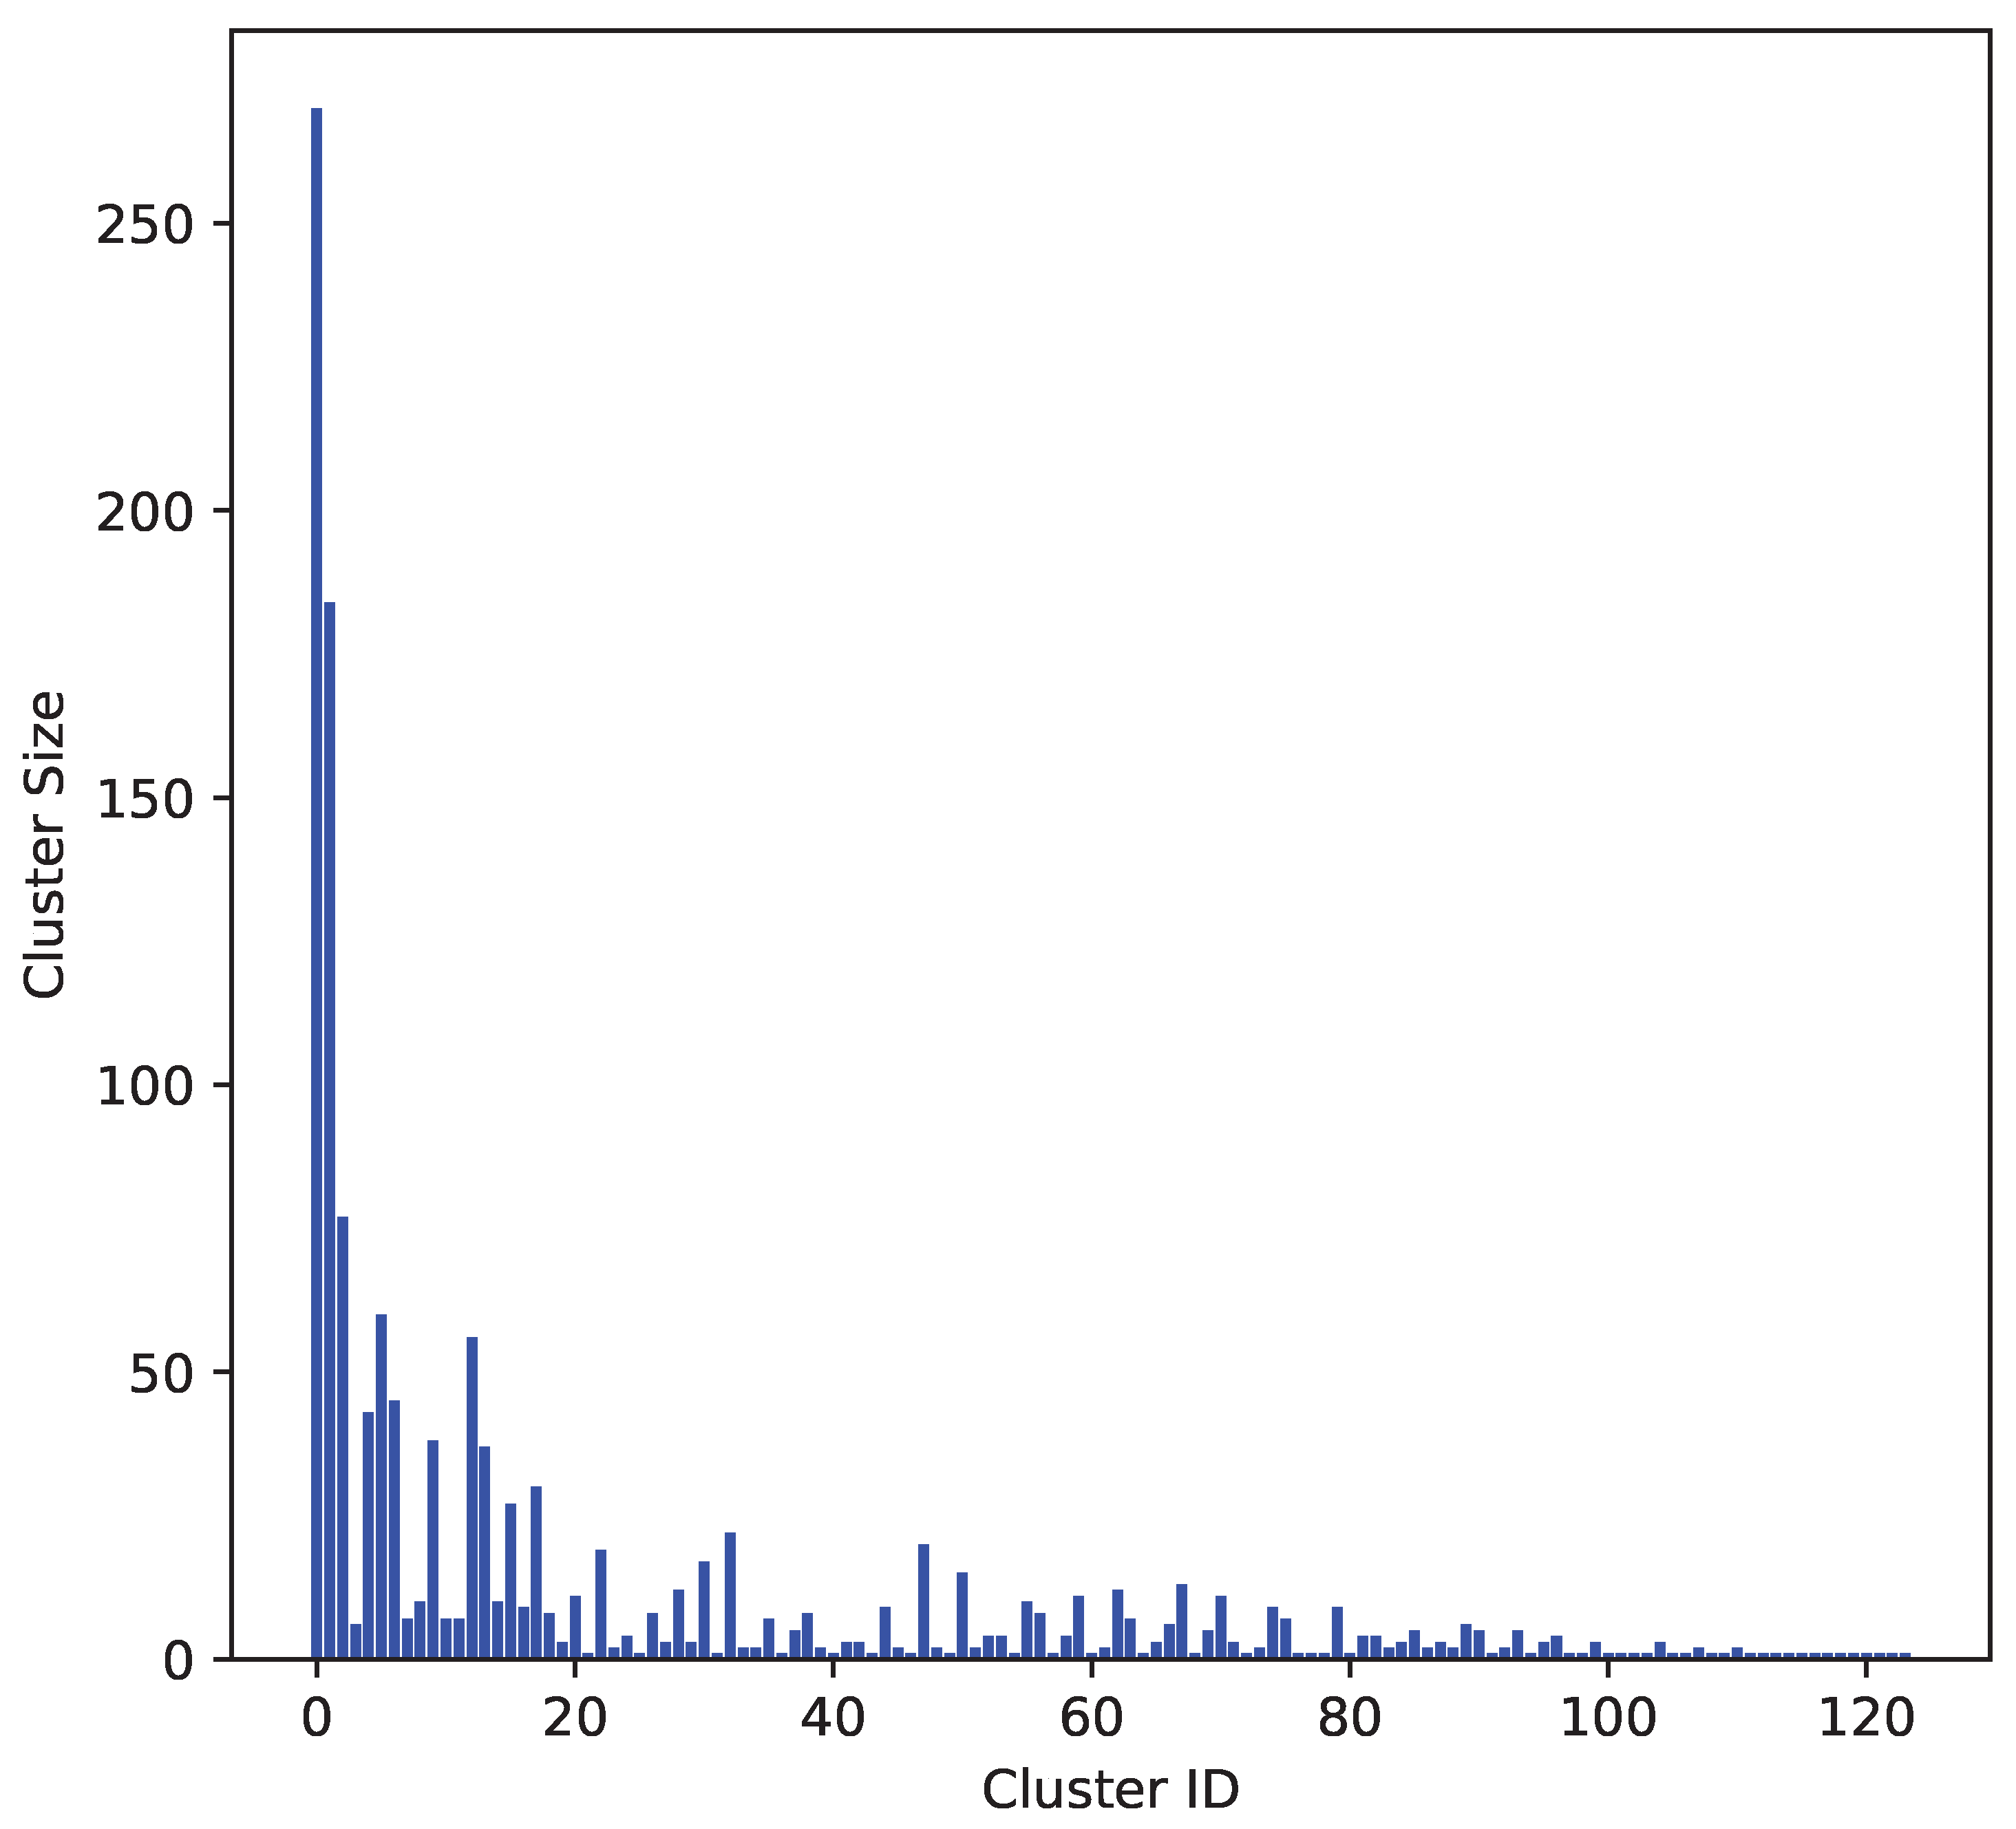
Figure 2.
Variation in R2 test values as a function of the number of descriptors, ranked from most to least significant.
Figure 2.
Variation in R2 test values as a function of the number of descriptors, ranked from most to least significant.
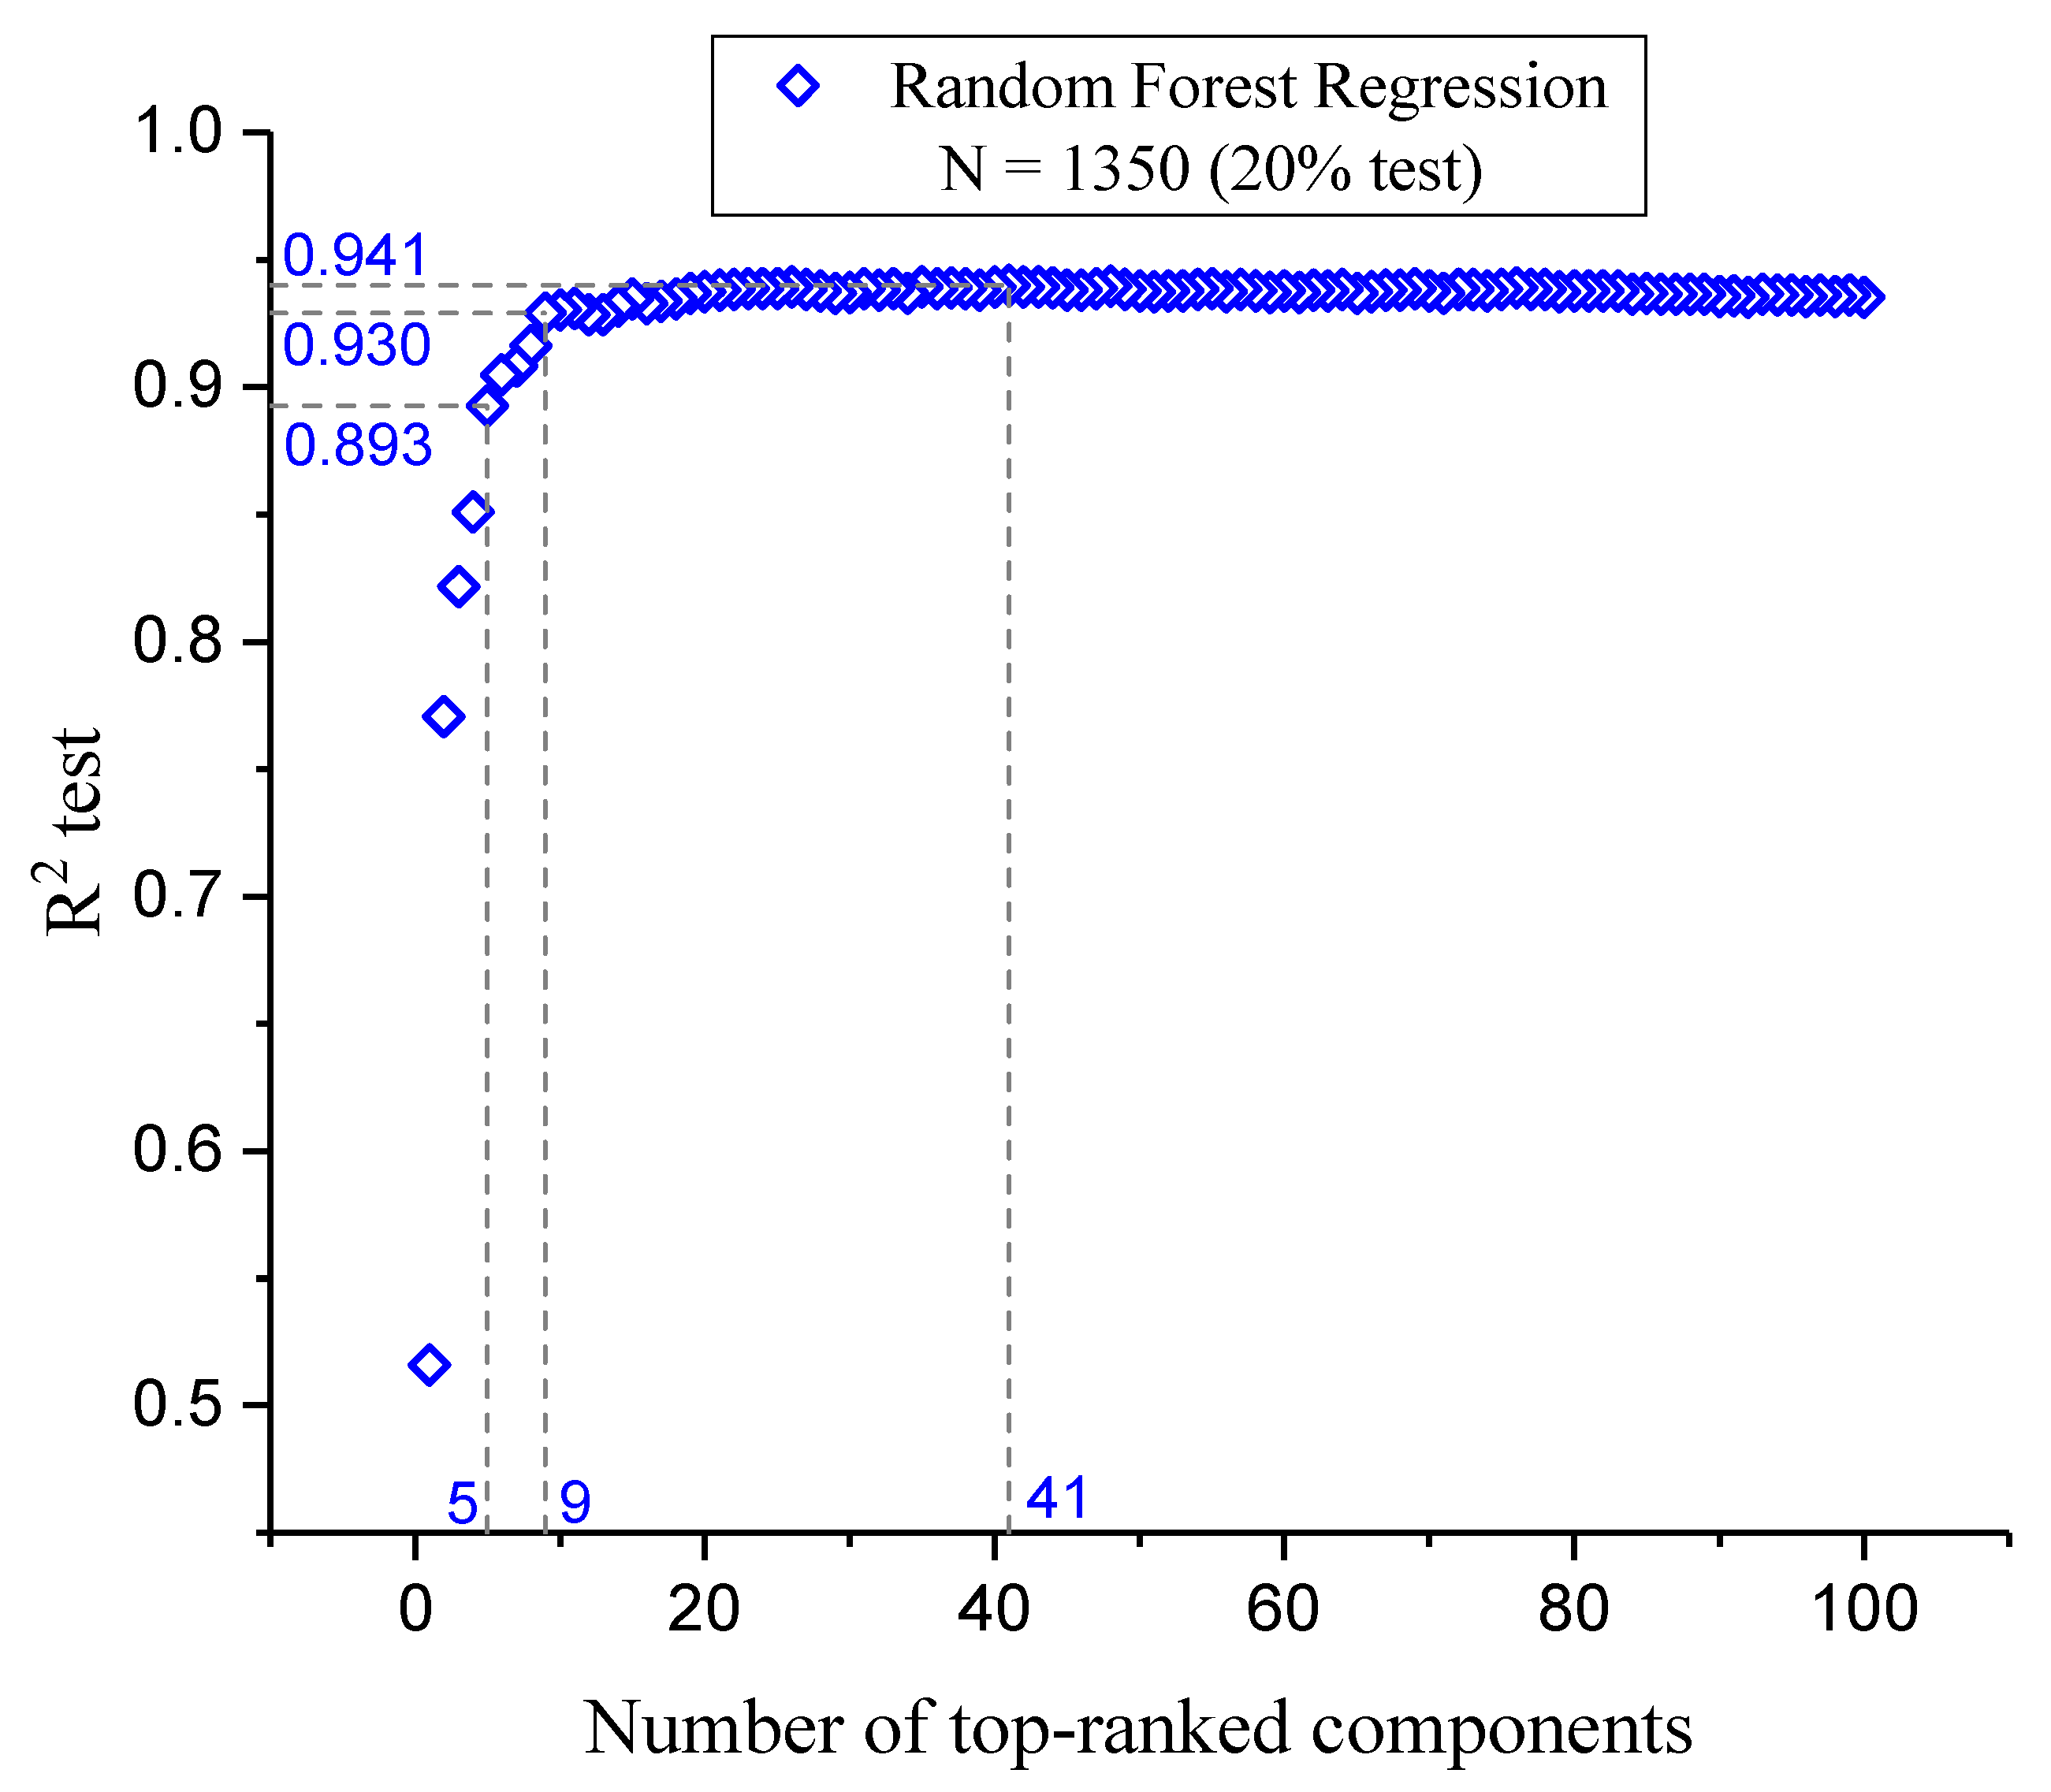
Figure 3.
Correlation matrix of 41 descriptors and inhibitory activity (pIC50). The heatmap displays the pairwise correlation coefficients among the descriptors, including their relationship with the dependent variable, pIC50. The color palette ranges from -1 (dark blue), indicating a strong negative correlation, to 1 (dark red), indicating a strong positive correlation. Neutral correlations are represented by white.
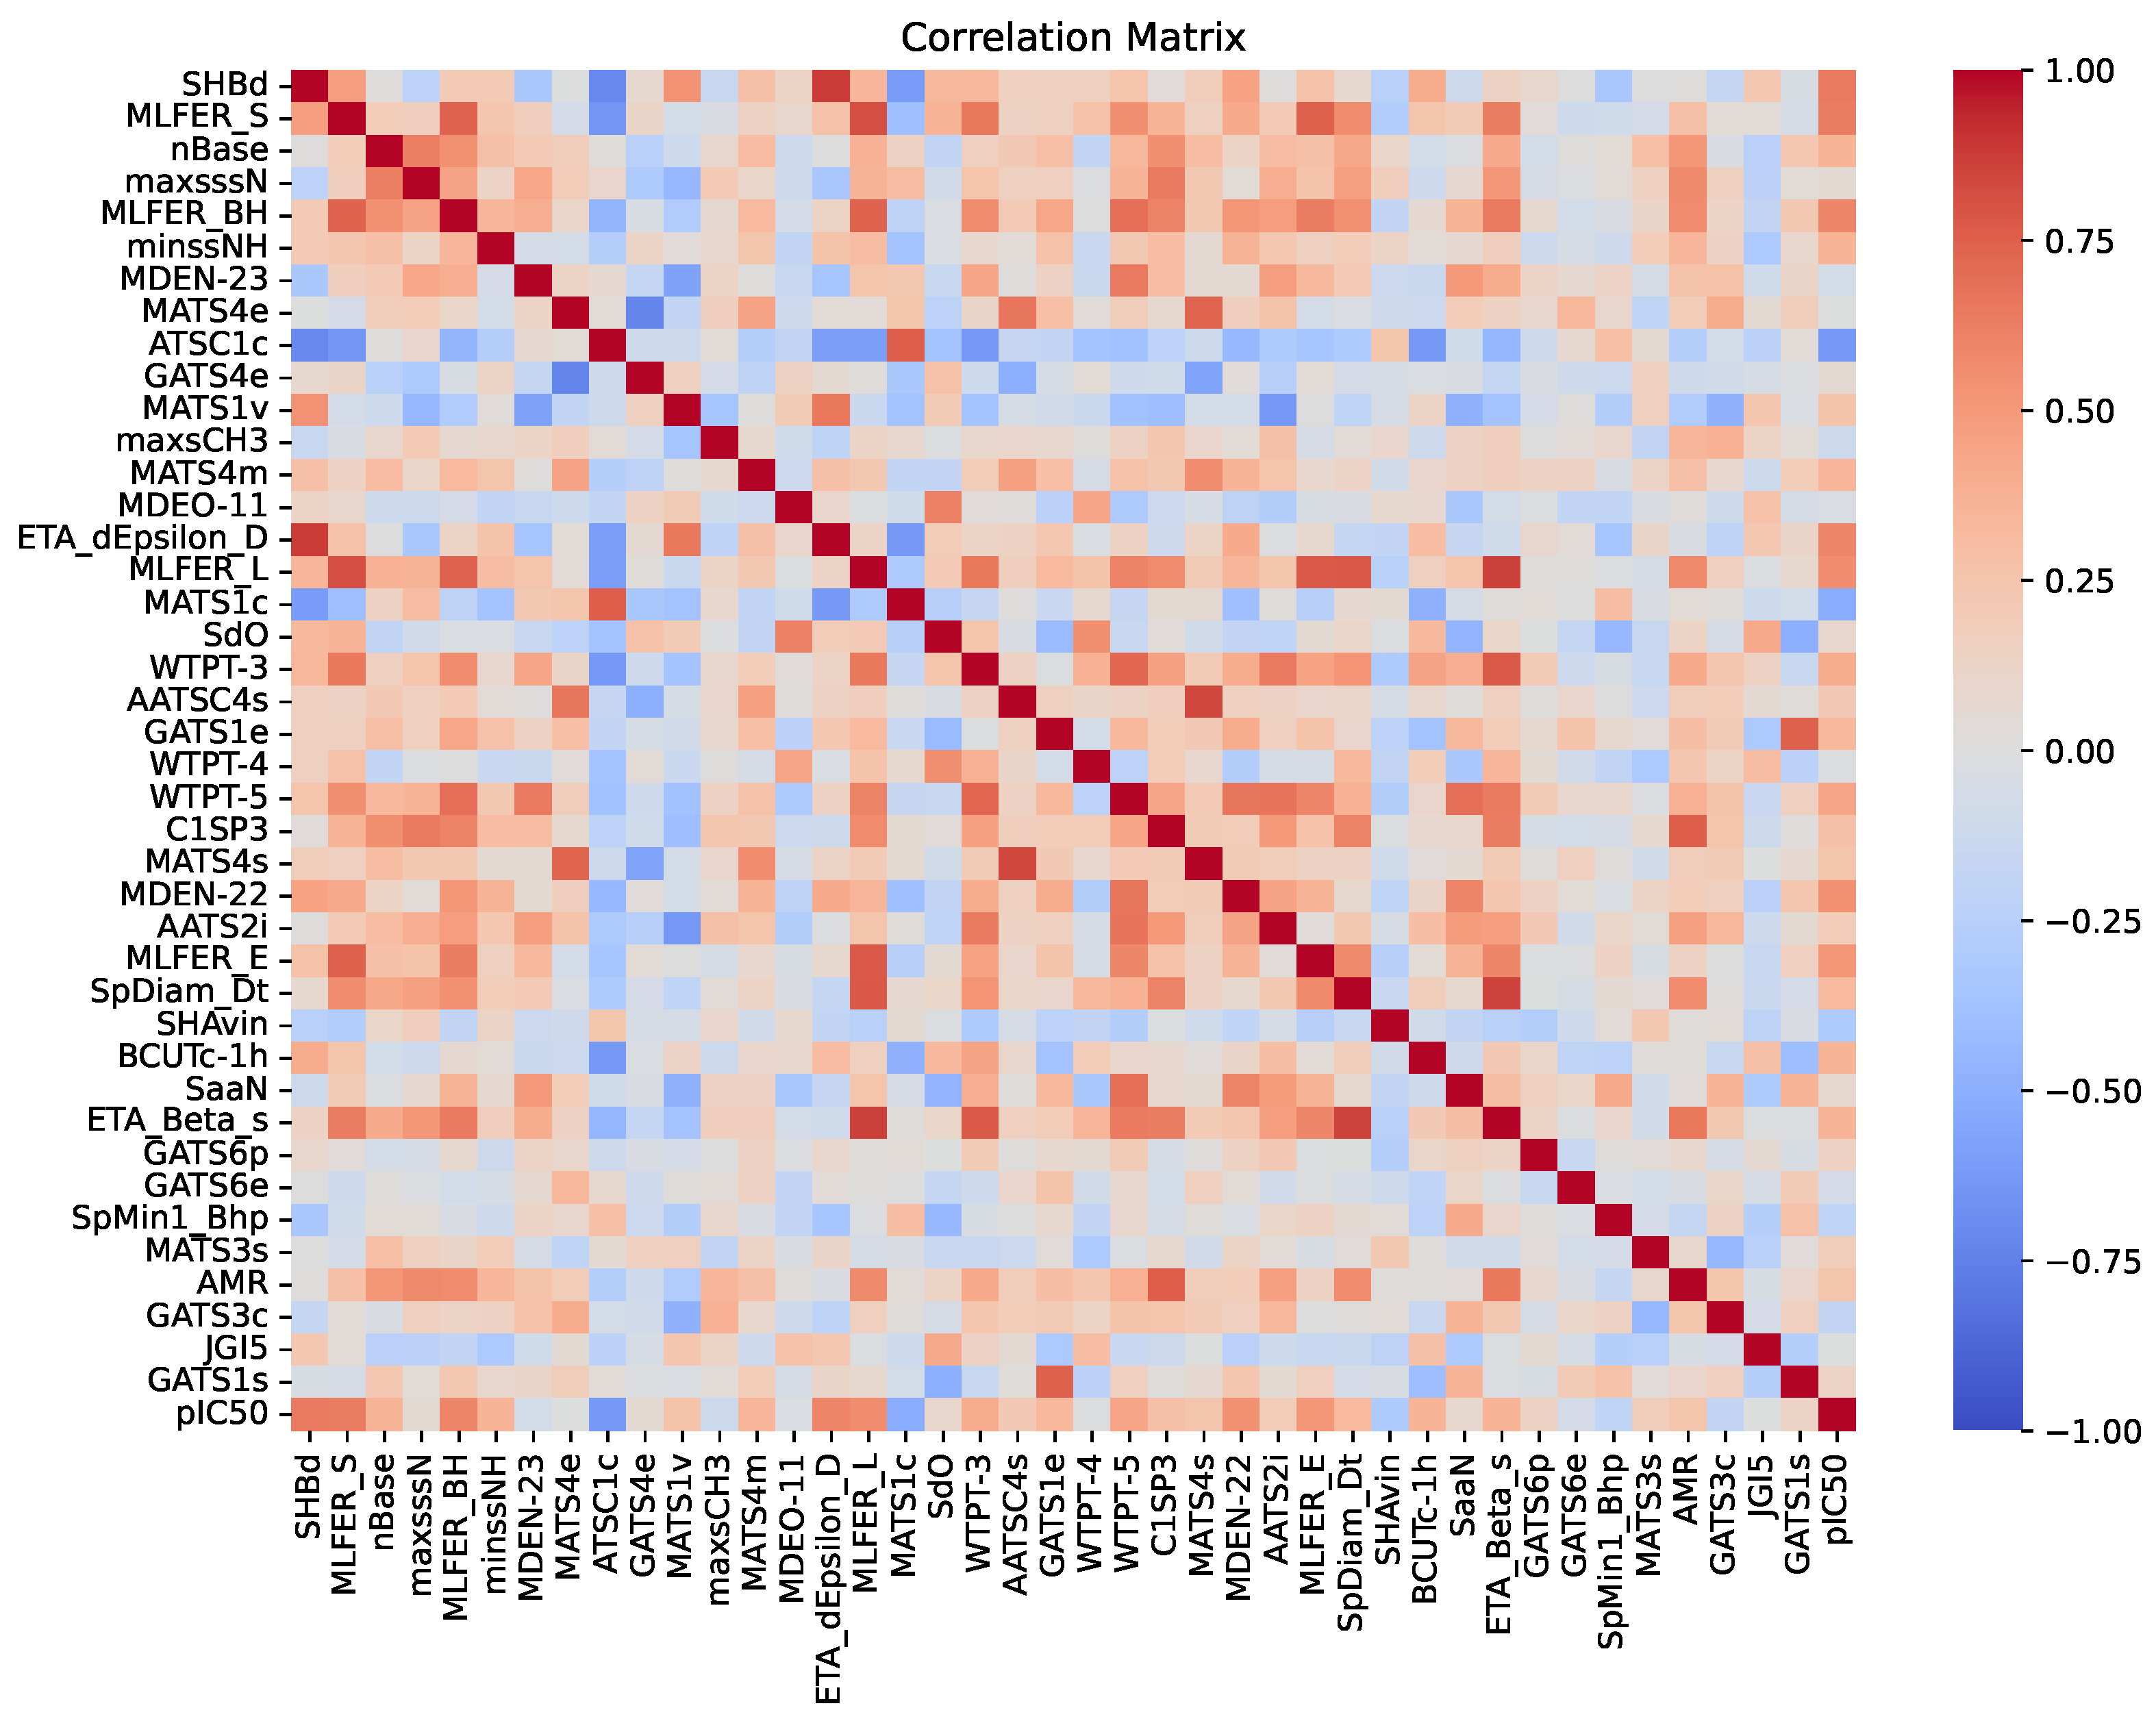
Figure 4.
(A) Scatter plot illustrating the performance of the Random Forest Regression (RFR) model. The model was trained with 1080 compounds (green points) and externally tested on 270 compounds (red points). The plot shows the correlation between the predicted and experimental pIC50 values for FLT3 tyrosine kinase inhibitors. (B) Illustration of the developed tool for predicting pIC50 values of FLT3 tyrosine kinase inhibitors.
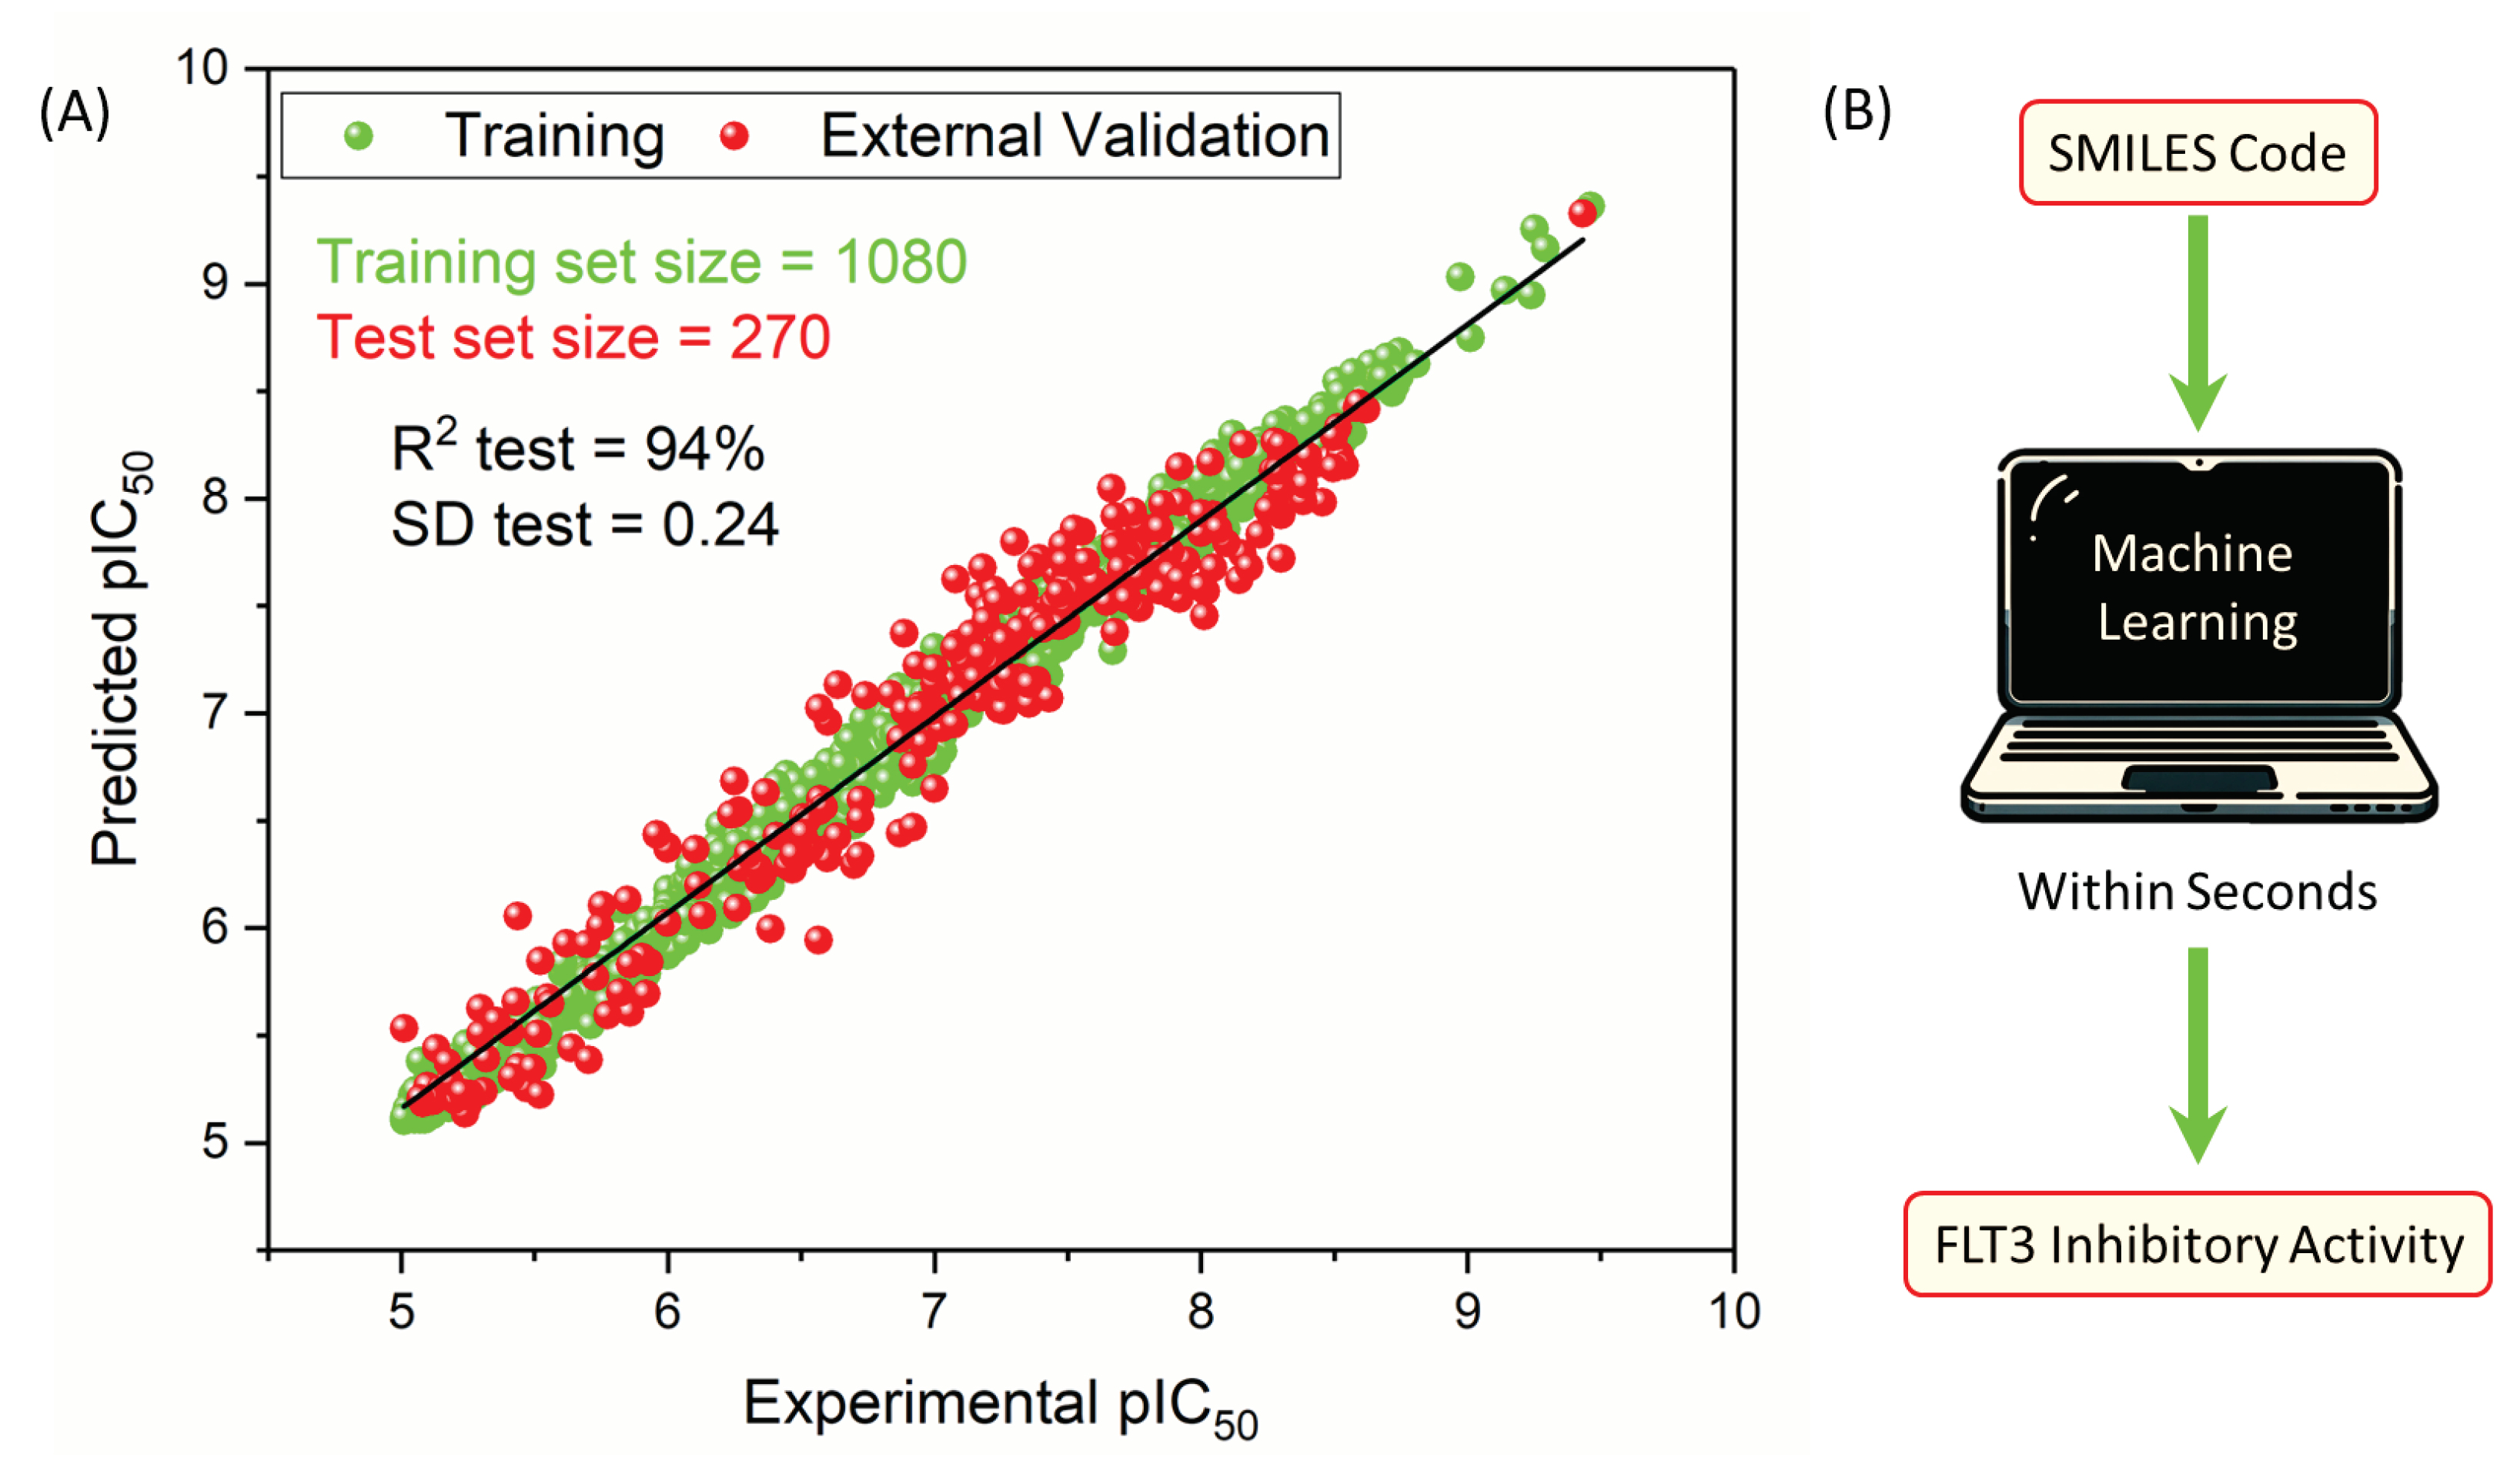
Figure 5.
Scatter plots to show the relation between the five key molecular descriptors and the FLT3 inhibitor potency of molecules in both the training set and test set. Range with higher values of potency highlighted in green in each plot.
Figure 5.
Scatter plots to show the relation between the five key molecular descriptors and the FLT3 inhibitor potency of molecules in both the training set and test set. Range with higher values of potency highlighted in green in each plot.
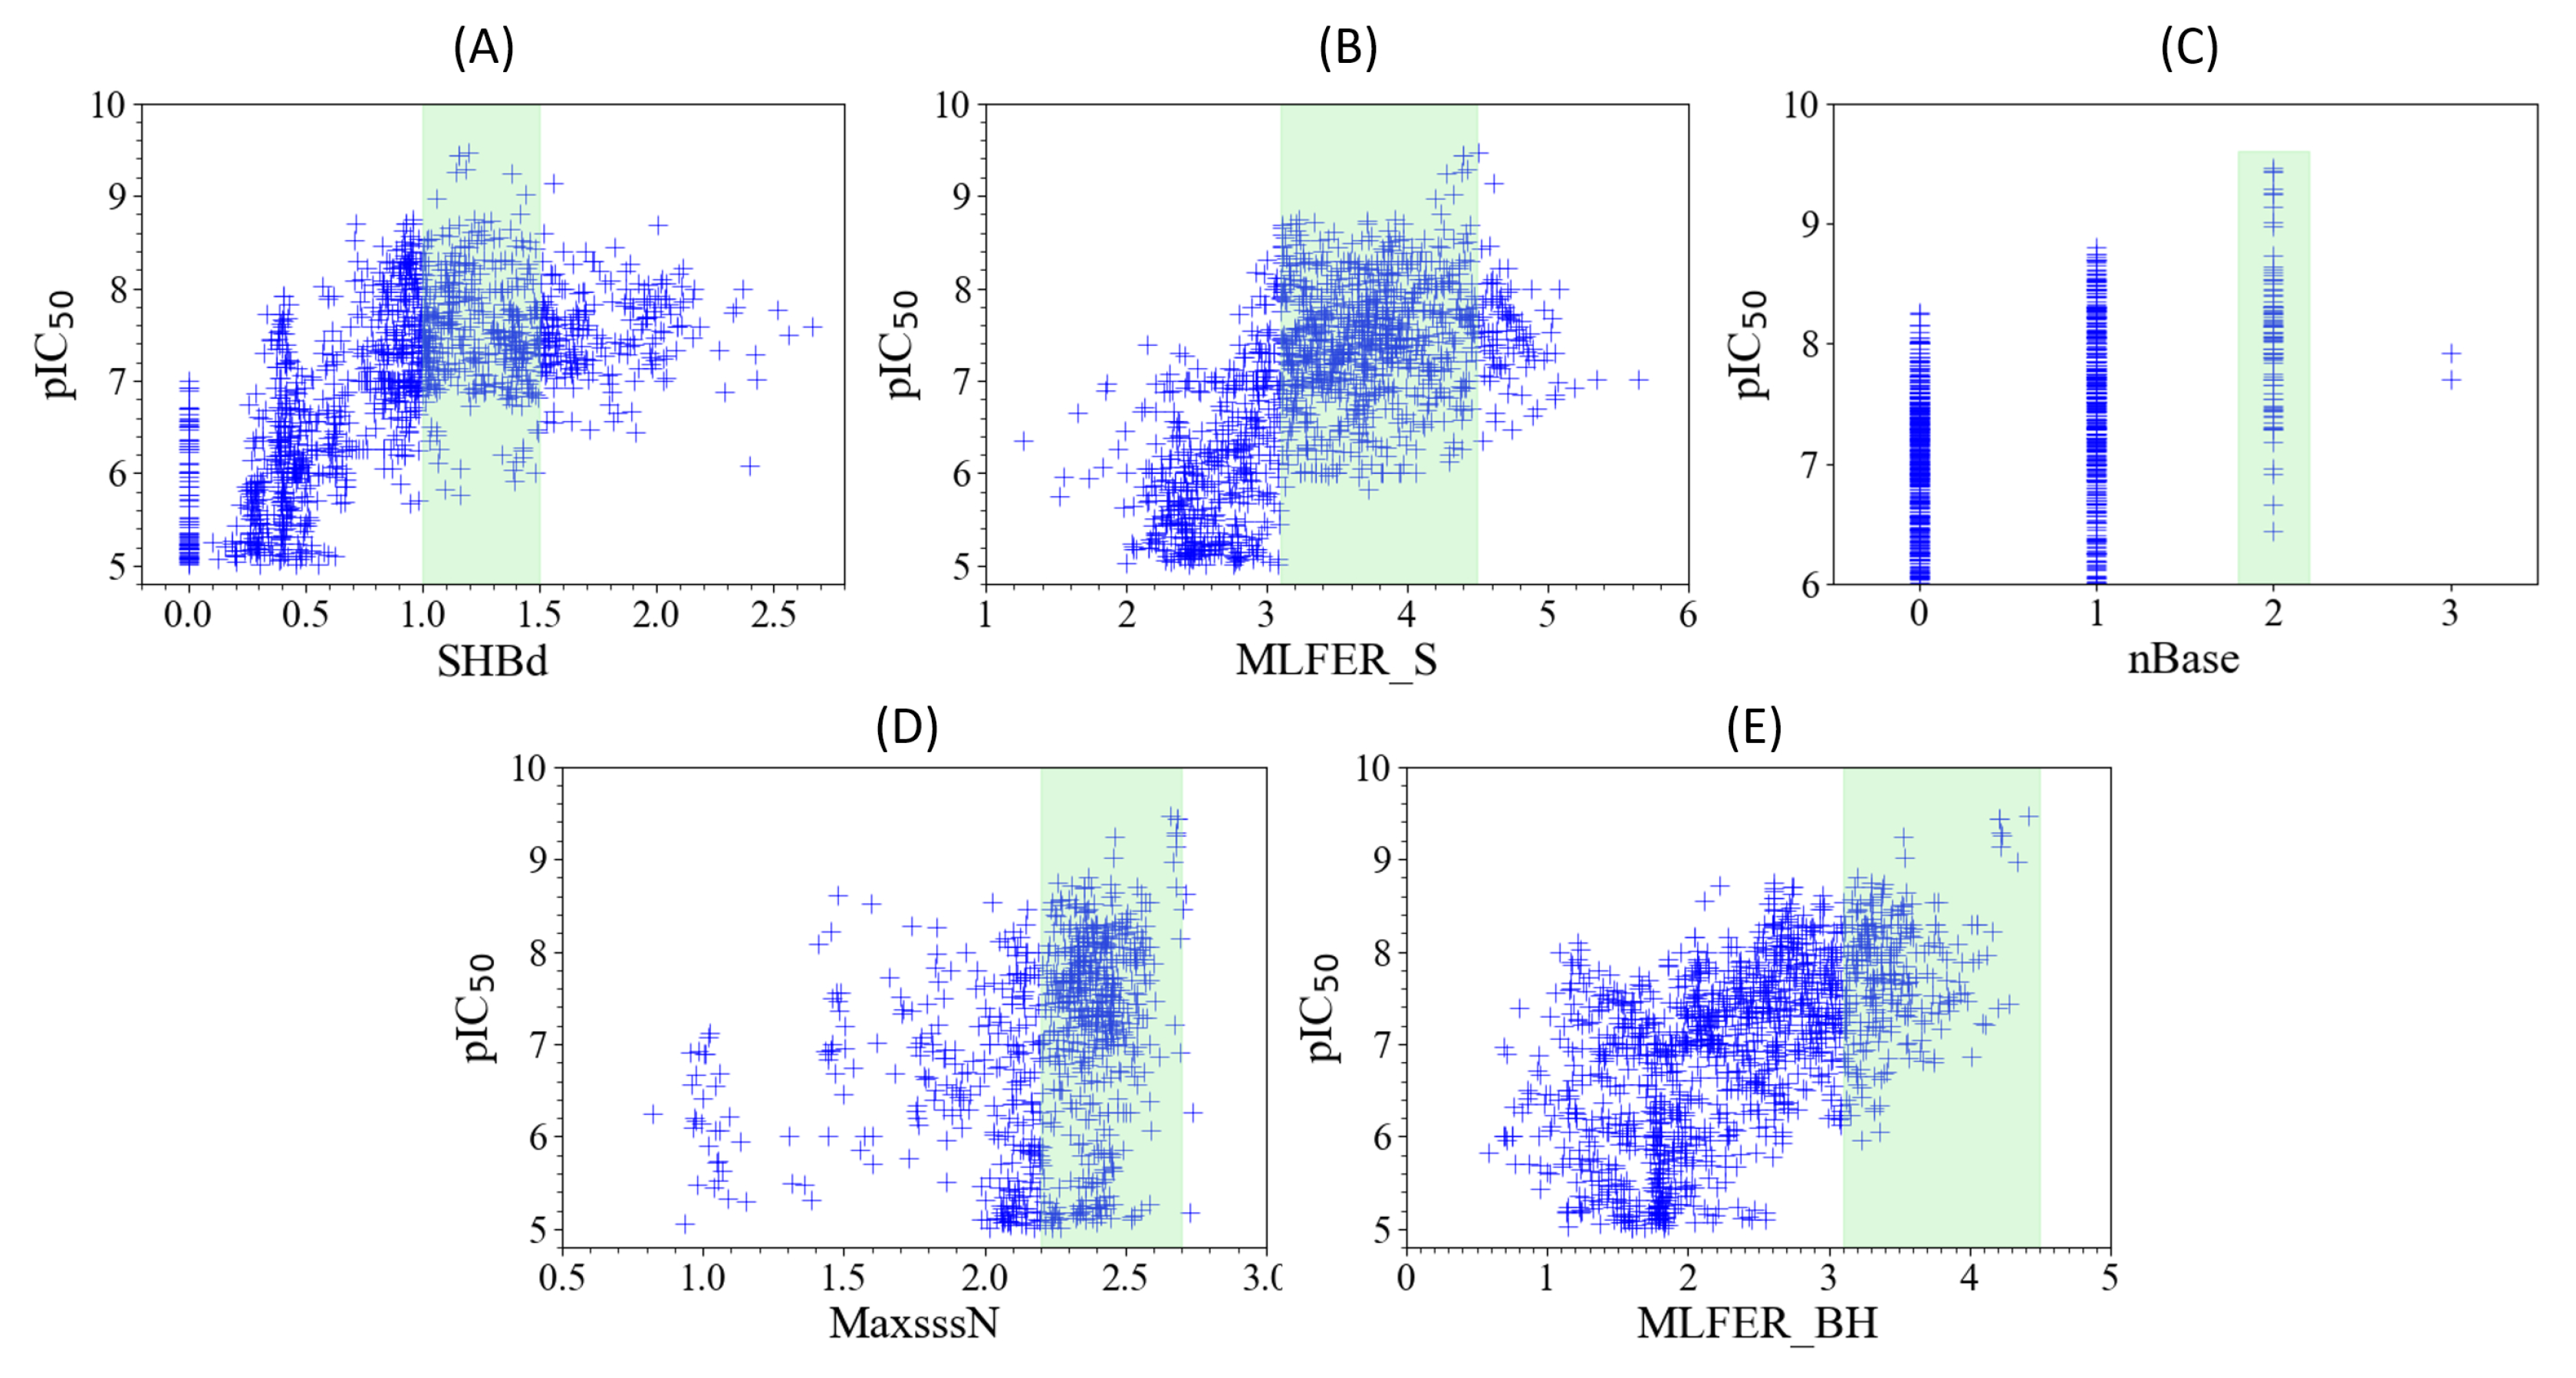

Table 1.
Performance comparison of machine learning models for predicting pIC50 values of FLT3 tyrosine kinase inhibitor compounds.
Table 1.
Performance comparison of machine learning models for predicting pIC50 values of FLT3 tyrosine kinase inhibitor compounds.
| Metrics/ML | RFR | GBR | KRR | GPR | BRF | ANN-K | ANN-P |
|---|---|---|---|---|---|---|---|
| R2 training | 0.988 | 0.973 | 0.546 | 0.641 | 0.967 | 0.988 | 0.983 |
| MAE training | 0.082 | 0.126 | 0.489 | 0.469 | 0.136 | 0.070 | 0.082 |
| SD training | 0.102 | 0.154 | 0.638 | 0.526 | 0.172 | 0.101 | 0.121 |
| RMSE training | 0.102 | 0.154 | 0.638 | 0.568 | 0.172 | 0.103 | 0.123 |
| R2 test | 0.936 | 0.939 | 0.592 | -0.228 | 0.931 | 0.907 | 0.895 |
| MAE test | 0.197 | 0.195 | 0.484 | 0.876 | 0.207 | 0.235 | 0.248 |
| SD test | 0.246 | 0.237 | 0.619 | 0.932 | 0.255 | 0.296 | 0.313 |
| RMSE test | 0.246 | 0.239 | 0.620 | 1.076 | 0.256 | 0.297 | 0.315 |
Table 2.
Performance of Random Forest models for predicting pIC50 values of FLT3 tyrosine kinase inhibitor compounds based on 41 components.
Table 2.
Performance of Random Forest models for predicting pIC50 values of FLT3 tyrosine kinase inhibitor compounds based on 41 components.
| Training set | Test set | |
|---|---|---|
| Size | 1080 | 270 |
| R2 | 0.989 | 0.941 |
| MAE | 0.081 | 0.193 |
| SD | 0.101 | 0.237 |
| RMSE | 0.101 | 0.238 |
| 0.926 | ||
Table 3.
Comparative performance of QSAR models for FLT3 inhibitors.
| Kara | Shihaa | Abutayehaa | Bhujbalaa | Fernandesaa | Ghoshaa | This | |
|---|---|---|---|---|---|---|---|
| (2012) | (2012) | (2019) | (2020) | (2020) | (2021) | work | |
| Dataset size | 67 | 72 | 93 | 63 | 40 | 40 | 1350 |
| Train set size | 51 | 25 | 76 | 45 | 28 | 30 | 1080 |
| Test set size | 16 | 47 | 17 | 18 | 12 | 10 | 270 |
| R2 training | 0.956 | 0.98 | 0.86 | 0.956 | 0.80 | 0.983 | 0.989 |
| R2 test | 0.891 | 0.76 | 0.57 | 0.707 | 0.80 | 0.698 | 0.941 |
| SD test | 0.435 | 0.66 | - | > 0.895 | 0.31 | 0.452 | 0.237 |
| 0.747 | 0.58 | 0.65 | 0.57 | 0.60 | 0.802 | 0.926 |
Table 4.
Name and characterization of the five most important descriptors for the model development, ordered by priority.
Table 4.
Name and characterization of the five most important descriptors for the model development, ordered by priority.
| Priority | Descriptor | Name | Description |
|---|---|---|---|
| 1° | SHBdb [33,34] | Sum of E-States for (strong) hydrogen bond donors | The value is calculated as the sum of each atom capable of donating a hydrogen atom, weighted by its electronic environment and topological position (E-State). |
| 2° | MLFER_S [34,35] | Molecular Linear-Free Energy Relation_S | Cumulative sum of the free energy contributions of solvatophilic groups in a molecule, calculated using previously established empirical values on their interactions with solvents. |
| 3° | nBase | Number of basic groups | Number of basic groups in the molecule, especially nitrogenous groups. |
| 4° | MaxsssN [33,36] | Maximum atom-type E-State: > N- | Maximum electrotopological state present in nitrogen atoms with three single bonds. |
| 5° | MLFER_BH [35,37] | Overall or summation solute hydrogen bond basicity | Total hydrogen bond basicity in a molecule calculated by summing the contributions of all possible hydrogen bond acceptor sites in the molecule. |
Table 5.
Top five candidates for FLT3 inhibitors identified by ligand-based virtual screening.
| IUPAC name | Structure | pIC50 |
|---|---|---|
| 6-Ethyl-3-[3-methoxy-4-[4-(1-methylpiperidin-4-yl)piperazin-1-yl]anilino]-5-(oxan-4-ylamino)pyrazine-2-carboxamide | 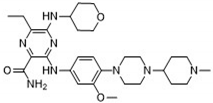 |
9.34 |
| 6-Ethyl-3-[3-methoxy-4-[4-(4-propan-2-ylpiperazin-1-yl) piperidin-1-yl]anilino]-5-(oxan-4-ylamino)pyrazine-2-carboxamide | 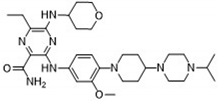 |
9.34 |
| 3-[4-[4-(1-Methylpiperidin-4-yl)piperazin-1-yl]anilino]-5-(oxan-4-ylamino)-6-propan-2-ylpyrazine-2-carboxamide | 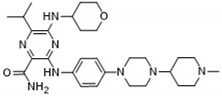 |
9.29 |
| 6-(1-Methyl-3,6-dihydro-2H-pyridin-4-yl)-3-[4-[4-(4-methylpiperazin-1-yl)piperidin-1-yl]anilino]-5-(oxan-4-ylamino)pyrazine-2-carboxamide | 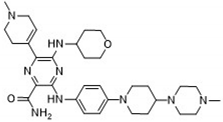 |
9.27 |
| 6-Ethyl-3-[4-[4-(4-methylpiperazin-1-yl)piperidin-1-yl]-3-propan-2-yloxyanilino]-5-(oxan-4-ylamino)pyrazine-2-carboxamide | 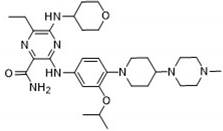 |
9.27 |
Disclaimer/Publisher’s Note: The statements, opinions and data contained in all publications are solely those of the individual author(s) and contributor(s) and not of MDPI and/or the editor(s). MDPI and/or the editor(s) disclaim responsibility for any injury to people or property resulting from any ideas, methods, instructions or products referred to in the content. |
© 2024 by the authors. Licensee MDPI, Basel, Switzerland. This article is an open access article distributed under the terms and conditions of the Creative Commons Attribution (CC BY) license (http://creativecommons.org/licenses/by/4.0/).
Copyright: This open access article is published under a Creative Commons CC BY 4.0 license, which permit the free download, distribution, and reuse, provided that the author and preprint are cited in any reuse.


