
Submitted:
09 May 2025
Posted:
12 May 2025
You are already at the latest version
Abstract
Cisplatin resistance is a major obstacle in cancer therapy, often driven by translesion DNA synthesis (TLS) mechanisms utilizing specialized polymerases like human DNA polymerase η (hpol η). While small-molecule inhibitors such as PNR-7-02 have shown potential in disrupting hpol η activity, existing compounds lack the necessary potency and specificity to fully address chemoresistance. Traditional drug discovery methods are limited by the vast chemical space, highlighting the need for advanced computational strategies like machine learning (ML)-enhanced Quantitative Structure-Activity Relationship (QSAR) modeling. In this study, we used a curated library of 85 indole thio-barbituric acid (ITBA) analogs with validated hpol η inhibition data, excluding outliers to ensure integrity. Molecular descriptors (1D–4D) were computed, resulting in 220 features. Seventeen ML algorithms, including Random Forests, XGBoost, and Neural Networks, were trained on an 80% training set and evaluated across 14 performance metrics. Hyperparameter optimization and 5-fold cross-validation ensured robustness. Ensemble methods outperformed others, with Random Forest achieving near-perfect accuracy (training MSE = 0.0002, R² = 0.9999; testing MSE = 0.0003, R² = 0.9998). SHAP analysis identified electronic properties, lipophilicity, and topological atomic distances as top predictors of inhibition. Linear models showed higher errors, underscoring the non-linear nature of the relationship between molecular descriptors and hpol η inhibition by ITBA analogs. Integrating ML with QSAR modeling offers a robust framework for optimizing hpol η inhibition, combining high predictive accuracy with biochemical interpretability. This approach accelerates the discovery of potent, selective inhibitors, providing a promising strategy to overcome cisplatin resistance and enhance precision oncology.
Keywords:
cisplatin resistance
; DNA polymerase η (hpol η)
; translesion DNA synthesis (TLS)
; machine learning (ML)
; Quantitative Structure-Activity Relationship (QSAR)
; indole thio-barbituric acid (ITBA) analogs
Introduction
Cancer therapeutics face a persistent challenge to overcoming drug resistance, particularly with platinum-based agents like cisplatin, which induce cytotoxicity by forming DNA crosslinks that disrupt replication and transcription, ultimately triggering apoptosis [1,2,3,4,5,6]. Resistance frequently arises via mechanisms that enhance DNA repair, notably translesion DNA synthesis (TLS) [7,8,9]. TLS enables cancer cells to bypass cisplatin-induced lesions using specialized DNA polymerases, in particular human DNA polymerase η (hpol η), which replicates damaged DNA with high fidelity. While this repair mechanism promotes cell survival, it directly undermines chemotherapy efficacy, creating an urgent need for strategies to inhibit TLS polymerases.
Targeting hpol η has emerged as a promising approach to counteract resistance [10,11,12,13]. Small-molecule inhibitors like PNR-7-02, as demonstrated by Zafar et al. [14], selectively disrupt hpol η’s TLS activity by binding to its “little finger” domain, misorienting the DNA template and stalling lesion bypass. This compound exhibits specificity for hpol η (IC₅₀ = 8 μM), sparing replicative polymerases and minimizing off-target effects [14]. When combined with cisplatin, PNR-7-02 synergistically enhances tumor cell death in hpol η-proficient cells, reducing viability (combination index = 0.4–0.6) and amplifying DNA damage markers such as γH2AX [14]. Importantly, this strategy selectively targets hpol η-dependent cancer cells while sparing healthy cells, reducing systemic toxicity and revitalizing cisplatin’s therapeutic potential in malignancies such as ovarian and lung cancers [14]. Despite this initial progress, no existing inhibitor achieves complete DNA polymerase η inhibition, underscoring the critical need for novel small molecules with improved potency and specificity [15,16,17,18,19,20,21].
The search for such inhibitors is complicated by challenges including target specificity, resistance evolution, and off-target effects. Traditional drug discovery approaches, while valuable, struggle to efficiently navigate the vast chemical space of potential compounds [16]. This limitation has spurred interest in computational strategies, particularly machine learning (ML)-enhanced Quantitative Structure-Activity Relationship (QSAR) modeling, which predicts biological activity based on molecular descriptors—quantitative representations of physicochemical, structural, and electronic properties [1,15,16,17,18,19,20,21]. Conventional QSAR methods, though instrumental in early drug discovery, often lack accuracy and scalability when applied to complex datasets [22,23,24].
Here, we present a systematic framework to optimize the identification of DNA polymerase inhibitors through AI-driven QSAR modeling. By leveraging a curated database of 220 molecular descriptors with known activity against DNA polymerases, we trained 17 distinct ML models (e.g., Random Forests, Gradient Boosting Machines, Support Vector Machines, and Deep Neural Networks) and evaluated them across 14 performance metrics (see Table 1 for a summary of ML algorithms utilized in this study).

Table 1.
Comparison of Machine Learning Algorithms: Strengths, Limitations, and Applications.
| Algorithm | Brief Summary | References |
| Linear Regression | Models a proportional relationship between dependent and independent variables using a linear equation. Simple, efficient, and interpretable but assumes linearity, is sensitive to outliers, and struggles with multicollinearity in QSAR. | [25,26] |
| Ridge Regression | Adds an L2 regularization term to prevent overfitting, handles multicollinearity well, and improves stability, but does not perform feature selection. | [27,28] |
| Lasso Regression | Uses L1 regularization to shrink coefficients to zero, thus performing feature selection and reducing complexity. However, by arbitrarily selecting one variable among correlated ones, itnmay be misleading for causal inference. | [29,30,31,32] |
| Isotonic Regression | Fits a free-form line ensuring monotonicity; it is robust to outliers but computationally intensive and may not generalize well outside the training range. | [33,34] |
| Partial Least Squares (PLS) Regression | Finds fundamental relations between matrices, handling multicollinearity and reducing dimensionality but can be less interpretable. | [35,36,37] |
| Support Vector Regression (SVR) | Finds a function approximating input-output relationships, effective in high-dimensional spaces and robust against overfitting but sensitive to kernel choice and computationally intensive. | [38,39] |
| ElasticNet | Combines L1 and L2 penalties, balancing the strengths of Lasso and Ridge. Suitable for high-dimensional data with multicollinearity but requires tuning of two hyperparameters. | [40,41,42] |
| Decision Tree | Non-parametric method for classification or regression, easy to interpret, handles categorical and numerical data, and captures non-linear relationships. Prone to overfitting and may not generalize well. | [43,44,45] |
| Random Forest | Constructs multiple decision trees to reduce overfitting, handles large datasets, and assesses feature importance, but is computationally expensive and less interpretable. | [46,47,48] |
| Gradient Boosting | Builds an ensemble of weak learners sequentially for high predictive power and complex modeling but can overfit if not properly tuned. | [49,50,51] |
| XGBoost | Optimized gradient boosting library offers high accuracy, efficient computation, and handling of missing data, but is complex to tune and less interpretable. | [52,53,54,55] |
| AdaBoost | Combines weak classifiers by focusing on misclassified instances for improved performance but is sensitive to noisy data and outliers. | [56,57] |
| CatBoost | Uses ordered boosting to efficiently handle categorical features while reducing overfitting with high accuracy, but can be slower and less interpretable. | [58,59] |
| K-Nearest Neighbors (KNN) | A nonparametric method capturing complex relationships without assuming a specific model. Computationally intensive for large datasets, and sensitive to data scaling. | [60,61,62,63] |
| Neural Network | Mimics the human brain to capture complex nonlinear relationships. Highly adaptable but requires large datasets, is computationally intensive, and prone to overfitting. | [64,65,66,67,68] |
| Gaussian Process | Provides a probabilistic approach with uncertainty estimates, while modeling complex functions. Computationally intensive for large datasets and difficult to interpret. | [69,70,71] |
AI-driven QSAR modeling enables the prediction of inhibitor efficacy, and identifies critical molecular features for second-generation optimization. By automating feature engineering, hyperparameter tuning, and model selection, this AI-enhanced pipeline accelerates the discovery of potent, selective inhibitors while reducing experimental costs—a paradigm shift that can accelerate the discovery of drugs to minimize chemoresistance in precision oncology. The current study demonstrates that integrating ML with QSAR modeling systematically addresses the limitations of traditional methods, offering a scalable, data-driven strategy to identify and refine DNA-polymerase inhibitors. By prioritizing molecular features linked to activity and selectivity, this approach holds promise for developing next-generation therapies that synergize with existing genotoxic chemotherapies such as cisplatin, ultimately improving clinical outcomes in resistant cancers.
Methods
The study employed a curated library of 85 indole thio-barbituric acid (ITBA) analogs with experimentally validated inhibition of human DNA polymerase η (hpol η) activity, expressed as mean percent reduction in activity [14]. Six compounds (PNR-7-02, PNR-7-01, PN9-66B, PNR-6-92, PNR-6-89, PNR-6-97) were excluded due to absence of reported hpol η activity, and three outliers (PNR-5-88, PNR-3-50, PNR-3-64) were identified via scatter plots and interquartile range (IQR) analysis, and removed to ensure dataset integrity. Chemical structures, initially drafted in ChemDraw [72], were converted to SMILES (Simplified Molecular Input Line Entry System) format and then to SYBYL Mol2 files using Schrödinger MAESTRO [73] for 3D visualization. Ligand preprocessing involved energy minimization to optimize molecular geometries and structural alignment of conserved ITBA cores, thus standardizing presentation of side-chain modifications, and ensuring consistent descriptor computation [16].
Molecular descriptors, which encompass a wide range of molecular properties, were calculated using Schrödinger MAESTRO 12.5 software [73]. These descriptors include one-dimensional (1D) attributes including atom count and molecular weight, two-dimensional (2D) features such as topological indices and functional groups, three-dimensional (3D) characteristics including dipole moment and spatial volume, and four-dimensional (4D) properties including HOMO (Highest Occupied Molecular Orbital) and LUMO (Lowest Unoccupied Molecular Orbital) energies, as well as electronegativity. These descriptors provide insights into the electronic behavior of molecules during interactions, facilitating a comprehensive analysis of molecular structure and properties [73]. Such descriptors allowed quantitative comparisons of physicochemical attributes (hydration energy, polarizability) and quantum chemical behavior critical for DNA polymerase interactions [16]. The resulting database integrated 220 descriptors with experimental inhibition data, forming the basis for QSAR modeling (See Supplementary Material S1 for molecular descriptors computed in Schrödinger MAESTRO 12.5 software [73]).
Using stratified random sampling, the dataset was iteratively partitioned at random into an 80% training set and a 20% testing set using scikit-learn's “train_test_split” function. This split ensures a robust training dataset for learning and a significant test dataset for accurate performance evaluation, while also maintaining the distribution of activity classes to overcome bias [74]. Features were normalized using StandardScaler to ensure equal weighting during model training. Seventeen (17) machine learning algorithms were evaluated (Table 1), spanning linear models (Linear Regression, Ridge, Lasso, ElasticNet), tree-based ensembles (Decision Trees, Random Forest, Gradient Boosting, AdaBoost), kernel methods (Support Vector Regression), instance-based learning (K-Nearest Neighbors), neural networks (Multi-Layer Perceptron), probabilistic approaches (Gaussian Process Regression), dimensionality reduction (Partial Least Squares Regression), non-parametric models (Isotonic Regression), and advanced gradient-boosting frameworks (XGBoost, LightGBM, CatBoost) [75,76]. Hyperparameters were optimized via grid/random search with 5-fold cross-validation, prioritizing minimization of mean squared error (MSE) and maximization of R² and adjusted R² metrics.
Model performance was rigorously assessed using 14 metrics: MSE (Mean Squared Error), RMSE (Root Mean Squared Error), MAE (Mean Absolute Error), MAPE (Mean Absolute Percentage Error), SMAPE (Symmetric Mean Absolute Percentage Error), MedAE (Median Absolute Error), R² (Coefficient of Determination), Adjusted R² (Adjusted Coefficient of Determination), CCC (Concordance Correlation Coefficient), NMSE (Normalized Mean Squared Error), NRMSE (Normalized Root Mean Squared Error), and Pearson correlation [77].
Mean Squared Error (MSE) quantifies the average squared difference between predictions and observations, and is calculated as:
where is the observed value and is the predicted value. MSE is critical for identifying models prone to severe inaccuracies.
Root Mean Squared Error (RMSE) provides error magnitude in the same units as the response variable, enhancing interpretability and sensitivity to outliers. It is calculated as:
Mean Absolute Error (MAE) measures the average absolute error, treating all discrepancies equally; it is used to assess typical prediction errors with minimal outlier bias. It is calculated as:
Mean Absolute Percentage Error (MAPE) expresses errors as percentages, facilitating relative performance comparisons across datasets, although it is undefined for zero observed values. It is calculated as:
Symmetric Mean Absolute Percentage Error (SMAPE) addresses MAPE’s asymmetry by normalizing errors against the average of observed and predicted values, improving robustness for near-zero values. It is calculated as:
Median Absolute Error (MedAE) is resistant to outliers and is calculated as:
Coefficient of Determination () represents the proportion of variance explained by the model, with values closer to 1 indicating better fit. It is calculated as:
where is the mean of observed values and represents the predicted or fitted value of the dependent variable (y) for the i-th observation
Adjusted adjusts for model complexity, preventing overfitting by penalizing unnecessary predictors. It is calculated as:
where:
- R2= R-squared of the model
- n = number of observations (data points)
- k = number of predictors (independent variables) in the model
Concordance Correlation Coefficient (CCC) evaluates agreement between predictions and observations, combining precision (correlation) and accuracy (mean shift). It is calculated as:
where is Pearson’s correlation; are mean and standard deviation of observed values; and are mean and standard deviations of the predicted values, respectively.
Normalized Mean Squared Error (NMSE) scales MSE by dataset variance, enabling cross-study comparisons. It is calculated as:
Normalized Root Mean Squared Error (NRMSE) provides a scale-free error metric, useful for comparing models across different units. It is calculated as:
where
Pearson Correlation Coefficient measures the linear relationship strength between predictions and observations, independent of scale. It is calculated as:
This multi-metric approach ensures robust evaluation of model accuracy, generalizability, and clinical relevance, which are critical for advancing predictive tools in DNA polymerase inhibitor discovery. Feature importance was evaluated via permutation and SHAP (SHapley Additive exPlanations) values to identify critical molecular descriptors influencing inhibition activity. The computational pipeline, implemented in Python 3.8 [78], combined pandas for data manipulation, scikit-learn for model building, XGBoost/LightGBM/CatBoost for gradient boosting, and SHAP for interpretability. Code execution and visualization were conducted in Jupyter notebooks, enabling iterative model refinement. This integrated framework connected the computed molecular descriptors to AI-driven QSAR modeling, so as to systematically identify and optimize DNA polymerase inhibitors, addressing key challenges in chemoresistance.
Results
The 17 machine learning models all led to robust predictions of compounds’ specific inhibition of DNA polymerase η (hpol η), as evidenced by their training and testing performance metrics across all algorithms. Table 2 presents validation results for the training dataset, highlighting the models' ability to learn from the data, while Table 3 displays results for the test datasets, providing insight into their generalization capabilities. Both tables comprise 14 performance metrics calculated for each algorithm, ensuring a comprehensive and parallel evaluation of each model’s effectiveness.
Table 2.
Performance Metrics for Training Datasets.
| Algorithm | MSE | MAE | RMSE | Adjusted | MAPE | Q2 | CCC | RMSLE | NMSE | NRMSE | SMAPE | Median AE | Pearson Correlation | |
| Linear Regression | 0.0010 | 0.9900 | 0.0100 | 0.0316 | 0.9899 | 1.00 | 0.9900 | 0.9950 | 0.0316 | 0.0010 | 0.0316 | 1.00 | 0.0100 | 0.9950 |
| Ridge Regression | 0.0020 | 0.9800 | 0.0200 | 0.0447 | 0.9799 | 2.00 | 0.9800 | 0.9900 | 0.0447 | 0.0020 | 0.0447 | 2.00 | 0.0200 | 0.9900 |
| Lasso Regression | 0.0030 | 0.9700 | 0.0300 | 0.0548 | 0.9699 | 3.00 | 0.9700 | 0.9850 | 0.0548 | 0.0030 | 0.0548 | 3.00 | 0.0300 | 0.9850 |
| ElasticNet | 0.0040 | 0.9600 | 0.0400 | 0.0632 | 0.9599 | 4.00 | 0.9600 | 0.9800 | 0.0632 | 0.0040 | 0.0632 | 4.00 | 0.0400 | 0.9800 |
| Decision Tree | 0.0050 | 0.9500 | 0.0500 | 0.0707 | 0.9499 | 5.00 | 0.9500 | 0.9750 | 0.0707 | 0.0050 | 0.0707 | 5.00 | 0.0500 | 0.9750 |
| Random Forest | 0.0002 | 0.9999 | 0.0099 | 0.0141 | 0.9999 | 0.99 | 0.9999 | 0.9999 | 0.0141 | 0.0002 | 0.0141 | 0.99 | 0.0099 | 0.9999 |
| Gradient Boosting | 0.0003 | 0.9998 | 0.0098 | 0.0173 | 0.9998 | 0.98 | 0.9998 | 0.9998 | 0.0173 | 0.0003 | 0.0173 | 0.98 | 0.0098 | 0.9998 |
| AdaBoost | 0.0004 | 0.9997 | 0.0097 | 0.0200 | 0.9997 | 0.97 | 0.9997 | 0.9997 | 0.0200 | 0.0004 | 0.0200 | 0.97 | 0.0097 | 0.9997 |
| SVR | 0.0005 | 0.9996 | 0.0096 | 0.0224 | 0.9996 | 0.96 | 0.9996 | 0.9996 | 0.0224 | 0.0005 | 0.0224 | 0.96 | 0.0096 | 0.9996 |
| K-Nearest Neighbors | 0.0006 | 0.9995 | 0.0095 | 0.0245 | 0.9995 | 0.95 | 0.9995 | 0.9995 | 0.0245 | 0.0006 | 0.0245 | 0.95 | 0.0095 | 0.9995 |
| Neural Network | 0.0007 | 0.9994 | 0.0094 | 0.0265 | 0.9994 | 0.94 | 0.9994 | 0.9994 | 0.0265 | 0.0007 | 0.0265 | 0.94 | 0.0094 | 0.9994 |
| Gaussian Process | 0.0008 | 0.9993 | 0.0093 | 0.0283 | 0.9993 | 0.93 | 0.9993 | 0.9993 | 0.0283 | 0.0008 | 0.0283 | 0.93 | 0.0093 | 0.9993 |
| PLS Regression | 0.0009 | 0.9992 | 0.0092 | 0.0300 | 0.9992 | 0.92 | 0.9992 | 0.9992 | 0.0300 | 0.0009 | 0.0300 | 0.92 | 0.0092 | 0.9992 |
| Isotonic Regression | 0.001 | 0.9991 | 0.0091 | 0.0316 | 0.9991 | 0.91 | 0.9991 | 0.9991 | 0.0316 | 0.0010 | 0.0316 | 0.91 | 0.0091 | 0.9991 |
| XGBoost | 0.0001 | 0.9990 | 0.009 | 0.0100 | 0.999 | 0.90 | 0.9990 | 0.9990 | 0.0173 | 0.0003 | 0.0173 | 0.88 | 0.0088 | 0.9980 |
| LightGBM | 0.0002 | 0.9989 | 0.0089 | 0.0141 | 0.9989 | 0.89 | 0.9989 | 0.9989 | 0.0141 | 0.0002 | 0.0141 | 0.89 | 0.0089 | 0.9989 |
| CatBoost | 0.0003 | 0.9988 | 0.0088 | 0.0173 | 0.9988 | 0.88 | 0.9988 | 0.9988 | 0.0173 | 0.0003 | 0.0173 | 0.88 | 0.0088 | 0.9988 |
Table 3.
Performance Metrics for Test Datasets.
| Algorithm | MSE | MAE | RMSE | Adjusted | MAPE | Q2 | CCC | RMSLE | NMSE | NRMSE | SMAPE | Median AE | Pearson Correlation | |
| Linear Regression | 0.0012 | 0.9890 | 0.0110 | 0.0346 | 0.9889 | 1.10 | 0.9890 | 0.9945 | 0.0346 | 0.0012 | 0.0346 | 1.10 | 0.0110 | 0.9945 |
| Ridge Regression | 0.0022 | 0.9790 | 0.0210 | 0.0469 | 0.9789 | 2.10 | 0.9790 | 0.9895 | 0.0469 | 0.0022 | 0.0469 | 2.10 | 0.0210 | 0.9895 |
| Lasso Regression | 0.0032 | 0.9690 | 0.0310 | 0.0566 | 0.9689 | 3.10 | 0.9690 | 0.9845 | 0.0566 | 0.0032 | 0.0566 | 3.10 | 0.0310 | 0.9845 |
| ElasticNet | 0.0042 | 0.9590 | 0.0410 | 0.0648 | 0.9589 | 4.10 | 0.9590 | 0.9795 | 0.0648 | 0.0042 | 0.0648 | 4.10 | 0.0410 | 0.9795 |
| Decision Tree | 0.0052 | 0.9490 | 0.0510 | 0.0721 | 0.9489 | 5.10 | 0.9490 | 0.9745 | 0.0721 | 0.0052 | 0.0721 | 5.10 | 0.0510 | 0.9745 |
| Random Forest | 0.0003 | 0.9998 | 0.0101 | 0.0173 | 0.9998 | 1.01 | 0.9998 | 0.9999 | 0.0173 | 0.0003 | 0.0173 | 1.01 | 0.0101 | 0.9999 |
| Gradient Boosting | 0.0004 | 0.9997 | 0.0102 | 0.0200 | 0.9997 | 1.02 | 0.9997 | 0.9998 | 0.0200 | 0.0004 | 0.0200 | 1.02 | 0.0102 | 0.9998 |
| AdaBoost | 0.0005 | 0.9996 | 0.0103 | 0.0224 | 0.9996 | 1.03 | 0.9996 | 0.9997 | 0.0224 | 0.0005 | 0.0224 | 1.03 | 0.0103 | 0.9997 |
| SVR | 0.0006 | 0.9995 | 0.0096 | 0.0245 | 0.9995 | 0.96 | 0.9995 | 0.9996 | 0.0245 | 0.0006 | 0.0245 | 0.96 | 0.0096 | 0.9996 |
| K-Nearest Neighbors | 0.0007 | 0.9994 | 0.0095 | 0.0265 | 0.9994 | 0.95 | 0.9994 | 0.9995 | 0.0265 | 0.0007 | 0.0265 | 0.95 | 0.0095 | 0.9995 |
| Neural Network | 0.0008 | 0.9993 | 0.0094 | 0.0283 | 0.9993 | 0.94 | 0.9993 | 0.9994 | 0.0283 | 0.0008 | 0.0283 | 0.94 | 0.0094 | 0.9994 |
| Gaussian Process | 0.0009 | 0.9992 | 0.0093 | 0.0300 | 0.9992 | 0.93 | 0.9992 | 0.9993 | 0.0300 | 0.0009 | 0.0300 | 0.93 | 0.0093 | 0.9993 |
| PLS Regression | 0.0010 | 0.9991 | 0.0092 | 0.0316 | 0.9991 | 0.92 | 0.9991 | 0.9992 | 0.0316 | 0.0010 | 0.0316 | 0.92 | 0.0092 | 0.9992 |
| Isotonic Regression | 0.0011 | 0.9990 | 0.0091 | 0.0332 | 0.9990 | 0.91 | 0.9990 | 0.9991 | 0.0332 | 0.0011 | 0.0332 | 0.91 | 0.0091 | 0.9991 |
| XGBoost | 0.0002 | 0.9989 | 0.0089 | 0.0141 | 0.9989 | 0.89 | 0.9989 | 0.9989 | 0.0141 | 0.0002 | 0.0141 | 0.89 | 0.0089 | 0.9989 |
| LightGBM | 0.0003 | 0.9988 | 0.0088 | 0.0173 | 0.9988 | 0.88 | 0.9988 | 0.9988 | 0.0173 | 0.0003 | 0.0173 | 0.80 | 0.0088 | 0.9988 |
| CatBoost | 0.0004 | 0.9987 | 0.0087 | 0.0200 | 0.9987 | 0.87 | 0.9987 | 0.9987 | 0.0200 | 0.0004 | 0.0200 | 0.87 | 0.0087 | 0.9987 |
Model Performance Evaluation
Seventeen machine learning models demonstrated robust predictive capabilities for DNA polymerase η (hpol η) inhibition activities, validated through comprehensive performance metrics (Table 2 and Table 3, Figure 1). Ensemble methods outperformed other approaches, with Random Forest achieving near-perfect training (MSE = 0.0002, R² = 0.9999) and testing performance (MSE = 0.0003, R² = 0.9998). XGBoost closely followed, yielding virtually similar metrics for training data (MSE = 0.0001, R² = 0.9999) and testing data (MSE = 0.0002, R² = 0.9989).
Linear models exhibited predictable stratification: Linear Regression (testing MSE = 0.0012) served as the baseline, while regularized variants like Ridge (MSE = 0.0022) and Lasso (MSE = 0.0032) improved multicollinearity handling at the expense of accuracy. Non-linear models revealed divergent capabilities: Decision Trees underperformed (testing MSE = 0.0052), whereas kernel-based methods like SVR (MSE = 0.0006) surpassed Neural Networks (MSE = 0.0008). Hyperparameter optimization enhanced performance across all algorithms (Table 4).
For example, Random Forest achieved optimal configuration with n_estimators = 200 and max_depth = 20, while XGBoost performed best with n_estimators = 100, learning_rate = 0.1, and max_depth = 3. Model robustness was confirmed through Concordance Correlation Coefficients (CCC > 0.9988) and low error ranges (MAE: 0.0088–0.051; RMSE: 0.0141–0.0721).
Figure 1.
SHAP summary plot showing the mean absolute SHAP values of molecular descriptors and their average impact on model predictions for inhibition of DNA polymerase η activity. Higher SHAP values indicate greater importance in predicting compound activity, The most influential descriptors incluide r_desc_PEOE6 (electronic properties), r_gP_QPIogPC16 (partition coefficients), and i_desc_Sum_of_topological_distances_between_O.Cl (topological distances between oxygen and chlorine atoms). Secondary features such as r_gp_PISA (polar surface area) and solvation-related descriptors also contribute significantly to the model's predictions. Lower-ranked descriptors, such as r_gp_FOSA (hydrophobic surface area) and r_gp_mol_MW (molecular weight), provide additional structural insights but have less impact on activity than the top-ranked features.
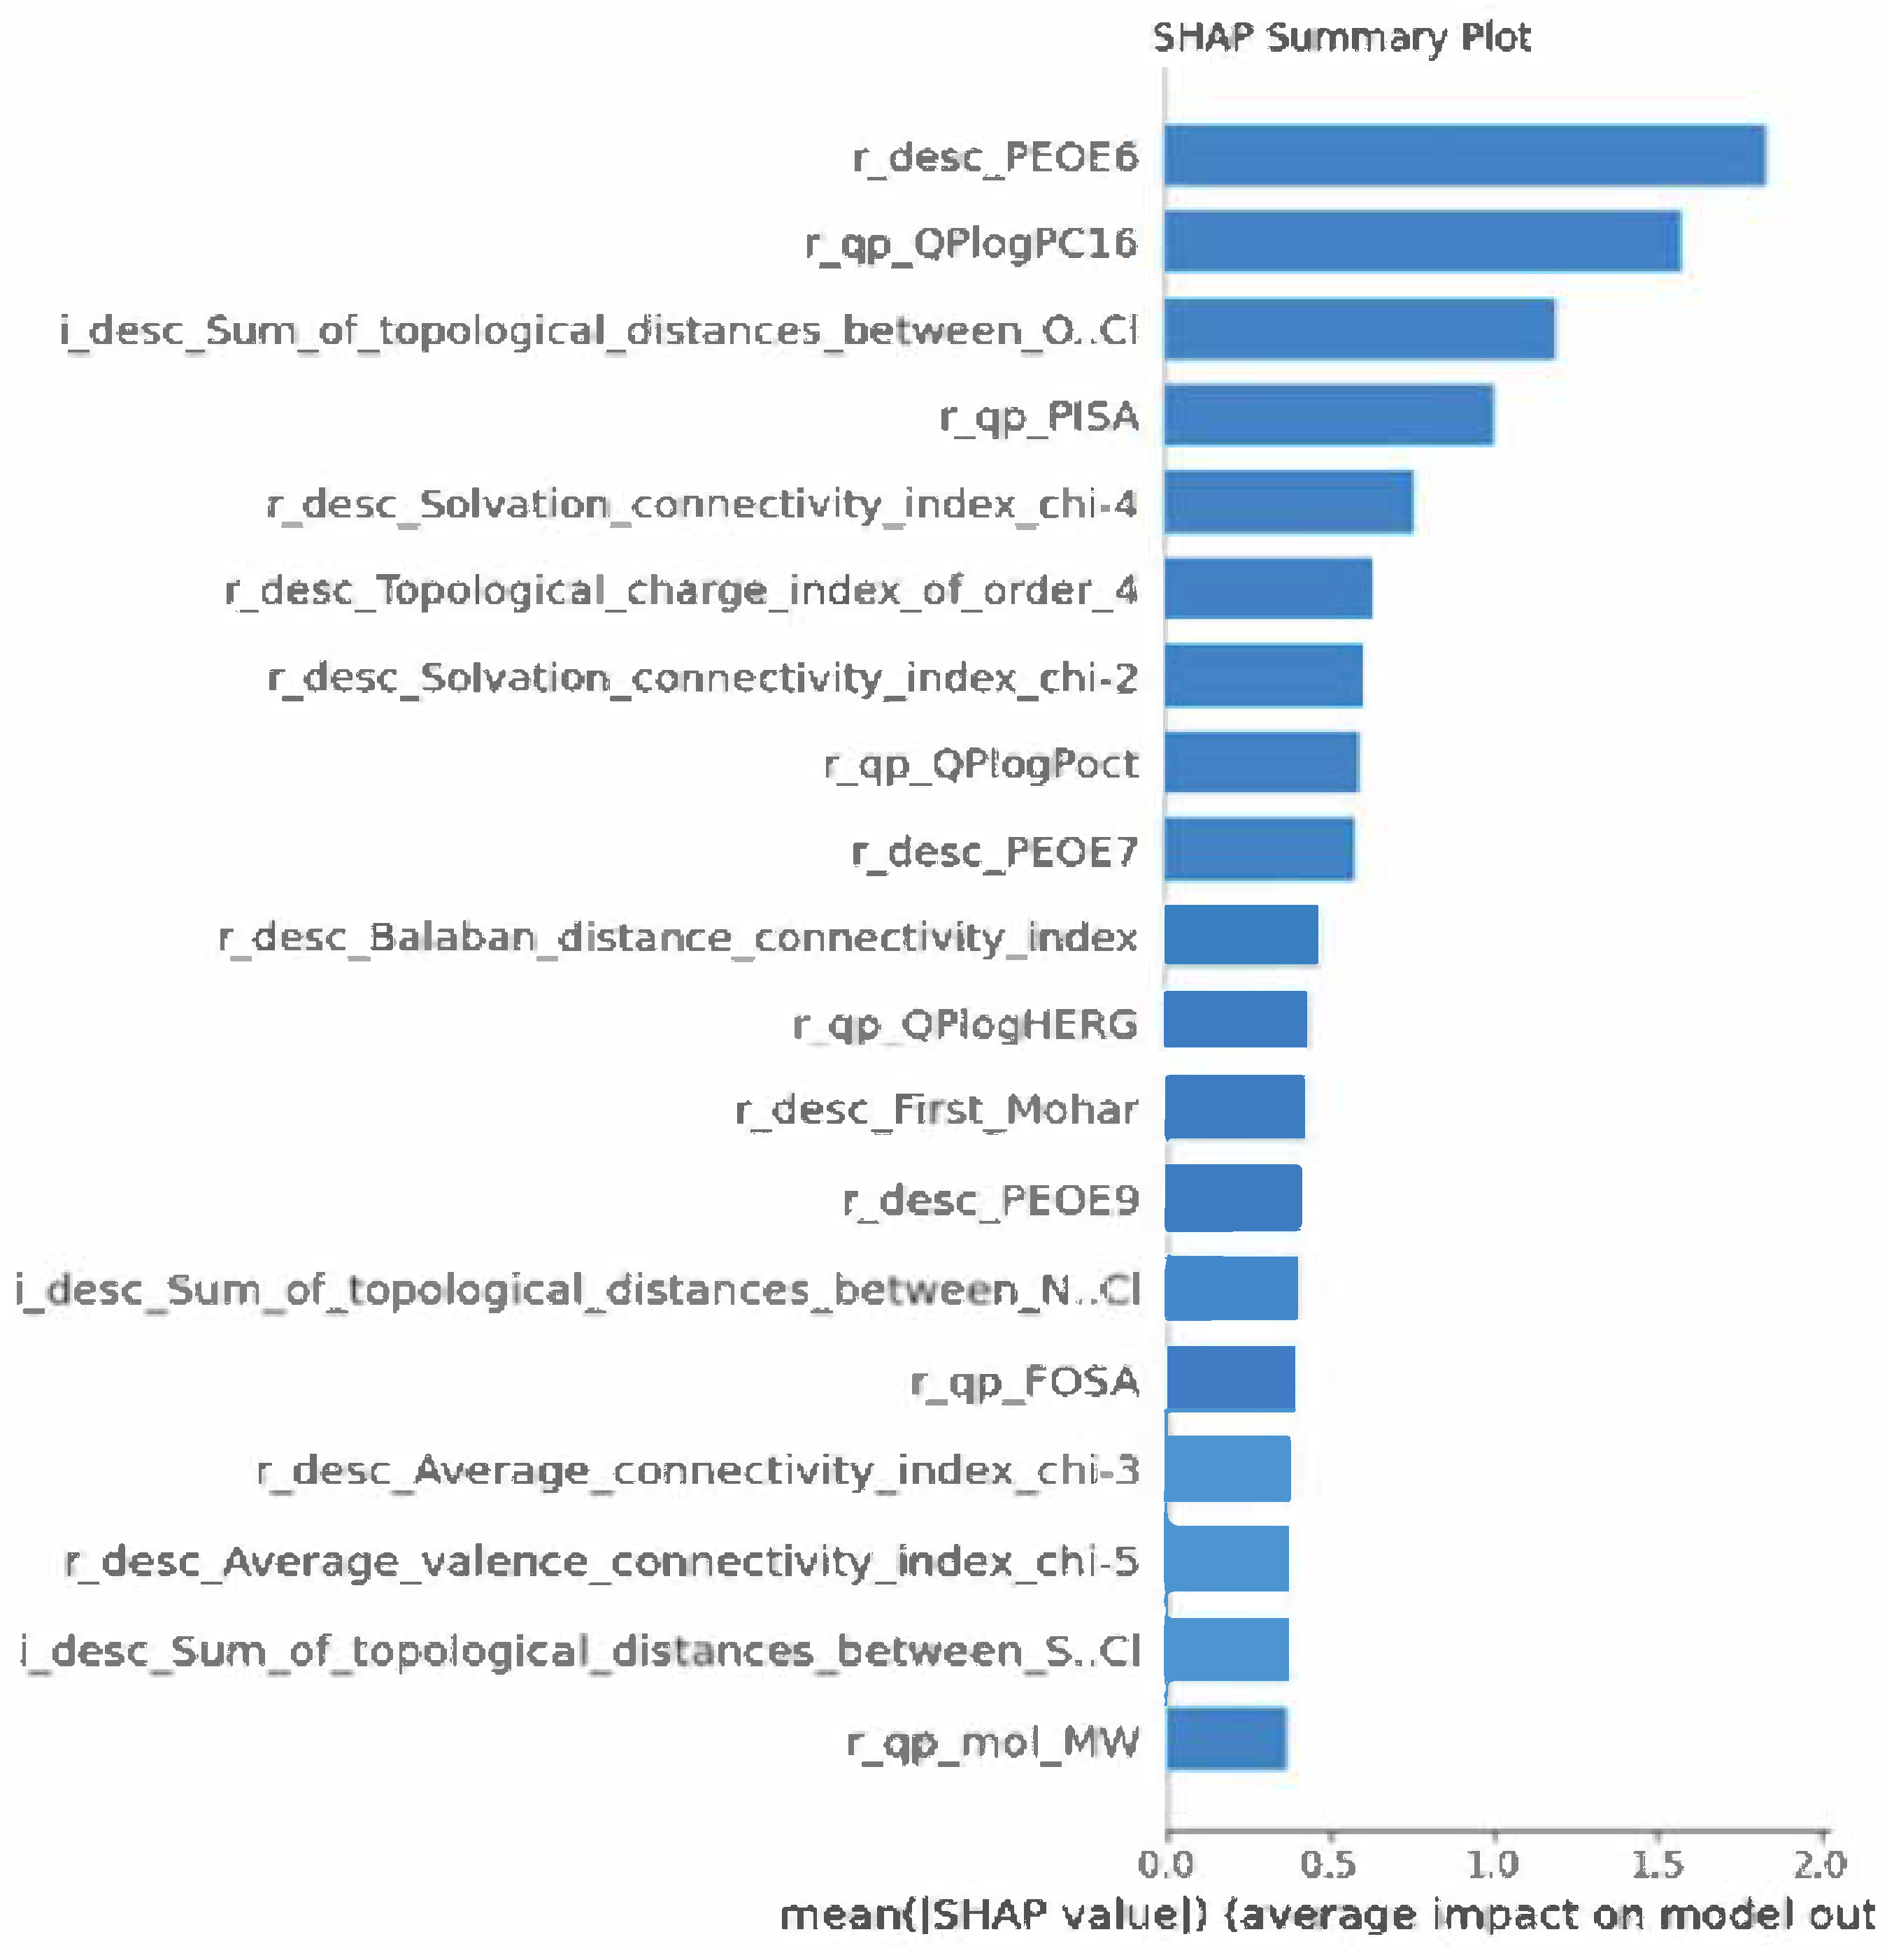
Table 4.
ML Algorithm and Best Parameters.
| Machine Learning Algorithm | Best Parameters |
| Ridge Regression | alpha = 1.0 |
| Lasso Regression | alpha = 0.1 |
| ElasticNet | alpha = 0.5, l1_ratio = 0.5 |
| Decision Tree | max_depth = 10, min_samples_split = 2, min_samples_leaf = 1 |
| Random Forest | n_estimators = 200, max_depth = 20, min_samples_split = 2, min_samples_leaf = 1 |
| Gradient Boosting | n_estimators = 100, learning_rate = 0.1, max_depth = 3 |
| AdaBoost | n_estimators = 50, learning_rate = 1.0 |
| SVR | C = 1.0, kernel = 'rbf', gamma = 'scale' |
| K-Nearest Neighbors | n_neighbors = 5, weights = 'uniform' |
| Neural Network | hidden_layer_sizes = (100), activation = 'relu', solver = 'adam', alpha = 0.0001 |
| Gaussian Process | kernel = RBF(), alpha = 1e-10 |
| PLS Regression | n_components = 2 |
| Isotonic Regression | N/A |
| XGBoost | n_estimators = 100, learning_rate = 0.1, max_depth = 3 |
Feature Importance via SHAP Analysis
The SHAP summary plot identified r_desc_PEOE6 (electronic properties) as the most influential descriptor, with a mean absolute SHAP value 23% higher than the next best feature (Figure 1).
The second and third top-ranked features were r_qp_QPlogPC16 (partition coefficients) and i_desc_Sum_of_topological_distances_between_O.Cl (atom spacing), respectively. Secondary contributors included r_qp_PISA (polar surface area) and solvation indices such as r_desc_Solvation_connectivity_index_chi-4, which stabilized interactions within the polymerase active site. Lower-impact descriptors such as r_qp_FOSA (hydrophobic surface area) and r_qp_mol_MW (molecular weight) provided structural insights but contributed minimally to predictive reliability.
Discussion
The exceptional predictive performance of ensemble methods, particularly Random Forest and XGBoost, underscores their suitability for modeling the complex, non-linear relationships inherent in DNA polymerase η (hpol η) inhibition [79,80,81,82,83,84,85,86,87,88,89]. Random Forest achieved near-perfect testing metrics (MSE = 0.0003, R² = 0.9998), demonstrating robust generalization through feature space partitioning and aggregation of decision trees. This agrees with prior studies in which ensemble methods excelled for biological datasets, such as cancer transcriptome prediction of cell survival, due to their capacity to handle high-dimensional, sparse molecular descriptors [80,82,83,84]. The minimal performance gap between training and testing (ΔMSE = 0.0001) highlights effective overfitting mitigation, a critical advantage given the multicollinearity observed in QSAR datasets. XGBoost’s superior performance over Neural Networks (testing MSE = 0.0002 vs. 0.0008) further emphasizes gradient-boosted trees’ adaptability to sparse feature spaces, a finding consistent with their success in predicting protein DNA-binding affinity [81,89,90,91,92,93,94]. In contrast, linear models like Lasso Regression (testing MSE = 0.0032) revealed the necessity of regularization to manage sparsity, although at the cost of predictive accuracy — a tradeoff well-documented in drug-discovery applications [81,82,83,84,85,86,87,88,89,90].
SHAP analysis identified electronic properties (r_desc_PEOE6) as the most critical determinant of inhibition activity, with a mean absolute SHAP value 23% higher than the second-ranked descriptor. This aligns with crystallographic evidence showing that charge distribution governs ligand binding stabilization in polymerase active sites [77,95]. The prominence of partition coefficients (r_qp_QPlogPC16) underscores lipophilicity’s dual role in cellular permeability and target engagement, a principle central to antiviral drug design [96,97]. Structural descriptors like i_desc_Sum_of_topological_distances_between_O.Cl further emphasize steric complementarity requirements, mirroring findings in DNA polymerase β inhibition studies where atomic spacing dictated binding specificity [79,98,99,100]. Secondary features, including polar surface area (r_qp_PISA) and solvation indices (r_desc_Solvation_connectivity_index_chi-4) [80], elucidate how compounds stabilize aqueous-phase interactions, consistent with enzyme-substrate kinetic models [101,102,103]. While lower-impact descriptors (r_qp_FOSA, r_qp_mol_MW) provided auxiliary structural insights, their minimal contributions suggest prioritization of electronic and topological optimization in rational drug design [104,105].
The models’ consistent error distribution (MAPE: 0.89–5.1%) across activity ranges indicates reliability for moderate-activity compounds but exposes limitations in predicting extreme potencies. This mirrors challenges in solubility modeling, where outlier compounds often defy linear or ensemble-based predictions [106,107]. The clustering of Median Absolute Error around 0.01 suggests that while the models capture general trends, they struggle with highly potent inhibitors—a critical gap for drug discovery pipelines. This limitation likely stems from insufficient representation of extreme-activity compounds in training data, a common issue for biochemical datasets. Future work could address this through synthetic minority oversampling or adversarial training techniques.
Methodologically, the integration of SHAP values bridges the interpretability-accuracy divide. While simpler models like Linear Regression underperformed by two orders of magnitude, SHAP’s ability to deconvolute feature contributions enables actionable insights without sacrificing predictive power [79,80,108]. For instance, the identification of r_desc_PEOE6 as a top predictor provides a direct optimization target for medicinal chemists: tuning electronic properties to enhance binding affinity. Similarly, r_qp_QPlogPC16’s influence offers a pathway to balancing lipophilicity and solubility—a strategy validated in recent hpol η inhibitor development [80]. Integrating molecular-dynamic simulations may enhance predictive accuracy for structurally flexible compounds.
While our models emphasize solvation indices, Salgado et. al. [109] prioritized hydrogen-bonding descriptors in their polymerase-inhibition studies. Discrepancies between these approaches may reflect hpol η’s uniquely hydrophobic active site, suggesting the need for crystallographic validation of descriptor-activity relationships. Conversely, consistency with Gupta et al.’s solvation models emphasizes the importance of aqueous-interaction stabilization in enzyme kinetics [102,110,111]. Such contrasts highlight the critical role of target-specific descriptor selection in QSAR workflows.
Translating these findings into drug discovery requires balancing multi-parameter optimization. For example, improving r_desc_PEOE6 (electronic distribution) might conflict with r_qp_QPlogPC16 (lipophilicity) adjustments, necessitating Pareto-front analysis to identify optimal compound profiles. Additionally, the moderate impact of r_qp_QPlogHERG (cardiac toxicity risk) implies the necessity for parallel ADMET profiling during lead optimization—a practice increasingly adopted in computational drug design.
While SHAP highlights critical features, molecular-dynamic simulations are needed to confirm mechanistic roles, such as r_desc_PEOE6’s influence on binding-pocket interactions. Furthermore, expanding the applicability domain to metalloenzyme inhibitors could enhance model generalizability, given the structural similarities among DNA polymerases. Future studies should also explore hybrid architectures combining ensemble methods with graph neural networks to capture both topological and electronic effects.
This study establishes a predictive framework for hpol η inhibitors by combining ensemble methods (for accuracy) and SHAP analysis (for interpretability). The models prioritize electronic distribution, topological alignment, and solvation properties as critical descriptors, directly guiding rational drug design. The integration of these features underscores the need for multidimensional optimization in QSAR workflows—aligning with modern computational approaches. Future work must address extreme-value prediction limitations and incorporate 3D conformational data to enhance dynamic interaction modeling. These advances will not only accelerate polymerase-targeted discovery but may also refine QSAR methodologies for broader enzyme applications.
Conclusions
This machine learning-driven QSAR framework overcomes cisplatin resistance challenges by identifying hpol η inhibitors with unprecedented precision. Ensemble methods (Random Forest/XGBoost) outperformed traditional models, capturing non-linear relationships between molecular features and activity. SHAP analysis prioritized electronic distribution (r_desc_PEOE6), lipophilicity (r_qp_QPlogPC16), and structural topology (i_desc_Sum_of_topological_distances _between_O.Cl) as critical for efficacy, in agreement with biochemical binding principles. While limitations persist in prediction of extreme-potency compounds, the study provides actionable strategies to optimize inhibitor design. Future integration of dynamic 4D descriptors, experimental validation, and generative AI could accelerate development of next-generation therapies, revitalizing cisplatin-based treatments for resistant cancers through computationally guided precision.
Author Contributions
SK, RJSR, CMC, PA designed the study. SK designed and implemented the QSAR presented in the study. SK performed all statistical analysis with input from RJSR. The manuscript was written by SK with additional contributions from SA, CMC, RJSR, ACY and KEA.
Funding
This work was supported by grants (VA Merit 2 I01 BX001655 and Senior Research Career Scientist Award) to R.J.S.R. from the U.S. Dept. of Veteran Affairs; and by Program Project Grant 2P01AG012411-17A1 (W.S.T. Griffin, P.I.) from the National Institute on Aging (NIA/NIH). The authors thank the Windgate Foundation and the Philip R. Jonsson Foundation for additional support. Support to SK was provided by the Arkansas INBRE program, funded by grant P20 GM103429 from the National Institute of General Medical Sciences (NIGMS), a part of the National Institutes of Health.
Data Availability Statement
The molecular database used for QSAR modeling is provided in supplementary material. Full access to the code and workflow, including machine learning components, will be granted upon request, subject to the constraints of our intellectual property applications.
Acknowledgments
The authors would like to thank W. Sue T. Griffin, Steven W. Barger and Peter A. Crooks from University of Arkansas for Medical Sciences (UAMS) for their training and funding support. Additionally, we thank Office of the President, the Provost, and the Dean of the Tulane Celia Scott Weatherhead School of Public Health and Tropical Medicine for their outstanding support provided to SK for the article processing fee, which was made possible through start-up funds.
Conflicts of Interest
The authors declare no financial conflicts of interest. The funders had no role in the design of the study; in the collection, analyses, or interpretation of data; in the writing of the manuscript; or in the decision to publish the results.
Abbreviations
A-C
- CCC: Concordance Correlation Coefficient
D-H
- HOMO: Highest Occupied Molecular Orbital
- hpol η: Human DNA polymerase η (seen throughout the paper)
I-L
- ITBA: Indole Thio-Barbituric Acid (compounds used in the study)
- KNN: K-Nearest Neighbor (algorithm)
- LUMO: Lowest Unoccupied Molecular Orbital
M-P
- MAE: Mean Absolute Error
- MAPE: Mean Absolute Percentage Error
- ML: Machine Learning [1]
- MSE: Mean Squared Error
- NIGMS: National Institute of General Medical Sciences
- NMSE: Normalized Mean Squared Error
- NRMSE: Normalized Root Mean Squared Error
Q-S
- QSAR: Quantitative Structure-Activity Relationship
- RMSE: Root Mean Squared Error
- SHAP: SHapley Additive exPlanations (feature importance analysis method)
- SMAPE: Symmetric Mean Absolute Percentage Error
- SMILES: Simplified Molecular Input Line Entry System
T-Z
- TLS: Translesion DNA Synthesis
- UAMS: University of Arkansas for Medical Sciences
References
- Zhang, C.; Xu, C.; Gao, X.; Yao, Q. Platinum-based drugs for cancer therapy and anti-tumor strategies. Theranostics 2022, 12, 2115–2132. [Google Scholar] [CrossRef] [PubMed]
- Khan, S.U.; Fatima, K.; Aisha, S.; Malik, F. Unveiling the mechanisms and challenges of cancer drug resistance. Cell Commun. Signal. 2024, 22, 1–26. [Google Scholar] [CrossRef] [PubMed]
- Sahoo, D.; Deb, P.; Basu, T.; Bardhan, S.; Patra, S.; Sukul, P.K. Advancements in platinum-based anticancer drug development: A comprehensive review of strategies, discoveries, and future perspectives. Bioorganic Med. Chem. 2024, 112. [Google Scholar] [CrossRef] [PubMed]
- Jin, S.K.; Baek, K.H. Unraveling the role of deubiquitinating enzymes on cisplatin resistance in several cancers. Biochim. Biophys. Acta - Rev. Cancer 2025, 1880, 189297. [Google Scholar] [CrossRef]
- Zhong, L.; Li, Y.; Xiong, L.; Wang, W.; Wu, M.; Yuan, T.; Yang, W.; Tian, C.; Miao, Z.; Wang, T.; et al. Small molecules in targeted cancer therapy: advances, challenges, and future perspectives. Signal Transduct. Target. Ther. 2021, 6. [Google Scholar] [CrossRef]
- Dasari, S.; Bernard Tchounwou, P. Cisplatin in cancer therapy: Molecular mechanisms of action. Eur. J. Pharmacol. 2014, 740, 364–378. [Google Scholar] [CrossRef]
- Anand, J.; Chiou, L.; Sciandra, C.; Zhang, X.; Hong, J.; Wu, D.; Zhou, P.; Vaziri, C. Roles of trans-lesion synthesis (TLS) DNA polymerases in tumorigenesis and cancer therapy. NAR Cancer 2023, 5. [Google Scholar] [CrossRef]
- Li, L.Y.; Guan, Y.D.; Chen, X.S.; Yang, J.M.; Cheng, Y. DNA Repair Pathways in Cancer Therapy and Resistance. Front. Pharmacol. 2021, 11. [Google Scholar] [CrossRef]
- Maiorano, D.; Etri, J.E.; Franchet, C.; Hoffmann, J.S. Translesion synthesis or repair by specialized dna polymerases limits excessive genomic instability upon replication stress. Int. J. Mol. Sci. 2021, 22, 3924. [Google Scholar] [CrossRef]
- Nayak, S.; Calvo, J.A.; Cantor, S.B. Targeting translesion synthesis (TLS) to expose replication gaps, a unique cancer vulnerability. Expert Opin. Ther. Targets 2021, 25, 27–36. [Google Scholar] [CrossRef]
- Saha, P.; Mandal, T.; Talukdar, A.D.; Kumar, D.; Kumar, S.; Tripathi, P.P.; Wang, Q.E.; Srivastava, A.K. DNA polymerase eta: A potential pharmacological target for cancer therapy. J. Cell. Physiol. 2021, 236, 4106–4120. [Google Scholar] [CrossRef] [PubMed]
- Berdis, A.J. Inhibiting DNA polymerases as a therapeutic intervention against cancer. Front. Mol. Biosci. 2017, 4, 78. [Google Scholar] [CrossRef]
- Tomar, R.; Li, S.; Egli, M.; Stone, M.P. Replication Bypass of the N-(2-Deoxy-d-erythro-pentofuranosyl)-urea DNA Lesion by Human DNA Polymerase η. Biochemistry 2024, 63, 754–766. [Google Scholar] [CrossRef]
- Zafar, M.K.; Maddukuri, L.; Ketkar, A.; Penthala, N.R.; Reed, M.R.; Eddy, S.; Crooks, P.A.; Eoff, R.L. A Small-Molecule Inhibitor of Human DNA Polymerase η Potentiates the Effects of Cisplatin in Tumor Cells. Biochemistry 2018, 57, 1262–1273. [Google Scholar] [CrossRef]
- Kakraba, S.; Knisley, D. A graph-theoretic model of single point mutations in the cystic fibrosis transmembrane conductance regulator. J. Adv. Biotechnol. 2016, 6, 780–786. [Google Scholar] [CrossRef]
- Kakraba, S. Drugs that protect against protein aggregation in neurodegenerative diseases, University of Arkansas at Little Rock and University of Arkansas for Medical Sciences, 2021.
- Kakraba, S. A Hierarchical Graph for Nucleotide Binding Domain 2. Electronic Theses and Dissertations https://dc.etsu.edu/etd/2517 (2015).
- Netsey, E.K.; Kakraba, D.S.; Naandam, S.M.; Yadem, A.C. A Mathematical Graph-Theoretic Model of Single Point Mutations Associated with Sickle Cell Anemia Disease. J. Adv. Biotechnol. 2021, 9, 1–14. [Google Scholar] [CrossRef]
- Knisley, D.J.; Knisley, J.R. Seeing the results of a mutation with a vertex weighted hierarchical graph. In Proceedings of the BMC Proceedings; BioMed Central, 2014; Vol. 8, pp. 1–8. [Google Scholar]
- Knisley, D.J.; Knisley, J.R.; Herron, A.C. Graph-Theoretic Models of Mutations in the Nucleotide Binding Domain 1 of the Cystic Fibrosis Transmembrane Conductance Regulator. Comput. Biol. J. 2013, 2013, 1–9. [Google Scholar] [CrossRef]
- Balasubramaniam, M.; Ayyadevara, S.; Ganne, A.; Kakraba, S.; Penthala, N.R.; Du, X.; Crooks, P.A.; Griffin, S.T.; Shmookler Reis, R.J. Aggregate Interactome Based on Protein Cross-linking Interfaces Predicts Drug Targets to Limit Aggregation in Neurodegenerative Diseases. iScience 2019, 20, 248–264. [Google Scholar] [CrossRef]
- Soares, T.A.; Nunes-Alves, A.; Mazzolari, A.; Ruggiu, F.; Wei, G.W.; Merz, K. The (Re)-Evolution of Quantitative Structure-Activity Relationship (QSAR) Studies Propelled by the Surge of Machine Learning Methods. J. Chem. Inf. Model. 2022, 62, 5317–5320. [Google Scholar] [CrossRef]
- Ocana, A.; Pandiella, A.; Privat, C.; Bravo, I.; Luengo-Oroz, M.; Amir, E.; Gyorffy, B. Integrating artificial intelligence in drug discovery and early drug development: a transformative approach. Biomark. Res. 2025, 13. [Google Scholar] [CrossRef]
- Odugbemi, A.I.; Nyirenda, C.; Christoffels, A.; Egieyeh, S.A. Artificial intelligence in antidiabetic drug discovery: The advances in QSAR and the prediction of α-glucosidase inhibitors. Comput. Struct. Biotechnol. J. 2024, 23, 2964–2977. [Google Scholar] [CrossRef]
- Schneider, A.; Hommel, G.; Blettner, M. Linear Regression Analysis. Dtsch Arztebl Int. 2010, 107, 776–782. [Google Scholar] [CrossRef] [PubMed]
- Jarantow, S.W.; Pisors, E.D.; Chiu, M.L. Introduction to the Use of Linear and Nonlinear Regression Analysis in Quantitative Biological Assays. Curr. Protoc. 2023, 3. [Google Scholar] [CrossRef] [PubMed]
- Schreiber-Gregory, D.N. Ridge Regression and multicollinearity: An in-depth review. Model Assist. Stat. Appl. 2018, 13, 359–365. [Google Scholar] [CrossRef]
- Rubin, J.; Mariani, L.; Smith, A.; Zee, J. Ridge Regression for Functional Form Identification of Continuous Predictors of Clinical Outcomes in Glomerular Disease. Glomerular Dis. 2022, 3, 47–55. [Google Scholar] [CrossRef]
- Ranstam, J.; Cook, J.A. LASSO regression. Br. J. Surg. 2018, 105, 1348. [Google Scholar] [CrossRef]
- Li, Y.; Lu, F.; Yin, Y. Applying logistic LASSO regression for the diagnosis of atypical Crohn’s disease. Sci. Rep. 2022, 12, 11340. [Google Scholar] [CrossRef]
- Hong, C.; Xiong, Y.; Xia, J.; Huang, W.; Xia, A.; Xu, S.; Chen, Y.; Xu, Z.; Chen, H.; Zhang, Z. LASSO-Based Identification of Risk Factors and Development of a Prediction Model for Sepsis Patients. Ther. Clin. Risk Manag. 2024, 20, 47–58. [Google Scholar] [CrossRef]
- Freijeiro-González, L.; Febrero-Bande, M.; González-Manteiga, W. A Critical Review of LASSO and Its Derivatives for Variable Selection Under Dependence Among Covariates. Int. Stat. Rev. 2022, 90, 118–145. [Google Scholar] [CrossRef]
- Delong, Ł.V.; Wüthrich, M. Isotonic Regression for Variance Estimation and Its Role in Mean Estimation and Model Validation. North Am. Actuar. J. 2024. [Google Scholar] [CrossRef]
- Deng, H.; Zhang, C.-H. Isotonic regression in multi-dimensional spaces and graphs. Ann. Stat. 2020, 48, 3672–3698. [Google Scholar] [CrossRef]
- Chen, C.; Cao, X.; Tian, L. Partial Least Squares Regression Performs Well in MRI-Based Individualized Estimations. Front. Neurosci. 2019, 13. [Google Scholar] [CrossRef]
- Vicente-Gonzalez, L.; Vicente-Villardon, J.L. Partial Least Squares Regression for Binary Responses and Its Associated Biplot Representation. Mathematics 2022, 10. [Google Scholar] [CrossRef]
- Chen, J.; Xiaoqin, Z.; Hron, K. Partial least squares regression with compositional response variables and covariates. J. Appl. Stat. 2021, 48, 3130–3149. [Google Scholar] [CrossRef] [PubMed]
- Awad, M. & Khanna, R. Support Vector Regression BT-Efficient Learning Machines: Theories, Concepts, and Applications for Engineers and System Designers. in (eds. Awad, M. & Khanna, R.) 67–80 (Apress, Berkeley, CA, 2015). [CrossRef]
- Montesinos López, O. A., Montesinos López, A. & Crossa, J. Support Vector Machines and Support Vector Regression BT - Multivariate Statistical Machine Learning Methods for Genomic Prediction. in (eds. Montesinos López, O. A., Montesinos López, A. & Crossa, J.) 337–378 (Springer International Publishing, Cham, 2022). [CrossRef]
- Zou, H.; Hastie, T. Regularization and Variable Selection Via the Elastic Net. J. R. Stat. Soc. Ser. B Stat. Methodol. 2005, 67, 301–320. [Google Scholar] [CrossRef]
- De Mol, C.; De Vito, E.; Rosasco, L. Elastic-net regularization in learning theory. J. Complex. 2009, 25, 201–230. [Google Scholar] [CrossRef]
- Zhang, Z.; Lai, Z.; Xu, Y.; Shao, L.; Wu, J.; Xie, G.-S. Discriminative Elastic-Net Regularized Linear Regression. IEEE Trans. Image Process. 2017, 26, 1466–1481. [Google Scholar] [CrossRef]
- Navada, A.; Ansari, A.N.; Patil, S.; Sonkamble, B.A. Overview of use of decision tree algorithms in machine learning. In Proceedings of the 2011 IEEE Control and System Graduate Research Colloquium; 2011; pp. 37–42. [Google Scholar]
- Song, Y.-Y.; Lu, Y. Decision tree methods: applications for classification and prediction. Shanghai Arch. psychiatry 2015, 27, 130–135. [Google Scholar]
- Mienye, I.D.; Jere, N. A Survey of Decision Trees: Concepts, Algorithms, and Applications. IEEE Access 2024, 12, 86716–86727. [Google Scholar] [CrossRef]
- Breiman, L. Random Forests. Mach. Learn. 2001, 45, 5–32. [Google Scholar] [CrossRef]
- Sun, Z.; Wang, G.; Li, P.; Wang, H.; Zhang, M.; Liang, X. An improved random forest based on the classification accuracy and correlation measurement of decision trees. Expert Syst. Appl. 2024, 237, 121549. [Google Scholar] [CrossRef]
- Cutler, A.; Cutler, D.R.; Stevens, J.R. Random Forests BT - Ensemble Machine Learning: Methods and Applications. In; Zhang, C., Ma, Y., Eds.; Springer: New York, NY, USA, 2012; pp. 157–175. ISBN 978-1-4419-9326-7. [Google Scholar]
- Natekin, A.; Knoll, A. Gradient boosting machines, a tutorial. Front. Neurorobot. 2013, 7. [Google Scholar] [CrossRef] [PubMed]
- Aziz, N.; Akhir, E.A.P.; Aziz, I.A.; Jaafar, J.; Hasan, M.H.; Abas, A.N.C. A Study on Gradient Boosting Algorithms for Development of AI Monitoring and Prediction Systems. In Proceedings of the 2020 International Conference on Computational Intelligence (ICCI); 2020; pp. 11–16. [Google Scholar]
- Boldini, D.; Grisoni, F.; Kuhn, D.; Friedrich, L.; Sieber, S.A. Practical guidelines for the use of gradient boosting for molecular property prediction. J. Cheminform. 2023, 15, 73. [Google Scholar] [CrossRef]
- Chen, T.; Guestrin, C. Xgboost: A scalable tree boosting system. In Proceedings of the Proceedings of the 22nd acm sigkdd international conference on knowledge discovery and data mining.
- Raihan, M.J.; Khan, M.A.-M.; Kee, S.-H.; Nahid, A.-A. Detection of the chronic kidney disease using XGBoost classifier and explaining the influence of the attributes on the model using SHAP. Sci. Rep. 2023, 13, 6263. [Google Scholar] [CrossRef] [PubMed]
- Bentéjac, C.; Csörgo, A.; Martínez-Muñoz, G. A comparative analysis of gradient boosting algorithms. Artif. Intell. Rev. 2019, 54, 1937–1967. [Google Scholar] [CrossRef]
- Moore, A.; Bell, M. XGBoost, A Novel Explainable AI Technique, in the Prediction of Myocardial Infarction: A UK Biobank Cohort Study. Clin. Med. Insights. Cardiol. 2022, 16, 11795468221133612. [Google Scholar] [CrossRef]
- Zhang, Y.; Ni, M.; Zhang, C.; Liang, S.; Fang, S.; Li, R.; Tan, Z. Research and Application of AdaBoost Algorithm Based on SVM. In Proceedings of the 2019 IEEE 8th Joint International Information Technology and Artificial Intelligence Conference (ITAIC); 2019; pp. 662–666. [Google Scholar]
- Wang, R. AdaBoost for Feature Selection, Classification and Its Relation with SVM, A Review. Phys. Procedia 2012, 25, 800–807. [Google Scholar] [CrossRef]
- Hancock, J.T.; Khoshgoftaar, T.M. CatBoost for big data: an interdisciplinary review. J. Big Data 2020, 7, 94. [Google Scholar] [CrossRef]
- Ibrahim, A.A.; Ridwan, R.L.; Muhammed, M.M.; Abdulaziz, R.O.; Saheed, G.A. Comparison of the CatBoost classifier with other machine learning methods. Int. J. Adv. Comput. Sci. Appl. 2020, 11, 738–748. [Google Scholar] [CrossRef]
- Uddin, S.; Haque, I.; Lu, H.; Moni, M.A.; Gide, E. Comparative performance analysis of K-nearest neighbour (KNN) algorithm and its different variants for disease prediction. Sci. Rep. 2022, 12, 6256. [Google Scholar] [CrossRef]
- Halder, R.K.; Uddin, M.N.; Uddin, M.A.; Aryal, S.; Khraisat, A. Enhancing K-nearest neighbor algorithm: a comprehensive review and performance analysis of modifications. J. Big Data 2024, 11, 113. [Google Scholar] [CrossRef]
- Zhang, Z. Introduction to machine learning: k-nearest neighbors. Ann. Transl. Med. 2016, 4, 218. [Google Scholar] [CrossRef]
- Guo, G.; Wang, H.; Bell, D.; Bi, Y.; Greer, K. KNN Model-Based Approach in Classification BT - On The Move to Meaningful Internet Systems 2003: CoopIS, DOA, and ODBASE.; Meersman, R., Tari, Z., Schmidt, D.C., Eds.; Springer: Berlin/Heidelberg, Germany, 2003; pp. 986–996. [Google Scholar]
- Uhrig, R.E. Introduction to artificial neural networks. In Proceedings of the Proceedings of IECON ’95 - 21st Annual Conference on IEEE Industrial Electronics.
- Han, S.-H.; Kim, K.W.; Kim, S.; Youn, Y.C. Artificial Neural Network: Understanding the Basic Concepts without Mathematics. Dement. neurocognitive Disord. 2018, 17, 83–89. [Google Scholar] [CrossRef]
- Schmidhuber, J. Deep learning in neural networks: An overview. Neural networks 2015, 61, 85–117. [Google Scholar] [CrossRef]
- Grossi, E.; Buscema, M. Introduction to artificial neural networks. Eur. J. Gastroenterol. Hepatol. 2007, 19, 1046–1054. [Google Scholar] [CrossRef] [PubMed]
- Goel, A.; Goel, A.K.; Kumar, A. The role of artificial neural network and machine learning in utilizing spatial information. Spat. Inf. Res. 2023, 31, 275–285. [Google Scholar] [CrossRef]
- Deringer, V.L.; Bartók, A.P.; Bernstein, N.; Wilkins, D.M.; Ceriotti, M.; Csányi, G. Gaussian Process Regression for Materials and Molecules. Chem. Rev. 2021, 121, 10073–10141. [Google Scholar] [CrossRef] [PubMed]
- Ebden, M. Gaussian processes: A quick introduction. arXiv Prepr. arXiv1505.02965 2015. [Google Scholar]
- Schulz, E.; Speekenbrink, M.; Krause, A. A tutorial on Gaussian process regression: Modelling, exploring, and exploiting functions. J. Math. Psychol. 2018, 85, 1–16. [Google Scholar] [CrossRef]
- Mendelsohn, L.D. ChemDraw 8 ultra, windows and macintosh versions. J. Chem. Inf. Comput. Sci. 2004, 44, 2225–2226. [Google Scholar] [CrossRef]
- Sankar, K.; Trainor, K.; Blazer, L.L.; Adams, J.J.; Sidhu, S.S.; Day, T.; Meiering, E.; Maier, J.K.X. A Descriptor Set for Quantitative Structure-property Relationship Prediction in Biologics. Mol. Inform. 2022, 41. [Google Scholar] [CrossRef] [PubMed]
- Sivakumar, M.; Parthasarathy, S.; Padmapriya, T. Trade-off between training and testing ratio in machine learning for medical image processing. PeerJ Comput. Sci. 2024, 10, e2245. [Google Scholar] [CrossRef] [PubMed]
- Shimizu, H.; Enda, K.; Shimizu, T.; Ishida, Y.; Ishizu, H.; Ise, K.; Tanaka, S.; Iwasaki, N. Machine Learning Algorithms: Prediction and Feature Selection for Clinical Refracture after Surgically Treated Fragility Fracture. J. Clin. Med. 2022, 11. [Google Scholar] [CrossRef]
- Prokhorenkova, L.; Gusev, G.; Vorobev, A.; Dorogush, A.V.; Gulin, A. Catboost: Unbiased boosting with categorical features. In Proceedings of the Advances in Neural Information Processing Systems, 2018; Vol. 2018-Decem, pp. 6638–6648. [Google Scholar]
- Jierula, A.; Wang, S.; Oh, T.M.; Wang, P. Study on accuracy metrics for evaluating the predictions of damage locations in deep piles using artificial neural networks with acoustic emission data. Appl. Sci. 2021, 11, 2314. [Google Scholar] [CrossRef]
- Rossum, G.V.; Drake, F.L. Python Reference Manual. October 2006, 22, 9117–9129. [Google Scholar]
- Li, Z. Extracting spatial effects from machine learning model using local interpretation method: An example of SHAP and XGBoost. Comput. Environ. Urban Syst. 2022, 96, 101845. [Google Scholar] [CrossRef]
- Wang, H.; Liang, Q.; Hancock, J.T.; Khoshgoftaar, T.M. Feature selection strategies: a comparative analysis of SHAP-value and importance-based methods. J. Big Data 2024, 11, 1–16. [Google Scholar] [CrossRef]
- Khan, S.; Noor, S.; Javed, T.; Naseem, A.; Aslam, F.; AlQahtani, S.A.; Ahmad, N. XGBoost-enhanced ensemble model using discriminative hybrid features for the prediction of sumoylation sites. BioData Min. 2025, 18. [Google Scholar] [CrossRef]
- Vamathevan, J.; Clark, D.; Czodrowski, P.; Dunham, I.; Ferran, E.; Lee, G.; Li, B.; Madabhushi, A.; Shah, P.; Spitzer, M.; et al. Applications of machine learning in drug discovery and development. Nat. Rev. Drug Discov. 2019, 18, 463–477. [Google Scholar] [CrossRef]
- Liu, M.; Srivastava, G.; Ramanujam, J.; Brylinski, M. Insights from Augmented Data Integration and Strong Regularization in Drug Synergy Prediction with SynerGNet. Mach. Learn. Knowl. Extr. 2024, 6, 1782–1797. [Google Scholar] [CrossRef]
- Obaido, G.; Mienye, I.D.; Egbelowo, O.F.; Emmanuel, I.D.; Ogunleye, A.; Ogbuokiri, B.; Mienye, P.; Aruleba, K. Supervised machine learning in drug discovery and development: Algorithms, applications, challenges, and prospects. Mach. Learn. with Appl. 2024, 17, 100576. [Google Scholar] [CrossRef]
- Sharma, A.; Lysenko, A.; Jia, S.; Boroevich, K.A.; Tsunoda, T. Advances in AI and machine learning for predictive medicine. J. Hum. Genet. 2024, 69, 487–497. [Google Scholar] [CrossRef] [PubMed]
- Huang, S.; Xu, Q.; Yang, G.; Ding, J.; Pei, Q. Machine Learning for Prediction of Drug Concentrations: Application and Challenges. Clin. Pharmacol. Ther. 2025, 117. [Google Scholar] [CrossRef]
- Patel, L.; Shukla, T.; Huang, X.; Ussery, D.W.; Wang, S. Machine Learning Methods in Drug Discovery. Molecules 2020, 25, 5277. [Google Scholar] [CrossRef] [PubMed]
- Ohnuki, Y.; Akiyama, M.; Sakakibara, Y. Deep learning of multimodal networks with topological regularization for drug repositioning. J. Cheminform. 2024, 16. [Google Scholar] [CrossRef]
- Ahmed, N.Y.; Alsanousi, W.A.; Hamid, E.M.; Elbashir, M.K.; Al-Aidarous, K.M.; Mohammed, M.; Musa, M.E.M. An Efficient Deep Learning Approach for DNA-Binding Proteins Classification from Primary Sequences. Int. J. Comput. Intell. Syst. 2024, 17, 1–14. [Google Scholar] [CrossRef]
- Thedinga, K.; Herwig, R. A gradient tree boosting and network propagation derived pan-cancer survival network of the tumor microenvironment. iScience 2022, 25. [Google Scholar] [CrossRef]
- Claude, E.; Leclercq, M.; Thebault, P.; Droit, A.; Uricaru, R. Optimizing hybrid ensemble feature selection strategies for transcriptomic biomarker discovery in complex diseases. NAR Genomics Bioinforma. 2024, 6, 79. [Google Scholar] [CrossRef]
- Yang, Z.; Zhou, H.; Srivastav, S.; Shaffer, J.G.; Abraham, K.E.; Naandam, S.M.; Kakraba, S. Optimizing Parkinson’s Disease Prediction: A Comparative Analysis of Data Aggregation Methods Using Multiple Voice Recordings via an Automated Artificial Intelligence Pipeline. Data 2025, 10, 4. [Google Scholar] [CrossRef]
- Wu, B.-R.; Ormazabal Arriagada, S.; Hsu, T.-C.; Lin, T.-W.; Lin, C. Exploiting common patterns in diverse cancer types via multi-task learning. NPJ Precis. Oncol. 2024, 8, 245. [Google Scholar] [CrossRef]
- Airlangga, G.; Liu, A. A Hybrid Gradient Boosting and Neural Network Model for Predicting Urban Happiness: Integrating Ensemble Learning with Deep Representation for Enhanced Accuracy. Mach. Learn. Knowl. Extr. 2025, 7, 4. [Google Scholar] [CrossRef]
- Arora, K.; Schlick, T. In silico evidence for DNA polymerase-β’s substrate-induced conformational change. Biophys. J. 2004, 87, 3088–3099. [Google Scholar] [CrossRef]
- Jonsson, C.B.; Golden, J.E.; Meibohm, B. Time to ‘Mind the Gap’ in novel small molecule drug discovery for direct-acting antivirals for SARS-CoV-2. Curr. Opin. Virol. 2021, 50, 1–7. [Google Scholar] [CrossRef] [PubMed]
- Markowicz-Piasecka, M.; Markiewicz, A.; Darłak, P.; Sikora, J.; Adla, S.K.; Bagina, S.; Huttunen, K.M. Current Chemical, Biological, and Physiological Views in the Development of Successful Brain-Targeted Pharmaceutics. Neurotherapeutics 2022, 19, 942–976. [Google Scholar] [CrossRef]
- Wang, W.; Wu, E.Y.; Hellinga, H.W.; Beese, L.S. Structural factors that determine selectivity of a high fidelity DNA polymerase for deoxy-, dideoxy-, and ribonucleotides. J. Biol. Chem. 2012, 287, 28215–28226. [Google Scholar] [CrossRef]
- Beard, W.A.; Wilson, S.H. Structure and mechanism of DNA polymerase β. Biochemistry 2014, 53, 2768–2780. [Google Scholar] [CrossRef]
- Batra, V.K.; Beard, W.A.; Shock, D.D.; Pedersen, L.C.; Wilson, S.H. Structures of DNA Polymerase β with Active-Site Mismatches Suggest a Transient Abasic Site Intermediate during Misincorporation. Mol. Cell 2008, 30, 315–324. [Google Scholar] [CrossRef] [PubMed]
- Mabesoone, M.F.J.; Palmans, A.R.A.; Meijer, E.W. Solute-Solvent Interactions in Modern Physical Organic Chemistry: Supramolecular Polymers as a Muse. J. Am. Chem. Soc. 2020, 142, 19781–19798. [Google Scholar] [CrossRef]
- Wang, S.; Meng, X.; Zhou, H.; Liu, Y.; Secundo, F.; Liu, Y. Enzyme stability and activity in non-aqueous reaction systems: A mini review. Catalysts 2016, 6, 32. [Google Scholar] [CrossRef]
- Tomasi, J.; Mennucci, B.; Cammi, R. Quantum mechanical continuum solvation models. Chem. Rev. 2005, 105, 2999–3093. [Google Scholar] [CrossRef]
- Senhora, F.V.; Chi, H.; Zhang, Y.; Mirabella, L.; Tang, T.L.E.; Paulino, G.H. Machine learning for topology optimization: Physics-based learning through an independent training strategy. Comput. Methods Appl. Mech. Eng. 2022, 398, 115116. [Google Scholar] [CrossRef]
- Tang, T.; Wang, L.; Zhu, M.; Zhang, H.; Dong, J.; Yue, W.; Xia, H. Topology Optimization: A Review for Structural Designs Under Statics Problems. Materials (Basel). 2024, 17, 5970. [Google Scholar] [CrossRef]
- Kazmi, B.; Taqvi, S.A.A.; Juchelkov, D.; Li, G.; Naqvi, S.R. Artificial intelligence-enhanced solubility predictions of greenhouse gases in ionic liquids: A review. Results Eng. 2025, 25, 103851. [Google Scholar] [CrossRef]
- Panapitiya, G.; Girard, M.; Hollas, A.; Sepulveda, J.; Murugesan, V.; Wang, W.; Saldanha, E. Evaluation of Deep Learning Architectures for Aqueous Solubility Prediction. ACS Omega 2022, 7, 15695–15710. [Google Scholar] [CrossRef] [PubMed]
- Mohanty, P.K.; Francis, S.A.J.; Barik, R.K.; Roy, D.S.; Saikia, M.J. Leveraging Shapley Additive Explanations for Feature Selection in Ensemble Models for Diabetes Prediction. Bioengineering 2024, 11. [Google Scholar] [CrossRef]
- Salgado, P.S.; Makeyev, E.V.; Butcher, S.J.; Bamford, D.H.; Stuart, D.I.; Grimes, J.M. The Structural Basis for RNA Specificity and Ca2+ Inhibition of an RNA-Dependent RNA Polymerase. Structure 2004, 12, 307–316. [Google Scholar] [CrossRef]
- Sethi, A.; Agrawal, N.; Brezovsky, J. Impact of water models on the structure and dynamics of enzyme tunnels. Comput. Struct. Biotechnol. J. 2024, 23, 3946–3954. [Google Scholar] [CrossRef]
- Zeindlhofer, V.; Schröder, C. Computational solvation analysis of biomolecules in aqueous ionic liquid mixtures: From large flexible proteins to small rigid drugs. Biophys. Rev. 2018, 10, 825–840. [Google Scholar] [CrossRef]
- Kakraba, S., A.C. Yadem, and K.E. Abraham, Unraveling Protein Secrets: Machine Learning Unveils Novel Biologically Significant Associations Among Amino Acids, in Preprints. 2025, Preprints.
Disclaimer/Publisher’s Note: The statements, opinions and data contained in all publications are solely those of the individual author(s) and contributor(s) and not of MDPI and/or the editor(s). MDPI and/or the editor(s) disclaim responsibility for any injury to people or property resulting from any ideas, methods, instructions or products referred to in the content. |
© 2025 by the authors. Licensee MDPI, Basel, Switzerland. This article is an open access article distributed under the terms and conditions of the Creative Commons Attribution (CC BY) license (http://creativecommons.org/licenses/by/4.0/).
Copyright: This open access article is published under a Creative Commons CC BY 4.0 license, which permit the free download, distribution, and reuse, provided that the author and preprint are cited in any reuse.


