

Submitted:
22 March 2024
Posted:
25 March 2024
You are already at the latest version
Abstract
The described data set contains features from the machine control of a five-axis milling machine. The features were recorded during thirteen series productions. Each series production includes a changeover process in which the machine was set up for the production of a different product. In addition to the timestamps and the twenty recorded features derived from Numerical Control (NC) control variables, the data set also contains labels for the different production phases. For this purpose, up to 23 phases were assigned, which are based on a generalized milling process. The data set consists of thirteen .csv files, each representing a series production. The data set was recorded in a production company in the contract manufacturing sector for components with real series orders in ongoing industrial production.
Keywords:
Milling
; 5-axis
; NC data
; CNC
; Changeover
; Setup
; Production
1. Summary
The data set presented offers researchers insight into the changes in machine parameters on a milling machine during different phases of the production process. The data set contains the recorded features of the Numerical Control (NC) control, and it also includes an assignment of the underlying production phases, which was added by manual labeling.
Compared to other domains where dedicated data repositories are available, engineering data sets can generally be found in generalist data repositories [1]. Table 1 shows the result of a search for entries of milling-related data sets in the largest generalist repositories: In relation to the huge amount of existing data sets in the repositories, milling-related data sets can rarely be found. After closer analysis of the search results, the number of unique data records with a manufacturing reference appears to be seldom as well (see last column in Table 1). Therefore, publishing the presented data set aims to make more manufacturing data available for research.
The recorded data set contains production data from the NC of a five-axis milling machine, which was recorded in thirteen sessions between the end of November 2021 and the beginning of April 2022. For each recorded session, the anonymous data from the NC of the machine covers the preparation for the next manufacturing order (also defined as changeover) and the subsequently produced parts.
The used milling machine HERMLE C600 U is equipped with an NC HEIDENHAIN iTNC 530 and was operated in regular production shifts at the company Pabst Komponentenfertigung GmbH in Schweinfurt, Germany. Pabst specializes in the design and manufacture of tools and special machines, as well as the individual and series production of machine components. The company Pabst was a member of the publicly funded research project Optimization of Processes and Machine Tools through Provision, Analysis and Target/Actual Comparison of Production Data (OBerA), which was established to support metalworking companies with a focus on Small and medium-sized enterprises (SMEs) from northern Bavaria in digital techniques to optimize their production. The project lasted from 01.04.2018 until 31.12.2021. Several sessions of the data set were also recorded after the official end of the project. Overall, 13 sessions were recorded, forming the complete data set (see Table 2).
Selected sessions from the data set were used in two publications so far: In [2], the data set presented here was used to train a Machine Learning (ML) model for detecting changeover periods in production data. These models were then compared to ML models, which were trained with a data set from a DMG 100 U duoBLOCK milling machine. The DMG machine was equipped only with external sensors, which were not connected to its NC. The ML approaches for both machines were compared and discussed. Data from the DMG machine is not part of the data set presented here, only data from the HERMLE machine is included. Sessions 1 and 2 were used for this research.
In [3], the influence of different noise types on the training data of ML models was evaluated. For this purpose, sessions from the data set were overlaid with simulated noise. This data set was then used to train ML models for detecting the changeover periods in manufacturing data. During the simulation, different noise types were selected, and their specific influence on the metrics of the ML model was evaluated. For this research, sessions 1 and 2 were used.
2. Data Description
Table 2 shows the names of the .csv files for the 13 recorded sessions, the number of data rows, and the data rows per hour. It can be seen that the number of rows of all sessions ranges between 7,526 and 19,810, and the data rows per hour have a comparable magnitude with an average of 1914.15 data rows per hour. Usually, the sessions were recorded during one working day. Only session No. 13 was recorded on the 5th, 7th, and 8th of April. On the 6th of April, the machine was in maintenance. Each file uses commas as the separator, has a column descriptor in the first line of the file, and contains data from one changeover sequence followed by the subsequent production sequence.
Table 3 shows the durations of the specific sessions in the column "Total time" and the duration of the changeover period in the column "Changeover time". During a changeover, a machine is prepared for a new product type. Columns "Old product" and "New product" show an anonymized product number, which stands for the product that was produced before and after the changeover period.
In the data set, the first column contains the timestamp in the format YYYY-MM-DD HH:MM:SS. The following columns contain the recorded data from the individual features from the NC. Table 4 shows all the 20 recorded features with a short description. The features contain information about the milling process, i.e. FeedRate, as well as status information from the milling process, i.e. ProgramStatus and status information from the machine, i.e. DriveStatus.
Table 5 shows that some .csv files contain 19 and some 20 features. In the case of the files with 19 features, the variable No. 5 "PocketTable" was not recorded due to malfunctions in the recording interface.
In the last three columns of the data set, the authors assigned a production phase label for each timestamp. Each column represents a specific approach to label the specific production phase:
- In the 2-phase approach, only two phases are labeled if the machine is in a changeover state or intermittent idle time (No. 1) or the machine is in production state (No. 2). The column heading in the .csv files is "Production".
- In the 6-phase approach, six general phases are labeled (No. 1: Starting phase, No. 2: Main phase, No. 3: Ending phase, No. 4: Idle/break phase, No. 5: Production phase, No. 6: Quality control phase). The column heading in the .csv files is "Phase_compressed".
- In the 23-phase approach, specific phases are labeled, which are related to the functional content of an abstracted milling process with changeover. The phases with numbers 1–19 are milling-related sub-phases. Number 20 is assigned for idle time or breaks. Number 21 is assigned when the machine is in production phase. Phases number 22 and 23 are phases for quality control (No. 22: general quality checks, No. 23: quality checks concerning the workpiece quality). The column heading in the .csv files is "Phase".
Table 6 shows which phases of the 23-phase approach are assigned to the phases of the 6-phase approach. The table also contains a short description of all 23 phases.
Labeling the specific phases to the timestamps from sessions 3 to 12 was done using reported changeover start and stop times from the worker terminal. The timestamps from the worker terminal have a resolution of 5 min. This also implicates a rounding error of max. 2.5 min for the assigning of a specific production phase. For sessions 3 to 12, only labeling according to the 2-phase approach was conducted.
For sessions 1, 2, and 13, the labeling was done by a researcher who supervised the complete recording period in person. The timestamps have a resolution of 1 s. Deviations due to the human reaction time can be expected and are estimated to be 0.3 s. For these sessions, all three labeling approaches were conducted.
Figure 1 shows the different counts for the 2-phase labeling approach in all thirteen sessions. Due to the varying order lot sizes, there are different numbers of data rows for the changeover and production phase for the thirteen sessions.
Figure 2 shows the different counts for the 6-phase labeling approach for sessions 1, 2, and 13. The number of data rows for the six phases is comparable for sessions 1 and 13. Session 2 contains many data rows for the production phase "5".
Figure 3 shows the different counts for the 23-phase labeling approach for sessions 1, 2, and 13. Session 2 contains many rows with the label of phase 21 (production). Session 13 shows more idle time (phase 20) than production (phase 21).
3. Methods
For the data acquisition, a middleware by the company Cybus collected the NC data via the HEIDENHAIN DNC interface and transported it via the MQTT protocol to the Azure cloud and into an SQL database. The use of middleware resulted in a preselection of around 400 available variables. Of these variables, domain experts selected 19 variables, which, based on their description, indicated a context for the milling process. Variable No. 20 "Warmup" was derived after the data acquisition from variable No. 3 "ProgramDetail" and added to the data set. [2]
Due to the selected data recording concept, the data was either transferred to the database as soon as a new value was assigned to the variables or every two seconds. The following procedure was used for the imputation of missing values:
- For status variables, e.g., door and program statuses, missing values have been replaced by the last valid previous value.
- For variables that can take on continuous values, such as the feed rate, a rolling mean was calculated using the previous and subsequent values.
The timestamps occur for approx. 99% of all cases in frequencies of 1s, 2s and 3s. Frequencies of 1s occur at approx. 57%. Frequencies of 2s and 3s occur at about 33% and 10%.
4. User Notes
The different approaches to label the specific phases of production were introduced to be able to compare the capability of different ML algorithms to classify multiple categories (multiclass classification). The data set contains different characters of imbalanced data depending on the specific labeling approach (see Section 2).
The data set is available on the Zenodo platform. Please see DOI below. The chosen license for the data set is Creative Commons Attribution 4.0 International [5]. Researchers are free to share and adapt the presented data set, but they must:
- give credit to the authors with a reference,
- provide a link to the license,
- and indicate changes to the original data set.
Author Contributions
Conceptualization, A.-M.S., and B.E.; methodology, B.E.; software, A.-M.S.; validation, A.-M.S., and B.E.; formal analysis, B.E. and A.-M.S.; resources, B.E.; data curation, A.-M.S.; writing—original draft preparation, A.-M.S., and B.E.; writing—review and editing, A.-M.S., and B.E.; visualization, A.-M.S.; supervision, B.E.; project administration, B.E.; funding acquisition, B.E. All authors have read and agreed to the published version of the manuscript.
Funding
The authors gratefully acknowledge the funding support of the OBerA project by the state of Bavaria (Bayerisches Staatsministerium für Wirtschaft, Landesentwicklung und Energie, grant no. IUK530/010).
Institutional Review Board Statement
Not applicable
Informed Consent Statement
Informed consent was obtained from all subjects involved in the study.
Data Availability Statement
The original data presented in this data descriptor are openly available in the Zenodo repository: https://doi.org/10.5281/zenodo.10853254 (accessed on 22nd March 2024).
Acknowledgments
The authors gratefully thank Pabst Komponentenfertigung GmbH and Cybus GmbH for their contributions to the research.
Conflicts of Interest
The authors declare no conflicts of interest.
Abbreviations
The following abbreviations are used in this manuscript:
| ML | Machine Learning |
| NC | Numerical Control |
| OBerA | Optimization of Processes and Machine Tools through Provision, Analysis and Target/Actual Comparison of Production Data |
| SMEs | Small and medium-sized enterprises |
5. Statistics for Data Set
Table 7 contains basic statistics for all the sessions of the data set. The first 20 rows contain the statistics for the recorded features. The last three rows contain the statistics for the three phase approaches (labels).

Table 7.
Statistics for data set.
| Features and labels | count | mean | std | min | 25% | 50% | 75% | max |
| CoolantFlow | 190046 | 0.3146 | 0.46434 | 0 | 0 | 0 | 1 | 1 |
| ProgramStatus | 190046 | 1.2269 | 1.8800 | 0 | 0 | 0 | 2 | 11 |
| ProgramDetail | 190046 | 1.2333 | 1.6699 | 0 | 0 | 1 | 2 | 11 |
| ToolNumber | 190046 | 16.5908 | 8.8392 | 1 | 8 | 20 | 23 | 32 |
| PocketTable | 84446 | 9.1616 | 10.4458 | 0 | 0 | 3 | 20 | 30 |
| DriveStatus | 190046 | 0.5654 | 0.49571 | 0 | 0 | 1 | 1 | 1 |
| DoorStatusMain | 190046 | 0.3847 | 0.48652 | 0 | 0 | 0 | 1 | 1 |
| DoorStatusTooling | 190046 | 0.0324 | 0.17710 | 0 | 0 | 0 | 0 | 1 |
| CabinDoorLockFront | 190046 | 0.0004 | 0.0193 | 0 | 0 | 0 | 0 | 1 |
| CabinDoorLockSide | 190046 | 0.0 | 0.0 | 0 | 0 | 0 | 0 | 0 |
| DNCMode | 190046 | 0.0010 | 0.0314 | 0 | 0 | 0 | 0 | 1 |
| SpindleCleaning | 190046 | 0.0107 | 0.1028 | 0 | 0 | 0 | 0 | 1 |
| ChipCleaningGunStatus | 190046 | 0.9992 | 0.0279 | 0 | 1 | 1 | 1 | 1 |
| OverrideSpindle | 190046 | 99.0817 | 9.5370 | 0 | 100 | 100 | 100 | 100 |
| OverrideFeed | 190046 | 84.2471 | 32.5905 | 0 | 89 | 100 | 100 | 150 |
| FeedRate | 190046 | 767.6445 | 4021.7358 | -32710 | 0 | 0 | 215 | 32767 |
| SpindleSpeed | 190046 | 2513.5364 | 3779.1187 | 0 | 0 | 0 | 5099 | 10046 |
| SpindleApproval | 190046 | 0.0 | 0.0 | 0 | 0 | 0 | 0 | 0 |
| RapidTraverseKey | 190046 | 0.0035 | 0.0589 | 0 | 0 | 0 | 0 | 1 |
| Warmup | 190046 | 0.0374 | 0.1898 | 0 | 0 | 0 | 0 | 1 |
| Phase | 42116 | 17.6614 | 5.0887 | 1 | 13 | 20 | 21 | 23 |
| Phase_compressed | 42116 | 3.8307 | 1.5046 | 1 | 2 | 4 | 5 | 6 |
| Production | 190046 | 0.6118 | 0.4873 | 0 | 0 | 1 | 1 | 1 |
References
- Scientific data. Data Repository Guidance. 2022. Available online: https://www.nature.com/sdata/policies/repositories [Accessed: 04.03.2024].
- Engelmann, B.; Schmitt, A.M.; Theilacker, L.; Schmitt, J. Implications from Legacy Device Environments on the Conceptional Design of Machine Learning Models in Manufacturing. Journal of Manufacturing and Materials Processing 2024, 8, 15. [Google Scholar] [CrossRef]
- Biju, V.G.; Schmitt, A.M.; Engelmann, B. Assessing the Influence of Sensor-Induced Noise on Machine-Learning-Based Changeover Detection in CNC Machines. Sensors 2024, 24, 330. [Google Scholar] [CrossRef] [PubMed]
- Miller, E.; Borysenko, V.; Heusinger, M.; Niedner, N.; Engelmann, B.; Schmitt, J. Enhanced changeover detection in industry 4.0 environments with machine learning. Sensors 2021, 21, 5896. [Google Scholar] [CrossRef] [PubMed]
- Creative Commons. CC BY 4.0 Deed Attribution 4.0 International. 2024. Available online: https://creativecommons.org/licenses/by/4.0/deed.en [Accessed: 21.03.2024].
Figure 1.
Occurrences 2-phases.
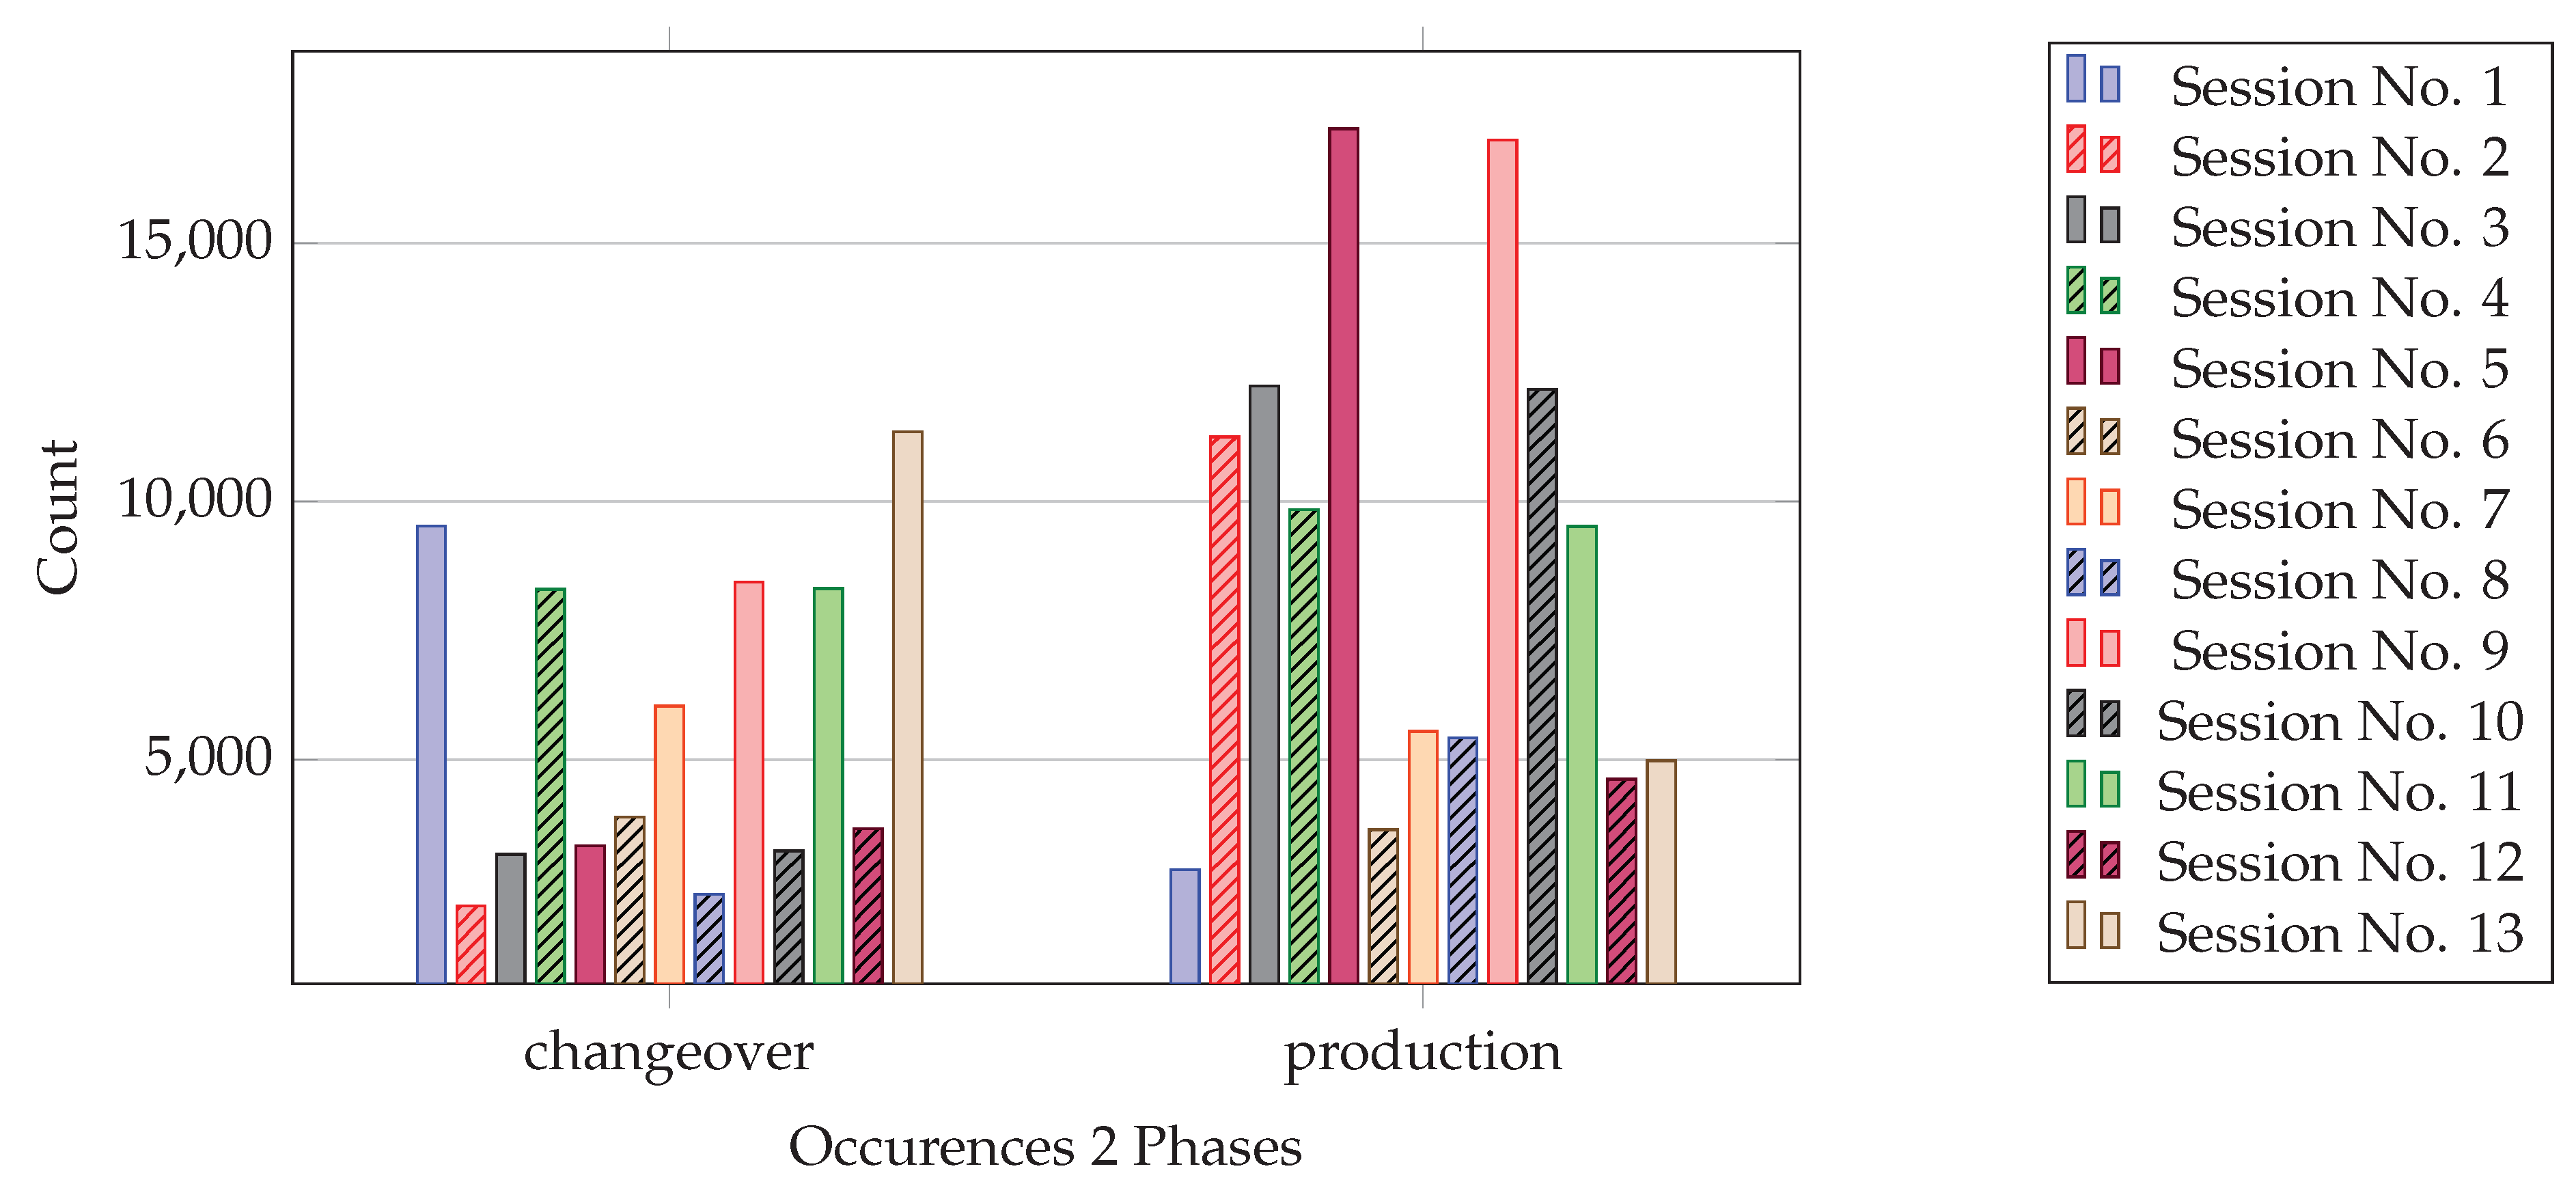
Figure 2.
Occurrences 6-phases.
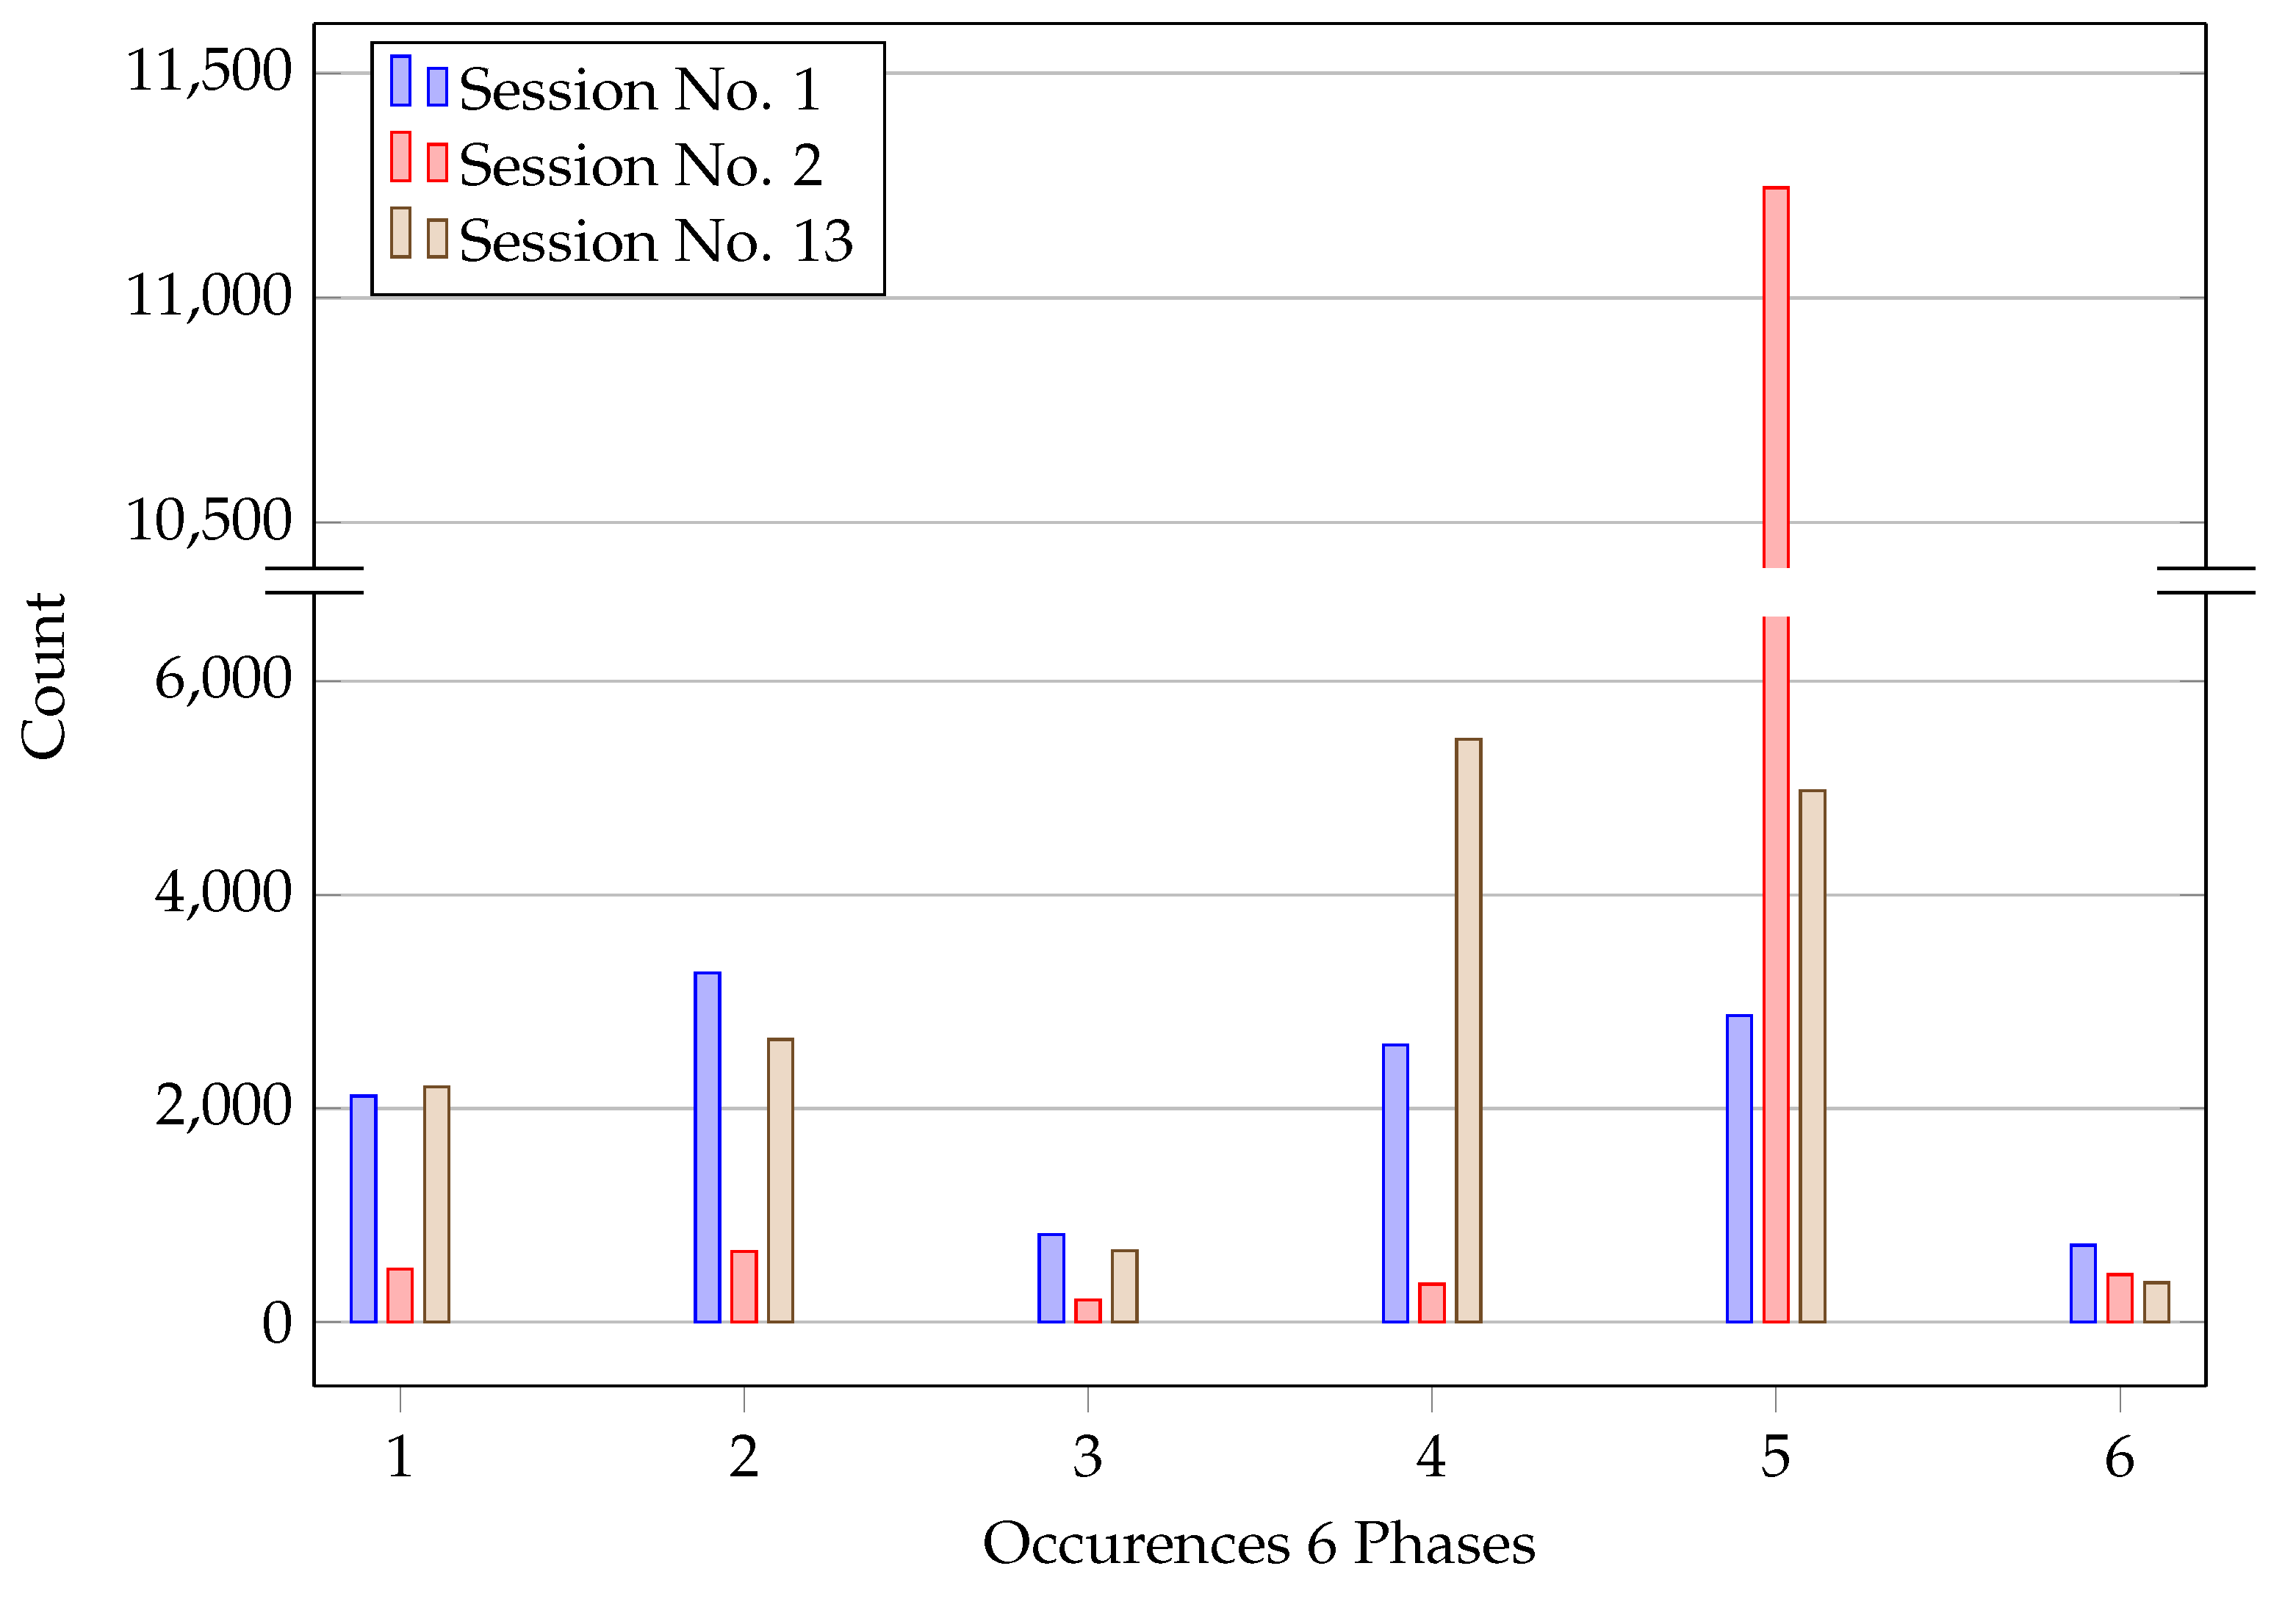
Figure 3.
Occurrences 23-phases. 14*: Phases 14+15, 16*: Phases 16+17.
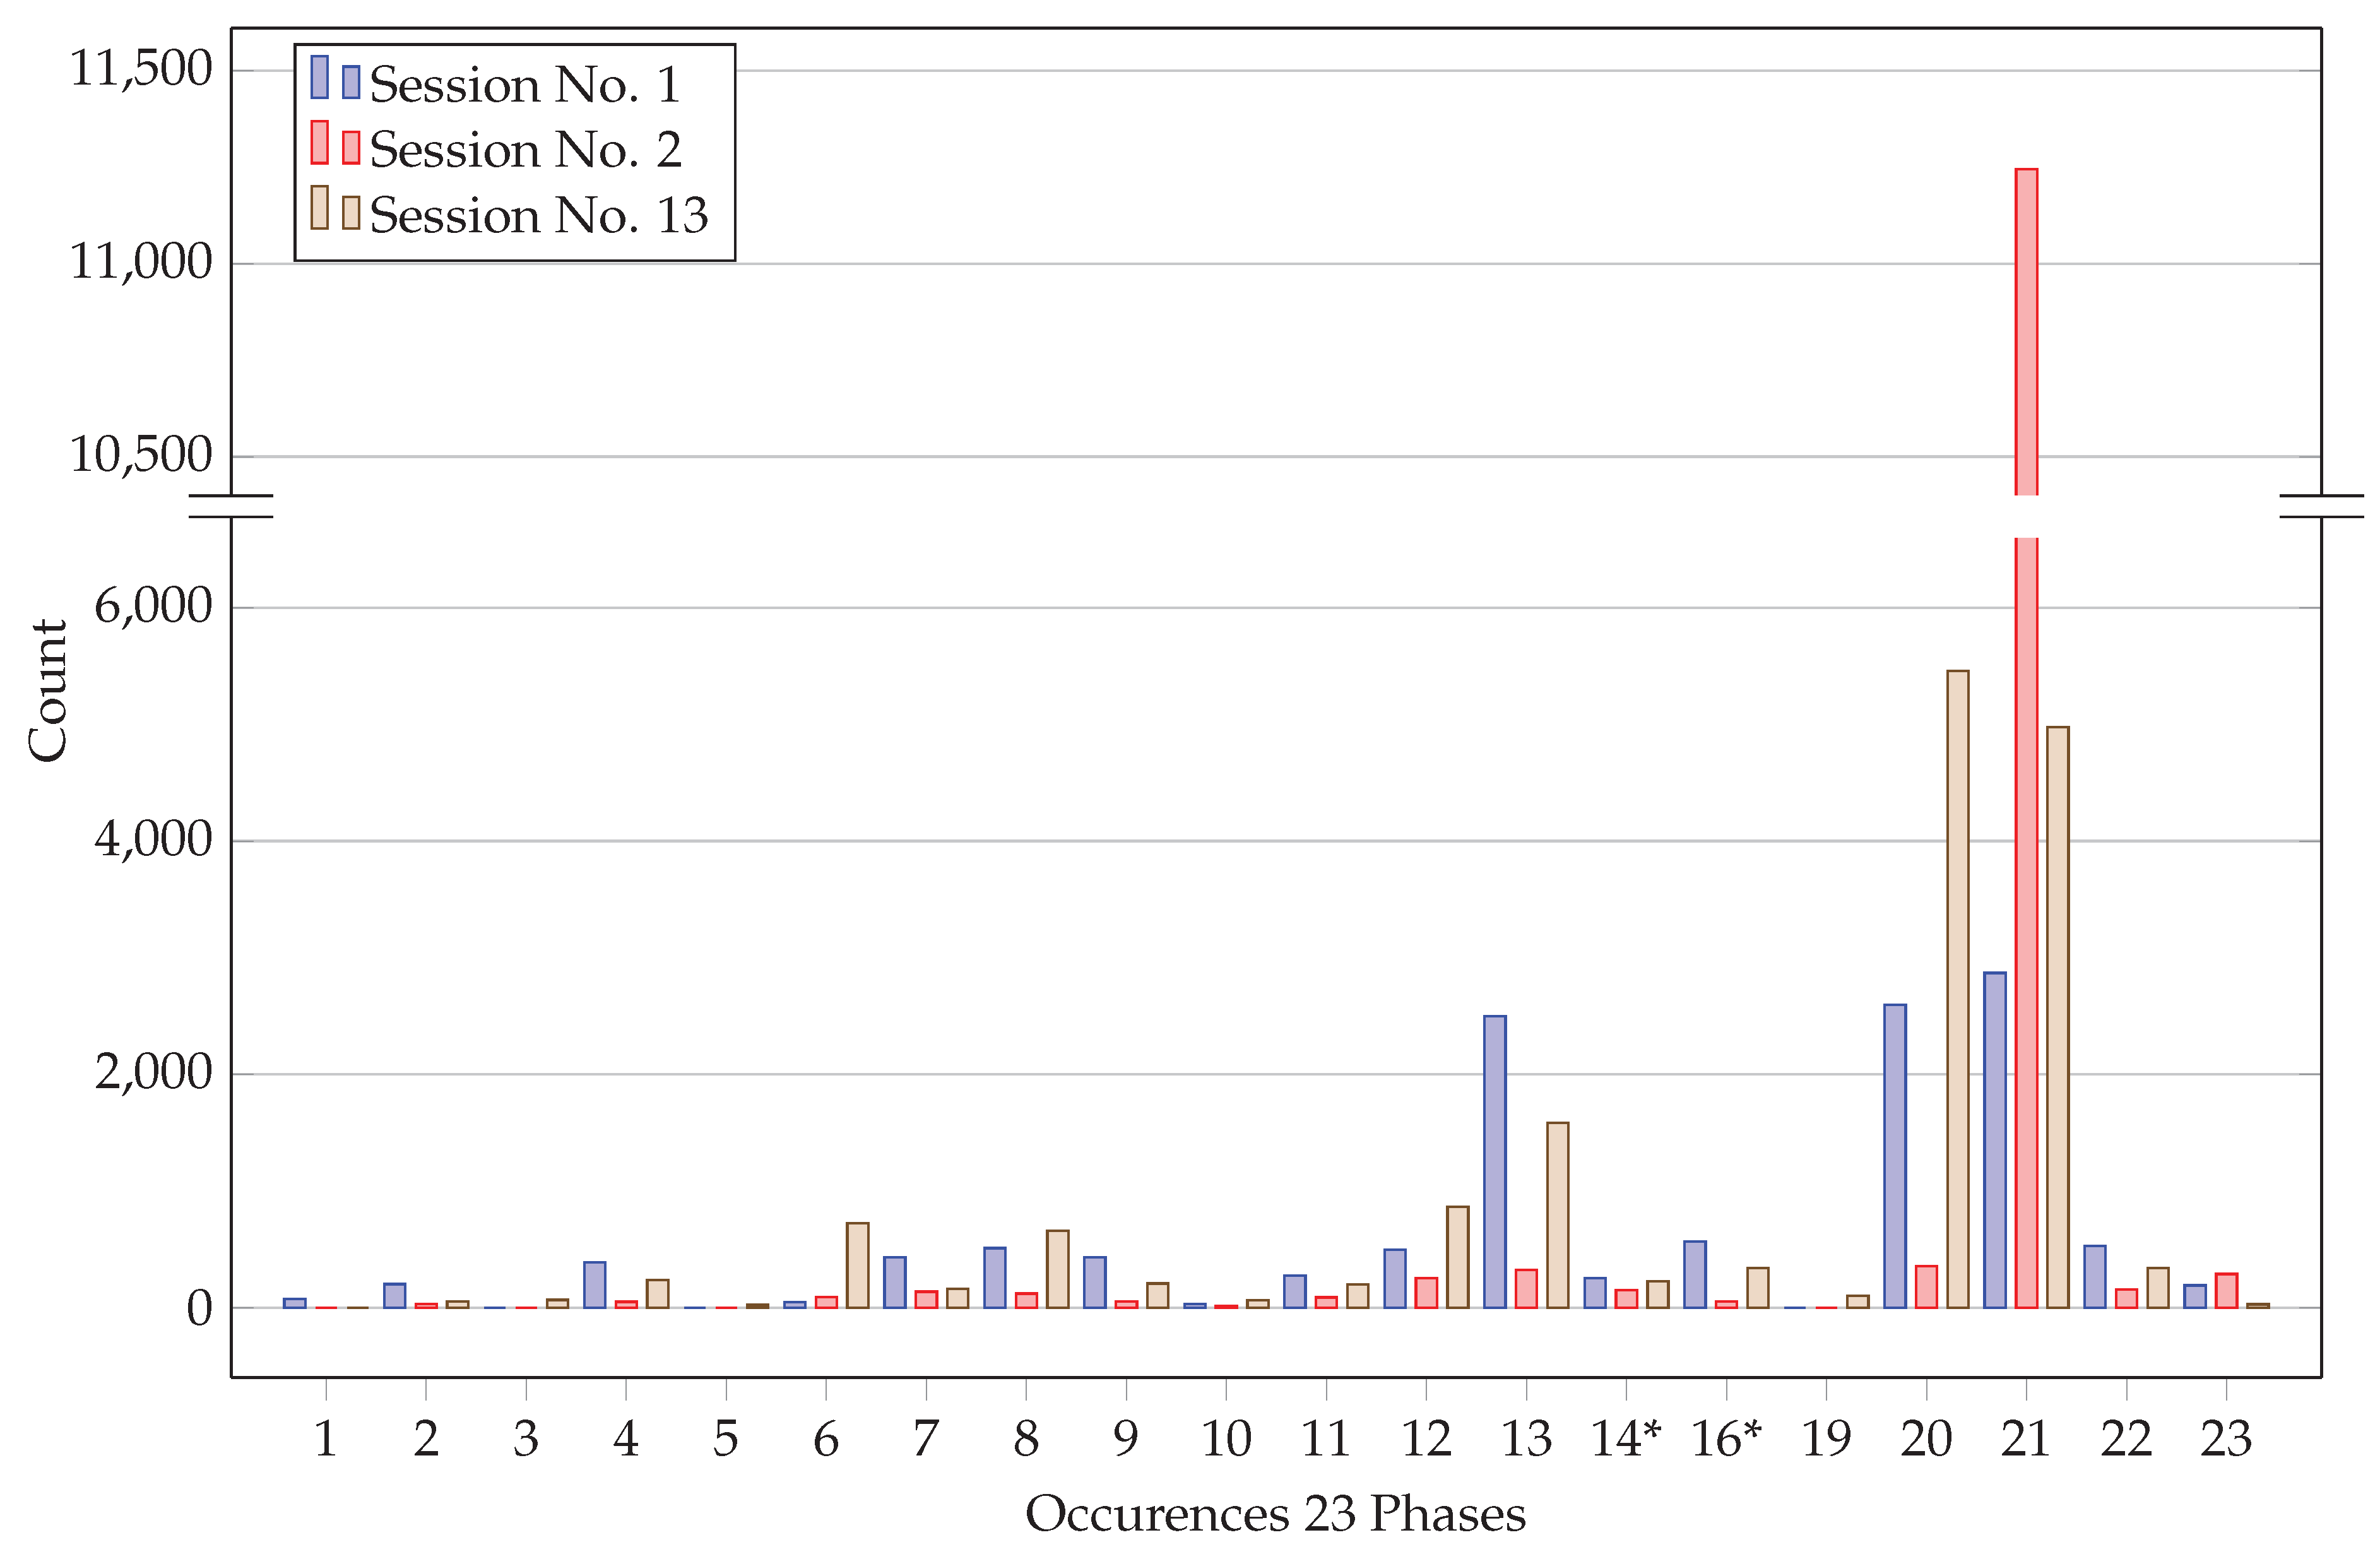
Table 1.
Milling-related data sets in data generalist repositories.
| Repository name | Focus | No. of milling related data sets | Manufacturing relation |
|---|---|---|---|
| Open Science | Generalist | 3 | 0 |
| Framework (OSF) | |||
| Figshare | Generalist with | 4* | 3 |
| engineering subcategories | |||
| Zenodo | Generalist with | 4 | 3 |
| engineering subcategories | |||
| Datadryad | Generalist | 0 | 0** |
| Science Data Bank | Generalist with | 16 | 5 |
| engineering subcategories | |||
| Harvard Dataverse | Generalist with | 6 | 2 |
| engineering subcategories |
* Categories: Mechanical, Materials, Other engineering, ** Mostly biological data sets.
Table 2.
Recorded sessions in the data set.
| Session no. | File name | Data rows | Data rows per hour |
|---|---|---|---|
| 1 | Data_from_2021-11-26.csv | 12388 | 1594 |
| 2 | Data_from_2021-12-07.csv | 13410 | 2038 |
| 3 | Data_from_2021-12-17.csv | 15396 | 1811 |
| 4 | Data_from_2022-01-20.csv | 18135 | 1844 |
| 5 | Data_from_2022-01-21.csv | 19810 | 1801 |
| 6 | Data_from_2022-02-14.csv | 7526 | 1926 |
| 7 | Data_from_2022-02-16.csv | 11582 | 1878 |
| 8 | Data_from_2022-02-18.csv | 7818 | 1956 |
| 9 | Data_from_2022-02-22.csv | 25422 | 2383 |
| 10 | Data_from_2022-03-02.csv | 15398 | 1949 |
| 11 | Data_from_2022-03-15.csv | 17828 | 2097 |
| 12 | Data_from_2022-04-05.csv | 8287 | 1579 |
| 13 | Data_from_2022-04.csv | 16318 | 2028 |
Table 3.
Duration of complete sessions, duration of changeover period and related products.
| No. | Total time | Changeover time | Old product | New product |
|---|---|---|---|---|
| 1 | 06:07:29 | 04:43:00 | 1 | 9 |
| 2 | 06:34:45 | 01:03:37 | 2 | 10 |
| 3 | 08:29:54 | 02:04:58 | 3 | 11 |
| 4 | 09:49:55 | 04:49:58 | 4 | 5 |
| 5 | 10:29:55 | 01:44:58 | 5 | 4 |
| 6 | 03:54:27 | 01:59:28 | 3 | 6 |
| 7 | 06:09:57 | 03:10:00 | 6 | 12 |
| 8 | 03:59:43 | 01:14:58 | 7 | 5 |
| 9 | 10:39:56 | 04:04:57 | 5 | 1 |
| 10 | 07:53:53 | 01:33:55 | 4 | 4 |
| 11 | 08:30:04 | 03:54:57 | 4 | 13 |
| 12 | 05:14:57 | 01:49:59 | 5 | 8 |
| 13 | 08:02:53 | 05:36:35 | 8 | 14 |
Table 4.
Recorded features.
| No. | Feature name | Description |
|---|---|---|
| 1 | CoolantFlow | Coolant flow turned on/off |
| 2 | ProgramStatus | Status Code: |
| idle: 0 | ||
| started: 1 | ||
| running: 2 | ||
| stopped: 3 | ||
| finished: 4 | ||
| completed: 5 | ||
| interrupted: 6 | ||
| error: 7 | ||
| canceled: 8 | ||
| selected: 9 | ||
| not_selected: 10 | ||
| cleared: 11 | ||
| 3 | ProgramDetail | See ProgramStatus, additionally includes program name |
| 4 | ToolNumber | Tool number and name |
| 5 | PocketTable | Place table for tool changer, number, and tool name |
| 6 | DriveStatus | Drive turned on/off |
| 7 | DoorStatusMain | Main door open/closed |
| 8 | DoorStatusTooling | Tooling door open/closed |
| 9 | CabinDoorLockFront | Front cabin door locked/unlocked |
| 10 | CabinDoorLockSide | Side cabin door locked/unlocked |
| 11 | DNCMode | DNC mode on/off |
| 12 | SpindleCleaning | Spindle cleaning on/off |
| 13 | ChipCleaningGunStatus | Chip cleaning gun on/off |
| 14 | OverrideSpindle | Spindle override (0-150 %) |
| 15 | OverrideFeed | Feed override (0 to 150 %) |
| 16 | FeedRate | Feed rate (-32710 to 32767 m/s) |
| 17 | SpindleSpeed | Spindle speed (0 to 10046 rpm) |
| 18 | SpindleApproval | PLC spindle lock on/off |
| 19 | RapidTraverseKey | Rapid traverse on/off |
| 20 | Warmup | Machine in warmup program on/off |
Table 5.
Number of features in the recorded sessions.
| No. | Time period start | Time period end | Number of features |
|---|---|---|---|
| 1 | 2021-11-26 07:15:36 | 2021-11-26 15:01:59 | 20 |
| 2 | 2021-12-07 07:39:13 | 2021-12-07 14:13:59 | 20 |
| 3 | 2021-12-17 14:00:01 | 2021-12-17 22:29:59 | 19 |
| 4 | 2022-01-20 09:10:01 | 2022-01-20 18:59:59 | 19 |
| 5 | 2022-01-21 11:30:01 | 2022-01-21 22:29:59 | 19 |
| 6 | 2022-02-14 11:35:01 | 2022-02-14 15:29:30 | 19 |
| 7 | 2022-02-16 11:30:01 | 2022-02-16 17:39:59 | 19 |
| 8 | 2022-02-18 07:00:14 | 2022-02-18 11:00:00 | 19 |
| 9 | 2022-02-22 11:45:01 | 2022-02-22 22:24:58 | 20 |
| 10 | 2022-03-02 07:06:05 | 2022-03-02 15:00:00 | 20 |
| 11 | 2022-03-15 06:58:00 | 2022-03-15 15:28:08 | 20 |
| 12 | 2022-04-05 07:30:01 | 2022-04-05 12:45:00 | 19 |
| 13 | 2022-04-05 13:06:11 | 2022-04-08 09:59:10 | 19 |
Table 6.
Different changeover phases, updated from [4].
Table 6.
Different changeover phases, updated from [4].
| 6-phases | 23-phases | Description |
|---|---|---|
| 1 - Start | 1 | Reporting changeover start at the terminal |
| 2 | Machine table cleaning | |
| 3 | Remove fixture from the machine table | |
| 4 | Component fastening to fixture | |
| 5 | Move fixture to the machine table | |
| 6 | Attach fixture to the machine table | |
| 7 | NC program loading | |
| 8 | Tool presetting | |
| 9 | Tool magazine filling and tool control | |
| 10 | Enter tool dimensions | |
| 2 - Main | 11 | Insert/remove tool directly into/from spindle |
| 12 | Zero point setting | |
| 13 | NC program optimizing and running | |
| 3 - End | 14* + 15 | Component cleaning and dismantling |
| 16* + 17 | Component deburring and remeasuring | |
| 18** | Upoad the optimized NC program | |
| 19 | Reporting changeover stop at the terminal | |
| 4 - Idle/break | 20 | Idle/break |
| 5 - Production | 21 | Production |
| 6 - Quality | 22 | General quality control |
| 23 | Workpiece quality control |
* only first number used for labeling. ** not used in this research.
Disclaimer/Publisher’s Note: The statements, opinions and data contained in all publications are solely those of the individual author(s) and contributor(s) and not of MDPI and/or the editor(s). MDPI and/or the editor(s) disclaim responsibility for any injury to people or property resulting from any ideas, methods, instructions or products referred to in the content. |
© 2024 by the authors. Licensee MDPI, Basel, Switzerland. This article is an open access article distributed under the terms and conditions of the Creative Commons Attribution (CC BY) license (http://creativecommons.org/licenses/by/4.0/).
Copyright: This open access article is published under a Creative Commons CC BY 4.0 license, which permit the free download, distribution, and reuse, provided that the author and preprint are cited in any reuse.


