
Submitted:
21 March 2024
Posted:
21 March 2024
You are already at the latest version
Abstract
Fundus image registration plays a crucial role in the clinical evaluation of ocular diseases, such as diabetic retinopathy and macular degeneration, necessitating meticulous monitoring. The alignment of multiple fundus images enables the longitudinal analysis of patient progression, widening the visual scope, or augmenting resolution for detailed examinations. Currently, prevalent methodologies rely on feature-based approaches for fundus registration. However, certain methods exhibit high feature point density, posing challenges in matching due to point similarity. This study introduces a novel fundus image registration technique integrating U-Net for the extraction of feature points employing FIVES for its training and evaluation, a novel and large dataset for blood vessels segmentation, prioritizing point distribution over abundance. Subsequently, the method employs medial axis transform and pattern detection to obtain feature points characterized by the Fast Retina Keypoint (FREAK) descriptor, facilitating matching for transformation matrix computation. Assessment of the vessel segmentation achieves 0.7559 for Intersection Over Union (IoU), while evaluation on the Fundus Image Registration Dataset (FIRE) demonstrates the method’s comparative performance against existing methods, yielding a registration error of 0.596 for area under the curve, refining similar earlier methods and suggesting promising performance comparable to prior methodologies.
Keywords:
Fundus image registration
; Feature extraction
; Blood vessels segmentation
; Feature matching
; Enhanced vascular bifurcations mapping
1. Introduction
The retina constitutes an integral component of the human visual system, responsible for the conversion of optical stimuli into neuroelectric signals that undergo subsequent processing within the brain. Among the various modalities for assessing the retina, fundus imaging stands as the predominant method, playing a pivotal role in the evaluation of diverse ocular pathologies, including diabetic retinopathy, age-related macular degeneration, and glaucoma, among others [1]. While individual fundus images offer a direct means of retinal assessment, the augmentation of this process through the integration of multiple fundus images and subsequent image registration emerges as a substantive approach. This method assumes significance in its ability to complement singular assessments, providing a more comprehensive evaluation that aids physicians in the discernment and diagnosis of retinal diseases [2].
Fundus image registration constitutes the systematic alignment of images sharing overlapping regions, relying on established correspondences between them. The detection of such correspondences serves as the essence of feature-based fundus registration, leading to diverse applications within the field of retinal analysis [3,4]. Foremost among these applications lie longitudinal studies, crucial in inspecting fundus images captured at disparate temporal intervals to exhibit morphological alterations within ocular structures due to evolving pathologies. Concurrently, image mosaicking emerges as an essential application, seeking to broaden the visual scope by harmonizing multiple fundus images from distinct viewpoints. Given the intrinsic limitation of fundus images, typically confined to a 45° field of view, comprehensive retinal assessments demand the analysis of multiple perspectives—a laborious and intricate undertaking for healthcare practitioners [5]. While wide-angle fundus photography offers an alternative with a potential field of view that surpasses 100° [6], its adoption remains limited owing to requisites such as pupil dilation and the exorbitant cost of specialized fundus cameras, particularly impeding accessibility for patients residing in rural areas [7]. Analogously, the pursuit of Super-Resolution of Fundus Images relies on registration techniques to align multiple low-resolution images obtained from cost-effective, portable fundus imaging devices often deployed in telemedicine initiatives [8]. Through the synthesis of these marginally varied images, resolution enhancement ensues, culminating in augmented visual acuity and the retrieval of clinically significant details previously obscured.
Various techniques have been developed for registering fundus images, some focusing on initial blood vessel detection in the images. For instance, while the Straightforward Bifurcation Pattern-Based Fundus Image Registration method (SBP-FIR) outlined in [9] relies on pixel-wise segmentation, the approach presented in [10] specifically utilizes the Frangi filter [11] for detecting tubular structures in fundus images. These methods employ thresholding-based segmentation and feature-based segmentation using filtering techniques, respectively. While these approaches offer advantages in terms of ease of implementation, simplicity, and, in the case of filtering-based methods, improved noise robustness, this study employs deep learning-based segmentation. This choice is due to its higher accuracy and particularly its adaptability to diverse datasets and the reduced dependency on threshold selection.
This paper introduces an algorithm designed for registering pairs of fundus images. In contrast to prior methodologies that used thresholding-based segmentation and Frangi filter [9,10,11] as the foundation for blood vessel delineation in fundus images, this approach initiates with the utilization of U-Net [12] to identify the specific region of interest within the image. The primary advantage of employing U-Net over the Frangi filter for defining this region in the fundus image arises from U-Net’s autonomy in sensitivity parameter settings and the execution time, since the entire segmentation process is performed more efficiently. The necessity of configuring sensitivity parameters for the Frangi filter restricts its adaptability in generalization and complex structure detection, while U-Net segmentation methods exhibit proficiency in learning intricate features without such constraints. Furthermore, the incorporation of U-Net in the segmentation process ensures the accurate identification of bifurcation regions, a guarantee that is occasionally lacking in the application of the Frangi filter [13]. The process begins with the utilization of U-Net [12] to identify a specific region of interest within the image (i.e. the blood vessels). A subsequent thinning process and pattern detection take place, and feature points are characterized using the Fast Retina Keypoint (FREAK) descriptor [14]. Feature matching is executed, and the removal of outliers and computation of the similarity transformation are achieved through Random Sample Consensus (RANSAC) [15]. Ultimately, a seamless image is generated via a blending process. This method not only endeavors to enhance registration precision but also aims to diminish execution time, a critical factor in introducing new methodologies into clinical practice for computer-aided diagnosis. This study evaluates both segmentation results and registration accuracy, yielding an Intersection over Union (IoU) score of 0.7559 on the Fundus Image Vessel Segmentation (FIVES) dataset [16] and an Area Under the Curve (AUC) of 0.596 on the Fundus Image Registration Dataset (FIRE) dataset [17]. It competes with complex methods and notably reduces the execution time by half compared to one of the top methods in registration accuracy, while still maintaining competitive performance in certain categories.
This paper’s central contribution lies in the novel integration of U-Net, FREAK descriptor, and RANSAC within the domain of fundus image registration, aiming to refine similar earlier methods. Departing from traditional approaches relying on thresholding-based segmentation or Frangi filter applications, this method introduces a paradigm by initiating the region-of-interest identification through U-Net [12]. Subsequent feature extraction results in a more evenly distributed feature point layout across fundus images compared to other state-of-the-art extractors. Despite exhibiting slightly lower accuracy in certain aspects compared to other methodologies, this technique significantly reduces execution time. The method’s evaluation across diverse datasets, including the FIVES dataset [16] and the FIRE dataset [17], emphasizes its competitive performance against complex methods while significantly reducing computational load.
This paper is structured as follows: Section 2 provides a comprehensive review of relevant studies within the field. Following this, Section 3 delineates the proposed approach for fundus image registration. Section 4 delves into a thorough examination of the experimental outcomes derived from the application of the proposed technique. Subsequently, discussion is presented in Section 5. Ultimately, Section 6 serves as the conclusion of this paper.
2. Related Work
In the extensive body of literature pertaining to fundus imaging, a multitude of methodologies for both registering and stitching fundus images have been advanced and documented. While the Scale-Invariant Feature Transform (SIFT) [18] stands as a cornerstone among robust and extensively adopted methods in image processing, the task of identifying corresponding points in fundus images presents challenges, particularly in scenarios involving fluctuating illumination or when confronted with two surfaces exhibiting similar intensity levels. This difficulty of its application in registering fundus image pairs arises from SIFT’s reliance solely on gray information for features extraction, thereby complicating the differentiation between such visually analogous conditions.
Nonetheless, some works have partially or entirely made use of this descriptor. For instance, the SIFT descriptor was employed in [19] to describe feature points that correspond to bifurcations over fundus images and subsequently, after feature matching and false match removal, Voronoi diagram is used to create mosaic images. However, the application and evaluation are limited to this task, putting aside tasks like longitudinal study and super-resolution imaging. This work was evaluated on the Fundus Image Registration Dataset (FIRE) dataset [17], which was also employed in [20], being the latter one of the top leaders in registration on this dataset. This approach integrates blood vessel bifurcations and the SIFT detector as feature points, initializing the initial estimation of camera pose through RANSAC employing a spherical eye model, ensuring precise results. Subsequent steps involve parameter estimation for an ellipsoidal eye model and further refinement of the camera pose. While commendable for its precision, a discernible drawback emerges in its approach to feature detection, employing dual feature detectors, thereby augmenting the amount of feature points. As a consequence, this amplifies the computational complexity during matching and registration, therefore elongating processing durations. On the other hand, while these researches are feature-based methods, Gong et al. in [21] affirm that registration based on intensity surpasses the performance of methods reliant on feature-point registration. In this intensity-based registration approach, dimensionality reduction serves as a pivotal technique employed to transpose disordered input images into a space characterized by lower dimensions. Leveraging this reduced dimensional representation, efficient recognition of global correspondences within images becomes feasible. In the context of contiguous image pairs, their approach involves optimizing the Mutual Information metric for registration purposes. The subsequent step involves the synthesis of panoramas through image blending.
Regarding works that have completely excluded the use of SIFT, numerous feature-based registration methodologies relying only on landmark identification along blood vessels have been proposed to register pairs of fundus images. In the study referenced as [22], a Convolutional Neural Network (CNN) trained on the Digital Retinal Images for Vessel Extraction (DRIVE) dataset is employed for detecting vascular crossovers and bifurcations, utilizing the U-Net architecture. This specific U-Net architecture is tailored for predicting a heatmap identifying landmarks crucial for subsequent determination. Similarly, the utilization of the Deep Retinal Image Understanding network (DRIU) alongside pre-trained VGG-16, as delineated in [23], entails a preliminary stage of blood vessel segmentation to facilitate subsequent feature detection. Furthermore, alternative methodologies disengaged from deep learning have directed attention to blood vessels as a focal area of interest for ascertaining feature points conducive to fundus registration. For example, the study detailed in [24] executed blood vessel segmentation through fundamental morphological operations and curvature evaluation. Likewise, in the work explicated by [25], the vessel tree served as a focal region for feature extraction, harnessing bifurcations extracted from the segmented vessel tree and incorporating a Bayesian approach as a matching algorithm. A straightforward mosaicking of fundus images methodology is presented in [26], in which utilizing a CNN model, their approach segments vascular structures within fundus images, specifically targeting the detection of vascular bifurcations. These bifurcations are subsequently extracted as feature points upon the vascular mask and subsequently the estimation of transformation parameters for the purpose of image stitching is stablished among these vascular bifurcations. While the effectiveness of this method was evaluated across a limited set of eyes, the primary limitation of this study lies in its absence of comparison with other methods to support its performance.
The investigation into bifurcations and crossovers in fundus images has been essential, particularly in the accurate identification of blood vessel issues and clot localization, crucial for precise medical intervention [27]. These points of junction are integral in understanding blood flow variations and pressure dynamics within the vessels [28]. In [27], a meticulous approach involved segmenting patches of 21×21 pixels along vessel structures obtained from binary segmentations. These patches became the training data for a Res18 convolutional neural network, aiming to discern these features. Despite a modest dataset of 40 images from the DRIVE database (30 for training, 10 for testing), the patch-based method generated an extensive sample pool of over 100,000 patches, ensuring a robust learning process. Moreover, similar techniques were employed in other studies like Patwari et al. [29] and others [30,31], utilizing methods such as morphological skeletonization, image enhancement through histogram equalization, and the extraction of bifurcation points from blood vessel skeletons, thereby augmenting the comprehension of vessel structures and their features.
It is noticeable that several methods in fundus image analysis focus on blood vessel segmentation to detect bifurcation points. Similarly, as seen in [26], this paper’s method emphasizes segmenting blood vessels to identify feature points within the segmentation map. Several studies concentrate on employing Convolutional Neural Networks (CNNs) for this purpose. For instance, Dharmawan et al. [32] proposed a modified U-Net [12] for patch-based segmentation, reducing downsampling operations and adding dropout layers between consecutive convolutional layers. They trained this network using cross-entropy loss on datasets such as DRIVE [33], STARE [34], and HRF [35]. In contrast, [36] introduces ResWnet, altering the U-Net structure by minimizing downsampling layers to two and implementing an encoding-decoding-encoding-decoding structure. ResWnet enhances feature retention and semantic extraction by utilizing skip connections and residual blocks, improving sensitivity across various vessel scales, evaluated on DRIVE and STARE databases. Moreover, [37] presents DRNet, a method using U-Net inspiration and a deep dense residual network structure. DRNet creatively merges feature maps across blocks, aiding spatial reconstruction, and introduces DropBlock to address overfitting concerns. Each method showcases innovations in vessel segmentation approaches for fundus image analysis.
Diverging from some prior research approaches, this study primarily focuses on aligning fundus images through a sequential process. Initially, it employs the traditional U-Net architecture [12] for segmenting blood vessels, utilizing the Fundus Image Vessel Segmentation (FIVES) dataset [16]. This novel dataset boasts a substantial collection of annotated fundus images, reportedly offering superior accuracy in labeling compared to other publicly available datasets intended for blood vessel segmentation in fundus images. The detection of bifurcations occurs along the blood vessel skeleton to establish the geometric relationship between the images. Subsequently, an image blending technique is applied to generate the final aligned result.
3. Proposed Method
This section introduces the conceptual framework of the proposed method. The central objective of this paper involve developing a feature-based fundus image registration technique, leveraging bifurcations and crossovers situated along the morphological skeleton of blood vessel segmentation as feature points. The SBP-FIR method outlined in [9] exhibited promising performance in registering pairs of fundus images. This proposal employed a pixel-wise segmentation method to initially define a region of interest over blood vessels, commonly used for detecting bifurcations and crossovers in fundus images [27,28,29,30,31]. After skeletonization, a pattern detection process was utilized to locate bifurcations and crossovers, followed by their characterization using Histogram of Oriented Gradients (HOG). This characterization facilitated establishing a geometric relationship between the fundus images, ultimately enabling image warping and blending for registration purposes. Illustrated in Figure 1, the proposed method unfolds across four principal stages: feature extraction, feature matching, computation of the transformation matrix and subsequent image warping, concluding with image blending. Unlike the approach in [9], this method utilizes a deep learning-based technique for blood vessel segmentation. The primary objective is to enhance segmentation accuracy while concurrently reducing processing time, complemented by the utilization of the FREAK descriptor.
3.1. Flowchart Description
Figure 1 presents an outline of the proposed method. Initially, a pair of color fundus images constitutes the input. Feature point extraction prioritizes the blood vessels area. Blood vessels segmentation follows on the original fundus images, succeeded by thinning or skeletonization to detect bifurcation patterns in the thinned images. Subsequently, descriptors represent feature points in each image, facilitating their matching for identification of shared points between the source and target images. Once the relationship between points in the source and target images is established, a transformation matrix is computed and applied to warp the source image. Finally, a blending process ensures seamlessness in the resulting image, mitigating visible seams due to potential exposure variations in the overlapped regions.
The revised method demonstrates significant advancements compared to its predecessor [9], primarily attributed to a shift in the segmentation approach and feature extraction techniques. Transitioning from a pixel-wise segmentation method to leveraging U-Net for blood vessel segmentation markedly heightens accuracy [38] and accelerates processing times. This adoption of deep learning enhances segmentation precision and optimizes computational demands. Additionally, employing the FREAK descriptor in feature extraction replaces the Histogram of Oriented Gradients (HOG) descriptor, aiming to accelerate the process without compromising accuracy [39]. Moreover, refining the matching process by omitting certain verification methods from the previous approach increases efficiency, allowing for faster registration while preserving potential matches. These strategic modifications collectively enhance the speed and precision of image registration, positioning the new method as a significant improvement over its predecessor. Further elaboration on the method is provided in subsequent sections.
3.2. Feature Extraction
Methods in fundus image registration that utilize the entire image for alignment and determine error based on similarity measures often struggle when aligning the complete fundus image surface [40]. In the proposed method for fundus image registration, detection of feature points is based on the extraction of vessels from the fundus image. Therefore, a robust method for detecting the vascular structure is required.
For this, the preprocessing stage starts with extraction of green channel of the fundus image, since this channel is the one having the greater contrast between blood vessels and background. Still, fundus images tend to be dark, and for this reason, to improve brightness and contrast between blood vessels and background, firstly gamma correction is applied, which is described by the Equation (1):
where x is the original pixel, y is the resultant pixel and is the gamma correction value. For the proposed method, was set to [41]. By means of this process the tonal response of the image is adjusted, and the darker areas of the fundus image are emphasized, while the brighter ones are compressed. Subsequently, the preprocessing continues by applying the Contrast Limited Adaptive Histogram Equalization (CLAHE) [42], which improves the visual quality of the fundus image while avoiding artifacts that other traditional histogram equalization methods may produce. The preprocessing steps are illustrated in Figure 2.
After preprocessing, the next stage in feature extraction for the fundus image is making segmentation of blood vessels. For this, patch-based segmentation is performed with U-Net [12], since the utilization of the entire image for both training and prediction strategies hinders U-net from attaining satisfactory results in vessel segmentation [43]. The reason for avoiding traditional segmentation methods arises from the evidence that deep learning-based segmentation methods many times are better not only regarding time [44] but also in accuracy, in which deep learning approaches are even better than human experts in retinal vessel segmentation [45].
Processing an entire high-resolution fundus image in one go can demand significant memory resources, especially for deep learning models. Therefore, to diminish the memory usage demanded during training or inference, patch-based segmentation is conducted. This type of segmentation implies three basic steps: partitioning (dividing the fundus image into smaller patches), processing (performing blood vessels segmentation) and aggregation (combining the segmented patches to generate a final segmented output for the entire fundus image), and it entails some benefits, such as the possibility of handling large images, enhancing the capture local context, robustness to variations, data augmentation and generalization, among others.
The proposed methodology harnesses the classical U-Net architecture, structured with convolutional blocks employing a downsampling schema facilitated by max pooling. Each block integrates convolutional layers activated by Rectified Linear Units (ReLU), ensuring feature extraction and representation. The upsampling component reverts the spatial resolution, preserving vital skip connections, culminating in a concluding layer comprising convolutional layers, culminating with sigmoid activation. Tailored to the task of blood vessels segmentation within fundus images, this approach performs a patch-based segmentation strategy using U-Net. The focus concentrates toward bifurcation detection, thus the network undergoes exclusive training solely on patches containing at least one bifurcation, steering the model to discern these essential points. Employing the FIVES dataset [16]—a repository boasting 800 high-resolution color fundus images, meticulously annotated at the pixel level—the network navigates its learning process.
The training comprises distinct phases aimed at refining the model’s understanding. Initially, 2000 patches are deployed, employing a learning rate of over 20 epochs. This foundational training is followed by two fine-tuning stages, introducing entirely new patch imagery. The first fine-tuning phase capitalizes on 2000 new patches, extending through 20 epochs with a reduced learning rate of . Subsequently, the second fine-tuning phase intensifies the learning with 3000 patches, reduced to 5 epochs while refining towards a learning rate of . This intricate approach endeavors to boost the U-Net model to delineate blood vessels while elevating its sensitivity toward identifying crucial bifurcation points within fundus images, leveraging a sequenced training methodology for optimal performance. Figure 3 shows the result of segmentation for patches and for the entire image after aggregation step, producing the blood vessels segmentation mask.
Next, the Zhang-Suen thinning algorithm [46] is utilized to perform thinning on the image, aimed at extracting the center lines of blood vessels previously segmented by the U-Net model. This specific algorithm functions by isolating the central pathways within a binary image, achieved through the elimination of image contour points, retaining only those points that constitute the skeleton structure, and preserving the bifurcation points within the skeleton of the fundus image blood vessels. Through multiple iterations, the algorithm progressively refines and consolidates these skeletons to derive the final representation of vascular centerlines. The outcome of applying this algorithm to the blood vessels’ segmentation of a fundus image is visually depicted in Figure 4.
Finally, feature points are identified by analyzing patterns within the skeleton. Distinct orientations of T and Y-shaped patterns are established to detect these specific configurations of foreground and background pixels within the vessel segmentation skeleton. The Hit-or-Miss transform, a binary morphological operation utilizing two structuring elements ( and ), is utilized to represent both the foreground (i.e., the morphological skeleton of blood vessel segmentation) and the background of the searched patterns. Equation (2) defines the bifurcation patterns observed across the skeleton image (A):
Here, symbols ⊛, ⊖, and ∩ denote convolution, erosion, and intersection operators, respectively. B combines structuring elements, where signifies the pattern’s skeleton and signifies its background. Additionally, denotes the complement of the skeleton image.
In this context, bifurcations are determined by identifying vessel pixels in their 8-neighborhood that possess three non-adjacent vessel pixels. These specific patterns are visualized in Figure 5.
3.3. Feature Matching
Once the feature points within the fundus image are identified, establishing the geometric relationship between images involves associating features from the source image with their counterparts in the target image. Initially, bifurcation points undergo characterization via a feature descriptor to identify their corresponding points in the other image. Given the limited texture in fundus images, predominantly dominated by the background, a robust feature descriptor becomes crucial. For this purpose, the FREAK descriptor, known for its computational and storage efficiency, as well as its efficacy in matching through Hamming distance [47], is employed due to its reliable accuracy and robustness.
The FREAK descriptor draws inspiration from the human retina, aiming to replicate retinal photoreceptors through pixels. To achieve this, the descriptor employs a configuration of partially overlapped receptive fields arranged in seven rings, each comprising six receptive fields. This arrangement facilitates the construction of the descriptor.
Each receptive field is filtered using a Gaussian kernel with a standard deviation of . Combining these filtered receptive fields with the central feature point position results in a total of 43 receptive fields forming the descriptor, which are distributed as shown in Figure 6. In this specific application, the distances from each of the 7 rings to the bifurcation point, arranged from the innermost to the outermost, are 4, 6, 8, 13, 18, 26, and 33 pixels, with their respective radii being 1, 2, 3, 4, 6, 9, 13, and 18 pixels. These measurements are instrumental in determining the spatial arrangement and relative positioning of the receptive fields concerning the bifurcation point within the descriptor’s construction.
In initiating the construction of a descriptor using FREAK, the initial step involves calculating the intensities of the receptive fields to ascertain the orientation, denoted as O, of the feature point. This orientation determination follows Equation (3):
where G is the set of all pairs used to compute the local gradient, which are show in Figure 7, M is the number of pairs in G, and is the smoothed intensity of the perceptive field .
To compose the binary descriptor of every bifurcation, each of the 43 perceptive fields undergoes comparison with the others, culminating in a comprehensive 903-bit descriptor. The determination of each bit’s value follows Equation (4):
where the intensities and correspond to the centers of the smoothed receptive fields within a pair. In prior research [14], it was noted that a 512-bit descriptor provided successful performance. Consequently, a selection process is implemented to identify the most significant pairs. This selection process involves learning, where the determination of the best pairs relies on their correlation, denoted as . For this particular application, a correlation threshold of was established.
Each feature point is paired with its corresponding nearest neighbor in the other image. In contrast to an alternative approach [9], this proposed method omits the utilization of cross-checking and the Second Nearest Neighbor (SNN) verification techniques. Although cross-checking offers benefits by reducing false positives and improving match reliability, it runs the risk of discarding potentially valid matches lacking mutual correspondence due to perspective differences, occlusion, or scene variations between fundus images. Similarly, while SNN might also result in the exclusion of valid matches, its efficacy relies on establishing a reliable threshold between the nearest and second nearest neighbor. Additionally, both these verification methods escalate the computational load of the feature matching process. Figure 8 illustrates on the top the resulting matches between two fundus images, demonstrating the application of the previously described considerations in the matching process.
3.4. Transformation Matrix Computation
The process of determining the geometric relationship between the images involves computing the transformation matrix. Initially, RANSAC discriminates between inliers and outliers to derive this transformation matrix. Traditionally, RANSAC randomly selects matches to compute a transformation and subsequently determines the number of inliers and outliers for that specific transformation. However, in this application, the random selection process is constrained, exclusively selecting pairs with a distance greater than a predefined threshold—empirically set to 20 pixels in this context. This restriction aims to mitigate the influence of localization error on registration error, as outlined in [9]. Figure 8 illustrates on the bottom the resulting inlier matches between the matches shown on the top, demonstrating the application of the previously described considerations in the RANSAC process for separating inliers from outliers.
Some applications may opt for complex transformation models; however, the selection of an optimal mapping primarily relies on the distinct pair of registered images [48]. Hence, considering the advantages associated with a similarity transformation—comprising computational simplicity and requiring minimal correspondences—this model becomes the choice for registering fundus image pairs. This preference proves especially advantageous when faced with challenges inherent in fundus images, such as obscured blood vessels due to disease progression, which restricts the availability of adequate correspondences.
In longitudinal studies and super-resolution imaging involving fundus images, the primary focus typically revolves around aligning images captured from similar or identical perspectives, resulting in significant overlap between the images being registered. Unlike the complexities encountered in fundus image mosaicking, where merging multiple images necessitates meticulous consideration of the retina’s curvature and intricate structures, longitudinal studies and super-resolution tasks experience a reduced impact of curvature during the registration process.
The substantial overlap inherent in these scenarios inherently mitigates the influence of the retina’s curvature on the alignment process. With a high degree of overlap, the areas of interest within the images display similar perspectives, minimizing the relevance of non-linear deformations caused by the retina’s curvature. Consequently, the necessity for complex transformation models that precisely address non-linear distortions diminishes in longitudinal studies and super-resolution imaging. Instead, the focus shifts towards optimizing computational efficiency, preserving structural integrity, and ensuring consistent and accurate alignment of overlapping regions. This emphasizes the requirement for robust and efficient registration methods over intricate transformation models catering to complex distortions. This adaptation simplifies the registration process, allowing for clearer interpretations and comparative analyses over time or across various image resolutions within these specific applications of fundus imaging.
3.5. Image Blending
When aligning fundus images to a unified coordinate system, the blending process aims to create a seamless image, eradicating visible image boundaries. Ideally, pixel intensities at corresponding locations across different fundus images should match precisely. However, practical scenarios deviate from this ideal state. Even after compensating for variations, certain issues persist, notably the visibility of several fundus image edges attributed to factors such as vignetting, misregistration, and radial distortion. In the realm of 2D image manipulation, the work of Burt and Adelson on multiband blending [49] stands as a proven and effective method for mosaic creation, notably mitigating blurring and ghosting artifacts.
This multiband blending method, often known as Laplacian pyramid blending, introduces a technique to seamlessly merge images using a pyramid-based approach. The methodology revolves around decomposing images into multiple levels or bands of varying spatial frequencies via a Laplacian pyramid. Initially, the original fundus images undergo transformation into Laplacian pyramids, comprising numerous layers that capture diverse scales of details, ranging from coarse to fine. The blending process entails combining corresponding layers from these Laplacian pyramids extracted from the fundus images to be merged. By weighting and merging these layers at each pyramid level, starting from the coarsest to the finest details, the method gradually reconstructs the merged image. This approach capitalizes on the frequency domain representation of images, facilitating a smooth transition of low-frequency components from one image into the high-frequency components of another, thereby achieving a seamless and artifact-free blend. Additionally, Laplacian pyramid blending effectively mitigates common artifacts like blurring or ghosting, prevalent in conventional blending methods, by retaining edge details and augmenting the visual quality of the resulting merged image. The results derived from the application of this method to registered fundus images are demonstrated in Section 4.5.
4. Experimental Results
In this section, an extensive evaluation of the proposed methodology is conducted through experimentation using a well-established public database. Initially, a detailed explanation behind the choice of the specific databases for segmentation and registration evaluation is provided. Subsequently, the evaluation criteria and metrics employed in the analysis of these two tasks are explicated. This is followed by a comprehensive quantitative analysis of the segmentation process, alongside a comparison between the proposed approach for fundus image registration and existing methodologies. Furthermore, notable instances showcasing successful outcomes achieved through the application of the proposed method are presented.
4.1. Datasets
The first task to be performed in the fundus registration process corresponds to segmentation of blood vessels from the fundus image. This is the core of feature extraction, and it is performed with the traditional U-Net architecture, which is trained with the FIVES dataset.
This dataset consists of 800 fundus images, each with a resolution of 2048×2048 and a field of view of 50°. Among these, 200 images are specifically designated for testing purposes. The images are sourced from 573 patients, ranging in age from 4 to 83 years, and encompass various retinal diseases, including Age-related Macular Degeneration (AMD), Diabetic Retinopathy (DR), and glaucoma, alongside images depicting healthy retinas. The dataset ensures an equal distribution of images across each disease category. Notably, the authors deliberately incorporated approximately 5% of images considered to have poor readability by experienced ophthalmic doctors, aiming to simulate real clinical scenarios. Table 1 provides a detailed overview of the FIVES dataset’s characteristics, alongside those of other datasets such as STARE, DRIVE, ARIA, and CHASEDB1, which were utilized for evaluating the segmentation in the registration method employed in this study. Additionally, Figure 9 showcases image examples from each category within the FIVES dataset, accompanied by their corresponding ground-truth blood vessel segmentation masks.
This analysis relies exclusively on the Fundus Image Registration (FIRE) dataset for assessment. The selection of this dataset is motivated by the limited availability of public databases explicitly tailored for fundus image registration. Presently, there exist only four databases containing images suitable for registration (e-ophtha [50], RODREP [51], VARIA [52], and FIRE [53]). Within these datasets, FIRE notably stands out as the sole repository offering ground truth for registration, featuring ten control points. This unique attribute enables quantitative evaluation of method performance and facilitates meaningful comparisons with prior research.
The FIRE dataset encompasses 129 fundus images, each at a resolution of 2912×2912 and a field of view spanning 45°, resulting in 134 image pairs. These images pertain to 39 patients, spanning an age range from 19 to 67 years, distributed across three distinct classes, each serving a specific registration purpose: category S for super resolution, category P for mosaicking, and category A for longitudinal studies. Particularly, category A contains registrable pairs reflecting anatomical changes like vessel tortuosity, microaneurysms, and cotton-wool spots. Table 2 offers an overview of the dataset’s characteristics, while Figure 10 visually represents the registrable image pairs, accompanied by their respective ground-truth control points, segregated by category.
4.2. Evaluation Metrics
The accuracy of the blood vessel segmentation process is assessed using the Intersection over Union (IoU) metric, also referred to as the Jaccard Index. This metric quantifies the degree of overlap between the predicted blood vessel mask and the ground truth mask, as outlined by Equation (5):
where ∩ represents the intersection operation, denoting the common region where the predicted blood vessels and ground truth masks overlap, while ∪ denotes the union operation, encompassing the entirety of both masks, including their overlapping and non-overlapping areas.
The IoU metric serves as a fundamental measure in evaluating the performance of blood vessel segmentation in fundus images, providing a precise quantitative assessment of their ability to accurately delineate blood vessel structures.
Regarding feature points extraction, an assessment is conducted to quantify the uniformity of their spatial distribution. This evaluation relies on entropy, a measure indicative of randomness or disorder within the distribution. The computation of entropy involves dividing the images into fixed-size bins and counting the points within each bin to derive a probability distribution. Subsequently, this distribution is utilized to calculate the Shannon entropy, represented by equation (6):
where H is the entropy and is the probability of finding a feature point in bin x. In this application, the bin size was set to . In the context of feature point distribution, higher entropy values denote a more uniform and evenly spread distribution, whereas reduced entropy values indicate a clustered or biased distribution.
Enhancing spatial coverage of feature points in fundus image registration offers several advantages. It makes the registration process more robust to deformations, rotations, scaling, or perspective alterations. Moreover, well-distributed feature points diminish ambiguity in the matching process and prove beneficial in scenarios where fundus image segments might be occluded or altered, such as the case of longitudinal studies. This dispersion of feature points ensures the availability of reference points for matching, even in affected or obscured areas of the image.
On the other hand, the fundus registration evaluation method follows the principles detailed in [17], utilizing strategically positioned control points marked by experts across overlapping fundus image pairs. Registration error is calculated as the mean distance between each control point in the target image and its corresponding point in the source image post-registration. This evaluation was performed across the entire dataset and separately for distinct categories.
To depict accuracy across various error thresholds, a 2D plot was constructed. The x-axis represents the error thresholds, while the y-axis depicts the percentage of image pairs successfully registered at each threshold. Successful registration is achieved when the error falls below the specified threshold. The resulting curve showcases the success rate concerning target accuracy, facilitating method comparison and aiding in the selection of the most suitable approach based on specific accuracy requirements. Furthermore, the curve provides a comprehensive assessment by evaluating the area under the curve (AUC).
4.3. Segmentation Performance
Accurate segmentation of blood vessels in fundus images holds paramount importance in facilitating precise image registration. In this subsection, an evaluation of the blood vessel segmentation performance attained through the proposed methodology is presented. Leveraging a robust segmentation framework, which incorporates U-Net architecture, this approach endeavors to delineate blood vessel structures. Through a thorough evaluation using various metrics, including visual assessments and numerical analyses, a detailed examination of the segmentation results is presented.
The U-Net model for blood vessel segmentation underwent multiple training iterations using different sets and variations. Initially, 1000 randomly selected patches from the green channel, untreated, were trained for 20 epochs, yielding an IoU of 0.5152. Given the low IoU, the training was extended to 30 epochs, raising the IoU to 0.5436, accompanied by loss and accuracy scores of 0.1078 and 0.9670, respectively, with similar validation results.
To enhance the segmentation quality, CLAHE was applied to the same 1000 patches, resulting in an average IoU of 0.6165 after 20 epochs. Subsequently, 2000 preprocessed patches, emphasizing bifurcation areas, were used, achieving an IoU of 0.7178 but displaying slightly reduced training and validation scores for loss and accuracy. This experiment showcased improved IoU by focusing on more extensive blood vessel areas during training. Figure 11 shows the accuracy and loss curves for this experiment, crucial metrics for evaluating the model’s performance. These curves illustrate the initial training phase before the fine-tuning phases.
Utilizing the weights from the most successful experiment, a fine-tuning stage commenced. The first fine-tuning involving 2000 bifurcation-focused patches with added Gamma correction and CLAHE enhanced the IoU to 0.7491 over 20 epochs, demonstrating better scores across all metrics. The second fine-tuning with a lowered learning rate and additional patches resulted in an IoU of 0.7559 after 5 epochs, maintaining competitive loss and accuracy values. This final fine-tuning, limited to 5 epochs, showed no significant increase in IoU beyond this point.
On the other hand, Figure 12 presents sample qualitative results of the segmentation stage, while Table 3 shows the results in terms of IoU for the different datasets that were employed for the evaluation of this segmentation network.
The performance disparity between the U-Net model trained on the FIVES dataset and its applicability to established fundus blood vessel segmentation datasets highlights the intricate challenges associated with model adaptability and generalization in medical image analysis. While the model demonstrates commendable performance within the controlled parameters of the FIVES dataset—characterized by unique imaging conditions and diverse pathology presentations—its translation to other datasets reveals multifaceted difficulties. Variations in dataset characteristics, encompassing differences in image quality, diverse pathologies, and demographic representations, present inherent challenges for seamless model generalization. Additionally, discrepancies or inconsistencies in annotation quality and precision across evaluation datasets pose significant obstacles, potentially impacting the model’s adaptability. This is highlighted in [16], where according to their standards, improper labeling from DRIVE dataset is shown. Furthermore, the U-Net model’s effectiveness within the FIVES dataset could result from a degree of overfitting, where it has carefully adapted to the specific unique features of that dataset during training, leading to reduced adaptability to the distinct characteristics presented by evaluation datasets. These challenges emphasize the urgent requirement for more comprehensive, diverse, and meticulously annotated datasets, representative of real-world variability, to promote the development of robust and adaptable segmentation models in fundus image analysis, mitigating issues related to dataset bias, annotation quality, domain shift, and overfitting.
Finally, quantitative evaluation of blood vessels segmentation within the FIRE dataset is not feasible due to the absence of ground truth data for vessel segmentation. However, Figure 13 showcases examples from each category of fundus images in the FIRE dataset, illustrating their respective segmentations generated using the proposed method.
4.4. Feature Extraction and Feature Description
The assessment of feature extraction involves analyzing the spatial distribution across fundus images, compared with methods like SIFT [18], Oriented FAST and Rotated BRIEF (ORB) [54] and SBP-FIR [9]. Table 4 delineates the average detection of feature points within the FIRE dataset’s fundus images for these methods and the proposed approach, alongside their corresponding mean entropy values.
From the findings in Table 4, it is evident that the proposed method achieves a balance in feature extraction. It consistently detects more features on average than SIFT but fewer than ORB, yet it achieves a superior distribution across fundus images. In the context of image registration, an abundance of feature points introduces drawbacks, including increased memory usage and increased processing time due to the necessity of describing and matching more features, thus elevating computational complexity. Conversely, a scarcity of feature points limits method coverage and robustness, potentially compromising the capture of sufficient information to endure deformations or viewpoint changes. Moreover, a reduced number of feature points could amplify the impact of even a small number of incorrect correspondences on alignment accuracy. Therefore, the objective in registering fundus images is to achieve a balance, as demonstrated when comparing this method with other state-of-the-art approaches like SIFT and ORB. An example of feature extraction for each of the methods from Table 4 is shown in Figure 14.
Finally, the FREAK feature description method illustrates the least correlated receptive fields, a crucial aspect in reducing the descriptor to 512 bits. Figure 15 showcases the paired receptive fields utilized in forming the descriptor across at least 50% of the fundus image pairs in the FIRE dataset.
The observation from Figure 15 reveals a distinct vertical pattern in the pairs utilized to form the descriptor. This trend emerges from the rotational adjustment during the angle computation of the points, demonstrating the FREAK descriptor’s ability to remain invariant despite rotations in the pattern.
4.5. Registration Performance on the FIRE Dataset
This section explores the critical assessment of registration accuracy, a fundamental criterion in evaluating the efficacy of the proposed fundus image registration methodology. The registration error, a crucial metric reflecting the alignment quality between registered images, serves as a key indicator of the method’s precision and reliability. This comprehensive analysis examines the registration success across various thresholds, revealing the method’s robustness under different alignment conditions and delineations. Complemented by visual representations showcasing registered images from distinct categories within the FIRE dataset, this section presents an evaluation offering insights into the method’s performance across a spectrum of alignment scenarios.
Figure 16 showcases the performance of different registration methods on the FIRE dataset, analyzing accuracy individually for each category and overall. Additionally, Table 5 provides the area under the curve (AUC) for all the compared methods, as well as information concerning execution time and the transformation model employed in each approach.
Yang et al., as detailed in [56], developed a method targeting the registration of diverse scenes, spanning natural landscapes, constructed environments, and medical imagery, including fundus images. Their approach utilizes feature points like corners and face points. Notably, depending on the specific image pairing under consideration, they leverage various transformation models, including similarity, affine, homography, and quadratic models.
In a similar way, the work by Chen et al. [55] involves the utilization of corners identified through a Harris detector as feature points for registration. Their methodology adapts different models based on the number of matches derived from the feature extraction, description, and matching processes, while their descriptor relies on gradients, emphasizing the primary orientation of the points.
Other comparative studies, such as [57], draw inspiration from [56], refining the generation of keypoint matches during initialization. This modification involves extracting Lowe keypoints from the gradient magnitude image and augmenting the keypoint descriptor by incorporating global-shape context through edge points. The aim is to address a limitation in [56], where its performance encounters difficulties when handling image pairs exhibiting significant non-linear intensity differences.
In [59], a novel approach for fundus image registration is introduced, focusing on a new structural feature. Unlike conventional methods relying on single bifurcation point angles, this method adopts a structure-matching technique. It utilizes a master bifurcation point and its three connected neighbors to form a distinctive vector, comprising normalized branching angle and length. This vector remains consistent against common transformations, reducing ambiguity in matching and aiding in addressing ill-posed matching scenarios. Its simplicity and effectiveness allow for standalone use or integration with other methods, offering flexibility in hybrid or hierarchical schemes.
Figure 16 highlights notable disparities in outcomes across distinct categories. Categories S and A, characterized by larger overlapping regions, naturally yield a higher volume of correspondences, leading to enhanced matching performance. Conversely, category P poses challenges due to limited potential matches confined to the overlapping area between fundus images. Similarly, category A experiences potential match reductions owing to inherent morphological changes observed in longitudinal studies.
Within category S, the GDB-ICP method showcases exceptional performance, with numerous successful registrations and minimal registration errors. However, it achieves successful registration for only 84.5% of the category. In contrast, the proposed method, alongside Harris-PIIFD and REMPE, achieves a 100% success rate, demonstrating a higher tolerance for registration errors.
For category A, REMPE emerges as the leader, boasting a success rate of 92.85%. It’s followed by Harris-PIIFD and the proposed method, achieving 78.57% and 71.42%, respectively. However, the proposed method outperforms both alternatives in lower threshold scenarios.
Moving to category P, REMPE surpasses other methods, except for GDB-ICP, which outperforms REMPE in registration error thresholds less than 10 pixels. In this context, the proposed method registers a 51.02% success rate in category P, while GDB-ICP and REMPE achieve 34.69% and 95.91%, respectively.
Table 5 offers a comprehensive analysis of the registration performance of these methods, encompassing the AUC metrics along with insights into the transformation model and execution time. Notably, the REMPE model, despite its high success rate in registering fundus images, demonstrates significantly slower execution times compared to the other approaches presented. Our proposed method, while maintaining competitive performance with REMPE across certain categories, manages to significantly reduce the execution time by over 50%, enhancing efficiency without compromising efficacy. Figure 17 presents sample outcomes for each category within the FIRE dataset, displaying accurate matches and the outcomes post-registration.
5. Discussion
This study focused on developing a novel fundus image registration method utilizing bifurcations as feature points while employing a deep learning-based blood vessels segmentation approach. The primary aim was to establish a geometric relationship between fundus images by extracting features, facilitating their alignment. Additionally, the utility of FREAK as a keypoint descriptor within the registration process was explored.
The findings from this investigation revealed several insights. Notably, the binary descriptor FREAK demonstrated remarkable effectiveness in fundus images, despite their inherent limitations in texture. Furthermore, the study highlighted a direct correlation between the quality of blood vessel segmentation, achieved through U-Net, and the resulting accuracy in registration. Enhanced segmentation directly contributed to superior registration accuracy, as evidenced by a qualitative comparison of previous approaches [9,10].
This aligns with existing literature by showcasing that bifurcations obtained from blood vessel segmentation using a similarity transformation can compete favorably with methods employing more intricate feature extraction and models. These findings suggest that even simpler methods can yield competitive results in fundus image registration.
The practical implications of this research are substantial. The marked reduction in the execution time of the fundus image registration task brings it significantly closer to integration into clinical practice. Moreover, the comprehensive evaluation performed in this study provides a robust benchmark for future methodologies, aiding in determining their suitability for clinical adoption.
However, a notable limitation of this study is the utilization of different datasets for blood vessel segmentation and subsequent registration evaluation. This limitation challenges establishing a direct causal link between improved segmentation and subsequent registration accuracy. Future research endeavors should prioritize the production and utilization of datasets encompassing both blood vessel segmentation ground truth and control points for more cohesive and integrated evaluations.
In terms of future directions, exploring the feasibility of automatically selecting transformation models based on the characteristics of fundus images emerges as a promising avenue. As the optimal transformation model may vary across different fundus image types, developing adaptive models could significantly enhance registration accuracy across diverse fundus images.
In conclusion, this study emphasizes the potential of simplified methods for effective fundus image registration and reveals paths for future investigations aimed at refining registration techniques for practical clinical application.
6. Conclusions and Future Work
This study unravels the potential of simplified yet robust fundus image registration techniques, leveraging bifurcations derived from blood vessel segmentation. The noteworthy achievement in reducing execution time marks a significant stride towards the practical integration of these methodologies into clinical workflows. Despite these advancements, the study confronts a critical limitation rooted in the utilization of disparate datasets for segmentation and registration evaluation. This juxtaposition hinders a complete demonstration of the causal link between improved segmentation and registration accuracy. To address this, future investigations demand the creation of unified datasets encompassing both ground truth segmentation and registration control points, enabling a more comprehensive validation of these methodologies.
The future trajectory of research in this domain necessitates a dual focus. Firstly, refining registration algorithms to strike an optimal balance between reduced execution times and sustained accuracy is paramount. This endeavor would propel the seamless adoption of these methodologies in clinical practice. Secondly, the quest for defining precise accuracy benchmarks emerges as a pivotal undertaking. Establishing these benchmarks is not only crucial for the validation but also for the subsequent integration of these methodologies into clinical workflows. The absence of defined accuracy standards poses a significant challenge in determining the readiness of these methods for real-world clinical applications. Hence, future research must emphasize the delineation of these accuracy benchmarks to streamline the validation and adoption of these techniques in clinical practice.
References
- Li, T., Bo, W., Hu, C., Kang, H., Liu, H., Wang, K., & Fu, H. (2021). Applications of deep learning in fundus images: A review. Medical Image Analysis, 69, 101971. [CrossRef]
- Ramli, R., Hasikin, K., Idris, M. Y. I., A. Karim, N. K., & Wahab, A. W. A. (2021). Fundus image registration technique based on local feature of retinal vessels. Applied Sciences, 11(23), 11201. [CrossRef]
- Ramli, R., Idris, M. Y. I., Hasikin, K., A Karim, N. K., Abdul Wahab, A. W., Ahmedy, I.,... & Arof, H. (2017). Feature-based retinal image registration using D-Saddle feature. Journal of healthcare engineering, 2017.
- Saha, S., Rahaman, G. A., Islam, T., Akter, M., Frost, S., & Kanagasingam, Y. (2021). Retinal image registration using log-polar transform and robust description of bifurcation points. Biomedical Signal Processing and Control, 66, 102424.
- Akram, M. U., Usmani, D., Ahmad, T., Abbas, S., & Noor, S. F. (2015, April). Seamless fundus image stitching using wld to improve field of view. In 2015 Fifth International Conference on Digital Information and Communication Technology and its Applications (DICTAP) (pp. 106-110). IEEE.
- Lucente, A., Taloni, A., Scorcia, V., & Giannaccare, G. (2023). Widefield and Ultra-Widefield Retinal Imaging: A Geometrical Analysis. Life, 13(1), 202.
- Toslak, D., Thapa, D., Chen, Y., Erol, M. K., Chan, R. P., & Yao, X. (2016). Trans-palpebral illumination: an approach for wide-angle fundus photography without the need for pupil dilation. Optics letters, 41(12), 2688-2691.
- Das, V., Dandapat, S., & Bora, P. K. (2019). A novel diagnostic information based framework for super-resolution of retinal fundus images. Computerized Medical Imaging and Graphics, 72, 22-33.
- Ochoa-Astorga, J. E., Wang, L., Du, W., & Peng, Y. (2023). A Straightforward Bifurcation Pattern-Based Fundus Image Registration Method. Sensors, 23(18), 7809.
- Astorga, J. E. O., Du, W., Peng, Y., & Wang, L. (2023, June). Fundus Image Registration with Binary Morphology Extraction of Feature Points. In 2023 Sixth International Symposium on Computer, Consumer and Control (IS3C) (pp. 182-185). IEEE.
- Frangi, A. F., Niessen, W. J., Vincken, K. L., & Viergever, M. A. (1998). Multiscale vessel enhancement filtering. In Medical Image Computing and Computer-Assisted Intervention—MICCAI’98: First International Conference Cambridge, MA, USA, –13, 1998 Proceedings 1 (pp. 130-137). Springer Berlin Heidelberg. 11 October.
- Ronneberger, O., Fischer, P., & Brox, T. (2015). U-net: Convolutional networks for biomedical image segmentation. In Medical Image Computing and Computer-Assisted Intervention–MICCAI 2015: 18th International Conference, Munich, Germany, October 5-9, 2015, Proceedings, Part III 18 (pp. 234-241). Springer International Publishing.
- Zai, S., & Abbas, A. (2018, July). An effective enhancement and segmentation of coronary arteries in 2d angiograms. In 2018 International Conference on Smart Computing and Electronic Enterprise (ICSCEE) (pp. 1-4). IEEE.
- Alahi, A., Ortiz, R., & Vandergheynst, P. (2012, June). Freak: Fast retina keypoint. In 2012 IEEE conference on computer vision and pattern recognition (pp. 510-517). Ieee.
- Fischler, M. A., & Bolles, R. C. (1981). Random sample consensus: a paradigm for model fitting with applications to image analysis and automated cartography. Communications of the ACM, 24(6), 381-395.
- Jin, K., Huang, X., Zhou, J., Li, Y., Yan, Y., Sun, Y.,... & Ye, J. (2022). Fives: A fundus image dataset for artificial Intelligence based vessel segmentation. Scientific Data, 9(1), 475. [CrossRef]
- Hernandez-Matas, C., Zabulis, X., Triantafyllou, A., Anyfanti, P., Douma, S., & Argyros, A. A. (2017). FIRE: fundus image registration dataset. Modeling and Artificial Intelligence in Ophthalmology, 1(4), 16-28.
- Lowe, D. G. (1999, September). Object recognition from local scale-invariant features. In Proceedings of the seventh IEEE international conference on computer vision (Vol. 2, pp. 1150-1157). Ieee.
- Jalili, J. , Hejazi, S. M., Riazi-Esfahani, M., Eliasi, A., Ebrahimi, M., Seydi, M.,... & Ahmadian, A. (2020). Retinal image mosaicking using scale-invariant feature transformation feature descriptors and Voronoi diagram. Journal of Medical Imaging, 7(4), 044001-044001.
- Hernandez-Matas, C., Zabulis, X., & Argyros, A. A. (2020). REMPE: Registration of retinal images through eye modelling and pose estimation. IEEE journal of biomedical and health informatics, 24(12), 3362-3373.
- Gong, C., Brunton, S. L., Schowengerdt, B. T., & Seibel, E. J. (2021). Intensity-mosaic: automatic panorama mosaicking of disordered images with insufficient features. Journal of Medical Imaging, 8(5), 054002-054002.
- Rivas-Villar, D., Hervella, Á. S., Rouco, J., & Novo, J. (2022). Color fundus image registration using a learning-based domain-specific landmark detection methodology. Computers in Biology and Medicine, 140, 105101.
- Wang, Y., Zhang, J., An, C., Cavichini, M., Jhingan, M., Amador-Patarroyo, M. J.,... & Nguyen, T. Q. (2020, May). A segmentation based robust deep learning framework for multimodal retinal image registration. In ICASSP 2020-2020 IEEE International Conference on Acoustics, Speech and Signal Processing (ICASSP) (pp. 1369-1373). IEEE.
- Zana, F., & Klein, J. C. (2001). Segmentation of vessel-like patterns using mathematical morphology and curvature evaluation. IEEE transactions on image processing, 10(7), 1010-1019.
- Zana, F., & Klein, J. C. (1999). A multimodal registration algorithm of eye fundus images using vessels detection and Hough transform. IEEE transactions on Medical Imaging, 18(5), 419-428. [CrossRef]
- Feng, X., Cai, G., Gou, X., Yun, Z., Wang, W., & Yang, W. (2020). Retinal mosaicking with vascular bifurcations detected on vessel mask by a convolutional network. Journal of Healthcare Engineering, 2020.
- Pratt, H., Williams, B. M., Ku, J. Y., Vas, C., McCann, E., Al-Bander, B., ... & Zheng, Y. (2017). Automatic detection and distinction of retinal vessel bifurcations and crossings in colour fundus photography. Journal of Imaging, 4(1), 4.
- Chaichana, T., Sun, Z., Barrett-Baxendale, M., & Nagar, A. (2017). Automatic location of blood vessel bifurcations in digital eye fundus images. In Proceedings of Sixth International Conference on Soft Computing for Problem Solving: SocProS 2016, Volume 2 (pp. 332-342). Springer Singapore.
- Patwari, M. B., Manza, R. R., Rajput, Y. M., Deshpande, N. K., & Saswade, M. (2013). Extraction of the retinal blood vessels and detection of the bifurcation points. International Journal of Computer Applications, 77(2), 29-34.
- Patwari, M. B. , Manza, R. R., Rajput, Y. M., Saswade, M., & Deshpande, N. (2014, March). Personal identification algorithm based on retinal blood vessels bifurcation. In 2014 international conference on intelligent Computing Applications (pp. 203-207). IEEE.
- Sutanty, E. , Rahayu, D. A., Susetianingtias, D. T., & Madenda, S. (2017, October). Retinal blood vessel segmentation and bifurcation detection using combined filters. In 2017 3rd International Conference on Science in Information Technology (ICSITech) (pp. 563-567). IEEE.
- Dharmawan, D. A., Li, D., Ng, B. P., & Rahardja, S. (2019). A new hybrid algorithm for retinal vessels segmentation on fundus images. IEEE Access, 7, 41885-41896.
- J. Staal, M. D. J. Staal, M. D. Abramoff, M. Niemeijer, M. A. Viergever, and B. V. Ginneken, ‘‘Ridge based vessel segmentation in color images of the retina,’’ IEEE Trans. Med. Imag., vol. 23, no. 4, pp. 501–509, Apr. 2004. [Online]. Available: http://www.isi.uu.nl/Research/Publications/publicationview.php?
- A. D. Hoover, V. A. D. Hoover, V. Kouznetsova, and M. Goldbaum, ‘‘Locating blood vessels in retinal images by piecewise threshold probing of a matched filter response,’’ IEEE Trans. Med. Imag., vol. 19, no. 3, pp. 203–210, Mar. 2000.
- J. Odstrcilik et al., ‘‘Retinal vessel segmentation by improved matched filtering: Evaluation on a new high-resolution fundus image database,’’ IET Image Process., vol. 7, no. 4, pp. 373–383, Jun. 2013. [Online]. Available: http://digital-library.theiet.org/content/journals/10.1049/iet-ipr.2012. 0455.
- Tang, Y., Rui, Z., Yan, C., Li, J., & Hu, J. (2020). ResWnet for retinal small vessel segmentation. IEEE Access, 8, 198265-198274.
- Guo, C. , Szemenyei, M., Yi, Y., Xue, Y., Zhou, W., & Li, Y. (2020, May). Dense residual network for retinal vessel segmentation. In ICASSP 2020-2020 IEEE International Conference on Acoustics, Speech and Signal Processing (ICASSP) (pp. 1374-1378). IEEE.
- Liu, X. , Song, L., Liu, S., & Zhang, Y. (2021). A review of deep-learning-based medical image segmentation methods. Sustainability, 13(3), 1224.
- Divyashree, N. , & Pushpalatha, K. N. (2020). A Review on Gradient Histograms for Texture Enhancement and Object Detection.
- You, X., Fang, B., He, Z., & Tang, Y. Y. (2005). A global-to-local matching strategy for registering retinal fundus images. In Pattern Recognition and Image Analysis: Second Iberian Conference, IbPRIA 2005, Estoril, Portugal, June 7-9, 2005, Proceedings, Part I 2 (pp. 259-267). Springer Berlin Heidelberg.
- Astorga, J. E. O., Wang, L., Yamada, S., Fujiwara, Y., Du, W., & Peng, Y. (2023). Automatic Detection of Microaneurysms in Fundus Images. International Journal of Software Innovation (IJSI), 11(1), 1-14.
- Zuiderveld, K. (1994). Contrast limited adaptive histogram equalization. Graphics gems, 474-485.
- Wang, C., Zhao, Z., Ren, Q., Xu, Y., & Yu, Y. (2019). Dense U-net based on patch-based learning for retinal vessel segmentation. Entropy, 21(2), 168.
- Hu, K., Zhang, Z., Niu, X., Zhang, Y., Cao, C., Xiao, F., & Gao, X. (2018). Retinal vessel segmentation of color fundus images using multiscale convolutional neural network with an improved cross-entropy loss function. Neurocomputing, 309, 179-191.
- Liu, X., Song, L., Liu, S., & Zhang, Y. (2021). A review of deep-learning-based medical image segmentation methods. Sustainability, 13(3), 1224.
- Zhang, T. Y., & Suen, C. Y. (1984). A fast parallel algorithm for thinning digital patterns. Communications of the ACM, 27(3), 236-239.
- Krig, S., & Krig, S. (2016). Interest point detector and feature descriptor survey. Computer Vision Metrics: Textbook Edition, 187-246.
- Motta, D., Casaca, W., & Paiva, A. (2018, June). Fundus image transformation revisited: Towards determining more accurate registrations. In 2018 IEEE 31st International Symposium on Computer-Based Medical Systems (CBMS) (pp. 227-232). IEEE.
- Burt, P. J., & Adelson, E. H. (1983). A multiresolution spline with application to image mosaics. ACM Transactions on Graphics (TOG), 2(4), 217-236.
- e-ophtha: A Color Fundus Image Database. Available online: https://www.adcis.net/en/Download-Third-Party/E-Ophtha.html (accessed on 28 December 2023).
- RODREP: Rotterdam Ophthalmic Data Repository Longitudinal Diabetic Retinopathy Screening Data. Available online: http://www.rodrep.com/longitudinal-diabetic-retinopathy-screening—description.html (accessed on 28 December 2023).
- VARIA. Available online: http://www.varpa.es/research/biometrics.html (accessed on 28 December 2023).
- FIRE: Fundus Image Registration Dataset. Available online: https://projects.ics.forth.gr/cvrl/fire/ (accessed on 28 December 2023).
- Rublee, E., Rabaud, V., Konolige, K., & Bradski, G. (2011, November). ORB: An efficient alternative to SIFT or SURF. In 2011 International conference on computer vision (pp. 2564-2571). Ieee.
- Chen, J., Tian, J., Lee, N., Zheng, J., Smith, R. T., & Laine, A. F. (2010). A partial intensity invariant feature descriptor for multimodal retinal image registration. IEEE Transactions on Biomedical Engineering, 57(7), 1707-1718. 7.
- Yang, G., Stewart, C. V., Sofka, M., & Tsai, C. L. (2007). Registration of challenging image pairs: Initialization, estimation, and decision. IEEE transactions on pattern analysis and machine intelligence, 29(11), 1973-1989.
- Tsai, C. L., Li, C. Y., Yang, G., & Lin, K. S. (2009). The edge-driven dual-bootstrap iterative closest point algorithm for registration of multimodal fluorescein angiogram sequence. IEEE transactions on medical imaging, 29(3), 636-649.
- Bay, H., Ess, A., Tuytelaars, T., & Van Gool, L. (2008). Speeded-up robust features (SURF). Computer vision and image understanding, 110(3), 346-359.
- Chen, L., Xiang, Y., Chen, Y., & Zhang, X. (2011, September). Retinal image registration using bifurcation structures. In 2011 18th IEEE International Conference on Image Processing (pp. 2169-2172). IEEE.
- Braun, D., Yang, S., Martel, J. N., Riviere, C. N., & Becker, B. C. (2018). EyeSLAM: Real-time simultaneous localization and mapping of retinal vessels during intraocular microsurgery. The International Journal of Medical Robotics and Computer Assisted Surgery, 14(1), e1848.
- Serradell, E., Pinheiro, M. A., Sznitman, R., Kybic, J., Moreno-Noguer, F., & Fua, P. (2014). Non-rigid graph registration using active testing search. IEEE Transactions on Pattern Analysis and Machine Intelligence, 37(3), 625-638.
Figure 1.
The flowchart illustrating the proposed method delineates sequential stages for processing both source and target images. Each step is accompanied by paired images, with stages shadowed in the background indicating steps applied individually to images.
Figure 1.
The flowchart illustrating the proposed method delineates sequential stages for processing both source and target images. Each step is accompanied by paired images, with stages shadowed in the background indicating steps applied individually to images.
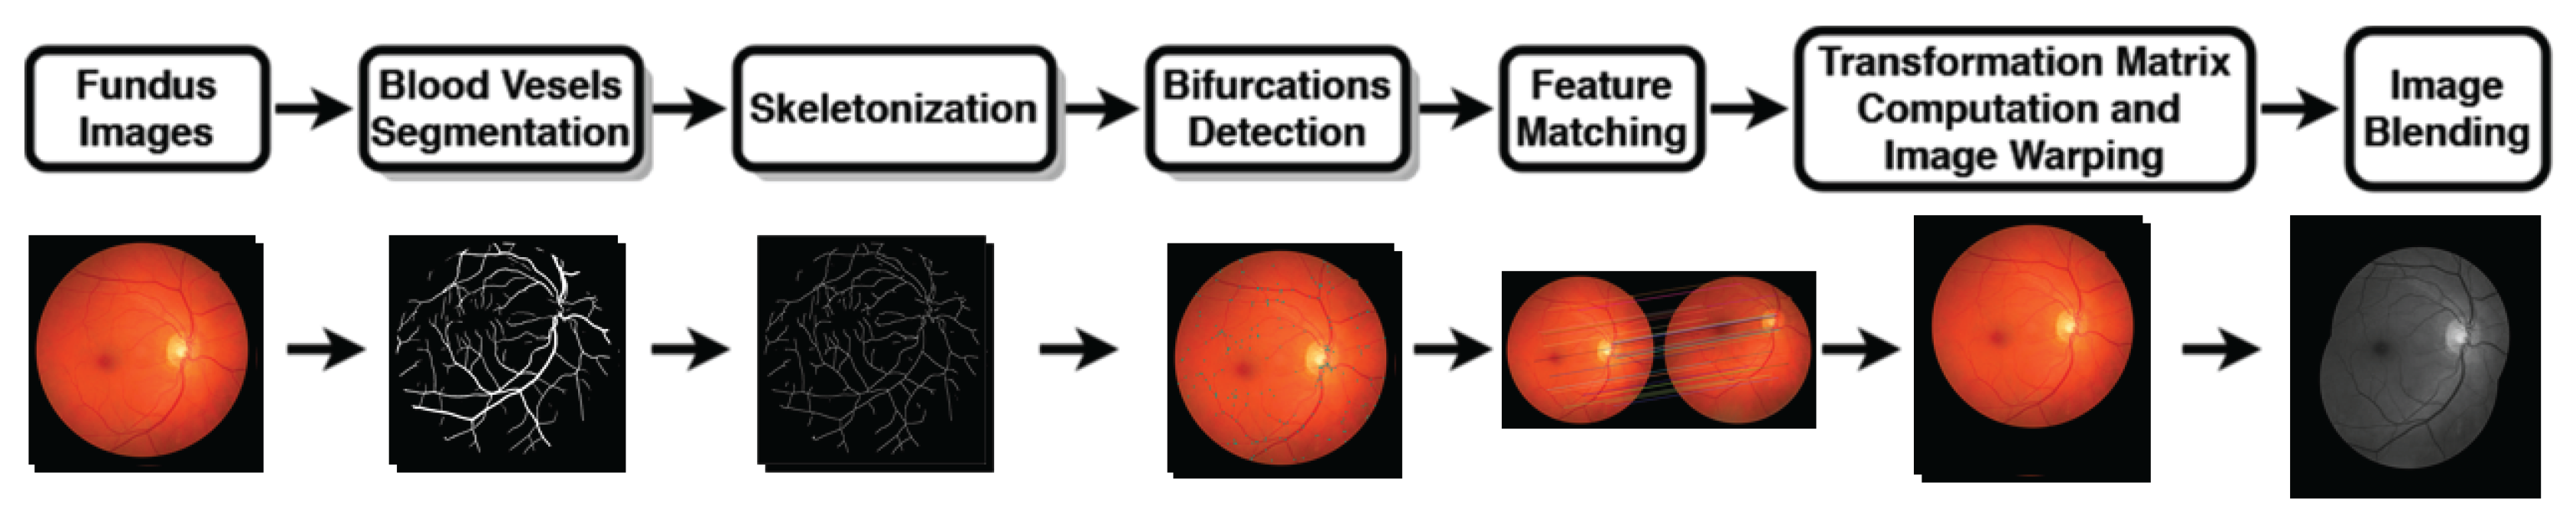
Figure 2.
Preprocessing steps preceding blood vessel segmentation within the fundus image.
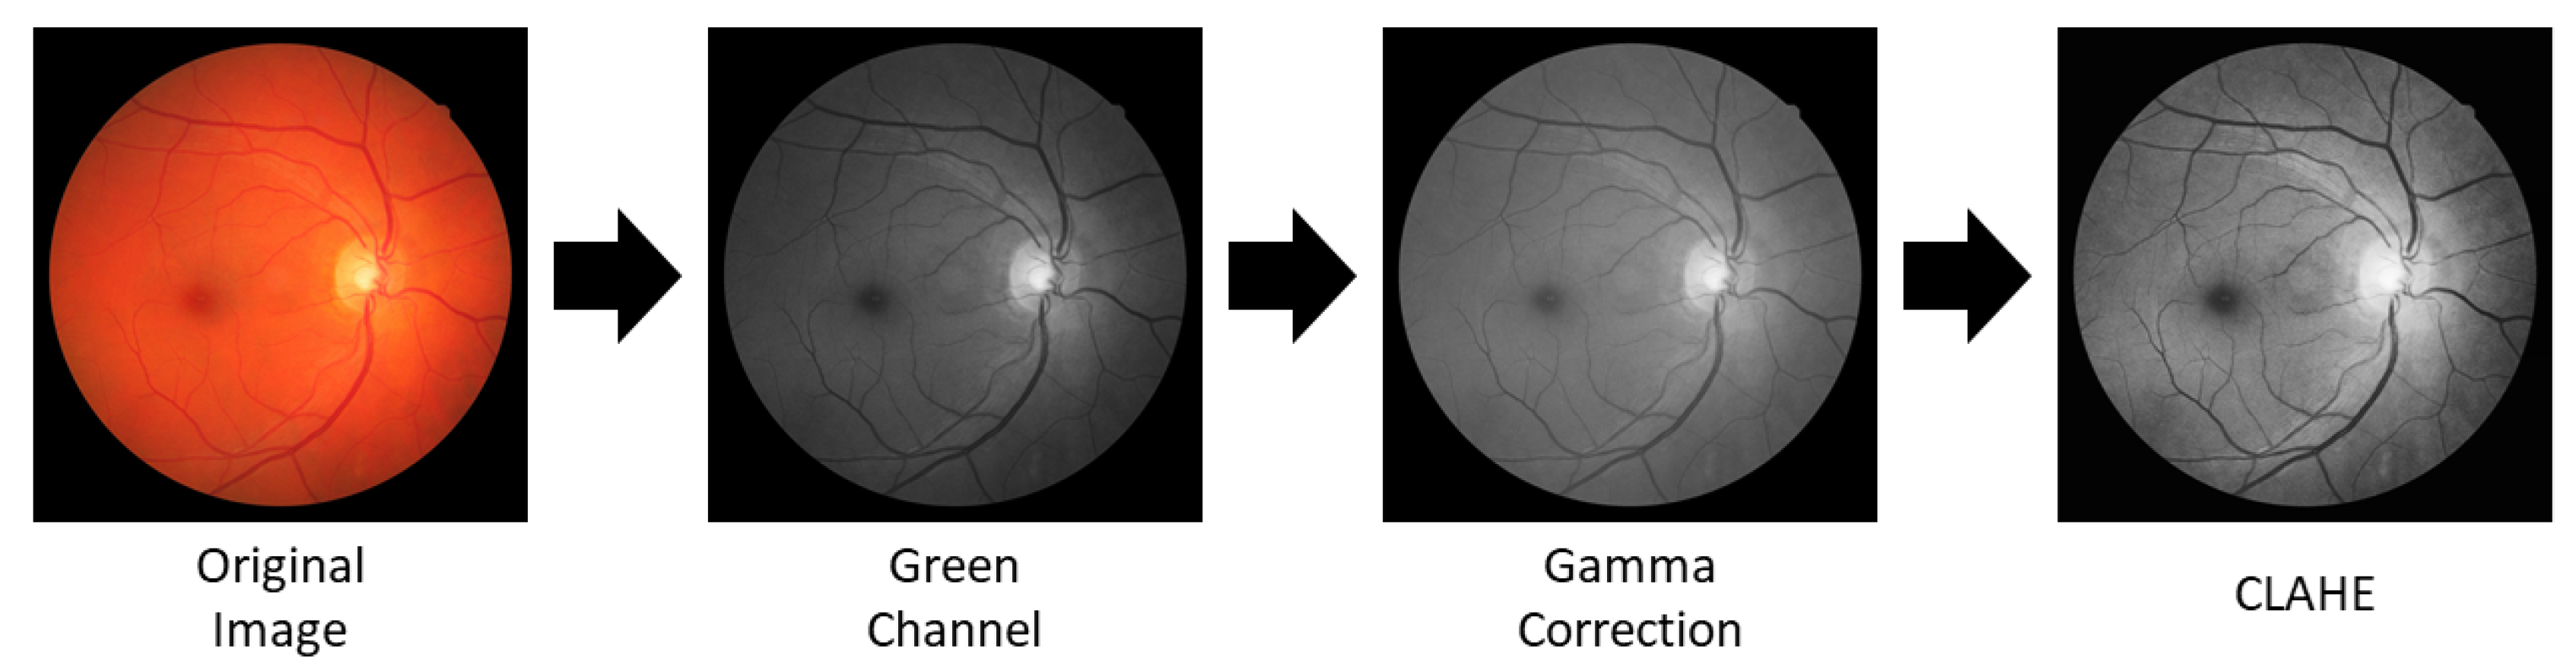
Figure 3.
(On the left side) Depicted are the original fundus images and the patches extracted after preprocessing. (On the right side) Presented are the predictions of the preprocessed patches and the final fundus image segmentation with composite result derived from integrating all the segmented patches.
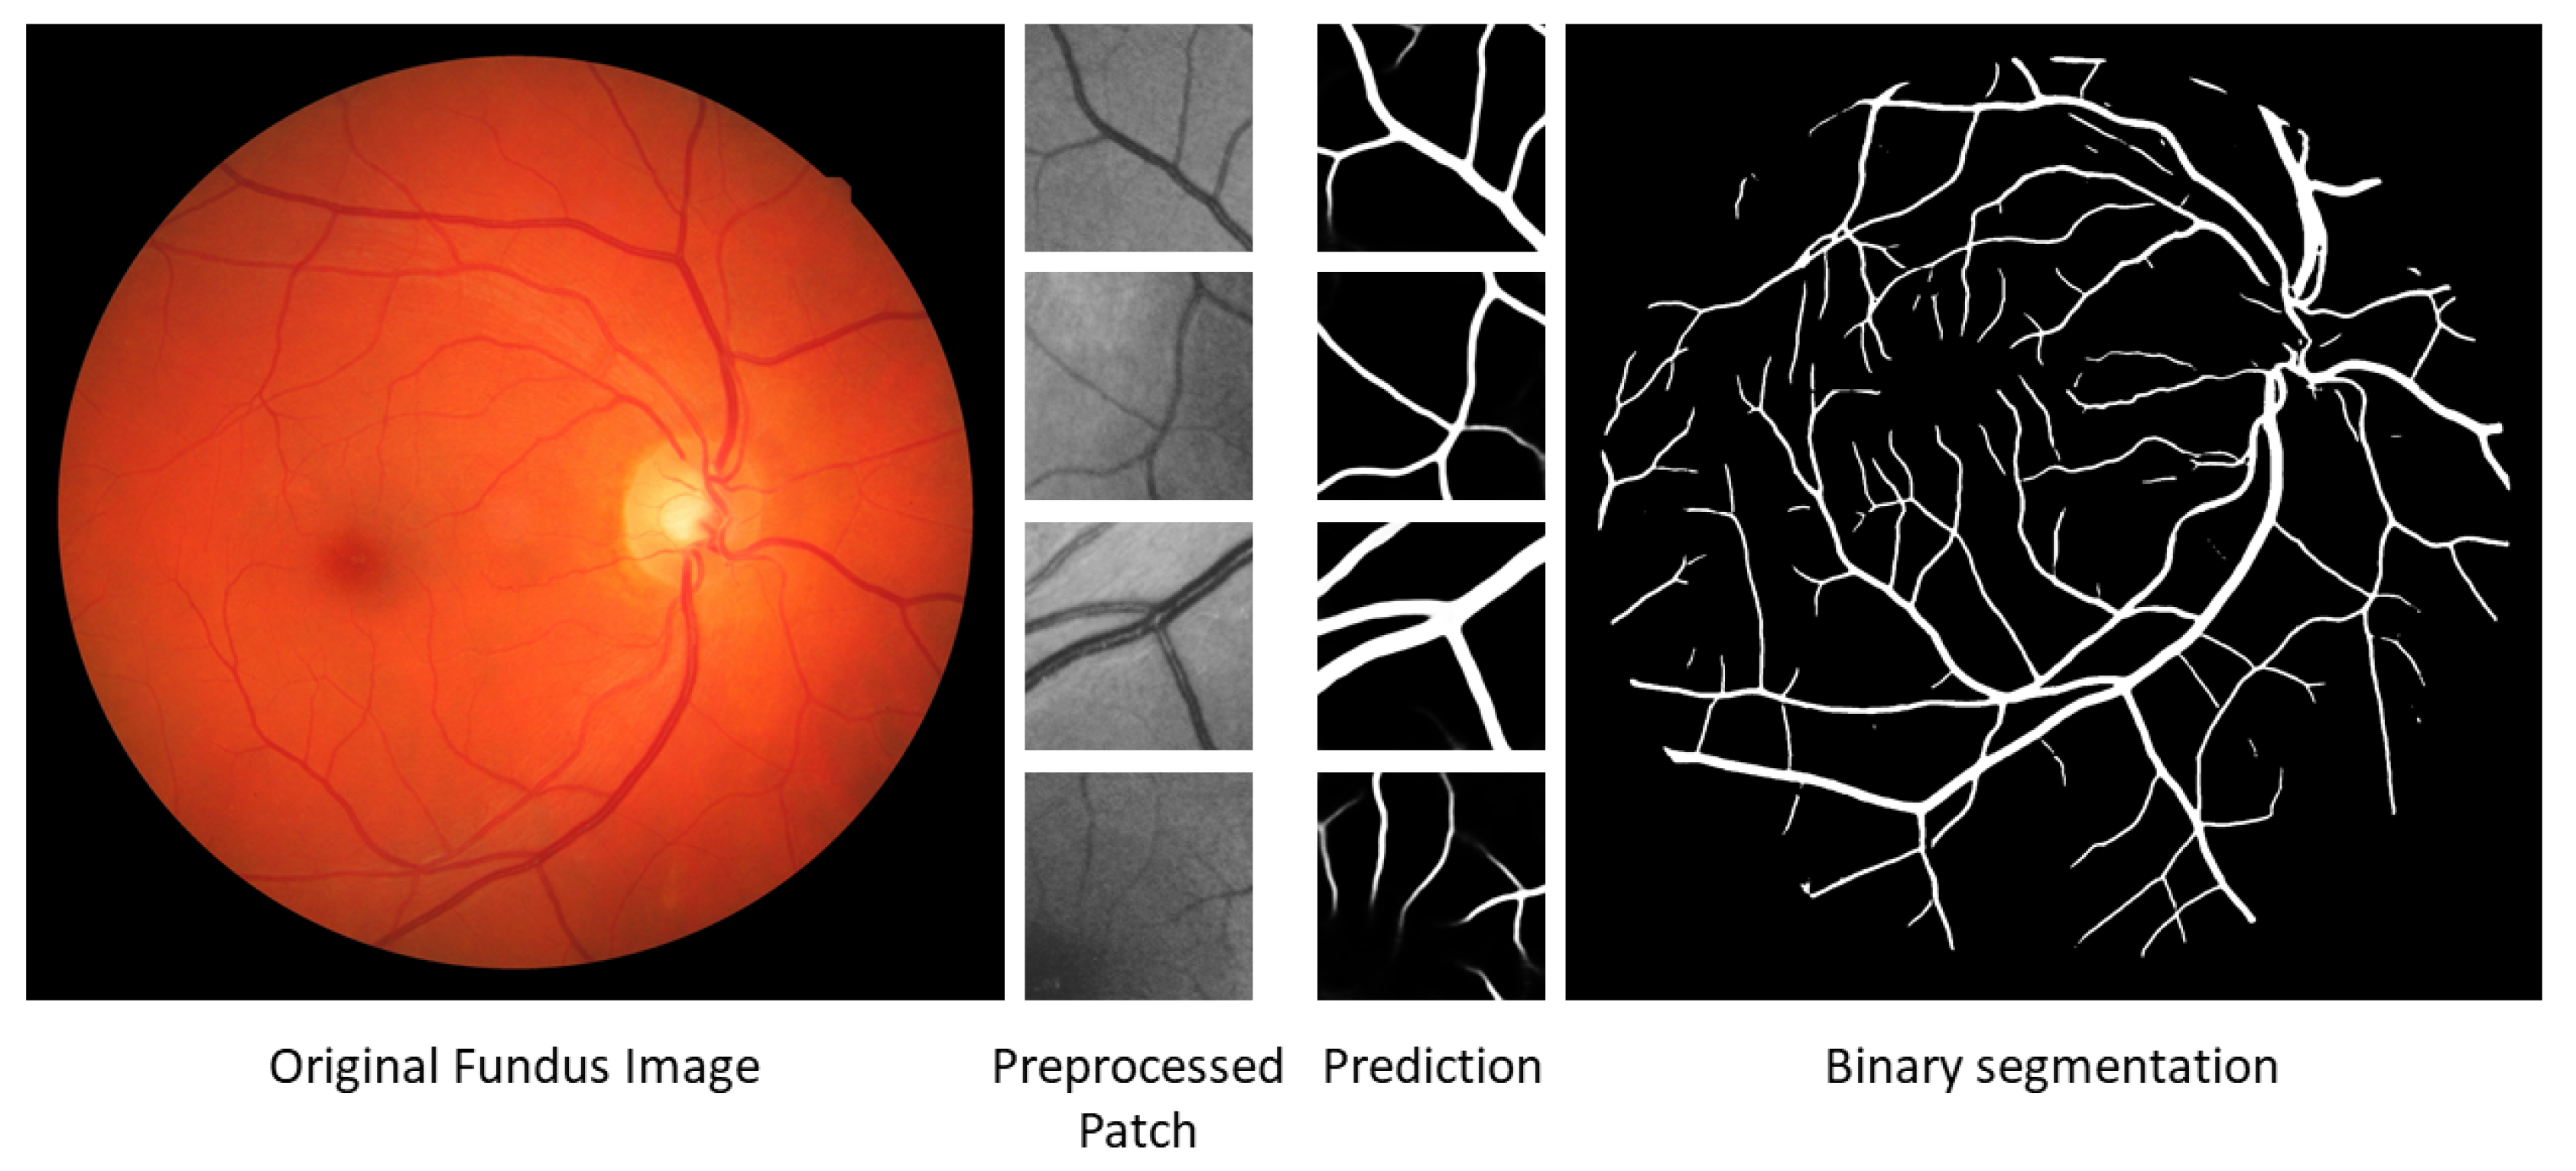
Figure 4.
Segmentation mask illustrating blood vessels within a fundus image alongside the outcome post-application of the thinning algorithm to derive the vessel segmentation skeleton.
Figure 4.
Segmentation mask illustrating blood vessels within a fundus image alongside the outcome post-application of the thinning algorithm to derive the vessel segmentation skeleton.
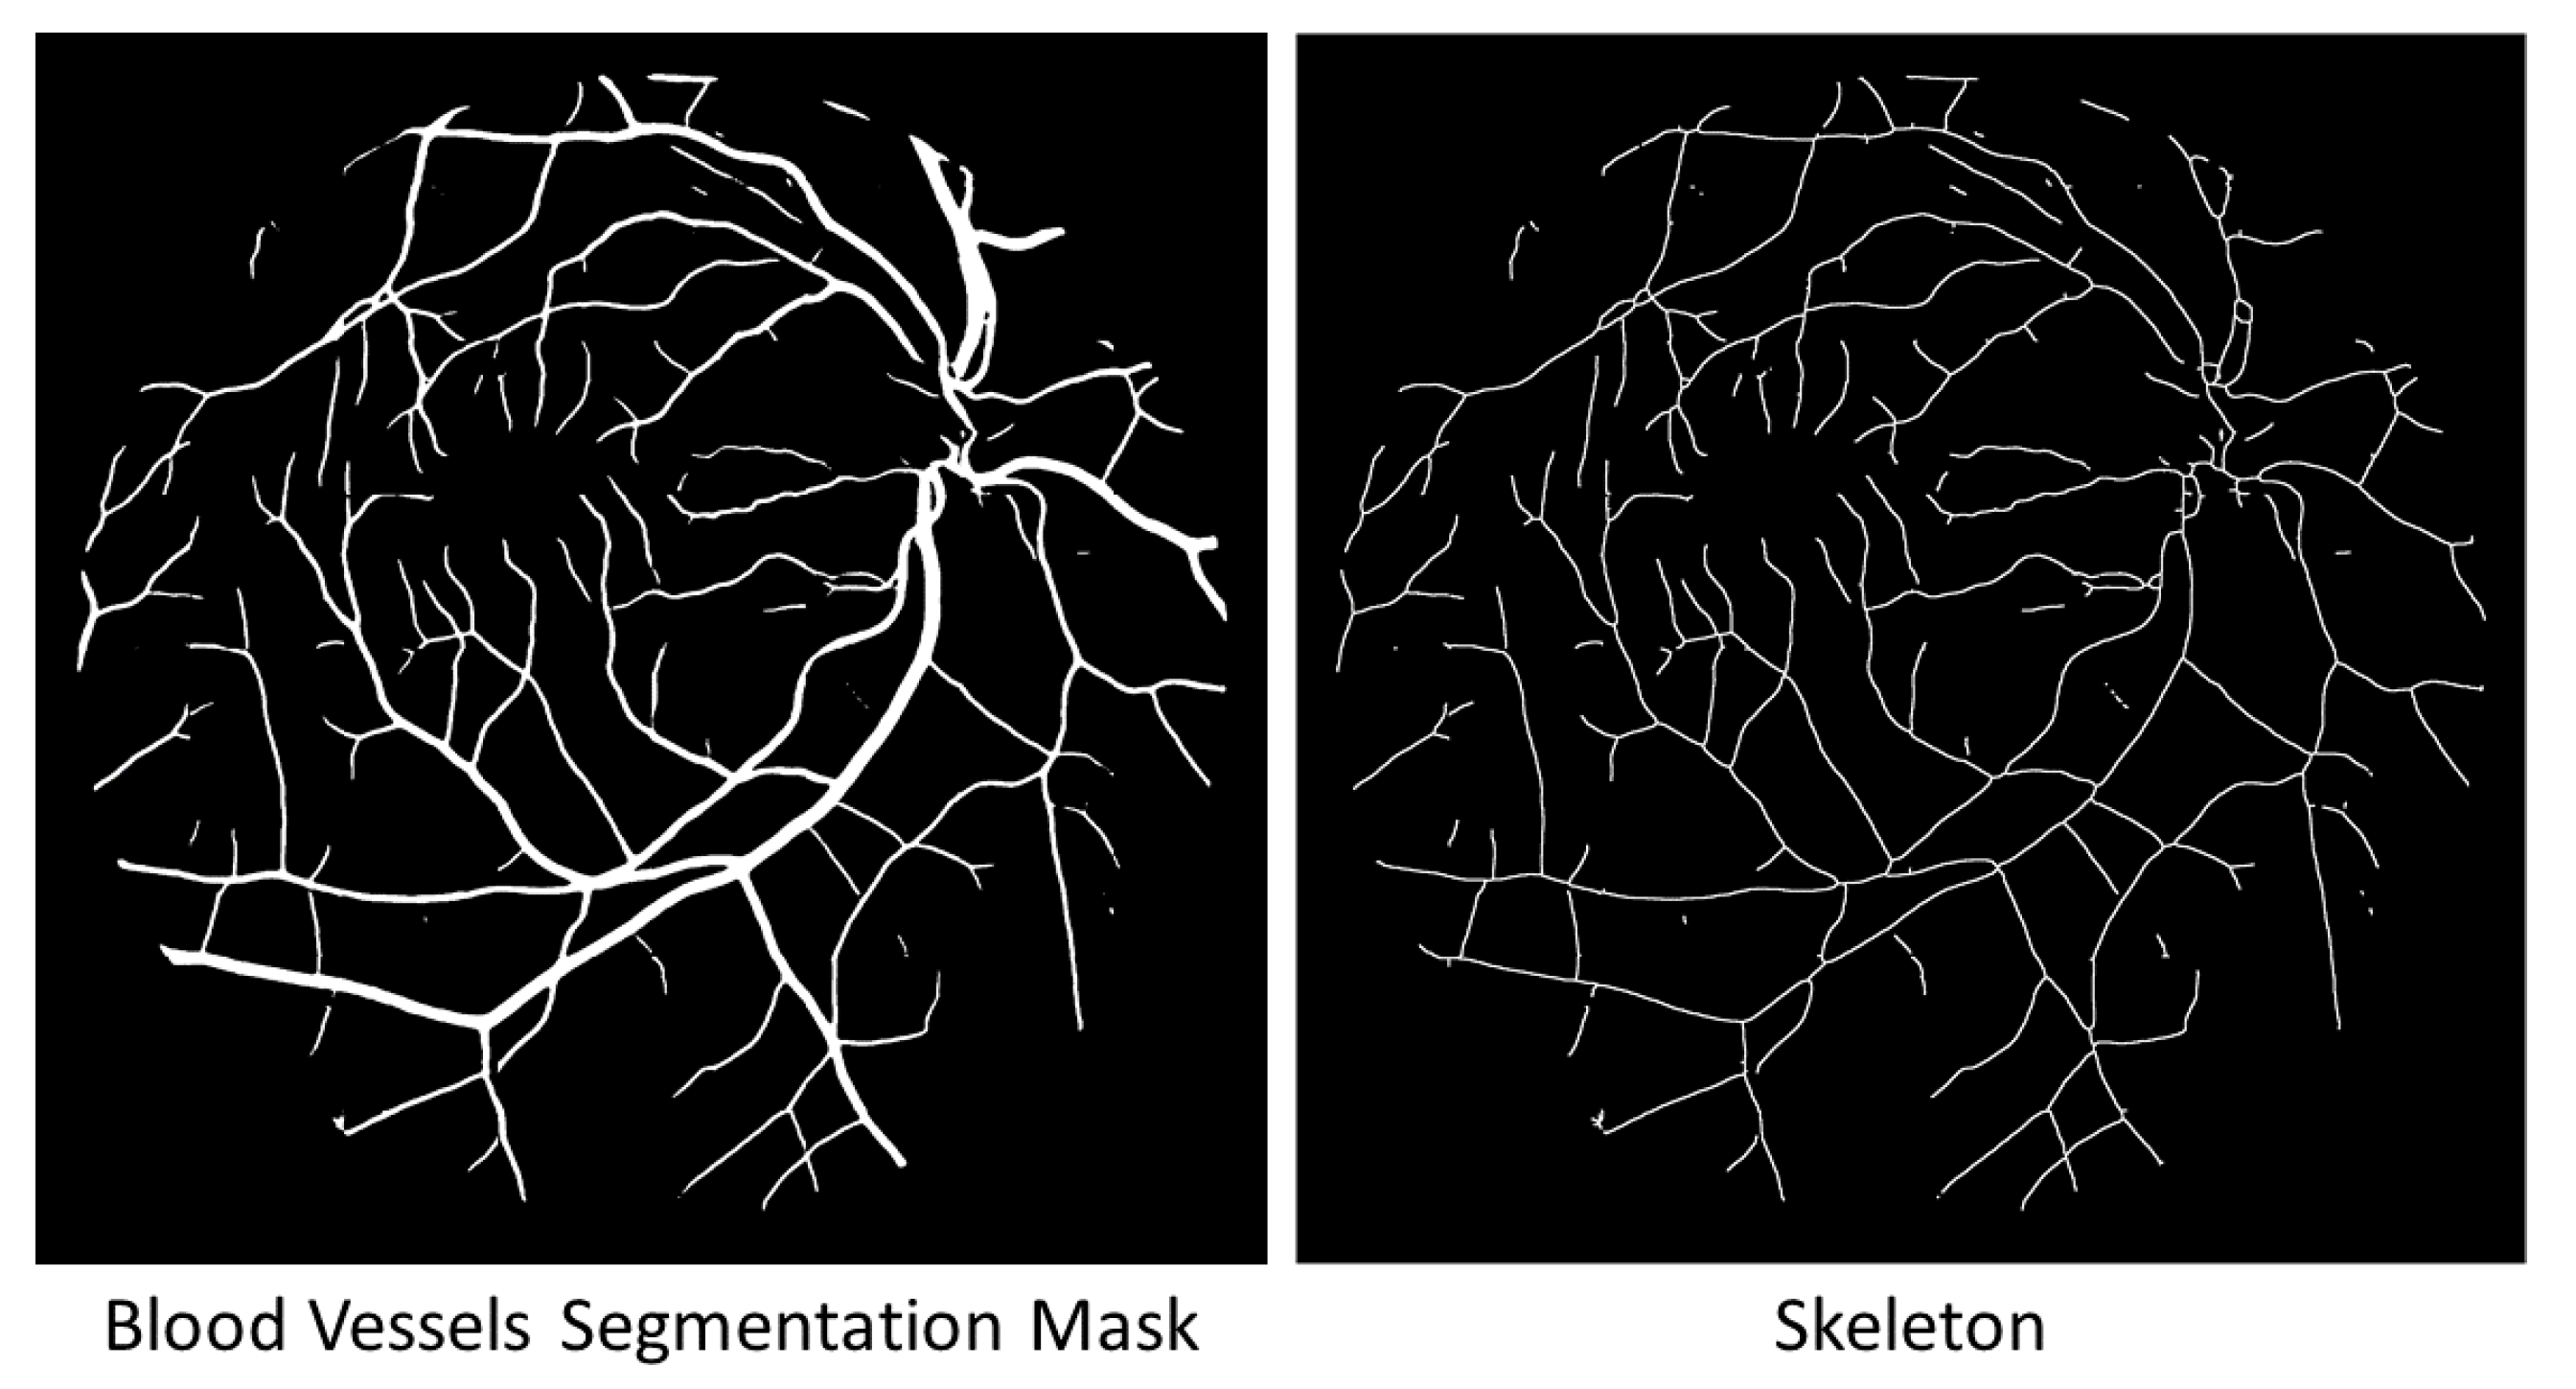
Figure 5.
The structuring elements (top) illustrate the patterns (bottom) used to detect bifurcations within the skeleton of fundus images.
Figure 5.
The structuring elements (top) illustrate the patterns (bottom) used to detect bifurcations within the skeleton of fundus images.
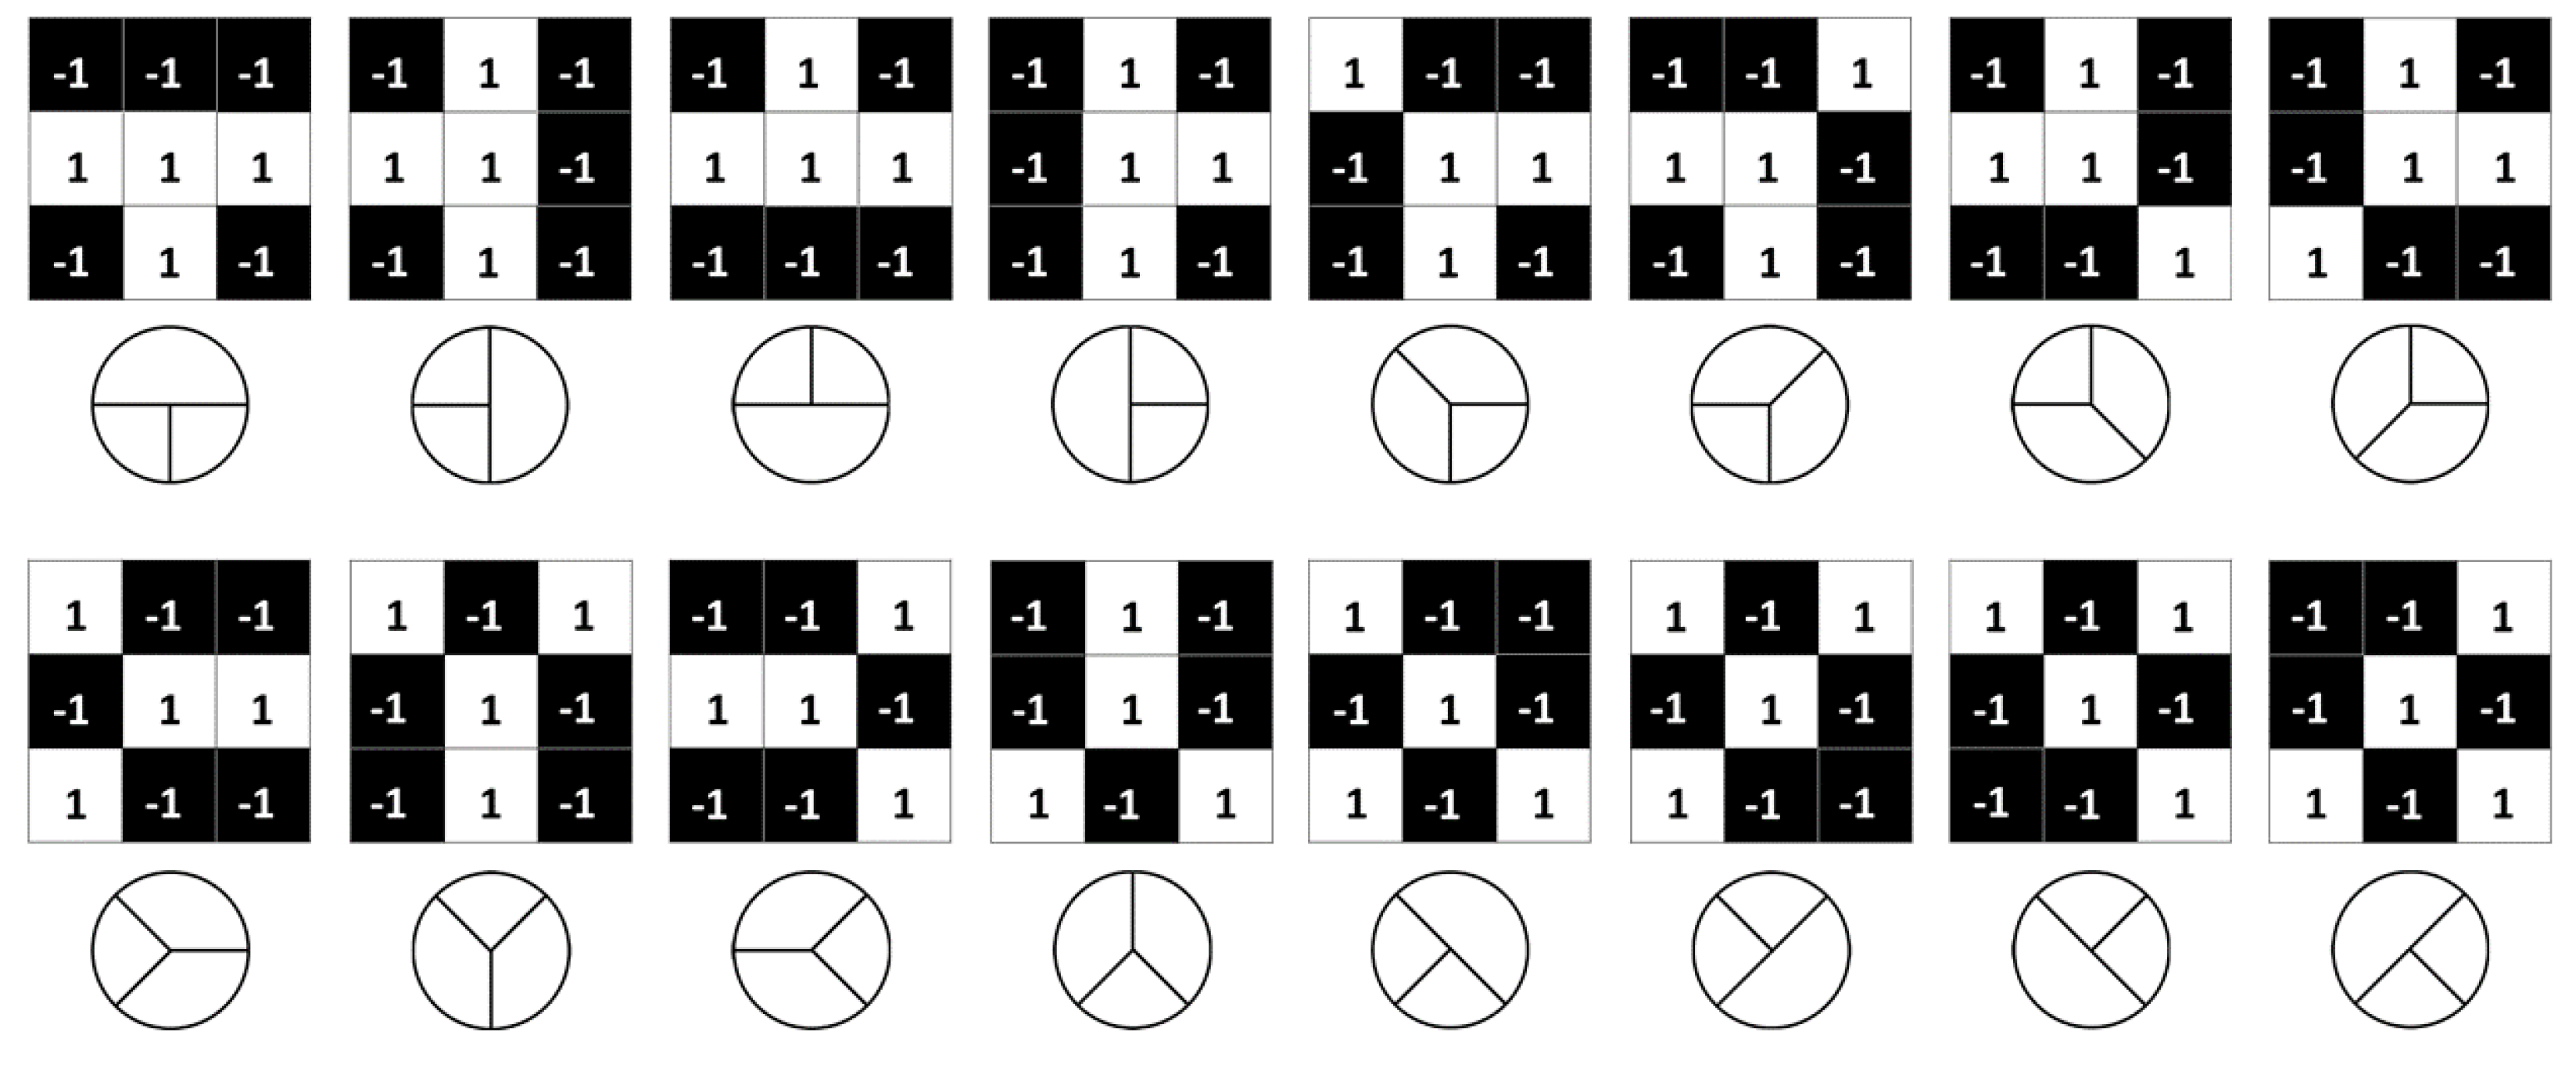
Figure 6.
Receptive fields utilized to characterize each feature point within fundus images.
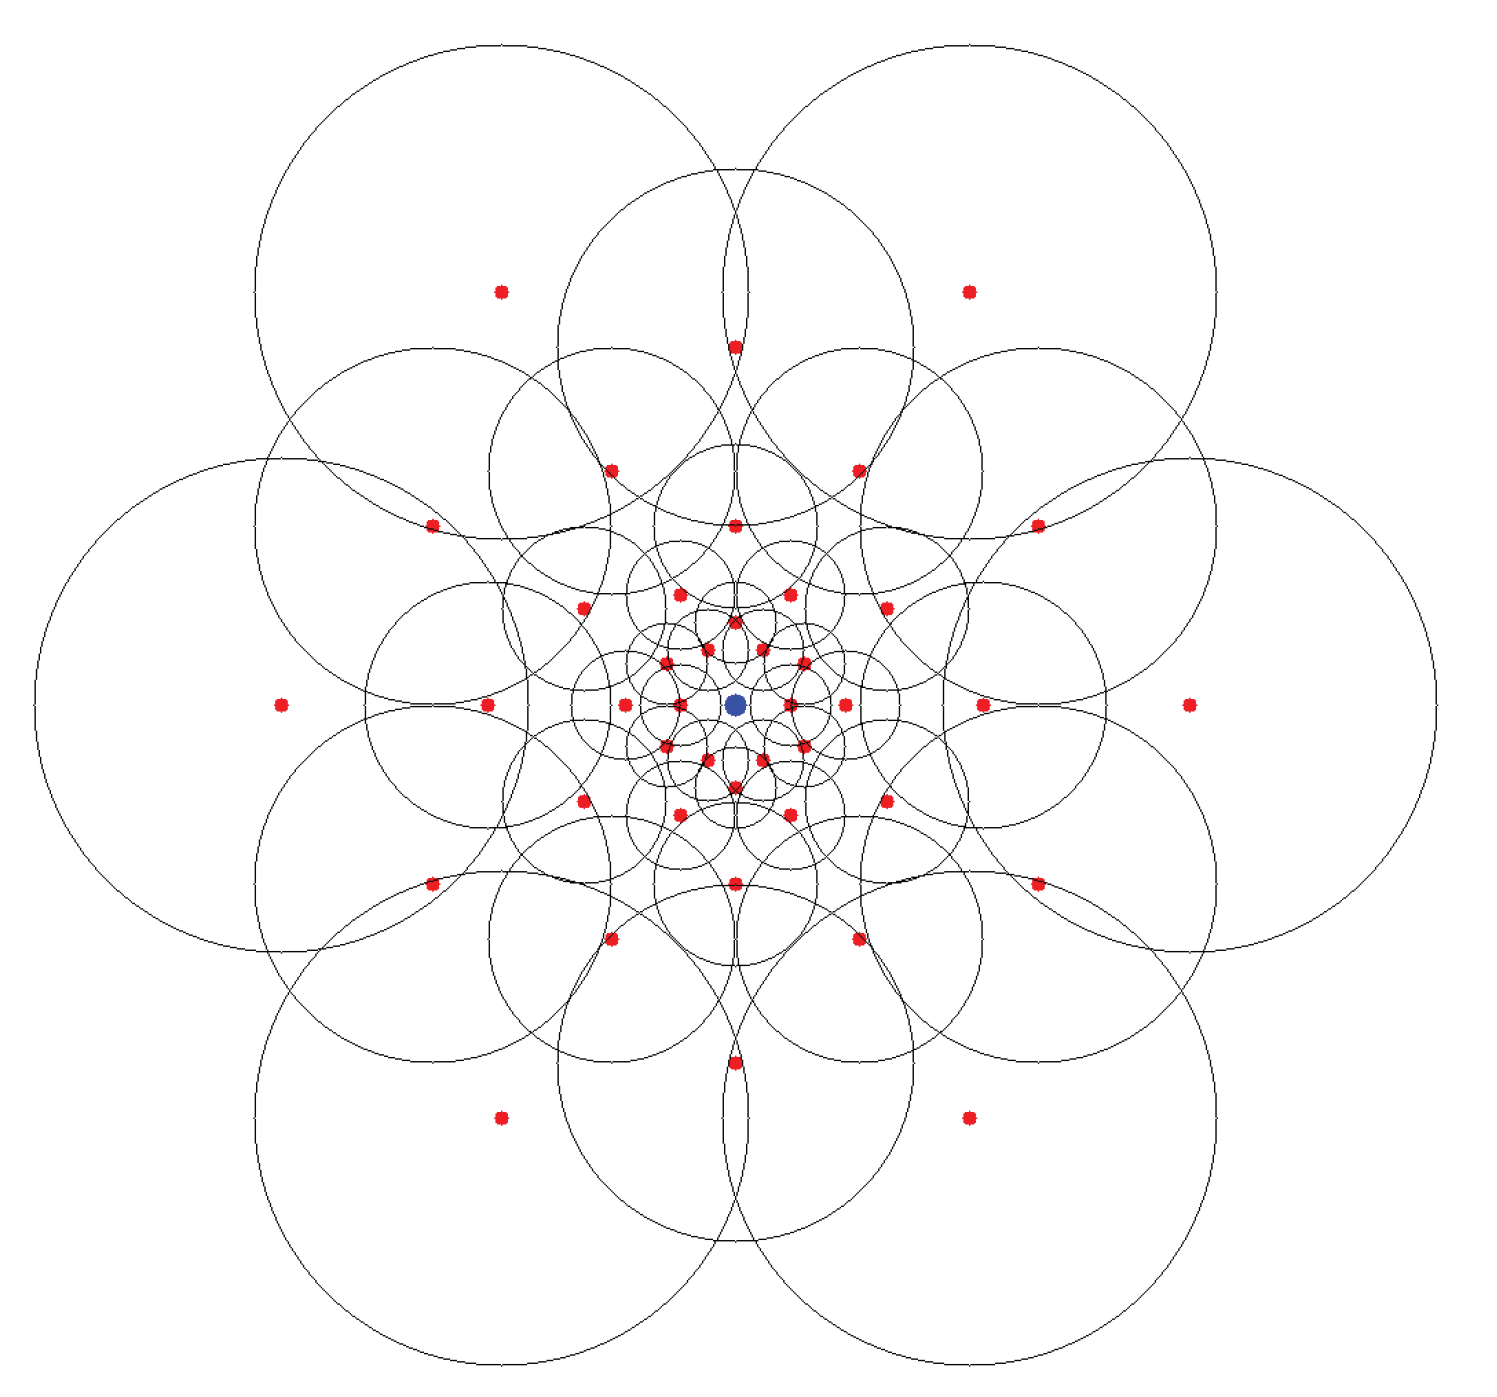
Figure 7.
Receptive field pairs employed for computing the orientation of feature points within fundus images.
Figure 7.
Receptive field pairs employed for computing the orientation of feature points within fundus images.
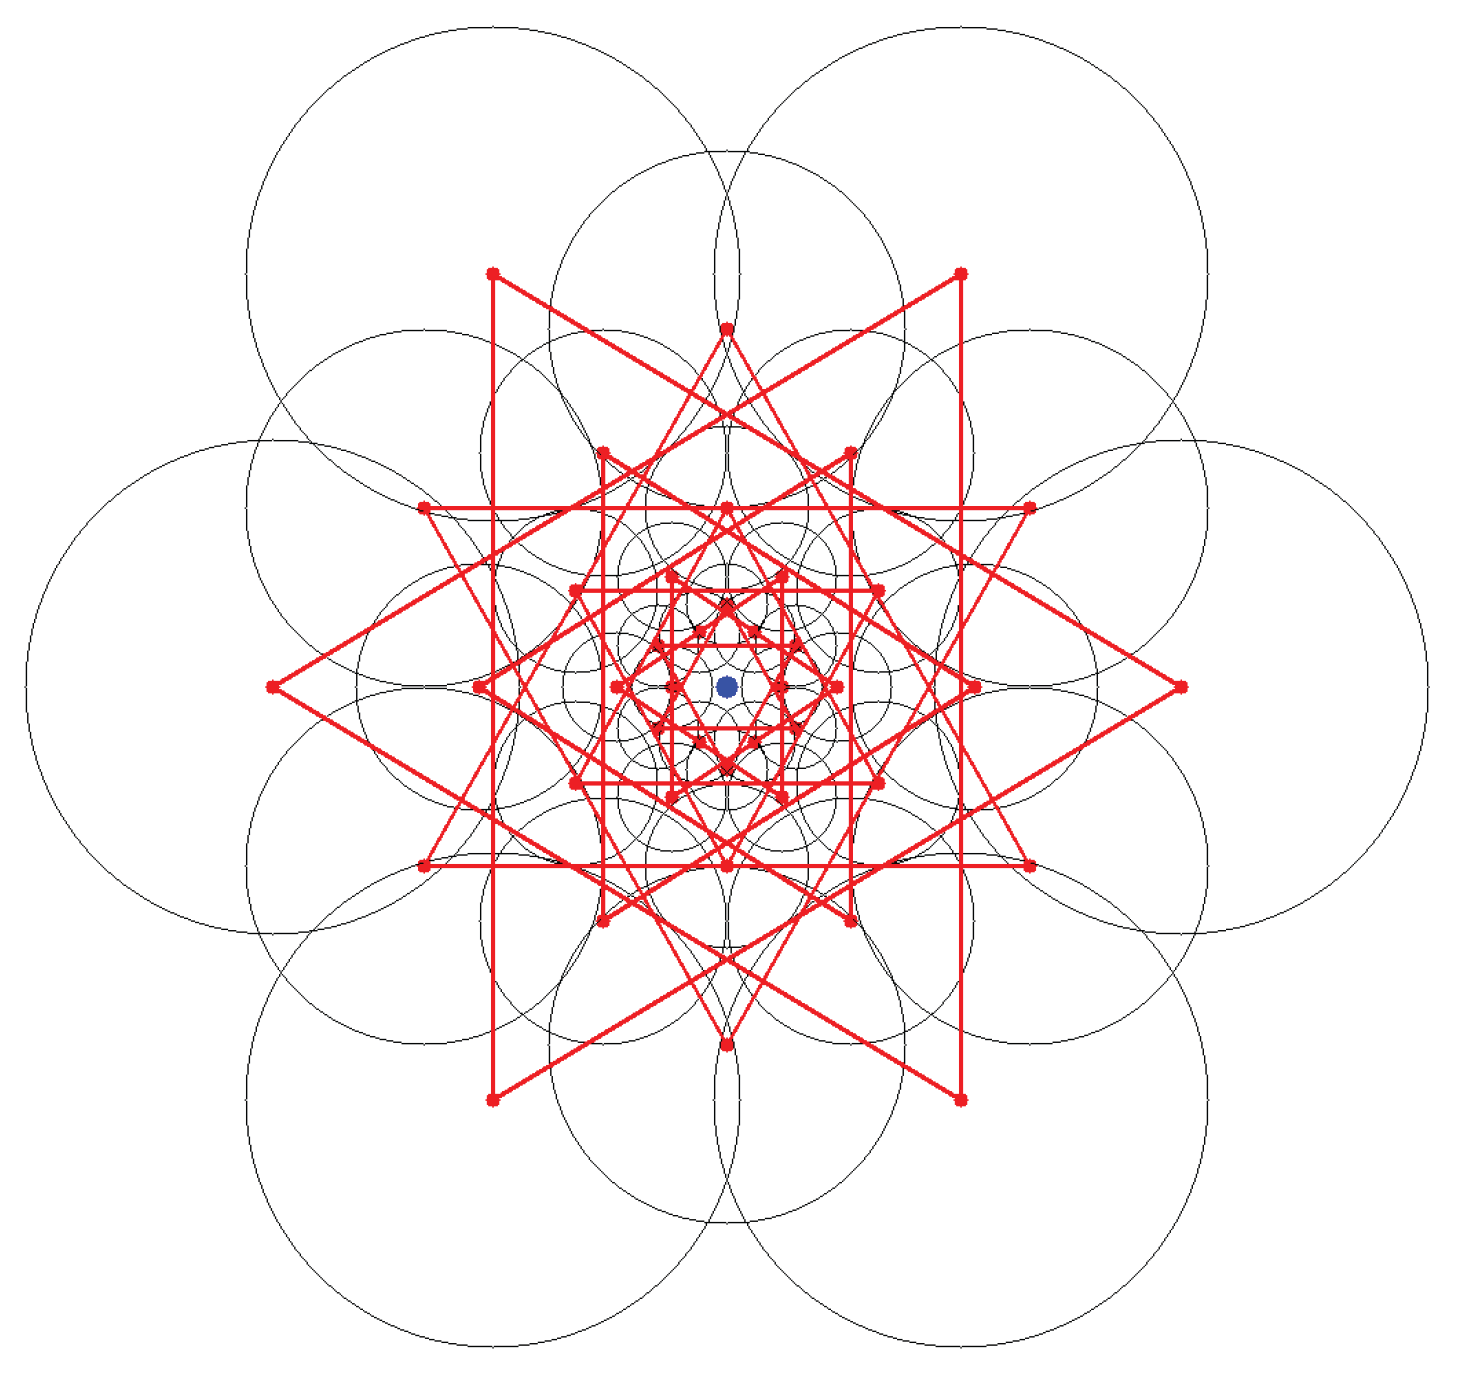
Figure 8.
Matches acquired for a pair of fundus images using the nearest neighbor approach (top) and matches identified as inliers following the application of RANSAC (bottom).
Figure 8.
Matches acquired for a pair of fundus images using the nearest neighbor approach (top) and matches identified as inliers following the application of RANSAC (bottom).
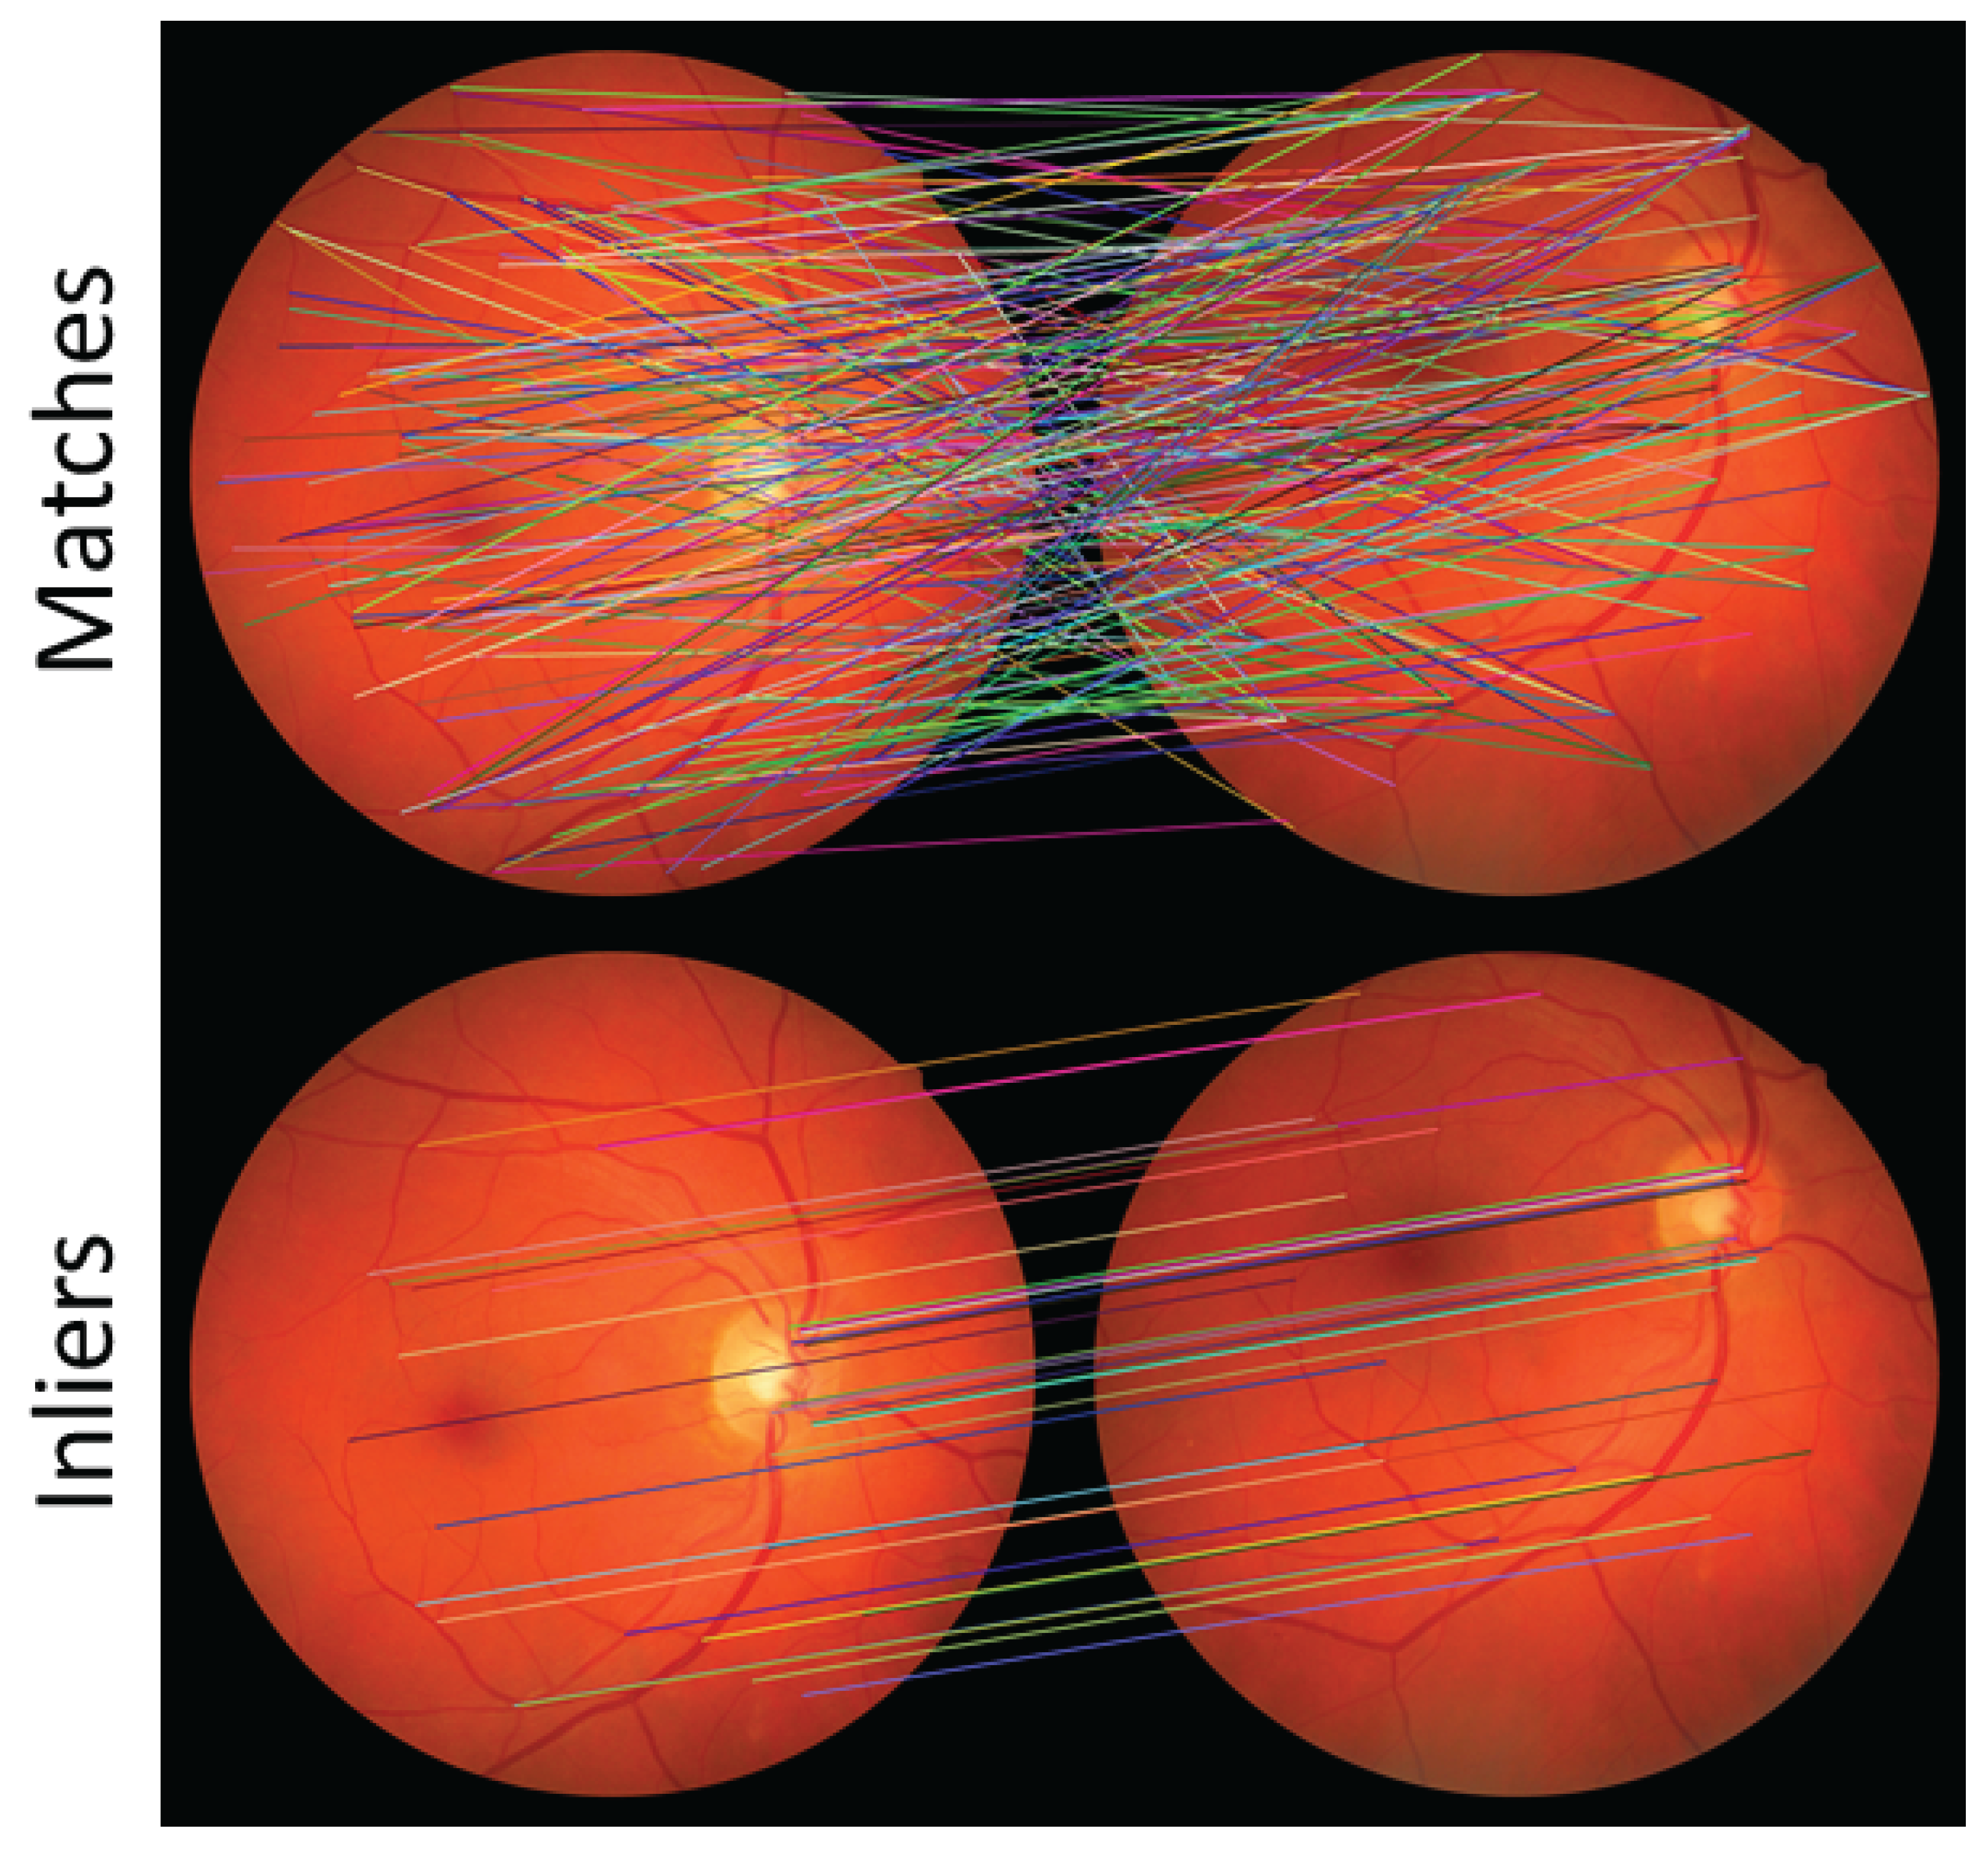
Figure 9.
Images from the FIVES dataset utilized for both training and testing data during the segmentation phase in the fundus image registration methodology, accompanied by their respective ground-truth annotations.
Figure 9.
Images from the FIVES dataset utilized for both training and testing data during the segmentation phase in the fundus image registration methodology, accompanied by their respective ground-truth annotations.
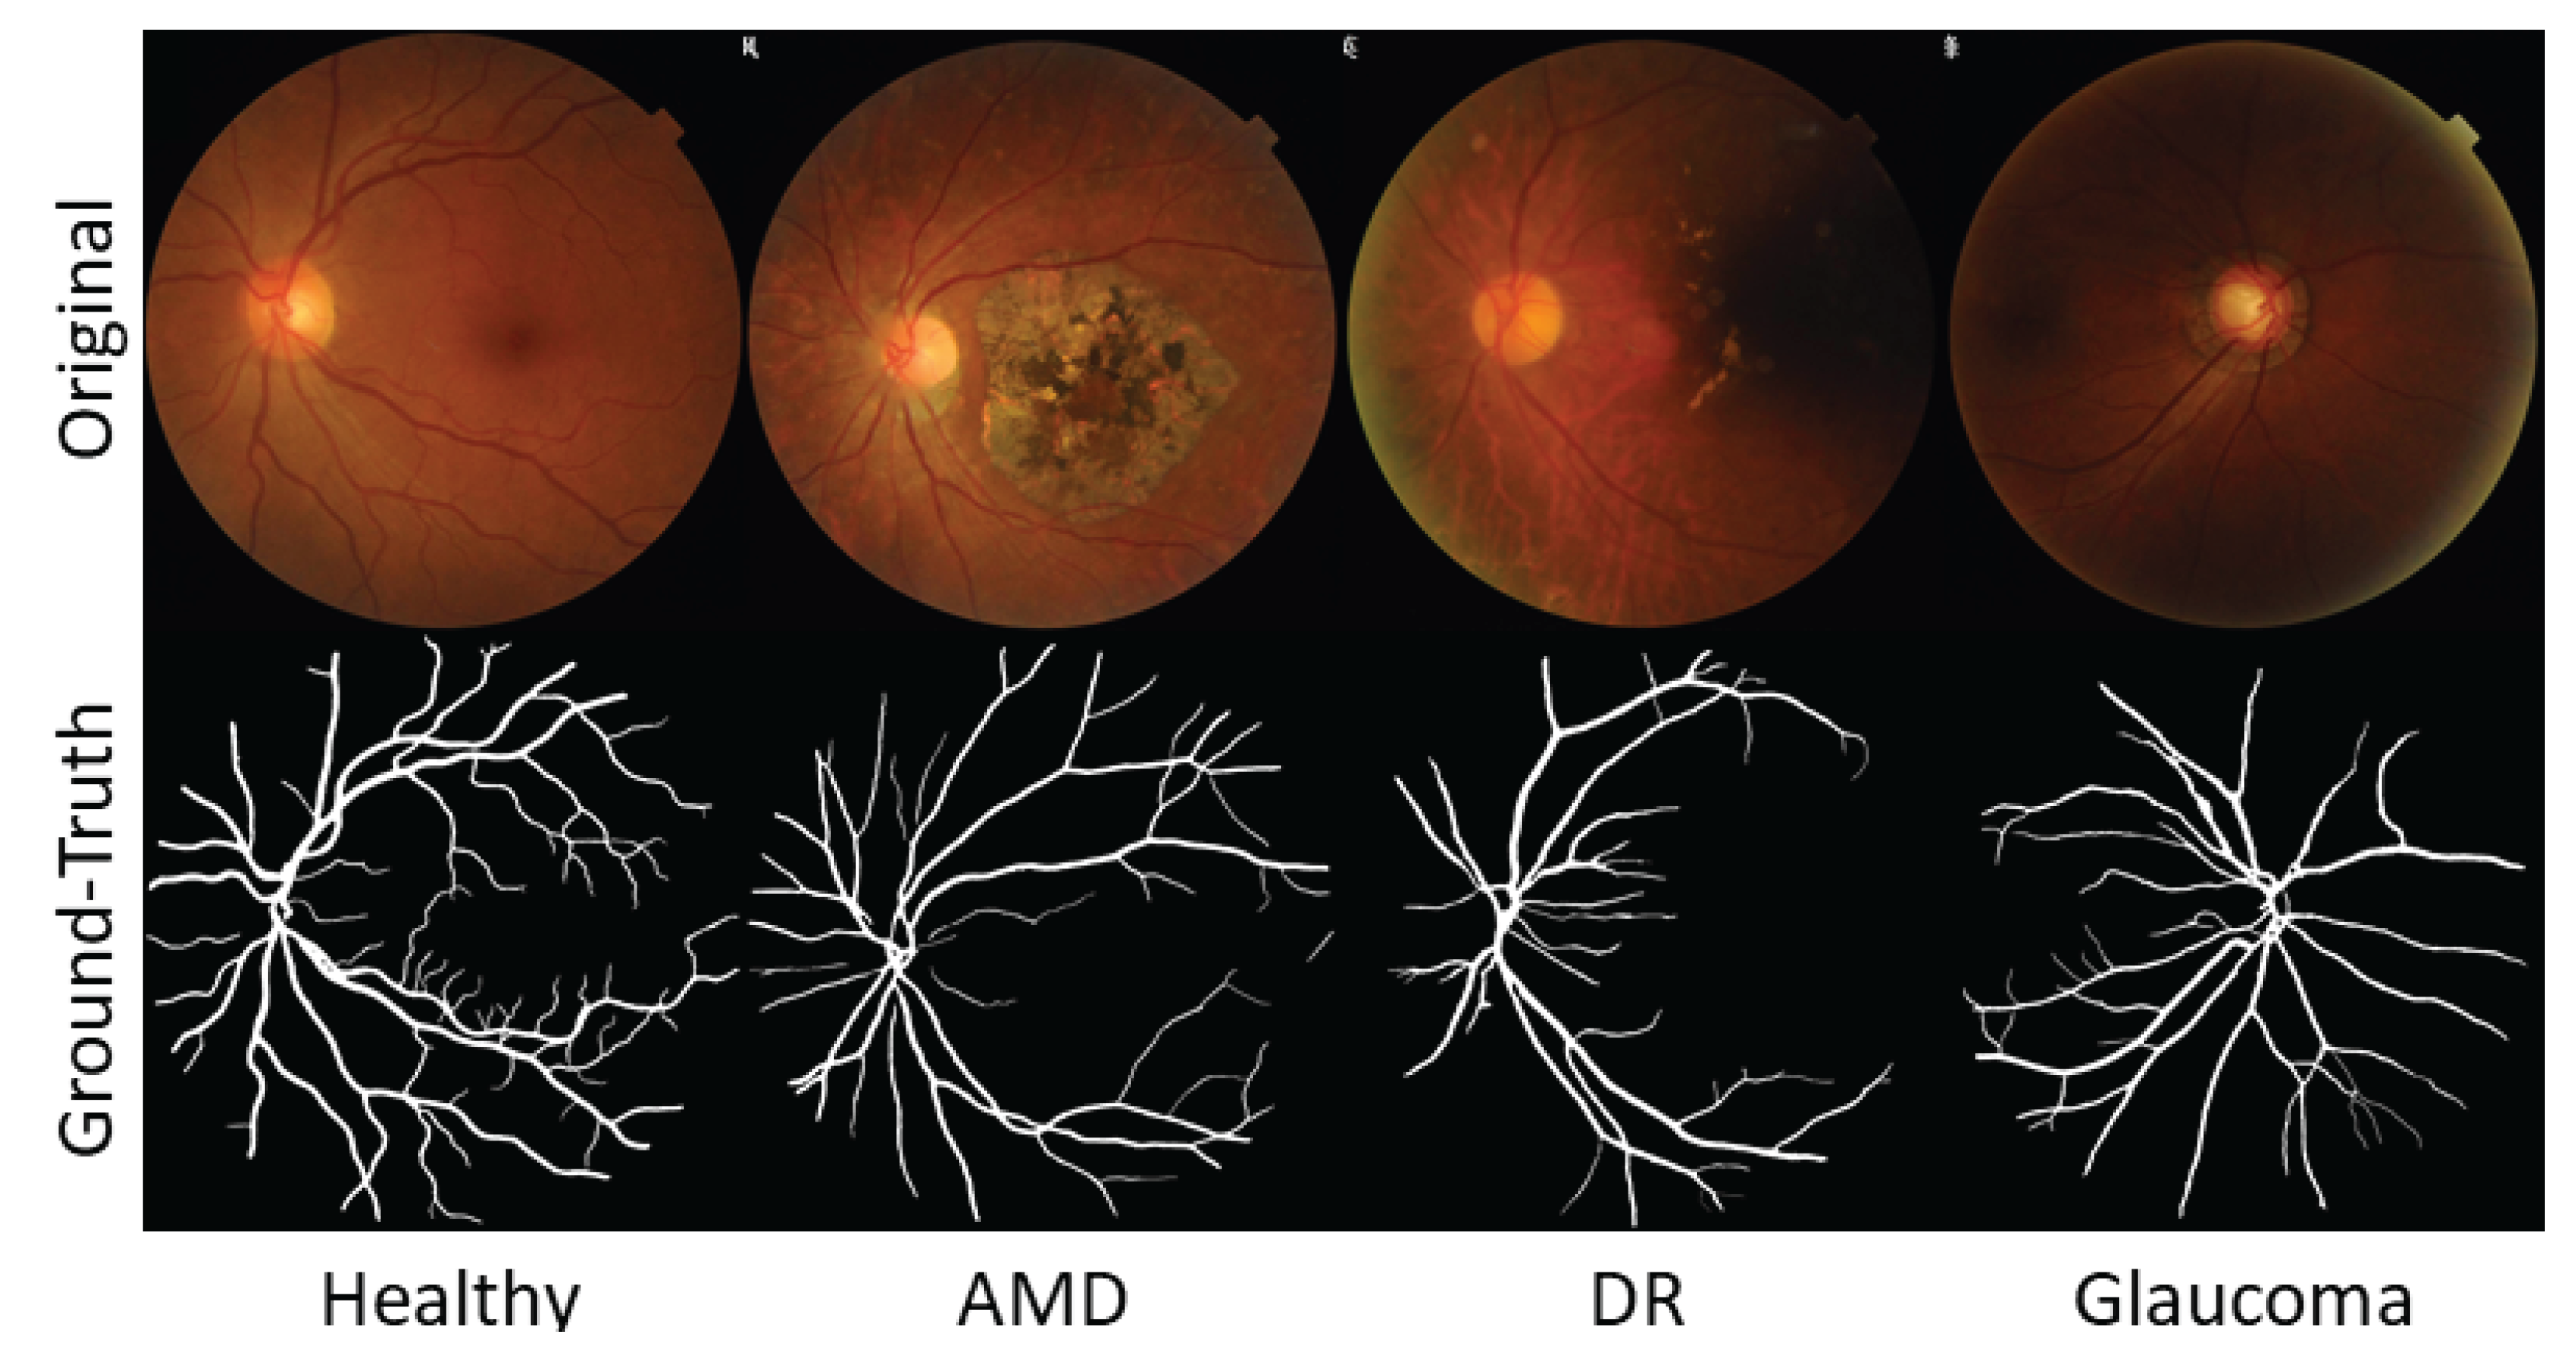
Figure 10.
Fundus image pairs designated for registration within the FIRE dataset are classified into three distinct categories, each accompanied by its corresponding annotated control points. These control points are established based on the provided coordinates within the dataset, serving as the ground truth.
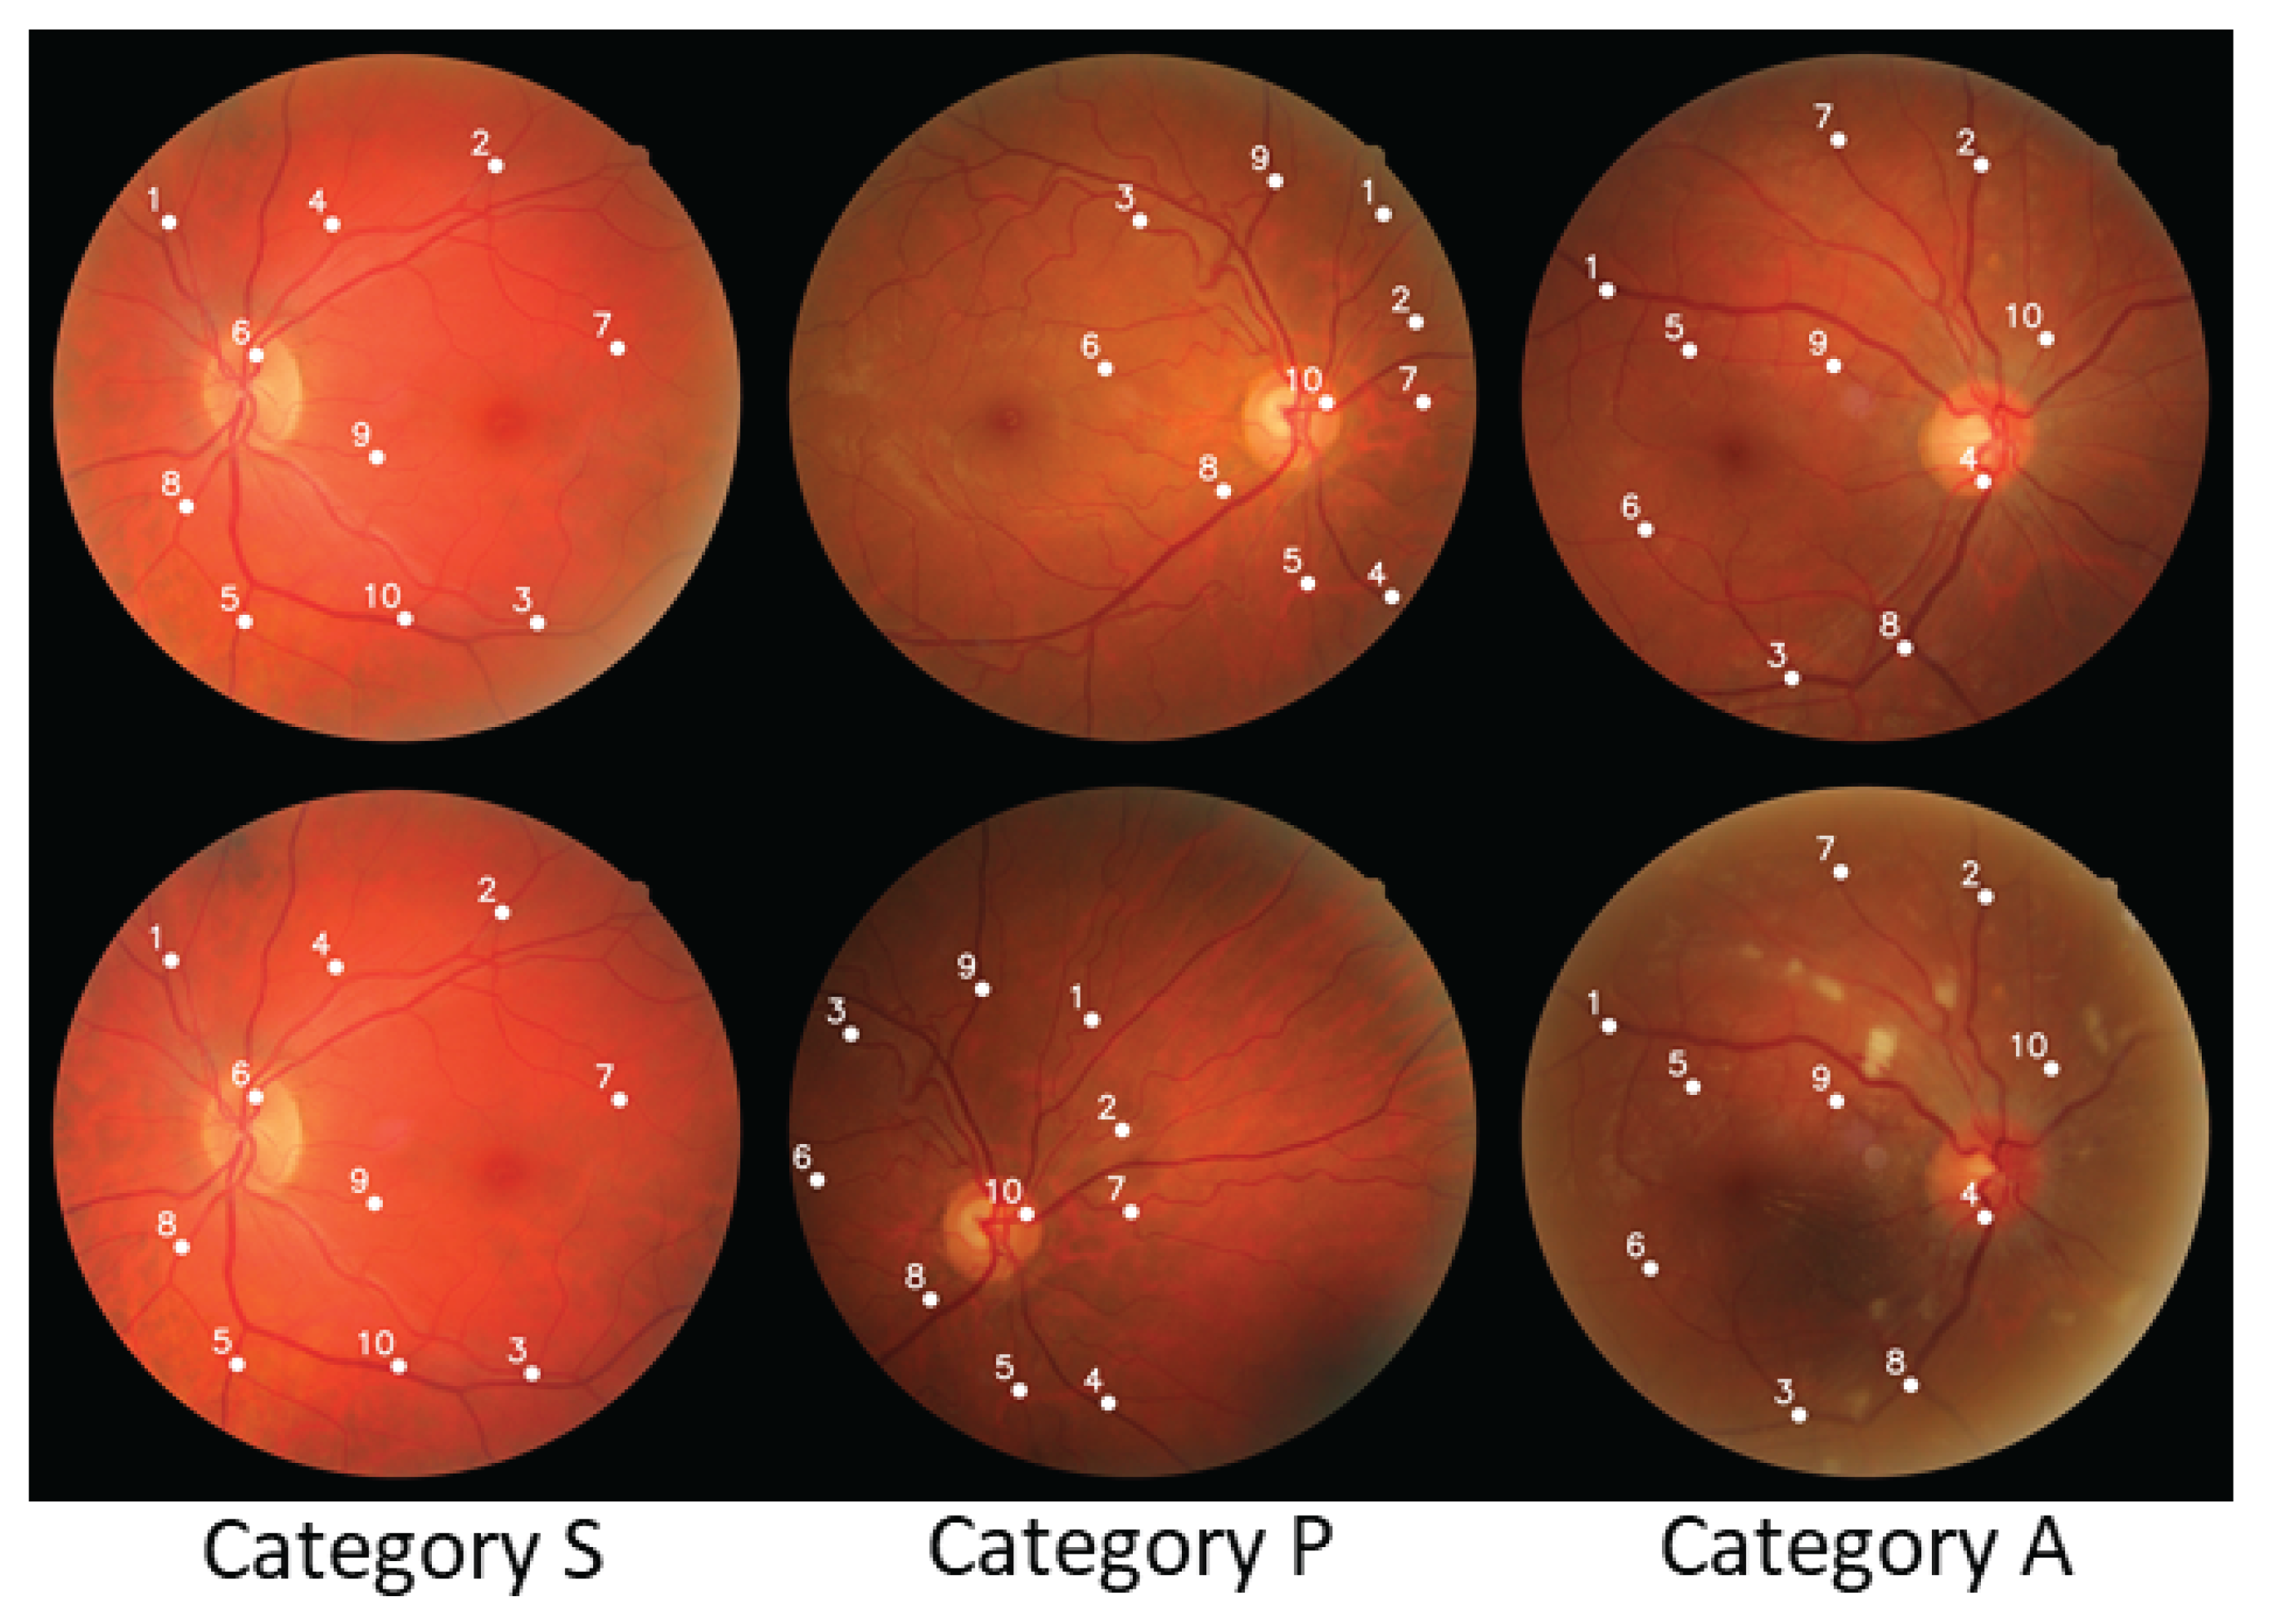
Figure 11.
The loss curve and accuracy curve generated during the initial phase of training for the U-Net model in the blood vessels segmentation process within the fundus image registration method.
Figure 11.
The loss curve and accuracy curve generated during the initial phase of training for the U-Net model in the blood vessels segmentation process within the fundus image registration method.
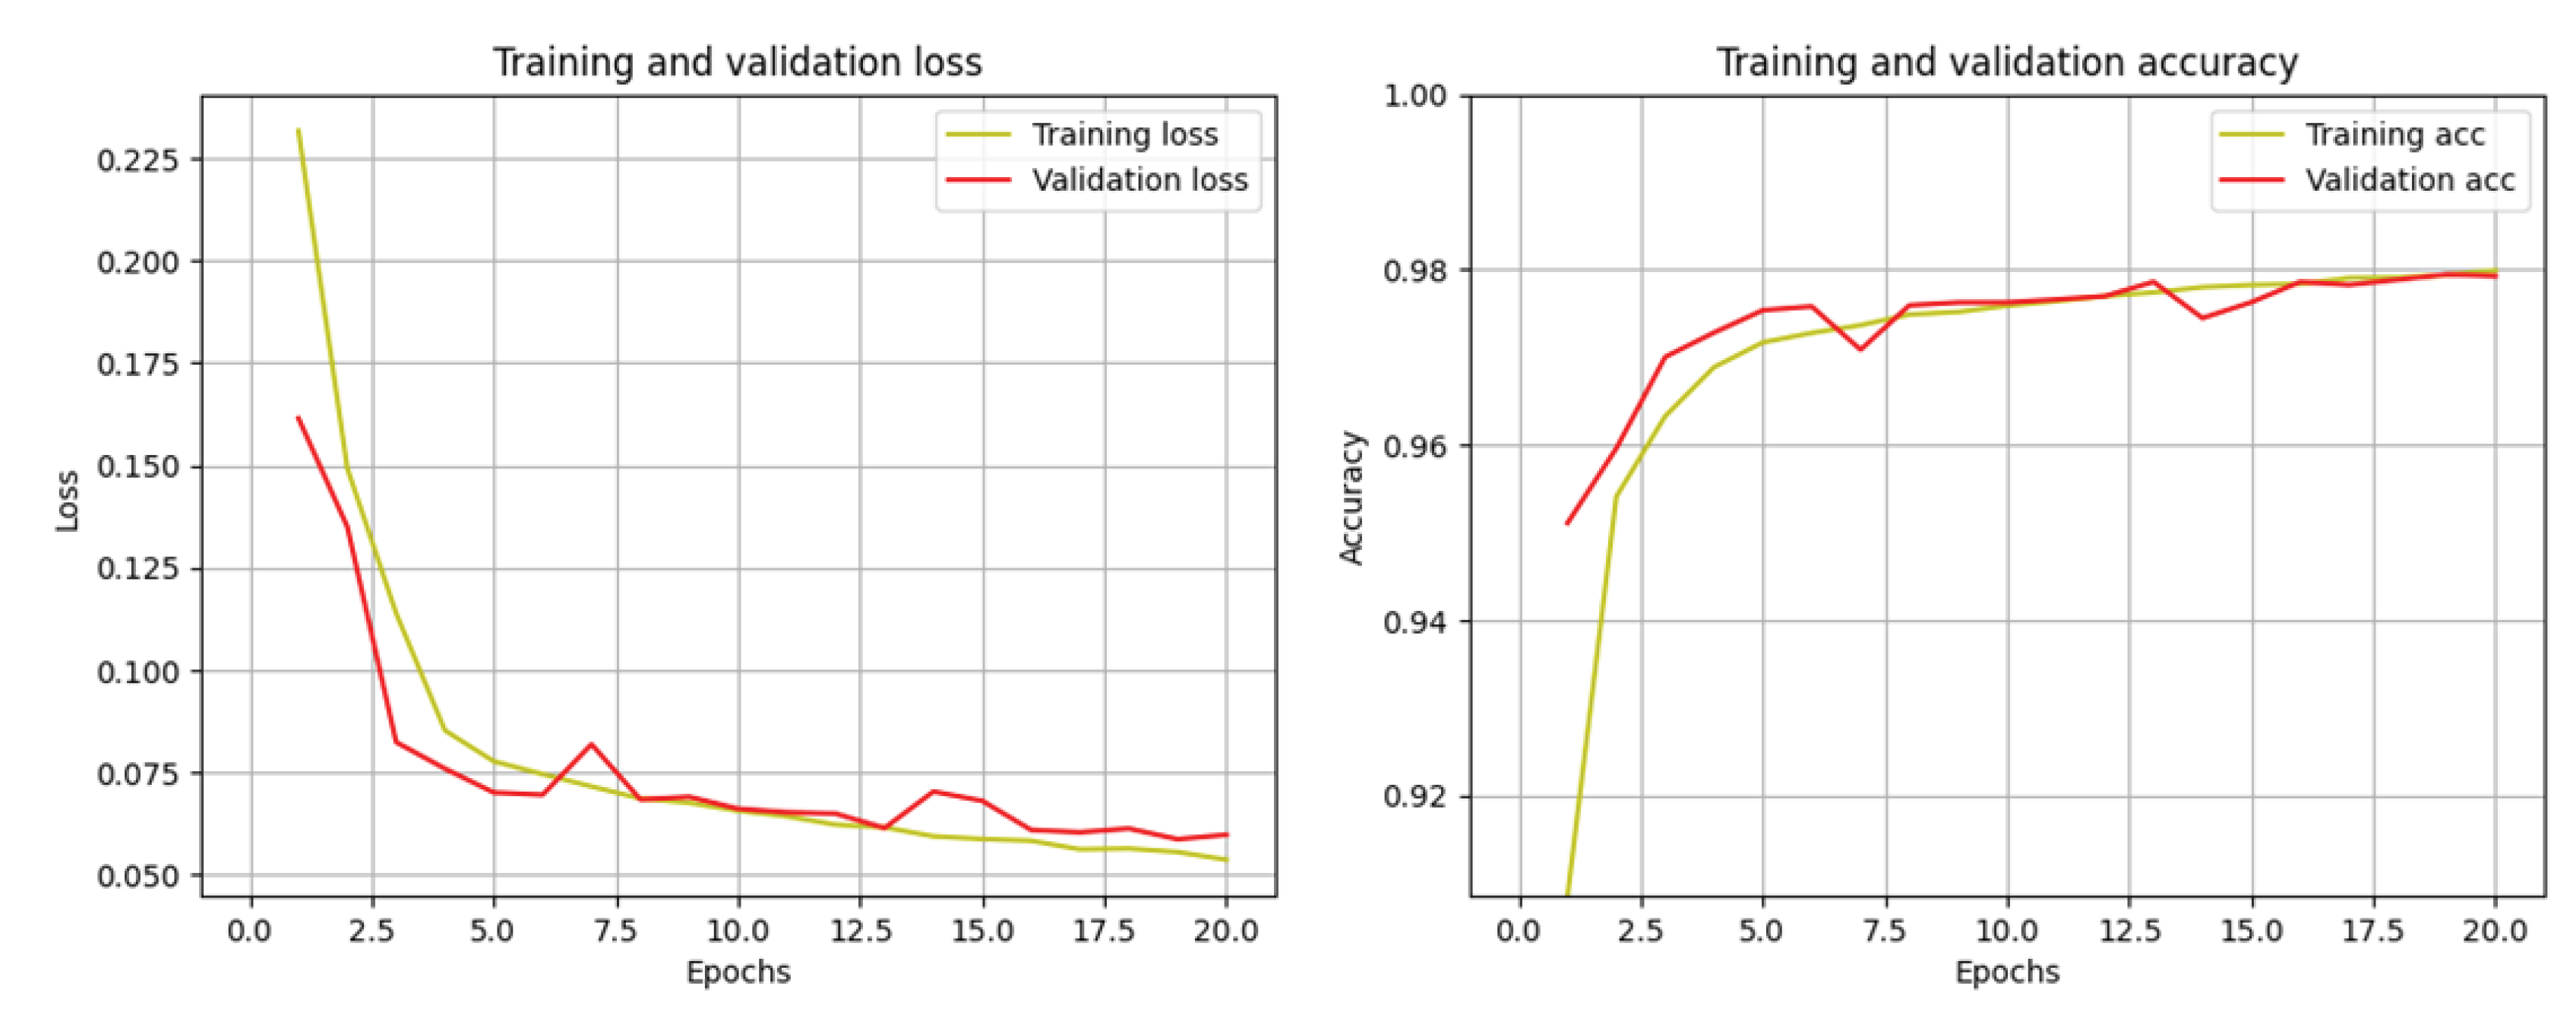
Figure 12.
Example results for the segmentation with U-Net employed as part of the fundus image registration method.
Figure 12.
Example results for the segmentation with U-Net employed as part of the fundus image registration method.
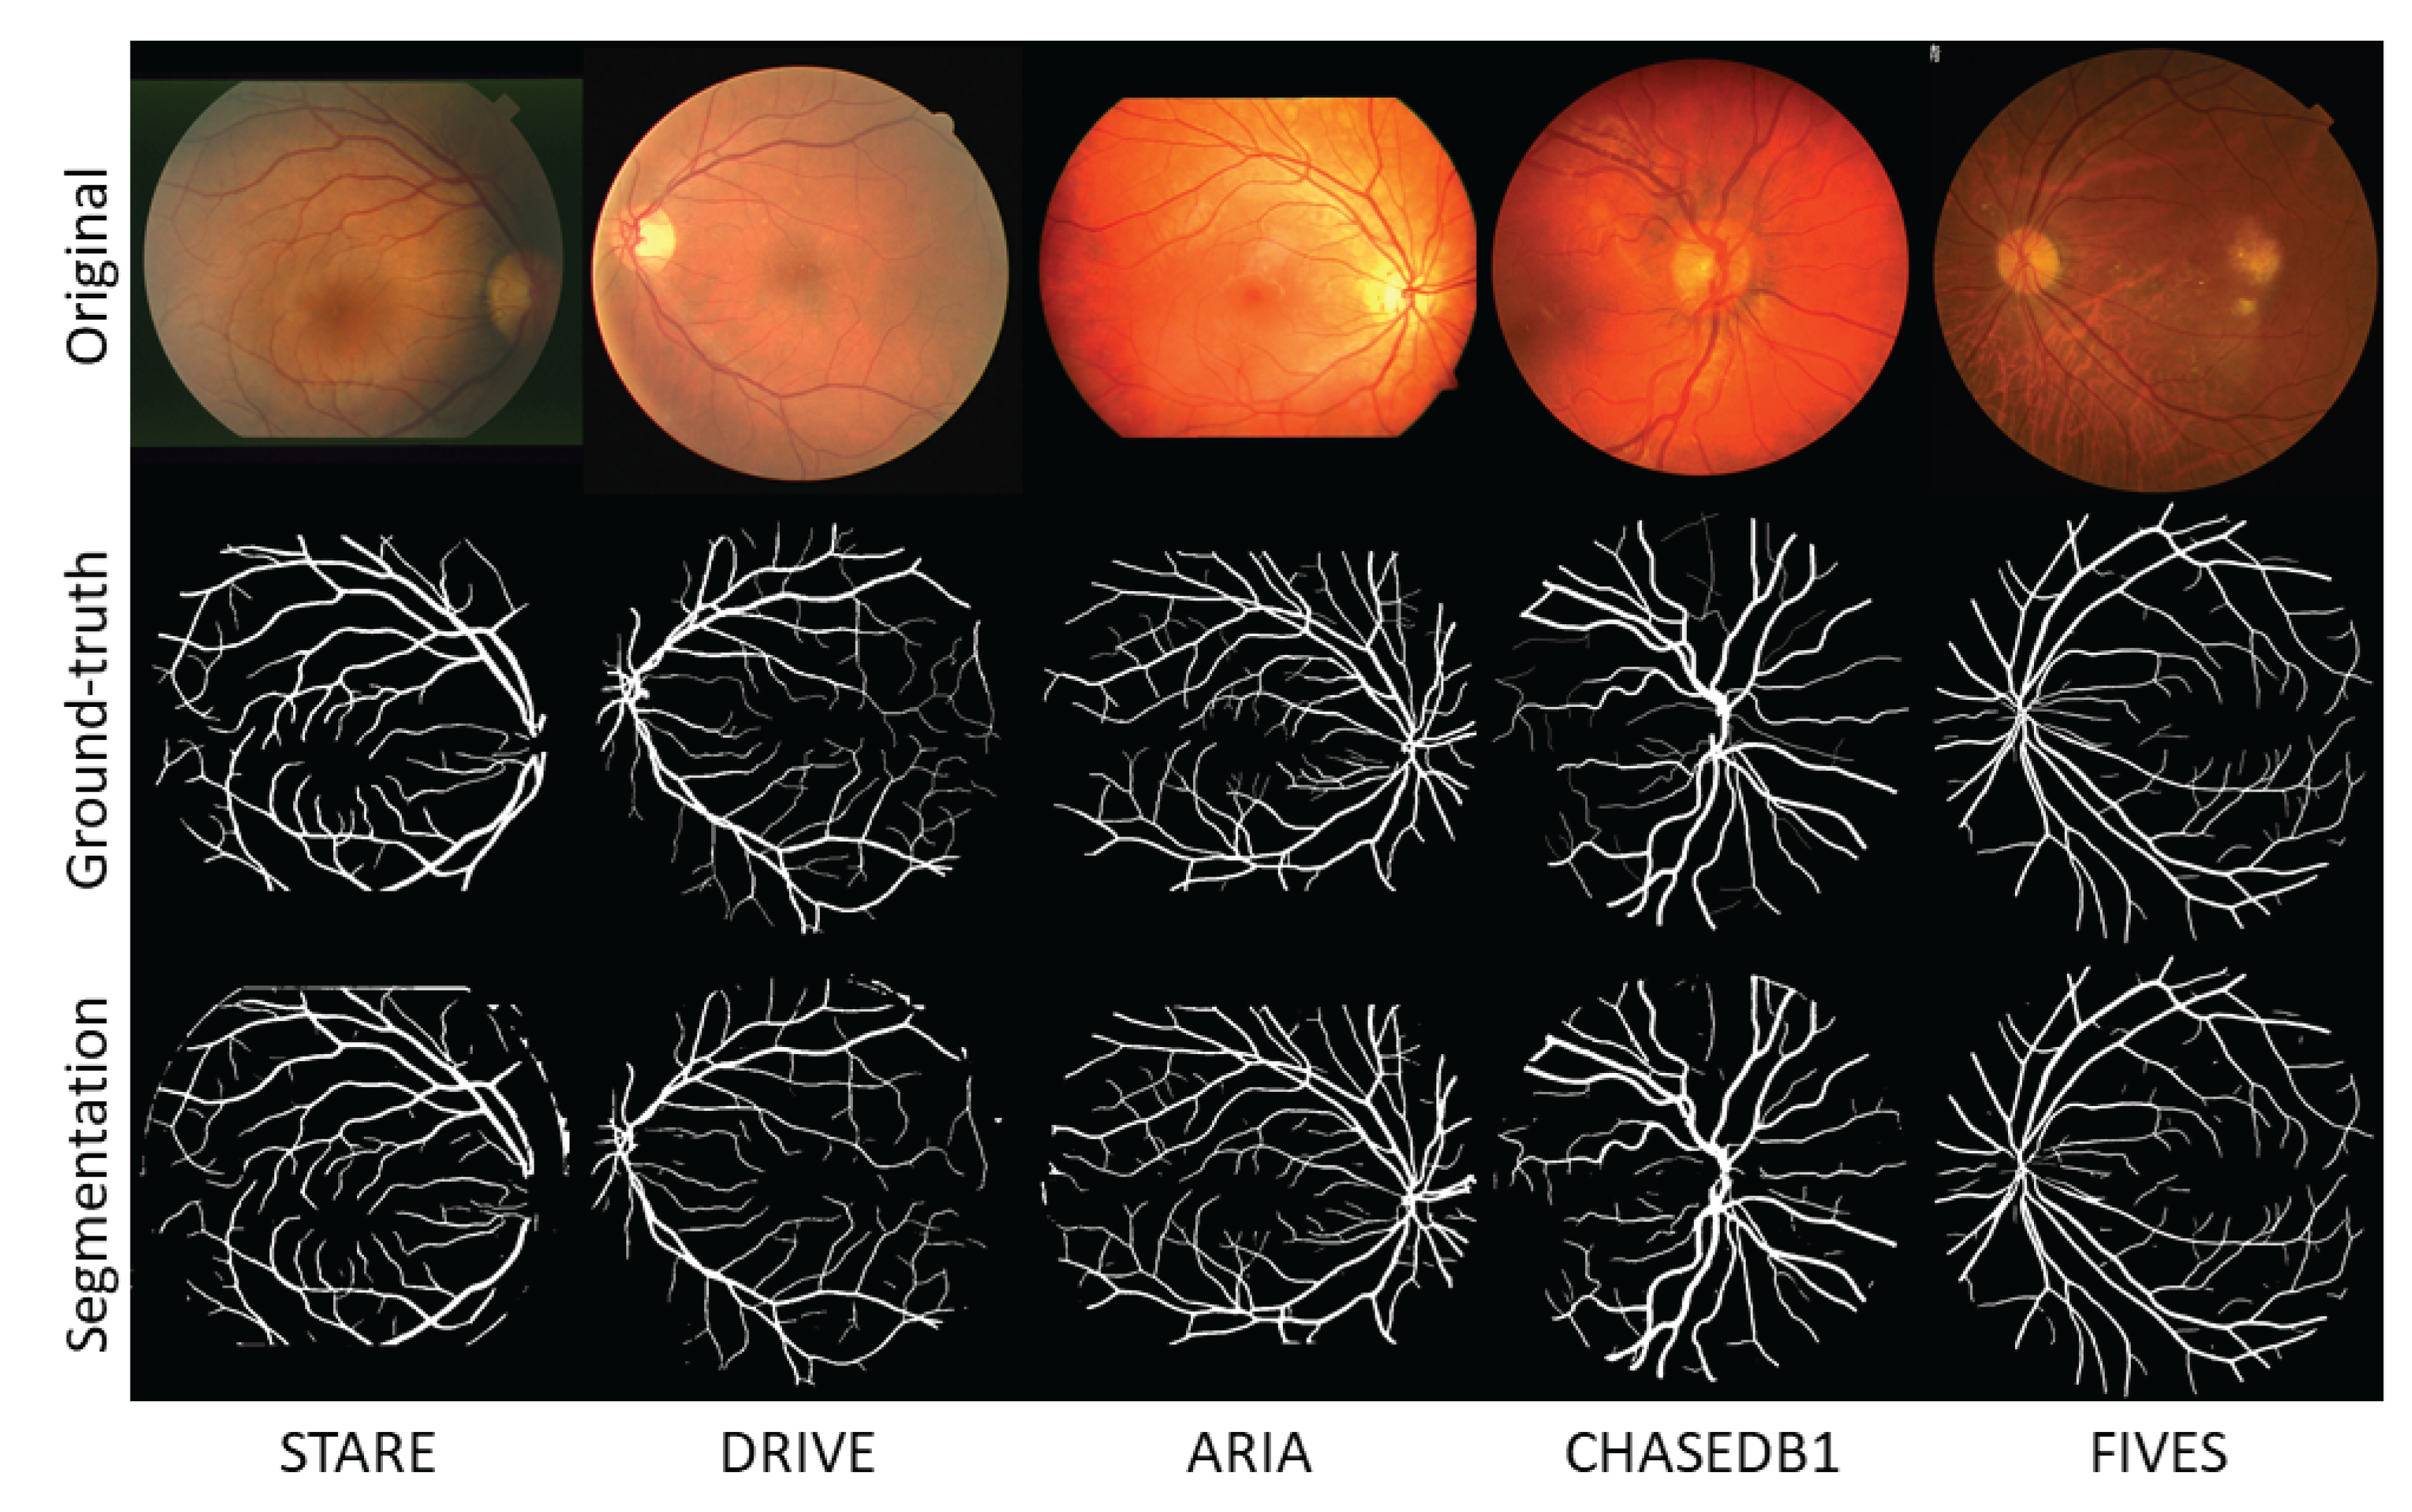
Figure 13.
Example results for the segmentation with U-Net for different categories of FIRE dataset.
Figure 13.
Example results for the segmentation with U-Net for different categories of FIRE dataset.
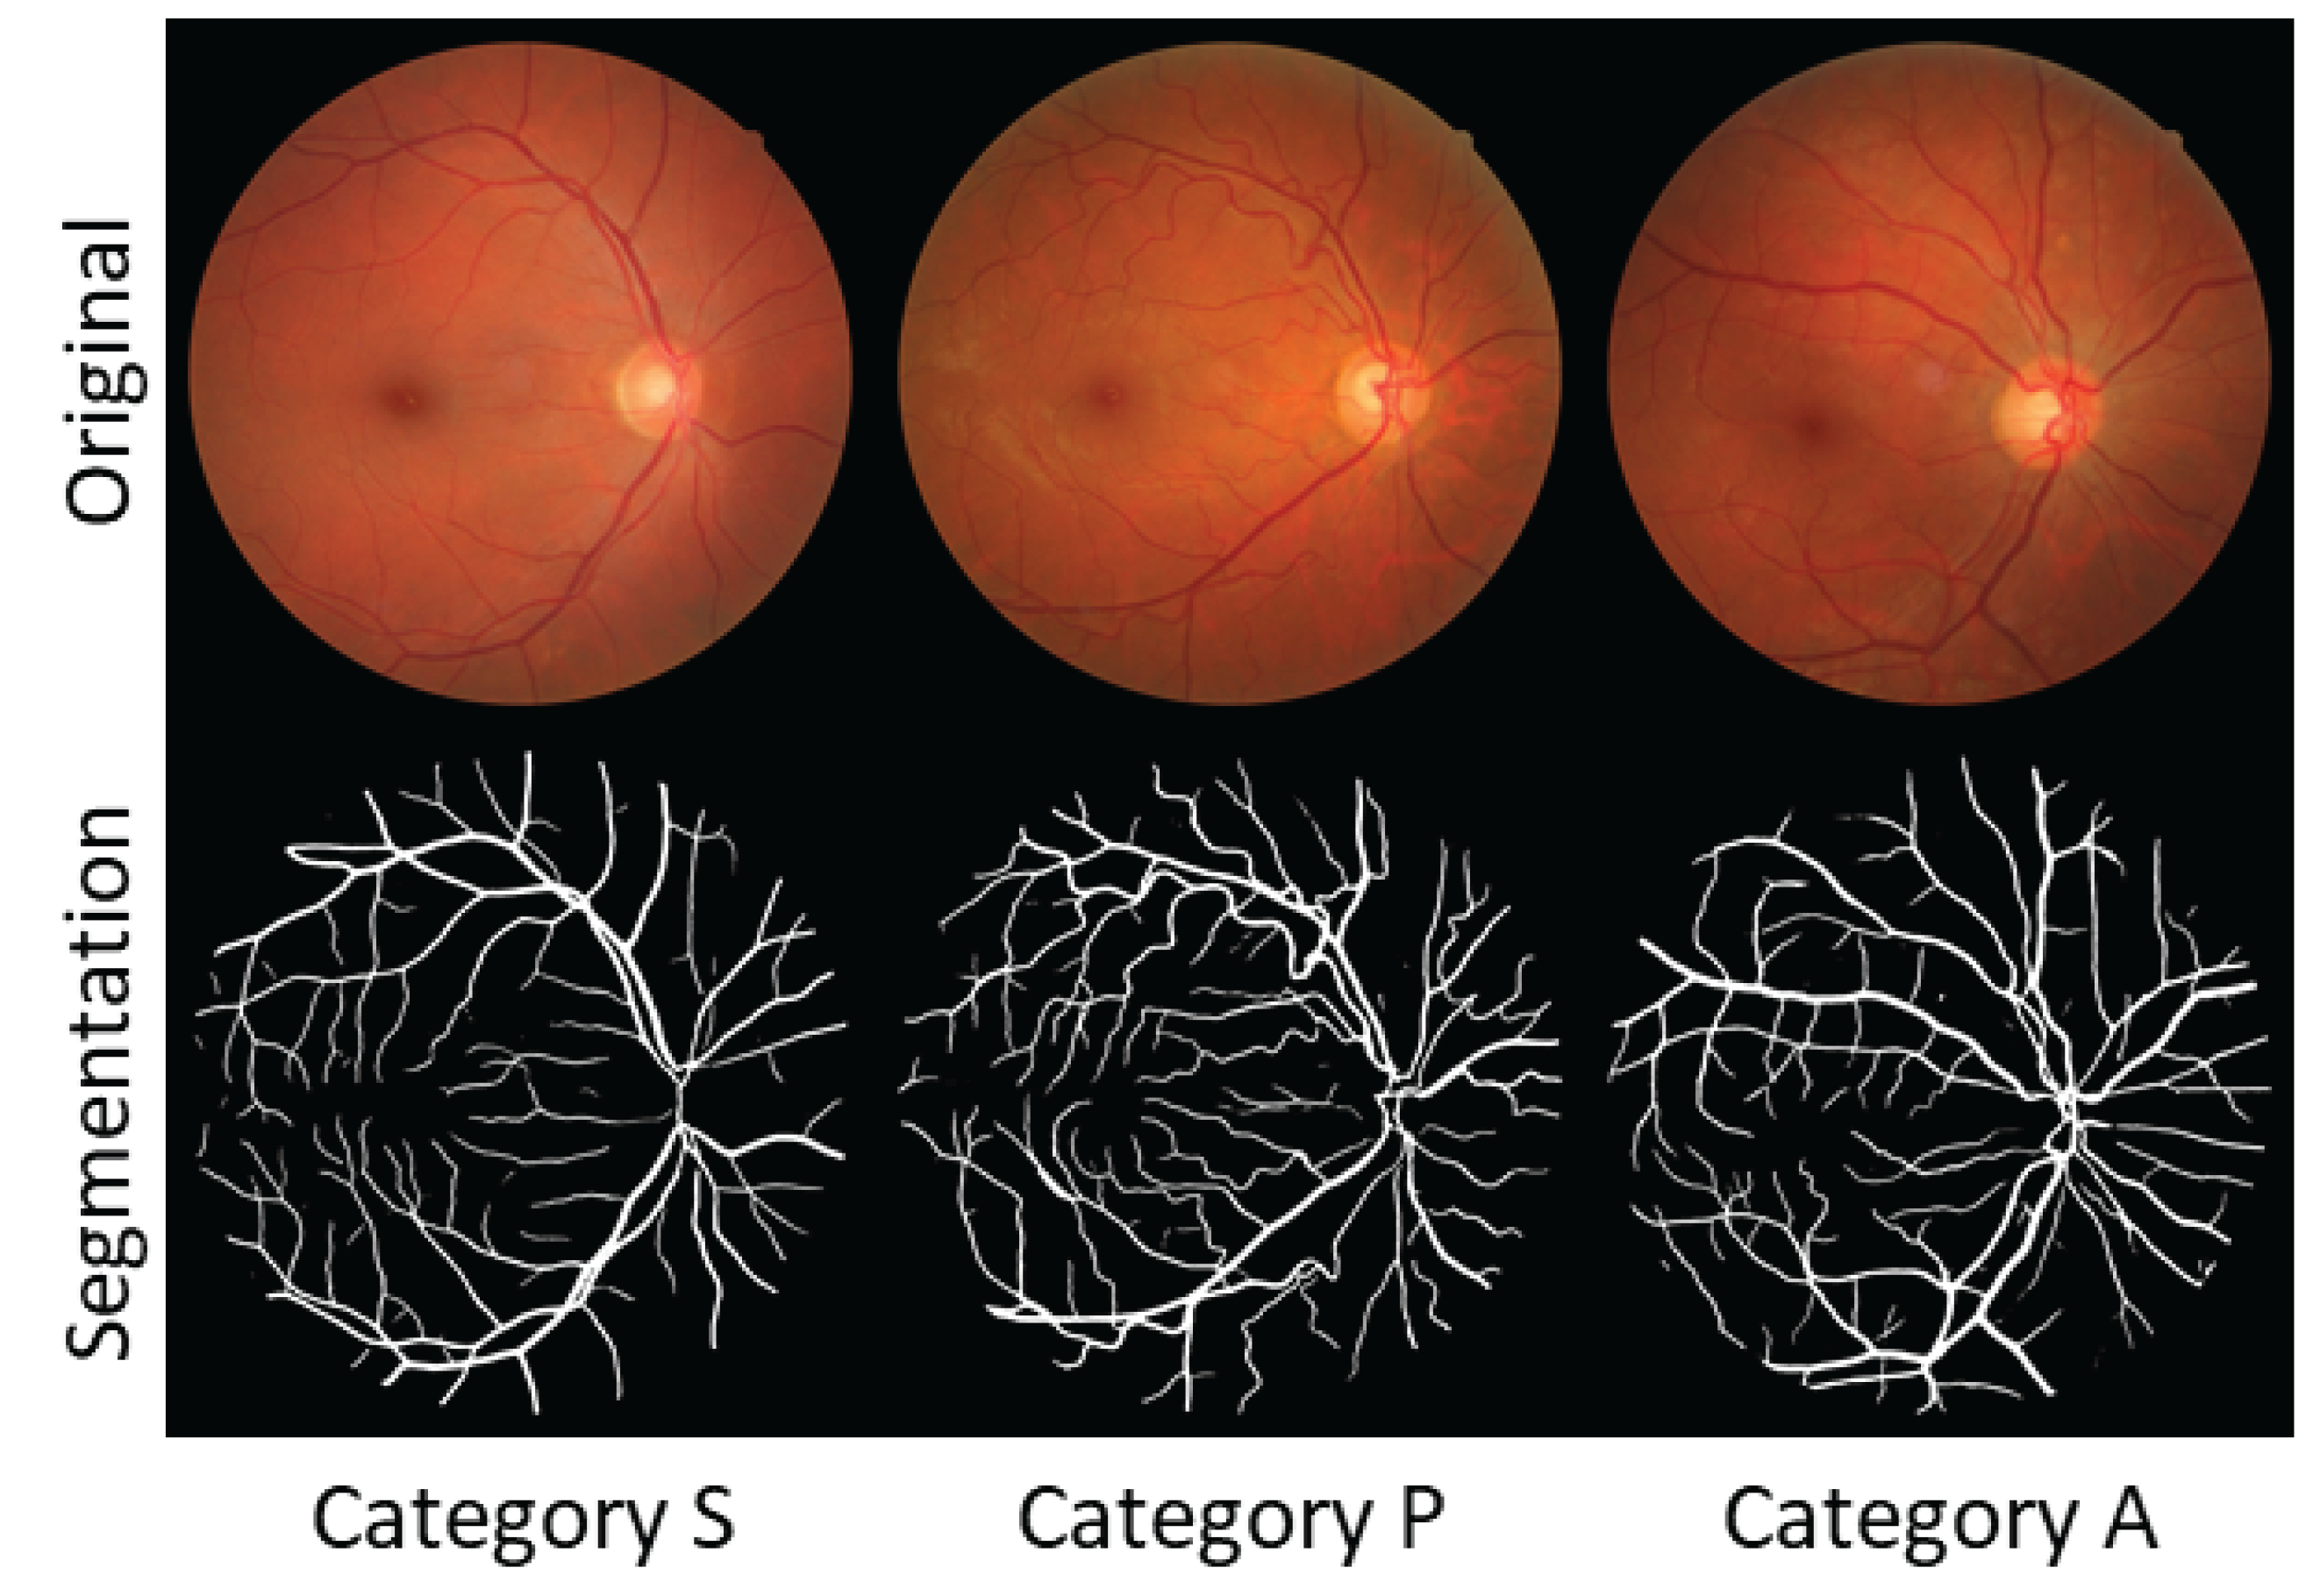
Figure 14.
Examples showcasing feature extraction methodologies corresponding to each method detailed in Table 4.
Figure 14.
Examples showcasing feature extraction methodologies corresponding to each method detailed in Table 4.
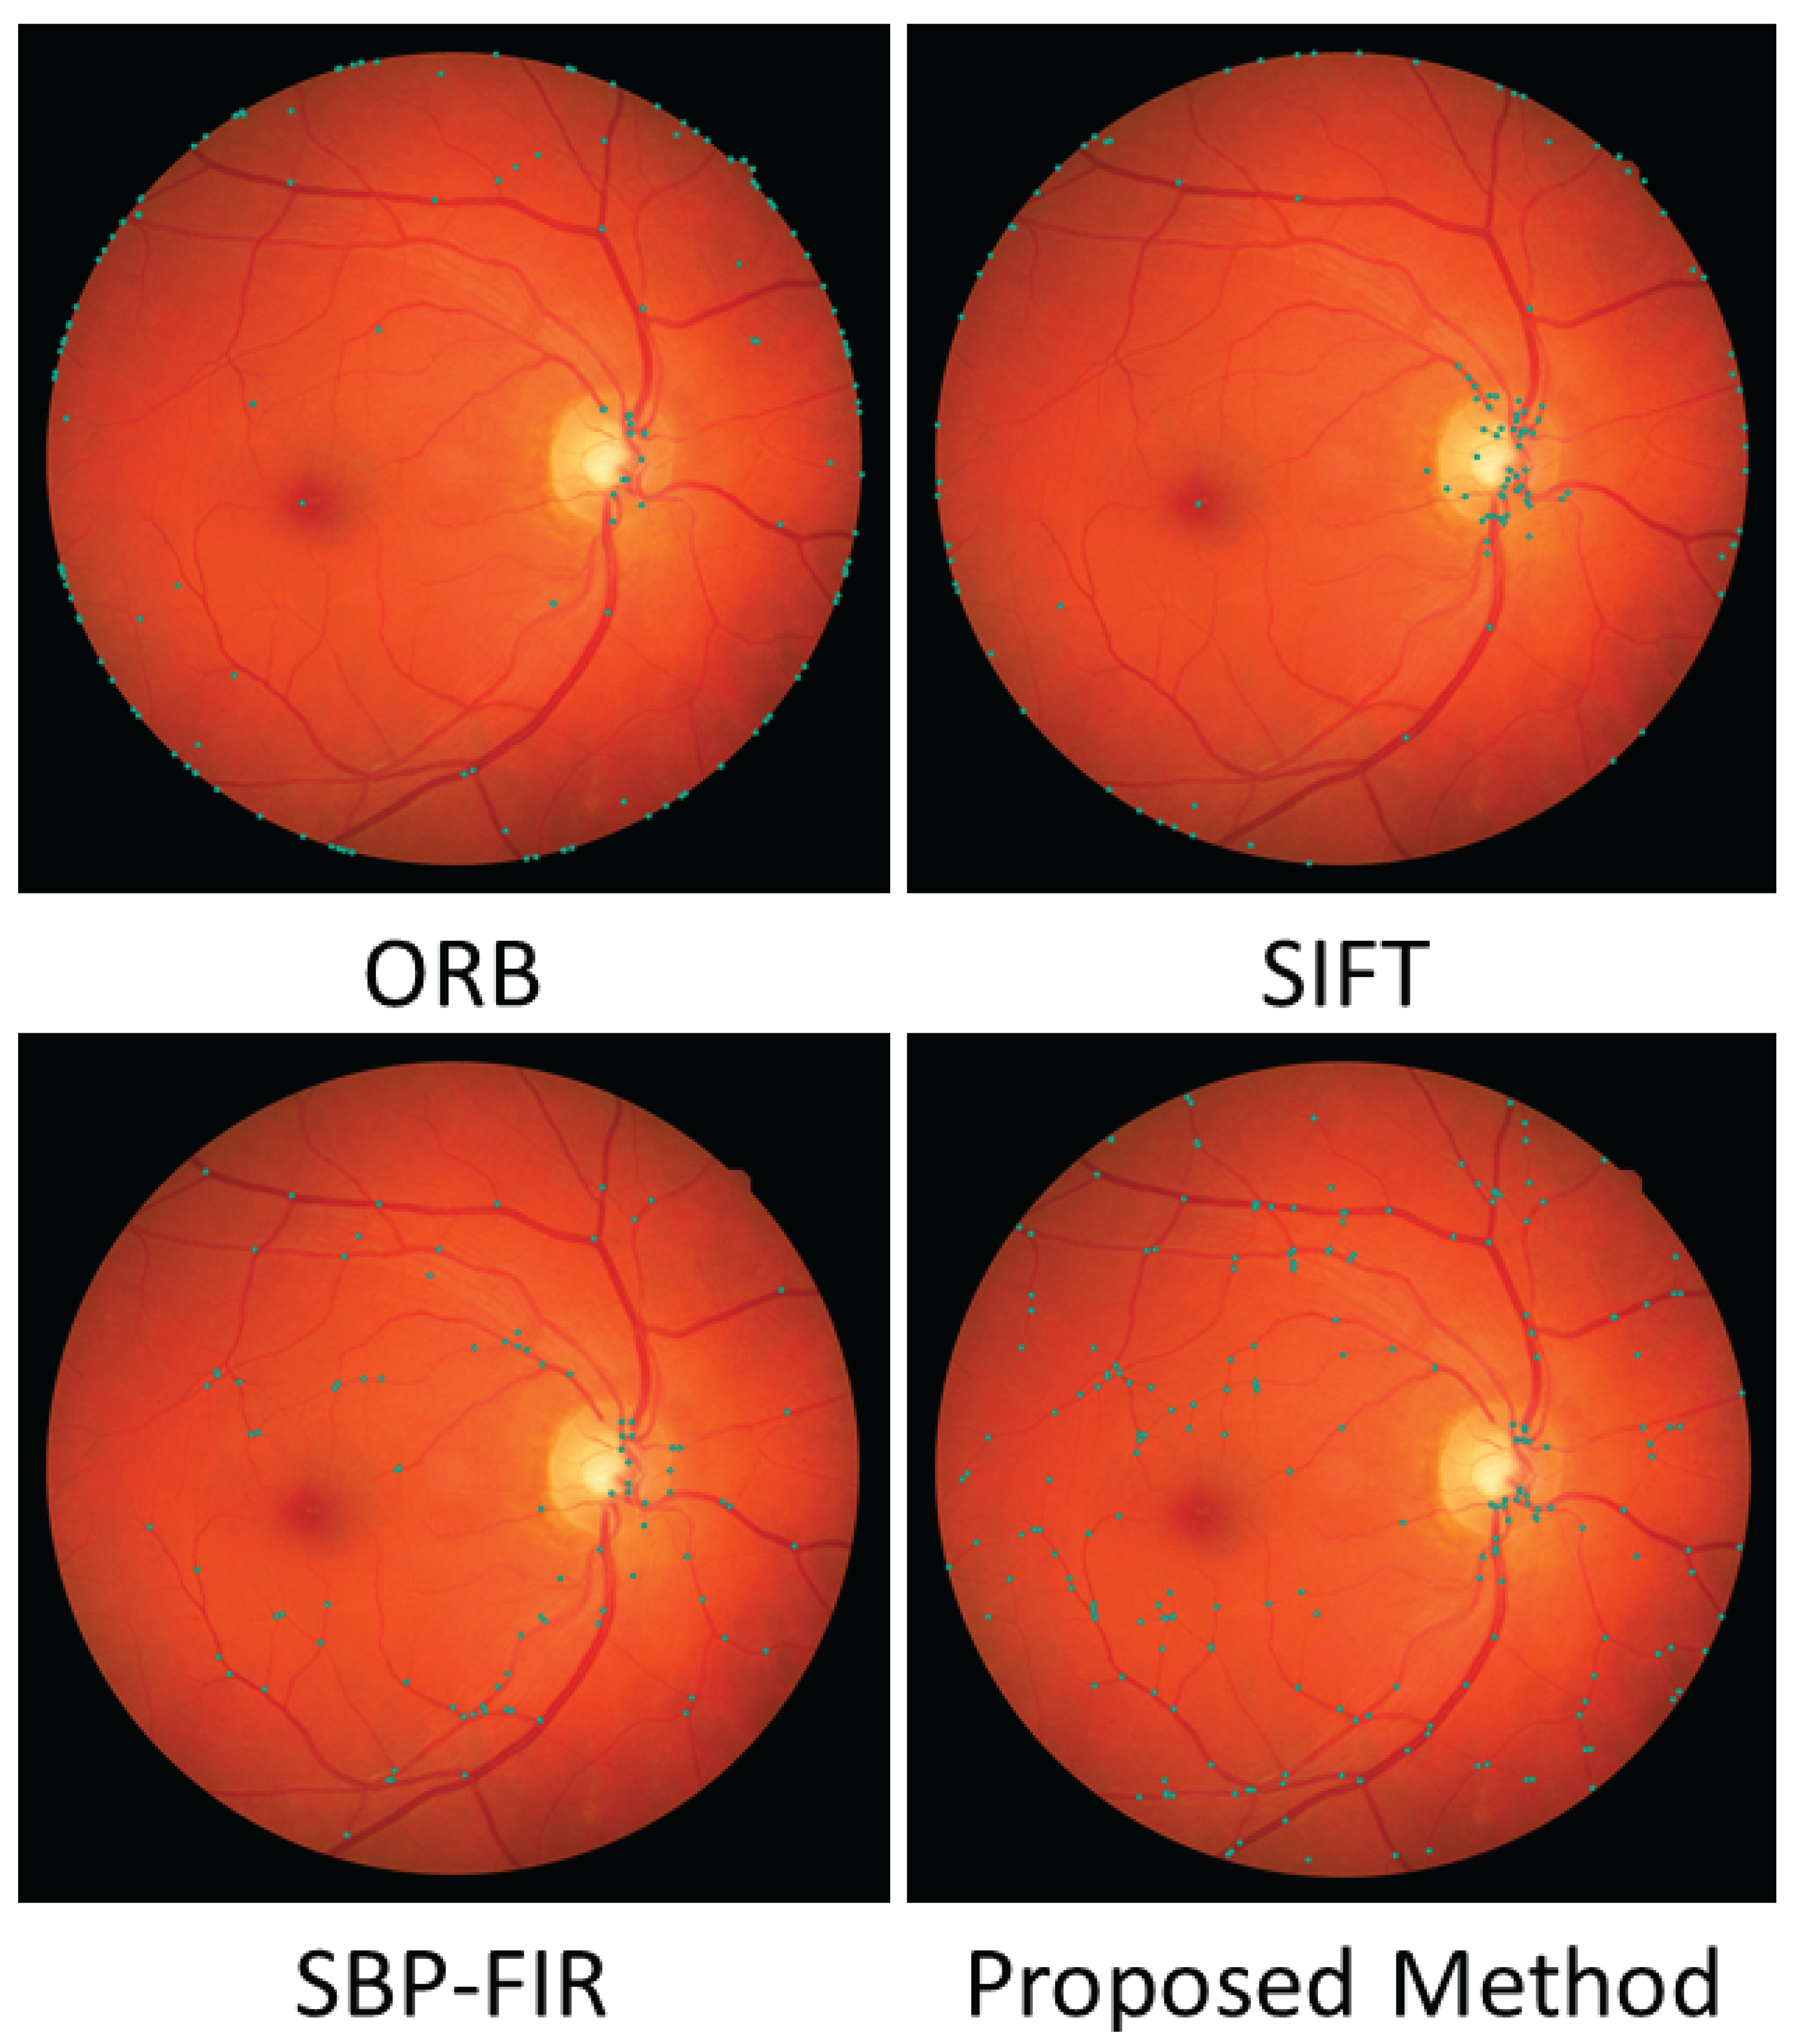
Figure 15.
Receptive field pairs employed during the feature description stage of the FREAK descriptor, illustrating those utilized in at least 50% of the feature points across the entire FIRE dataset.
Figure 15.
Receptive field pairs employed during the feature description stage of the FREAK descriptor, illustrating those utilized in at least 50% of the feature points across the entire FIRE dataset.
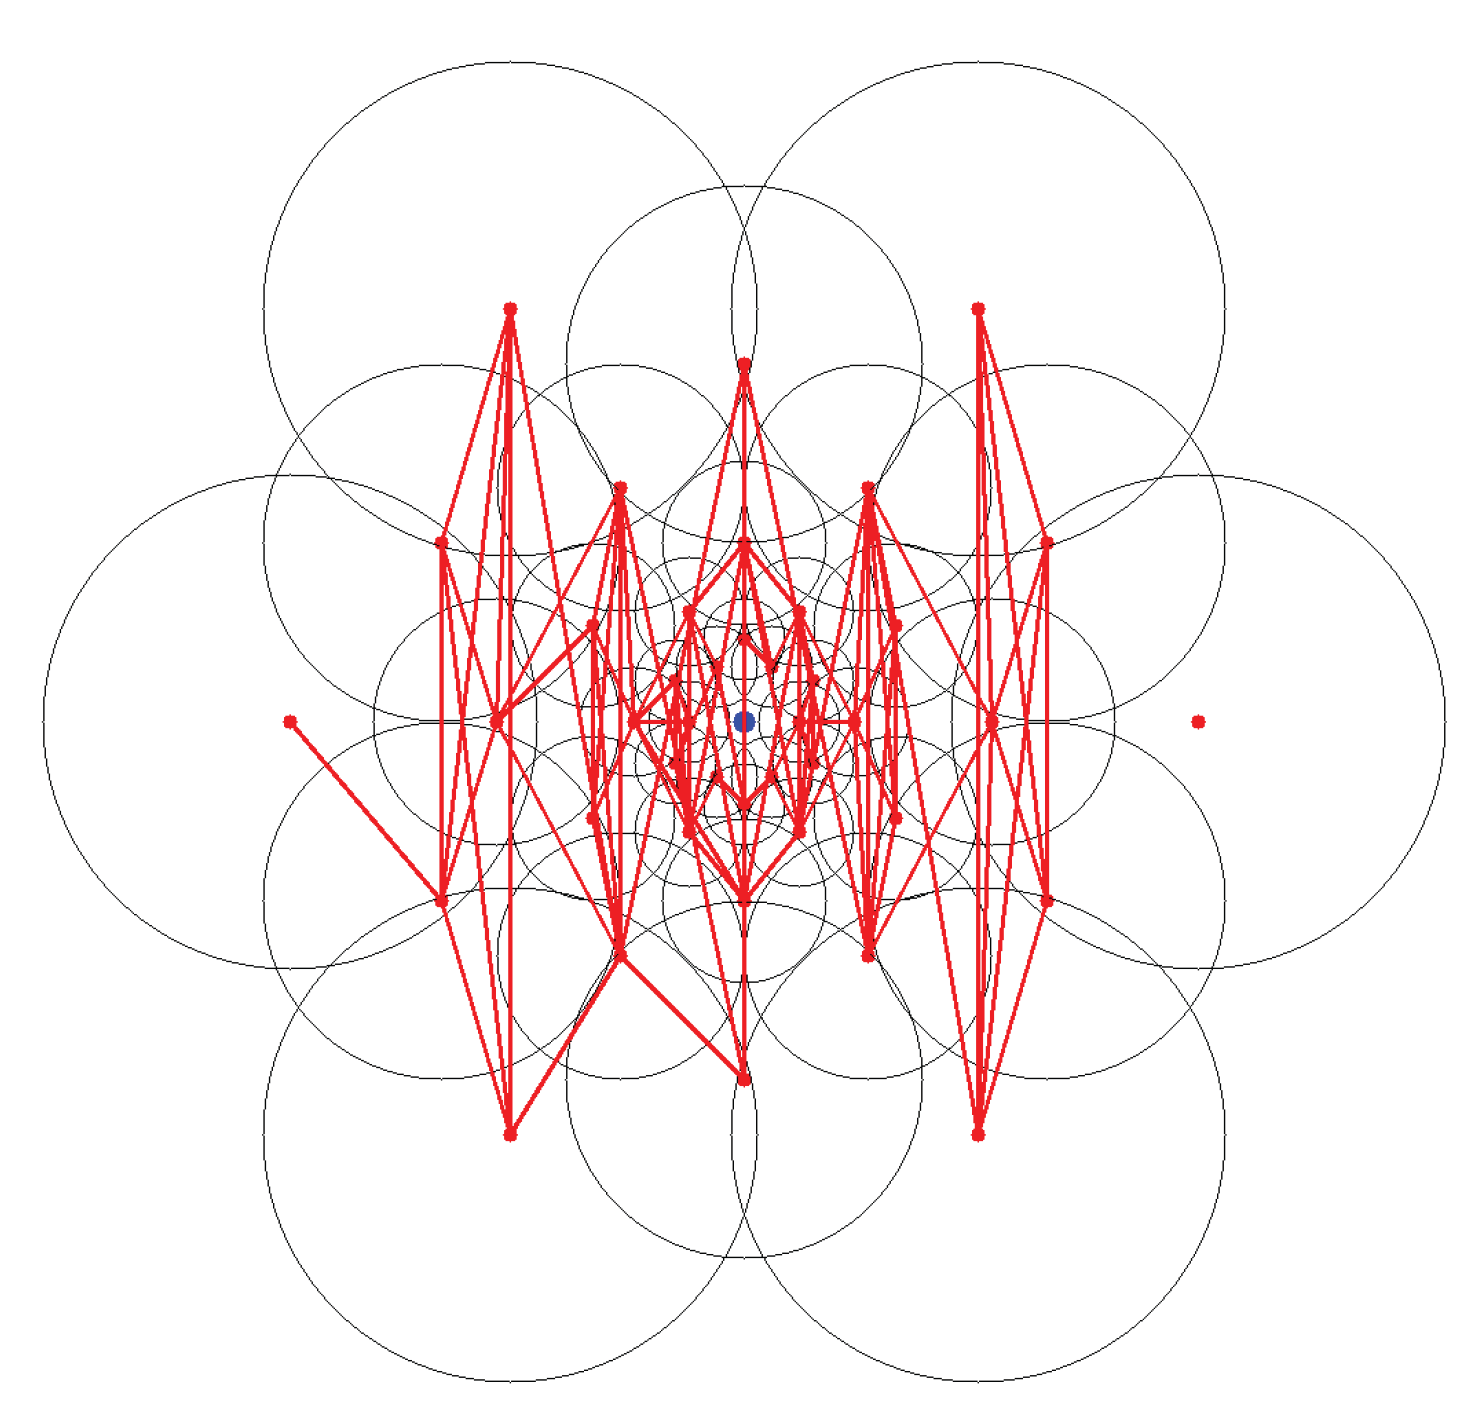
Figure 16.
Evaluation of retinal image registration techniques on the FIRE dataset, encompassing the outcomes of the proposed approach.
Figure 16.
Evaluation of retinal image registration techniques on the FIRE dataset, encompassing the outcomes of the proposed approach.
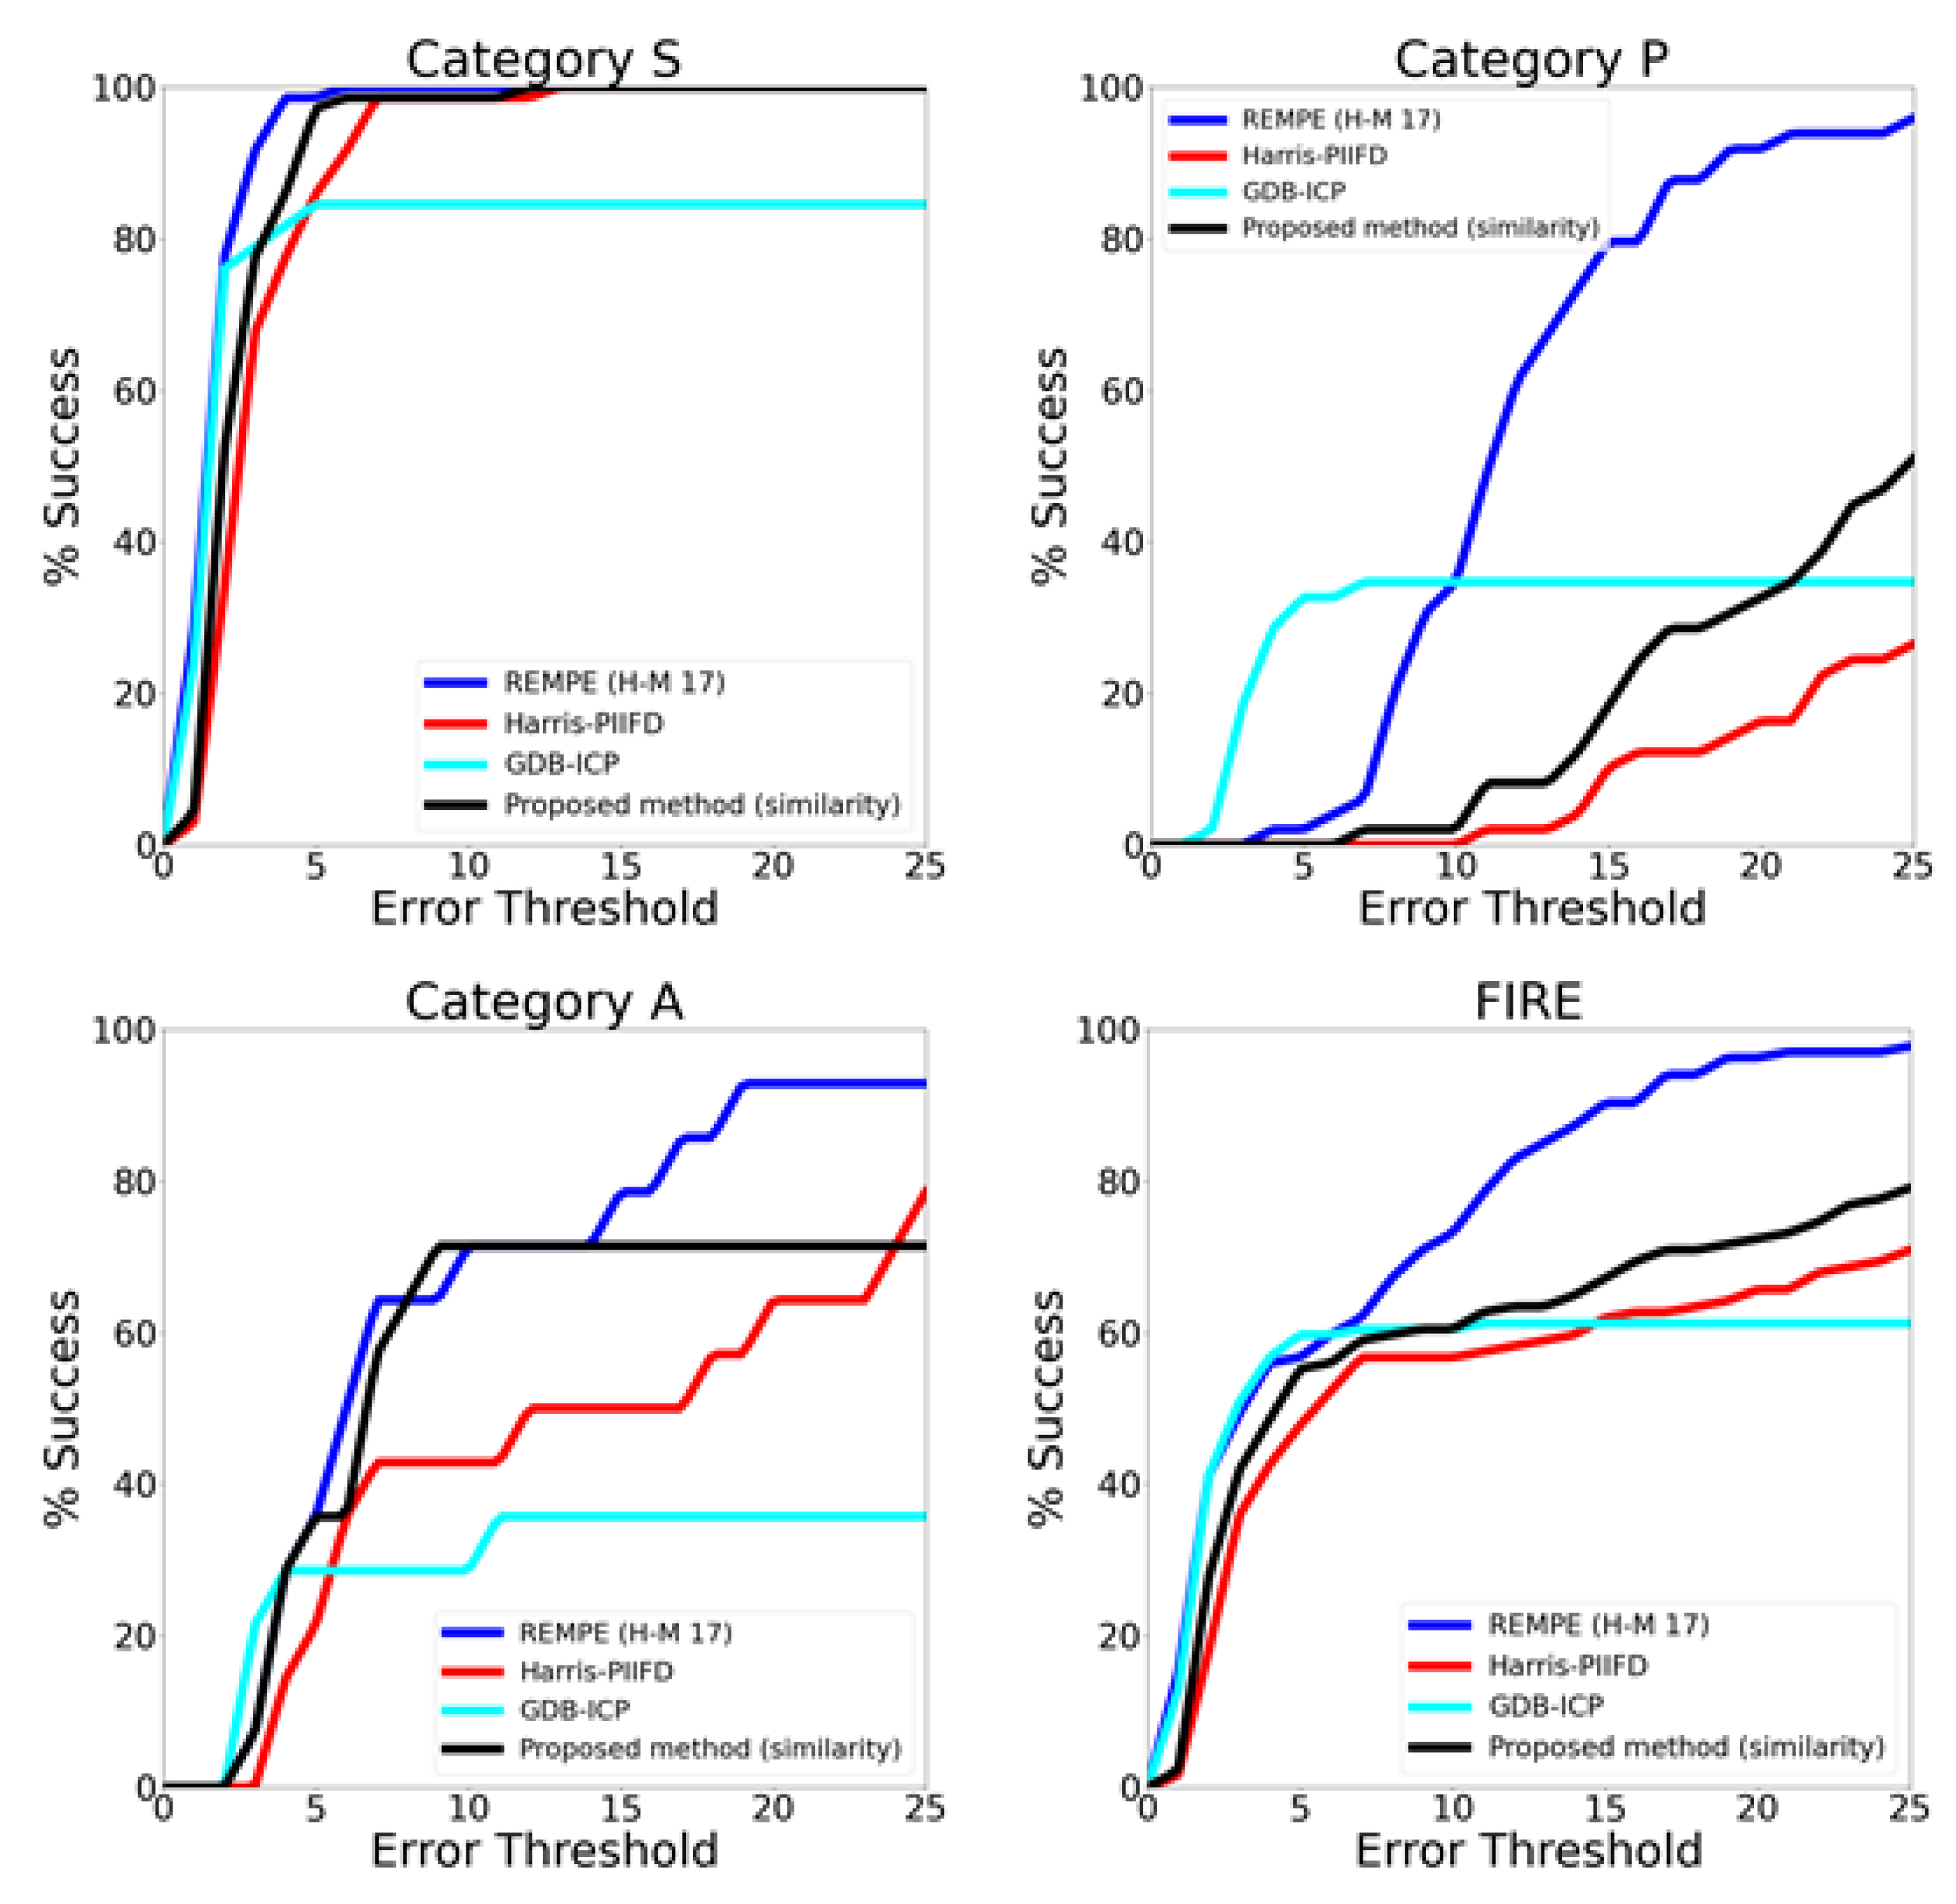
Figure 17.
Image pairs within the FIRE dataset showcase registration outcomes for super-resolution imaging (top row), image mosaicking (central row), and longitudinal study (bottom row).
Figure 17.
Image pairs within the FIRE dataset showcase registration outcomes for super-resolution imaging (top row), image mosaicking (central row), and longitudinal study (bottom row).
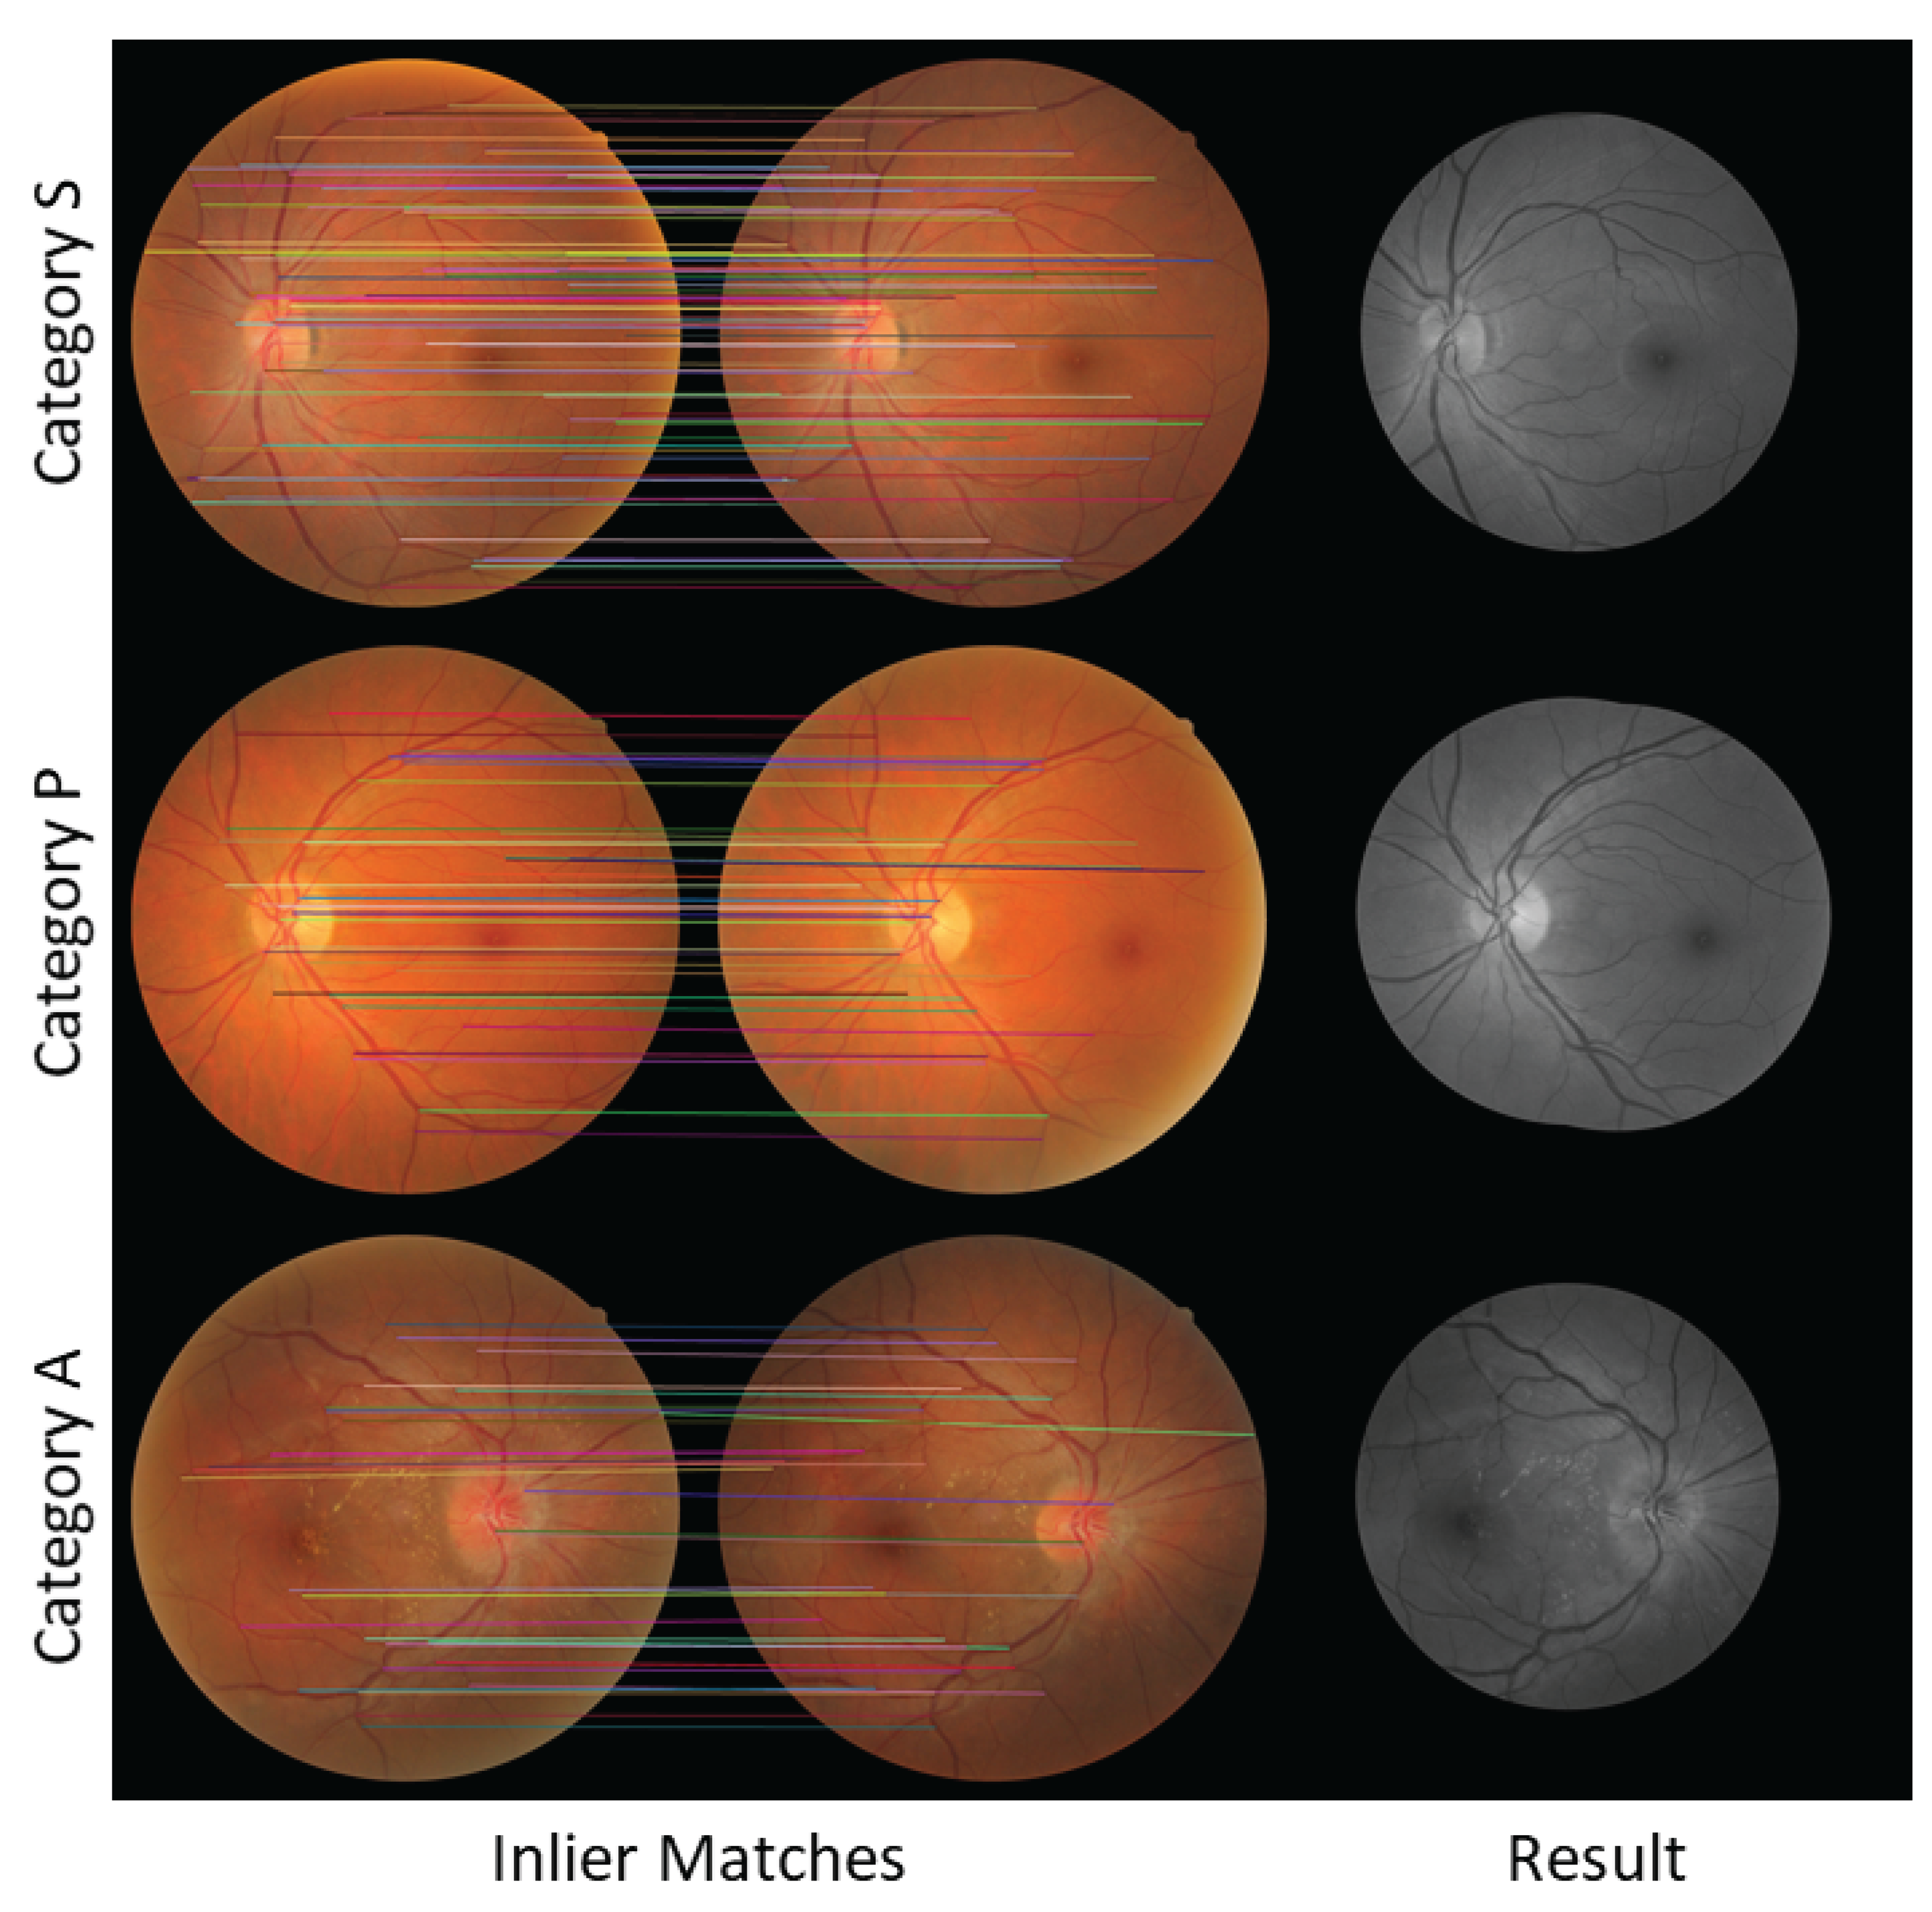

Table 1.
Summary of publicly available datasets used to evaluate the blood vessel segmentation network for the fundus image registration task.
Table 1.
Summary of publicly available datasets used to evaluate the blood vessel segmentation network for the fundus image registration task.
| Dataset | Year | Number of images |
Resolution | Disease | Annotators |
|---|---|---|---|---|---|
| STARE | 2000 | 20 | 605×700 | 10 healthy, 10 diseases | 2 |
| DRIVE | 2004 | 40 | 76884 | 33 healthy, 7 DR | 3 |
| ARIA | 2006 | 161 | 576×768 | 61 healthy, 59 DR, 23 AMD | 2 |
| CHASEDB1 | 2011 | 28 | 990×960 | 28 healthy | 2 |
| FIVES | 2021 | 800 | 2048×2048 | 200 healthy, 200 AMD, 200 DR, 200 glaucoma | Group |
Table 2.
Description of each category comprising the FIRE dataset.
| Total image pairs | Aproximate overlap | Anatomical changes | |
|---|---|---|---|
| Category S | 71 | >75% | No |
| Category P | 49 | <75% | No |
| Category A | 14 | >75% | Yes |
Table 3.
Datasets utilized to evaluate the performance of the U-Net architecture in blood vessel segmentation.
Table 3.
Datasets utilized to evaluate the performance of the U-Net architecture in blood vessel segmentation.
| Dataset | Number of Images | Intersection over Union |
|---|---|---|
| STARE | 20 | 0.5402 |
| DRIVE | 40 | 0.5602 |
| ARIA | 161 | 0.4532 |
| CHASEDB1 | 28 | 0.6326 |
| FIVES | 200 | 0.7559 |
Table 4.
Comparison of mean feature point count and entropy values among ORB, SIFT, SBP-FIR and the proposed method.
Table 4.
Comparison of mean feature point count and entropy values among ORB, SIFT, SBP-FIR and the proposed method.
| ORB | SIFT | SBP-FIR | Proposed Method | |
|---|---|---|---|---|
| Average number of feature points | 241 | 164 | 125 | 222 |
| Average entropy | 5.6809 | 5.9600 | 6.4245 | 7.0137 |
Table 5.
Comparison of the Area Under the Curve (AUC) values for diverse fundus image registration methods, along with their corresponding execution times in seconds and the respective transformation models utilized.
Table 5.
Comparison of the Area Under the Curve (AUC) values for diverse fundus image registration methods, along with their corresponding execution times in seconds and the respective transformation models utilized.
| Category S |
Category P |
Category A |
FIRE | Execution Time |
Transformation Model |
|
|---|---|---|---|---|---|---|
| REMPE (H-M 17) [20] | 0.958 | 0.542 | 0.660 | 0.773 | 198 | Ellipsoid eye model |
| Harris-PIIFD [55] | 0.900 | 0.090 | 0.443 | 0.553 | 13 | Polynomial |
| GDB-ICP [56] | 0.814 | 0.303 | 0.303 | 0.576 | 19 | Quadratic |
| ED-DB-ICP [57] | 0.604 | 0.441 | 0.497 | 0.553 | 44 | Affine |
| SURF+WGTM [58] | 0.835 | 0.061 | 0.069 | 0.472 | – | Quadratic |
| RIR-BS [59] | 0.772 | 0.004 | 0.124 | 0.440 | – | Projective |
| EyeSLAM [60] | 0.308 | 0.224 | 0.269 | 0.273 | 7 | Rigid |
| ATS-RGM [61] | 0.369 | 0.000 | 0.147 | 0.211 | – | Elastic |
| SBP-FIR [9] | 0.835 | 0.127 | 0.360 | 0.526 | – | Similarity |
| Proposed Method | 0.903 | 0.159 | 0.562 | 0.596 | 96 | Similarity |
Disclaimer/Publisher’s Note: The statements, opinions and data contained in all publications are solely those of the individual author(s) and contributor(s) and not of MDPI and/or the editor(s). MDPI and/or the editor(s) disclaim responsibility for any injury to people or property resulting from any ideas, methods, instructions or products referred to in the content. |
© 2024 by the authors. Licensee MDPI, Basel, Switzerland. This article is an open access article distributed under the terms and conditions of the Creative Commons Attribution (CC BY) license (http://creativecommons.org/licenses/by/4.0/).
Copyright: This open access article is published under a Creative Commons CC BY 4.0 license, which permit the free download, distribution, and reuse, provided that the author and preprint are cited in any reuse.


