Submitted:
13 March 2024
Posted:
14 March 2024
You are already at the latest version
Abstract
Brushless Direct Current Motors are significantly improved for using many electrical applications. The design investigation is increased year by year and most of the motor design researchers find out the superior efficiency of the BLDC motor. The traditional motor consumed more electrical power than BLDC motor. The design of BLDC motors that are compact, small, easy to control, save energy and light weight. Due to this fact, the design of BLDC motor should be analyzed to improve the motor characteristics performance. The research focuses on the design of BLDC motor performance using Taguchi Method and Response Surface Methodology (RSM) for Finite Element Method (FEM). Firstly, the Taguchi Method is applied to identify the optimization point of design parameters and consider using the reference model of actual BLDC electric fan motor with a rated power of 26Watts design. Based on the Taguchi Method to create the RSM is used to two-step optimization design performance using in FEM analysis. The performances of motor design proposed approach to provide the effeteness for motor design investigator. In this investigation aims the better structural performances in output power, torque, efficiency and torque ripple. The final design of proposed model achieved an energy efficiency is 10% higher than the reference design of prototype modes, the output power result is 10W higher this reference design. We can reduce the loss of the proposed motor design. Furthermore, the maximum torque can also increase the 0.032Nm of that design. The design simulation results were produced and studied by the FEM analysis of JMAG software. From the evaluation results, the configurations of reference model design are compared with the proposed design by using the three methods of motor design optimization showed the best characteristics for performance of motor investigation design.
Keywords:
outer rotor BLDC motor
; taguchi method
; response surface methodology (RSM)
; finite element method (FEM)
; magnetic flux density
; torque
1. Introduction
Brushless DC (BLDC) motors are becoming popular for electrical applications and industrial processes replaced by the using of traditional induction motors. According to the International Energy Agency (IEA) analysis report, the global electricity consumption in motors are about more than 46% of the total electricity [1,2]. The significant of traditional motors in industrial production is role of the largest power consumption. This power consumption is one of the facts of global warming and climate changes. The Paris Agreement, with Intended Nationally Determined Contributions (INDCs) is pointed to contribute the carbon dioxide reduction [3] and we also supported the industrial process to replace the BLDC motor instead of using traditional motor. The BLDC motors can be used in many electrical applications such as electric fans, water pumping, rolling machines in various industries and electric vehicles [4]. The performance of BLDC motors is higher than other kinds of motors and the electricity consumption is lower. The using of BLDC motor can also help the save the energy to slow down global warming and eco-friendly [5]. In the worldwide market of the electric fan, the BLDC motor demand market is increased year by year. In 2023, this report predicted around 9.6 billion US dollars to 15.2 billion US dollars by 2025. This is the big jump of the BLDC motor demand [6]. Moreover, the BLDC motor can produce high efficiency, and low noise of operation than other types of motors because the rotor part of the motor has permanent magnet can make the linearly magnetic flux line and smooth of current and voltage to effect of other noise from this motor [7].
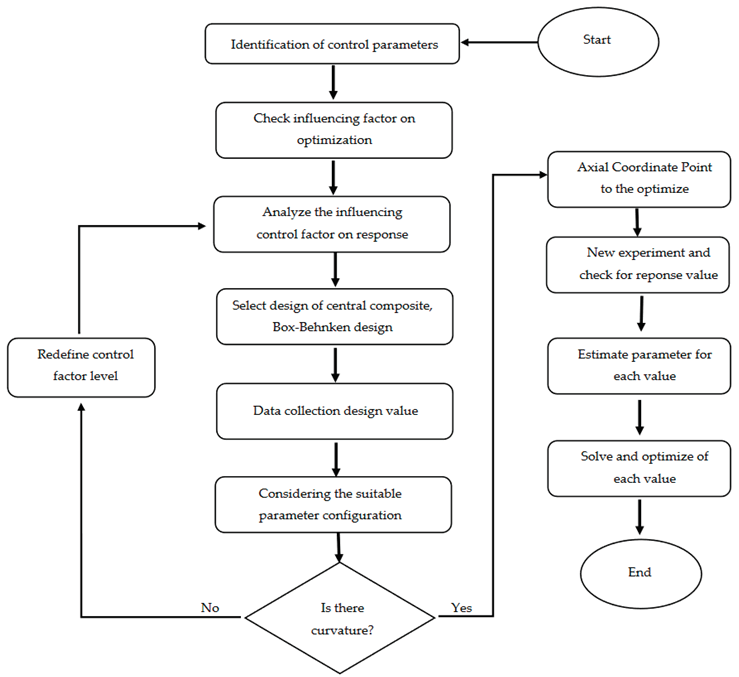
In this investigation, we can also focus on the design development for the following Figure 1. In this figure shows the producer of the motor design study under two-steps method of the FEM analysis. Firstly, we can make the market survey of the electric fan. According to this market, 93.5% is above the normal state of this survey for energy saving for using the BLDC motor electric fan as shown in Figure 2. The saving energy of the electric fan in real market can be the reference design and achievement of the proposed design is to be high performance of motor design. Therefore, we also find out the optimized parameter using hand calculation and with help of the JMAG software under the FEM analysis method.
2. Configuration of Reference Model Design and Materials
The design calculation of the outer rotor BLDC motor can be used in following equation. In this motor can calculated into torque development equation in Tmax is the torque development of motor in Nm, P is number of poles, Bg is air gap flux density in the electrical degree of 120 in Wb/m2, Ic is current through a conductor in amperes, ns is the number of stator slot, L is conductor length in mm, Rinner is inner radius of stator in mm [7];
Tmax = 2 P Bg Ic ns L Rinner
The magnet flux density is shown in equation (3). The magnetic flux density of the magnet is the relationship between the reluctance of air gap and magnet. The coefficient of reactance k is constant value [8]. In this study, to calculate the outer rotor BLDC motor design of material can be calculated by following equation.
{D} = [e]{S} – [eS]{E}
In equation (4) and (5) are show the relative permittivity of the material in term of electric displacement vector {D} in (C/m2), [e] is the Piezoelectric stress constant matrix e (C/m2), [ eS ] is permittivity matrix (F/m), {S} is Strain vector, {E} is the vector for electric field intensity (N/C) [9].
The characteristics of the flux density and magnetic field of china steel 50CS1300 is shown in Figure 3. In this figure gives the material of China steel 50CS1300. This material can use in the proposed model of motor in both the stator and shaft for the rotor parts. The following figure is the specification of china steel material configuration. In this material, the magnetic flux is range is 1.5T to 1.8T. In proposed motor, the magnetic flux is not exceeded to 1.8T value.
The magnet is magnetized to saturation point in closed circuit and the B-H curve characteristics of Ferrite-magnet of NMF-6C magnet has 0.5T of the flux density. The following Figure 4 provides a hysteresis loop of the relationship between the magnetic induction (B) and the magnetizing force(H). In this curve describes the magnetic field strength of the negative coercivity value of -270kA/m is approach to the zero value of the magnetic flux density. In this case the coercivity of the magnetic field strength reduced the magnetization to zero after the magnet has been saturated [9,10].
Since the reference value of the outer rotor BLDC motor with application of electric fan is used to measure the specification of the parameters. The cross section of the geometric parameters is shown in Table 1. At the initial stage of development, it is not feasible to pursue optimization for the proposed model. Instead, we are leveraging a reference model design for the prototype. The provided Table I presents the cross-section details of the reference prototype design for an outer rotor BLDC motor. This design is based on precise measurements derived from real fan application specifications. Rather than embarking on initial optimization, we are utilizing the reference model’s cross-section as a foundation for the prototype design. This approach ensures alignment with the specific requirements of the fan application.
The reference design and modeling of motor using in JMAG software is used the following specifications and data in Table 2. In this table includes dimensions, material properties, and any specific electromagnetic characteristics relevant to your motor design. This involves setting up the geometry of the motor, defining the suitable material shown in Figure 3 and Figure 4 of the rotor and stator of the motor, sources of electromagnetism and specifying boundary condition as shown in Figure 5.

Table 2.
Input parameters value of reference motor design.
| Parameter | Value | Unit |
|---|---|---|
| Depth of stator slot (Dss) | 10 | mm |
| Width of stator tooth (Wst) | 4.5 | mm |
| Width of stator slot-opening (Wso) | 2 | mm |
| Height of stator tooth tang (Hst) | 0.801 | mm |
| Angle of stator tooth tang (α) | 27 | degree |
| Number of turns (N) | 82 | turns |
| Magnet thickness (Mt) | 3.5 | mm |
| Stack height (H) | 4.5 | mm |
In this reference motor design is measured in the real simulation for motor testing machine. The motor testing machine data and software simulation result are same result. The testing machine result of the reference motor can be shown in Figure 6. This figure shows the efficiency, output power and voltage the reference design. These output values are used to improve of the design study for optimization.
The following Figure 7 shows the using the parameter of the reference design measure for output result simulation result. According to Figure 6 and Figure 7 results, the output power, voltage and efficiency of the motor results can be shown in Table 3.
Table 2.
Comparison between testing machine and software result.
| Parameter | Testing machine | Software |
|---|---|---|
| Efficiency | 72.92% | 72.76% |
| Voltage | 24.09V | 24.06V |
| Output power | 26.14W | 24.06W |
| Speed rank | 2314~5528rpm | 550~5560rpm |
This near-identity between simulation and test data is a very important key factor in the study as it confirms the reliability and accuracy of the simulation software used in this study. Using in testing machine can find the speed in only the rating condition of 2314~5528 rpm. Although software can give the whole operation process for speed of the stating, running and rated speed range in 550~5560 rpm. These simulation results can therefore be relied upon with confidence as a basis for further exploration and improvement of the design process, and to facilitate this purpose, reference models derived from the simulation results were incorporated into the study of this section.
In addition, this study also made in-depth application of Taguchi method and Response Surface Methodology (RSM). These methodologies are core components of this research and are designed to increase efficiency and effectiveness within our field. Through these technologies, the research process is not only optimized, but also the overall efficiency is successfully improved [10,11].
3. Taguchi Method and Response Surface Methodology (RSM)
This section can be divided into three parts. These parts of the design study under the Taguchi method, RSM and modified by the Taguchi method base on RSM.
3.1. Taguchi Method
The Taguchi method is a prominent experimental design technique that can enhance product quality by the optimization design parameters [11]. The optimization of the design parameters of the control factor are selected to the reference motor part of the dimension parameters. Each control factor has different levels, representing the different settings or values it can take. The selecting control factor of the Taguchi method is first considering process to improve the characteristics of the motor performance. The Taguchi method uses these specially designed matrices to study a large number of variables with a minimal number of experiments. This approach significantly reduces the time and resources needed for experimentation. The main objective is to improve the performance of the product or process, like a BLDC motor, by optimizing the control factors. This involves finding the best combination of control factor levels that produce the most robust and high-quality outcome. By focusing on the control factors and seeking a design less sensitive to noise factors, the Taguchi method helps in achieving an economically efficient design. It reduces the need for expensive alterations to handle noise factors, as the optimized design inherently copes better with these variations. In the Taguchi method, noise factors are variables that cannot be controlled or are too costly to control. For a BLDC motor, these might include environmental conditions or usage variations. In contrast, control factors are those that can be easily adjusted. The goal is to minimize the impact of noise factors by optimizing control factors [11,12,13,14,15,16].
In this method, the control factor of the BLDC motor is selected the following control Table 4.
In the selected control factors of stack height for proposed model of the value range is 3mm to 4mm because of the stack height depend on the speed of the motor in the operation condition of the motor performance. The speed of the proposed model is 8700 rpm at the stack height of 3mm. For this range can give the suitable value of the proposed model characteristics for motor performances. The control level of the number of turns, width of slot opening, depth of stator slot and angle of stator tooth tang are also corresponding to increase and decrease range of the torque, efficiency and magnetic flux will happen in this range of 17degree to 37 degree for angle stator tooth tang, 2.8mm to 4 mm for the width of stator tooth, 8 mm to 12mm for depth of stator slot, 1.5mm to 3mm for width of stator slot opening. Using this orthogonal array for different levels of control factors will calculated by the following Table 5 is the S/N ratio of the different values of control factors.
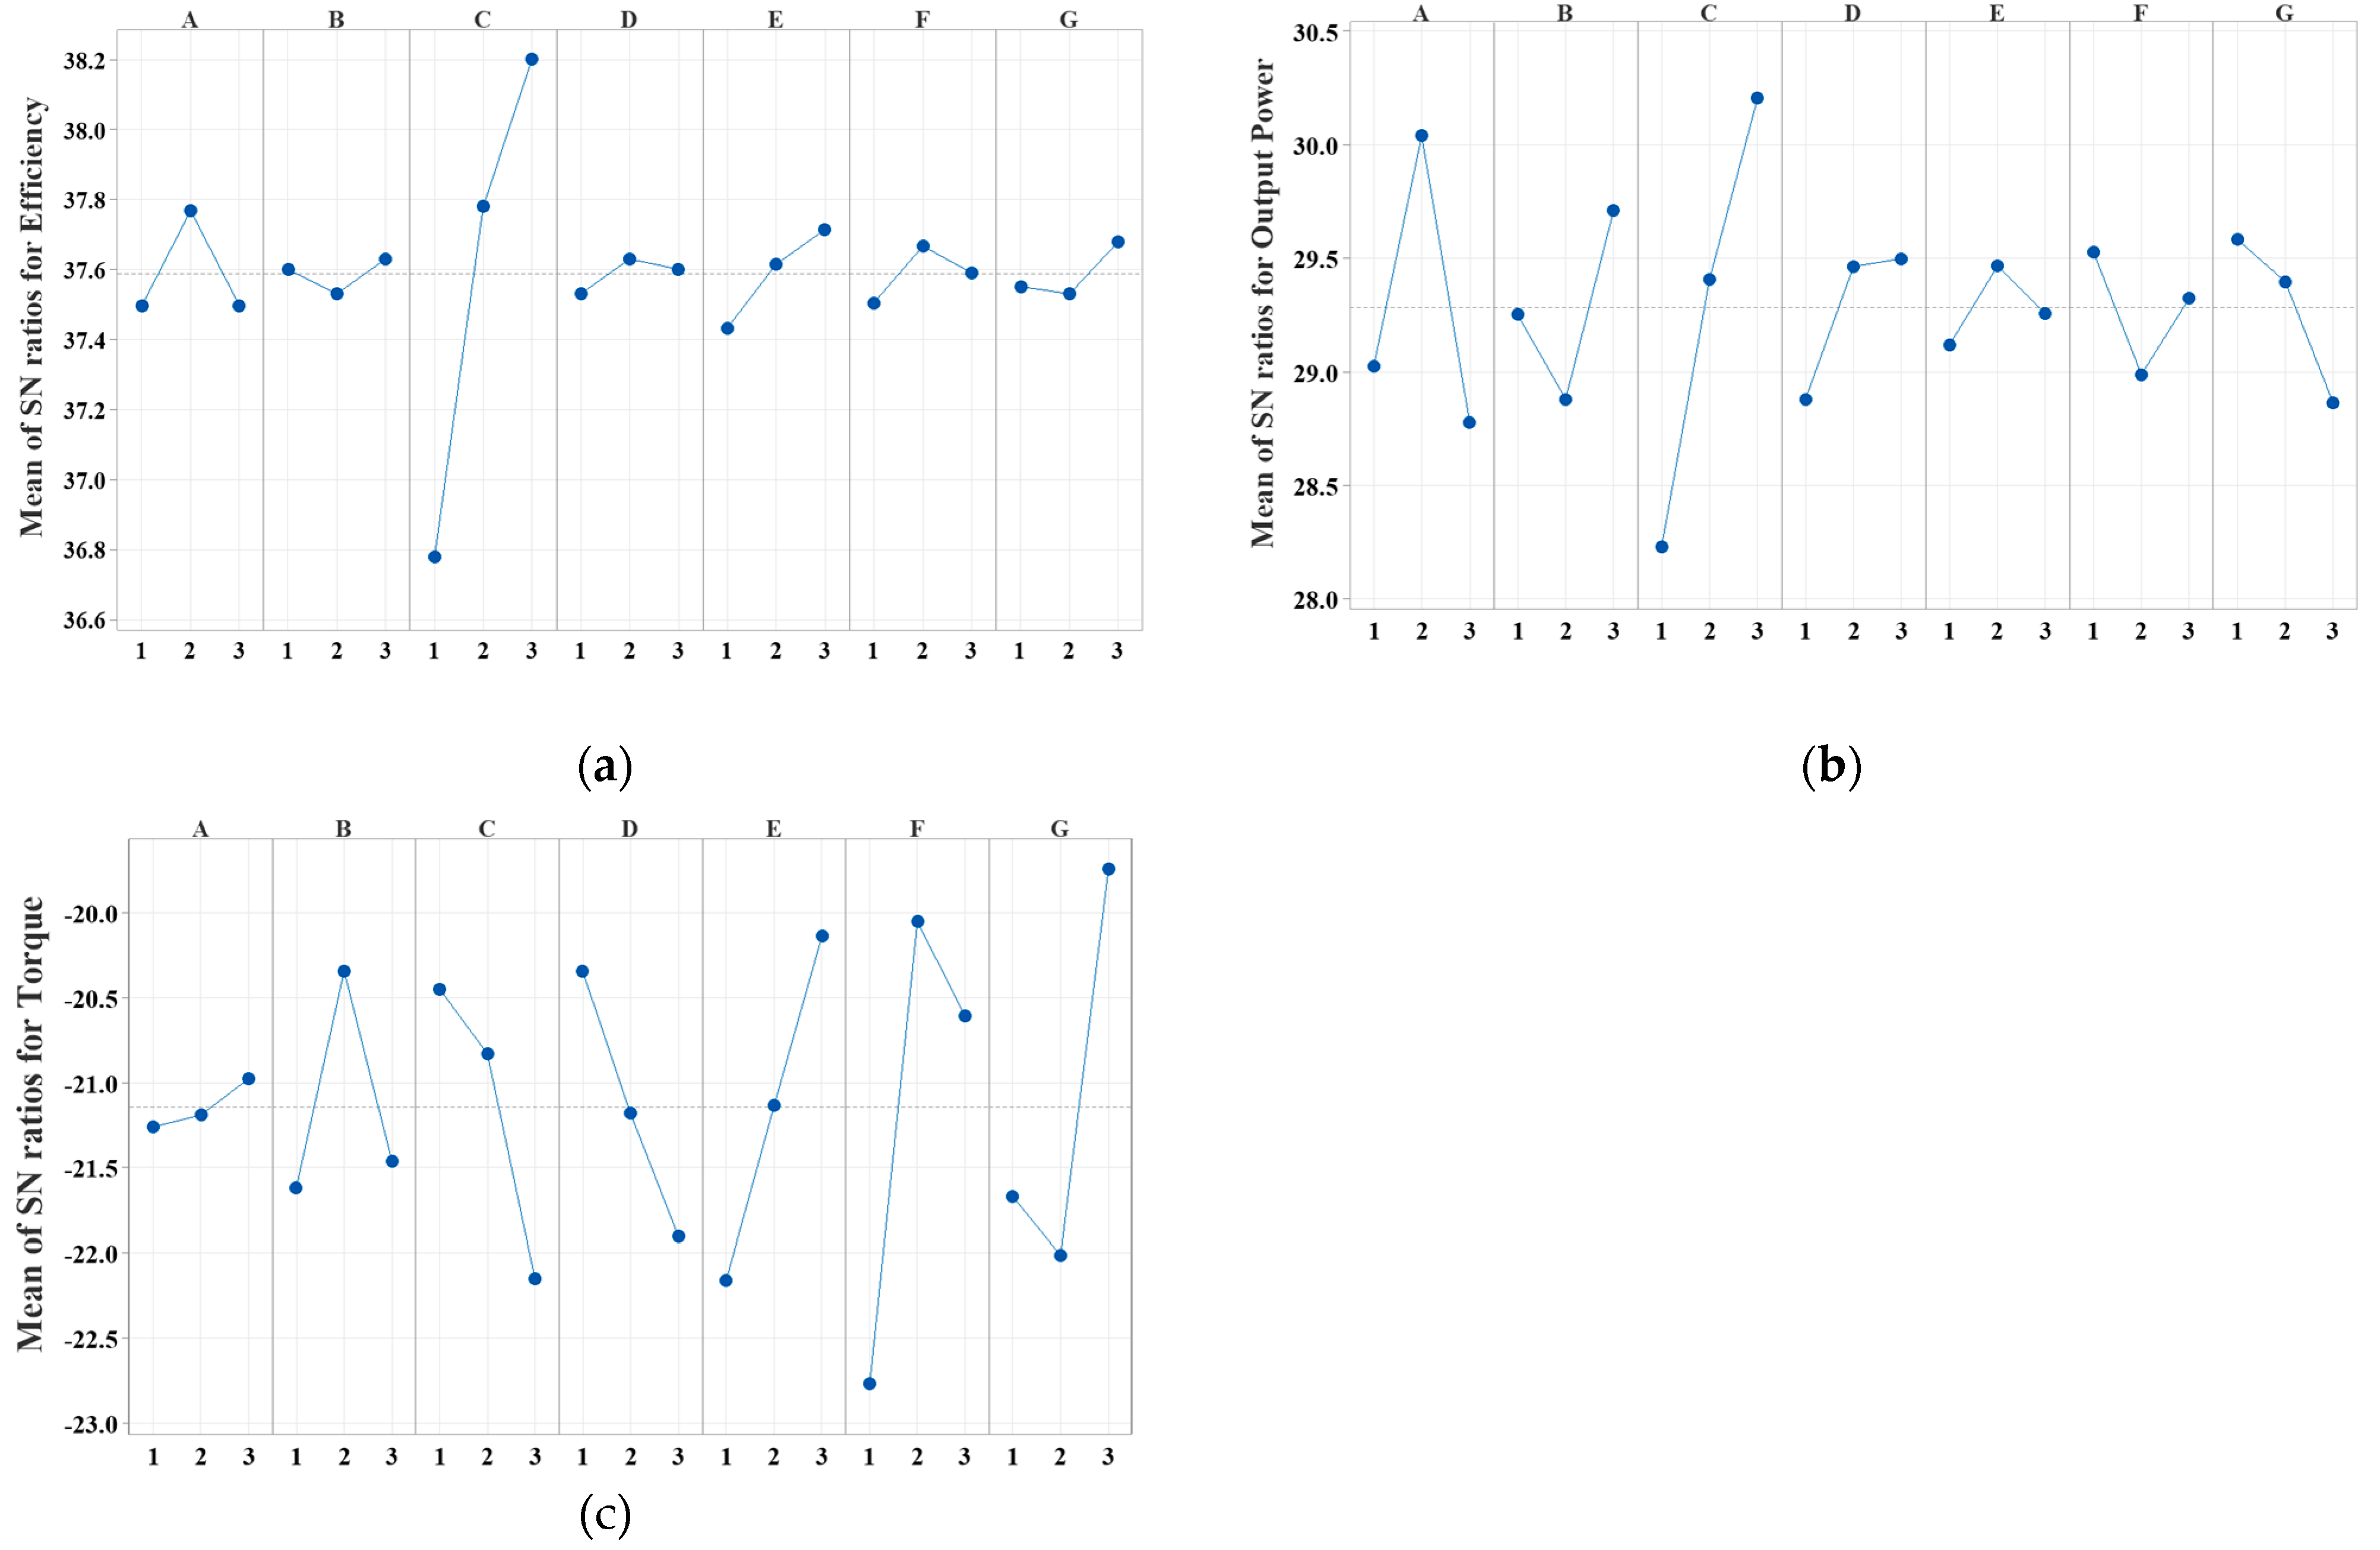
The orthogonal array of the Taguchi method in this Table 6 shows the FEM analysis of the simulation result. In this result can be the rated speed of the range of 5400 rpm and we cannot use the exceeded value within range. The S/N ratio of the efficiency, torque and output power can be shown in Figure 8. The outer rotor BLDC motor involves various control factors are magnet thickness, angle of stator tooth tang, depth of stator slot, width of stator slot opening, stack height, and number of turns. This method is used to improve motor performance, focusing on aspects constant torque, efficiency, and power. In Figure 5a shows the high efficiency of proposed model value of “level 2” for stack height, width of stator slot opening and number of turns. The “level 3” for width of stator tooth, depth of stator slot, angle of stator tooth tang and thickness of magnet can give the high efficiency of the reference model design. The maximum output power can get “level 1” for number of turns and magnet thickness, “level 2” for stack height and angle of stator tooth tang, the “level 3” for width of stator tooth, depth of stator slot and width of stator slot opening as shown in Figure 5b. The “level 1” for depth of stator slot and width of stator slot opening, the “level 2” for width of stator tooth and number of turns, the “level 3” for angle of stator tooth tang and magnet thickness can cause the maximum torque as shown in Figure 5c.
Figure 5.
S/N ratios of mean to control factor for proposed model design (a) S/N ratios for maximum efficiency; (b) S/N ratios for maximum output power (c) S/N ratios for maximum torque.
Figure 5.
S/N ratios of mean to control factor for proposed model design (a) S/N ratios for maximum efficiency; (b) S/N ratios for maximum output power (c) S/N ratios for maximum torque.
The following Table 7 show the result of different between the proposed model under studying the Taguchi method and reference model design by using FEM analysis.
3.2. Respond Surface Methodology(RSM)
Respond Surface Methodology (RSM) starts with a carefully planned series of experiments. These experiments are designed to systematically vary key factors to understand how changes in these factors affect the outcomes or responses. The design often includes central composite design (CCD), Box-Behnken design, or factorial design, among others. The goal is to explore the relationships between several explanatory variables and one or more response variables. Data Collection: Through these experiments, data is collected. This data represents the response(s) observed under various conditions set by the different levels of the factors involved in the study. The core of RSM is the development of a mathematical model that describes the relationship between the factors (independent variables) and the response (dependent variable). Once a satisfactory model is developed, it is used to analyze the effects of different factors on the response and to find the optimal conditions for the process. The final step is to validate the model by conducting experiments at the optimal settings determined by the model and comparing the observed responses to the predicted ones. If the model is accurate, the experimental results should closely match the predictions [16].
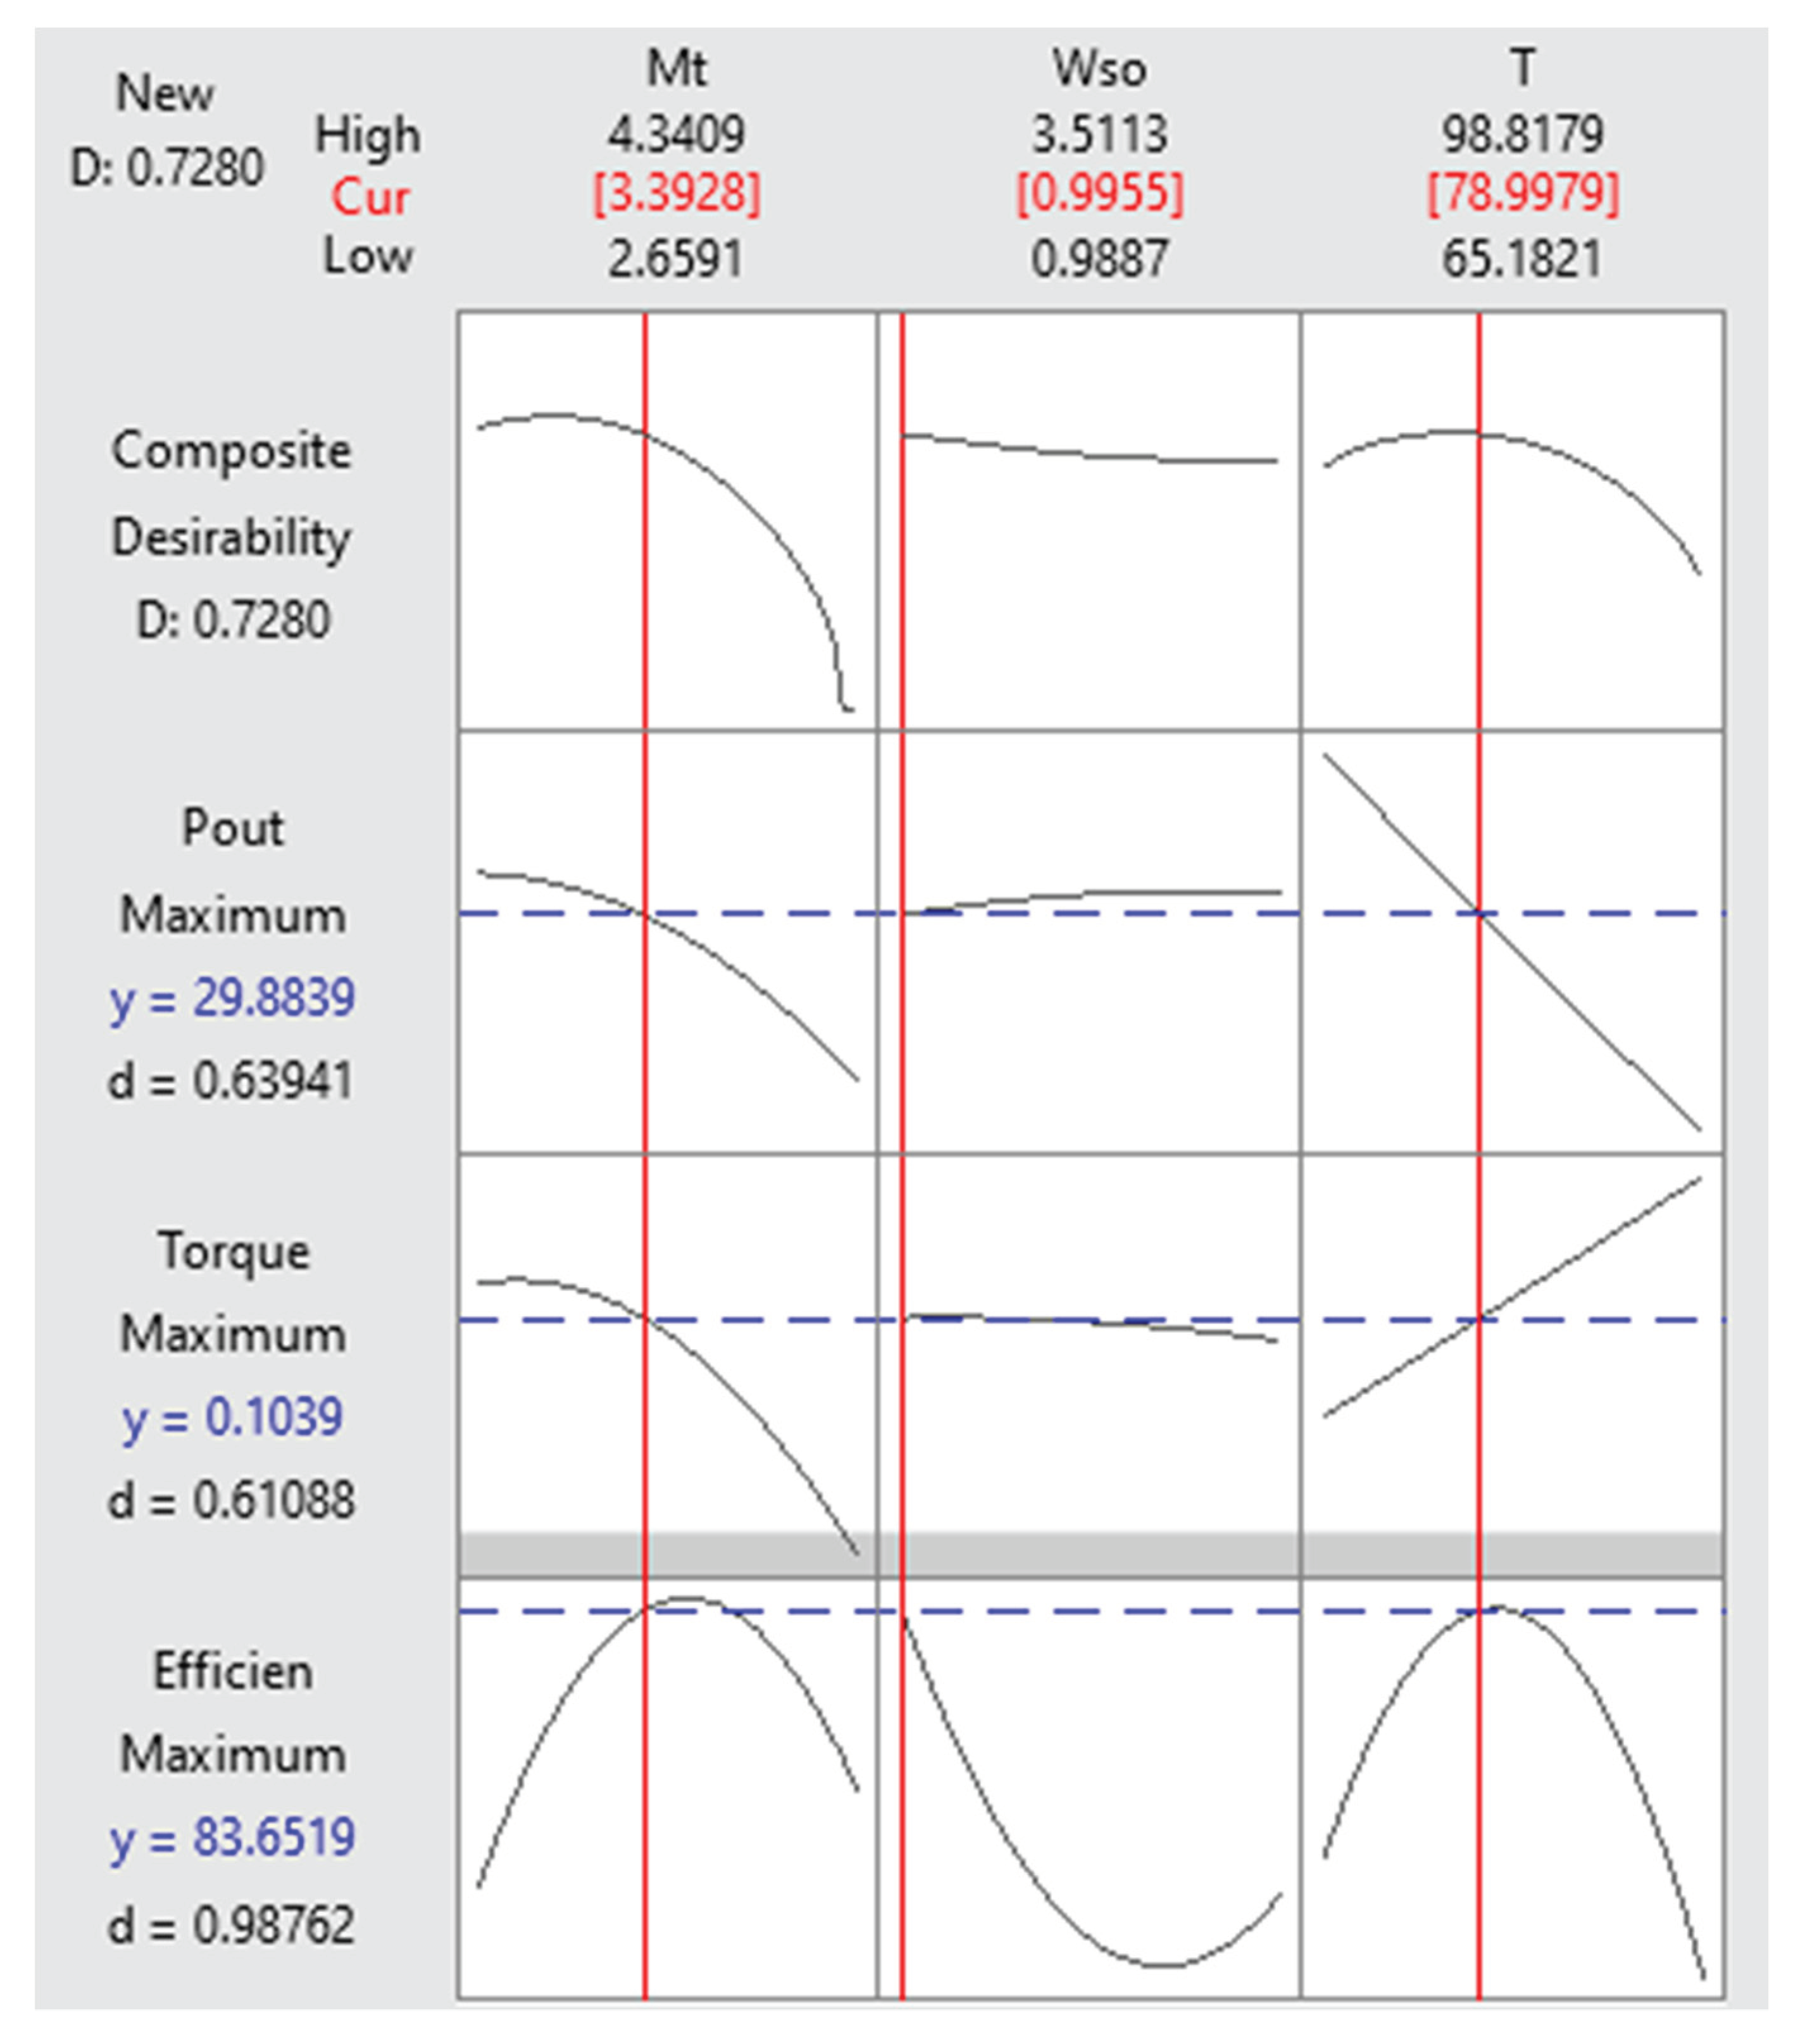
In this experimental approach, the Response Surface Method (RSM) is employed to develop a design scheme for optimizing a motor, as detailed in Table 8. The primary focus is on three key design variables: the thickness of magnet, the width of stator slot opening and the number of turns. These variables are crucial in influencing the motor’s performance, particularly in terms of electromagnetic properties. This is typically done through regression analysis. The model aims to fit the experimental data as closely as possible, often using polynomial equations [17,18]. Fitting to Experimental Data: The model’s coefficients are estimated using curve fitting techniques to match the experimental data. This involves finding the best fit that minimizes the discrepancy between the observed responses and the responses predicted by the model [19,20,21]. To assess the performance of each design point, finite element models of the motor are created. FEM analysis is a powerful tool for simulating and understanding the physical behavior of a design under various conditions as the thickness of magnet, the width of stator slot opening and the number of turns. In this case, it’s used to predict how changes in affect the motor’s functionality [22].
RSM is widely used in various fields like engineering, product development, manufacturing, and even in the pharmaceutical industry, as it offers a robust approach to optimizing processes and products efficiently.
The result from the simulations has shown in Table 9 that the reference motor compared with Taguchi method and Taguchi base RSM under investigation of FEM analysis.
Figure 6.
RSM analysis for proposed model optimization.
4. Discussion
The discussion regarding the development and optimization design of an outer rotor Brushless DC (BLDC) motor using a combination of the Taguchi Method and Response Surface Methodology (RSM) for Finite Element Method (FEM) analysis involves several intricate steps and considerations. The design process begins with the basic configuration of an outer rotor BLDC motor. This includes determining the motor‘s physical dimensions, magnet type, winding patterns, and other structural elements. The outer rotor design is specific as the rotor is on the outside, encircling the stator. This configuration can offer benefits in certain applications compared to inner rotor designs. Based on the FEM analysis, further adjustments might be made to the motor design to refine its performance[23,24]. The process can iterate several times, refining the design each time based on the Taguchi method, RSM, and FEM analysis results.
The Taguchi method is employed to identify the key factors that significantly affect the motor’s performance. This involves selecting control factors (like magnet thickness, coil turns, rotor dimensions) and noise factors (factors that are not easily controlled but impact the performance). An orthogonal array is chosen, and experiments are designed to systematically vary the control factors while keeping the noise factors at bay, to the extent possible. Experiments based on the Taguchi design are carried out. In the case of motor design, these could be virtual experiments using FEM analysis to simulate motor performance under different conditions. Data is collected on motor performance metrics like torque, efficiency, power output, etc., under various experimental conditions.
5. Conclusions
The conclusion of the study on Brushless Direct Current (BLDC) motors emphasizes the significant improvements achieved in these motors for various electrical applications. There has been a consistent year-over-year increase in research and development focused on BLDC motor design. Most researchers in motor design have identified the superior efficiency of BLDC motors compared to traditional motors. BLDC motors are noted for consuming less electrical power than traditional motors. Their design is characterized by compactness, small size, ease of control, energy saving, and light weight. The conclusion underscores the necessity of analyzing and improving the design of BLDC motors to enhance their performance characteristics further. The research utilized the Taguchi Method and RSM in conjunction with Finite Element Method (FEM) analysis for optimizing the motor design. The Taguchi Method initially identifies the optimization points of design parameters using a reference model of an actual 26-Watt BLDC electric fan motor. RSM is then employed for two-step optimization in the FEM analysis. The investigation aimed to improve structural performances in output power, torque, efficiency. The final proposed model achieved an energy efficiency that is 10% higher than the reference design. The output power of the proposed model is also 10 Watts higher than the reference design. The study found a reduction in losses and an increase in maximum torque by 0.032Nm in the proposed design. The design simulation results were produced and studied using JMAG software for FEM analysis. The evaluation compared the reference model design with the proposed design, using three different methods of motor design optimization. This comparison showed that the proposed design exhibits the best characteristics for the performance of motor design.
Author Contributions
Conceptualization, Chun-Yu Hsiao and Soe Min Htet; methodology, Chun-Yu Hsiao and Soe Min Htet; software Soe Min Htet; validation, Chun-Yu Hsiao, and Soe Min Htet; formal analysis, Chun-Yu Hsiao and Soe Min Htet; investigation, Chun-Yu Hsiao and Soe Min Htet; resources, Chun-Yu Hsiao and Soe Min Htet; data curation, Chun-Yu Hsiao, and Soe Min Htet; writing—original draft preparation, Chun-Yu Hsiao and Soe Min Htet; writing—review and editing, Chun-Yu Hsiao, and Soe Min Htet; visualization, Chun-Yu Hsiao, and Soe Min Htet; supervision, Chun-Yu Hsiao; project administration, Chun-Yu Hsiao and Soe Min Htet. All authors have read and agreed to the published version of the manuscript.
Funding
This research was fully funded by MOST 111-2221-E036-010-MY2 project for national science and technology council (NSTC) in R.O.C (Taiwan), partial funding support from Tatung University.
Institutional Review Board Statement
Not applicable.
Informed Consent Statement
Not applicable.
Data Availability Statement
Real data result from reference motor supported from Lutron Industrial Co., Ltd and other part of data generated to support the findings of the present study are in this article.
Acknowledgments
The Authors would to gratefully acknowledge fully funding support from MOST 111-2221-E036-010-MY2 project for national science and technology council (NSTC) in R.O.C (Taiwan), partial funding support from Tatung University. The authors would like to thank the technologically support from Jotactic Automotive Consulting Inc and also thank the Editor-in-Chief, Editor, and Reviewers for their valuable reviews.
Conflicts of Interest
The authors declare no conflict of interest.
References
- Căta, A.; Țăranu, B.-O.; Ienașcu, I.M.C.; Sfirloaga, P. New PVP–Ag or Pd-Doped Perovskite Oxide Hybrid Structures for Water Splitting Electrocatalysis. Appl. Sci. 2024, 14, 1186. [CrossRef]
- G. Eason, B. Noble, and I. N. Sneddon, “On certain integrals of Lipschitzankel type involving products of Bessel functions,” Phil. Trans. Roy. Soc. London, vol. A247, pp. 529–551, April 1955.
- J. Shao, ‘‘An improved microcontroller-based sensor less brushless DC BLDC) motor drive for automotive applications,’’ IEEE Trans. Ind. Appl., vol. 42, no. 5, pp. 1216–1221, Sep. 2006. [CrossRef]
- D. Mohanraj et al., "A Review of BLDC Motor: State of Art, Advanced Control Techniques, and Applications," in IEEE Access, vol. 10, pp. 54833-54869, 2022, doi: 10.1109/ACCESS.2022. Author 1, A.; Author 2, B. Book Title, 3rd ed.; Publisher: Publisher Location, Country, 2008; pp. 154–196.
- Hasanbeigi. (2018). Utilities and Governments are Wasting Millions of Dollars Subsidizing A Wrong Technology for Motor Systems Efficiency. Available: https://www.eeip.org/articles/detailed/b54ae3494-e0cfd5837f5693810b4fbe5/utilitiesand-governments-are-wasting-millions-of-dollars-subsidizing-awrong-technology-for-motor-s/ .
- P. D. Ali Hasanbeigi. (2017). Infographic: The Profile of Energy Use in Industrial Motor Systems. Available: https://www.globalefficiencyintel.com /newblog/2017/infogra-phicenergy-industrial-motor-systems .
- J. Shao, ‘‘An improved microcontroller-based sensorless brushless DC (BLDC) motor drive for automotive applications,’’ in Proc. 40th IAS Annu. Meeting. Conf. Rec. Ind. Appl. Conf., Oct. 2005, pp. 2512–2517.
- Y. B. A. Apatya, A. Subiantoro and F. Yusivar, "Design and prototyping of 3-phase BLDC motor," 2017 15th International Conference on Quality in Research (QiR): International Symposium on Electrical and Computer Engineering, Nusa Dua, Bali, Indonesia, 2017, pp. 209-214. [CrossRef]
- C. -Y. Hsiao, S. M. Htet, G. H. Lin, T. H. Yang and M. -S. Lu, "Analysis on the Effect of Number of Poles and Thickness of Permanent Magnet in PMBLDC Motor," 2023 9th International Conference on Applied System Innovation (ICASI), Chiba, Japan, 2023, pp. 121-123. [CrossRef]
- https://www.jmag-international.com/express/ .
- Zhilichev, Y. Analysis of Permanent Magnet Demagnetization Accounting for Minor B–HB–H Curves. IEEE Trans. Magn. 2008, 44, 4285–4288.
- Huner, E. Optimization of axial flux permanent magnet generator by Taguchi experimental method. Bull. Pol. Acad. Sci. Tech. Sci. 2020, 68, 409–419. [CrossRef]
- C. -Y. Hsiao, S. M. Htet, G. H. Lin and T. H. Yang, "Investigation of Design Performance in Outer Rotor BLDC Motor for Taguchi Method," 2023 IEEE 6th Student Conference on Electric Machines and Systems (SCEMS), HuZhou, China, 2023, pp. 1-6. [CrossRef]
- S. -K. Cho, K. -H. Jung and J. -Y. Choi, "Design Optimization of Interior Permanent Magnet Synchronous Motor for Electric Compressors of Air-Conditioning Systems Mounted on EVs and HEVs," in IEEE Transactions on Magnetics, vol. 54, no. 11, pp. 1-5, Nov. 2018, Art no. 8204705. [CrossRef]
- J. Si, S. Zhao, H. Feng, R. Cao and Y. Hu, "Multi-objective optimization of surface-mounted and interior permanent magnet synchronous motor based on Taguchi method and response surface method," in Chinese Journal of Electrical Engineering, vol. 4, no. 1, pp. 67-73, March 2018 . [CrossRef]
- M. Ajamloo, A. Ghaheri and E. Afjei, "Multi-objective Optimization of an Outer Rotor BLDC Motor Based on Taguchi Method for Propulsion Applications," 2019 10th International Power Electronics, Drive Systems and Technologies Conference (PEDSTC), Shiraz, Iran, 2019, pp. 34-39. [CrossRef]
- Beeravelli, V.N.; Chanamala, R.; Rayavarapu, U.M.R.; Kancherla, P.R. An Artificial Neural Network and Taguchi Integrated approach to the optimization of performance and emissions of direct injection diesel engine. Eur. J. Sustain. Dev. Res. 2018, 2, 16.
- Q. Sun, Y. Cheng and Z. Chen, "Minimization of Torque Fluctuation in Disc Type In-Wheel Motor Based on Response Surface Method and FEA," 2019 IEEE 3rd International Conference on Green Energy and Applications (ICGEA), Taiyuan, China, 2019, pp. 85-88. [CrossRef]
- Singh, V. Application of Artificial Neural Networks for predicting generated wind power. Int. J. Adv. Comput. Sci. Appl. (IJACSA) 2016, 7, 250–253.
- Braik, M.S. Chameleon Swarm Algorithm: A bio-inspired optimizer for solving engineering design problems. Expert Syst. Appl. 2021, 174, 114685. [CrossRef]
- M. A. Inayathullaah; N. Sivakumar; Ananthakrishnan Balasundaram; R. Arul; S. Angalaeswari. Time Domain Investigation of Hybrid Intelligent Controllers Fed Five-Phase PMBLDC Motor Drive. Applied Sciences 2023, 13, 3281. [CrossRef]
- Vadim Carev; Jan Roháč; Sergey Tkachenko; Konstantin Alloyarov. The Electronic Switch of Windings of a Standard BLDC Motor. Applied Sciences 2022, 12, 11096. [CrossRef]
- Dini, P.; Saponara, S. Modeling and Control Simulation of Power Converters in Automotive Applications. Appl. Sci. 2024, 14, 1227. [CrossRef]
- Taghinezhad, E.; Kaveh, M.; Szumny, A.; Figiel, A. Quantifying of the Best Model for Prediction of Greenhouse Gas Emission, Quality, and Thermal Property Values during Drying Using RSM (Case Study: Carrot). Appl. Sci. 2023, 13, 8904 . [CrossRef]
Figure 1.
Organization of the review process.
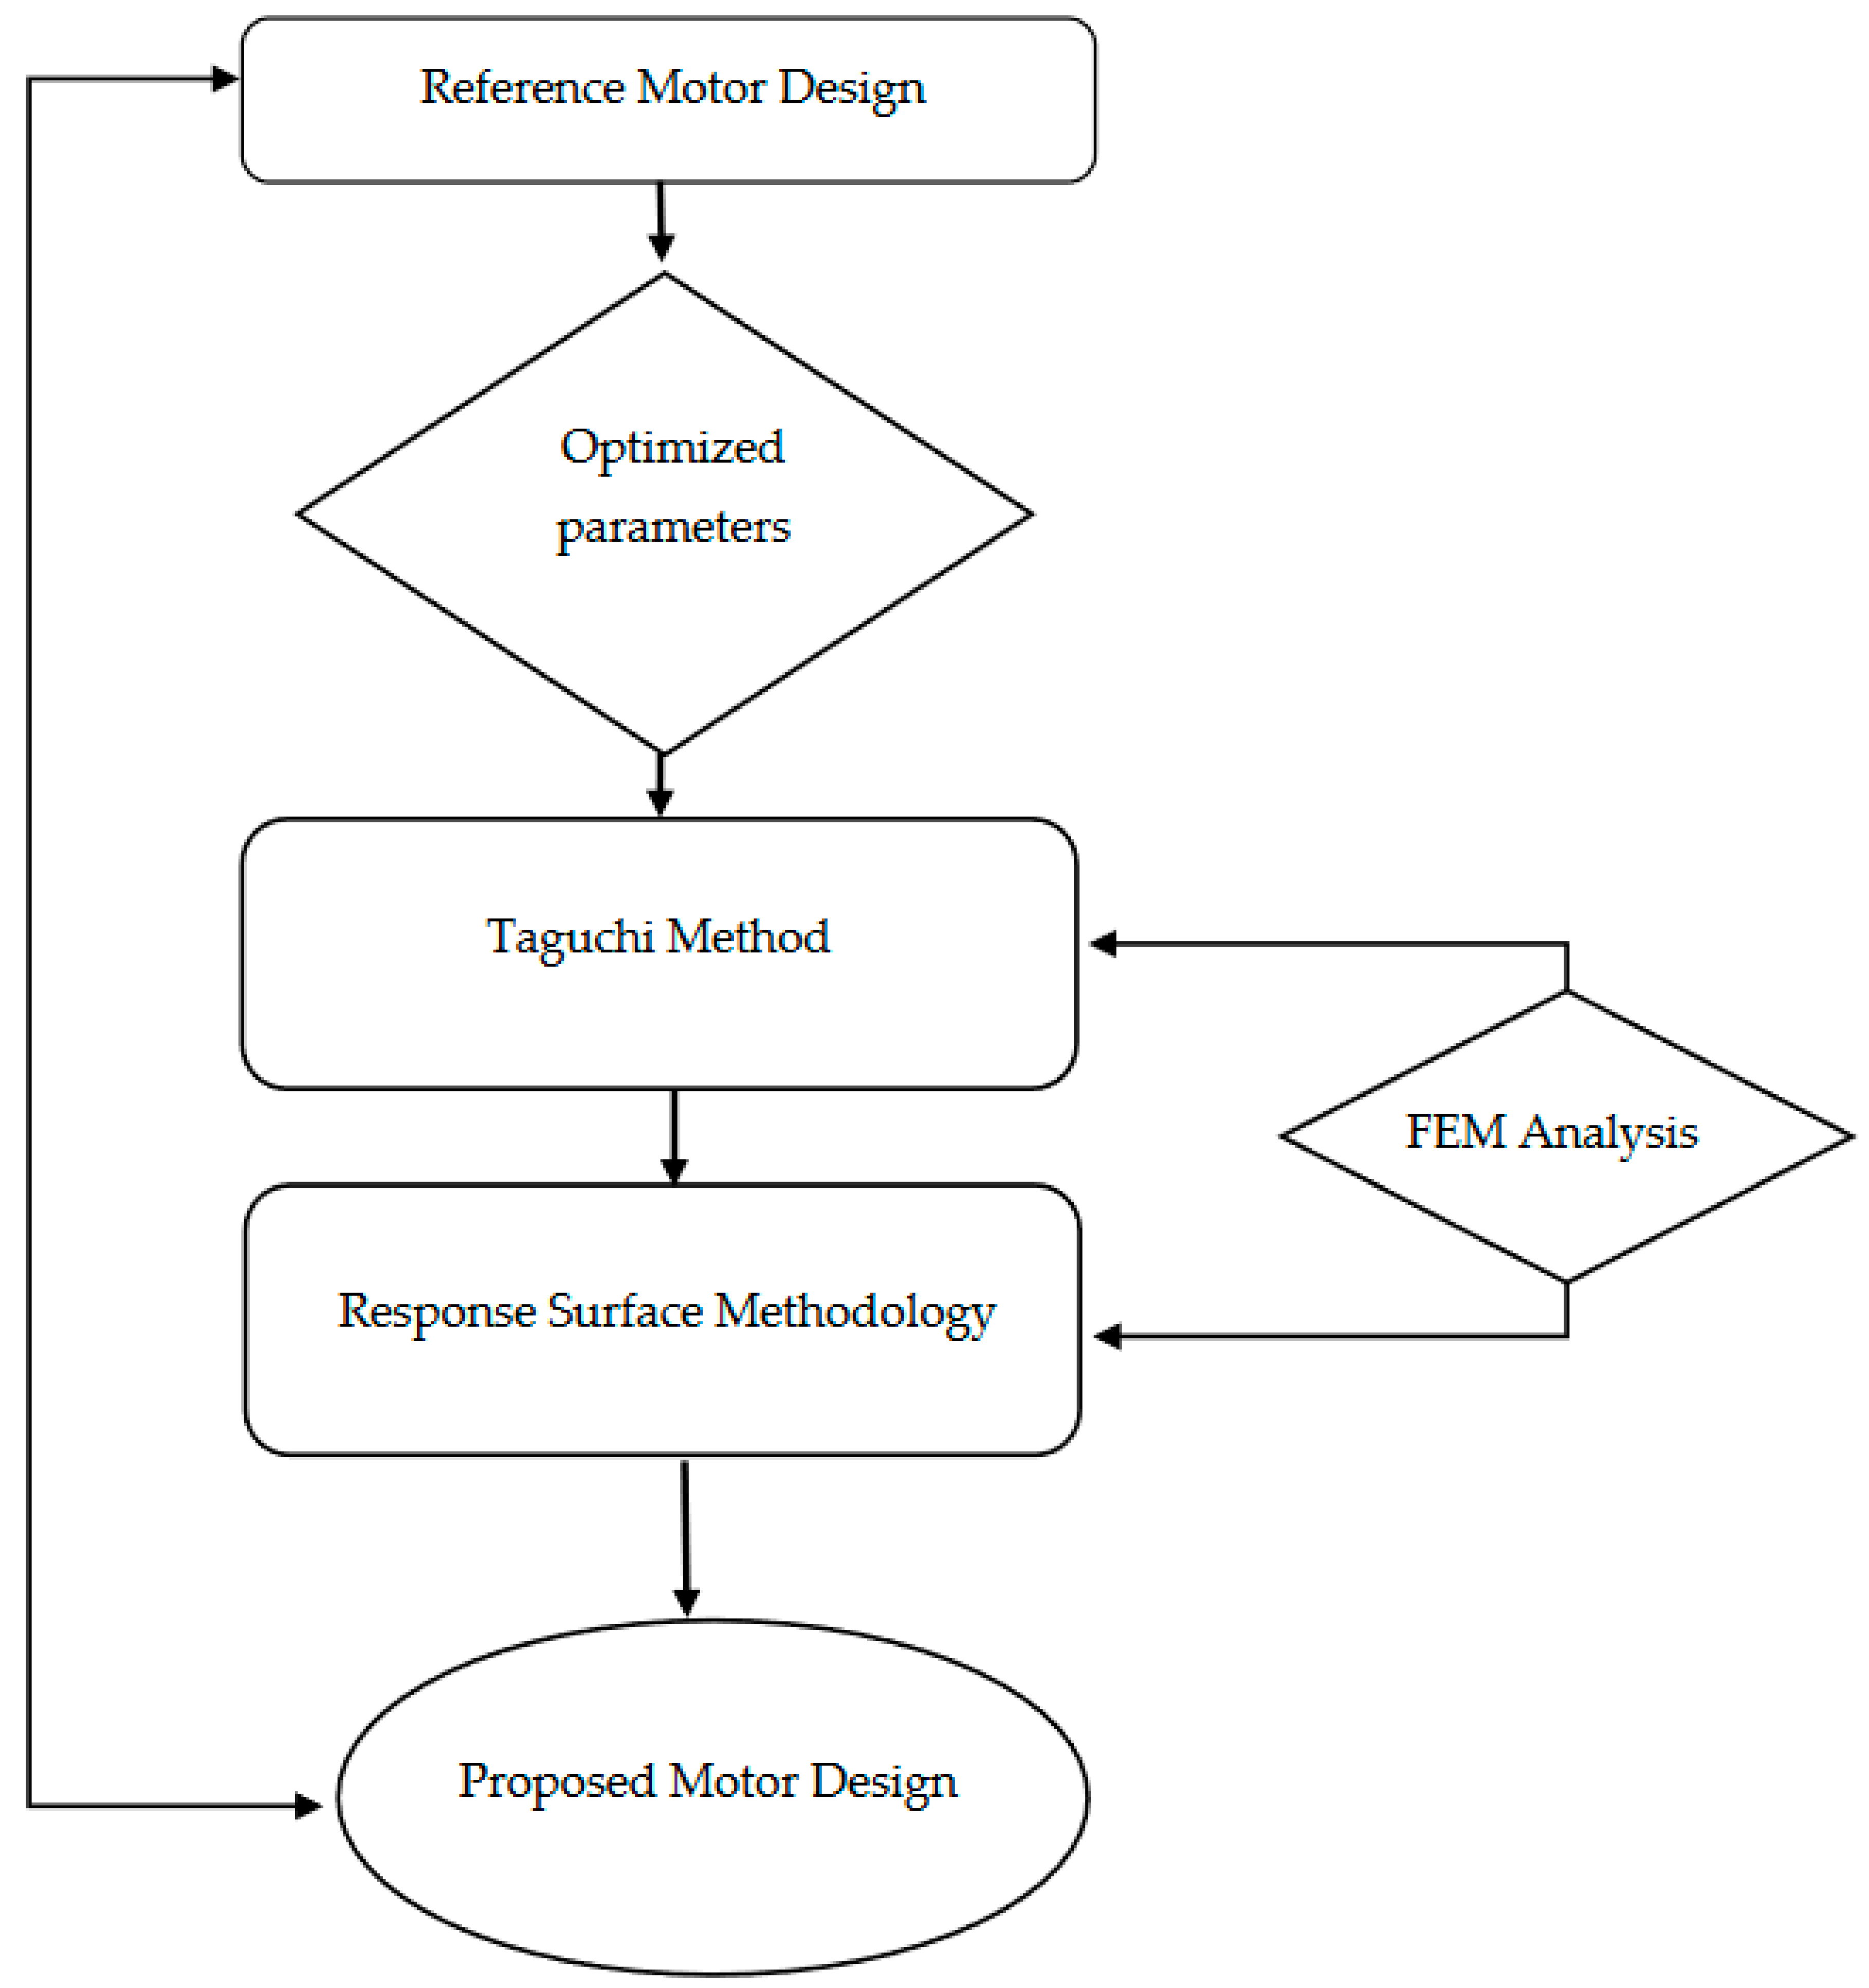
Figure 2.
Survey Diagram of energy saving electric fan.
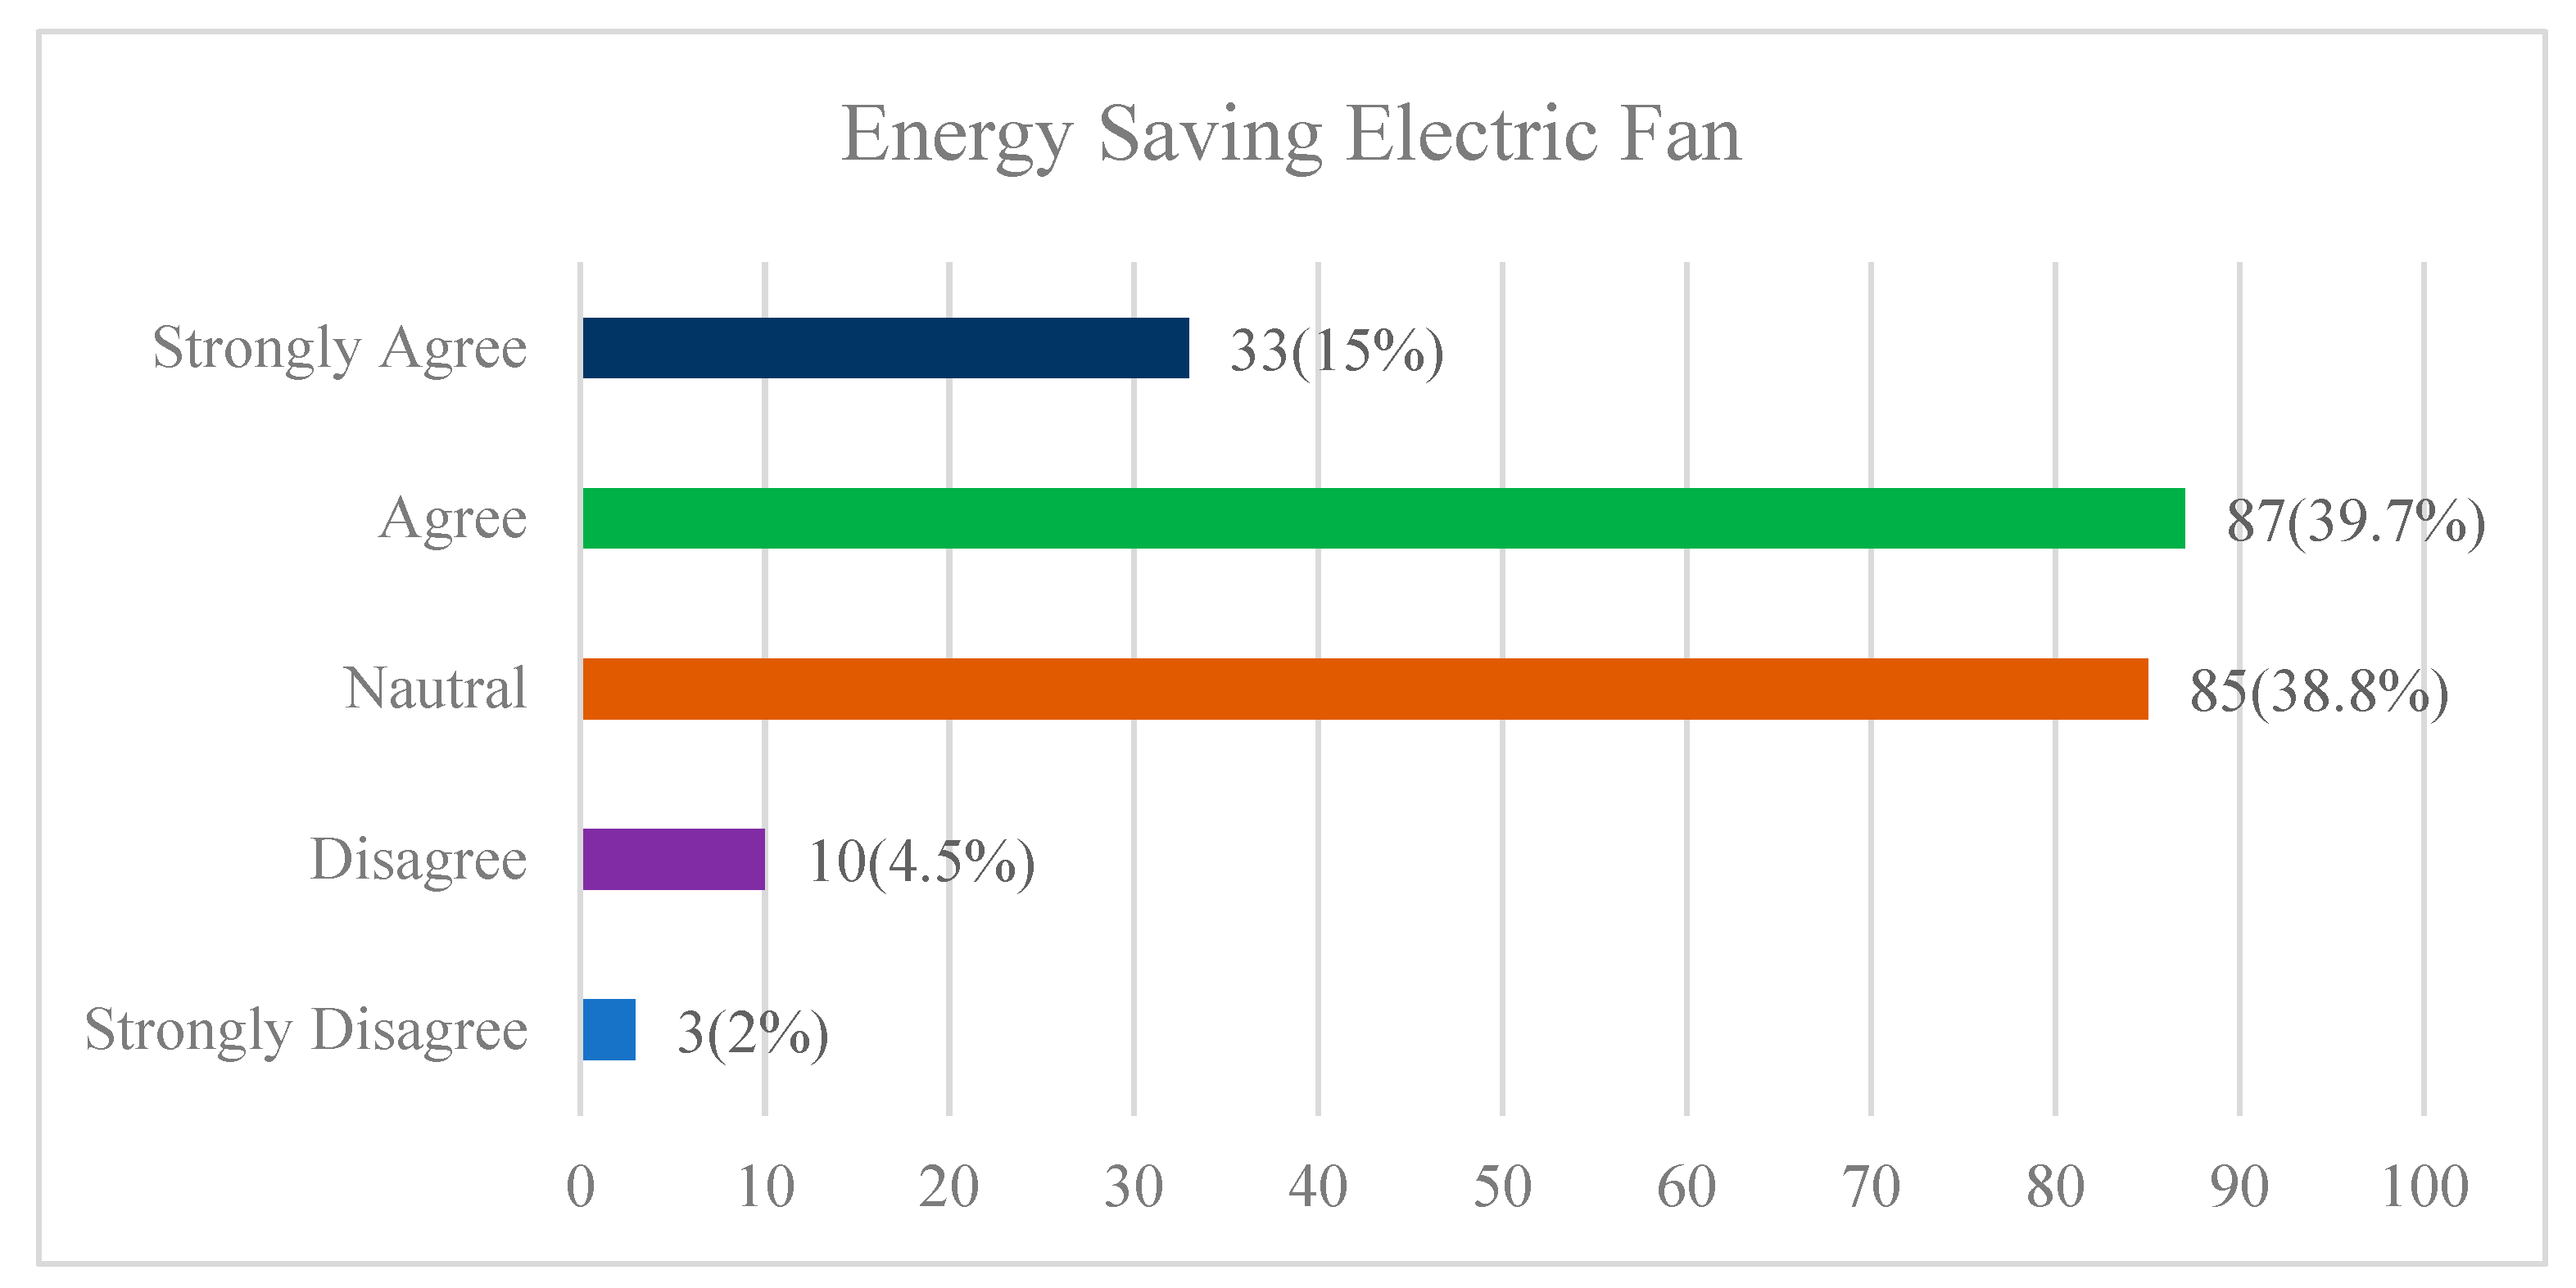
Figure 3.
Characteristics of flux density and magnetic field for 50CS1300 [9].
Figure 3.
Characteristics of flux density and magnetic field for 50CS1300 [9].
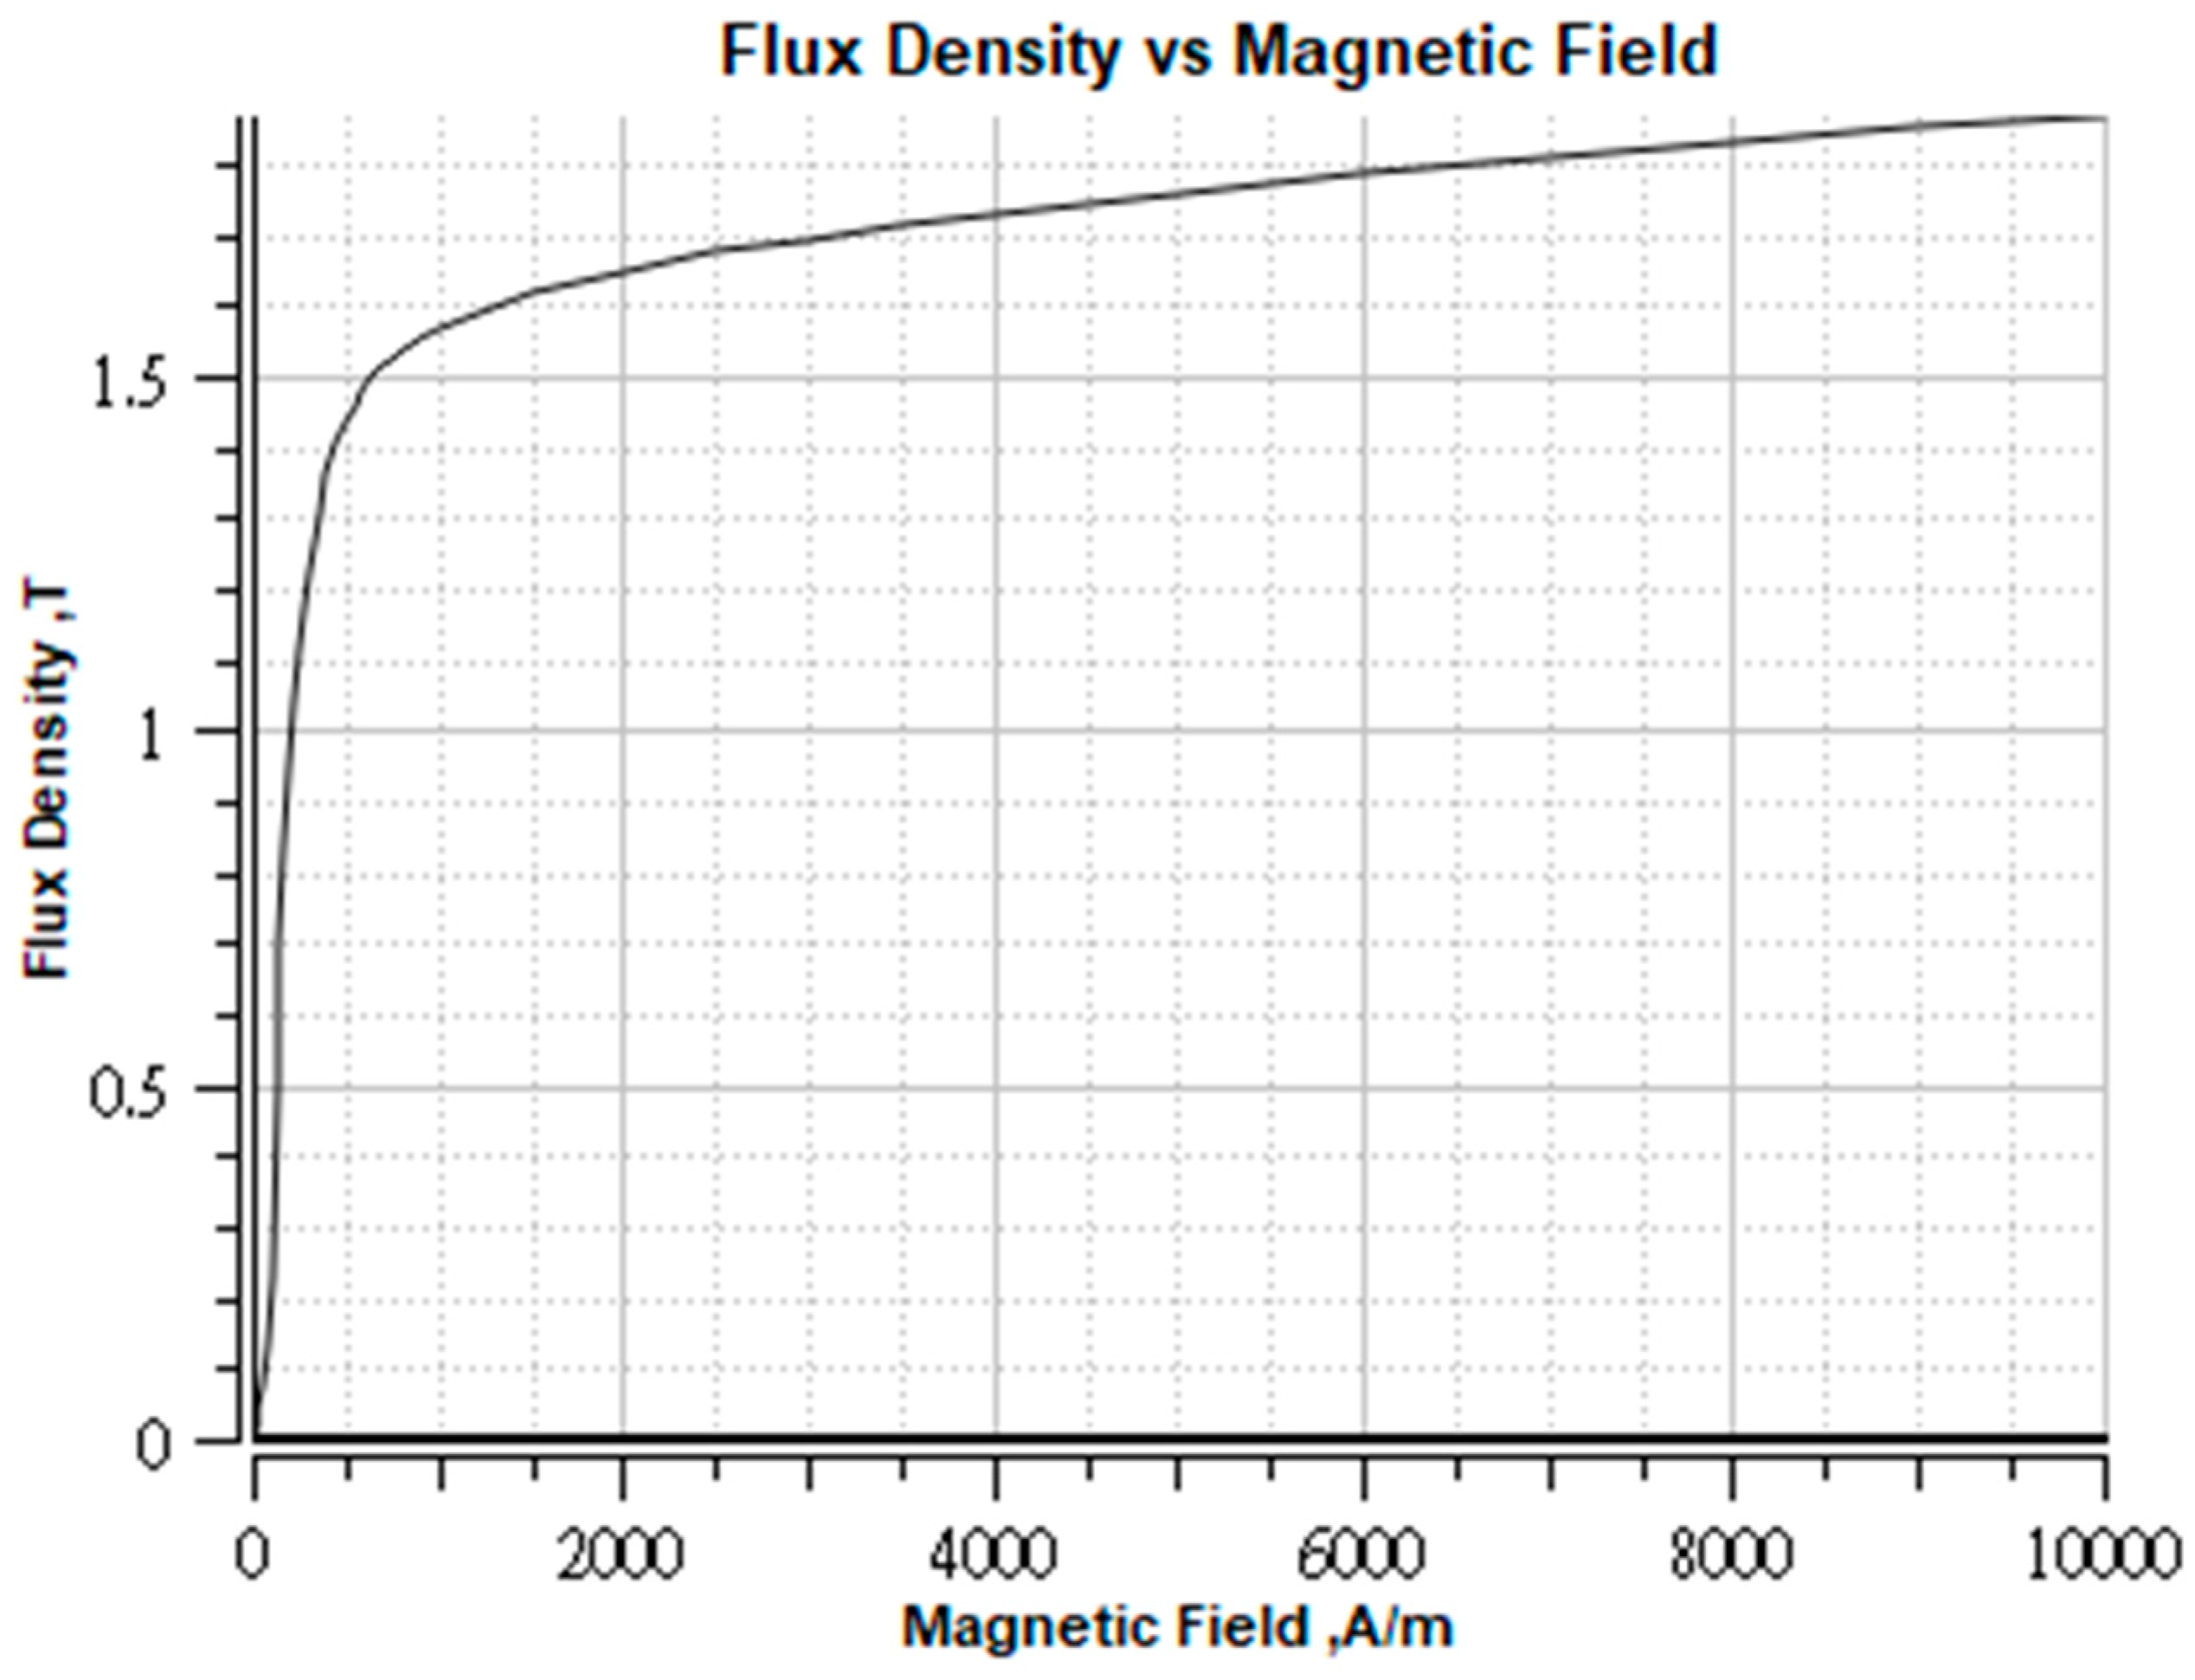
Figure 4.
B-H curve of NMF-6C magnet [9].
Figure 4.
B-H curve of NMF-6C magnet [9].
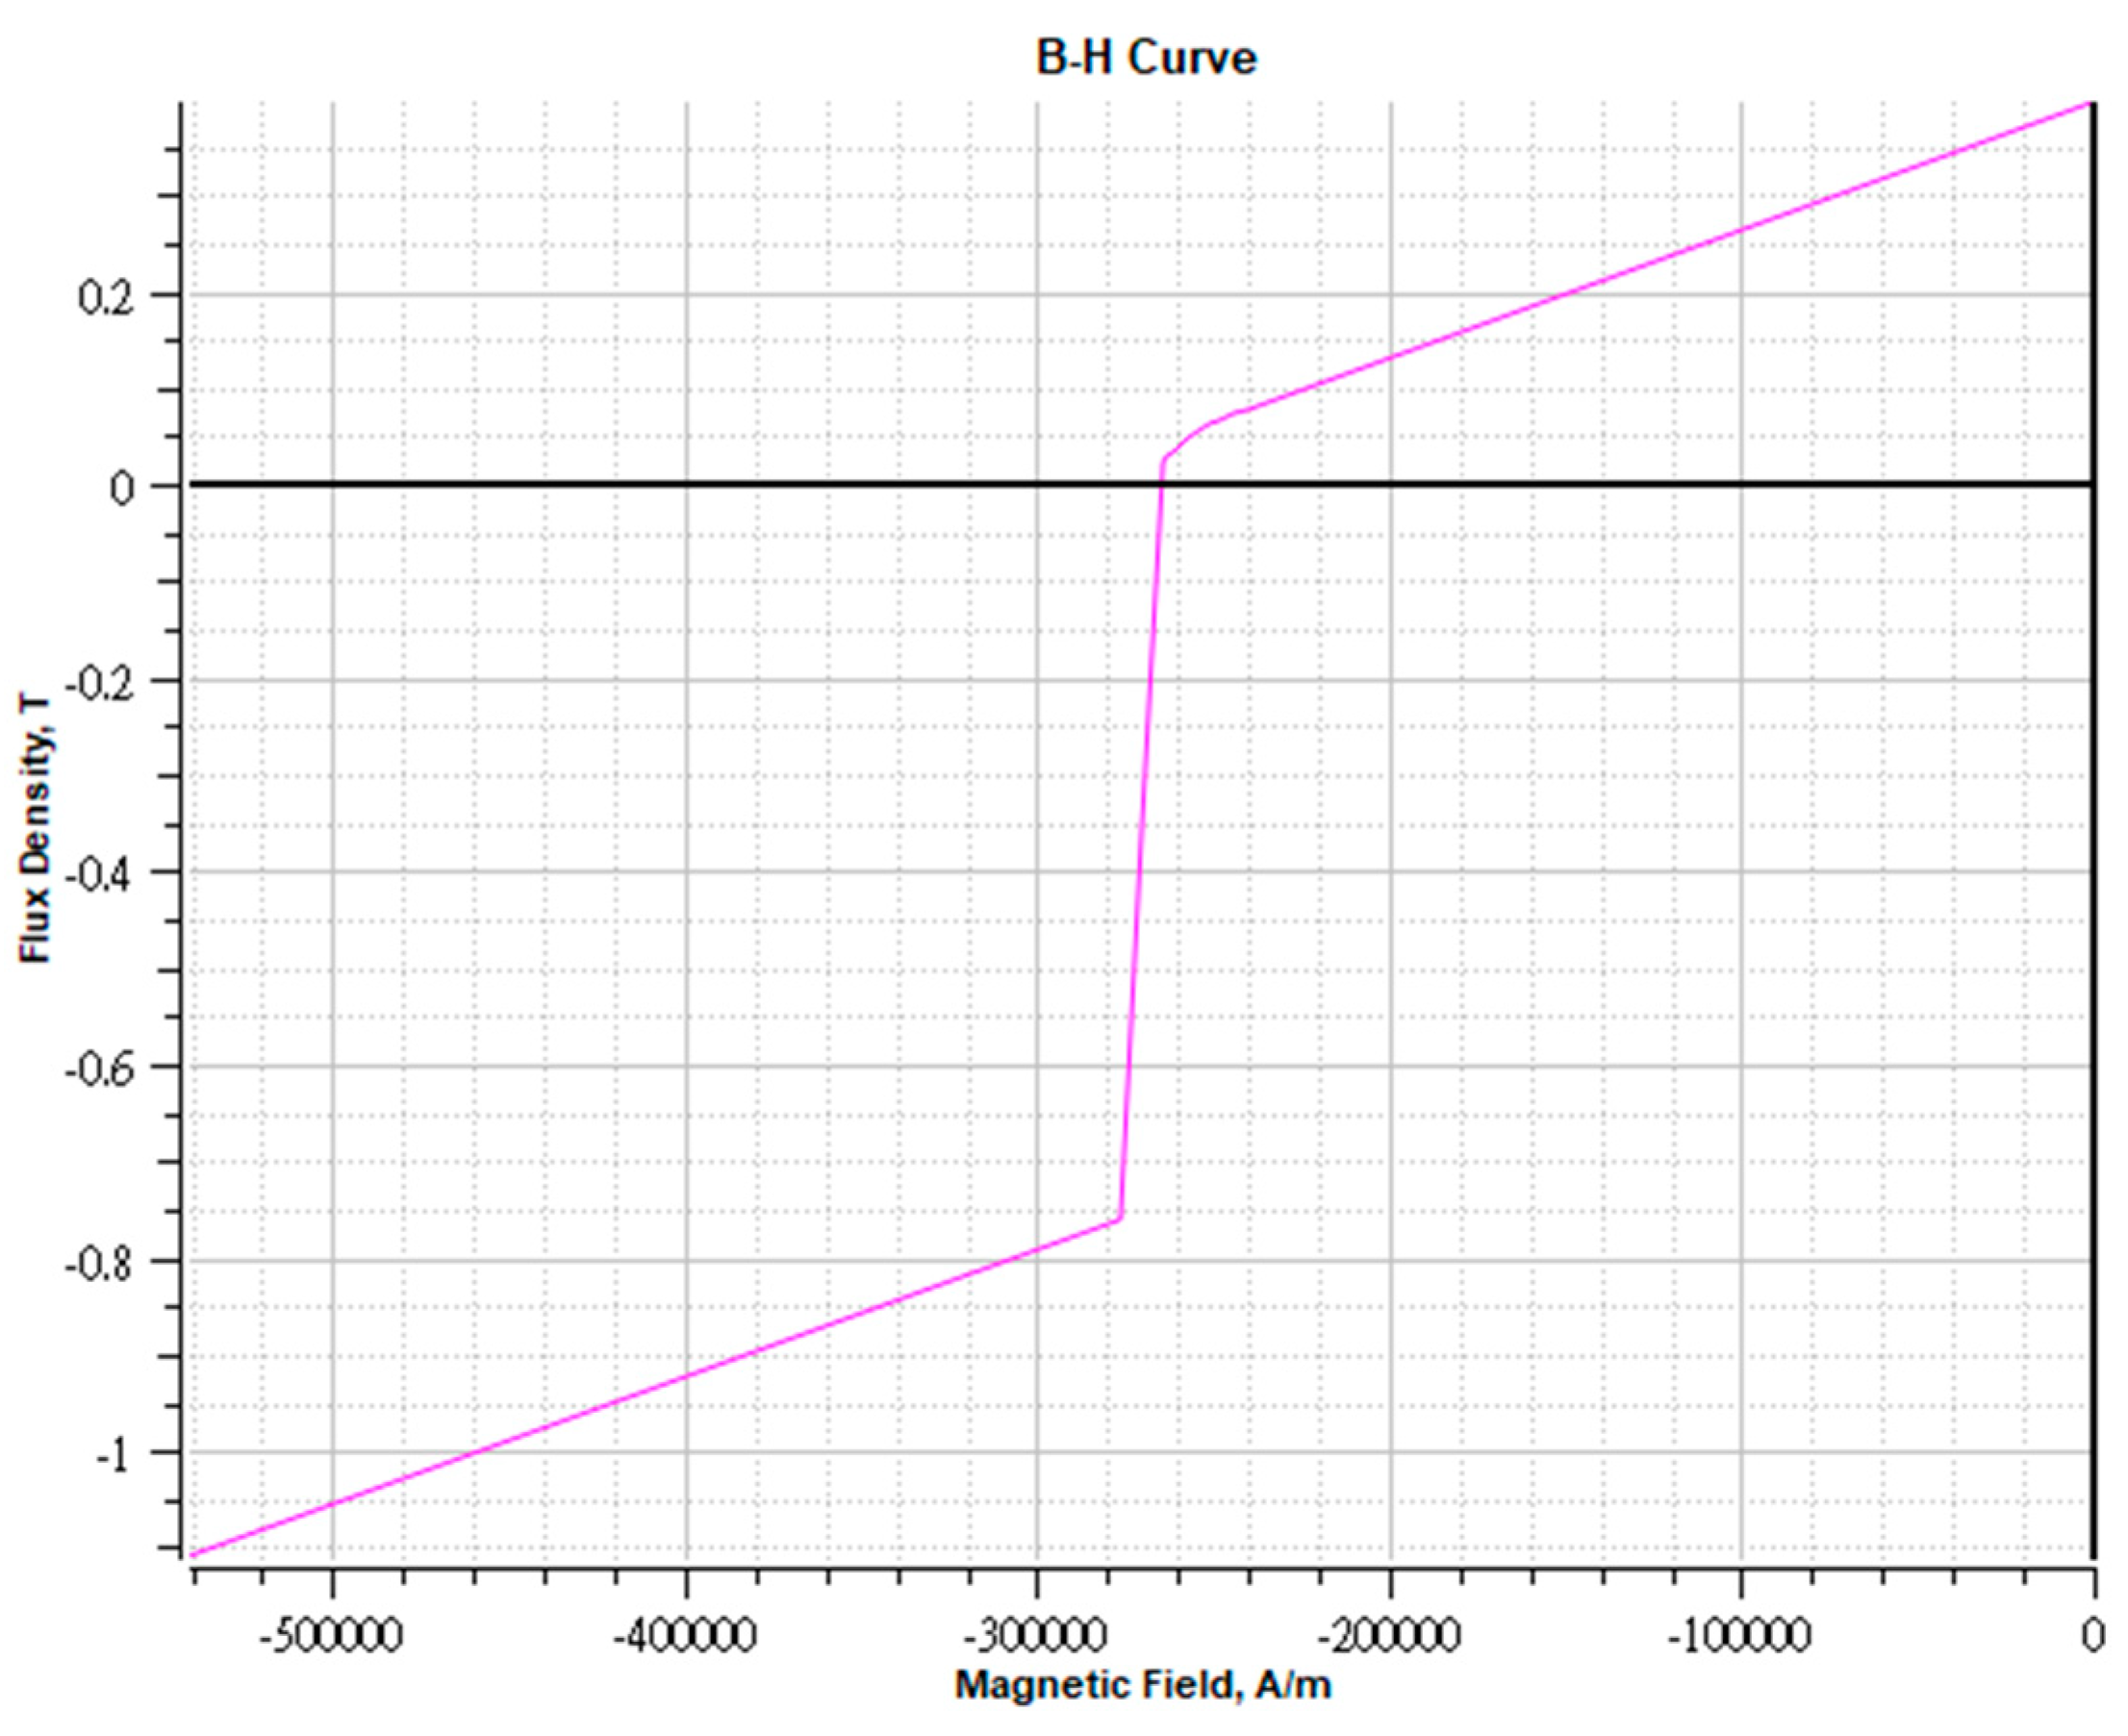
Figure 5.
Cross section of reference motor.
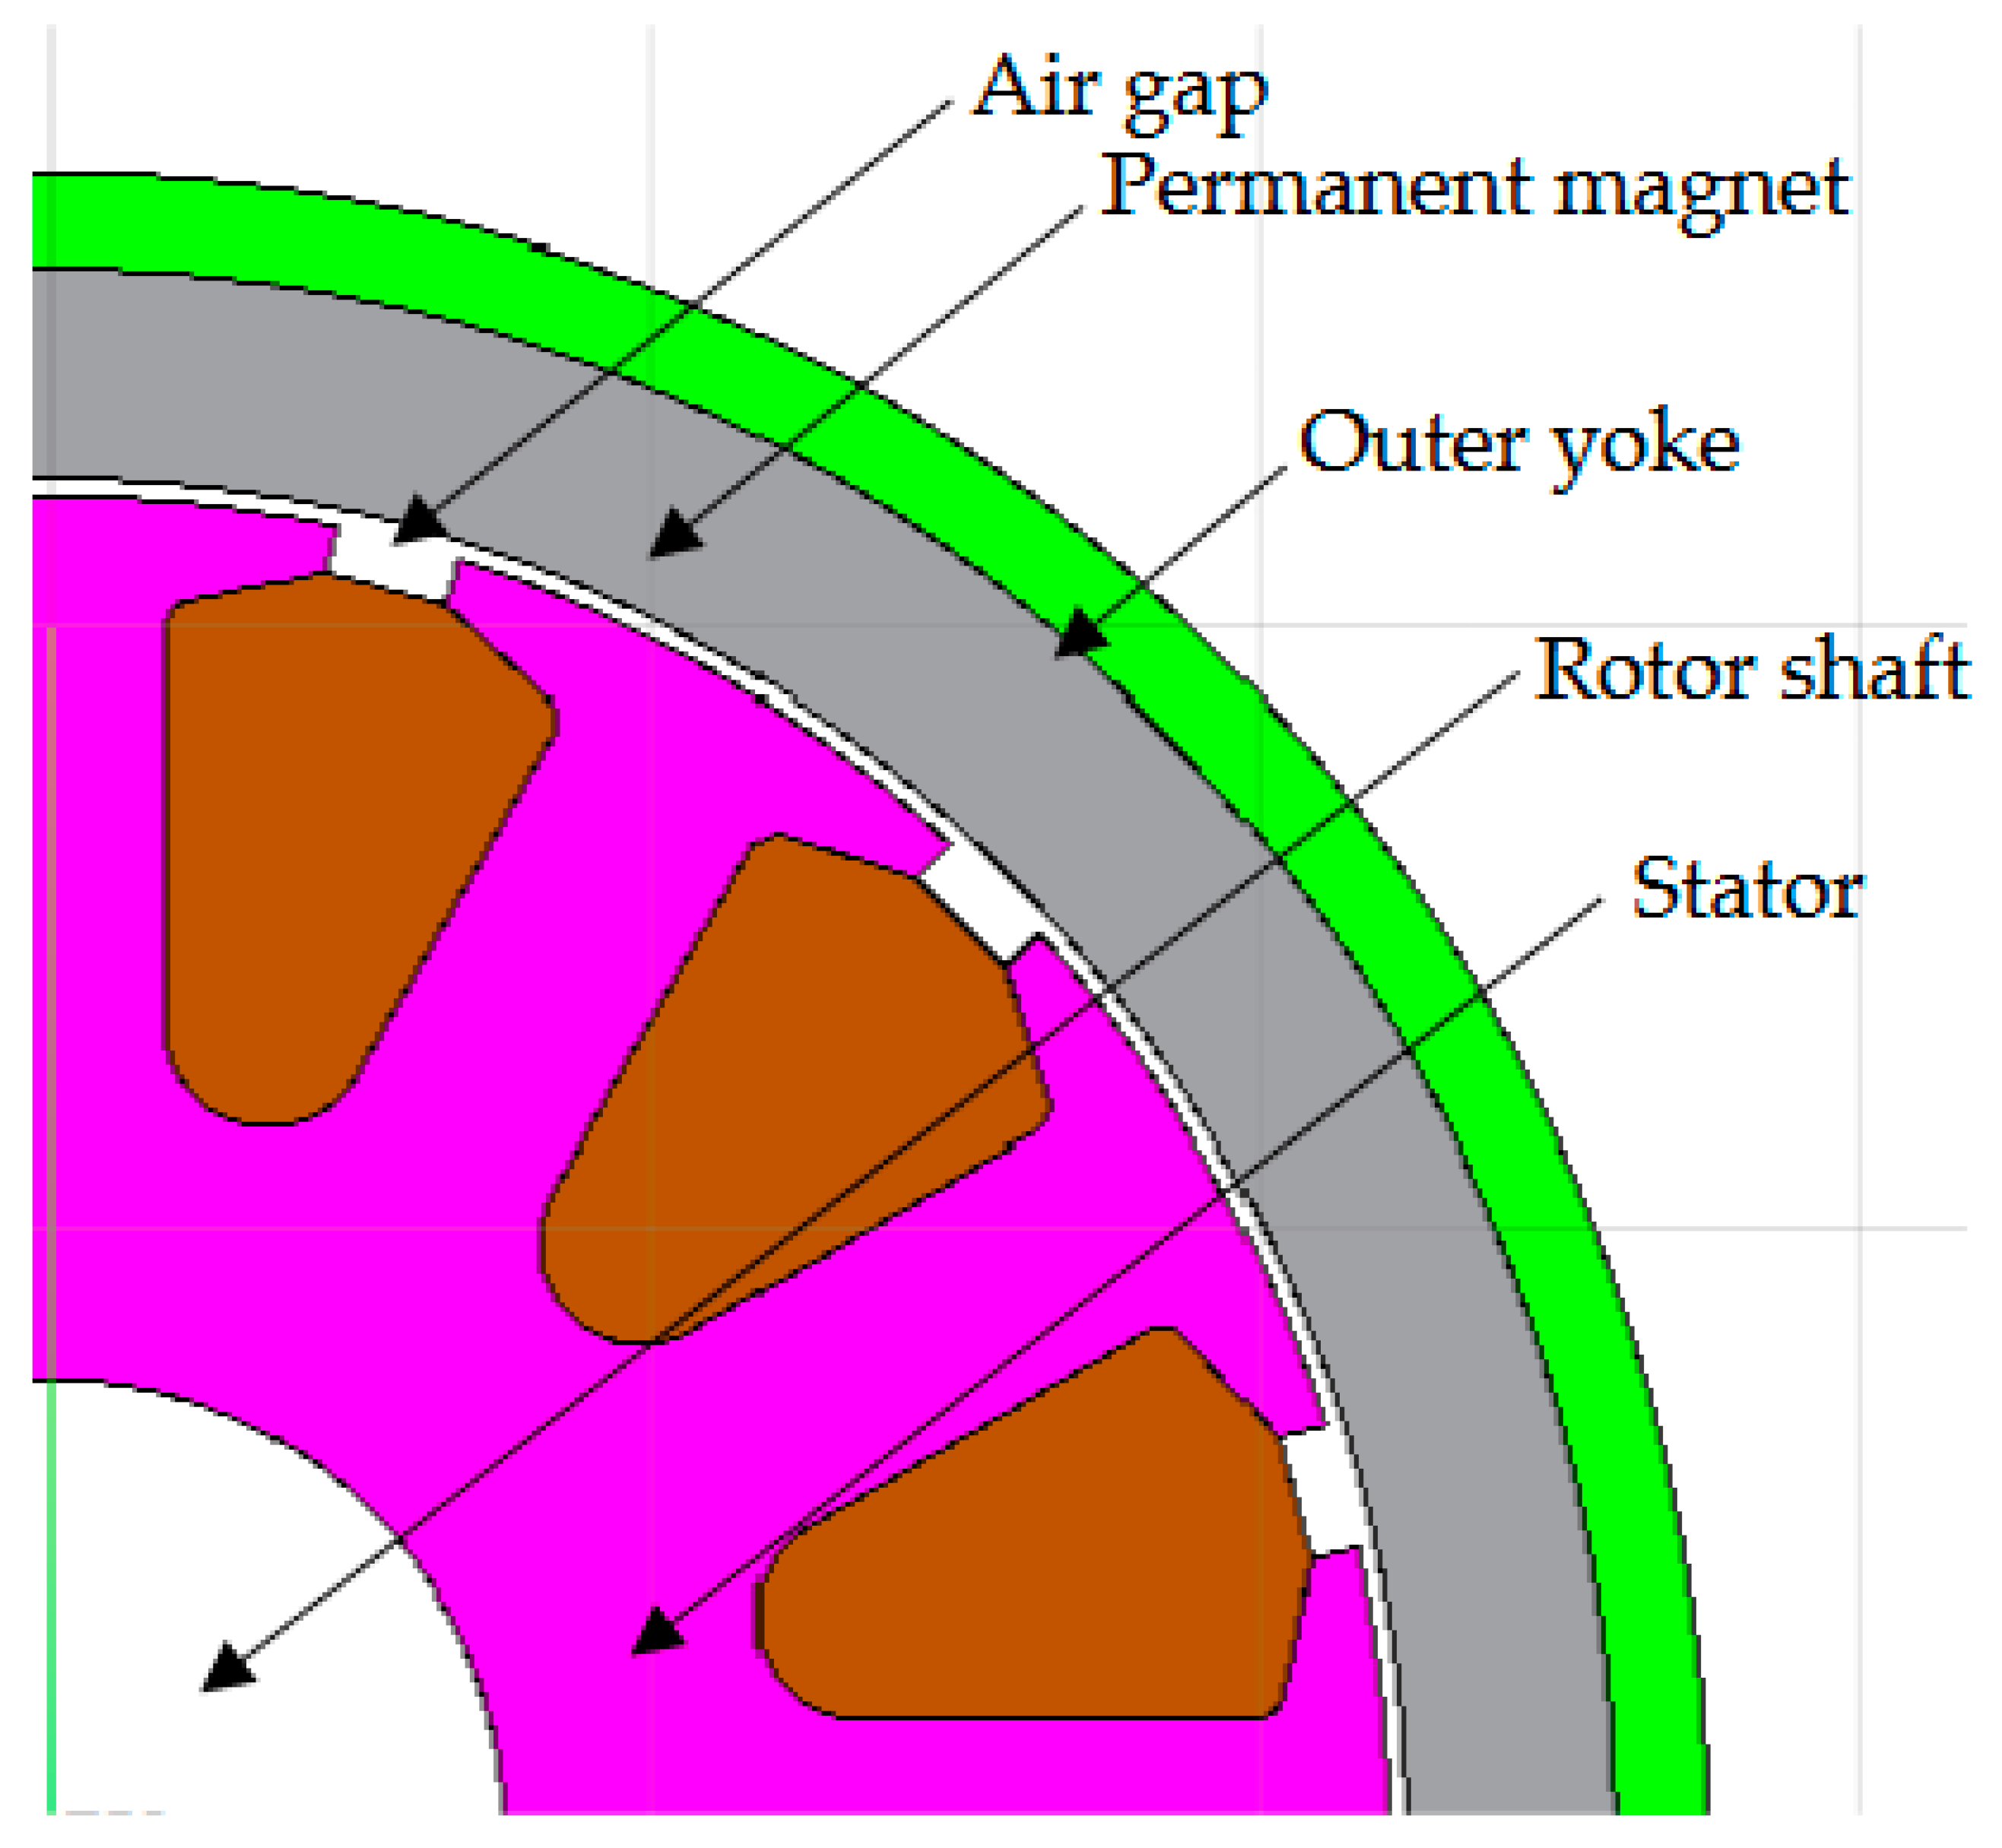
Figure 6.
Reference motor simulation result of testing machine.
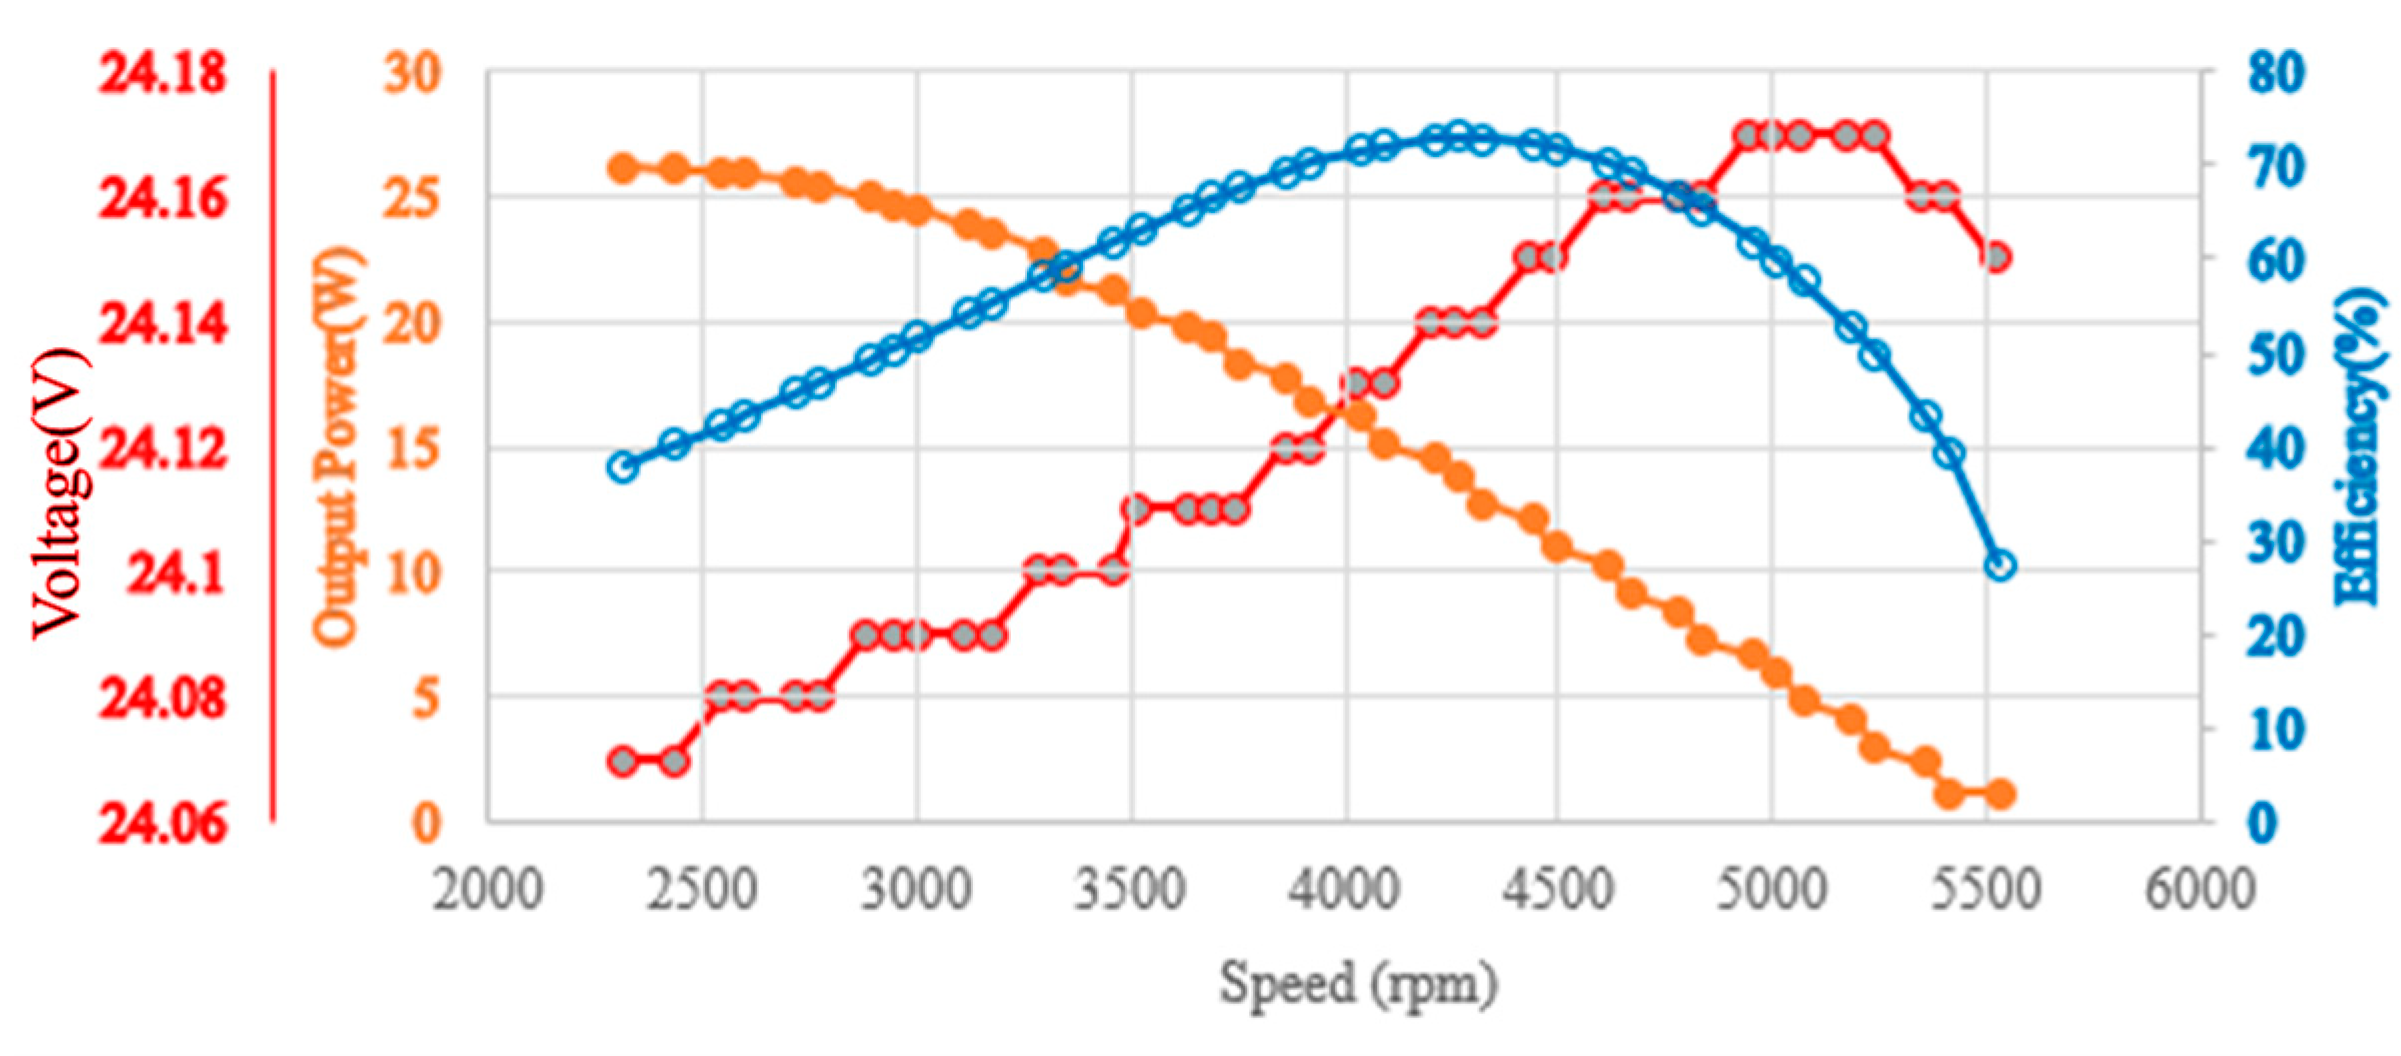
Figure 7.
Reference motor simulation result of software.
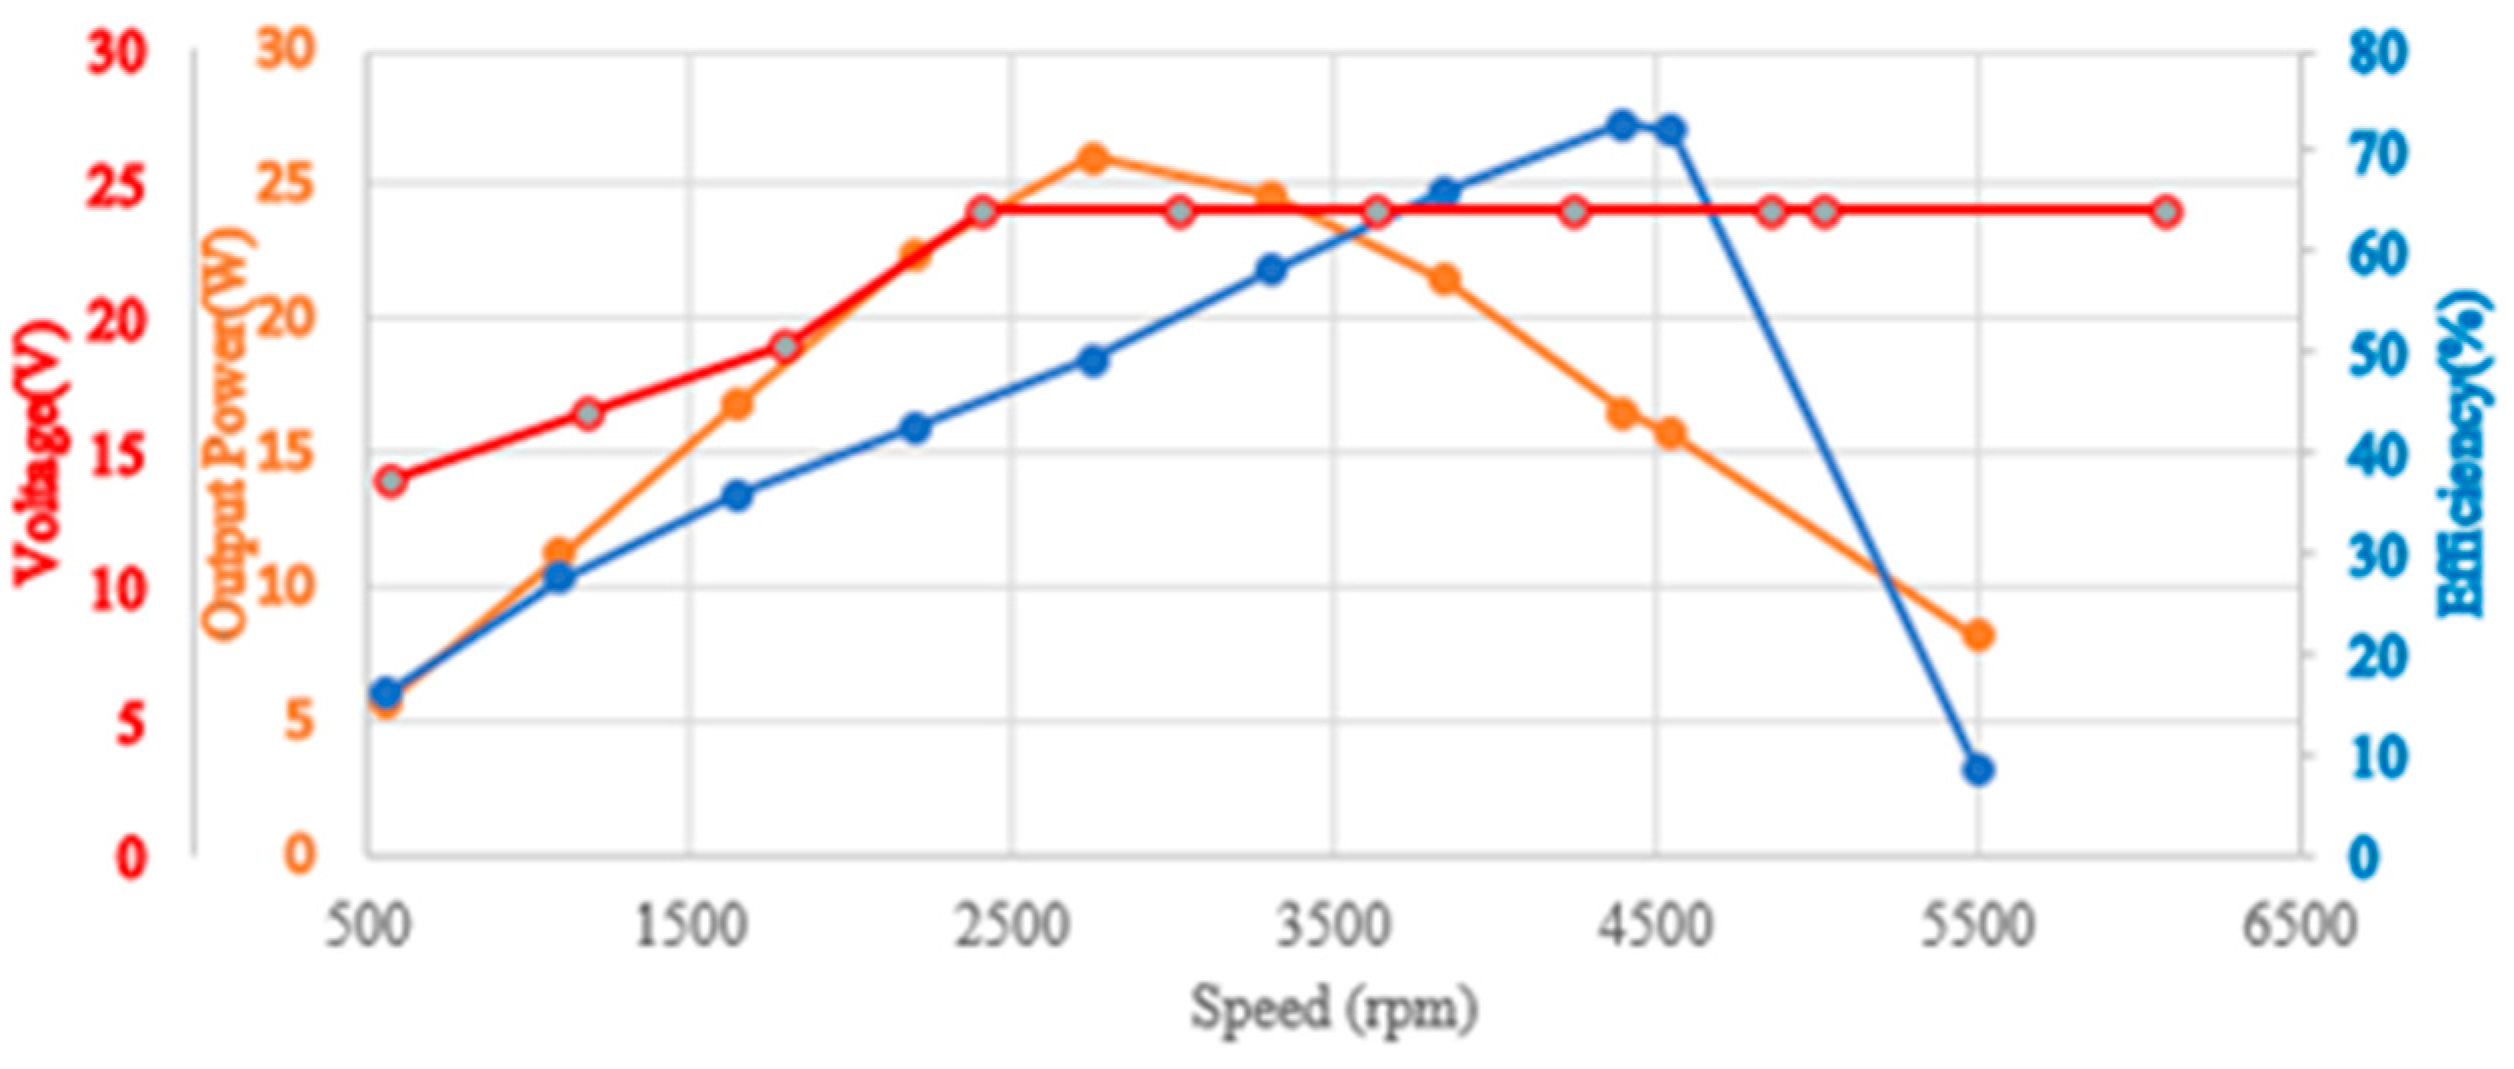
Table 1.
Specification of reference electric fan motor parameters.
| Parameter | Value | Unit |
|---|---|---|
| Outer diameter | 55 | mm |
| Inner diameter | 45 | mm |
| Stator bore diameter | 20 | mm |
| Gap length | 0.3 | mm |
| Number of slots | 12 | slots |
| Number of poles | 10 | poles |
| Rated voltage | 24 | V |
| Rated current | 3 | A |
| Speed | 5500 | rpm |
| Connection type | Y |
Table 4.
Design variance of the control factors.
| Constant | Control Factors | Orthogonal Array Levels | ||
| A | Stack height | 1 | 2 | 3 |
| B | Width of stator tooth | 1 | 2 | 3 |
| C | Depth of stator slot | 1 | 2 | 3 |
| D | Width of stator slot opening | 1 | 2 | 3 |
| E | Angle of stator tooth tang | 1 | 2 | 3 |
| F | Number of turns | 1 | 2 | 3 |
| G | Magnet thickness | 1 | 2 | 3 |
Table 5.
Signal to noise ratios for different level optimizations [14].
Table 5.
Signal to noise ratios for different level optimizations [14].
| Desired value | Signal to noise ratios |
| Larger is better | |
| Nominal is best | |
| Smaller is better |
Table 6.
FEM analysis for Taguchi Method of orthogonal array (L=37).
| A | B | C | D | E | F | G | η (%) | Pout (W) | τmax (Nm) |
| 1 | 1 | 1 | 1 | 1 | 1 | 1 | 65.50 | 26.37 | 0.0682 |
| 1 | 1 | 1 | 1 | 2 | 2 | 2 | 68.27 | 24.53 | 0.0991 |
| 1 | 1 | 1 | 1 | 3 | 3 | 3 | 70.24 | 20.95 | 0.1358 |
| 1 | 2 | 2 | 2 | 1 | 1 | 1 | 73.86 | 27.05 | 0.0692 |
| 1 | 2 | 2 | 2 | 2 | 2 | 2 | 77.08 | 27.78 | 0.1000 |
| 1 | 2 | 2 | 2 | 3 | 3 | 3 | 78.76 | 29.14 | 0.1354 |
| 1 | 3 | 3 | 3 | 1 | 1 | 1 | 79.25 | 36.21 | 0.0460 |
| 1 | 3 | 3 | 3 | 2 | 2 | 2 | 81.47 | 33.26 | 0.0706 |
| 1 | 3 | 3 | 3 | 3 | 3 | 3 | 82.24 | 32.27 | 0.0970 |
| 2 | 1 | 2 | 3 | 1 | 2 | 3 | 79.43 | 30.85 | 0.0980 |
| 2 | 1 | 2 | 3 | 2 | 3 | 1 | 78.87 | 35.03 | 0.0653 |
| 2 | 1 | 2 | 3 | 3 | 1 | 2 | 79.69 | 33.11 | 0.0753 |
| 2 | 2 | 3 | 1 | 1 | 2 | 3 | 82.18 | 28.66 | 0.1083 |
| 2 | 2 | 3 | 1 | 2 | 3 | 1 | 81.87 | 34.27 | 0.1022 |
| 2 | 2 | 3 | 1 | 3 | 1 | 2 | 81.74 | 34.07 | 0.0735 |
| 2 | 3 | 1 | 2 | 1 | 2 | 3 | 71.31 | 26.85 | 0.1038 |
| 2 | 3 | 1 | 2 | 2 | 3 | 1 | 71.51 | 32.11 | 0.0999 |
| 2 | 3 | 1 | 2 | 3 | 1 | 2 | 70.71 | 31.99 | 0.0717 |
| 3 | 1 | 3 | 2 | 1 | 3 | 2 | 81.05 | 29.08 | 0.0947 |
| 3 | 1 | 3 | 2 | 2 | 1 | 3 | 81.11 | 30.59 | 0.0668 |
| 3 | 1 | 3 | 2 | 3 | 2 | 1 | 80.76 | 33.84 | 0.0667 |
Table 7.
Comparison of reference and proposed model under Taguchi result for control factors.
| Performance | A | B | C | D | E | F | G | Results | |
| Efficiency | Reference | 2 | 2 | 1 | 2 | 3 | 2 | 2 | 72.76% |
| Proposed | 2 | 3 | 3 | 2 | 3 | 2 | 3 | 81.93% | |
| Improvement (+12.6%) | 9.17% | ||||||||
| Output Power(W) | Reference | 2 | 2 | 1 | 2 | 3 | 2 | 2 | 24.06W |
| Proposed | 2 | 3 | 3 | 3 | 2 | 1 | 1 | 34W | |
| Improvement (reduced losses (-41.3%)) | 10W | ||||||||
| Torque (Nm) | Reference | 2 | 2 | 1 | 2 | 3 | 2 | 2 | 0.098Nm |
| Proposed | 3 | 2 | 1 | 1 | 3 | 2 | 3 | 0.13Nm | |
| Improvement (+32.6%) | 0.032Nm | ||||||||
Table 8.
FEM analysis for RSM.
| Exp No |
Thickness of magnet (mm) |
Width of stator slot opening(mm) | Number of turns | η (%) | Pout (W) | τmax (Nm) |
| 1 | 3.0 | 3.0 | 72 | 80.55 | 29.2824 | 0.0975 |
| 2 | 3.5 | 2.3 | 82 | 81.34 | 26.5498 | 0.1041 |
| 3 | 4.0 | 1.5 | 92 | 82.33 | 22.1713 | 0.0944 |
| 4 | 2.7 | 2.3 | 82 | 81.94 | 28.6889 | 0.1127 |
| 5 | 4.0 | 3.0 | 92 | 83.73 | 25.9793 | 0.0927 |
| 6 | 3.5 | 2.3 | 82 | 82.20 | 29.9981 | 0.1041 |
| 7 | 3.5 | 2.3 | 82 | 82.20 | 29.9981 | 0.1041 |
| 8 | 4.3 | 2.3 | 82 | 79.62 | 28.3713 | 0.0654 |
| 9 | 3.0 | 1.5 | 92 | 83.01 | 27.2877 | 0.1284 |
| 10 | 3.0 | 1.5 | 72 | 81.70 | 30.0426 | 0.1001 |
| 11 | 3.5 | 2.3 | 82 | 82.92 | 30.2034 | 0.1041 |
| 12 | 3.5 | 2.3 | 82 | 82.92 | 30.2034 | 0.1041 |
| 13 | 3.5 | 2.3 | 66 | 77.27 | 29.2334 | 0.0835 |
| 14 | 4.0 | 3.0 | 72 | 78.49 | 29.0056 | 0.0724 |
| 15 | 3.5 | 2.3 | 99 | 83.63 | 26.4092 | 0.1257 |
| 16 | 4.0 | 1.5 | 72 | 83.28 | 30.0000 | 0.0739 |
| 19 | 3.5 | 1.0 | 82 | 82.52 | 28.3235 | 0.1051 |
| 20 | 3.5 | 2.3 | 82 | 82.92 | 30.2034 | 0.1041 |
Table 9.
Reference Model compared with Taguchi method and Taguchi based RSM.
| Performance | Reference | Taguchi Method | Taguchi Based RSM | Reference Vs Taguchi | Reference Vs Taguchi based RSM |
| Efficiency (%) | 72.76 | 81.93 | 83.65 | +13% | +15% |
| Output Power(W) | 26 | 34 | 30 | +31% | +15% |
| Torque(Nm) | 0.098 | 0.1300 | 0.1039 | +33% | +6% |
Disclaimer/Publisher’s Note: The statements, opinions and data contained in all publications are solely those of the individual author(s) and contributor(s) and not of MDPI and/or the editor(s). MDPI and/or the editor(s) disclaim responsibility for any injury to people or property resulting from any ideas, methods, instructions or products referred to in the content. |
© 2024 by the authors. Licensee MDPI, Basel, Switzerland. This article is an open access article distributed under the terms and conditions of the Creative Commons Attribution (CC BY) license (http://creativecommons.org/licenses/by/4.0/).
Copyright: This open access article is published under a Creative Commons CC BY 4.0 license, which permit the free download, distribution, and reuse, provided that the author and preprint are cited in any reuse.


