
Submitted:
11 March 2024
Posted:
12 March 2024
You are already at the latest version
Abstract
In the drive towards environmental restoration and sustainable energy solutions, effective utilization and management of agricultural crop residues are vital to mitigate greenhouse gas (GHG) emissions and waste accumulation. Converting biogenic wastes into biofuels and bioproducts has the potential to tackle the energy crisis and contribute to environmental remediation. In this investigation, teff husk, primarily generated in Ethiopia during teff production within the agro-industrial sector, is used as the feedstock for the slow pyrolysis process. In Ethiopia, it is estimated that over 1.75 million tons of teff husk are generated annually, with a significant portion being incinerated in the fields, resulting in substantial environmental pollution. This study focuses on assessing teff husk as a potential material for slow pyrolysis, a crucial stage in biochar production, to tap into its biochar-producing potential. To determine the composition of the biomass, the teff-husk was initially analyzed by thermogravimetry. The significant presence of fixed carbon indicates that teff husk is a viable candidate for pyrolytic conversion into biochar particles. The process of slow pyrolysis took place at three varied temperatures—specifically, at 400, 450, and 500 °C. Process parameters of slow pyrolysis such as reaction time, temperature, and heating rate were enhanced to obtain maximum biochar yields. The highest biochar yield of 43.4 wt% was recorded at optimized reaction time, temperature, and heating rate of 120 min, 400 °C, and 4.2 °C/min, respectively. Furthermore, biochar's physicochemical, SEM-EDX, FTIR, and TGA characterization were performed. The thermal stability and carbon content of biochar were found to rise at higher temperatures. Unlike fuel recovery, the results suggest that teff-husk can be used as a feedstock for biochar production.
Keywords:
biomass
; teff husk
; slow pyrolysis
; biofuel
; biochar
; TGA
; FTIR
; SEM
; EDX
1. Introduction
As the global population continues to increase, the production of agro-based products essential for meeting nutritional demands also rises. Worldwide, large amounts of agricultural residues are generated, often without proper disposal or recycling. In Ethiopia, a significant amount of agricultural residues are produced every year, commonly utilized in the animal feed industry and/or in composting [1]. Proper disposal and reuse of these wastes are crucial for environmental well-being. Efficient recovery not only contributes to global sustainability but also enhances profitability in both industrial and agricultural sectors, aligning with the circular economy concept. As the leading producer of agricultural residues in East Africa, Ethiopia generates an estimated residual amount of teff husk as high as 1.75 million tons [2]. For a long time, they are mainly disposed of landfill, composting, and used in incineration for energy generation. Nowadays, more than 70% of agricultural residues are directly incinerated in Ethiopia [3], which wastes resources, causes air pollution, and even endangers human health [4].
The utilization of agricultural residues to generate value-added materials with environmental applications stands as a fundamental pillar of the circular economy concept [5]. One prominent example is biochar, the solid byproduct arising from the pyrolysis of lignocellulosic biomass [6,7]. Pyrolysis is a widely employed technology for waste management purposes. What sets this process apart is its distinctive capability to generate gaseous, liquid, and biochar. Pyrolysis is a thermochemical process that relies on the decomposition of biomass in the absence of oxygen [7] to produce biochar. According to the most frequently reported in the literature, the temperature range for slow pyrolysis of biomass is 300–650 °C. However, recent research suggests an even broader temperature range from 250 to 900 °C [8]. Pyrolysis involves complex and diverse chemical reactions that take place instantly [9].
Biochar is a porous carbon-rich material derived from biomass pyrolysis in oxygen-limited conditions [10] holds promise as a useful solution with potential benefits spanning agricultural enhancement, effective waste management, carbon sequestration, catalyst support, clean energy generation, climate change mitigation, and soil improvement [11].
In most systems that currently burn pulverized coal, biochar is also a solid that can be burned to produce heat ( 18 MJ/kg) [12]. Because biochar has a low sulfur concentration, industrial biochar combustion often does not require technology to remove SOX from emissions to comply with EPA emission standards [13]. The NOX emissions from burning biochar are comparable to those from burning coal and call for similar technology for abatement.
In this study, teff husk, an abundant agricultural residue from teff grain cultivation in Ethiopia (see Figure 1), was converted into biochar by slow pyrolysis at three different temperatures under 1 atm pressure and at a heating rate of 4.2 °C per minute. Subsequently, these biochars were compared in terms of their thermal stability, chemical composition, and microstructures. The motivation to investigate these agricultural residues is related to environmental impacts linked to their cultivation and soil degradation in Ethiopia. In addition to offering a solution for waste management, achieving the conversion of waste to biochar could also be beneficial for improving soil quality. However, the biochar's yield and quality depend on factors like the pyrolysis process, feedstock traits, and operational conditions. The main objective of this study focuses on comparing the properties of the teff husk before and after its pyrolysis to biochar at three different temperatures as a basis for future studies involving their application to soil improvement.
2. Materials and Methods
2.1. Feedstock Collection and Preparation
In this study, the chosen feedstock was teff husk. This particular agricultural residue was selected due to Ethiopia's high demand for eragrostis teff compared to other crops for food security. The teff husk was collected from flour mills located in Adama and Jimma cities, Ethiopia. After collection, the samples were separated from the teff grain, washed, and air-dried for 72 hours. Subsequently, the samples were ground to a particle size of <0.5 mm.
2.2. Physicochemical Characterization of Feedstock and Products
A detailed proximate analysis of the sample was carried out according to ASTM International standards E1756-01, E872-82, and E1755-01 respectively. Fixed carbon content (FC) was calculated as the difference between 100% and the sum of moisture content (MC), volatile matter (VM), and ash content (AC), as expressed in Equation (1):
FC (wt.%) = 100 − (VM wt.% + MC wt.% + AC wt.%)
The Mohr method was used to determine the chlorine content in the sample after extraction with nitric acid (V). In an oxidizing atmosphere, a sample of known mass in direct contact with the Eschka mixture is burned to remove the combustible ingredient and convert the chlorine to alkali chlorides. To calculate amount of chlorine in checked waste samples use formula presented below:
where,
c—concentration of silver nitrate (V) solution, [mol/dm3]
—the volume of the silver nitrate (V) solution used for the determination, [cm3]
—the volume of the silver nitrate (V) solution used to the determine the blank sample, [cm3]
m—mass of titrated sample, [g]
An elemental analyzer (Perkin Elmer 2400) was used to directly determine the weight percentages of carbon (C), hydrogen (H), nitrogen (N), and sulfur (S) in the feedstock and biochar. Meanwhile, the oxygen (O) content was calculated using Equation (3):
O (%) = 100 − (%C + %H + %N + %S + %Cl))
A commercial Parr 6200 Isoperibol bomb calorimeter from Parr Instrument Company in Moline, Illinois, USA, was utilized to determine the higher heating values (HHV) of ground teff husk samples, weighing approximately 0.5–0.6 grams. This procedure followed to the ASTM D 2015 standard test method. All analyses were performed a minimum of three times to ensure data reproducibility. The summarized properties of teff husk summarized in Table 1.
2.3. Pyrolysis Procedure
Figure 2 provides a comprehensive visual representation of the intricate reaction pathway involved in the pyrolysis process of teff husk, as conducted within the confines of a batch fixed bed reactor, as explored and elucidated in the current study. With this reactor design, the pyrolysis experiments were carried out precisely with controlled conditions, which allowed us to investigate the pyrolysis phenomenon in depth. Pyrolysis of teff husk was conducted under nitrogen atmosphere within the temperatures range of 400–500 °C under 1 atm pressure and at a heating rate of 4.2 °C per minute. This temperature range was chosen with the consideration that higher temperatures can potentially augment the pyrolysis process. However, to manage energy consumption effectively, the study was limited to a maximum temperature of 500 °C.
The apparatus consisted of an electric furnace, temperature controller, a K-type thermocouple, and a condenser. A K-type thermocouple was mounted to monitor the actual temperature of the reactor. Temperature control was achieved through a proportional integral derivative (PID) temperature controller, ensuring that the reactor operated within a maximum temperature limit of 500 °C.
To initiate the pyrolysis process, 1kg of dried teff husk with particle sizes less than 0.5 mm was introduced into the reactor, as illustrated in Figure 3. The following equations were used for the determination of the yields of the products.
The optimal biochar yield, attained at 400 °C, was utilized as the reference for all experiments. To validate the data, each experiment was replicated three times, and the final yield was determined by averaging the results.
The heating rate was calculated by monitoring the increase in the reactor bed temperature as a function of time[14,15]. The pyrolysis set-up included other components like a pressure gauge, mass flow meter, and pressure relief valves. During pyrolysis experiments, condensed liquids (such as aqueous and organic phases of bio-oil) were collected inside the condenser after each procedure. While the biochar was kept at room temperature, the bio-oil was sealed in clean glass bottles to prevent polymerization.
2.4. Product Analysis
Teff husk mass loss was measured using a thermogravimetric analyzer (TGA) (STA 449 F1 Jupiter, Netzsch, Selb, Germany) [16,17]. Each sample was heated in a crucible from 40 to 900 °C at two different heating rates (5, 20 °C/min) with nitrogen flowing at 30 mL/min. At least three replicates of the experiment were conducted to ensure repeatability with an error of 1.5%. There were almost no differences between the TG and DTG curves, which resulted in very low standard deviations for the calculated kinetic parameters .
2.4.1. Surface Area and Porosity Analyses
Barret-Joyner-Halenda (BJH) [18] and Brunauer-Emmett-Teller (BET) [19] analyses were conducted using the Micromeritics ASAP 2020 apparatus, manufactured by Micromeritics Instrument Corporation in Norcross, USA. The BJH method offered information about pore size and volume, while the BET method provided insights into the surface and textural characteristics of the biochar samples. To perform the BET analysis, the adsorption-desorption isotherm of N2 at -196 °C was utilized [20]. To eliminate moisture and absorbed gases in the biochar samples after pyrolysis, the samples were degassed at 300 °C under a vacuum pressure of 500 mmHg for 4 hours before analysis.
2.4.2. Fourier-Transform Infrared Spectroscopy (FTIR) Analysis
FTIR analysis was employed to identify chemical compounds and to investigate the presence of chemical functional groups using FTIR (PERKIN ELMER RX) instrument [1]. This instrument was utilized for conducting the FTIR analysis on both the teff husk and obtained biochar. The FTIR spectra were obtained with an 8 cm-1 resolution spanning the 400–4000 cm-1 area.
2.4.3. Scanning Electron Microscopy with Energy-Dispersive X-ray Spectroscopy (SEM-EDX) Analysis
The study included an analysis of biochar images obtained at various temperatures using Scanning Electron Microscopy with Energy-Dispersive X-ray Spectroscopy (SEM-EDX) [21]. SEM images were captured by using a JEOL (JSM-6480 LV) microscope with an acceleration voltage of 10 kV, allowing for a detailed examination of the biochar's surface morphology at magnifications of 1000X, 2500X, and 4000X. Additionally, EDX was employed to identify the elemental composition of the biochar. To ensure a comprehensive analysis, random areas of interest were selected to investigate the elements present in each sample.
2.4.4. pH and Electrical Conductivity
The electrical conductivity (EC) and pH value of biochar samples (<0.5 mm) were determined using an Elite PCTS pH/conductivity meter (ThermoFisher Scientific, Mississauga, Canada) [22]. This measurement was conducted after the biochar had been mixed with deionized water for 24 h at a 1:5 ratio of biochar and water with sporadic agitation [23]. To validate the data, each experiment was repeated in 3 replicates, and the average result was taken as the final yield.
3. Results and Discussion
3.1. Characteristics of Feedstock
Table 1 provides a summary of the proximate and elemental analyses conducted on teff husk. The results show that teff husk contains moisture, ash, and volatile matter contents of 8.57 wt.%, 6.13 wt.%, and 76.85 wt.%, respectively. The high volatile content in teff husk indicated its suitability as a feedstock for biochar production via slow pyrolysis [24]. Elemental analysis showed that teff husk has carbon (41.39 wt.%) and hydrogen (7.77 wt.%) similar to the value reported in the literature, with sulfur and chlorine present in minimal amounts of 0.055 wt.% and 0.0063 wt.%, respectively. The fixed carbon content, calculated using Equation (1), is 11.19 wt.%. During biochar synthesis, teff husk is expected to release low levels of sulfur and nitrogen oxides. This makes it an environmentally friendly feedstock for slow pyrolysis due to its low nitrogen, chlorine, and sulfur concentrations as determined by elemental analysis.
The higher heating value (HHV) of teff husk in this study is 15.41 MJ/kg, slightly exceeding the value reported by Leitea et al. [25]. However, teff husk exhibits a lower HHV compared to other biomasses, such as coconut, cassava rhizomes, and oil palm, which respectively present HHV values of 17.77 MJ/kg, 23.67 MJ/kg, and 19.35 MJ/kg [26,27,28]. According to Jung et al. [29], higher fixed carbon contents lead to increased heat production during combustion, resulting in a higher heating value. The TG and DTG profiles of the raw teff husk sample for the temperature range of 40–800 °C, with a heating rate of 10°C/min, are presented in Figure 3. The TG plot indicates that heat starts to penetrate the teff husk at approximately 110 °C, leading to the removal of inherent moisture, which constitutes about 8% of the sample weight. The primary degrading processes, including depolymerization, cracking, and decarboxylation, occur within the temperature range of 155–650 °C. Thermal degradation of teff husk initiates around 155 °C, reaching its peak between 270 °C and 425 °C. This finding is agreed with recent studies on lignocellulosic feedstocks characterized by high ash and potassium content, suggesting the catalytic effect of ash [30,31]. Devolatilization of the sample is almost complete at around 650 °C. Additionally, the TGA results reveal two main weight loss regimes for teff husk. The decomposition of hemicellulose and the early stages of cellulose decomposition are associated with the lower temperature regime (155–350 °C), while the later stages of cellulose decomposition primarily occur in the upper temperature regime (350–455 °C). Lignin thermal degradation occurs across the pyrolysis temperature range (170–560 °C).
3.2. Thermal Decomposition Analysis of Teff Husk
The thermogravimetric analysis of teff husk is shown in Figure 4. The thermal degradation of the raw material indicated three weight loss regions. The first weight loss step occurred at the temperature range between 70 °C and 270 °C, where moisture content in the teff husk was removed. The second weight loss step happened at the temperature range of 270–425 °C where volatilization of hemicelluloses and residual oil occurs. The third weight loss occurs from 425–650 °C with the inflection point at 350 °C where the maximum rate of weight loss occurs, which may be due to the decomposition of lignin and cellulose.
3.3. The Influence of Heating Rate and Pyrolysis Temperature
The pivotal parameter in the biochar production process is the influence of heating rate and reaction temperature on product yield. Extensive literature surveys and previous studies have consistently highlighted the significant role of pyrolysis temperature in determining the distribution of products[32,33,34]. Figure 5 (a) shows the high heating rate affects the weight loss. A heating rate of 20 °C per minute leads to rapid fragmentation of teff husk, which may increase the volatiles' production and decrease the ash residues. The primary reason for the increased volatiles is the additional tar decompositions at high heating rates. The lower heating rate at 400 °C tends to maximize the yield of biochar, while a higher heating rate favors bio-oil formation. The percentage yield of products from the pyrolysis experiment at different reaction temperature is shown in Figure 6. In this study the pyrolysis temperature from 400 °C to 500 °C shown the biochar yield decreased from 43.4 wt% to 36.1 wt% (Figure 6). The result in Figure 6 showed that the effect of temperature had been clearly observed on the distribution of the products.
3.4. Biochar Characterization
3.4.1. Physicochemical Characterization
The physicochemical properties of biochar derived from teff husk obtained at 400 °C, 450 °C, and 500 °C is shown in Table 2. Teff husk pyrolysis generated biochars with high carbon contents (47.21–54.75%), low hydrogen contents (2.75–4%), and moderate oxygen contents (40.69–42.28%). The carbon content of the biochar was higher than that of the feedstock as shown in Table 2.
Additionally, the biochar's carbon content increases as the temperature increases. The decarboxylation, dehydration, and decarbonylation reactions that occurred during the pyrolysis may cause the biochar's reduced oxygen and hydrogen levels compared to the feedstock. The hydrogen value in biochar, on the other hand, generally declined with temperature along the following trend: 4% (400 °C) > 3.52% (450 °C) > 2.75%. (500 °C). Additionally, the tendency for the biochar's oxygen content decreased with temperature.
The decrease in oxygen and hydrogen could result from the temperature increase, enhancing the dehydration and deoxygenation reactions. The aromatization and subsequent formation of hydrogen gas (H2) as a result of the production of low molecular weight hydrocarbons (CH4, C2H6, or C2H4) was another potential cause of biochar's low hydrogen content [18,35,36].
It should be noted that as the pyrolysis temperature increased, the nitrogen content of the biochar produced from teff husk pyrolysis dropped. It might be because nitrogen is released into the gas phase when the pyrolysis temperature increases. The HHV of the biochar produced from the pyrolysis of teff husks was in the range of 21.22 to 22.8 MJ/kg, which is relatively more significant than the values of lower-ranked coals (12 to 25 MJ/kg [37]. Teff husk biochar may be used as a solid renewable fuel due to its high calorific values and carbon content. The bio-nitrogen char's content ranged from 1.32 to 1.75%, which is crucial information for estimating the NOx emissions that will result from burning the biochars. Additionally, Table 2 also includes the ultimate analysis of low-rank coal-lignite for sake of comparisons.

Table 2.
Physicochemical characteristics of biochar at different pyrolysis temperatures.
| Characteristics |
Results Temperatures (°C) |
|||
| 400 °C | 450 °C | 500 °C | Low-rank coallignite [13,38] | |
| BET surface area (m2/g) | 25.70 | 32.65 | 43.23 | 10.09 (500 °C) |
| pH | 7.65 | 8.02 | 9.52 | - |
| Proximate analysis, (wt.% as dry bases) | ||||
| Moisture | 3.4 | 2.10 | 1.32 | - |
| Volatile matter | 25.42 | 14.26 | 14.1 | |
| Fixed carbon | 46.25 | 52 | 55 | |
| Ash | 7.25 | 12.78 | 15.63 | |
| Ultimate Analysis (wt.% as dry bases) | ||||
| Carbon | 47.21 | 51.96 | 54.75 | 58.78 |
| Hydrogen | 3.99 | 3.52 | 2.75 | 4.9–7.0 |
| Nitrogen | 1.75 | 1.56 | 1.32 | 0.6–2.4 |
| Sulfur | 0.023 | 0.016 | 0.03 | 0.3–6.0 |
| Chlorine | 0.00 | 0.00 | 0.00 | - |
| Oxygena | 42.27 | 41.40 | 40.69 | 12–30 |
| Calorific value HHV (MJ/kg) | 22.34 | 21.22 | 22.80 | 12.00–25 |
a by difference.
4.4.2. Thermogravimetric Analysis of Biochar (TGA)
Figure 7 shows the biochar TGA curves. There were two stages to the thermal decomposition of all the biochar’s. The first phase started at about 100 °C and was caused mainly by moisture evaporation. Slow devolatilization has occurred at temperatures higher than 300 °C up to 950 °C, at which the rate of weight loss accelerated. The amount of residual carbon was lowest at 400 °C and highest at 500 °C.
3.4.2. Fourier Transform Infrared Spectroscopy (FTIR) Characterization
The functional groups in the biochar generated from tef husk pyrolysis were identified using FTIR analysis. Figure 8 displays the infrared spectra of three different types of biochar. Their wavenumbers and shape are similar and comparable.
There are several peaks that show the biochar's structure contains the functional groups O–H, C–O, and C–C, as well as aromatic rings. Table 3 presents details on the typical band assignments for the three types of biochars.
3.4.3. Scanning Electron Microscopy SEM) Analysis
SEM analysis of biochar samples was conducted to study the textural property, surface morphology, and porous structure. The SEM images of biochar produced from teff husk, at different temperatures, are shown in Figure 9. Based on SEM images, it is concluded that porosity and pore sizes increase with temperature. At 400 °C, only a few number of pores appeared due to the low decomposition of volatile matter. However, as the temperature reached 450 °C, a substantial increase in both the number and size of pores was observed on the surface of solid biochar, as shown in Figure 9. The significant development of micro-sized pores at a temperature of 450 °C resulted in a notable expansion of the biochar samples' surface area [39]. These findings were attributed to the rapid release of volatile compounds during pyrolysis at higher temperatures. The results obtained in this study align closely with previous research [40], who investigated the impact of pyrolysis temperature on biochar porosity and pore size using SEM and BET analysis simultaneously. It has been found that the pyrolysis reaction obtained in this study closely matches Yang et al.'s results regarding biochar porosity.
However, at 500 °C, these pores might be blocked and combined, thereby reducing in size due to the plastic nature of the biochar. Additionally, a significant number of pore blockages may arise from the melting and combination of minerals, which are primary constituents of biochar produced at high temperatures. The maximum porosity development occurred at 450 °C, correlating with the peak devolatilization phase during pyrolysis. Additionally, these images showed the uneven distribution of pores and the surface texture. White spots on the surface indicate the presence of residual ash.
The presence of large pores at the surface of biochar has multifunctional values that include the use for the following purposes: porous material for mitigating greenhouse gas emissions and odorous compounds, catalyst for industrial applications, soil amendment to improve soil health, nutrient, and microbial carrier, increase metal adsorption capacity by chemisorption method [41].
3.4.4. Energy-Dispersive X-ray Spectroscopy (SEM-EDX) Analysis
The EDX analysis confirmed that biochar contains a range of inorganic elements including C, O, N, Al, Ca, Fe, Si, K, P, and Mg. Biochar enriched with these elements is applied to soil as a fertilizer, especially in acidic soil, it provides essential plant nutrients [30,36]. The presence of N, P, and K within biochar samples are the essential macronutrients for plants, supporting their growth and fertility. The oxygen, gold, and carbon values obtained from the EDX investigation were observed to be slightly higher than those of other elements in all examinations. The surface elemental analysis of the biochar, conducted using EDX, indicates the predominance of C (41.50wt%), O (18.50wt%), and Au (24.65%) as its primary components summarized in Table 4. Images were taken at magnifications of 1000X and 2500X. The examination at 450 °C shows the presence of C (47.45 wt%), O (14.36 wt%), and Au (28.33 wt%) Table 5.
The images were captured at magnifications of 1000X, 2500X, and 4000X. "Moreover, at 500°C, the analysis shows the composition, including C (53.15 wt%), O (4.04 wt%), and Au (39.88 wt%), with detailed images taken at magnifications of 1000X and 2500X." Table 6. As the teff husk was manually separated from its grain on the earth's surface, there is a possibility that gold might be present in this biochar. This indicates that some minerals could potentially mixed with the teff husk from the soil during the separation process. As a final note, FTIR analysis (Figure 2) indicated the presence of robust CO2 characteristic bands in the spectra of the three biochars [42] suggesting their potential as sorbents for atmospheric CO2. Previous research has demonstrated the effectiveness of biochar-amended soil in reducing atmospheric CO2 concentrations, presenting biochar as a viable candidate for mitigating CO2 emissions, particularly in heavily polluted areas [43]. In light of this, the biochars used in this study could potentially be applied in similar applications, but this will require further research is necessary.
4. Conclusions
In this study, the pyrolysis of teff husk was conducted within a fixed bed reactor at temperatures ranging from 400 °C to 500 °C. The teff husk particles used were smaller than 0.5 mm, and the reactor had a nominal capacity of 1 kg/h. Subsequently, the produced biochar underwent characterization. At a temperature of 400 °C, the maximum biochar yield achieved was 43.4 wt.%, a result that aligns with the biochar yield obtained from various other agricultural residues. The physical and chemical properties of the biochars produced from teff husk at different temperatures are quite similar to those obtained from other agricultural residues in existing literature. The elemental analysis of the product indicated the following composition: carbon (41.39 wt.%), hydrogen (7.77 wt.%), oxygen (48.46 wt.%), and nitrogen (2.323 wt.%). Thermogravimetric Analysis (TGA) conducted in an inert gas (N2) showed notable differences in the thermal degradation behavior among the three biochars. In future research, emphasis will be placed on establishing correlations between the biochar properties identified in this study and their potential implications for soil improvement or other environmental applications.
Author Contributions
Author Contributions: Conceptualization, M.A. and M.L.; methodology, M.A.; formal analysis, M.A, and P.F.; investigation, M.A and M.L.; resources, M.T.; writing—original draft preparation, M.A.; writing—review and editing, K.P and M.L.; visualization, K.P, and M.L. All authors have read and agreed to the published version of the manuscript.
Funding
This research received no external funding.
Institutional Review Board Statement
Not applicable.
Informed Consent Statement
Not applicable.
Data Availability Statement
Not applicable.
Acknowledgments
The authors wish to thank the Silesian University of Technology and Jimma University for providing funding and research materials.
Conflicts of Interest
The authors declare no conflict of interest.
Nomenclature
BT—Bio-oil at a given temperature
DTG—Derivative thermogravimetric
EDX—Energy dispersive X-ray spectroscopy
FTIR—Fourier Transform Infrared Spectroscopy
GHG—Greenhouse gas
HHV—Higher heating value
PID—proportional integral derivative
TH—Teff husk
TGA—Thermogravimetric Analysis
References
- Landrat, M.; Abawalo, M.T.; Pikoń, K.; Turczyn, R. Bio-Oil Derived from Teff Husk via Slow Pyrolysis Process in Fixed Bed Reactor and Its Characterization. Energies 2022, 15, 9605. [Google Scholar] [CrossRef]
- Tolessa, A. Bioenergy Potential from Crop Residue Biomass Resources in Ethiopia. Heliyon 2023, 9, e13572. [Google Scholar] [CrossRef] [PubMed]
- Lee, H. Teff, A Rising Global Crop: Current Status of Teff Production and Value Chain. TOASJ 2018, 12, 185–193. [Google Scholar] [CrossRef]
- Gabisa, E.W.; Gheewala, S.H. Potential of Bio-Energy Production in Ethiopia Based on Available Biomass Residues. Biomass and Bioenergy 2018, 111, 77–87. [Google Scholar] [CrossRef]
- Amalina, F.; Razak, A.S.A.; Krishnan, S.; Sulaiman, H.; Zularisam, A.W.; Nasrullah, M. Biochar Production Techniques Utilizing Biomass Waste-Derived Materials and Environmental Applications – A Review. Journal of Hazardous Materials Advances 2022, 7, 100134. [Google Scholar] [CrossRef]
- Zhang, J.; Lü, F.; Luo, C.; Shao, L.; He, P. Humification Characterization of Biochar and Its Potential as a Composting Amendment. Journal of Environmental Sciences 2014, 26, 390–397. [Google Scholar] [CrossRef] [PubMed]
- Yazhini, G.; Abishek, R.; Ilakiya, T.; Shanmugapriya, S.; Piriya, R.S. Beneficial Effects of Biochar on Agriculture and Environments. IRJPAC 2020, 74–88. [Google Scholar] [CrossRef]
- He, Z.; Uchimiya, S.M.; Guo, M. Production and Characterization of Biochar from Agricultural By-Products: Overview and Use of Cotton Biomass Residues. In SSSA Special Publications; Guo, M., He, Z., Uchimiya, S.M., Eds.; American Society of Agronomy and Soil Science Society of America: Madison, WI, USA, 2015; pp. 63–86. ISBN 978-0-89118-967-1. [Google Scholar]
- Zhao, Z.; Ibrahim, M.M.; Wang, X.; Xing, S.; Heiling, M.; Hood-Nowotny, R.; Tong, C.; Mao, Y. Properties of Biochar Derived from Spent Mushroom Substrates. BioRes 2019, 14, 5254–5277. [Google Scholar] [CrossRef]
- Wardani, S.; Pranoto; Himawanto, D.A. Kinetic Parameters and Calorific Value of Biochar from Mahogany (Swietenia Macrophylla King) Wood Pyrolysis with Heating Rate and Final Temperature Variations. Surabaya, Indonesia, 2018; p. 020034. [Google Scholar]
- Yue, Y.; Lin, Q.; Xu, Y.; Li, G.; Zhao, X. Slow Pyrolysis as a Measure for Rapidly Treating Cow Manure and the Biochar Characteristics. Journal of Analytical and Applied Pyrolysis 2017, 124, 355–361. [Google Scholar] [CrossRef]
- Erdem, A.; Dogru, M. Process Intensification: Activated Carbon Production from Biochar Produced by Gasification: Highly Porous Carbon Substances with Low Production Costs. Johnson Matthey Technology Review 2021, 65, 352–365. [Google Scholar] [CrossRef]
- Suman, S. Conversion of Solid Biomass into Biochar: Act as a Green, Eco-Friendly Energy Source and a Substitute of Fossil Fuel Inputs. In Proceedings of the The First World Energies Forum—Current and Future Energy Issues; MDPI, September 11 2020; p. 34. [Google Scholar]
- Ma, Y.; Wang, M.; Zhao, X.; Dai, X.; He, Y. Study of the Microstructural Characteristics of Low-Rank Coal under Different Degassing Pressures. Energies 2022, 15, 3691. [Google Scholar] [CrossRef]
- Higashikawa, F.S.; Conz, R.F.; Colzato, M.; Cerri, C.E.P.; Alleoni, L.R.F. Effects of Feedstock Type and Slow Pyrolysis Temperature in the Production of Biochars on the Removal of Cadmium and Nickel from Water. Journal of Cleaner Production 2016, 137, 965–972. [Google Scholar] [CrossRef]
- Jesus, M.S.D.; Martinez, C.L.M.; Costa, L.J.; Pereira, E.G.; Carneiro, A.C.O.D. Thermal Conversion of Biomass: A Comparative Review of Different Pyrolysis Processes. RCM 2020, 11, 12–22. [Google Scholar] [CrossRef]
- Chia, C.H.; Gong, B.; Joseph, S.D.; Marjo, C.E.; Munroe, P.; Rich, A.M. Imaging of Mineral-Enriched Biochar by FTIR, Raman and SEM–EDX. Vibrational Spectroscopy 2012, 62, 248–257. [Google Scholar] [CrossRef]
- Dhar, S.A.; Sakib, T.U.; Hilary, L.N. Effects of Pyrolysis Temperature on Production and Physicochemical Characterization of Biochar Derived from Coconut Fiber Biomass through Slow Pyrolysis Process. Biomass Conv. Bioref. 2022, 12, 2631–2647. [Google Scholar] [CrossRef]
- Reza, M.S.; Afroze, S.; Bakar, M.S.A.; Saidur, R.; Aslfattahi, N.; Taweekun, J.; Azad, A.K. Biochar Characterization of Invasive Pennisetum Purpureum Grass: Effect of Pyrolysis Temperature. Biochar 2020, 2, 239–251. [Google Scholar] [CrossRef]
- Kalus, K.; Koziel, J.A.; Opaliński, S. A Review of Biochar Properties and Their Utilization in Crop Agriculture and Livestock Production. Applied Sciences 2019, 9, 3494. [Google Scholar] [CrossRef]
- Aboelela, D.; Saleh, H.; Attia, A.M.; Elhenawy, Y.; Majozi, T.; Bassyouni, M. Recent Advances in Biomass Pyrolysis Processes for Bioenergy Production: Optimization of Operating Conditions. Sustainability 2023, 15, 11238. [Google Scholar] [CrossRef]
- Alper, K.; Tekin, K.; Karagöz, S. Pyrolysis of Agricultural Residues for Bio-Oil Production. Clean Techn Environ Policy 2015, 17, 211–223. [Google Scholar] [CrossRef]
- Karaeva, J.; Timofeeva, S.; Islamova, S.; Bulygina, K.; Aliev, F.; Panchenko, V.; Bolshev, V. Pyrolysis of Amaranth Inflorescence Wastes: Bioenergy Potential, Biochar and Hydrocarbon Rich Bio-Oil Production. Agriculture 2023, 13, 260. [Google Scholar] [CrossRef]
- Onay, Ö. Production of Bio-Oil from Biomass: Slow Pyrolysis of Rapeseed (Brassica naps L. ) in a Fixed-Bed Reactor. Energy Sources 2003, 25, 879–892. [Google Scholar]
- Leite, S.; Leite, B.; Carrico, C.; Dell’Isola, A.T.; Dangelo, J.V. Characterization of Biomass Residues Aiming Energy and By-Products Generation. Chem. Eng. Trans. 2018, 65, 733–738. [Google Scholar]
- Sugumaran, V.; Prakash, S.; Ramu, E.; Arora, A.K.; Bansal, V.; Kagdiyal, V.; Saxena, D. Detailed Characterization of Bio-Oil From Pyrolysis of Non-Edible Seed-Cakes by Fourier Transform Infrared Spectroscopy (Ftir) and Gas Chromatography Mass Spectrometry (Gc–Ms) Techniques. J. Chromatogr. B 2017, 1058, 47–56. [Google Scholar] [CrossRef] [PubMed]
- Wu, L.; Guo, S.; Wang, C.; Yang, Z. Production of alkanes (C7–C29) from different part of poplar tree via direct deoxy-liquefaction. Bioresour. Technol. 2009, 100, 2069–2076. [Google Scholar] [CrossRef] [PubMed]
- Elliott, D.C. Historical developments in hydro-processing bio-oils. Energy Fuels 2007, 21, 1792–1815. [Google Scholar] [CrossRef]
- Jung, S.-H.; Kang, B.-S.; Kim, J.-S. Production of bio-oil from rice straw and bamboo sawdust under various reaction conditions in a fast pyrolysis plant equipped with a fluidized bed and a char separation system. J. Anal. Appl. Pyrolysis 2008, 82, 240–247. [Google Scholar] [CrossRef]
- Adjaye, J.D.; Bakhshi, N.N. Production of hydrocarbons by catalytic upgrading of a fast pyrolysis bio-oil. Part I: Conversion over various catalysts. Fuel Process. Technol. 1995, 45, 185–202. [Google Scholar] [CrossRef]
- Adjaye, J.D.; Bakhshi, N.N. Production of hydrocarbon by catalytic upgrading of a fast pyrolysis bio-oil. 2. Comparative catalyst performance and reaction pathways. Fuel Process. Technol. 1995, 45, 185–202. [Google Scholar] [CrossRef]
- Song, H.; Wang, J.; Garg, A.; Lin, X.; Zheng, Q.; Sharma, S. Potential of Novel Biochars Produced from Invasive Aquatic Species Outside Food Chain in Removing Ammonium Nitrogen: Comparison with Conventional Biochars and Clinoptilolite. Sustainability 2019, 11, 7136. [Google Scholar] [CrossRef]
- Patra, B.R.; Nanda, S.; Dalai, A.K.; Meda, V. Slow Pyrolysis of Agro-Food Wastes and Physicochemical Characterization of Biofuel Products. Chemosphere 2021, 285, 131431. [Google Scholar] [CrossRef]
- Tomczyk, A.; Sokołowska, Z.; Boguta, P. Biochar Physicochemical Properties: Pyrolysis Temperature and Feedstock Kind Effects. Rev Environ Sci Biotechnol 2020, 19, 191–215. [Google Scholar] [CrossRef]
- Wu, M.; Feng, Q.; Sun, X.; Wang, H.; Gielen, G.; Wu, W. Rice (Oryza Sativa L) Plantation Affects the Stability of Biochar in Paddy Soil. Sci Rep 2015, 5, 10001. [Google Scholar] [CrossRef]
- Parthasarathy, P.; Alherbawi, M.; Pradhan, S.; Al-Ansari, T.; Mackey, H.R.; McKay, G. Pyrolysis Characteristics, Kinetic, and Thermodynamic Analysis of Camel Dung, Date Stone, and Their Blend Using Thermogravimetric Analysis. Biomass Conv. Bioref. 2022. [Google Scholar] [CrossRef]
- Tolessa, A. Bioenergy Production Potential of Available Biomass Residue Resources in Ethiopia. Journal of Renewable Energy 2023, 2023, 1–12. [Google Scholar] [CrossRef]
- Pawlak-Kruczek, H. 2 - Properties of Low Rank Coals and Resulting Challenges in Their Utilization. In Low-Rank Coals for Power Generation, Fuel and Chemical Production, Luo, Z., Agraniotis, M. ed; Woodhead Publishing, 2017; pp. 23–40. ISBN 978-0-08-100895-9. [Google Scholar]
- Tolessa, A. Potential of Biomethane-Based Energy Production from Livestock Waste Biomass Resources in Ethiopia. Frontiers in Energy Research 2023, 11. [Google Scholar] [CrossRef]
- Amenaghawon, A.N.; Anyalewechi, C.L.; Okieimen, C.O.; Kusuma, H.S. Biomass Pyrolysis Technologies for Value-Added Products: A State-of-the-Art Review. Environ Dev Sustain 2021, 23, 14324–14378. [Google Scholar] [CrossRef]
- Uddin, M.N.; Techato, K.; Taweekun, J.; Rahman, M.M.; Rasul, M.G.; Mahlia, T.M.I.; Ashrafur, S.M. An Overview of Recent Developments in Biomass Pyrolysis Technologies. Energies 2018, 11, 3115. [Google Scholar] [CrossRef]
- Onay, O. Influence of Pyrolysis Temperature and Heating Rate on the Production of Bio-Oil and Char from Safflower Seed by Pyrolysis, Using a Well-Swept Fixed-Bed Reactor. Fuel Processing Technology 2007, 88, 523–531. [Google Scholar] [CrossRef]
- Liu, Y.; Paskevicius, M.; Wang, H.; Parkinson, G.; Wei, J.; Asif Akhtar, M.; Li, C.-Z. Insights into the Mechanism of Tar Reforming Using Biochar as a Catalyst. Fuel 2021, 296, 120672. [Google Scholar] [CrossRef]
Figure 1.
Teff with its residues: a) Teff b) Teff husk c) Produced biochar.
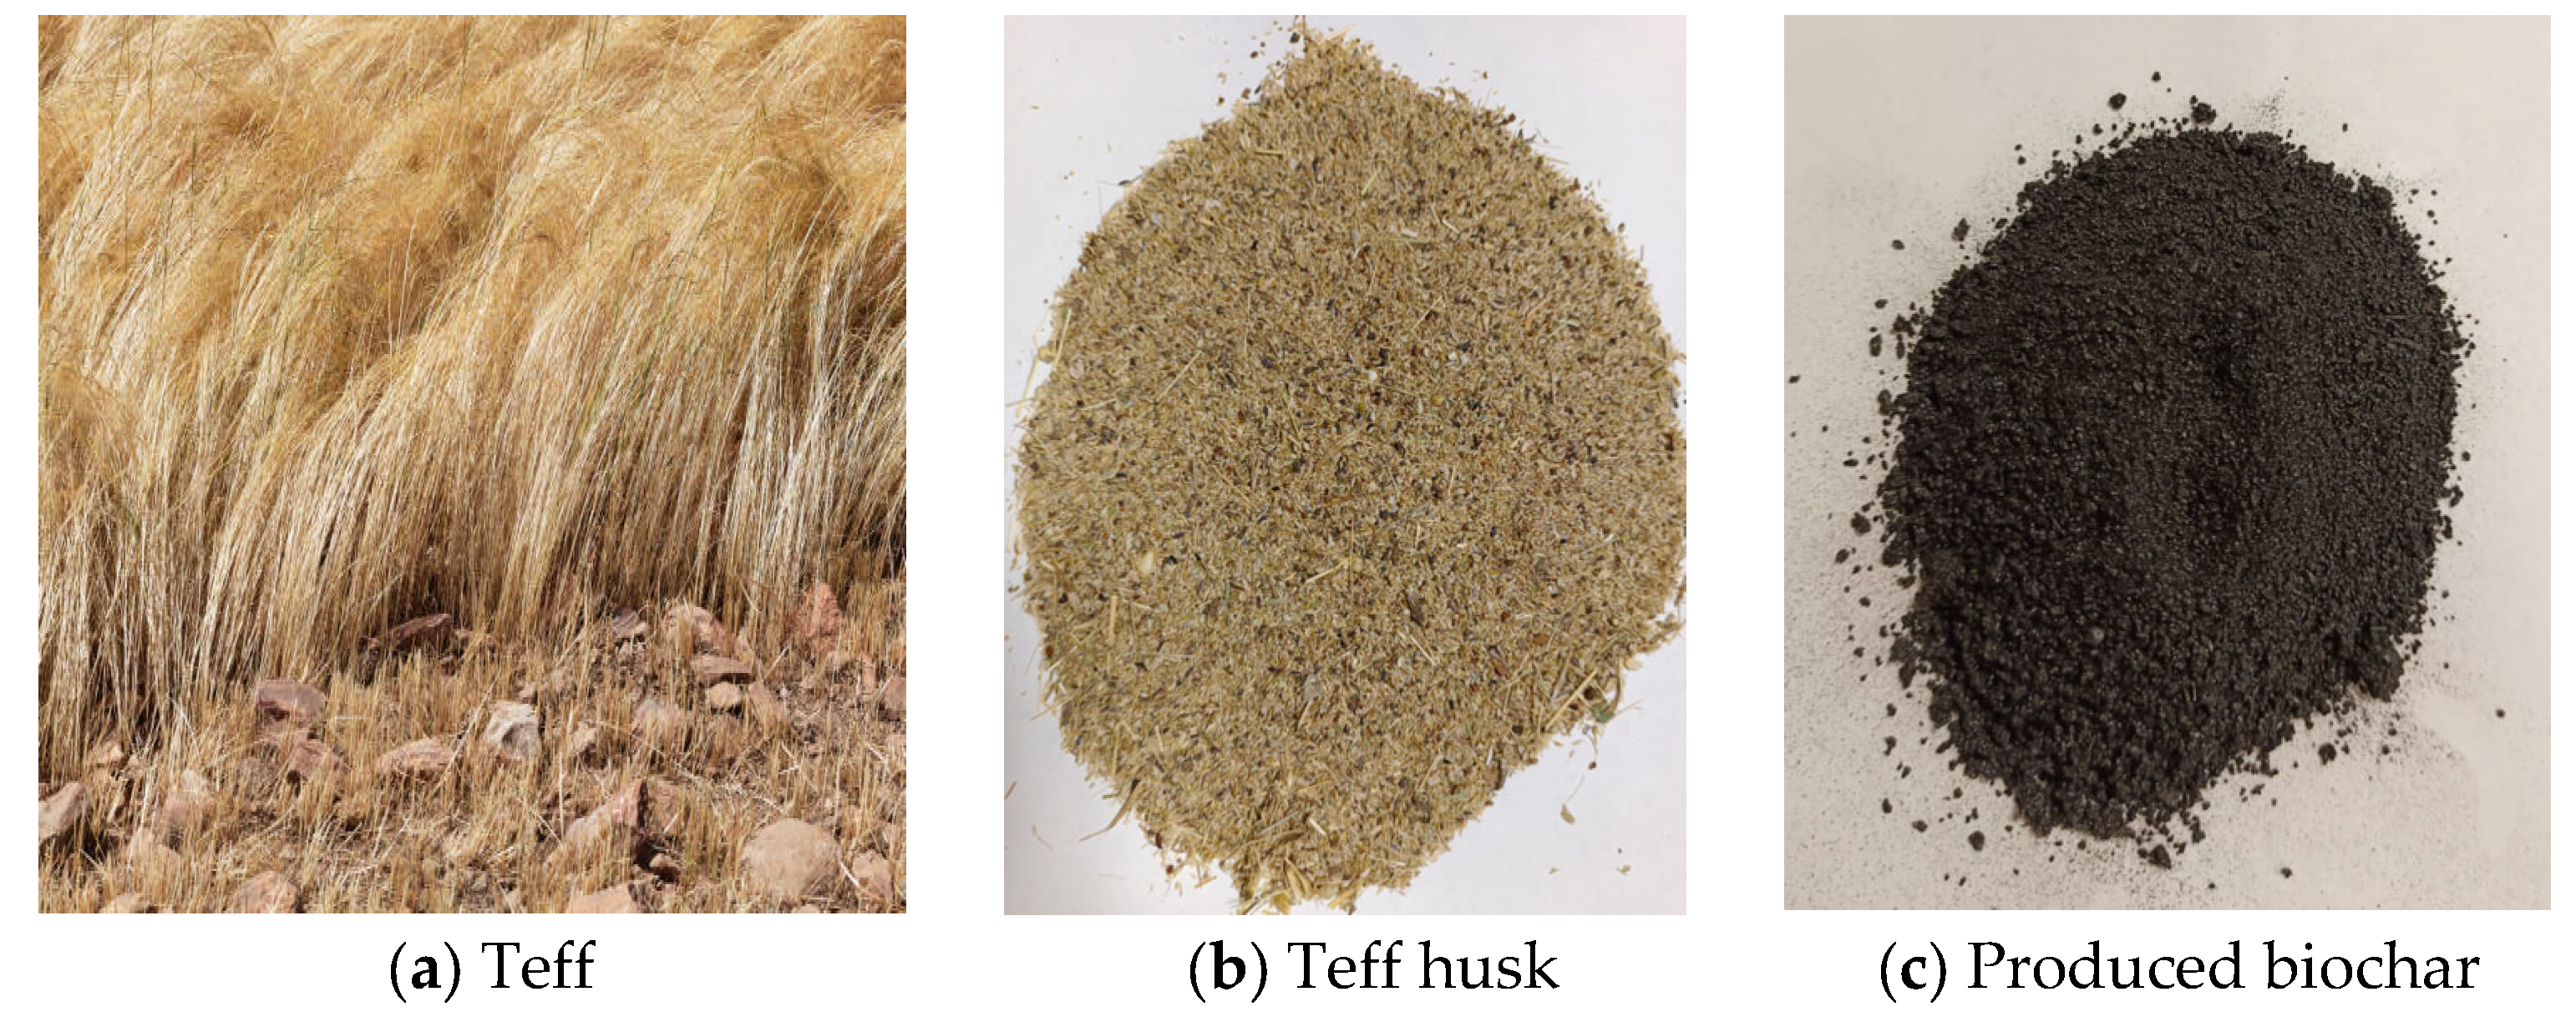
Figure 2.
Reaction pathway of pyrolysis process.
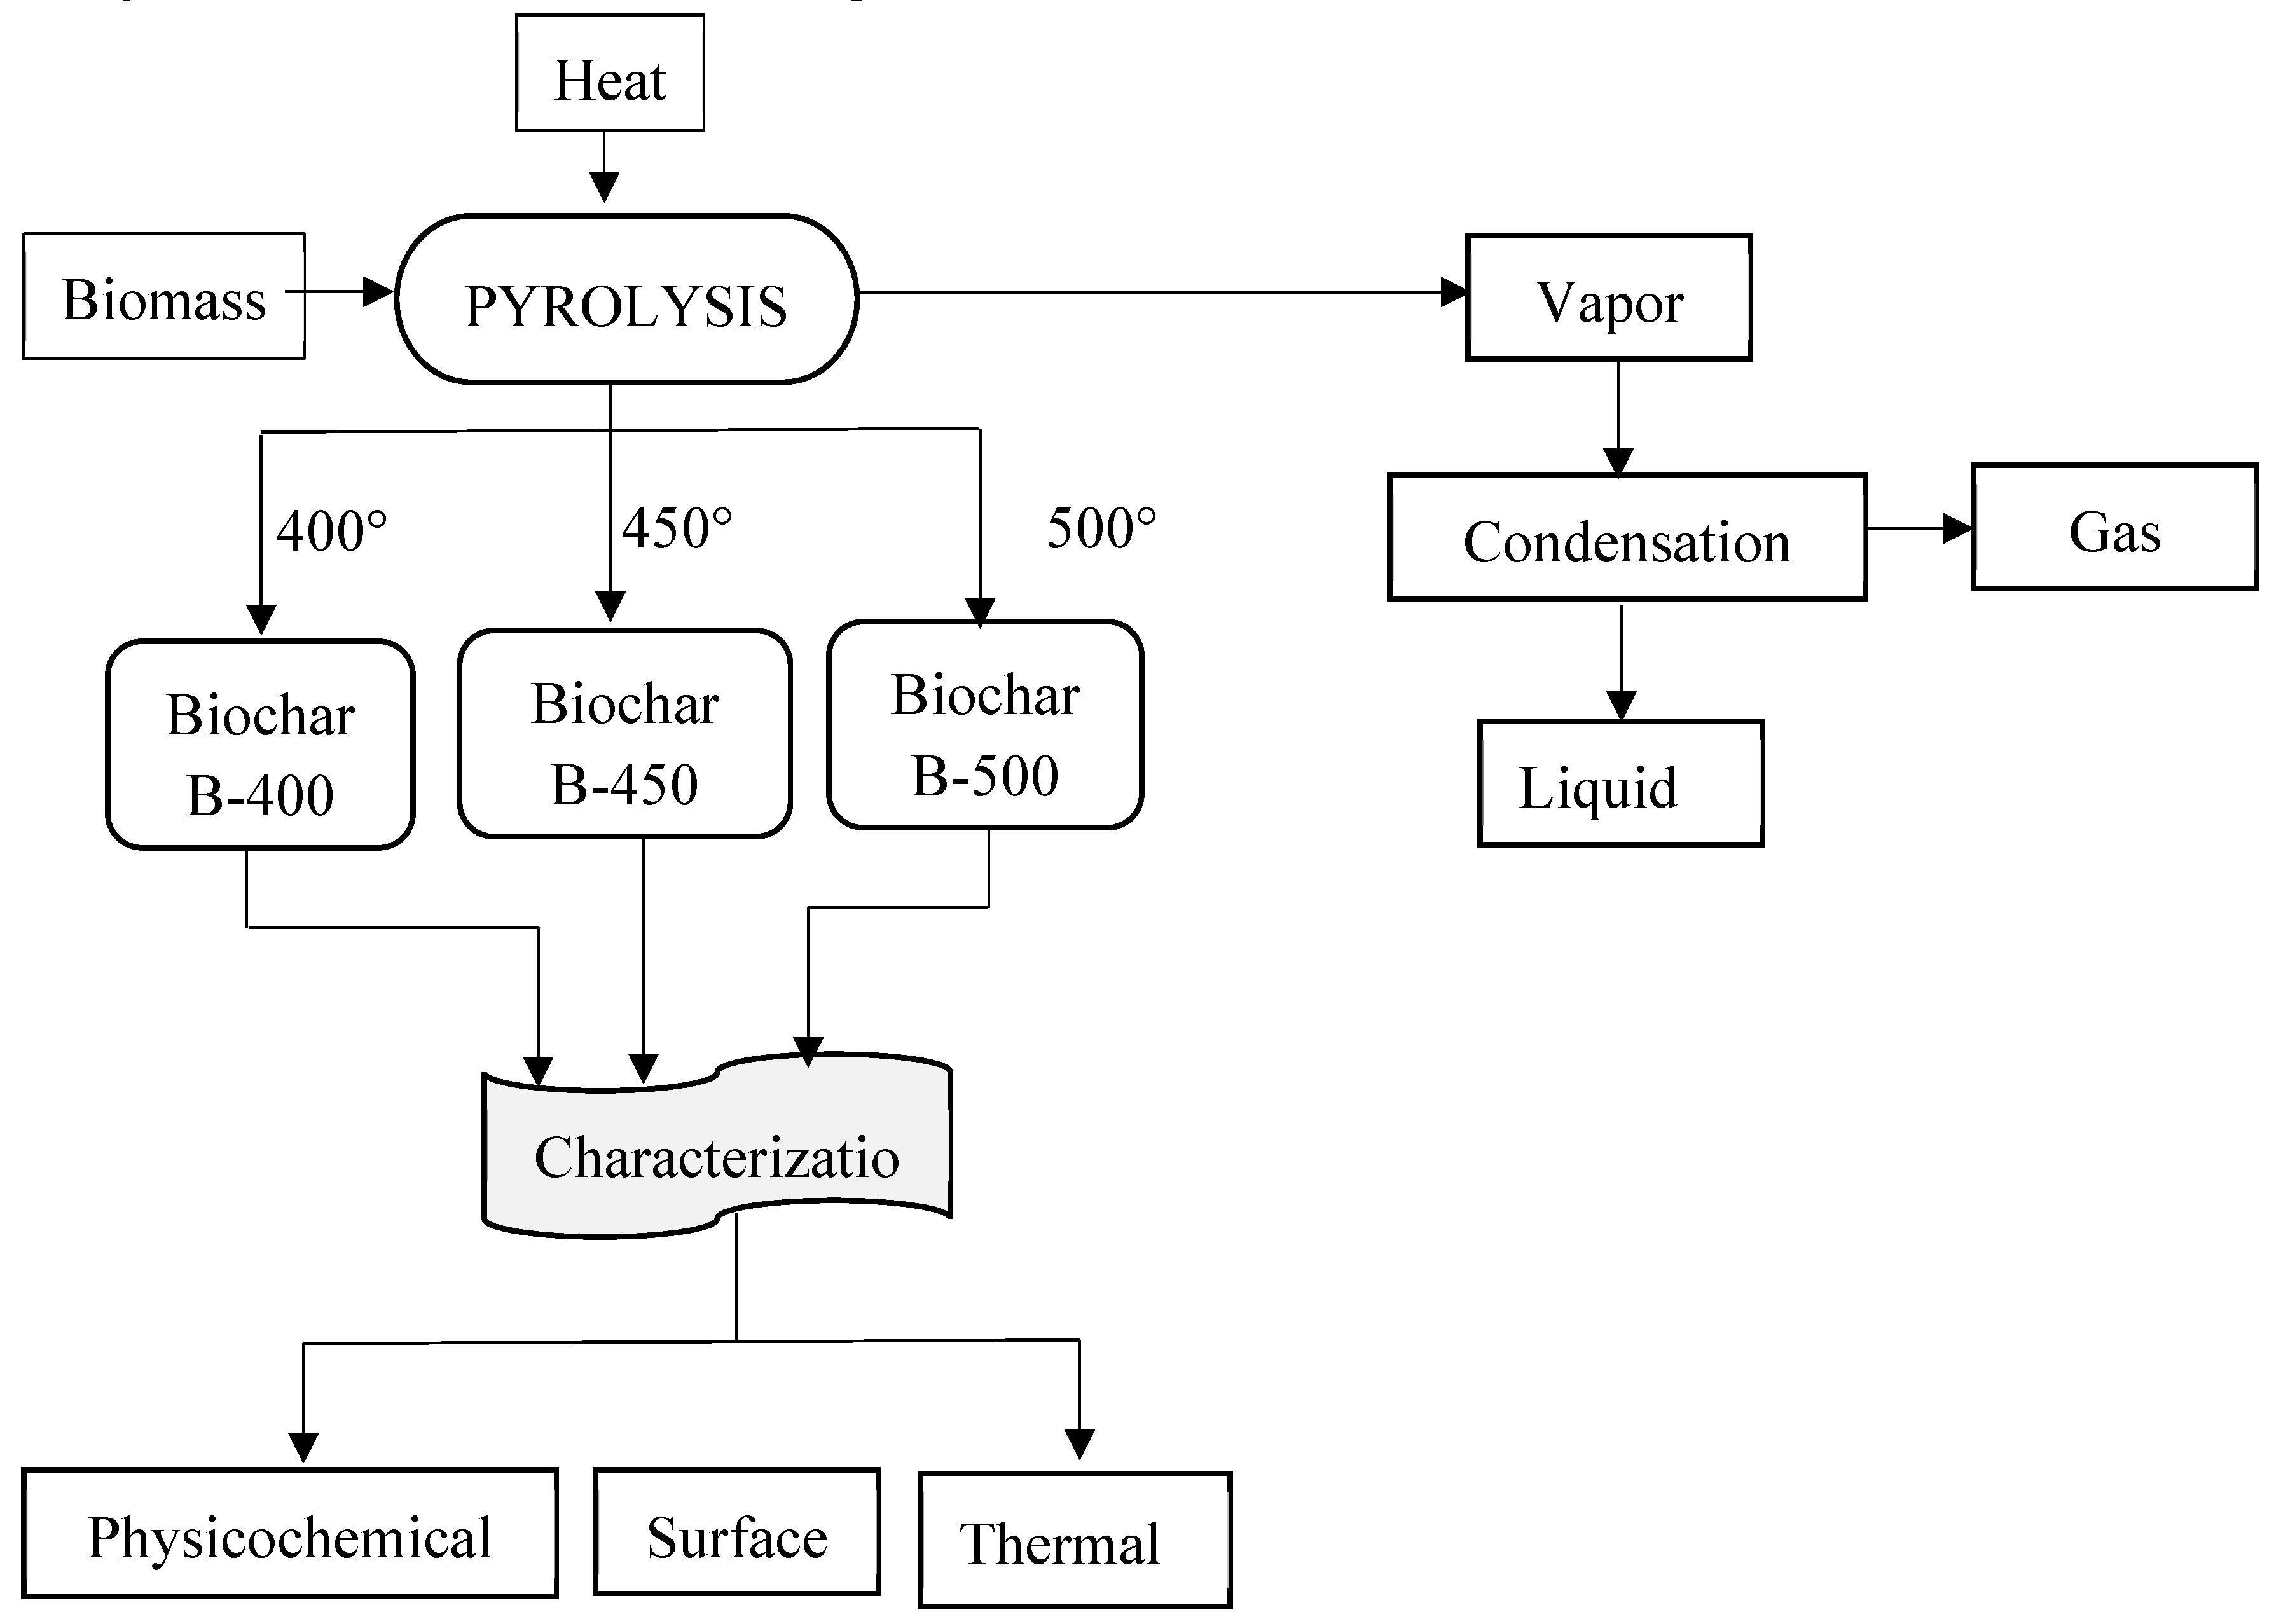
Figure 3.
Schematic diagram of the pyrolysis experimental setup.
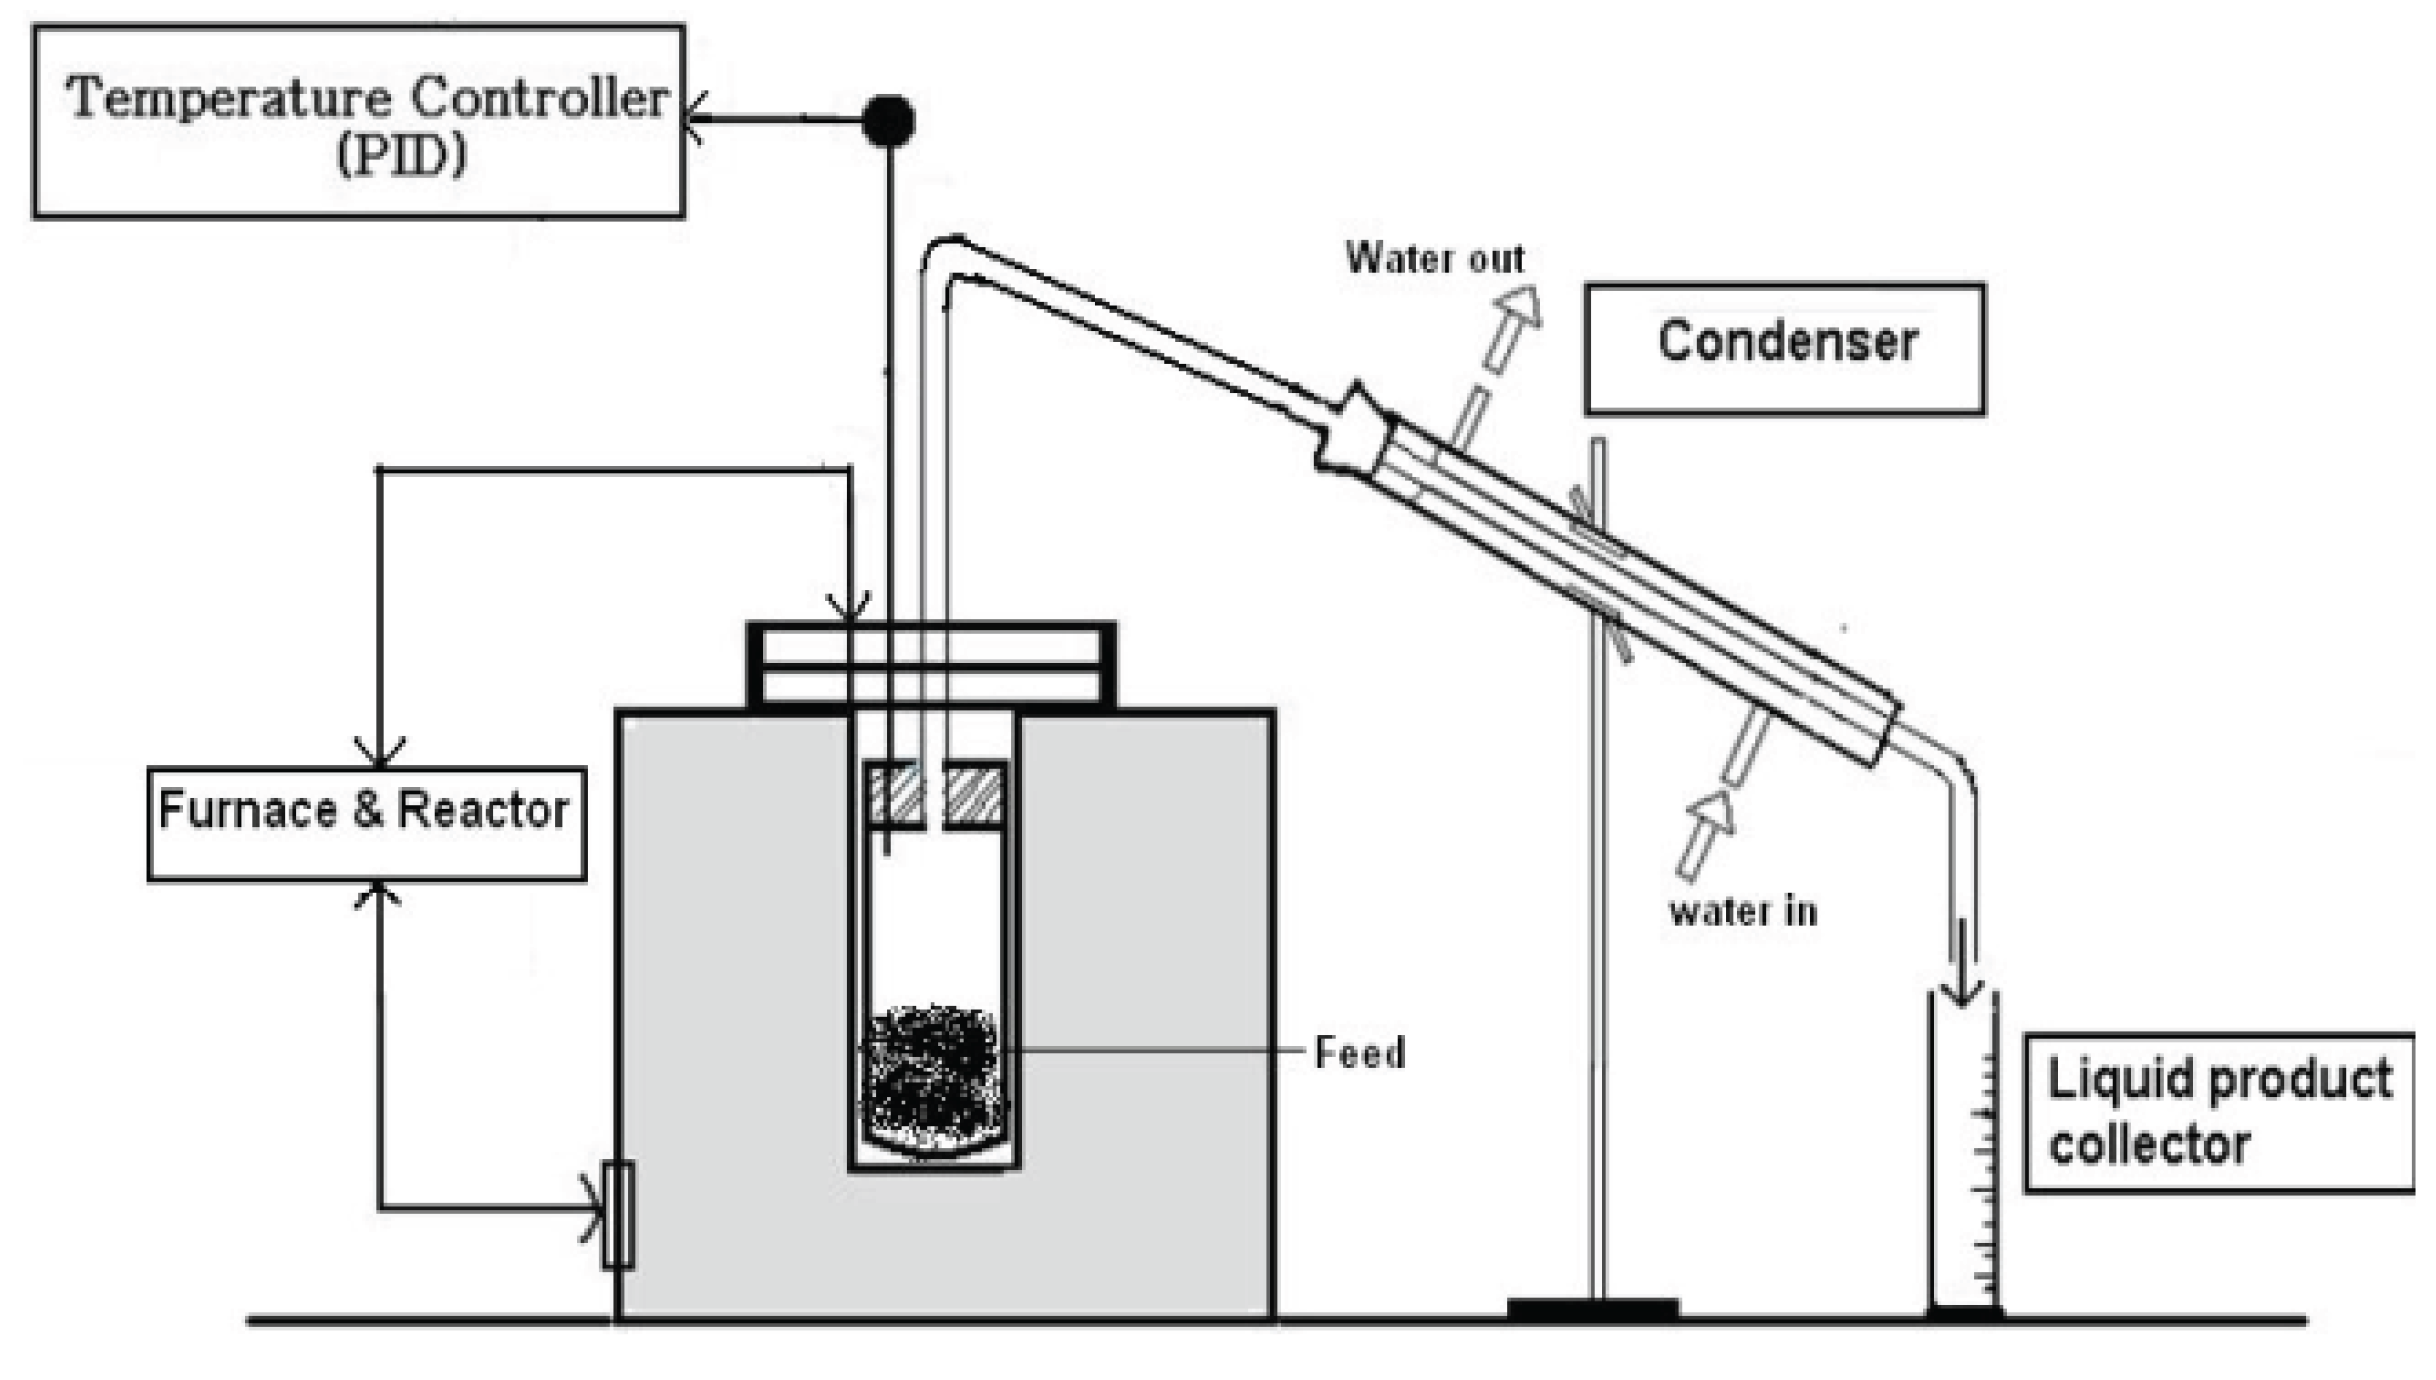
Figure 4.
Thermogravimetric (TGA) and derivative thermogravimetric (DTG) plots of teff husk at 20 °C /min heating rate.
Figure 4.
Thermogravimetric (TGA) and derivative thermogravimetric (DTG) plots of teff husk at 20 °C /min heating rate.
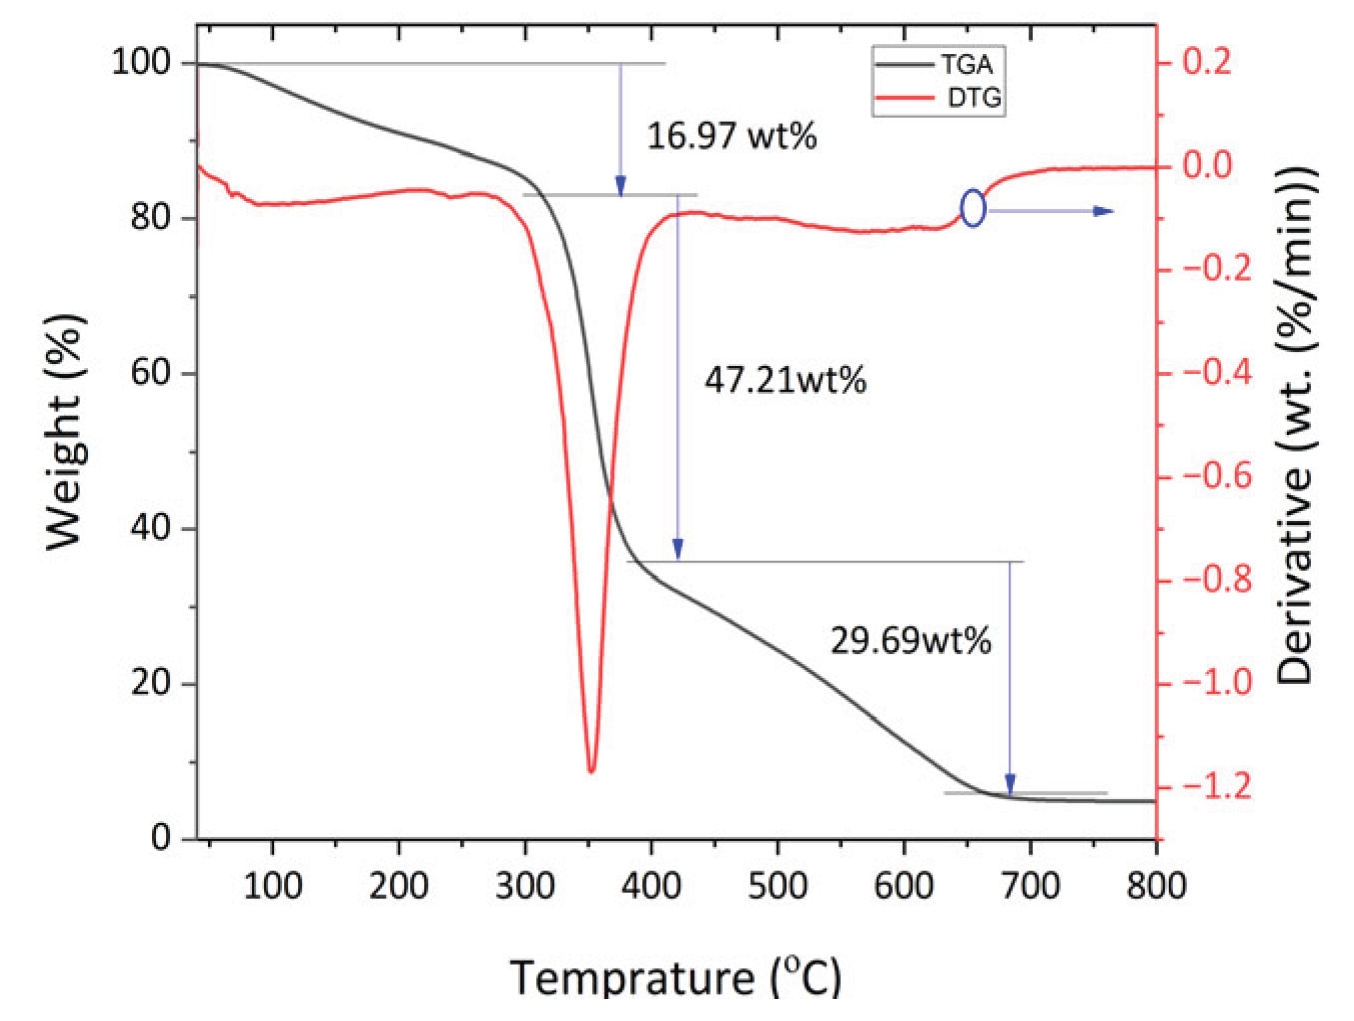
Figure 5.
Effect of heating rate at 5 °C /min and 20 °C /min: (a) TGA and b) DTGA plots of teff husk.
Figure 5.
Effect of heating rate at 5 °C /min and 20 °C /min: (a) TGA and b) DTGA plots of teff husk.
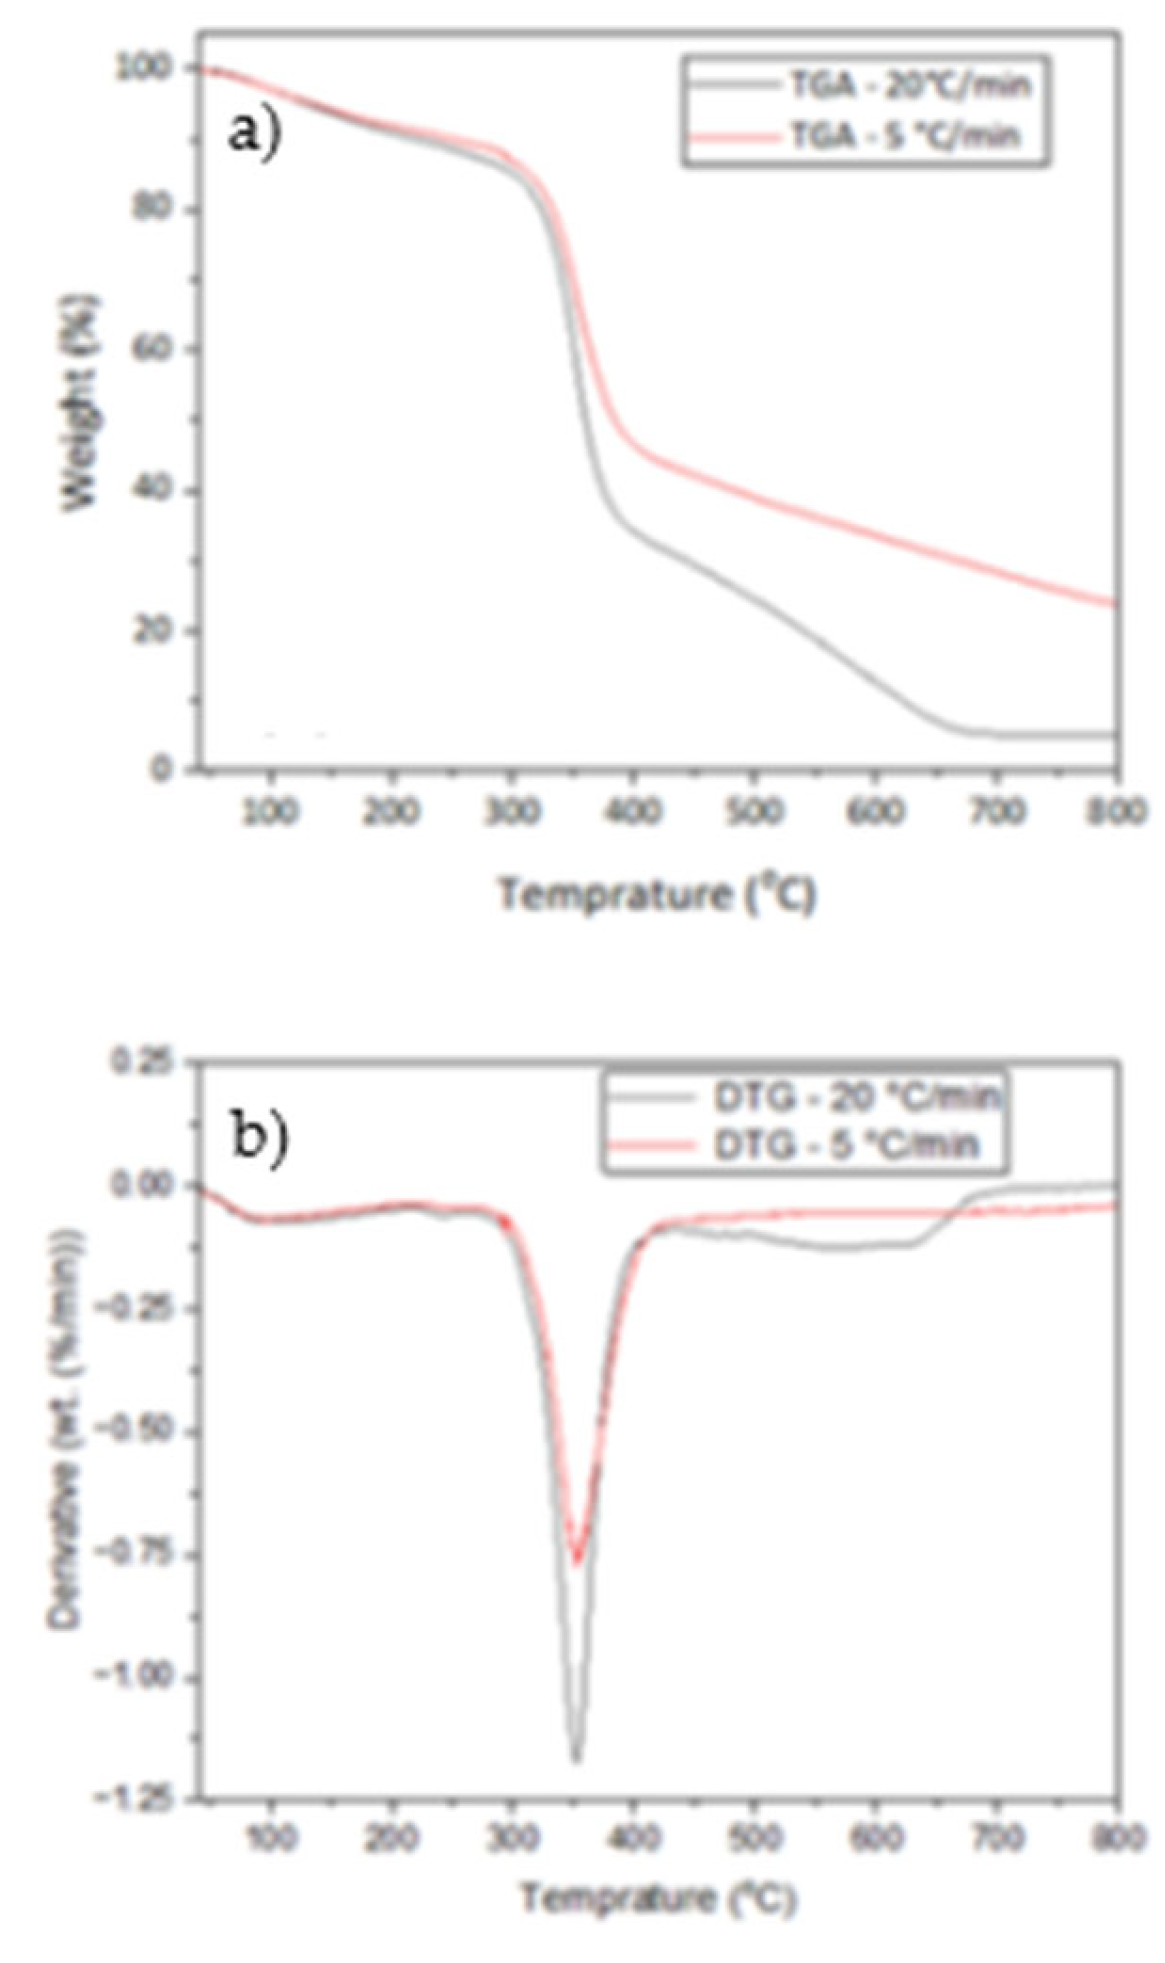
Figure 6.
Effect of temperature variation on biofuel yields derived from pyrolysis of teff husk in fixed bed reactor.
Figure 6.
Effect of temperature variation on biofuel yields derived from pyrolysis of teff husk in fixed bed reactor.
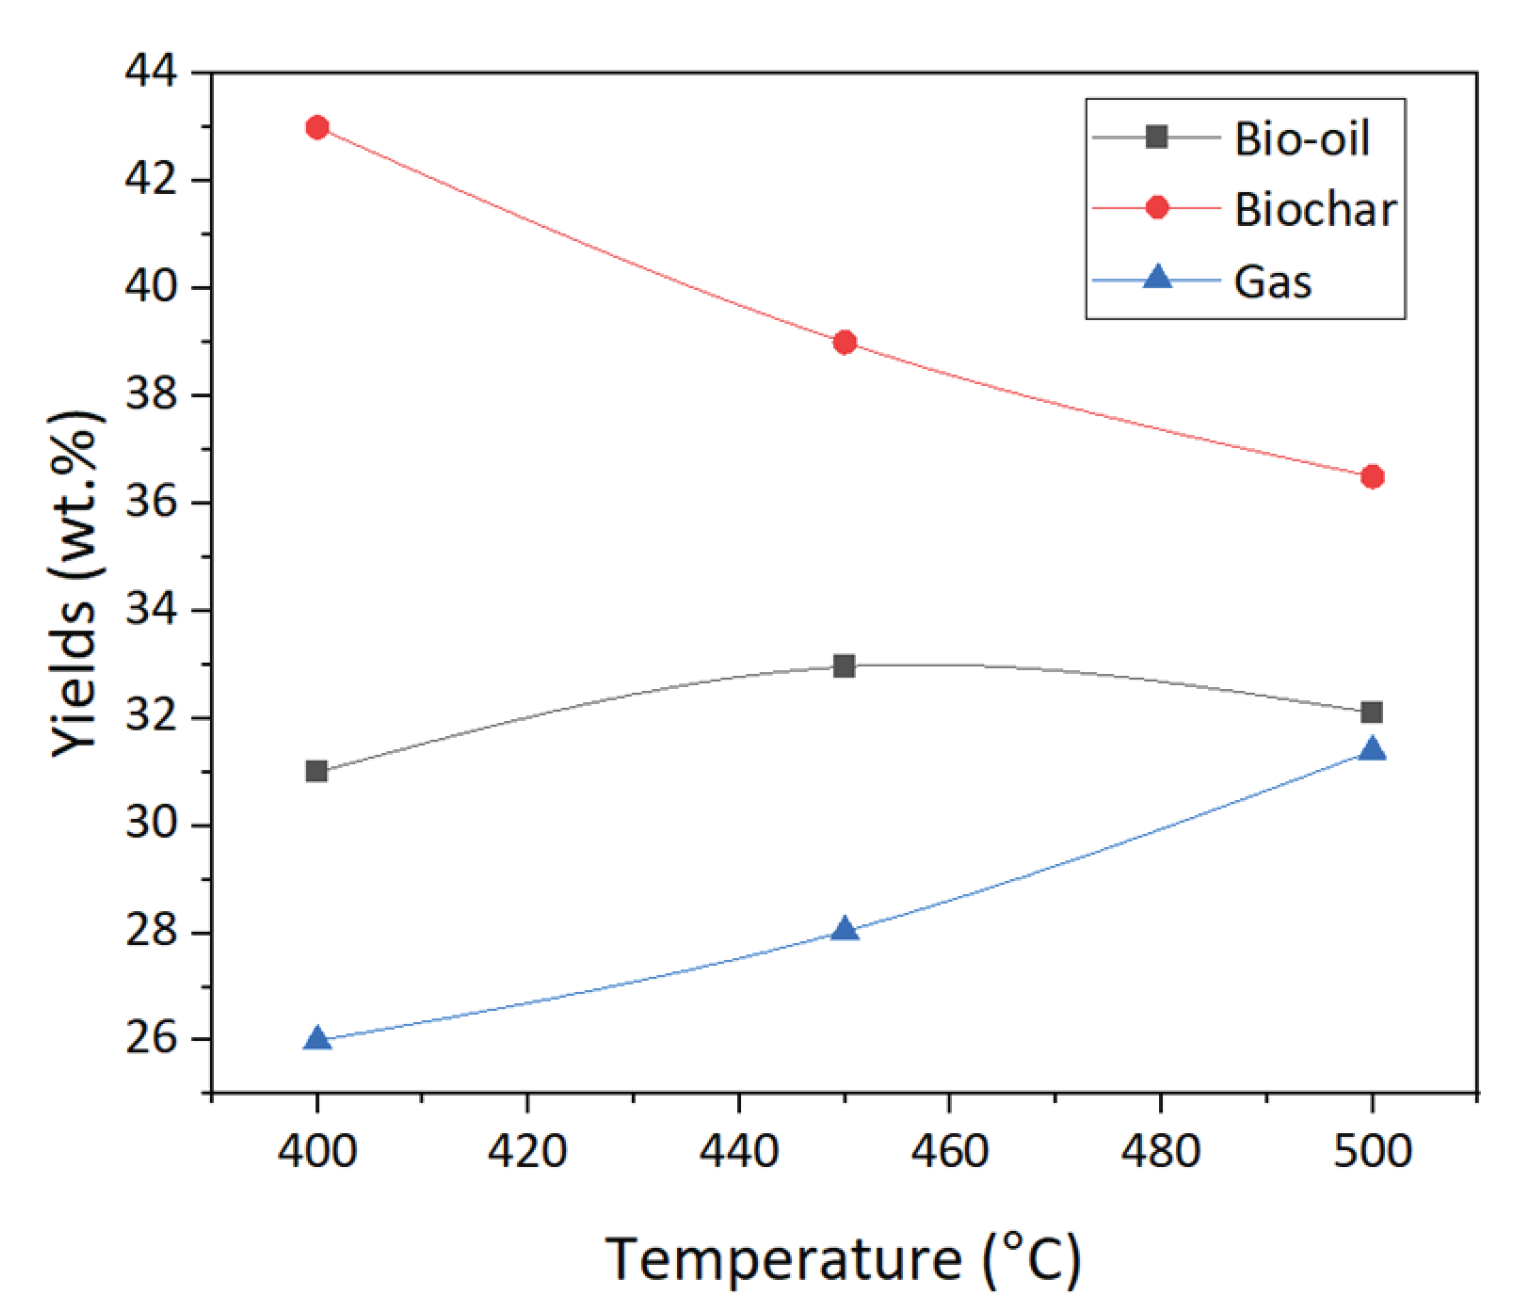
Figure 7.
Thermogravimetric analysis of biochar.
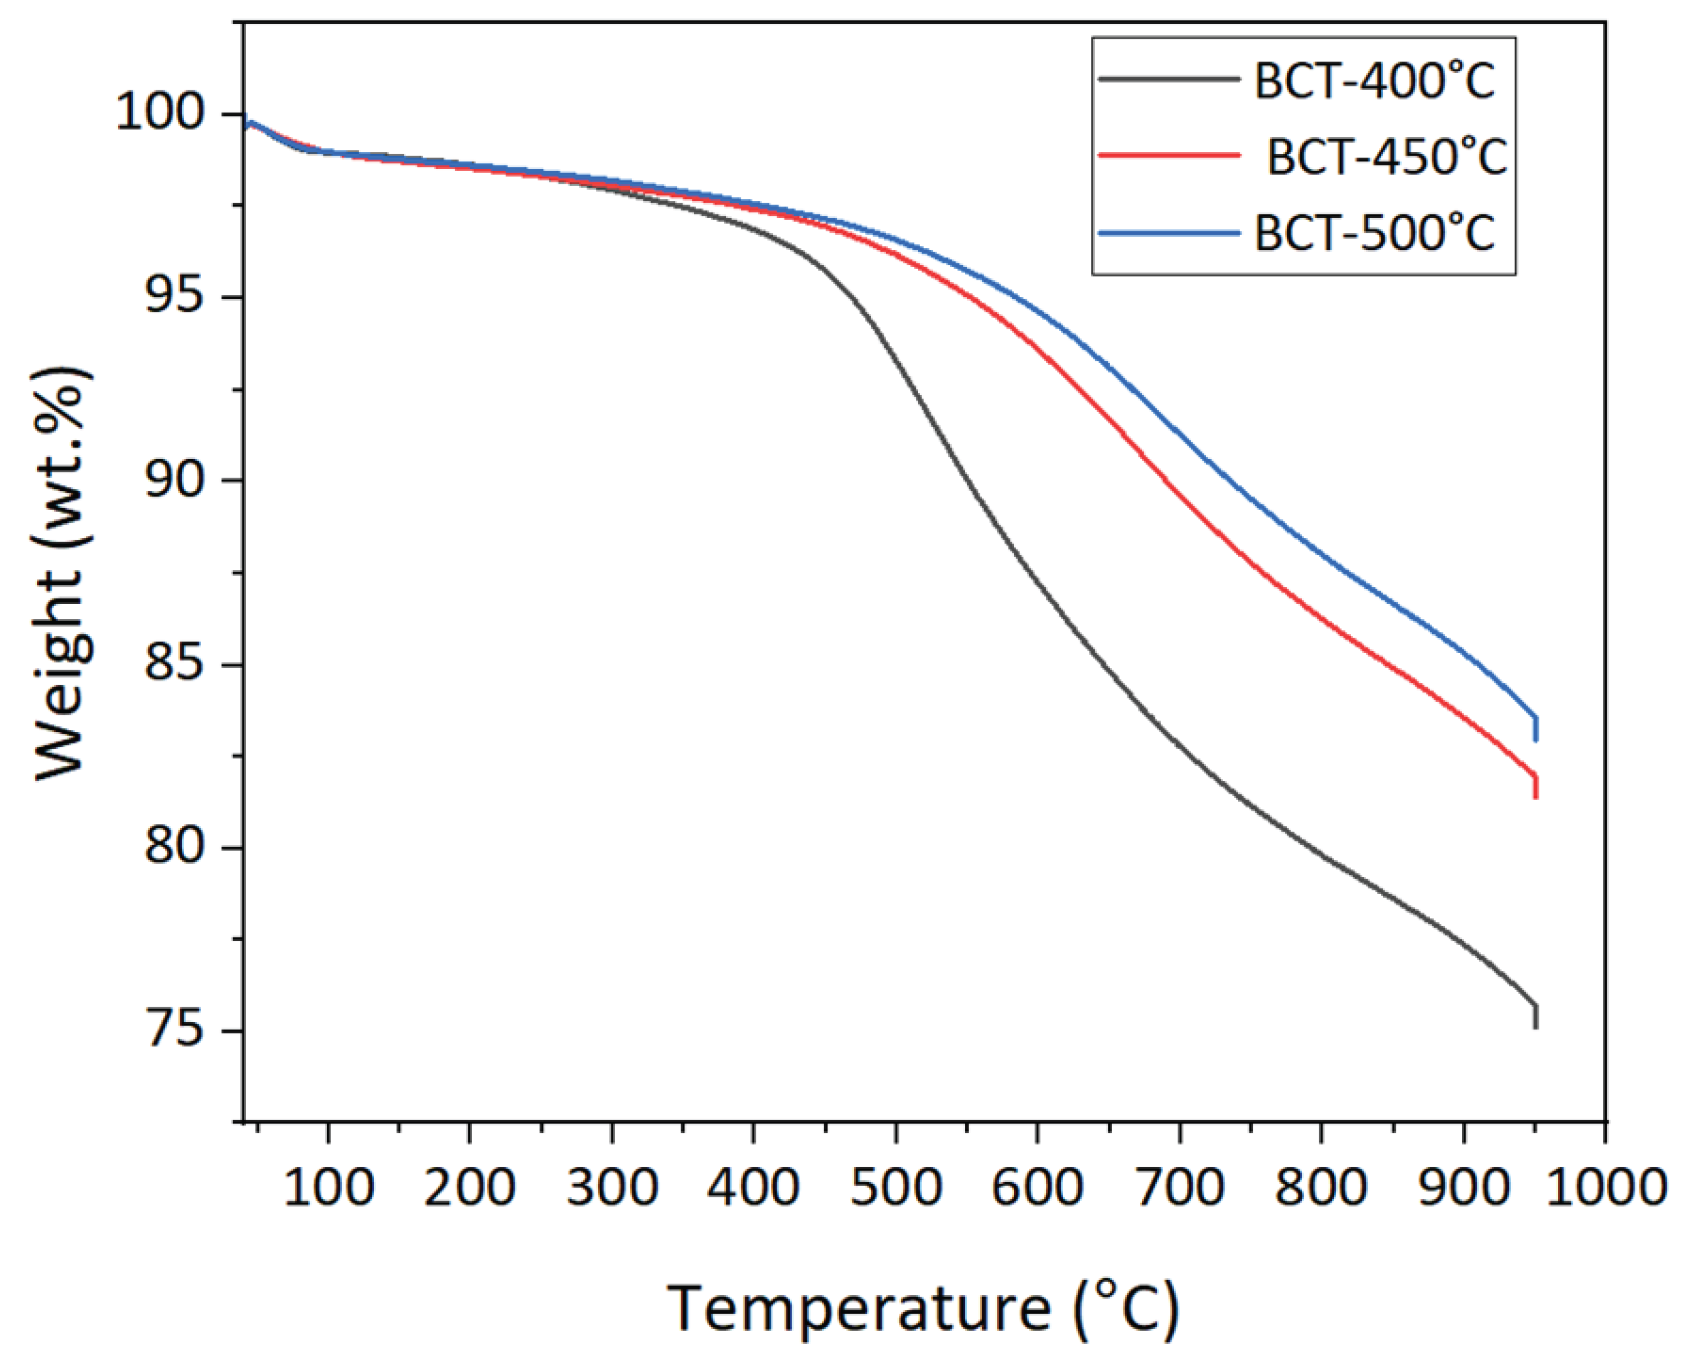
Figure 8.
FTIR spectra of the biochar from teff husk pyrolysis at different temeprature.
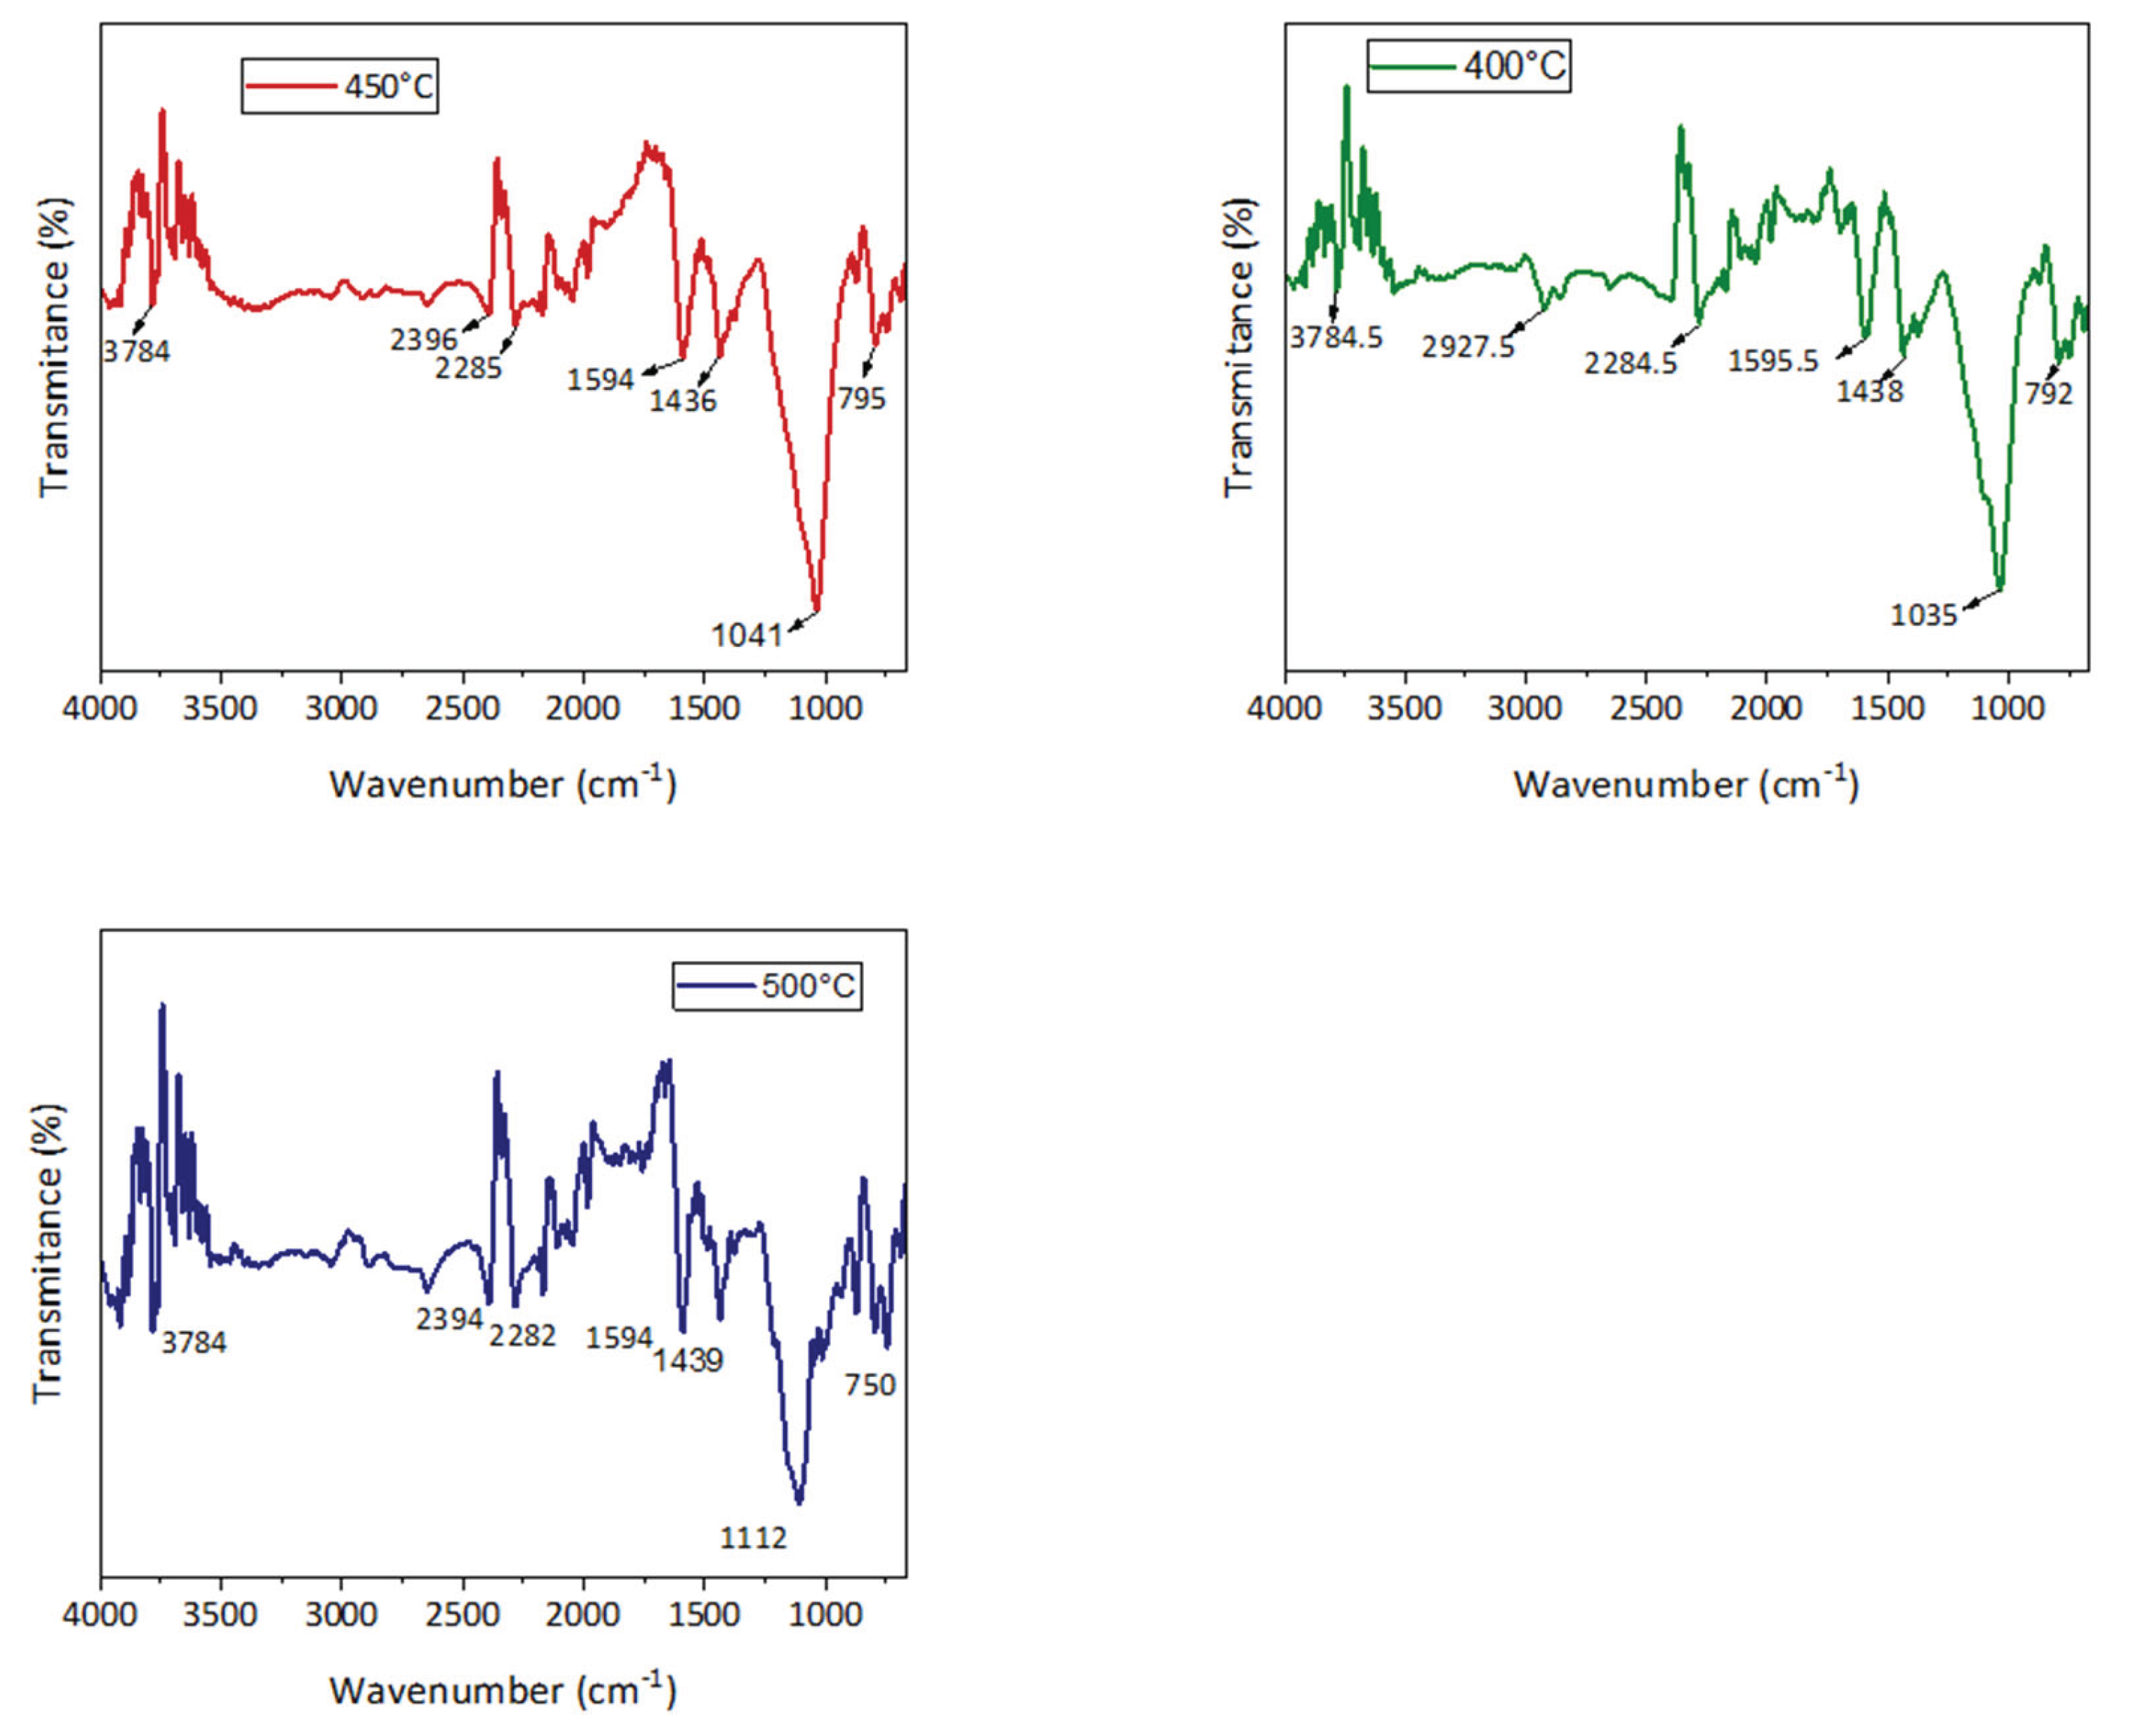
Figure 9.
SEM images of the particles of the biochar samples: a) 400 °C b) 450 °C c) 500 °C.
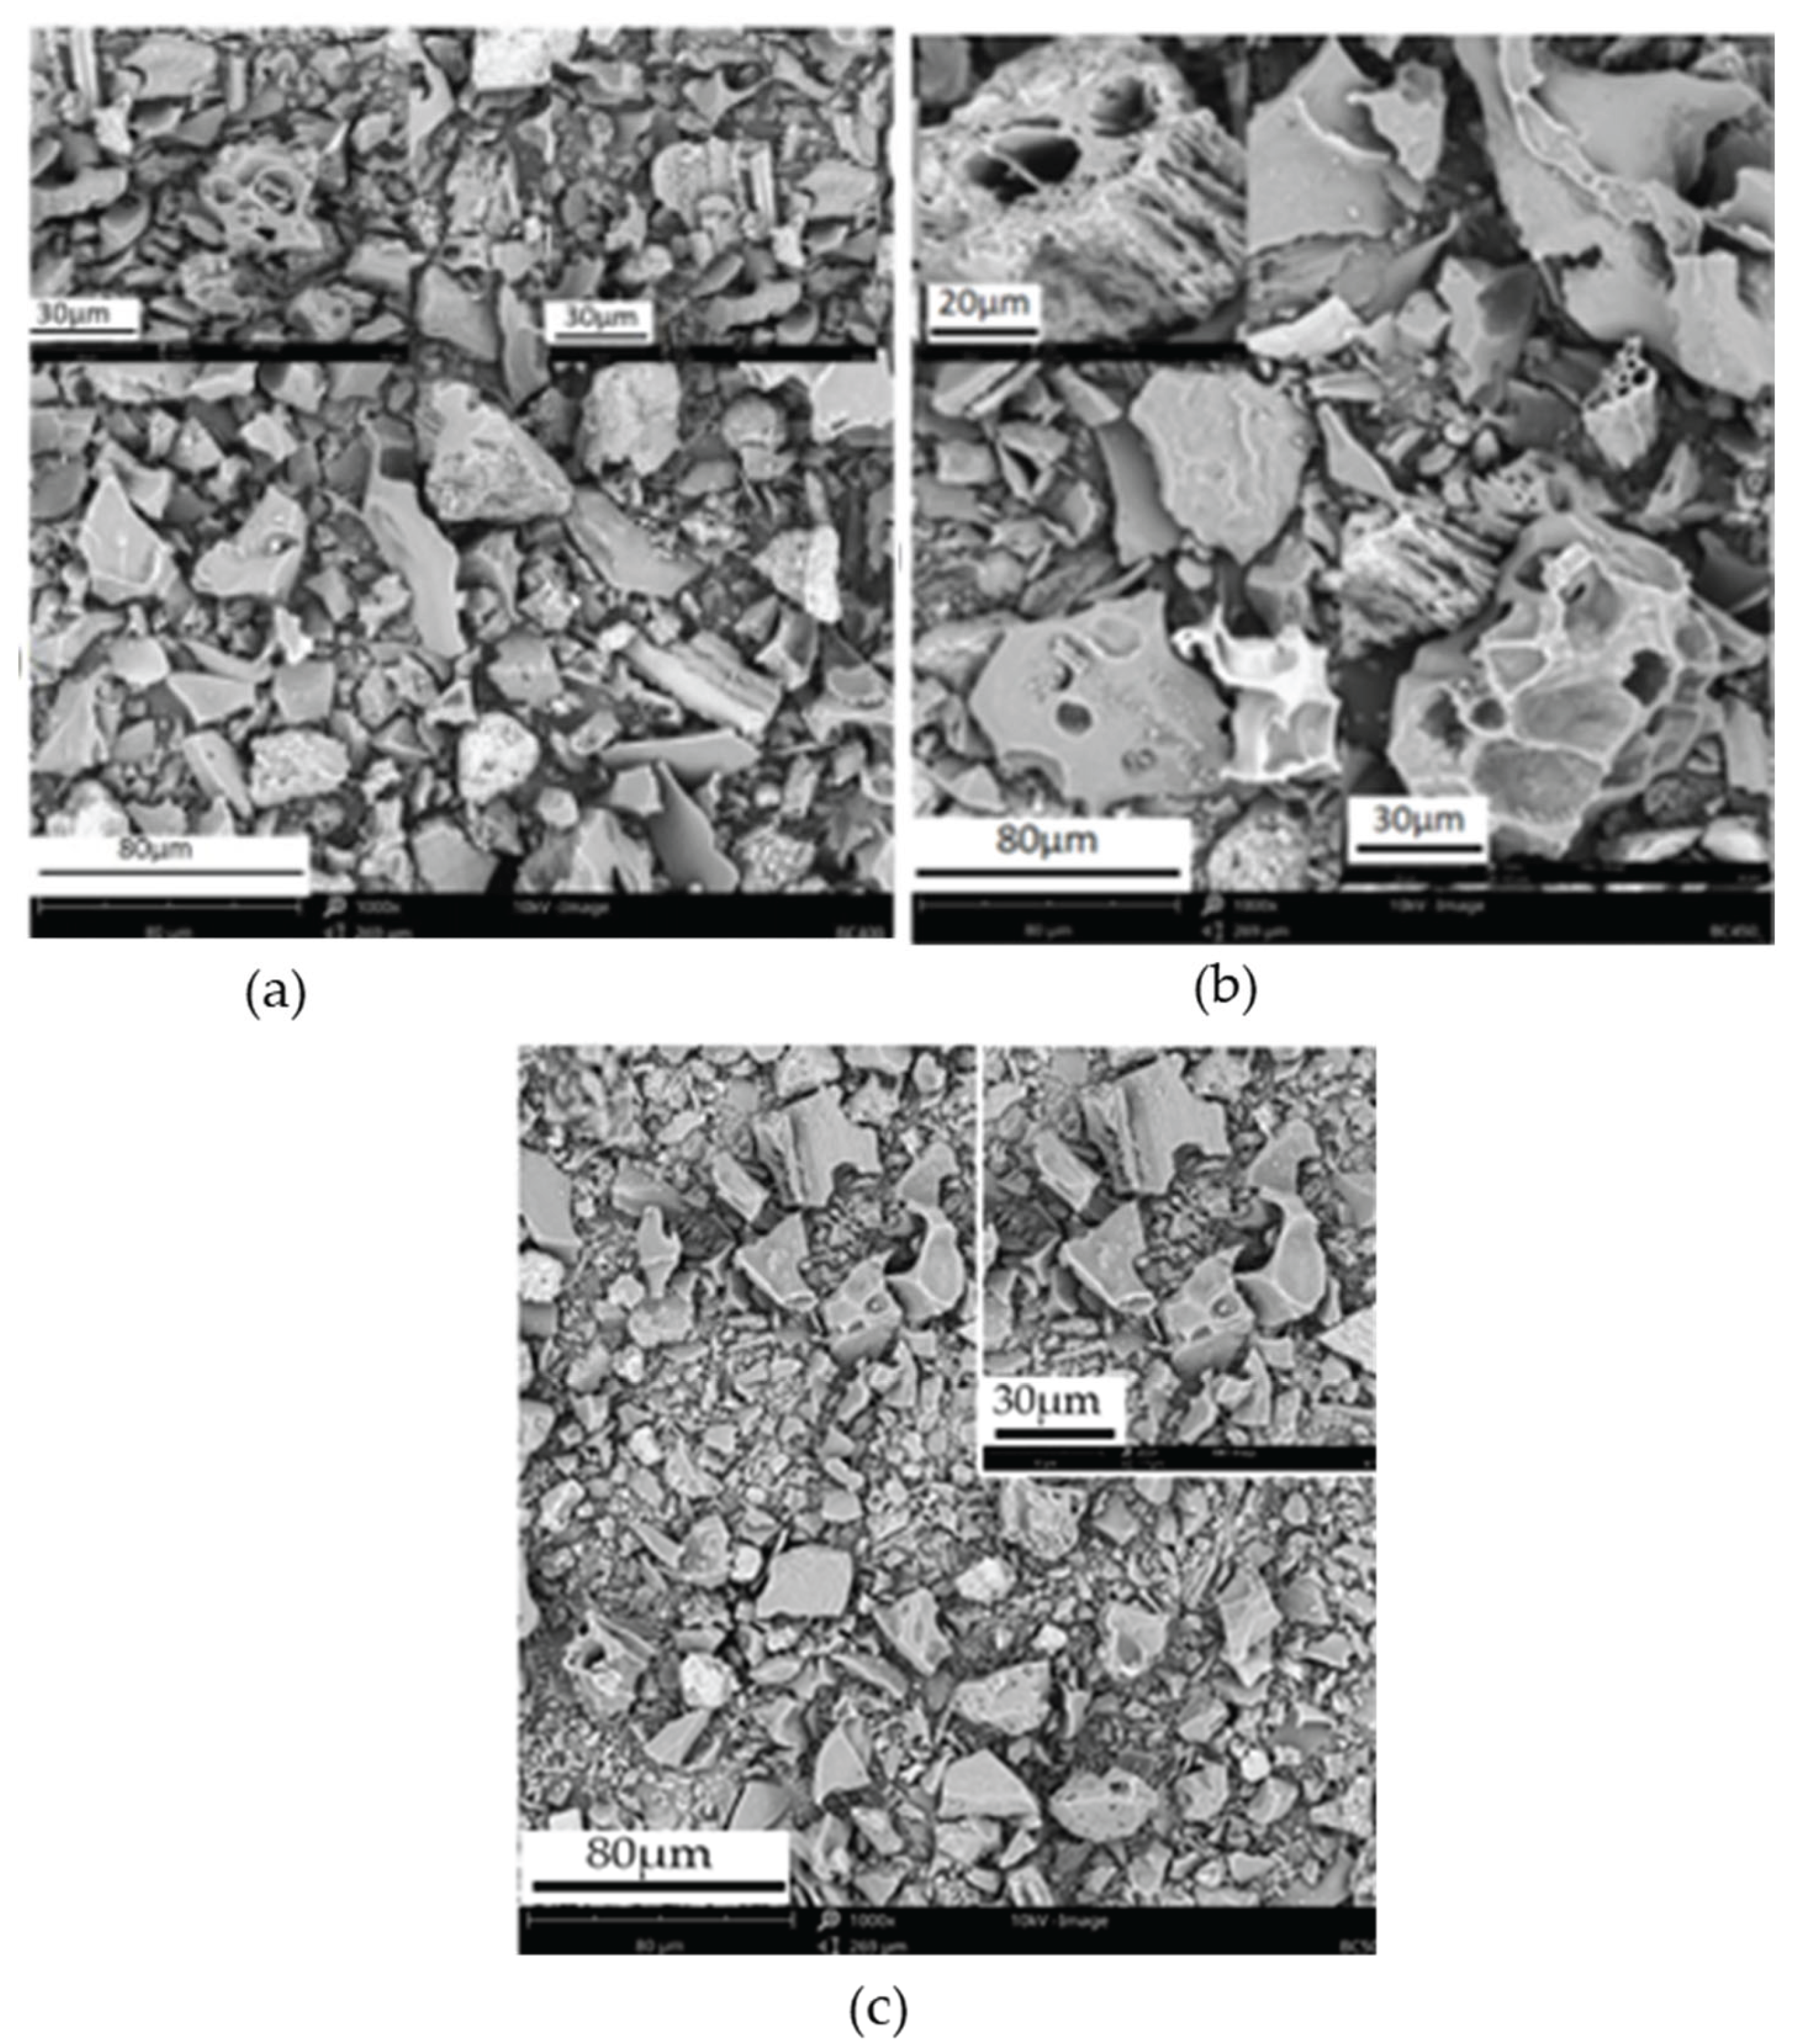
Table 1.
Physicochemical characteristics of teff husk.
| Analysis | Results |
|---|---|
| Proximate analysis, (wt.% as dry bases) | |
| Moisture | 8.57 |
| Volatiles | 76.85 |
| Ash | 6.13 |
| Fixed carbon | 8.45 |
| Ultimate Analysis (wt.% as dry bases) | |
| Carbon | 41.39 |
| Hydrogen | 7.77 |
| Nitrogen | 2.323 |
| Sulphur | 0.055 |
| Chlorine | 0.0063 |
| Oxygena | 48.46 |
| Calorific value HHV (MJ/kg) | 15.41 |
a by difference.
Table 3.
FTIR functional group compositions of Biochar.
| Wave number (cm-1) | Wave number (cm-1) |
Group | Class of compound |
|---|---|---|---|
| 3200–3600 | 3549,3784 | O–H bonded | Alcohol and Phenols |
| 2852–2960 | 2927 | C–H stretching | Alkane |
| 1400–1600 | 1436-1595 | C–C stretching | Aromatic |
| 1300–950 | 1035,1041,1112 | C–O stretching O–H bending |
Primary, secondary and tertiary alcohols, Phenols, esters and ethers |
| 790–830 | 792 | C–H bending | 1,4-disubstituted |
Table 4.
EDX analysis of the biochar at 400 °C (wt%).
| Element Number |
Element Symbol |
Element Name |
Atomic Conc. |
Weight Conc. |
|---|---|---|---|---|
| 6 | C | Carbon | 63.92 | 41.50 |
| 8 | O | Oxygen | 21.39 | 18.50 |
| 7 | N | Nitrogen | 5.71 | 4.32 |
| 15 | P | Phosphorus | 2.50 | 4.18 |
| 12 | Mg | Magnesium | 2.37 | 3.11 |
| 79 | Au | Gold | 2.31 | 24.65 |
| 19 | K | Potassium | 1.68 | 3.55 |
| 14 | Si | Silicon | 0.13 | 0.19 |
Table 5.
EDX analysis of the biochar at 450 °C (wt%).
| Element Number |
Element Symbol |
Element Name |
Atomic Conc. |
Weight Conc. |
|---|---|---|---|---|
| 6 | C | Carbon | 72.22 | 47.45 |
| 8 | O | Oxygen | 16.41 | 14.36 |
| 7 | N | Nitrogen | 5.69 | 4.36 |
| 79 | Au | Gold | 2.63 | 28.33 |
| 20 | Ca | Calcium | 1.26 | 2.76 |
| 14 | Si | Silicon | 0.78 | 1.20 |
| 15 | P | Phosphorus | 0.43 | 0.73 |
| 13 | Al | Aluminium | 0.32 | 0.48 |
| 12 | Mg | Magnesium | 0.25 | 0.34 |
| 26 | Fe | Iron | 0.00 | 0.00 |
Table 6.
EDX analysis of the biochar at 500 °C (wt%).
| Element Number |
Element Symbol |
Element Name |
Atomic Conc. |
Weight Conc. |
| 6 | C | Carbon | 87.89 | 53.27 |
| 8 | O | Oxygen | 4.08 | 3.29 |
| 79 | Au | Gold | 4.03 | 40.03 |
| 7 | N | Nitrogen | 3.37 | 2.38 |
| 14 | Si | Silicon | 0.39 | 0.55 |
| 19 | K | Potassium | 0.24 | 0.47 |
Disclaimer/Publisher’s Note: The statements, opinions and data contained in all publications are solely those of the individual author(s) and contributor(s) and not of MDPI and/or the editor(s). MDPI and/or the editor(s) disclaim responsibility for any injury to people or property resulting from any ideas, methods, instructions or products referred to in the content. |
© 2024 by the authors. Licensee MDPI, Basel, Switzerland. This article is an open access article distributed under the terms and conditions of the Creative Commons Attribution (CC BY) license (http://creativecommons.org/licenses/by/4.0/).
Copyright: This open access article is published under a Creative Commons CC BY 4.0 license, which permit the free download, distribution, and reuse, provided that the author and preprint are cited in any reuse.


