

Submitted:
11 March 2024
Posted:
11 March 2024
You are already at the latest version
Abstract
Grape dehydration is practiced widely in the food industry with large yields of sultanas produced globally. This paper proposes an investigation into grape microstructure changes as it is dried by imaging specimens at intervals during dehydration at two temperatures using scanning electron microscopy. Detailed images of the microstructure were obtained, and a unique image processing algorithm was developed to quantitatively analyse the properties of this microstructure. Two main methods were developed to obtain the complex boundaries of cells present in the grape tissue in over 36 SEM images. Segmentation of the binary image using an adapted watershed function obtained the most consistent and accurate morphological shape. This was compared to a secondary method which used Canny’s edge detection function, morphological closing and skeletonizing to outlines the cellular microstructure. MATLAB was utilised to convert these boundaries into measurable areas so that quantitative data on average cell area, perimeter and cell axis lengths was acquired. It was found that over drying time cell area and perimeter reduced as expected. Some variability in the data was clear due to only single samples being analysed for each temperature and time combination. The development of automatic image processing techniques will enable quantitative data to be extracted from these images. Trends in cell perimeter, diameter and shape will be used to demonstrate relationships between morphological structure, drying temperature, and duration.
Keywords:
Grape
; drying
; Micro-structure
; SEM
; Algorithm
Introduction
Food industry develop many products worldwide and there is a demand for improving technologies, could benefit from advances in Food Engineering [1]. There is a large amount of energy consumed during these processes, and there is a need to investigate the science behind this to potentially enable more efficient technologies [2]. By examining the microstructure of food materials throughout the drying process, trends in changes to structure and moisture transfer can be found (Figure 1). During drying, moisture is transferred through the inner cells to the plant surface before transforming into vapour and evaporating into the surrounding environment [3]. This loss of water causes deformation of the food microstructure. As the cells lose their water content (which makes up 70-80% of the cell cytoplasm), the cells shrink and loose shape whilst retaining their continuous cell wall. In some cases, cells do not shrink at the same rate as adjoining cells, and there would be separation between neighboring cells. If the dehydration process is rapid or not isotropic the cells could rupture from the high stresses placed on the cell membrane and cause a cavity to form [4].
It has been suggested by [2] and [5] that this process of cavity formation is very slow because the cells attempt to protect themselves from the dehydration process by adapting the cellular structure depending on time and temperature changes. This theory supports the assumption that drying preserves food molecular structure (ie. proteins and DNA) and most of the biological assemblies (cell membranes) [2]. Previous research by Ramosa et al. [6] found that the grape microstructure retained its general shape whilst reducing uniformly by perimeter and area.
The kinematics of the drying process has been investigated in current literature using a wide range of food products. The consensus appeared to be that water content is proportional to cell area, and appears to decrease uniformly as drying time progresses [4,7] Furthermore, that higher dying temperature increased the rate of shrinkage in cell microstructure [6,8,9]. Several studies on the drying curves of grapes have been undertaken, all of which obtained similar drying curves as that carried out on Thompson seedless grapes [10]. Research conducted [11] into the effect of particle size of drying times found that halved grape berries dry in considerably less time that whole grape berries, while still exhibiting drying and moisture behavior like other dried fruits.
There were comments made in several articles that during the final stages of drying the cell area seem to increase slightly with varying hypothesis made that the cells either “reopened” after longer drying times [12] or created a rigid crust (casehardening) at the surface food sample during the very low moisture content stages [3]. The subsequent rehydration of the dried food tissues was also extensively covered by several sources, which supported the theory that the “degree of rehydration is dependent on the degree of cellular and structural disruption suffered during drying, which leads to loss of integrity and dense structure of collapsed and shrunken capillaries with reduced hydrophilic properties, as reflected by the inability to imbibe sufficient water to rehydrate fully [13,14,15].
Food microstructure controls water and nutrient transport by determining the pathways travelled between cells [16]. In addition, water within the food can be free or bound, and are compartmentalized within varying levels of substructures (such as in microdomains and organelles). Thus, the relationship between the rate of drying and the transfer of moisture through not only the cells but the substructures within these cells should be examined [2,4].
As the food industry could control external heat and mas transfer during drying, but not internal cellular changes, there is a need for image processing techniques to uncover what these internal changes are to improve the drying process [2].
Scanning Electron Imaging
Scanning electron microscopes (SEMs) can be used to magnify an object up to 500,000 times to obtain images at the micro and nano levels [17]. The device focuses a concentrated beam of electrons onto the sample and scans the area side–to-side to get an overall reading of the structure the electrons come into contact with the samples. The signals collected by the SEM are the result of interactions between the electron beam and atoms close to and at the surface of the sample. These reactions are recorded by collecting the secondary electrons produced from this interaction. As the electrons have the ability to contact atoms to a certain depth within the sample, it is sometimes feasible to produce an image with a characteristic three-dimensional appearance [17].
Scanning electron microscopy has been found to produce better images than past approaches which used the light microscope [16]. It has an advantage of a higher resolution at very high magnification levels and the ability to obtain good topographical images to produce a three dimensional like image. Furthermore, to obtain clear images the sample must be conductive (to allow electron reaction with the surface atoms) and thus a thin coating of metal is often applied to organic tissue. In most cases gold is splutter-coated across the mounted sample prior to imaging [18].
There are many cases in literature where dried food microstructure has been examined using a scanning electron microscope. Carrot [18], potato [7,12,19], banana [20] and apple [16,21] were commonly chosen for investigations. Favaa et al. (Favaa, et al., 2011) and developed images of grape tissue for investigation into microscopic changes during dehydration [6]. However, there is few literatures which quantitatively examines grape microstructure using scanning electron microscopy.
Image Analysis
A similar investigation into analysing SEM images which showed microstructural changes of potato during drying employed image processing methods to this project [7,12]. This analysis utilised MATLAB algorithms to detect the edge of cells in potato and measure cell wall perimeter and area. The process initially detected cell boundaries by using the Canny’s edge detector algorithm which specified two thresholds for analysis [23]. Pixels identified beneath the lower threshold were set to appear black, and those above the upper threshold white. Pixels which sat between the two thresholds were set to white if it had a neighboring pixel above this threshold, or black if it did not [24]. Morphological closing was performed which linked previously detected edges that were close to touching to create an enclosed cell [7]. The use of a thinning algorithm developed by [25] transformed these thick outlines and reduced the solid boundaries into one pixel wide outlines [26]. Pruning was also employed to remove small branches of cell boundary that did not fully separate cells [12]. Furthermore, small regions within the image were removed by imposing a minimum number of connected pixels required of shapes (Figure 2).
There are several other methods of image processing the cell segmentation that have been identified in literature on other types of specimens [27]). Medical and biological studies into cell growth have also utilized many image processing techniques which are relevant to this investigation. Farhan et al. [28] examines human cell cytoplasm obtained using confocal laser technology. Pre-processing stage shown in Figure 3 incorporate histogram equalisation and morphological closing techniques. Further analysis is undertaken by applying Gaussian kernel operations to the image. The final cell segmentation provided images that were easily analysed to obtain dimensional properties of the cells [27, 28] and discuss methods of processing images obtained using confocal microscopy. The further support the use of Gaussian filters to process the image and segmentation methods involving separating the background and foreground imaging using double thresholds like that employed in the canny edge algorithm [28]. Method of segmentation using watershed functions is discussed thoroughly with an emphasis on using distance functions to separate cells or objects [29].
Although there were many studies found looking at the microstructure of food during dehydration, the current literature seems to be lacking a thorough analysis linking dehydration and microstructure during drying. It was found that grape specimens were often not a focus of current literature, with the use of apple, potato, carrot, and banana favored. Image analysis methods were not covered in detail in many sources, and thus the need for development of custom SEM image analysis algorithm for the grape samples was confirmed. Image processing techniques such as the Canny edge detector, watershed function combined with distance measurements and closing techniques positively mentioned in the literature will be included in the development process of the custom algorithm.
Material and Methods
Material
Thompson seedless Grapes were used as the material for the experimentation. The internal structure of grapes are separated into fleshy tissue, skin, stalk and seeds [29]. The focus of this investigation was the internal flesh of the grape, and thus the skin, stalk, endocarp and pips are not important features. The skin (epicarp) is comprised of one layer of epidermis and three of four layers of subepidemic collenchymatous (exocarp). After these layers, the pulp (mesocarp) begins [22]. This was evident in images produced of grapes using a light microscope in which the epicarp and mesocarp layers can be identified (Figure 4).
Drying Procedure
The purpose of the drying procedure was to obtain specimens used in the food industry, namely raisins (dried grapes) which are usually dried until they reach a moisture content of raisin to 0.17 to 0.18 kg/kg dry basis, which is considered safe for long term storage [10]. The grapes were dried using a standard heated fruit dehydrator. In order to greatly reduce drying time, as shown in investigations [11], the grape specimens were first cut in two on a longitudinal line through the centre of the grape. The first group of grapes were heated at constant temperature of 70°C throughout the testing. A set of four grapes were placed facing upwards in the dehydrator and taken out after the first-time interval (two hours). This was repeated for increasing durations a subsequent four times to obtain samples dried for 4, 6, 8 and 10 hours. The method of drying the grapes in batches ensured that the amount of heat and air distributed to each grape was equal throughout the process, instead of having 20 grapes in the dehydrator at the start reduce gradually to 4 grapes. A second group of grapes was dried at 55°C in the same manner. For each batch of four grapes, the weight of the sample prior to and after drying was recorded. Three grapes were refrigerated at approximately 8°C for later rehydration and one was preserved in a dry and airtight container for imaging.
Rehydration Process
Prior to rehydration the grape samples were weighed again to allow any changes in mass from storage in the refrigerator to be accounted for. This was used as the initial grape weight for the rehydration data. The grapes (three from each temperature and time duration set) were then submerged in a water bath for nearly seven hours. The temperature of water was consistent with ambient conditions. Within the first 100 minutes the grapes were removed and weighed every 20 minutes, and then hourly until 400 minutes had passed. This was to record data frequently at the start of the rehydration process as it was expected that water absorption would slow after this point.
Sample Preparation for SEM Imaging
The specimens were placed in a osmotic dehydrating fluid which removed any remain fluid within the grape specimens without affecting the microstructure of the grape. Each sample was then mounted on an aluminium dish to support and transport the specimen. To ensure the surface is electrically and thermally conductive, and thus can be imaged by the scanning electron microscope, each piece of grape was splutter-coated with a thin layer of gold. This layer enabled strong secondary electron generation which improves the signal obtained by the SEM.
Imaging Process
QUT’s scanning electron microscope (SEM) was used to obtain high quality images of the grape microstructure at several stages of the drying process. Each sample was placed inside the SEM and the chamber was placed under vacuum. The electron beam was focussed on the sample and the image created by secondary electron generation was recorded. The image taken of each sample was at a region of the grape which appeared not physically damaged, and was away from the edge of the grape to ensure only the mesocarp (large, inside grape cells) of the microstructure was captured. Each grape sample was imaged at 400 X and 250 X magnifications in the same region (NB: the grape sample from the Temperature 55oC group after ten hours was imaged at 300X magnification instead of 400X). These images were saved for processing and labelled according to their drying conditions.
These images were saved for processing and labelled according to their drying conditions.For example , sample H10T1_400 signifies the halved grape specimen that was dried for ten hours (H10) at Temperature 1 (T1) and imaged at 400X magnification (_400).
Image Processing Techniques
Image processing techniques were employed to automatically quantitate the microstructure found in each SEM images. Characteristics of the cell shape, including average area and perimeter, of each sample were obtained to enable relationships to be drawn between changes in microstructure and drying time and temperatures. The first stage of the image processing was to identify regions of the image which signified cell walls and create an outline or boundary of these cells. Once this was established, analysis of the segmented/boundary image could be analysed to determine the mean dimensional characteristics of each sample. The image processing algorithm was required to omit holes and non-typical microstructure from the analysis, without affecting the quality of the output. MATLAB was used in conjunction with the image processing toolbox to create the algorithm to analyse the images. Throughout the development of the image processing algorithms, the SEM image taken at 400 times magnification of the grape specimen was used as an example as the 400X image, upon visual inspection of all SEM images, provided a clearer and easier to analyse microstructure. Techniques were drawn from examples of image processing of cells in literature and from expanding upon processing techniques outlined by Gonzalez and Woods in their 2009 text “Digital Image Processing using MATLAB” (Gonzalez & Woods, 2002).
Procedure Followed for Determination of Outline of Cells
The first step after importing the chosen image into MATLAB was to convert it to a binary greyscale image. The size of this image was found and used to crop of the information panel at the bottom of the image.
Pre-Processing
A range of pre-processing measures or filters were applied to several SEM images with different appearances to note the effect. The three most effective of those attempted were the histogram equalisation, top hat, and bottom hat filtering [24,30]. The histogram equalisation improves the visibility of the cell boundaries effectively in both very different contrasting SEM images. The direct impact of the final segmentation from the Top and Bottom Hat filters were also confirmed by processing the final algorithm using each one, to detrimental effects. Thus the histogram equalisation method was used to emphasise the cell boundary prior to further analysis.
Pyramid Reduction
The pyramid function was used to reduce the above processed image to enable smoother and easier identification of the cell boundaries. The process reduced the image in both the horizontal and vertical dimensions by using a Gaussian shaped weighting function [25]. This reduced the size of the image by half and enhances salient image features. Pyramid reduction was conducted twice on the histogram equalised image to reduce it to a quarter of the original size.
Cell Boundary Modelling
Three techniques were employed for this procedure.
Technique 1: Watershed Segmentation Method
The first technique used to model the cell boundaries in the SEM images was segmentation using the watershed function. The watershed function utilised the behaviour of water catchments in nature., which shows that a basin will drain water into the lowest/deepest point [24]. Figure 5, shows how catchment basins are formed around large depths and that watershed or ridge lines appear on the boundaries of these catchments.
This function works by interpreting the image gradient as heights. The image gradient is calculated by looking at the differential of the binary image. In this process the minima of the gradient function are found and used as markers for the bottom of the basins. A treshold is used to exclude any ‘shallow’ basins which are not relevant to the image. Midway points between significant minima indicate ridge lines within the image, which segment the image into the important regions, in this case the grape cells.
There are several methods of using the watershed function, all of which were attempted in this process to determine the most effective process. Firstly, the gradient of the image was calculated by running a sobel mask over the binary image and the derivative of the binary image and finding the squared average of the two. The watershed function of this gradient was then found. When this value was set to by logically equal to zero, the cell segments were shown [24].
To counteract this, some of the minima gradients used to segment the image were eliminated by using a threshold (h). This eliminated any ‘shallow’ basins which did not contribute strongly to the segmentation of the image. This was carried out by specifying a ‘height” which corresponds to the magnitude gradient of which minima which fall below are not included in the analysis. Next, the distance each pixel is situated away from these minima (which meet the thresholding requirements) is computed and the watershed function is applied to it. When these values are legally equal to zero, the ridge lines, and thus the cell boundaries, are identified.
Technique 2: Edge Detection Methods
The second method of finding the cell boundaries incorporated edge detection procedures. Technique 2 comprised several steps to obtain a clear boundary of the grape microstructure in the SEM images.These utilised the maxima found in the gradients, in contrast to the minima which was a focus of the watershed function. The Canny edge detection algorithm was chosen to base the cell outline on as it computer gradients in both the horizontal and vertical directions, which enabled a direction of the detected edge to be accounted for. It was the best method to optimise the signal-to-noise ratio of the SEM images as it is favoured over other edge detection methods in literature [23].
Closing
The next step applied the closing function to the edges detected by the canny function. The closing function used a structural element to dilate the existing lines, and then erode the dilated image.
Skeleton
The skeleton function was used to think the closed image to boundary lines a single pixel width. The function found each point in the closed image and computed its closest neighbour. If there was greater than one neighbour it belonged to the skeleton. Pixels belonging to the skeleton body are reduced until they are one pixel width, without breaking any objects apart. The pixels remaining make up the image skeleton. This option preserves the Euler number.
Remove Small Regions
Spurs are the small regions of skeleton which protrude from the boundary outline. If required, a function was used to remove any small regions of cells that were not fully connected to the main boundary/outline. This was to remove any accidental detection of lines that were too small to indicate cells. The function removes any group of pixels totally less than a set threshold (T).
Technique 3: Edge Detection Methods- Remove Inside Regions
An alternate to using the skeleton function and subsequent steps of Technique 2 was to remove the inside ‘white’ regions of the closed image. This thinned the large cell boundaries from the inside of the white to the outside, opposite to the skeleton function (Gonzalez & Woods, 2002).
Determination of Morphological Properties
Boundaries obtained using Technique 1 and 2 were used to quantify the microstructure of the SEM images. The first step to calculating the morphological properties (e.g.,: area, perimeter, axis length) was to invert the segmented or boundary image previously found using the two techniques. This was simply done by setting all zero pixel values to a value of one, and all one value pixels to a zero value.
In order, to remove any cells that were over segmented, the cell regions analysed were restricted by a minimum area. This value was adjusted for SEM images which by inspection were seen to obtain smaller cell sizes. In turn, cells with very large perimeters were also excluded as these were often cells that had been merged in the boundary detection stage due to unclear edges in the original SEM image. A computer code developed by Authors are used to do the cell exclusion steps.
The mean microstructural characteristics were determined by the region props function which calculated the properties of each cell included in the analysed boundary image. The mean of these outputs was calculated and scaled depending on what level magnification was used to capture the analysed image. The scale factor for each size was determined by determining the number of pixels the scale bar shown in the origin image before it was cropped and the number of pixels of the original image. This was than divided by 4, to account for the multiple pyramid reductions.
Results and discussion
Dehydration and Rehydration
Drying kinetics was calculated using the equation suggested by Henderson and Pabis (1961)
Where Mi - moisture content of the sample (kg/kg db), Mo – Initial moisture content (kg/kg db), Me – equilibrium moisture content (kg/kg db), k- drying constant (h-1), A- constant, t- time (h)
Me is the material equilibrium constant which has been found to often have a negligible effect on the moisture ratio and was thus excluded from the calculation for simplicity (Bauman, et al., 2005).
The fitted curves in Figure 6 show there is a clear exponential relationship between the moisture ratio and the drying time of the grapes. This is consistent with literature data, which confirmed that these grapes are suitable to be examined further to analyse the microstructural changes of dried grapes. Table 1 lists the drying coefficients of each temperature group modelled by the exponential curve, and the goodness of fit indicator, R-squared (signifies the perfect fit).

Table 1.
Drying Coefficients for Both Temperature Ranges.
| Constants | A | K =Drying Rate Constant (h-1) | (R2) |
|---|---|---|---|
| 70oC | 1.2534 | 0.336 | 0.9205 |
| 55oC | 1.1818 | 0.329 | 0.9562 |
The initial stages of this investigation require measuring the moisture contents and producing drying curves of the dehydrated grapes to confirm their suitability for further investigations. Figure 23 showed a plot of the exponential relationship between moisture ratio and drying time for both temperatures. This relationship was comparable to similar experiments found in literature searches [10]. In particular, the exponential curves fitted to the data had very high R–squared values (>0.9) indicating that the grapes could be modelled well to expected behaviours. Although it was expected that there was a larger difference between the drying curves of the two differing temperatures, the higher temperature did in general average high drying rates than the lower range. The drying coefficients obtained of 0.336 (Temp1) and 0.329 (Temp2) measured in hours-1 is comparable to literature values when converted to similar units. Is should be noted that although the drying constant for Temperature 1 in higher than Temperature 2 (as expected), it is only a difference of approximately 2%, and thus not significant.
Following dehydration, the grape samples that were not preserved for image analysis was rehydrated. The percentage weight increase of the three grapes from each temperature and drying period group were averaged over the duration they were submerged in the hydrating solution. The results of this process are shown in Figure 7.
The rehydration data shown in Figure 7, further demonstrated that there is a microstructural difference between the higher temperature grape samples and the lower temperature ones as grapes dried for the same duration at Temperature 1 (70°C) almost always gained weight percentage while submerged in the water bath at a slower rate than Temperature 2 (55°C) .
Image Processing
Following dehydration, a halved grape sample from each drying period and temperature were imaged using the scanning electron microscope. The images taken at 70oC drying at 2-hour intervals are shown in Figure 8. Also, similar images are taken for 55oC.
Images were processed using the MATLAB algorithm previously developed to obtain quantitative values for mean area, perimeter, mean maximum and minimum axis length and a value of eccentricity. Two techniques for obtaining these values were used where Technique 1 utilised the watershed segmentation method and shown in Figure 9 for different thresholds for 70oC with magnification x400. Technique 2 used canny edge detection with several trials to ensure the selection of the best threshold values. Figure 10 shows some of the results of the altering the thresholds using Canny algorithms and selected final algorithm for further morphological transformations. Each sample was analysed individually, and the algorithm was altered slightly to negate the effect of over-segmentation (by removing areas that were below a minimum threshold) and the remove most of the cells which were combined and cut off on the edge of the image (by removing cells with a perimeter over the set threshold). Figure 11 shows the cell regions superimposed onto each SEM image by two methods, the thresholds used and the resulting cells which were analysed to obtain the morphological properties.
The image processing stage also accounted for a lot of the unexpected results. Although the image processing techniques worked very well for most specimens, there were a few images that accurate cell boundaries were not able to be properly defined. This was due to a range of problems. The first issue was that the SEM image was too difficult to analyse. This was often due to the specimen itself. As the SEM captures an almost threedimensional topographic image of the surface, the sample is very uneven of physically damaged it is difficult for the edges to stand out when compared to other parts of the cell (including the inside surface) which may be closer to the SEM focus point. In addition, if the gold splutter coating method didn’t successfully reach all areas of the specimen, then some key features would not have been captured properly. Although this did not seem to be an obvious problem, the effects may have been subtle. Although due care was taken when the SEM was positioned on each sample, some were small and damaged, and it was difficult to find a part of the grape mesocarp (centralized body cells) to entirely fill in the 250X magnification frame. Thus, some of the smaller cells on the edge of the grape berry may have been captured and would not be a true reflection of the mean cell size of a typical grape specimen after being dried for the same period.
There are also clear problems with the image processing method. Firstly, it is difficult to use almost the same algorithm to analyse images with shapes that are different sizes and shapes. The contrast and highlight in the images also changes dramatically between samples. Although the histogram equalisation step tried to account for this, it was not always successful. The biggest problems seen with obtaining the boundary outline was with the grape samples with either very large or very small cell sizes. It is inherently difficult to find the outline of the grape cells of the H2T2_400 image (See Appendix 4) as they are very large and nearly every cell intersects the boundary of the image and cannot be modelled fully. In contrast, the very small cells in H8T2_400 were not able to be closely referenced at all by the algorithm.
It was however clear that the segmentation method using the watershed function was more successful than edge detection methods at mimicking the microstructure shapes, shown when you compare in Figure 12 Both techniques were also better at analysing the 400X magnification images, which was expected as it was designed to read those size images first.
The method for measuring the properties of the cells, once they have been identified by the boundary finding techniques was quite successful. Several sources found in the literature used very loose methods of averaging cell size by approximating the number of pixels which were allocated to the perimeter, and which were used to denote the area of the cell. In this case, each cell was identified and measured separately. The only inaccuracy of this stage of the process was carried on from poor extraction of the segmented image. In particular, the constraints applied to minimise the cell area and limit the cell perimeter included in the analysis improved the boundary outline by illuminated cells located in error. The parameters were changes as required, when the images on the left of Appendix 4 were examined in addition to the cells selected in the right image.
Microstructural Changes and Determination of Morphological Properties
Cell boundaries obtained by Technique 1 and 2 was used to quantify the microstructure of the images. Before calculation of properties need to invert the segmented or boundary images. Figure 13 shows cell detection process for microstructural analysis.
Figure 14 shows the mean area that was calculated by summing the pixels within each separate region and multiplying them by a scaling factor to obtain metric units. Each of these values was averaged for each SEM image. The mean perimeter was calculated using a similar method where the number pixels along each boundary were converted to micrometers and graphed.
Unfortunately, the microstructural properties obtained from the SEM images did not clearly show many trends when compared with drying time and temperature. When the results of each property versus drying time are compared between the two techniques, it is clear that Technique one gives results with less unexpected or outlying data points. It is also noticeable that the outlying data points usually are part of the data set taken from images with a 250X magnification.
Unfortunately, the microstructural properties obtained from the SEM images did not clearly show many trends when compared with drying time and temperature. When the results of each property versus drying time are compared between the two techniques, it is clear that Technique one gives results with less unexpected or outlying data points. It is also noticeable that the outlying data points usually are part of the data set taken from images with a 250X magnification.
Area
In spite of this, there are some trends that are visible. Figures 25 and 26 revealed that mean cell area did in general decrease with drying time. This is consistent with known trends as shrinkage of the berry on the macro scale is expected to cause shrinkage in the microstructure. Also, samples dried a Temperature 1 (70°C) seemed to have on average a lower average area than samples dried at Temperature 2 (55°C). This confirms the theory that increased temperature affects the microstructure more quickly. The data obtained using Technique 2 appeared more variable than Technique 1, further emphasising the superiority of the watershed segmentation method.
Perimeter
The data obtained from the image analysis for perimeter was not very successful. It was clear that on average, for both techniques used to analyse the images, the perimeter does decrease with drying time. However, there doesn’t seem to be any clear trend that the perimeter measure on the Temperature 1 samples were on average less than Temperature 2 samples, which was an expected outcome. In contrast to the other measured parameters, Technique 2 seemed better at modelling these relationships; both 400X magnification data followed similar trends, and both magnification levels of Temperature 1 data seem to be aligned.
Axes Length
Mean axis length showed some very general trends which were supported by literature findings. As the drying time increased, the mean axis length (in particular minimum) decreased). For Temperature 1 samples, both the 400X and the 250X axis lengths seemed to follow a similar pattern, which positively indicated the image processing correctly analysed those specimens. It was not always clear that the size of Temperature 1 was less than Temperature 2 data for axis length, although it did seem to maintain this relationship better in the maximum length data.
Eccentricity
The eccentricity versus time did not indicate any trends. They reinforced the outlying values are more likely to appear in graphs recording data obtained using Technique 2. It was clear though that it is possible for the shape of the grape cells to vary greatly, as some eccentricities were recorded as low as 0.5, which when they were compared to the original image to confirm this value, it was clear the variance did truly exist (see H2T1_250 with e = 0.5540 and H0T1_250 with e = 0.9669 ).
When we look back at the dehydration and rehydration curve to see if there are any unexpected values, we see that H6T1 on average did not fit within the fitted drying curve. When the raw data was examined, the moisture content of grape two (which was retained for imaging) was compared to the other three specimens to see if at any data group there was an clear variance. The only unusual value was H8T2, which had a significantly higher moisture content than the other three grapes, which may indicate it wasn’t dried sufficiently, which suggests the cells was more intact and thus they had retained their larger size. These observations could account for some of the unexpected variance in the results.
Results of image processing
Table 1 provides morphological parameters cells during drying period using watershed management technique. Canny edge detection data is shown in the appendix. Provided and not shown here. In Table 1 A signifies threshold cell areas were restricted by (pixels), P signifies threshold cell perimeters were restricted by (pixels) at different magnifications. Table 2 provides morphological parameters from Canny edge detection technique.
Table 1.
Morphological properties from watershed management technique.
| Sample |
Properties (watershed segmentation) | ||||
|---|---|---|---|---|---|
| Mean area (μm2) | Mean perimeter (μm) | Mean major axis (μm) | Mean minor axis (μm) |
Mean eccentricity | |
| 250X A>500 <300 | |||||
| H0T1 | 1.868e+04 | 749.4680 | 301.2960 | 108.1984 | 0.9333 |
| H2T1 | 1.6276e+04 | 527.2443 | 160.6473 | 121.5663 | 0.6537 |
| H4T1 | 1.5813e+04 | 449.5994 | 144.2168 | 97.0850 | 0.7395 |
| H6T1 | 1.7529e+04 | 479.0513 | 170.7560 | 104.8985 | 0.7891 |
| H8T1 | 1.3052e+04 | 973.4885 | 315.7655 | 213.9352 | 0.7355 |
| H10T1 | 1.3524e+04 | 434.2135 | 166.2669 | 78.3663 | 0.8820 |
| H2T2 | 1.8380e+04 | 581.5718 | 188.4769 | 144.8233 | 0.6400 |
| H4T2 | 2.0445e+04 | 651.2853 | 194.6465 | 142.0478 | 0.6837 |
| H6T2 | 1.8574e+04 | 586.0782 | 203.8516 | 124.2818 | 0.7927 |
| H8T2 | 1.7274e+04 | 481.4237 | 153.9302 | 118.1231 | 0.6412 |
| H10T2 | 1.8603e+04 | 1.1199e+03 | 307.8014 | 221.9638 | 0.6928 |
| 400X A>1000 P<350 | |||||
| H0T1 | 1.4060e+04 | 610.5335 | 220.1148 | 114.3835 | 0.8544 |
| H2T1 | 1.4446e+04 | 841.5988 | 304.9690 | 125.9145 | 0.9108 |
| H4T1 | 1.2241e+04 | 335.2362 | 103.3524 | 86.5694 | 0.5463 |
| H6T1 | 1.2945e+04 | 421.5962 | 178.6316 | 55.3865 | 0.9507 |
| H8T1 | 1.0646e+04 | 468.9098 | 157.0120 | 93.8365 | 0.8018 |
| H10T1 | 9.6000e+04 | 390.7552 | 140.0699 | 80.2164 | 0.8198 |
| 400X A>700 P<370 | |||||
| H2T2 | 1.5567e+04 | 308.4978 | 110.4789 | 64.3719 | 0.8127 |
| H4T2 | 1.0204e+04 | 305.8831 | 116.8105 | 57.4392 | 0.8707 |
| H6T2 | 9.1721e+03 | 377.3641 | 135.2469 | 78.9786 | 0.8118 |
| H8T2 | 8.4145e+03 | 369.4578 | 144.5740 | 66.3178 | 0.8886 |
| H10T2 | 1.4217e+04 | 447.2165 | 140.1456 | 101.2784 | 0.6912 |
Conclusions
Major relationship between cell size and drying time and temperature were confirmed, the variance in the data did not allow any further in-depth analysis of the results or any new findings. Moisture ratio change with time during drying confirmed the shrinkage of the grape specimens over longer drying periods, and that higher drying temperature generally increased moisture loss and subsequent ability to rehydrate as successfully as their cooler counterparts. Scanning Electron Imaging of grape samples from two temperature groups and ranging from two to ten hours of drying time was undertaken. These images were analysed using image processing techniques established in this project. Two main techniques were established to outline the cells in the grape microstructure recoded in each scanning electron microscope image. Segmentation of the cells using the watershed function was more successful and consistent at extracting the morphological shape than the used of the Canny edge detector, closing and skeletisation method. From the obtained cell boundaries, quantitative data was extracted on mean grape cell area, perimeter and axis length for each sample. It was found that over drying time cell area and perimeter reduced as expected. Furthermore, that in general the higher temperature samples had smaller microstructural elements. Further work could be progressed in the future to develop a more accurate image processing method and obtain further SEM images to analyse so that anomalies are removed from the results. Further development of the image processing algorithm could assist in more accurate results being obtained. It is clear from viewing the results modelled the cell microstructure very well and other times there was little accurate cell shapes. If more SEM image could be obtained then the data could be averaged, or actual anomalies in the data could be excluded to create more reliable results.
Further images could be processed to obtain smoother and more convincing data in the future. The development of automatic image processing techniques will enable quantitative data to be extracted from these images.
Acknowledgments
Authors acknowledge the Queensland University of Technology for their support in providing Laboratory to use their laboratory facilities conduct this study.
References
- Aguilera, J. M., Stanley. New dimensions in micrsotructure of food products. Food Science and Technology. 2000, 11, 3–9. [Google Scholar]
- Aguilera, J. M. Drying and Dried Products Under the Microscope. Food Science and Technology. 2003, 9(3), 137–143. [Google Scholar] [CrossRef]
- Sansiribhan, S., Devahastin. Quantitative Evaluation of Microstructural Changes and their Relations with Some Physical Characteristics of Food during Drying. Journal of Food Science 2010, 75(7)(7), 453–461. [Google Scholar] [CrossRef] [PubMed]
- Mayor, L., Pissarra. Microstructural changes during osmotic dehydration of parenchymatic pumpkin tissue. Journal of Food Engineering 2008, 85, 326–339. [Google Scholar] [CrossRef]
- Tunnacliffe, A., Garcia. Anhydrobiotic engineering of bacteria and mammalia cells: Is intracellular trahalose sufficient? Cryobiology 2001, 43, 143–132. [Google Scholar] [CrossRef]
- Ramos, I. N., Silvaa. Quantification of microstructural changes during first stage air drying of grape tissue. On Journal of Food Engineering [Online] 2004. [Google Scholar] [CrossRef]
- Senadeera, W., & Banks, J. (2011). Analysis of micro-structural changes and measurement of their parameters of a food material. In Proceedings of the 5th Nordic Drying Conference (NDC 2011): Norwegian University of Science and Technology.
- Kerdpiboon, S., & Devahastin. Fractal Characterizaion of Some Physical Propoerties of a Food Product under Various Drying Conditions. Drying Technology 2007, 25(1)(1), 135–146. [Google Scholar] [CrossRef]
- Kerdpiboon, S., Devahaston. Comparative fractal characterization of physical changes of different food products during drying. Journal of Food Engineering 2007, 83, 570–580. [Google Scholar] [CrossRef]
- Sawhney, R., Pangavhane, D., & Sarsavadia, P. (2009). Drying Studies of Single Layer Thompson Seedless Grapes. In International Solar Food Processing Conference.
- Khodaei, J., & Akhijahani. Some Physical Properties of Rasa Grape (Vitis vinifera L.). World Applied Sciences Journal 2012, 18(6)(6), 818–825. [Google Scholar] [CrossRef]
- Banks, J., & Senadeera, W. (2012). Measurement of structural changes to a food material during dehydration. In 4th International Conference on Computational Methods.
- Aguilera, J. M. Why food microstructure? Journal of Food Engineering 2005, 67(2), 3–11. [Google Scholar] [CrossRef]
- Chen, X. D., & Mujumdar, A. S. (2008). Drying technologies in food processing.
- Goula, A. M., & Adamopoulos, K. G. (2009). Modeling the Rehydration Process of Dried Tomato.
- Tortoe, C., & Orchard. Microsturctual changes of osmotically dehydrated tussies of apple, banana, and potato. Scanning 2006, 28(3)(3), 172–178. [Google Scholar] [CrossRef]
- Australian Microscopy and Microanalysis Research Facility. (2013). MyScope: SEM [Internet]. Retrieved 8 April, 2013from http://www.ammrf.org.au/myscope/sem/background/.
- Georget, D. M. R., Smith. Thermal transitions in freeze-dried carrot and its cell wall components. Thermochimica acta 1999, 332(2), 203–210. [Google Scholar] [CrossRef]
- Lewicki, P. P., & Pawlaka. Effect of mode of drying on microstructure of potato. Drying technology 2005, 23(4)(4), 847–869. [Google Scholar] [CrossRef]
- Jiang, H., Zhang. Analysis of Temperature Distribution and SEM Images of Microwave Freeze Drying Banana Chips. Food Bioprocess Technol 2013, 6, 1144–1152. [Google Scholar] [CrossRef]
- Askari, G. R., Emam-Djomeh, Z., & Mousavi, S. M. (2004). Effect of Dying Method on Microstructural Changes of Apple Slices. In 14th Internation Drying Symposium (Vol. B, pp. 1435-1441).
- Favaa, J., Hodarac. Structure (micro, ultra, nano), color and mechanical properties of Vitis labrusca L. (grape berry) fruitstreated by hydrogen peroxide, UV–C irradiation and ultrasound. Food Research International 2011, 44(9), 2938–2948. [Google Scholar] [CrossRef]
- Canny, J. A computational approach to edge detection. IEEE Transactions on Pattern Analysis and Machine Intelligence 1986, 8(6), 679–698. [Google Scholar] [CrossRef]
- Gonzalez, M., Meschino. Solving the over segmentation problem in applications of Watershed Transform. Journal of Biomedical Graphics and Computin 2013, 3(3). [Google Scholar] [CrossRef]
- Adelson, B. The Laplacian Pyramid as a Compact Image Code. IEEE Transactions on Communications 1983, 31(4), 532–540. [Google Scholar]
- Zhou, R. W., Quek. A novel single-pass thinning algorithm and an effective set of performance criteria. Pattern Recognition Letters 1995, 16, 1267–1275. [Google Scholar] [CrossRef]
- Fisher, R., Perkins, S., Walker, A., & Wolfart, E. (2003). Thinning [Internet]. Retrieved 20 Apr., 2013from http://homepages.inf.ed.ac.uk/rbf/HIPR2/thin.htm.
- Forero, M., & Hidalgo, A. (2011). Image Processing Methods for Automatic Cell Counting In Vivo or In Situ Using 3D Confocal Microscopy. In G. Gargiulo (Ed.), Advanced Biomedical Engineering (pp. 183-204). Croatia: InTech. Retrieved from http://www.intechopen.com/books/advanced-biomedicalengineering/image-processing- methods-for-automatic-cell-counting-in-vivo-or-in-situ-using-3d-confocalmicroscopy.
- Farhan, M., Ruusuvuori. Multi-scale Gaussian representation and outlinelearning based cell image segmentation. BMC Bioinformatics Retrieved from http://www.biomedcentral.com/1471- 2105/14/S10/S6. 2013, 14(10). [Google Scholar]
- Margaritis, E., & Jones. Beyond cereals: crop processing and Vitis vinifera L. Ethnography, experiment and charred grape remains from Hellenistic Greece. Journal of Archeological Science 2006, 33(6), 784–805. [Google Scholar] [CrossRef]
- Burt, A. Fast Filter Transforms for Image Processing. Computer Graphics and Image Processing 1981, 16, 20–51. [Google Scholar] [CrossRef]
Figure 1.
Changes to plant microstructure during dehydration. a: fresh cell, b: shrinkage and plasmolysis, c: cell to cell debonding and d: cell rupture and cavity formation (Mayor, et al., 2008).
Figure 1.
Changes to plant microstructure during dehydration. a: fresh cell, b: shrinkage and plasmolysis, c: cell to cell debonding and d: cell rupture and cavity formation (Mayor, et al., 2008).
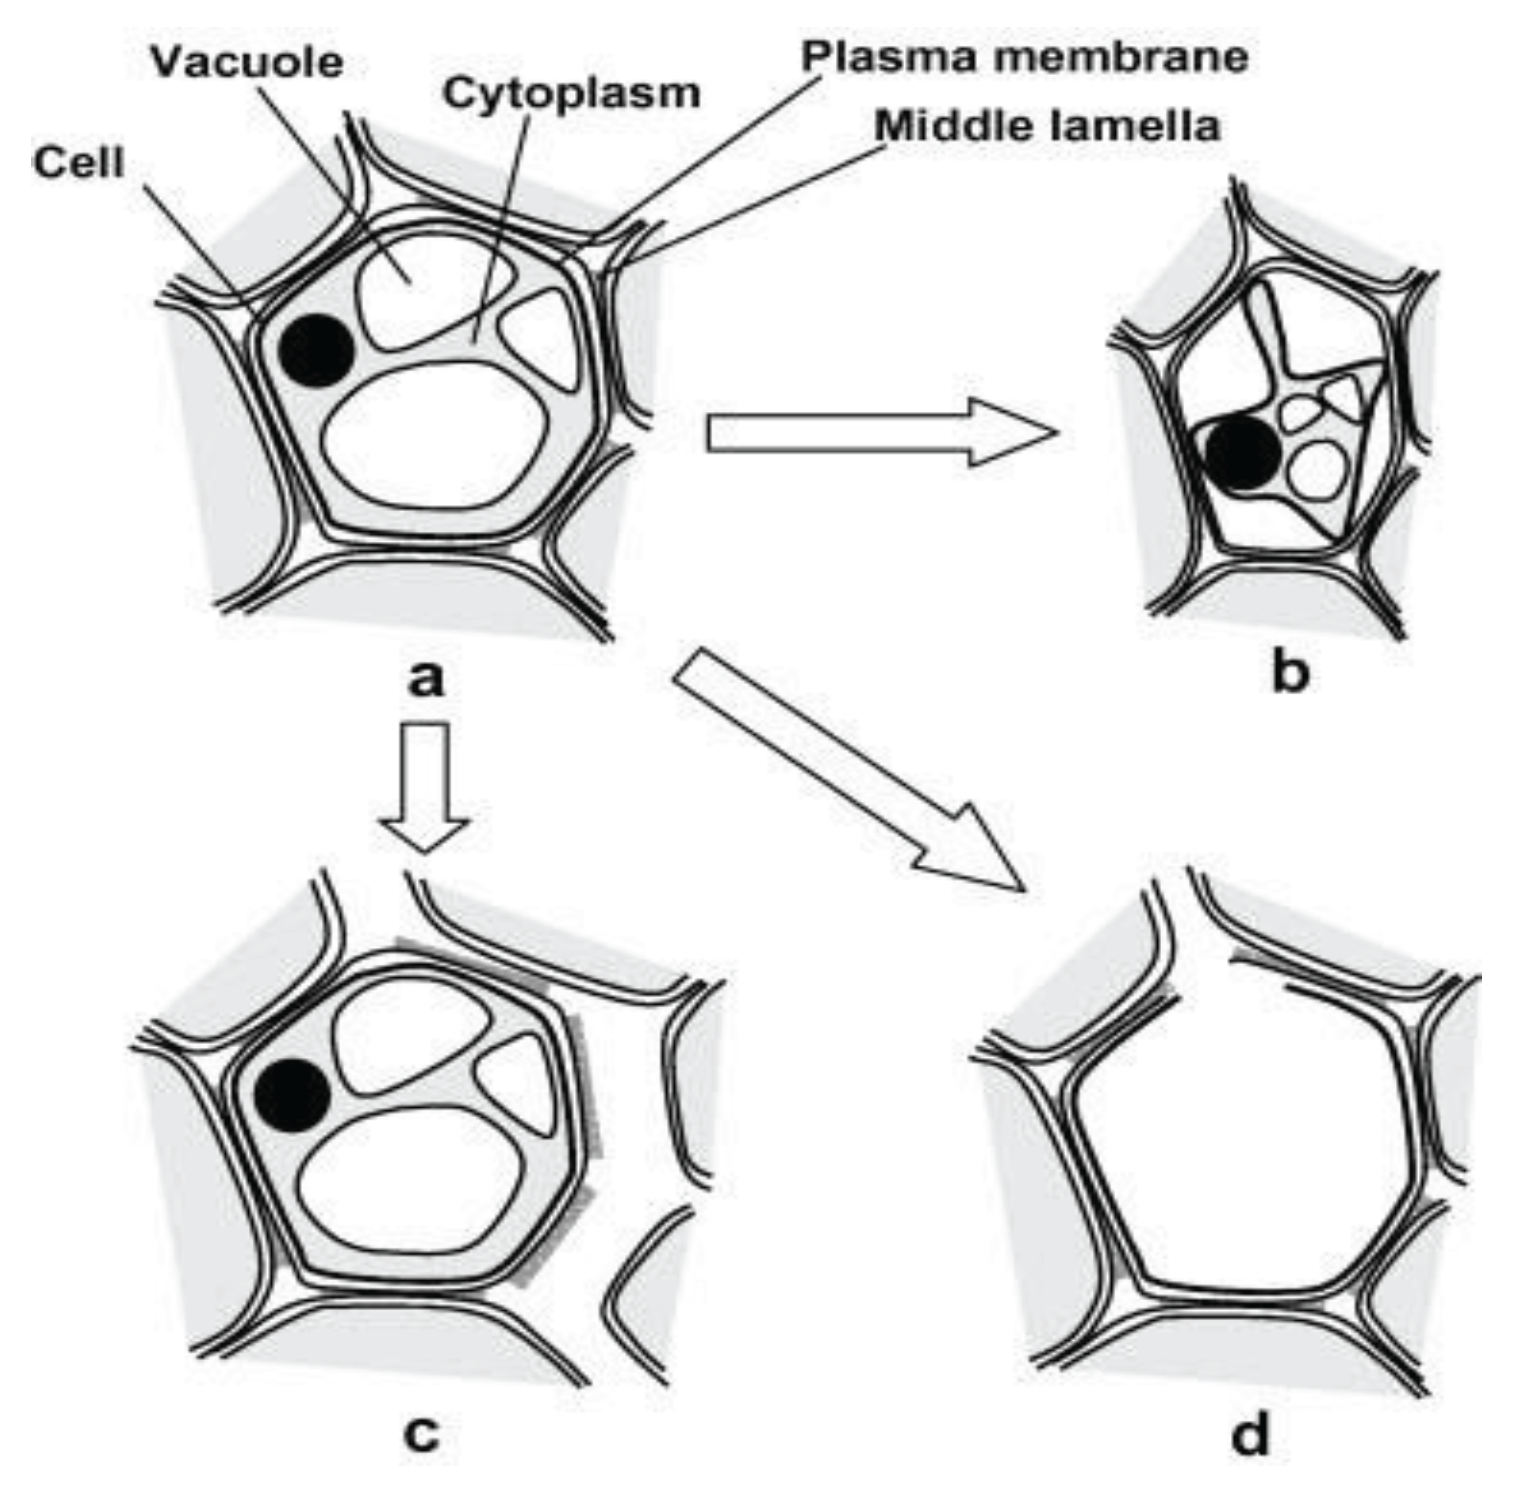
Figure 2.
Cell Boundary Detection Process. (a) original greyscale image, (b) after edge detection step, (c) and following closing, (d) thinning, (e) pruning and removal of small regions (f) (Banks & Senadeera, 2012).
Figure 2.
Cell Boundary Detection Process. (a) original greyscale image, (b) after edge detection step, (c) and following closing, (d) thinning, (e) pruning and removal of small regions (f) (Banks & Senadeera, 2012).
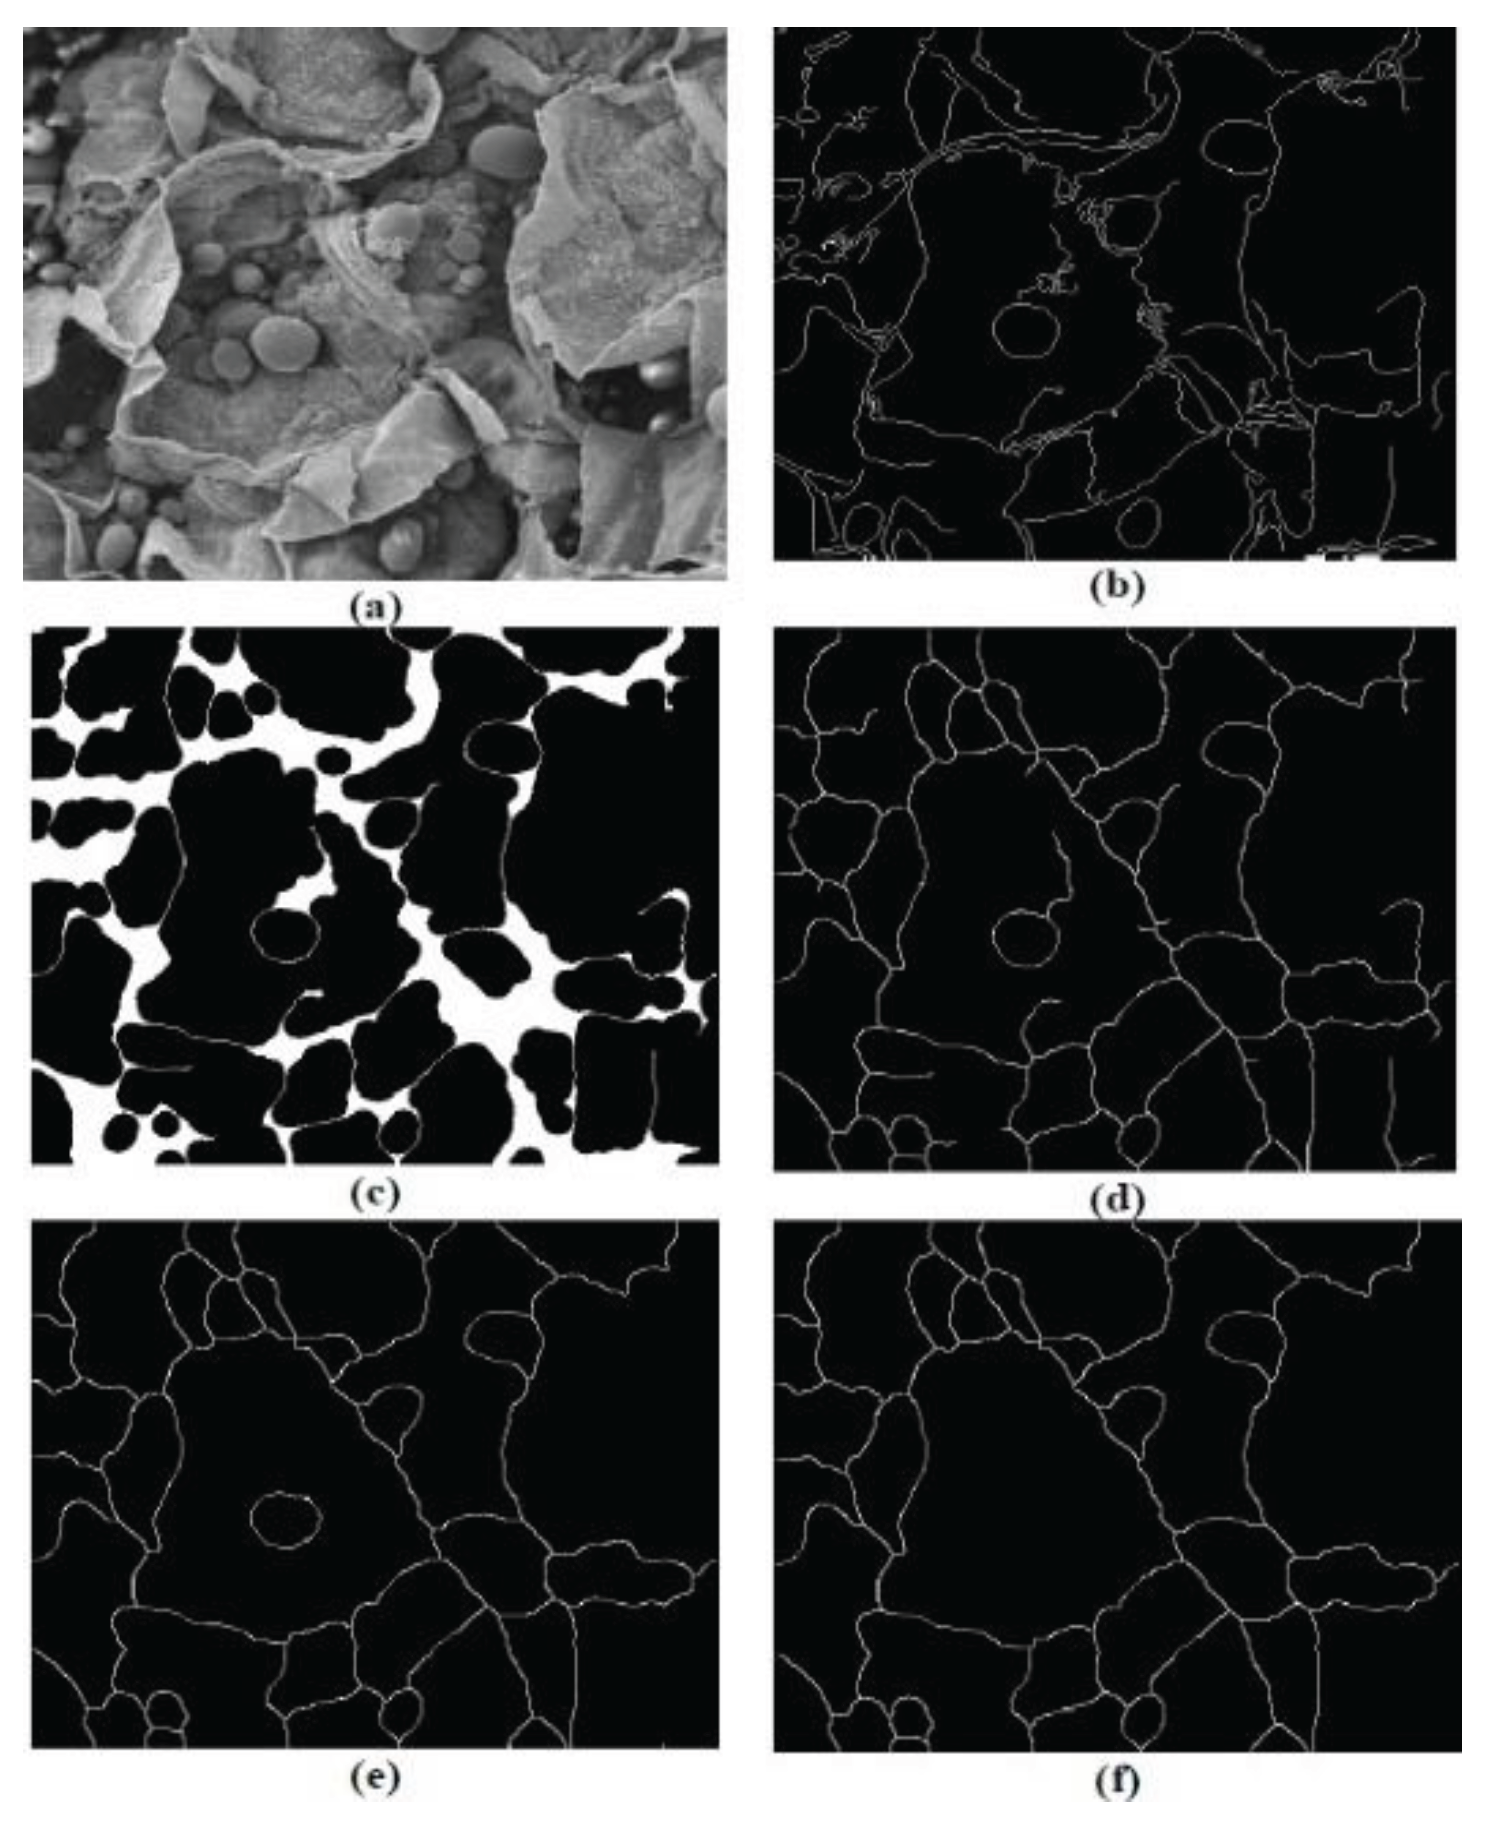
Figure 3.
Image segmentation a) the original microscopy image, b) the effects of pre-processing, c) Gaussian kernel applications and d) final segmented image (Farhan, et al., 2013).
Figure 3.
Image segmentation a) the original microscopy image, b) the effects of pre-processing, c) Gaussian kernel applications and d) final segmented image (Farhan, et al., 2013).
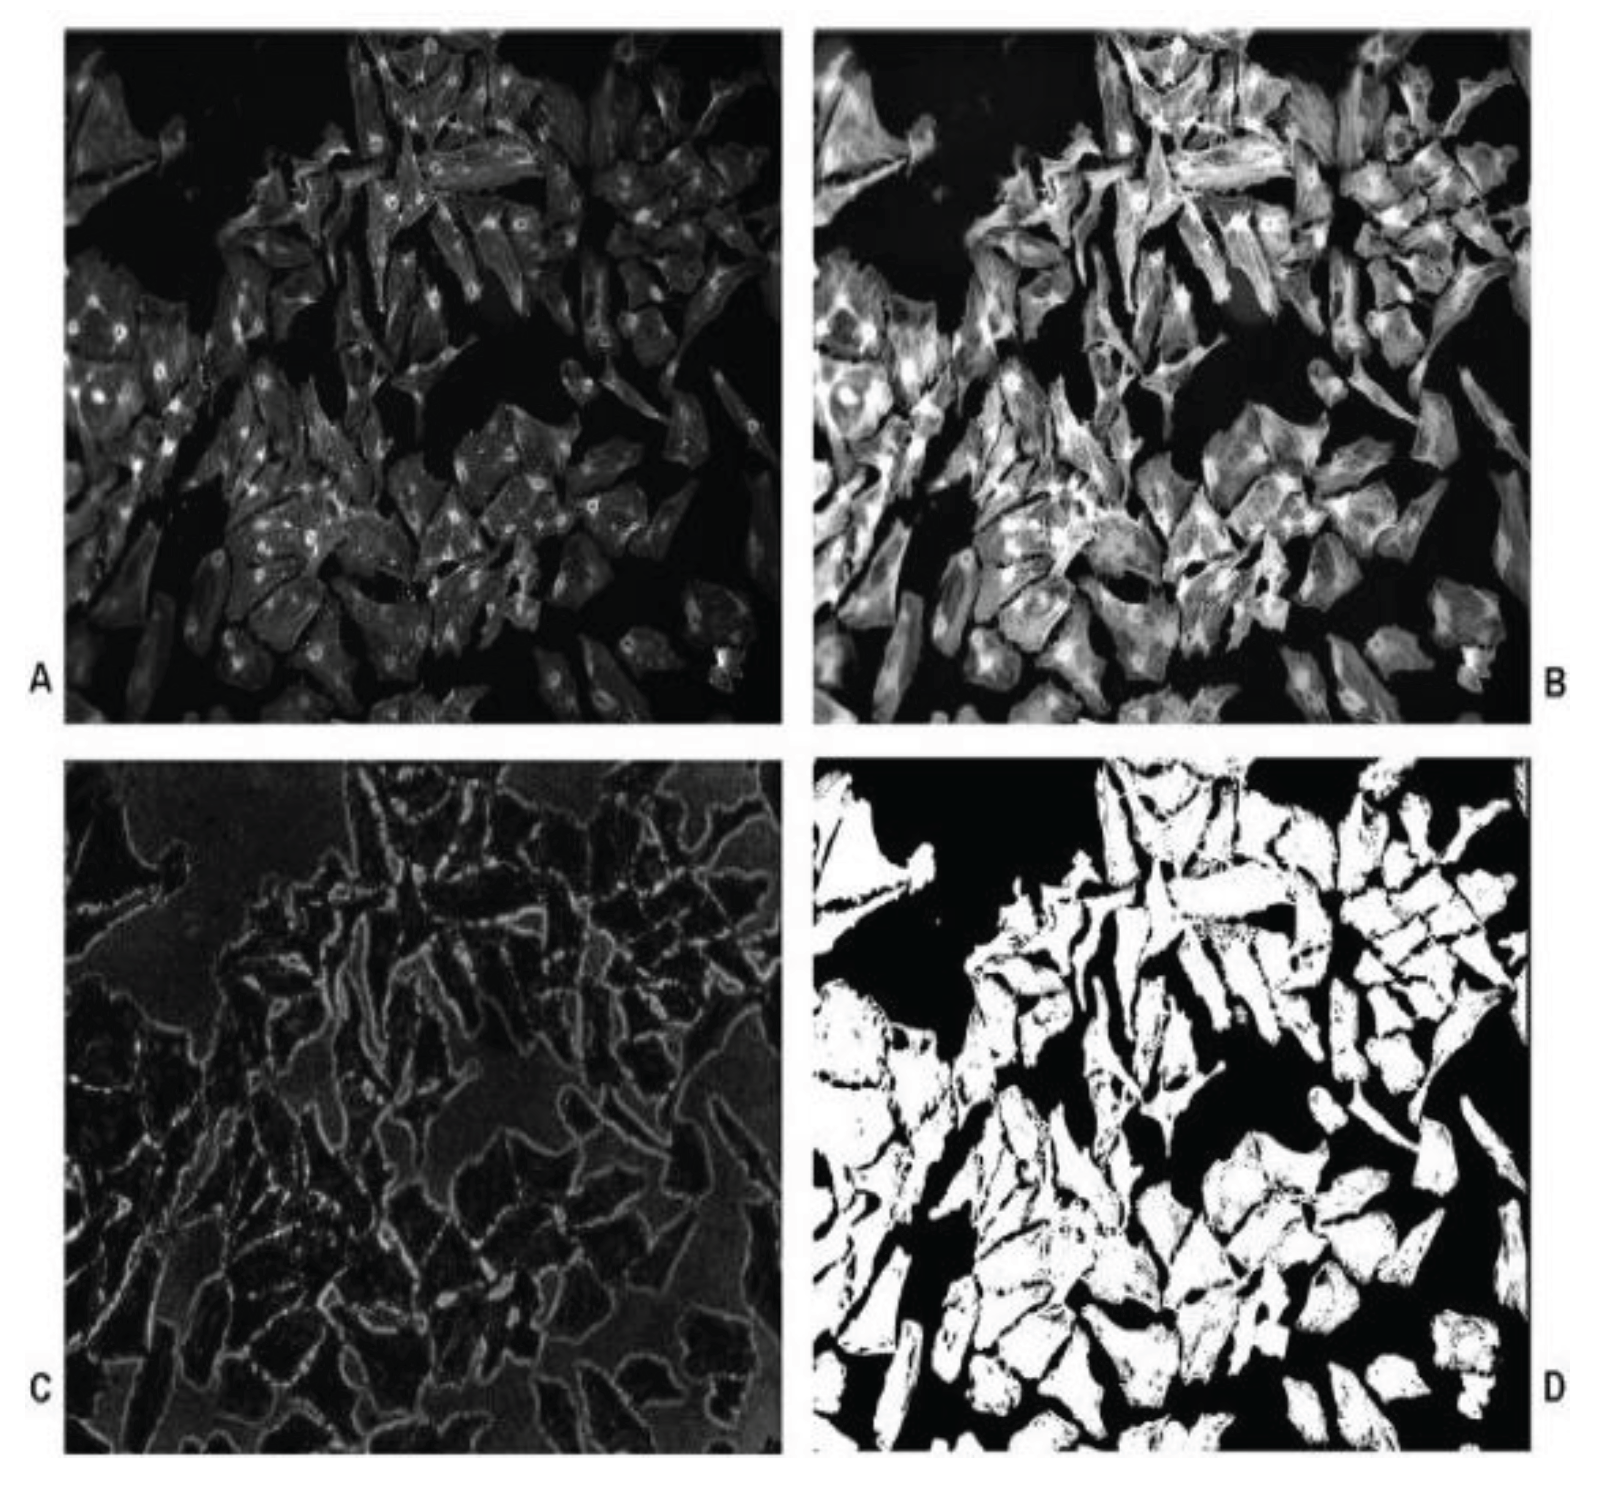
Figure 4.
Macrostructure of a typical grape (Margaritis & Jones, 2006).
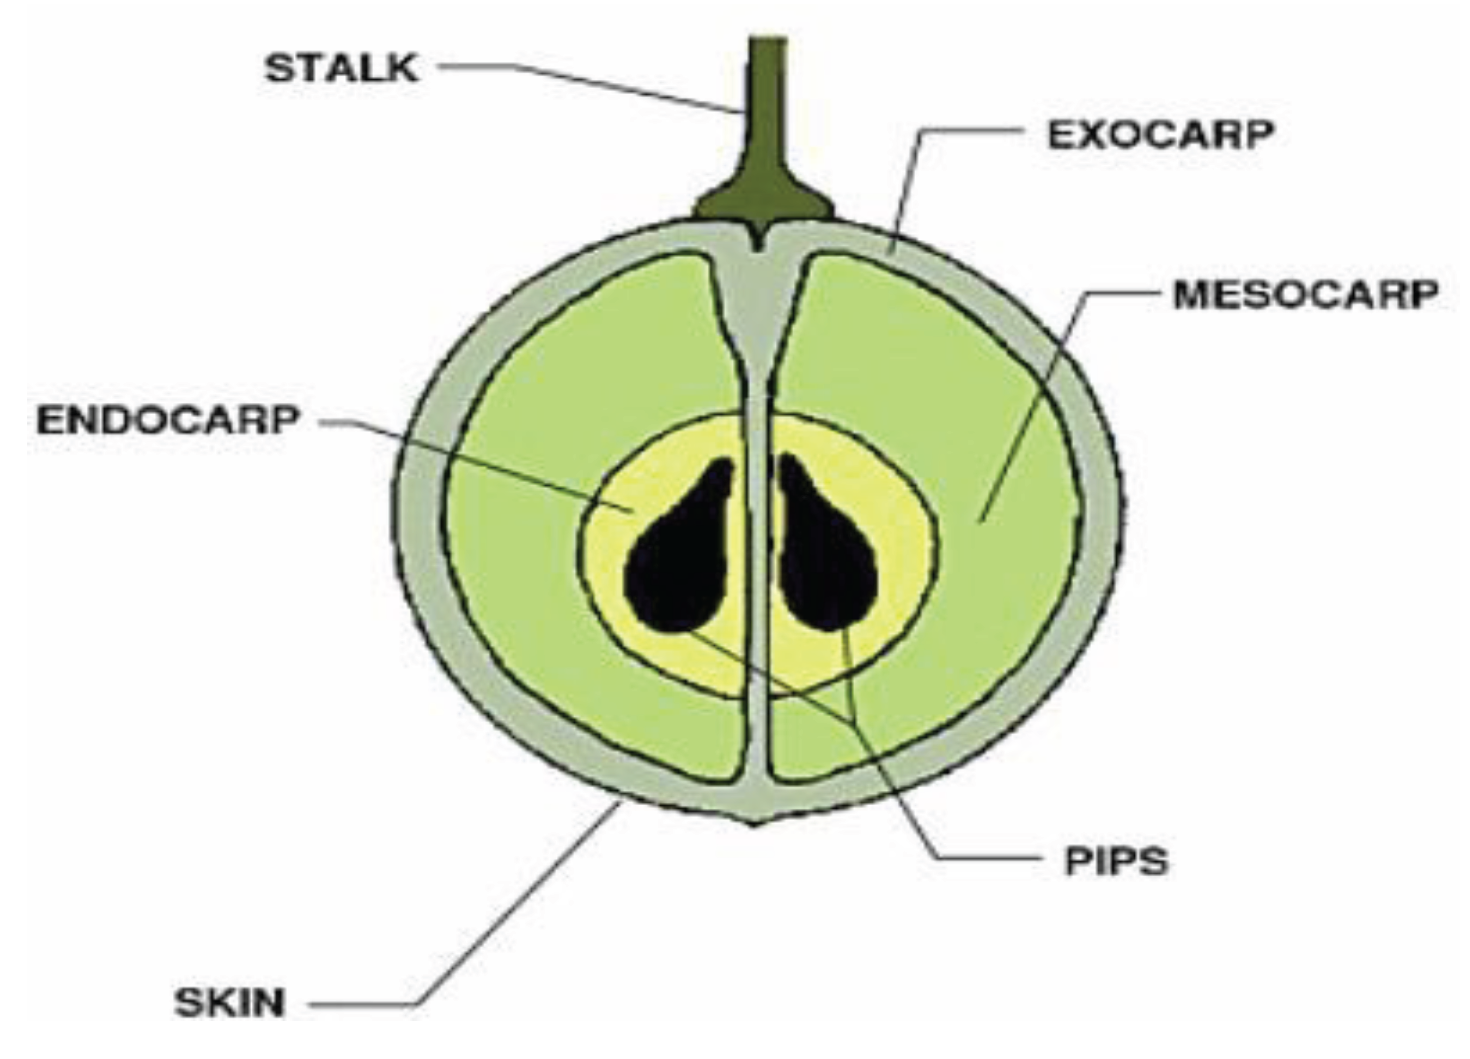
Figure 5.
Schematic of Watershed Theory (Gonzalez, et al., 2013).
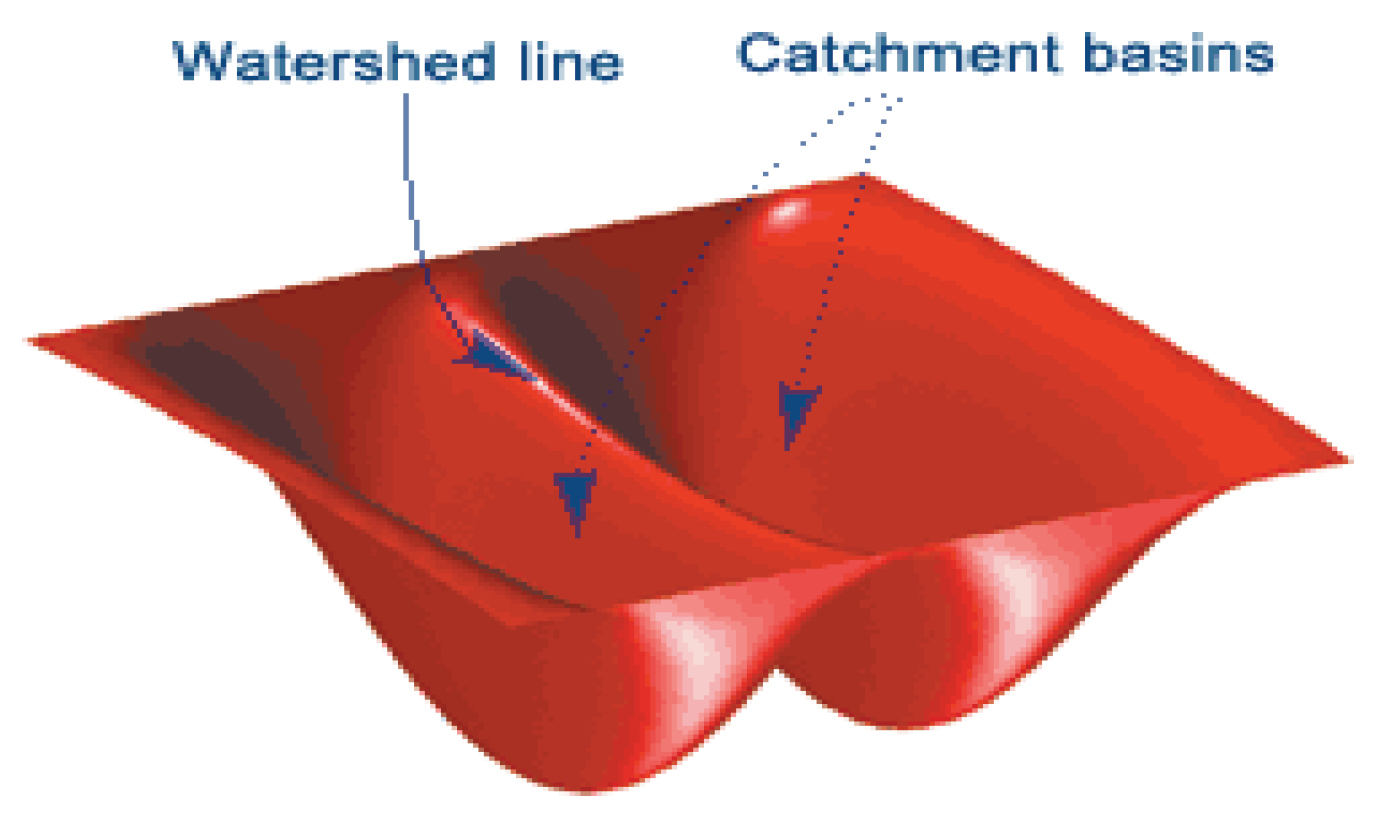
Figure 6.
Drying kinetics of grapes at two different temperatures.
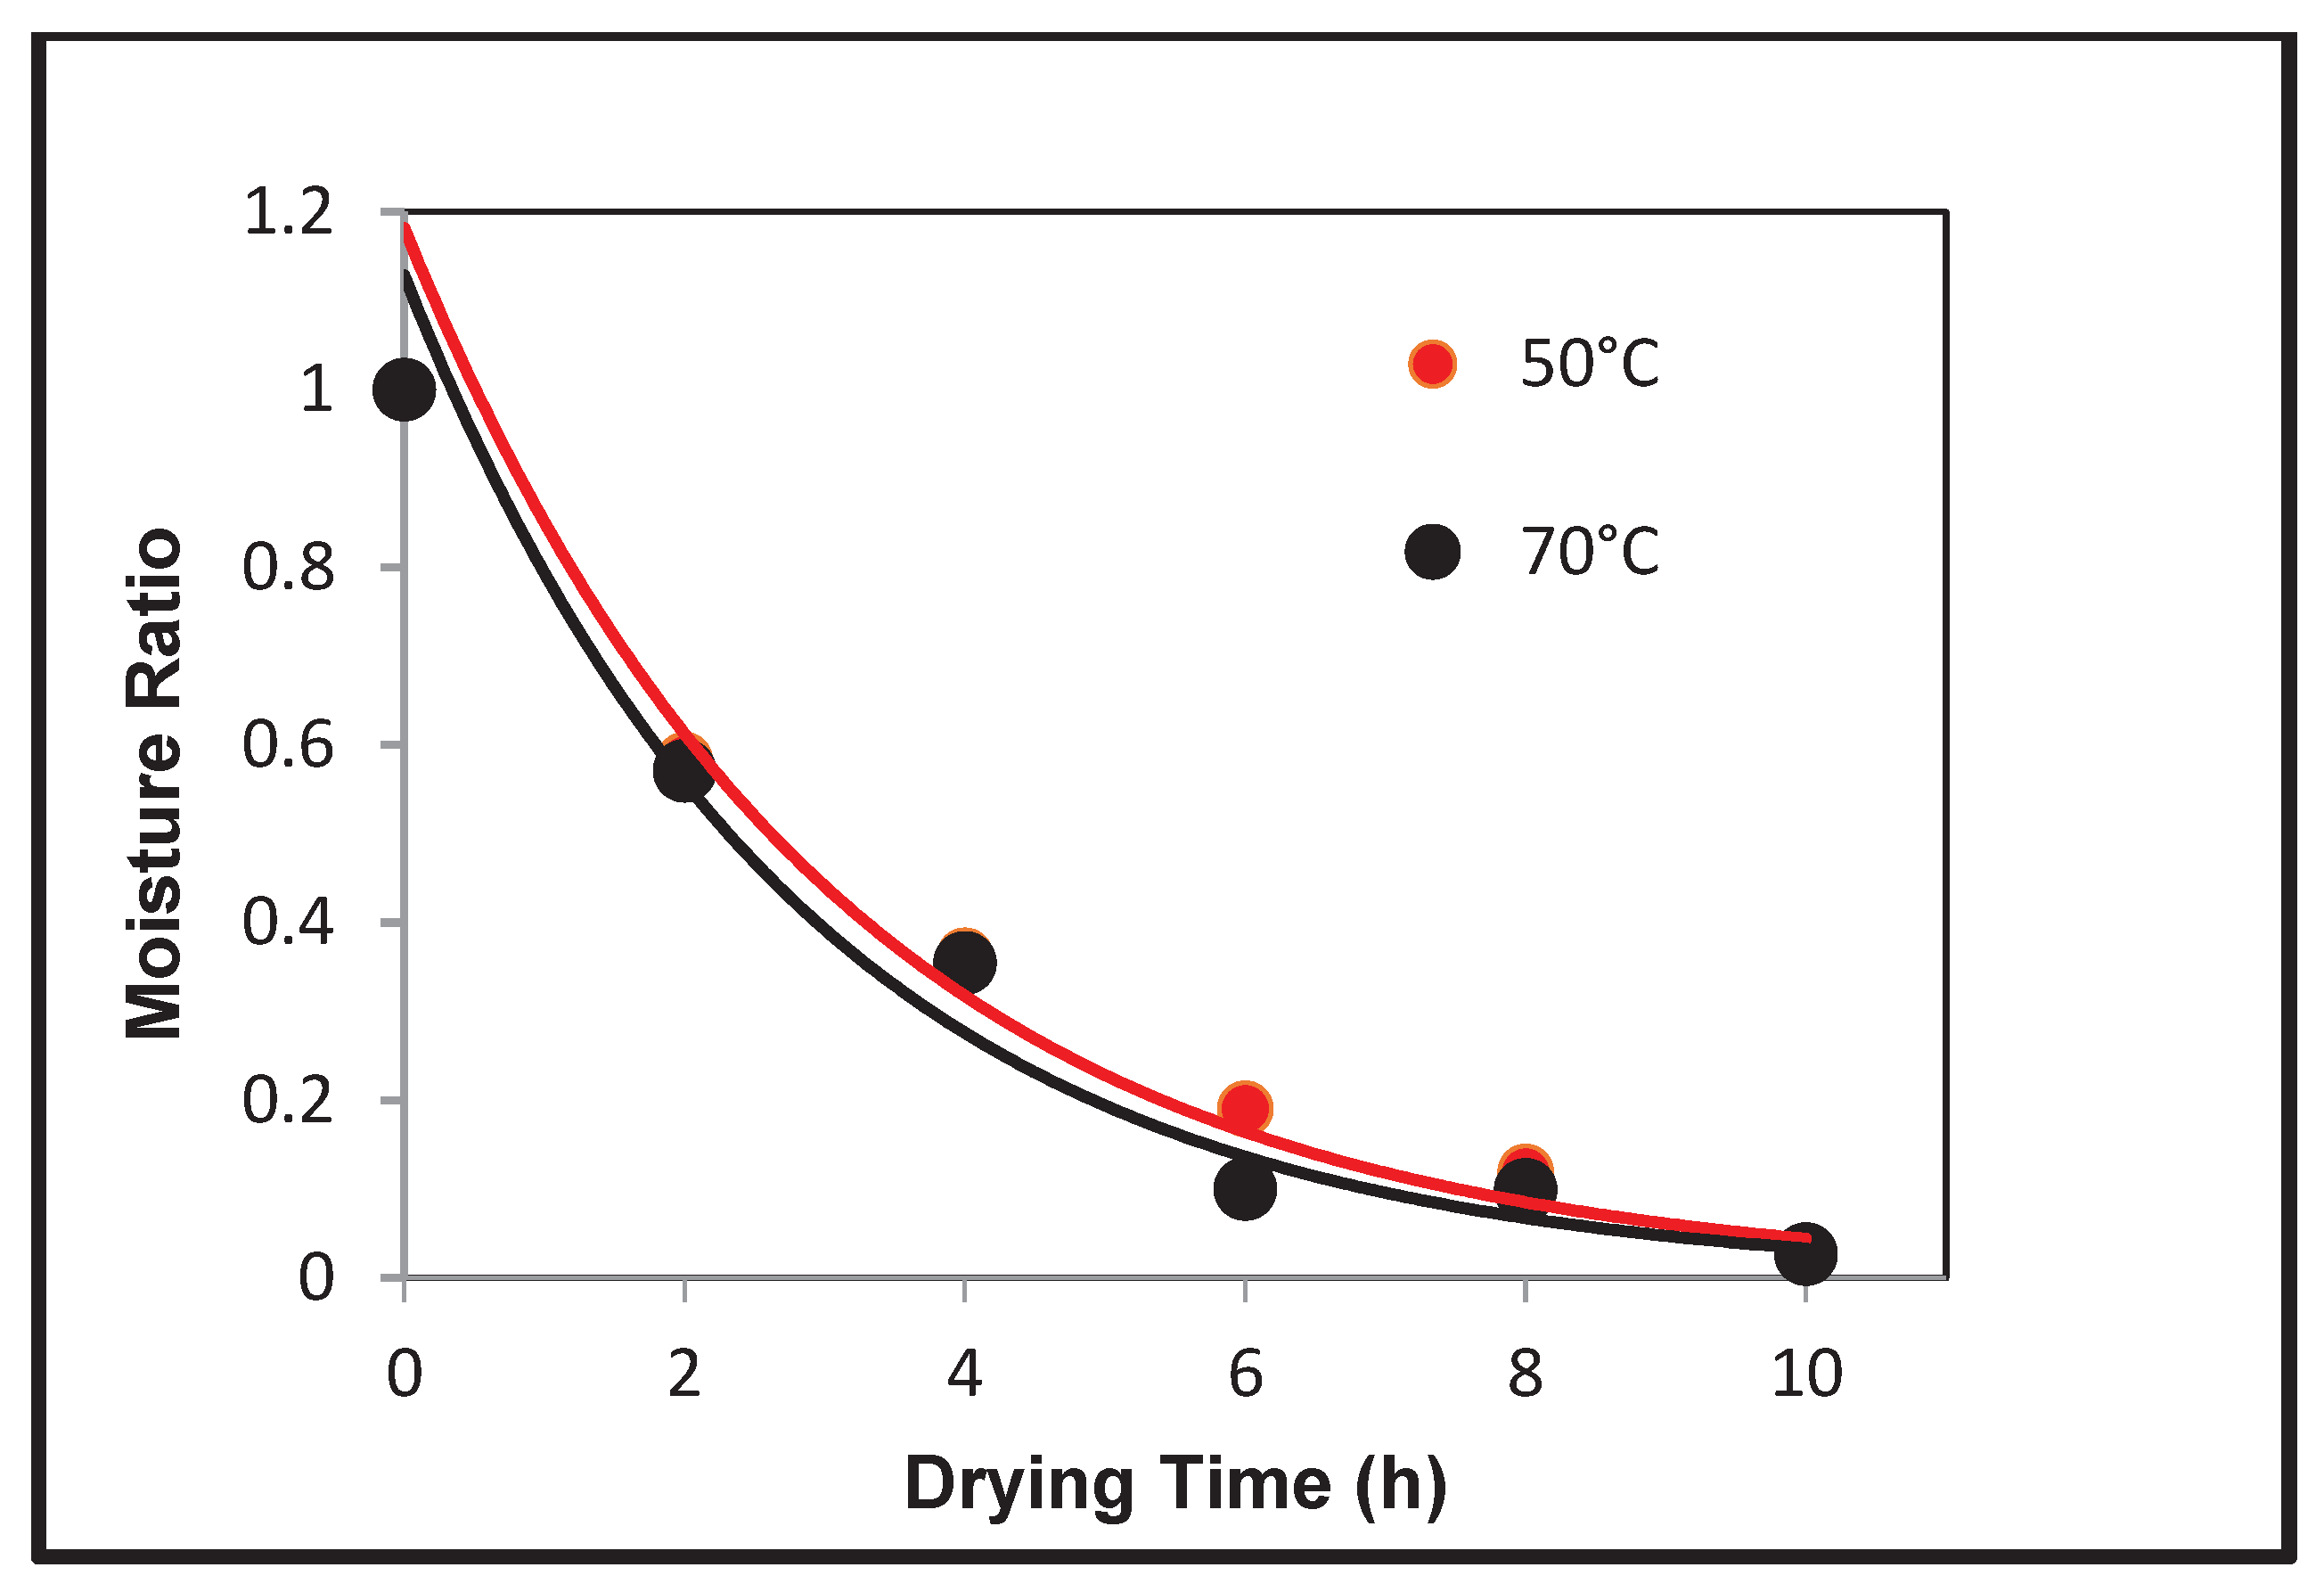
Figure 7.
Rehydration rate curves of grapes dried at Temperature 70oC (T1) and 55oC (T2).
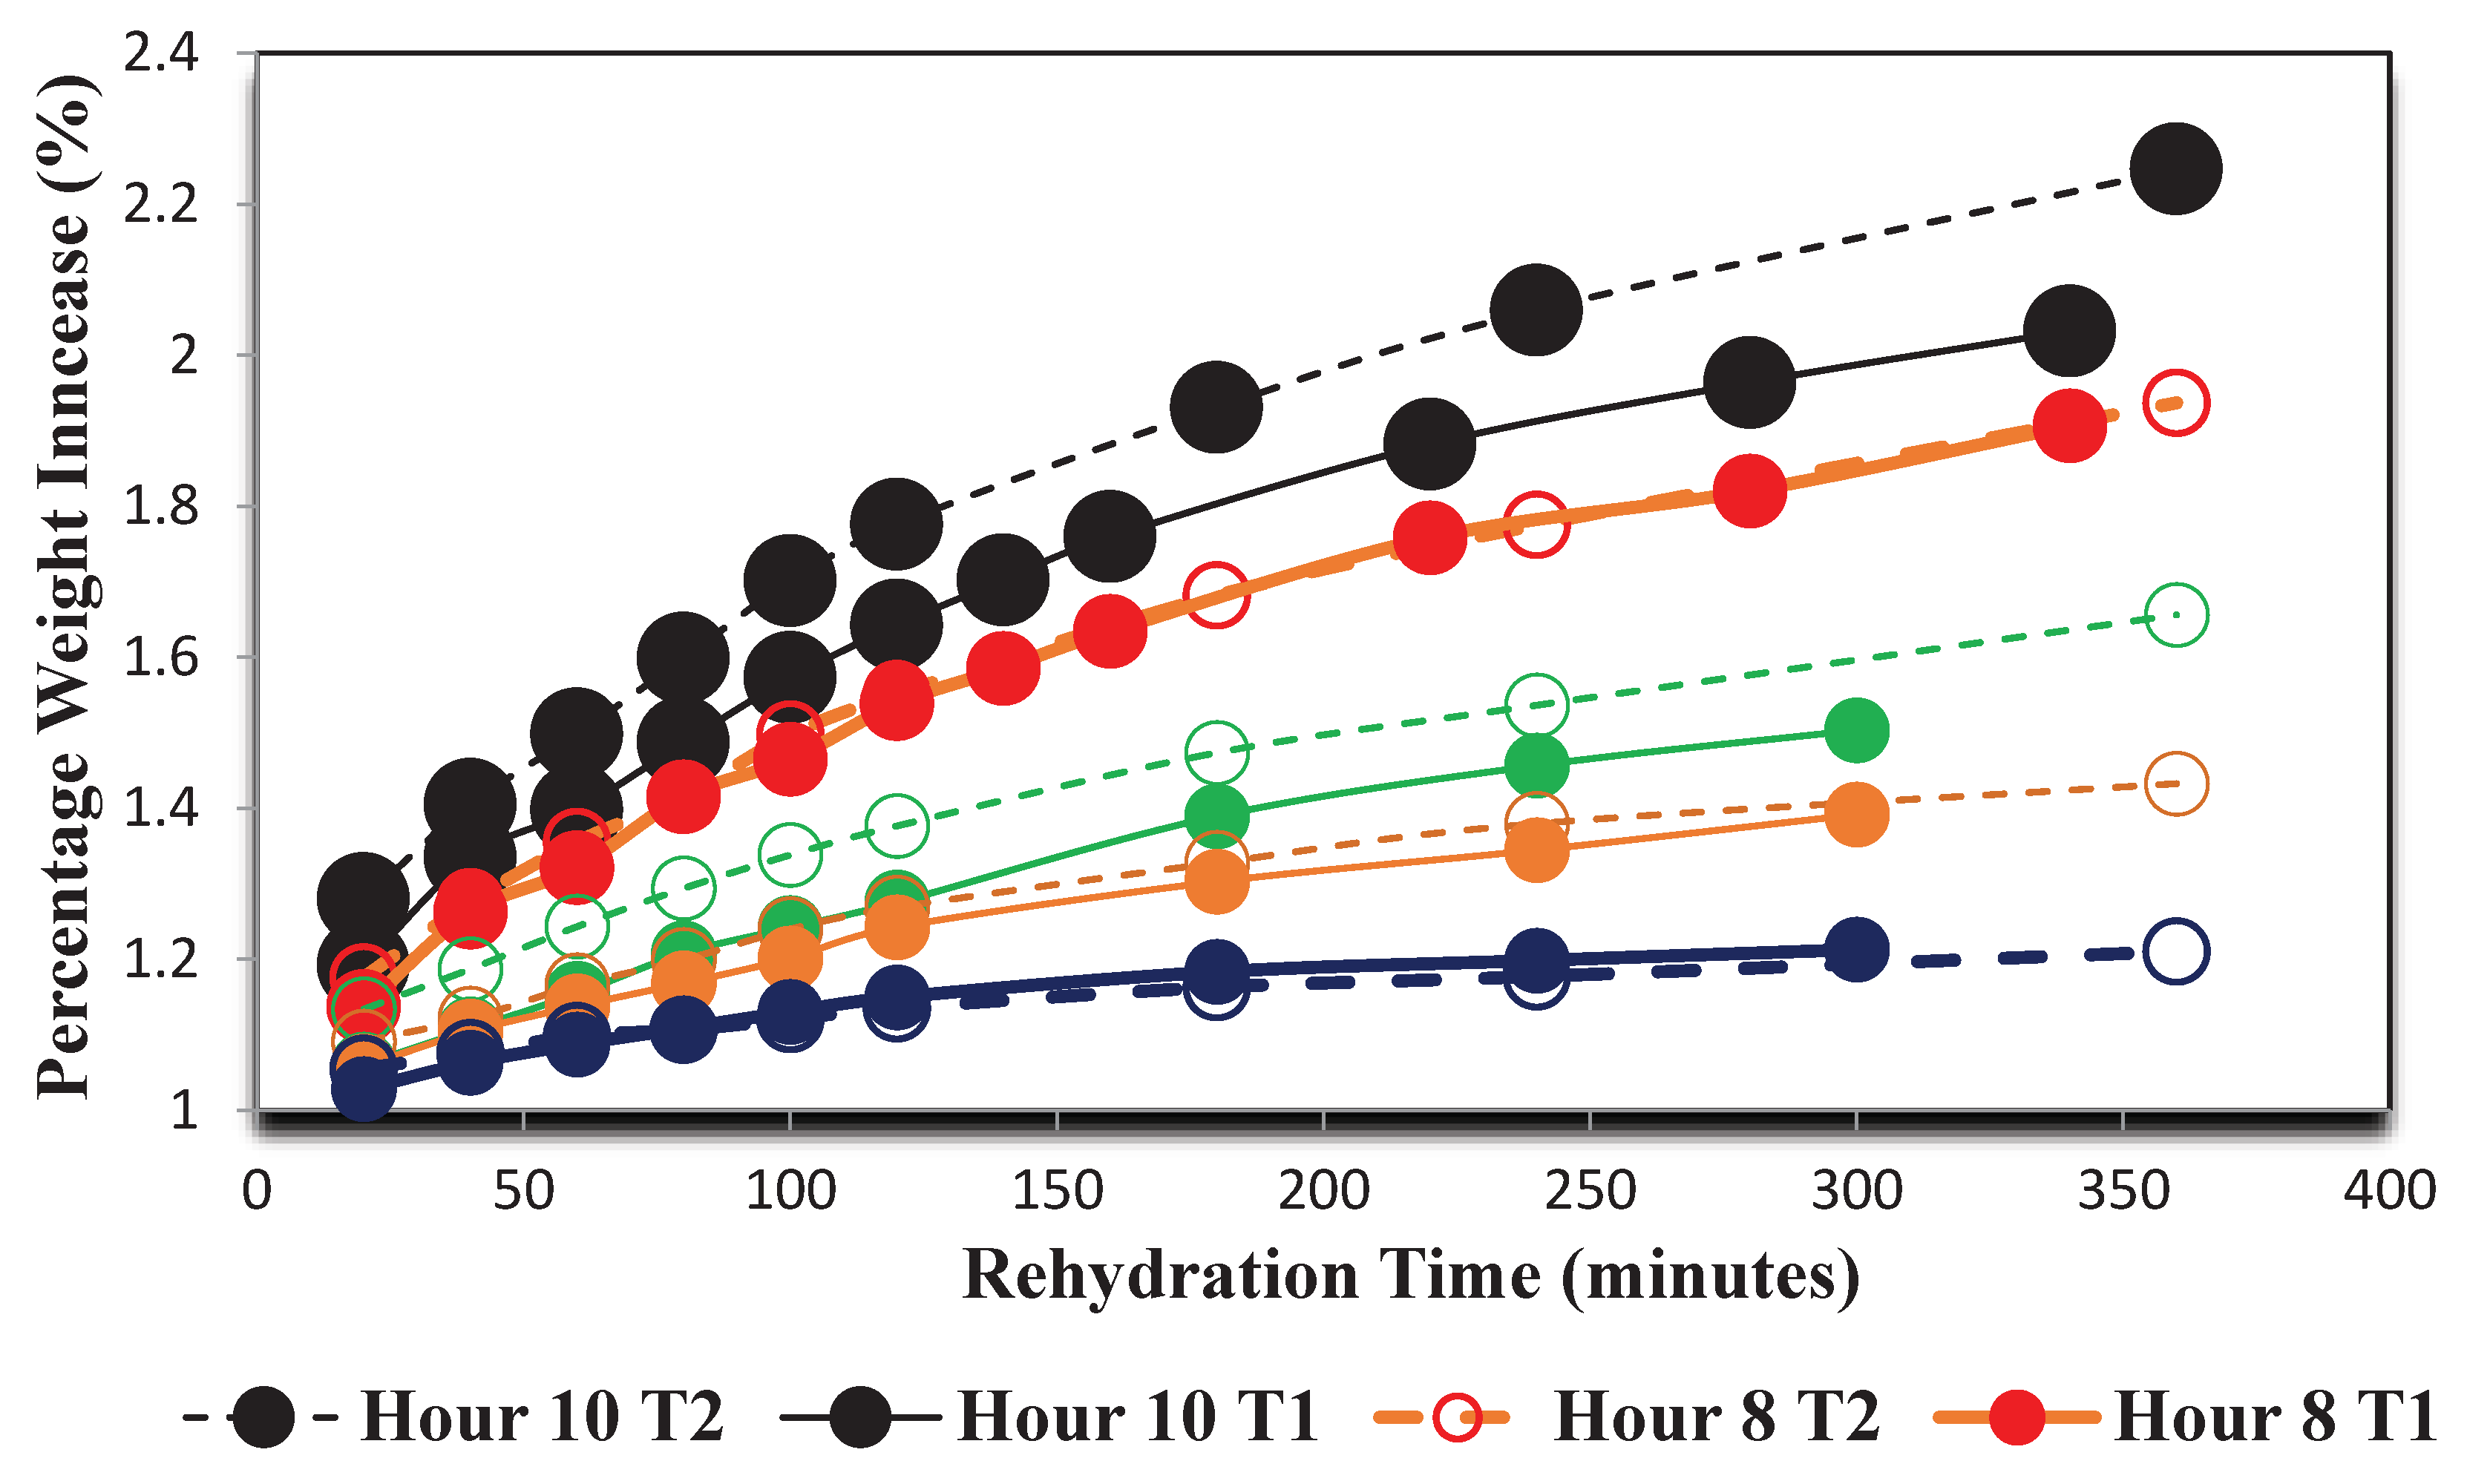
Figure 8.
Variation of microstructure at 70oC drying in 2-hour intervals.

Figure 9.
Watershed segmentation at various threshold (h) for 70oC, 10 _400. Chosen threshold h= 120.
Figure 9.
Watershed segmentation at various threshold (h) for 70oC, 10 _400. Chosen threshold h= 120.
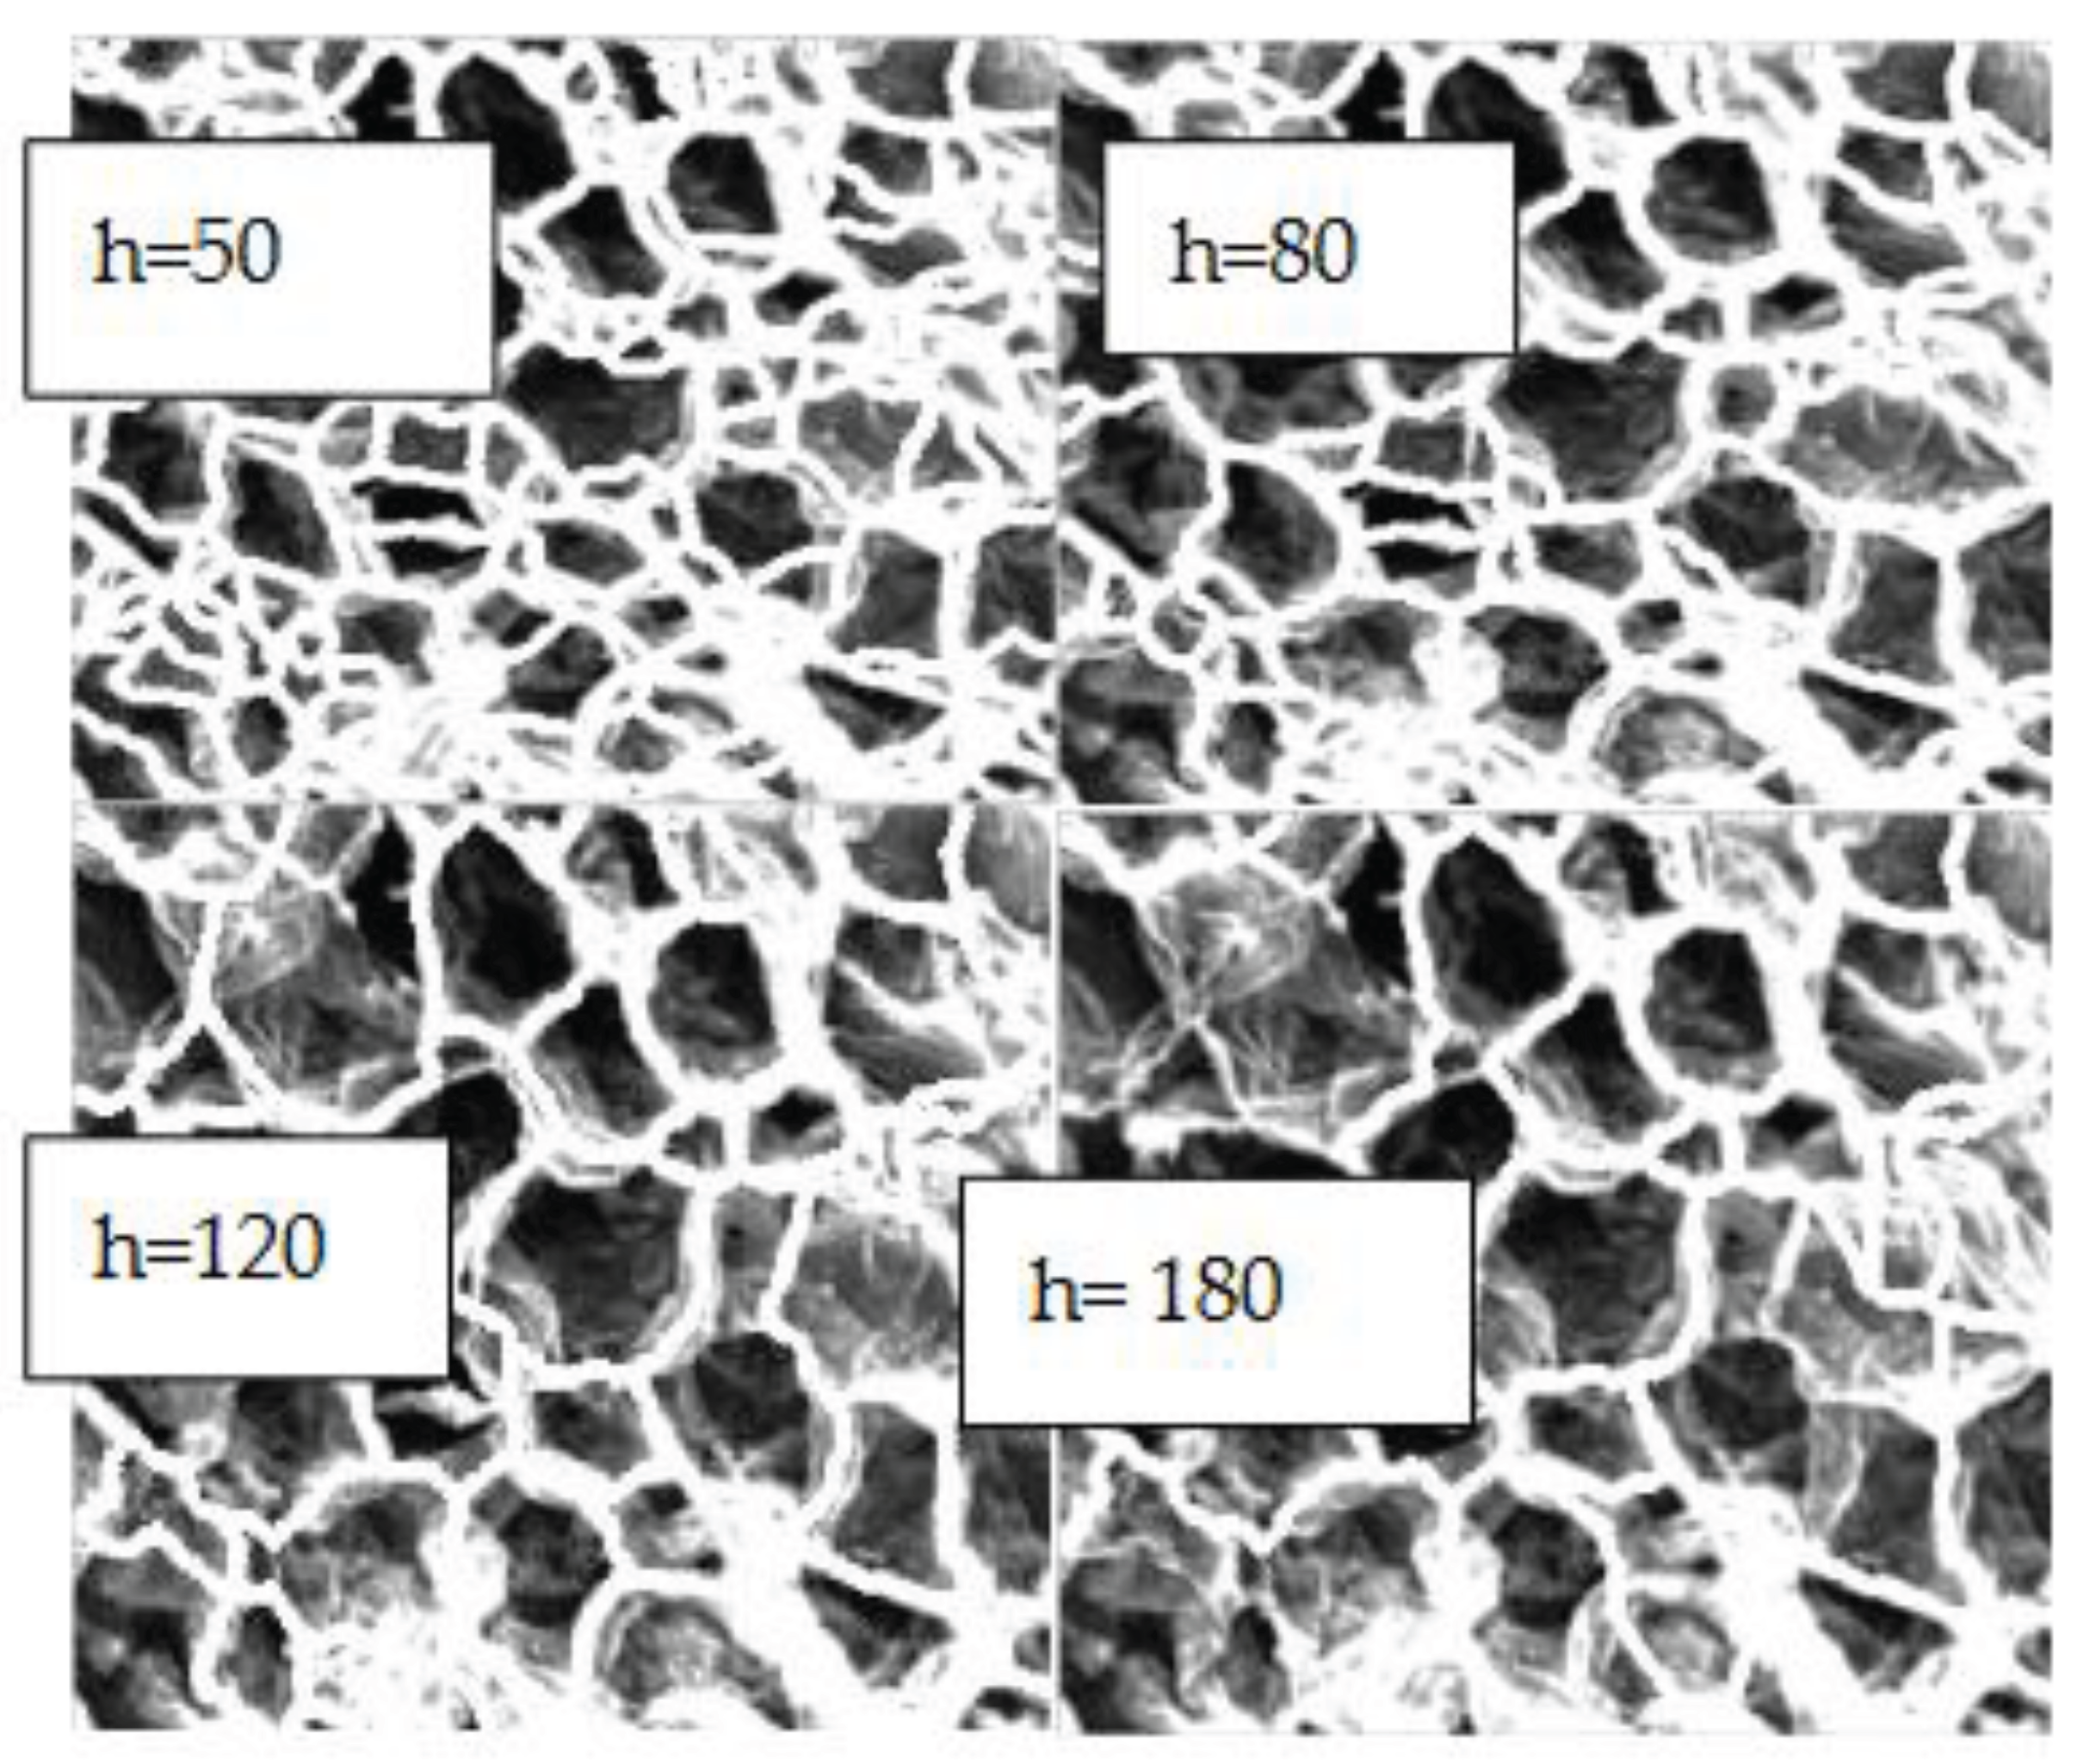
Figure 10.
Canny edge detector with varying thresholds applied.
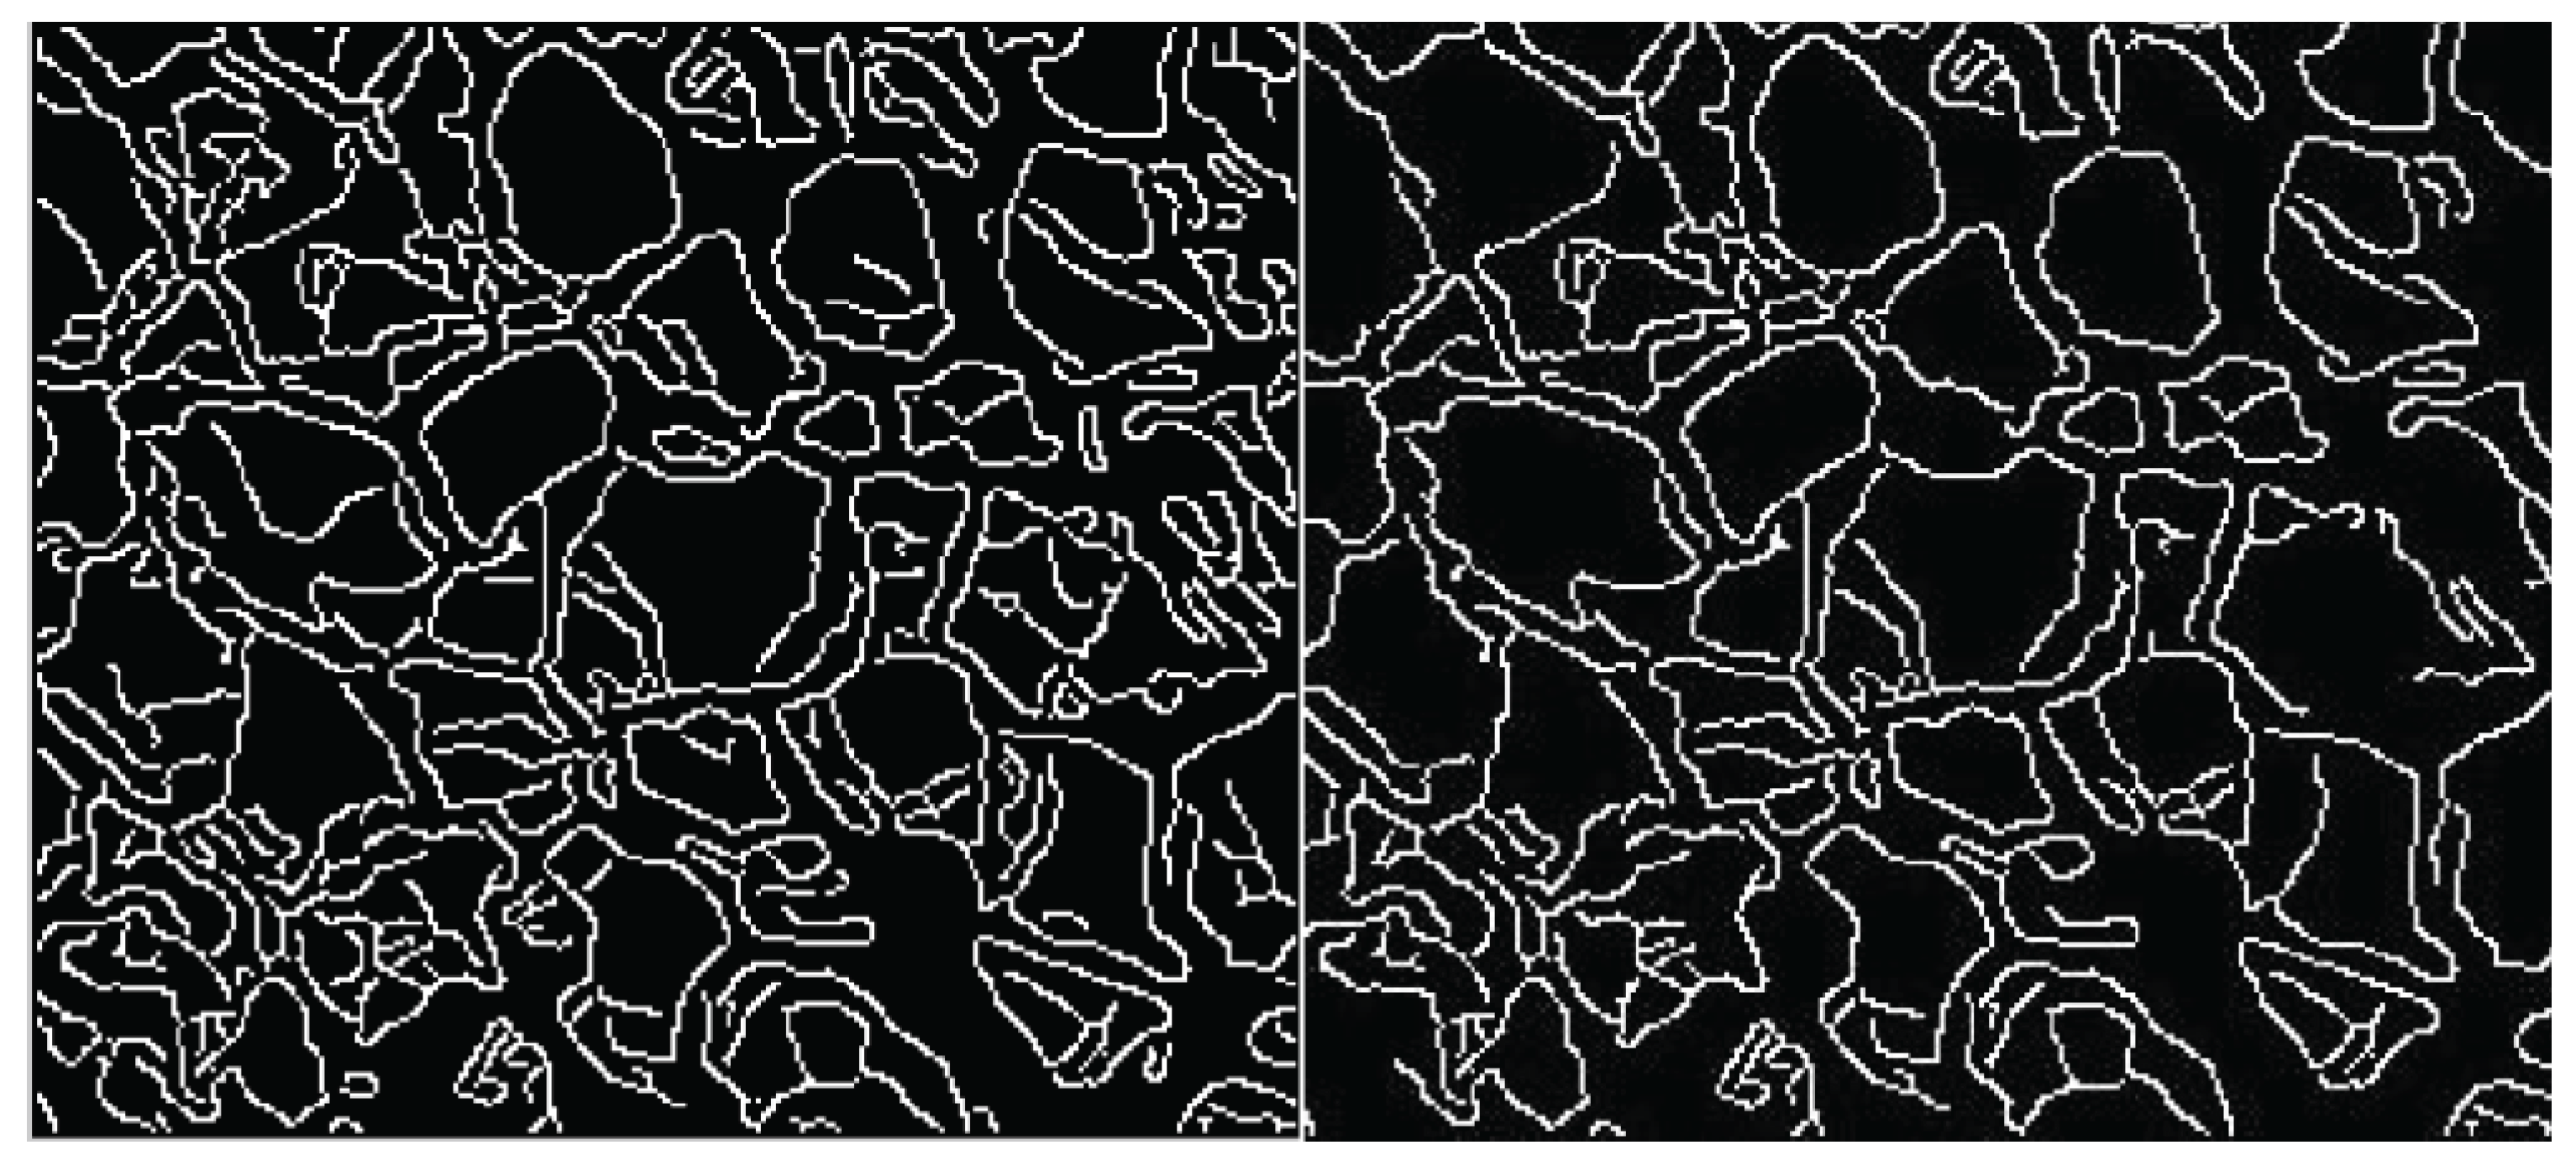
Figure 11.
Cell regions superimposed onto each SEM image by two methods.
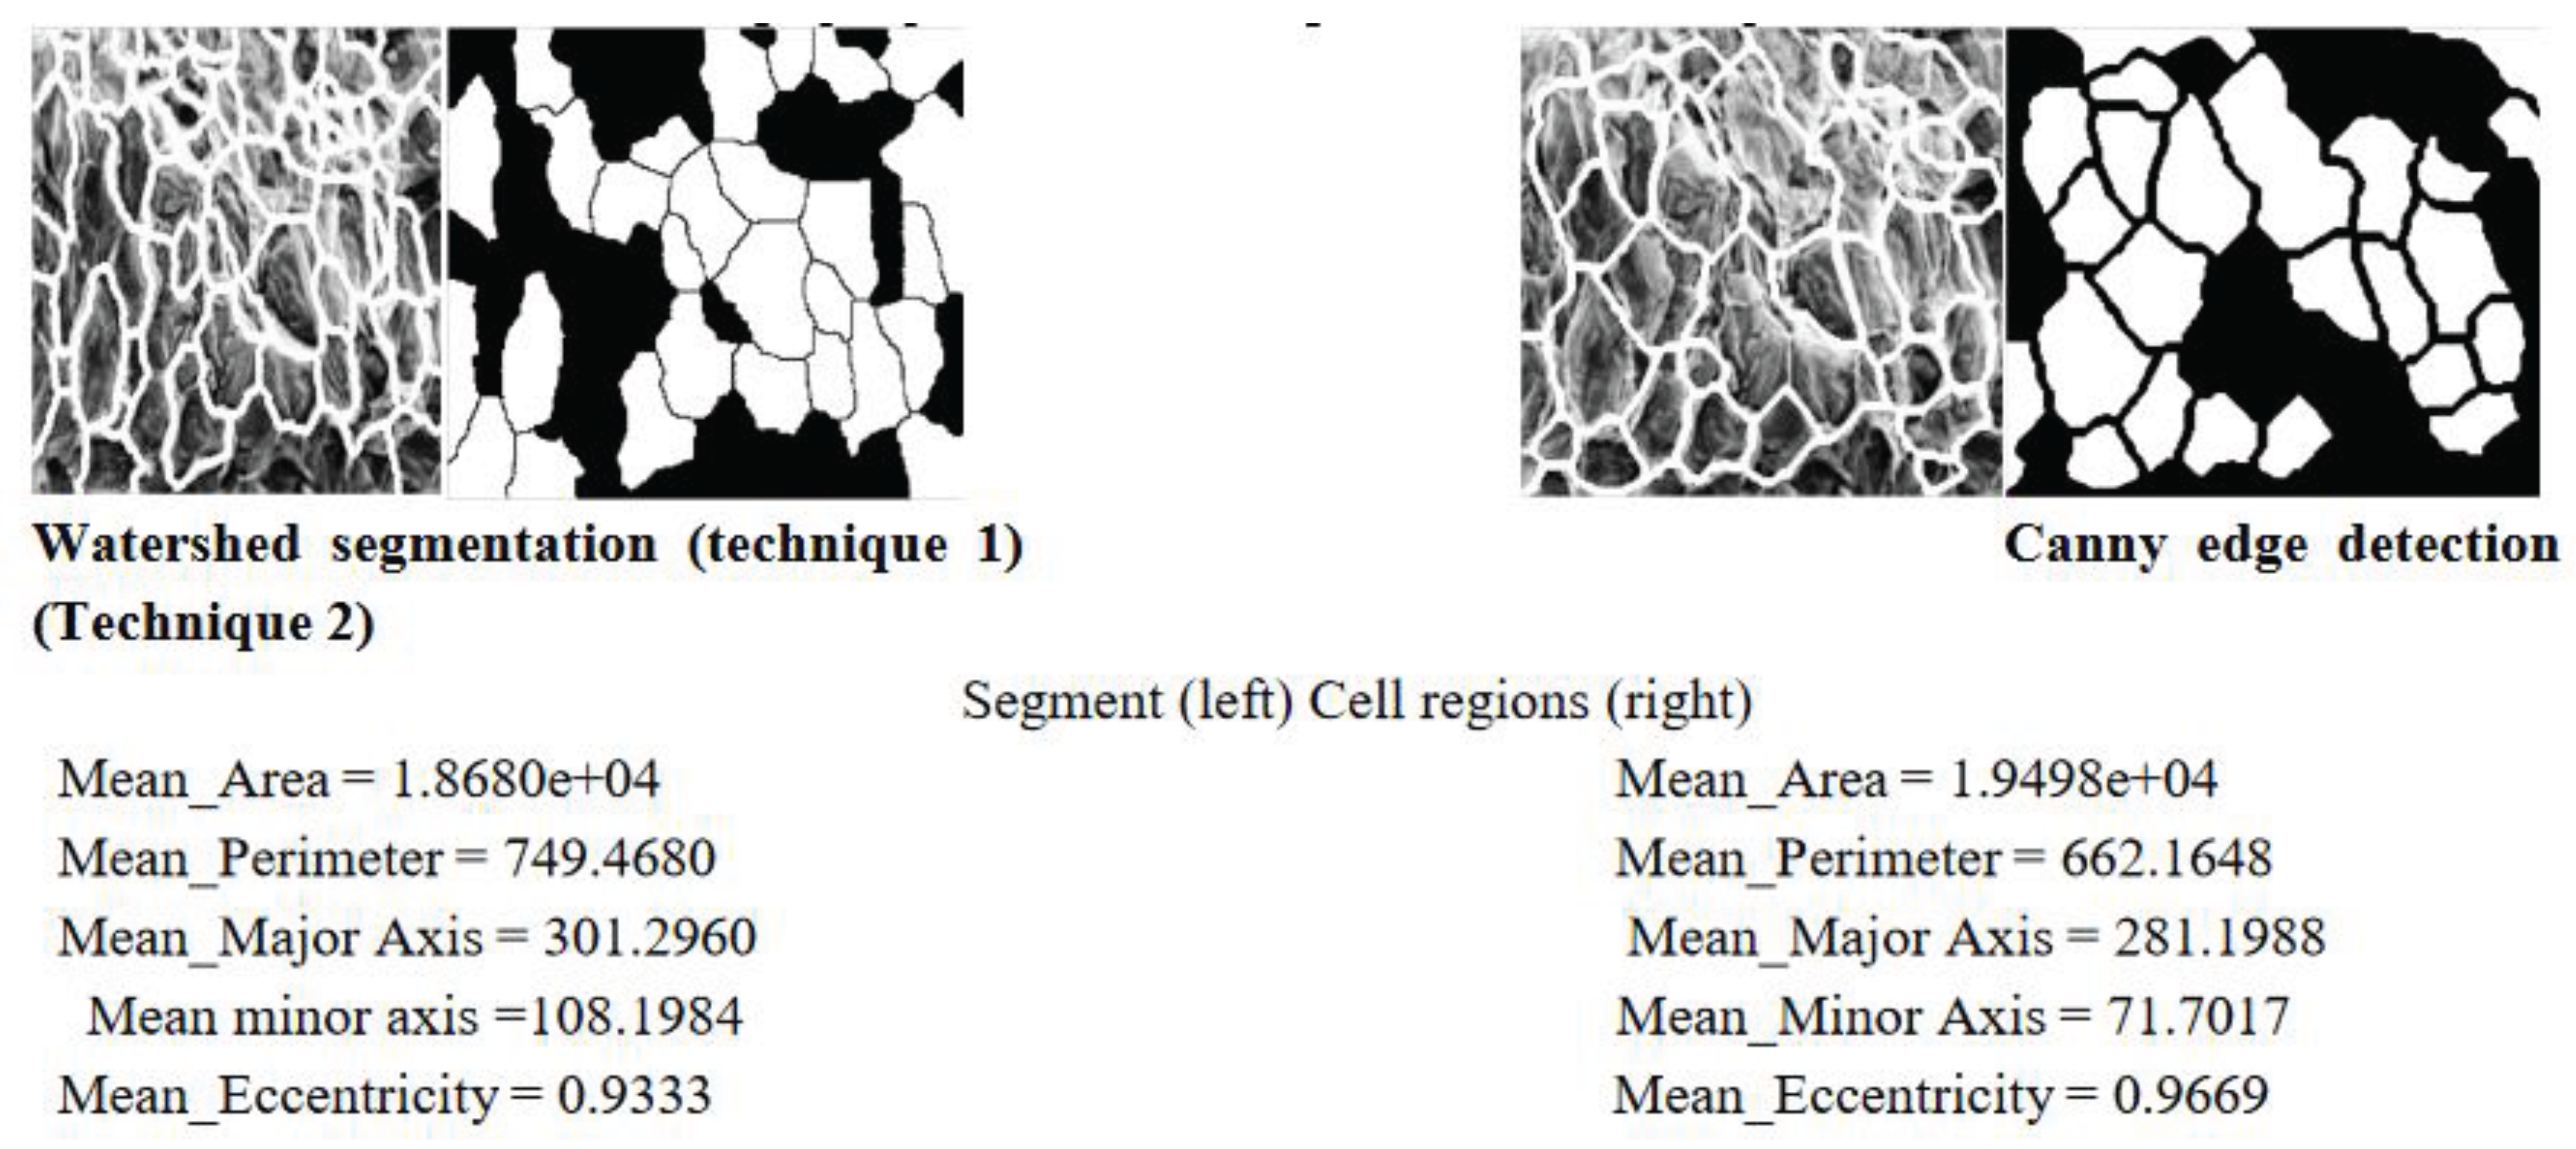
Figure 12.
Superimposed cell boundary outlines.
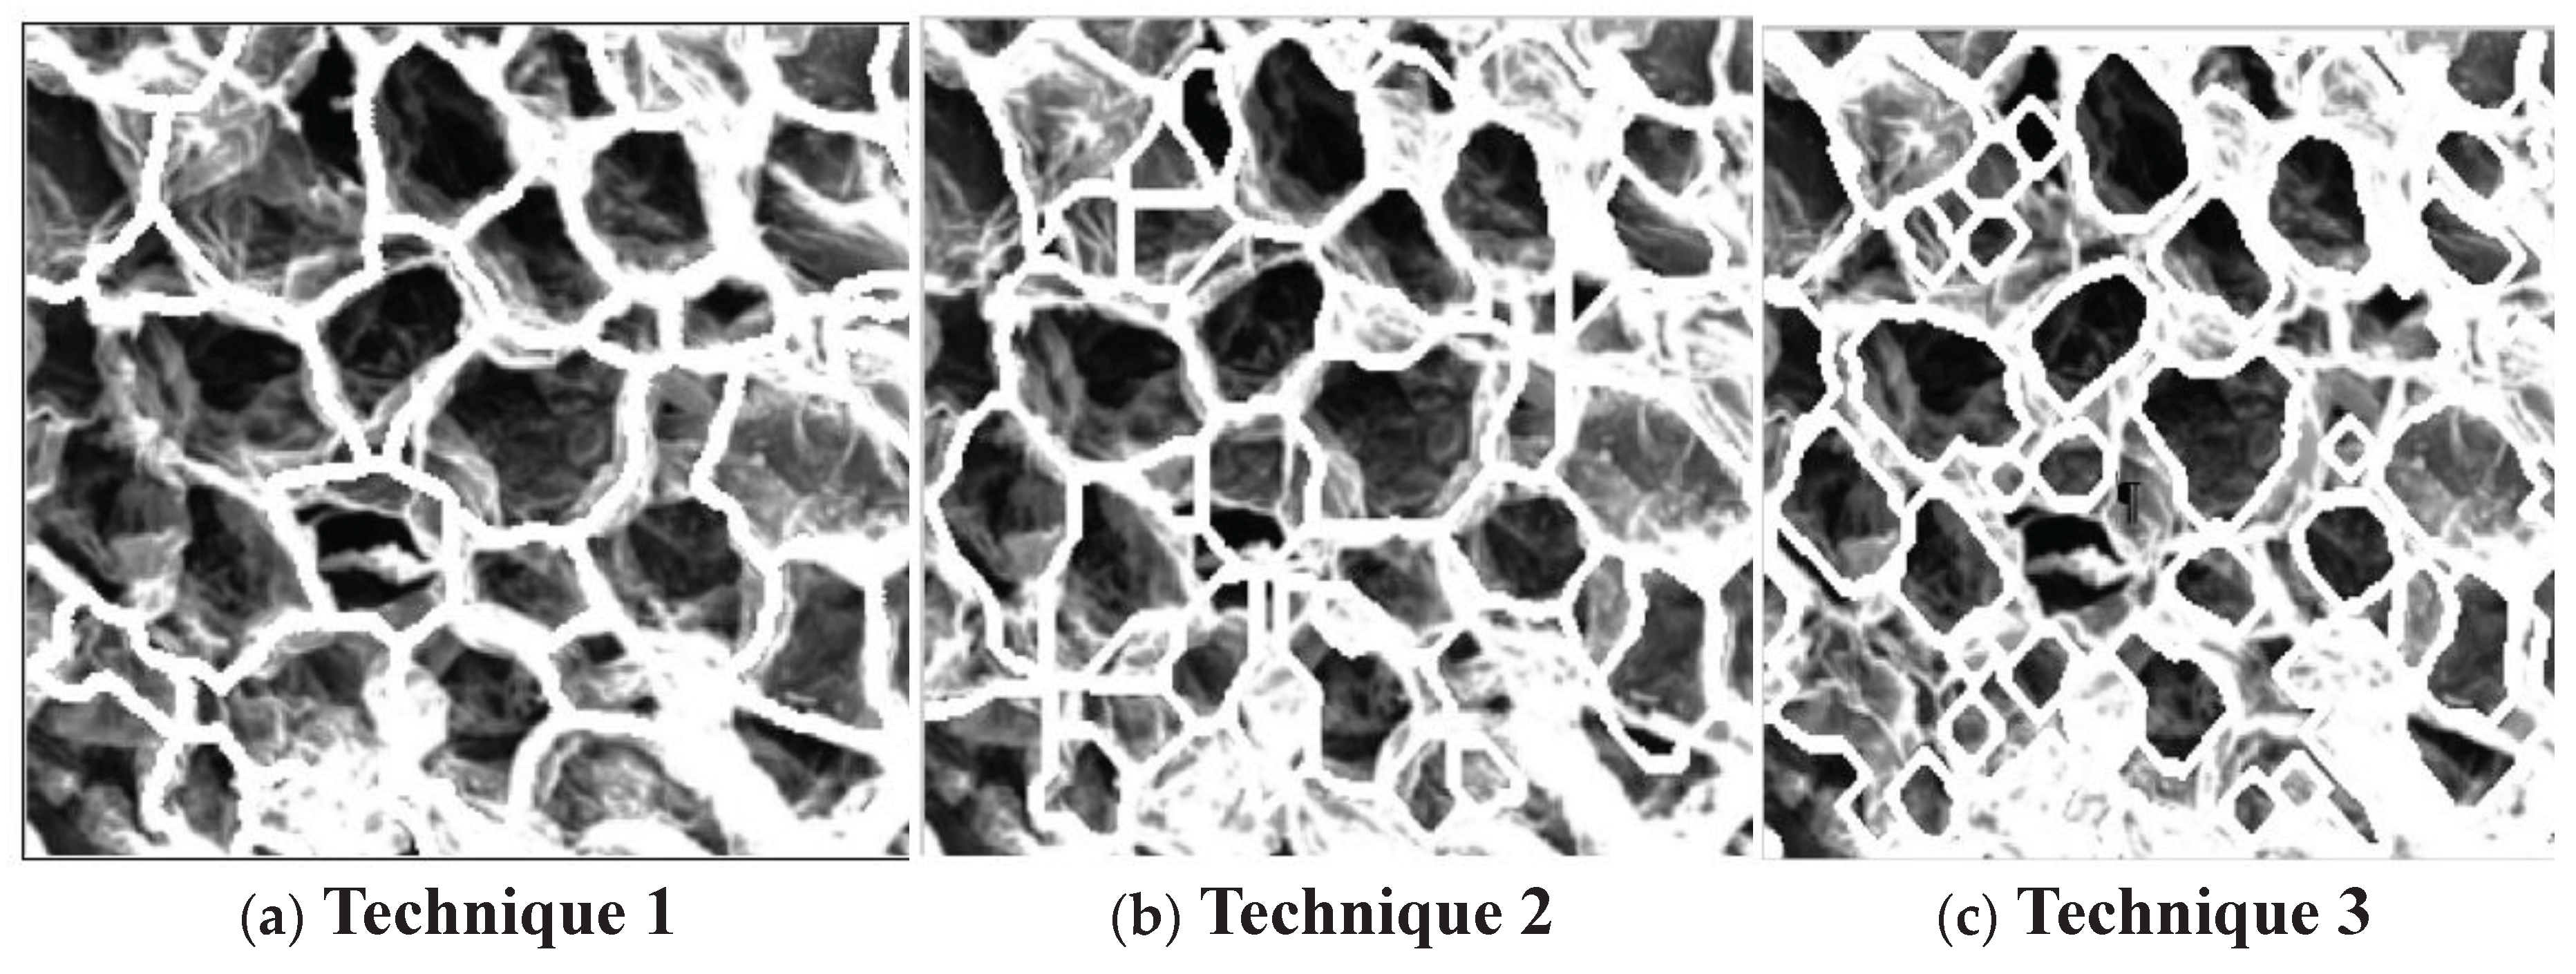
Figure 13.
Cell detection process for microstructural analysis.
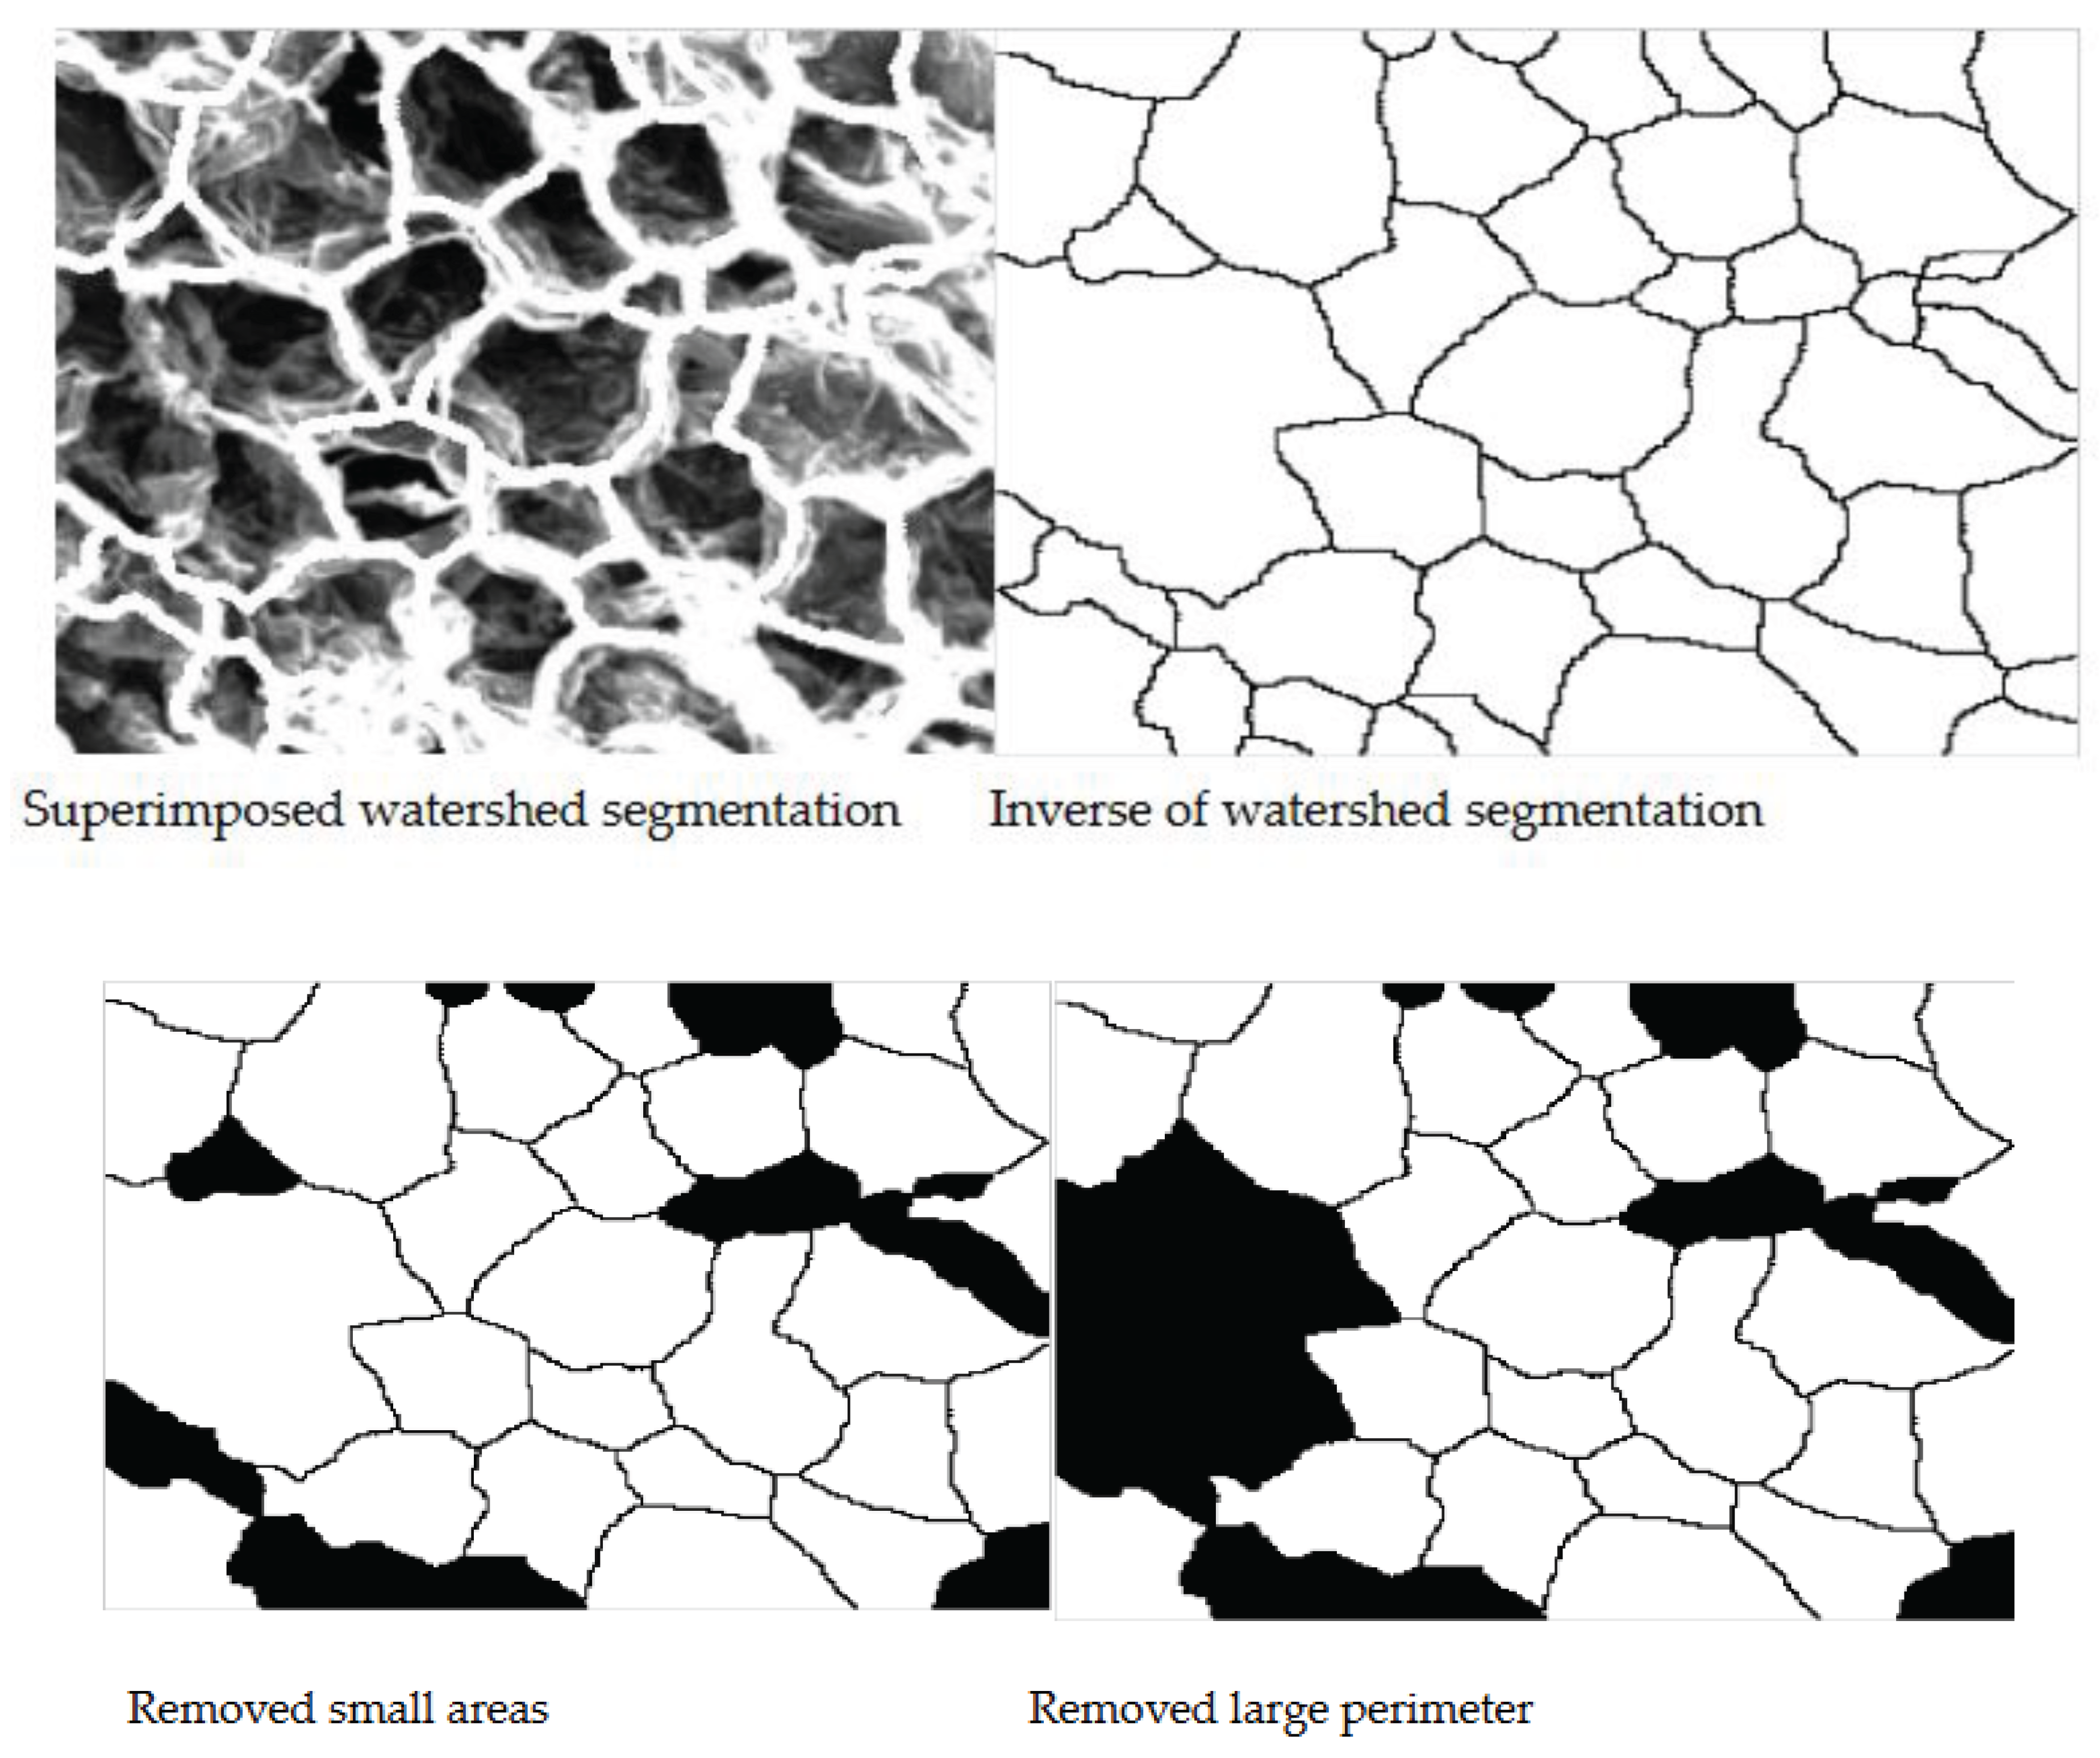
Figure 14.
Mean area versus drying time. Technique 1 (left), Technique 2 (right).
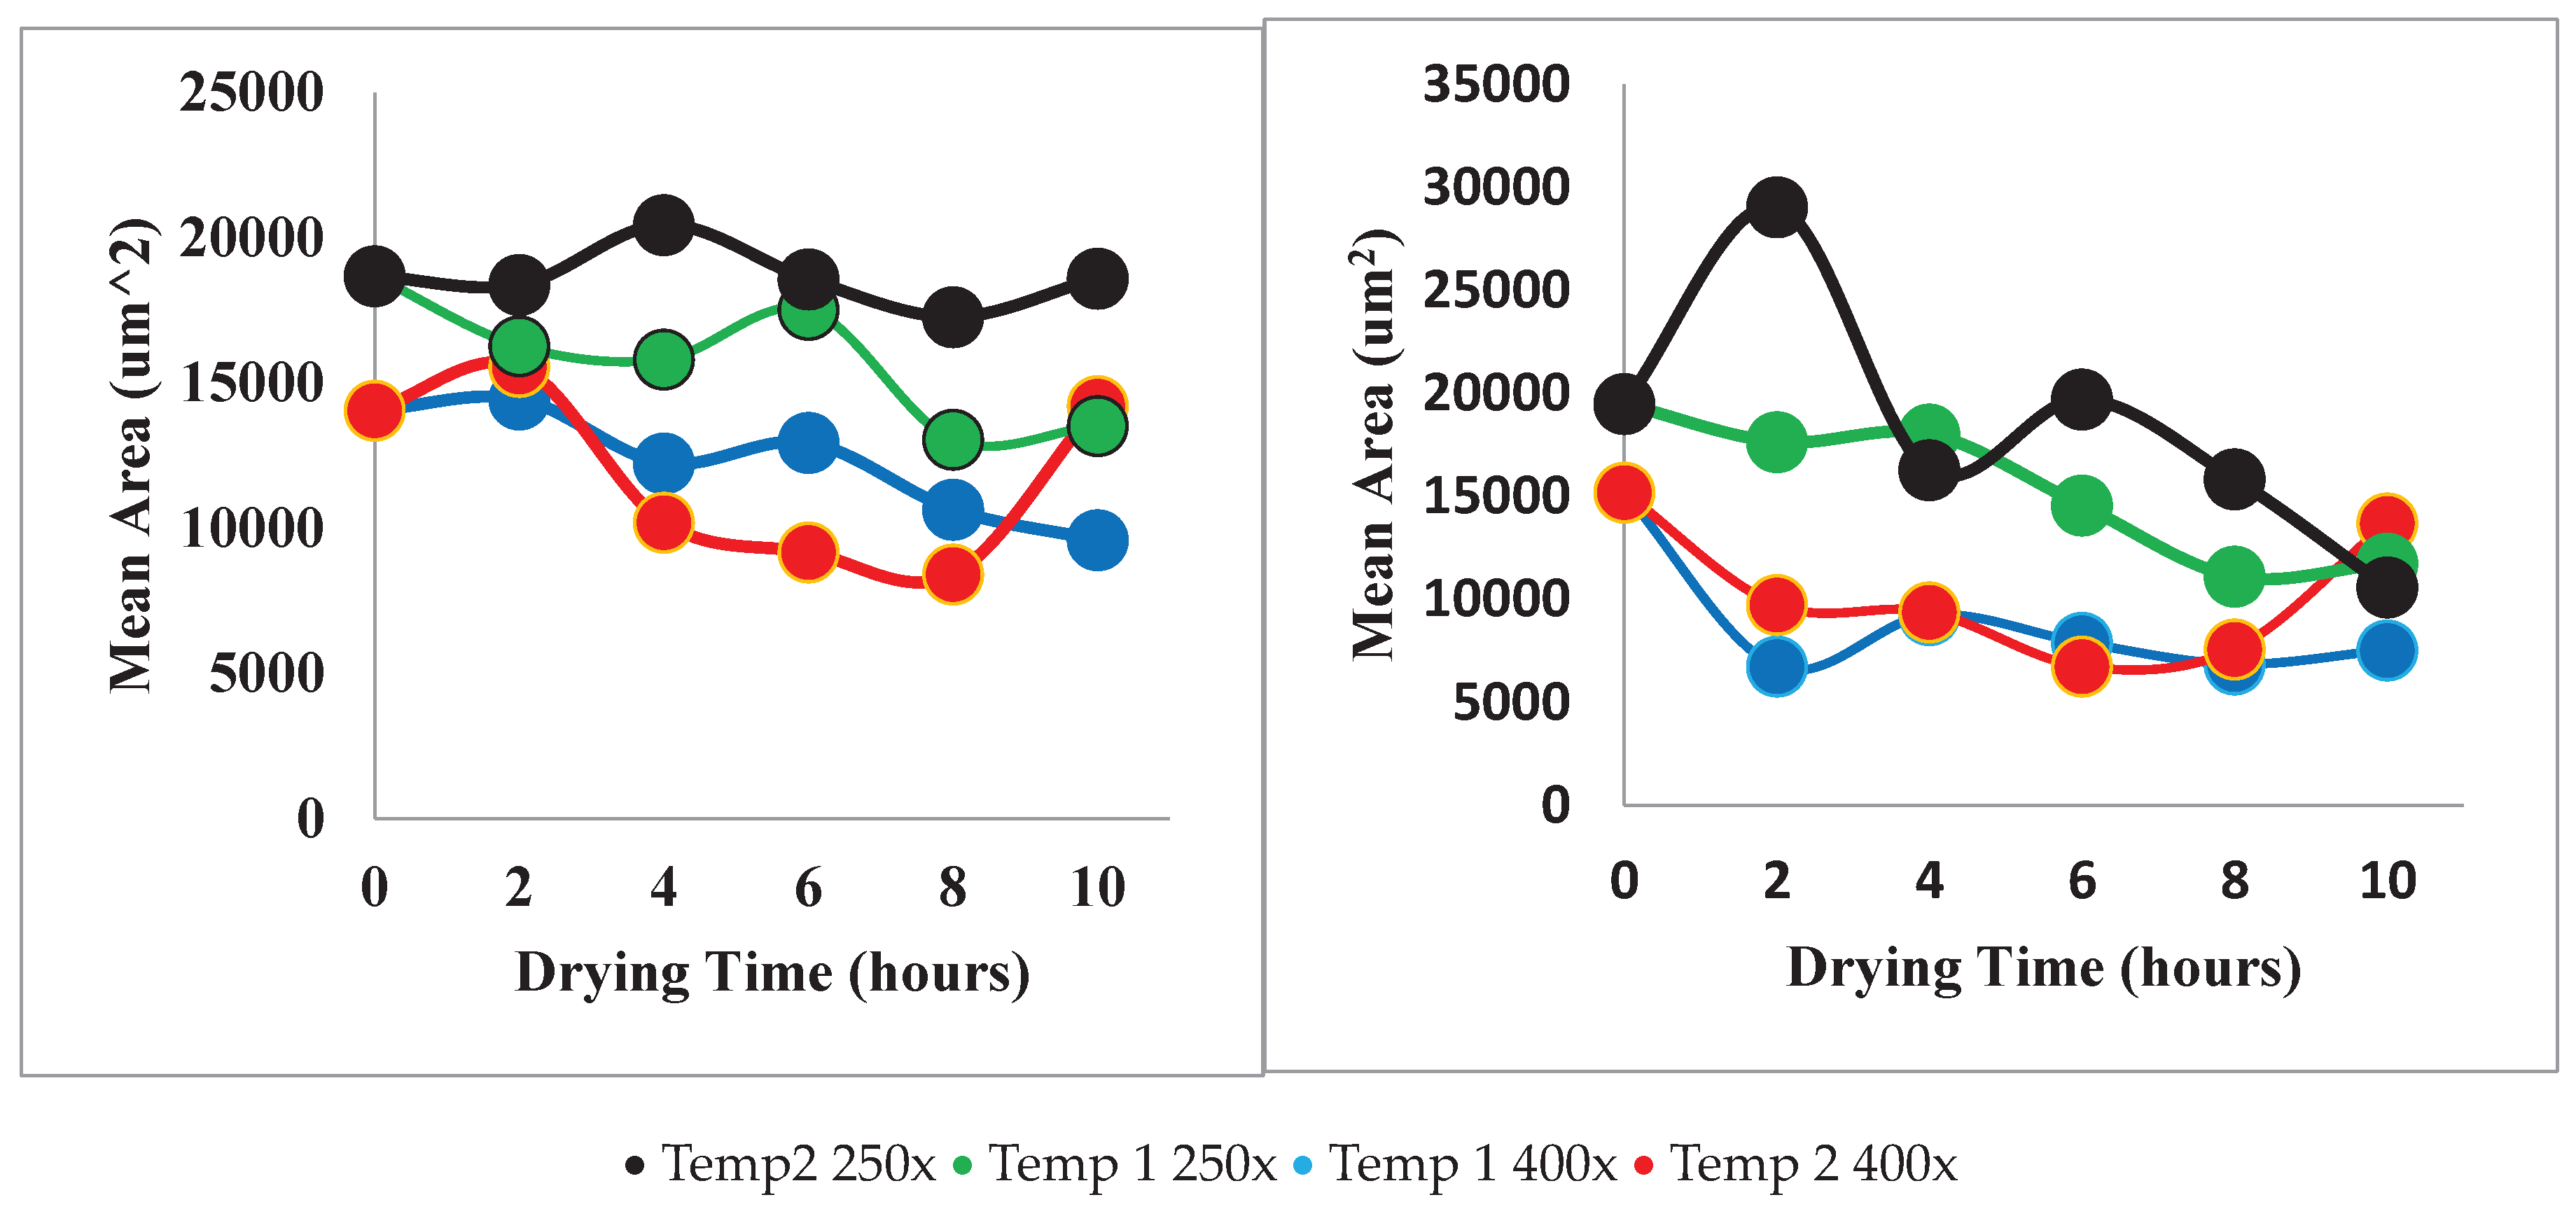
Table 2.
Morphological properties from Canny edge detection technique.
| Sample | Magnification and thresholds | Mean area (μm2) | Mean perimeter (μm) | Mean major axis (μm) | Mean minor axis (μm) | Mean Eccentricity |
|---|---|---|---|---|---|---|
| H0T1 | 250X A>500 P<300 | 1.9498e+04 | 662.1648 | 281.1988 | 71.7017 | 0.9669 |
| H2T1 | 250X A>500 P<240 | 1.7644e+04 | 449.5994 | 146.4707 | 121.9424 | 0.5540 |
| H4T1 | 250X A>500 P<240 | 1.8022e+04 | 477.0161 | 154.2266 | 138.7953 | 0.4360 |
| H6T1 | 250X A>500 P<180 | 1.4570e+04 | 609.2269 | 216.0205 | 111.8562 | 0.8555 |
| H8T1 | 250X A>500 P<180 | 1.1111e+04 | 438.1443 | 158.7734 | 86.7433 | 0.8376 |
| H10T1 | 250X A>500 P<160 | 1.1753e+04 | 580.5193 | 203.7704 | 139.8929 | 0.7271 |
| H2T2 | 250X A>800 P<300 | 2.9047e+04 | 1.1775e+03 | 390.1254 | 190.4161 | 0.8728 |
| H4T2 | 250X A>500 P<240 | 1.6276e+04 | 576.0129 | 185.8455 | 113.3312 | 0.7925 |
| H6T2 | 250X A>500 P<240 | 1.9711e+04 | 361.0750 | 108.5730 | 105.3326 | 0.2425 |
| H8T2 | 250X A>500 P<240 | 1.5844e+04 | 387.1718 | 121.8561 | 101.5215 | 0.5531 |
| H10T2 | 250X A>300 P<200 | 1.0593e+04 | 774.1750 | 275.1776 | 107.5439 | 0.9305 |
| H0T1 | 400X A>1500 P<400 | 1.5197e+04 | 582.8798 | 211.0376 | 108.1086 | 0.8588 |
| H2T1 | 400X A>700 P<300 | 6.7466e+03 | 411.7972 | 167.1921 | 61.9964 | 0.9287 |
| H4T1 | 400X A>800 P<250 | 9.2492e+03 | 461.3646 | 179.7302 | 52.3723 | 0.9566 |
| H6T1 | 400X A>800 P<250 | 7.9043e+3 | 324.9705 | 124.4181 | 62.2680 | 0.8658 |
| H8T1 | 400X A>500 P<250 | 6.8593e+03 | 349.7104 | 105.7494 | 92.9892 | 0.4762 |
| H10T1 | 400X A>500 P<240 | 7.5400e+03 | 346.5231 | 115.4658 | 56.2731 | 0.8732 |
| H2T2 | 400X A>700 P<300 | 9.7355e+03 | 299.6762 | 117.6791 | 57.9392 | 0.8704 |
| H4T2 | 400X A>700 P<300 | 9.3901e+03 | 386.7582 | 114.4119 | 108.7739 | 0.3100 |
| H6T2 | 400X A>700 P<300 | 6.7462e+04 | 427.3982 | 138.5129 | 107.8773 | 0.6272 |
| H8T2 | 400X A>700 P<240 | 7.5915e+03 | 289.4105 | 117.9694 | 52.5847 | 0.8952 |
| H10T2 | 400X A>700 P<240 | 1.3703e+04 | 358.1542 | 119.0250 | 98.8277 | 0.5573 |
Disclaimer/Publisher’s Note: The statements, opinions and data contained in all publications are solely those of the individual author(s) and contributor(s) and not of MDPI and/or the editor(s). MDPI and/or the editor(s) disclaim responsibility for any injury to people or property resulting from any ideas, methods, instructions or products referred to in the content. |
© 2024 by the authors. Licensee MDPI, Basel, Switzerland. This article is an open access article distributed under the terms and conditions of the Creative Commons Attribution (CC BY) license (http://creativecommons.org/licenses/by/4.0/).
Copyright: This open access article is published under a Creative Commons CC BY 4.0 license, which permit the free download, distribution, and reuse, provided that the author and preprint are cited in any reuse.


