Submitted:
08 March 2024
Posted:
11 March 2024
You are already at the latest version
Abstract
The coastal zone of the Valparaíso Region has been historically threatened by its natural and anthropogenic conditions, which demands efficient management for the adaptation and mitigation of the impacts that occur on the coast, especially in the face of the growing effects of climate change. As a contribution to decision makers in the development of strategic actions through adaptation plans, this study presents an approach to coastal vulnerability in the southern part of the region, applying the Coastal Vulnerability Index considering the variables geomorphology, coastal slope, changes in sea level, coastal erosion, tidal range, and wave height. The result illustrates a sectorization of the coast according to the degree of vulnerability, where the sectors formed by fine sandy beaches near river mouths and estuaries present greater risks to climatic events than those rocky stretches with medium-low cliffs.
Keywords:
Valparaíso
; vulnerability
; coastal zone
; climate change
1. Introduction
The coastal or littoral zone is the transition area between the terrestrial and marine environment, is exposed to a series of events that alter its shape. These events are manifested in three situations, where the first one is naturally exposed through coastal dynamics. The second is caused by human factors that modify the coastal landscape through the construction of infrastructure for the development of economic and tourist activities in the area. And the third and no less important, Climate Change, which in recent years has gained considerable relevance, because of the sustained increase in the average sea level, warmer ocean temperatures and extreme storms that are attributed to it as part of this phenomenon [1].
The importance of the study of these events on the Chilean coast lies in the historical relevance of this area as a human settlement and the economic contribution to the country [2], in addition, in recent years there has been an increase in population not only in Chile, but worldwide around coastal areas [3], which implies an exposure of human lives and material goods, so that an integrated management that incorporates risk variables is required to establish the vulnerability of the area [4].
Vulnerability assessment is one of the main tools used and proposed by the first International Panel on Climate Change in 1990 [5], which is related to the degree to which a given coastal area can be affected by a specific event [6]. A semiquantitative estimation [7], expressed in a vulnerability index [8], is used for its evaluation, which incorporates a certain number of variables according to the context and needs of each locality where it is applied [9,10], which allows establishing coastal zones with greater and lesser fragility.
In this context, faced with the important challenge of conserving vital ecosystems for the sustainable development of society, an approach to vulnerability in the southern coastal zone of the Valparaíso Region has been developed, using the main variables established by Vivien Gornitz in her coastal vulnerability studies.
2. Materials and Methods
2.1. Study Area
The Valparaiso Region has approximately 1.8 million inhabitants with a population density of 110.75 inhabitants per square kilometer [11], which are distributed in large urban areas, mainly coastal, which also have a great tourist attraction that leads the region to receive between 100,000 and 200,000 visitors on its beaches during the summer months [12]. This great demand has generated a growth in the territorial infrastructures of its 6 main coastal urban centers, causing an environmental impact with losses in the natural heritage and in the quality of the coastal landscape [13].
The coastal zones of the region are located on the continental margin of South America, where tectonic plate activity and changes in mean sea level have shaped the geomorphological composition of the coast over time [13]. This area of the central coast is characterized by elevated open bays with large cliffs that shelter small confined pocket beaches in the north, dune fields on coastal terraces that are fed by sand from the beaches in the central zone [14] and extensive beaches with gentle slopes and fine sands in the south [15]. The sediments present are formed by granitic complexes of Paleozoic age [16], with sediments based on quartz and feldspar sands [17].
The climate of this area is characterized by a warm temperate type [15], with mixed semi-diurnal tides [18], where the swell is influenced by the South Pacific anticyclone that produces winds in a South-Southwest (S-SW) direction, with the exception of the winter months when the Pacific anticyclone moves northward, which favors low pressure generating winter storms and swells [19].
The study area corresponds to the coastal zone located in the south of the Valparaiso Region, made up of 20 main beach areas, of which the beaches of Quintay, Tunquén, Algarrobo, El Tabo, Cartagena and Santo Domingo stand out (Figure 1). These six beaches in the southern zone are characterized by being straight and pocket-like, with estuaries and creeks flowing into them, surrounded by dunes and mountain ridges that shape the coastal relief, which is deteriorated and vulnerable because of unsustainable urban development and the effects of climate change in the area.
2.2. Methodology
According to the Intergovernmental Panel on Climate Change (IPCC), vulnerability is defined as a predisposition to be negatively affected and comprises concepts that include sensitivity or susceptibility to damage and lack of response and adaptation capacity [20]. In this line, the aim is to determine the degree of vulnerability of the main beaches in the south of the Valparaíso Region, to establish protection and adaptation strategies in accordance with the parameters analyzed.
2.2.1. Coastal Vulnerability Index (CVI)
The Coastal Vulnerability Index (CVI) [8,10,21,22] is one of the most widely used approaches to assess vulnerability on the coast as it is considered a starting point for possible adaptations [23]. The index is based on a quantitative and multi-criteria analysis, reflecting the degree of potential changes or resilience of different coastal stretches because of the analysis of different parameters.
The mathematical calculation of the CVI is generated by combining a defined number of variables or parameters by means of an equation (Equation (1)), which combines the relative risk variables to create a single indicator. The first step involves creating a database with the variables to be considered, where the literature review shows that the number of variables can range from five to ten [24], but what is essential in the analysis of variables is that they are able to describe the coastal evolution from the geological and hydrodynamic point of view [21]. In this case study, six variables were considered, weighting geomorphology, coastal slope, mean sea level, shoreline displacement or coastal erosion, tidal range, and wave height. Subsequently, these parameters are assigned weights from 1 (very low vulnerability) to 5 (very high vulnerability) [22] (Table 1), taking care to assign balanced ratings to obtain an adequate balance of the variables involved [25].
These weights are integrated by means of the mathematical equation that provides the value of the index, which is presented below:
Where a represents geomorphological, b slope, c sea level change, d coastal erosion or shoreline displacement, e tidal range and f wave height. The ranking with the weighting of each of the parameters used is presented in Table 1.
Finally, the CVI value calculated for each sector studied is divided into 4 classes (low, moderate, high, and very high) using as limits the 25%, 50% and 75% percentiles with the objective of classifying the values obtained in an orderly manner with sections from greater to lesser vulnerability and thus facilitating their interpretation [26], represented by colors of the sections according to the relative vulnerability obtained.
The choice of this index for the analysis was justified by the fact that it is an integrating index, of a semi-quantitative nature [7], with an easy application based on existing data on the southern coast of the Valparaíso Region, and widely accepted worldwide, proposed for its application by the first International Panel on Climate Change in 1990.
2.2.2. Variables Used in the Calculation of the CVI
The information obtained has been digitized using the free and open-source software Geographic Information System QGIS, where the variables considered for the calculation of the CVI along the coast have been integrated, in a total subdivision of 48 stretches of beaches located from Laguna Verde to Santo Domingo in the southern coastal zone of the Valparaiso Region.
Geomorphology (a): describes the relative erosionability of different coastal formations, where an evident degree of erosionability conditions the vulnerability of the beach to a rise in mean sea level, so that when this variable is higher, it is understood that there is a higher degree of vulnerability with a quantitative assignment of 1 to 5. To approach a realistic description of the geomorphological conditions, cartographic information contained in geological maps was used, together with cartography obtained from satellite images and aerial photographs, as well as documentary information found in the literature together with field photographs and documentary videos of the area, establishing the assignment criteria as follows [8]:
- High cliffs on coherent rocks
- Medium cliffs on rocks of medium resistance
- Low cliffs on sedimentary formations and marine terraces.
- Extensive low elevation beaches with unconsolidated sediments and estuaries.
- Sandy beaches with dune fields, beaches attached to barrier island formations, tombolos, coastal arrows, deltas, coral reefs, mangroves, etc.
Coastal slope (b): allows the evaluation of the relative risk of flooding as well as the speed of coastal retreat and the extent of potential sea level rise [27]. The calculation was based on topographic elevations, using a digital elevation and bathymetric model, where the steeper the slope, the lower the degree of vulnerability.
Changes in sea level (c): this is a relative value obtained from tide gauges in mm/year, where it is possible to measure the potential impact of a rise in sea level, since it is estimated that each millimeter that the sea level rises means a loss of 10 centimeters of coastline [28], highlighting that those beaches with a greater slope will have less erosion. This variable has the limitation that the rate of sea level change measured in tide gauges is associated with the point location of this and requires using a spatial interpolation criterion for each coastal stretch, however, as an approximation, local data obtained from the Valparaiso tide gauge were used using the RCP8.5 scenario [29], where higher relative rates imply a higher degree of vulnerability.
Shoreline displacement (coastal erosion) (d): this is defined as the modification or retreat of the pre-existing shoreline [30] that results in a loss of sediment [31]. This is a rate that measures the evolution of the coastline over the years, recording its modification from aerial or satellite images, where it is interpreted that the higher the negative erosion rates, the more vulnerable the beach is. For the analysis of this point, the coastal erosion values have been obtained from the report Determinación del riesgo de los impactos del cambio climático en las costas de Chile, Volume 4: Vulnerabilidad y riesgos en playas [32], prepared by the Chilean Ministry of the Environment, where a thorough study is made of the evolution over time of its coastline.
Tidal range (e): this parameter measures the vertical difference between high tide and low tide and is related to the risks of permanent or temporary flooding in the coastal zone, where an assessment of the tidal range would allow estimating vulnerability, considering that a greater tidal range produces greater vulnerability. The beaches in the south of the Valparaíso Region are of the meso-tidal type [33], with mixed behavior [34], i.e. there are two high tides and two low tides with differences between the heights reached by the water in both cases (Figure 2). To quantify the tidal range, the values recorded by the existing tide gauges in the area have been used, in addition to the information provided by the Hydrographic and Oceanographic Service of the Chilean Navy (SHOA).
Wave height (f): waves are the main phenomenon that describes the coastal zone, since significant average wave heights along the coast allow estimation of relative vulnerability, which is considered higher with greater wave heights [26]. For its calculation, an analysis was made of the information available in the literature and in state agencies such as the SHOA, which has detailed information from its wave buoys along the coast of the region. This process allowed assigning an average value for each classified section with ratings from 1 to 5.
3. Results
3.1. Results of Variables Used
Geomorphology (a): Most of the southern coastal zone in the Valparaíso Region (81%) is made up of medium or low cliffs that range from 30 to 10 meters high, with coasts or beaches made up of sedimentary formations [34]. The only exception is found in Santo Domingo beach (Figure 3, red zone), where there is an extensive 20 km long beach composed of fine sands with dune formations as a result of the winds that occur in the sector [32]. The valuations made for the geomorphology of each zone analyzed are detailed in Figure 3.
Coastal slope (b): due to the geomorphological formation itself, with a predominance of cliffs, 79% of the areas analyzed have steep slopes greater than 1% (Figure 4), which is why the degree of vulnerability is low (green zone) or very low (blue zone).
Changes in sea level (c): the results of the models of variations in sea level due to Climate Change [32], show a rise for the analyzed area of 1.0 m for the period 2026-2045 in the RCP8.5 scenario, suggesting a moderate vulnerability (Figure 5).
Displacement of the coastline (coastal erosion) (d): most of the beaches analyzed present the category of moderate erosion according to the established ranges [8], however, according to the report Determination of the Risk of Climate Change Impacts on the coasts of Chile prepared by the Ministry of the Environment, the highest erosion rates are recorded in Algarrobo beach with -2.54 meters/year between 1980 and 2017, and in Santo Domingo beach with -1.73 meters/year between 1992 and 2018, these two areas being listed in the high and very high vulnerability category, respectively (Figure 6).
Tidal range (e): The zone presents a tidal range of mesotidal character, with mean ranges varying between 1.0 and 1.9 meters, which classifies the zone as having a low level of tidal vulnerability (Figure 7).
Wave Height (f): Data obtained from Coastal Modeling Systems of the Chilean Wave Atlas [19], in conjunction with the Climate Change Impact in Chile study [32], indicate that there is a maximum wave height between 3.0 and 4.9 meters in height, thus falling into the low coastal vulnerability category (Figure 8).
3.2. Result Coastal Vulnerability Index
With the results obtained for each of the six variables previously studied and integrated through the application of the formula of Gornitz et al. 1991 (Equation (1), it is observed that the Coastal Vulnerability Index (CVI) for each zone analyzed presents greater vulnerability in those zones with dune formations, and those located at river mouths and estuaries. On the other hand, those with the lowest vulnerability are in port areas and where there are medium-low cliffs.
The numerical data of the Coastal Vulnerability Index are represented in Table 2, which are dimensionless, with values between 2.45 and 10.95. The mean value is 5.27, the median is 4.24 and the standard deviation is 2.12. The 25th, 50th and 75th percentiles are 3.46, 4.24 and 6.00, respectively.
The numerical results were divided into low, moderate, high, and very high vulnerability categories, where values below 3.46 are assigned to a low vulnerability category. Between 3.46 and 4.24 are considered moderate vulnerability. Between 4.24 and 6.00 is high vulnerability and values greater than 6.00 are classified as very high vulnerability areas.
The cartography shows the zoning according to the resulting CVI (Figure 9), assigning each of the zones a color depending on the degree of vulnerability.
4. Discussion
The Coastal Vulnerability Index (CVI) makes it possible to zone the coast according to the degree of vulnerability to certain events [6]. The quantification of this index shows a special sensitivity to the scale considered in each of the parameters integrated for its confection [36], since according to authors, it is possible to appreciate relevant differences mainly in the analysis of sea level and tidal range with spatial scales of 100 km, in addition to the coastal topography with values recorded at spatial scales of approximately 10 km [37]. Of all these variables, geomorphology is as the least vulnerable to scale considerations, since it is evaluated in qualitative terms, i.e., according to the type of coast, so that the classification zones remain invariable regardless of the scale used.
Therefore, the analysis of each of the variables requires a study on a regional scale, as this reflects the most realistic option by simplifying the modeling of parameters adapted to local conditions, allowing the establishment of strategic plans for adaptation and protection on the coast.
Another relevant consideration is the numerical quantification made by the CVI assigning the same degree of impact to each of its variables, however, there are some of these that generate a greater contribution to vulnerability in the impacted areas [38], which is possible to correct by means of weightings applicable to the parameters considered in the study by capturing the relevance of each one of them [39,40]. An example of this is the coastal erosion variable, which represents a crucial condition for considering a vulnerable area since, if an important part of the area is eroded, it is necessary to reflect this in the numerical quantification to identify the area as vulnerable.
Once each of the parameters under study has been analyzed and scored, for the conversion of the general scores of the index obtained by means of the Gornitz equation, the calculation of percentiles is required for their corresponding classification by categories, which are subjective in nature as they are subject to the opinion of experts, which is not free of possible biases in their interpretation [41].
Finally, despite the possible limitations observed in this discussion, the CVI represents a useful tool to obtain an overview of vulnerable coastal areas in the face of physical and geological factors, which constitutes it as a first approximation to understand and study strategies appropriate to local coastal conditions.
5. Conclusions
The southern coastal zone of the Valparaíso Region presents disparate situations in terms of vulnerability, where the lack of accurate analysis has led to the implementation of temporary solutions that are not effective measures to address the problem. Therefore, in order to contribute to the identification of vulnerable areas by considering the Coastal Vulnerability Index, together with its graphic representation for each of the zones analyzed, it is possible to establish the following categorization:
Forty percent of the coastal zones present high or very high vulnerability, in which there are extensive rectilinear beaches with dune formations and fine sediments close to river mouths and estuaries with considerable environmental value. There are a total of twelve beaches in this vulnerable category in the area analyzed, distributed in the towns of Laguna Verde, Quintay, Tunquen, Algarrobo, El Quisco, Punta de Tralca, Isla Negra, El Tabo, La Chépica, Las Cruces, Cartagena, and Santo Domingo (Figure 9).
On the other hand, areas with moderate or very low vulnerability account for sixty percent of the territory analyzed, characterized by rocky sediment beaches, with medium-low cliff formations and areas close to the port of San Antonio.
Undoubtedly, the coastal vulnerability assessment is an initial approximation to the existing reality of the coast that is essential for the management of coastal areas, since, through the preliminary identification of vulnerable areas, it is possible to develop effective adaptation and mitigation strategies to address the vulnerability present in the area. However, in order to guarantee the success of its application, it is necessary to carry out detailed and specific studies for each region or specific zone, in order to establish comparisons between the different existing methodologies for its analysis, which will make it possible to obtain effective information for decision-making and management of coastal zones that accurately reflects the different categories of vulnerability.
References
- IPCC. Climate change: impacts, adaptation and vulnerability. International Journal of Climatology 2001, 22, 878. [CrossRef]
- Martinez, C.; Arenas, F.; Bergamini, K.; Urrea, J. Hacia una ley de costas en Chile: criterios y desafíos en un contexto de cambio climático. 2019.
- Woodroffe, C. Coasts: Form, Process and Evolution. 2002.
- Martinez, C.; Tamburini, L.; Moris, R. Gestión Del Riesgo, Descentralización Y Políticas Públicas: ¿Se Reduce El Riesgo De Desastres En Chile? In ¿Para que descentralizar? Centralismo y Políticas Publicas en Chile: Análisis y Evaluación por Sectores, Chile, U.A.d., Ed.; 2017; pp. 153-179.
- Houghton, J.; Jenkins, G.; Ephraums, J. Climate change: the IPCC scientific assessment. American Scientist;(United States) 1990, 80.
- Adger, W.N. Vulnerability. Global Environmental Change 2006, 16, 268-281. [CrossRef]
- Rangel-Buitrago, N.; Posada-Posada, B. Determinación de la vulnerabilidad y el riesgo costero mediante la aplicación de herramientas SIG y métodos multicriterio en la línea de costa. Intropica 2013, 8, 29 - 42.
- Gornitz, V. Global coastal hazards from future sea level rise. Palaeogeography, Palaeoclimatology, Palaeoecology 1991, 89, 379-398. [CrossRef]
- Zanetti, V.; De Sousa Junior, W.; De Freitas, D. A Climate Change Vulnerability Index and Case Study in a Brazilian Coastal City. Sustainability 2016, 8, 811. [CrossRef]
- Gornitz, V.; Daniels, R.; White, T.; Birdwell, K. The development of a coastal risk assessment database: vulnerability to sea-level rise in the US Southeast. Journal of coastal research 1994, 327-338.
- INE. Censo de Población y Vivienda; Instituto Nacional de Estadistica Chile: 2017.
- INE. Series Mensuales De Turismo; Instituto Nacional de Estadística Chile: 2017.
- Martinez, C.; Contreras, M.; Winckler, P.; Godoy, E.; Agredano, R. Coastal erosion in central Chile: A new hazard? Ocean & Coastal Management 2018, 141-155. [CrossRef]
- Manriquez, H. Geomorfología del campo de dunas de Concón. Ciencia para la ciudad 2020, 2023.
- Castro, C.; Alvarado, C. La gestión del litoral chileno: un diagnóstico. Manejo Costero Integrado y Política Pública en Iberoamérica: Un Diagnóstico. Necesidad de Cambio 2011, 213-234.
- Muñoz-Cristi, J. Estudios petrográficos y petrológicos sobre el batolito de la costa de las provincias de Santiago y Valparaíso. In Proceedings of the Anales de la Facultad de Ciencias Físicas y Matemáticas, 1963; pp. ág. 5-mapa.
- Vergara, H.; Hickmann, V. Fluctuación anual de la morfología y granulometría de Playa las Salinas, V Región. In Proceedings of the III Congreso Geológico Chileno, Concepción e Chile, 1982.
- SHOA. Anuario Hidrográfico de la Marina de Chile: Tomo 46, 1994; Servicio Hidrográfico y Oceanográfico de la Armada de Chile: 1994.
- Beyá, J.; Álvarez, M.; Gallardo, A.; Hidalgo, H.; Aguirre, C.; Valdivia, J.; Parra, C.; Méndez, L.; Contreras, F.; Winckler, P.; et al. Atlas de Oleaje de Chile. Atlas De Oleaje De Chile 2016.
- IPCC. Meeting report of the intergovernmental panel on climate change expert meeting on geoengineering. In Proceedings of the IPCC Working Group III Technical Support Unit, Postdam Institute for Climate Impact Research, 2012.
- Gornitz, V.; White, T. A coastal hazards data base for the US East Coast. 1992. [CrossRef]
- Pendleton, E.; Thieler, E.; Williams, S.; Beavers, R. Coastal vulnerability assessment of Cumberland Island National Seashore (CUIS) to sea-level rise. US Geological Survey Open-File Report 2004, 1196, 1-23. [CrossRef]
- Mujabar, P.S.; Chandrasekar, N. Shoreline change analysis along the coast between Kanyakumari and Tuticorin of India using remote sensing and GIS. Arabian Journal of Geosciences 2013, 6, 647-664. [CrossRef]
- Kovaleva, O.; Sergeev, A.; Ryabchuk, D. Coastal vulnerability index as a tool for current state assessment and anthropogenic activity planning for the Eastern Gulf of Finland coastal zone (the Baltic Sea). Applied Geography 2022, 143, 102710. [CrossRef]
- Kokot, R.; J., C.; Elissondo, M. Vulnerabilidad al ascenso del nivel del mar en la costa de la provincia de Río Negro. Revista de la Asociación Geológica Argentina 2004, 59.
- Jiménez, M.; Ceacero, C.; Ordoñez, P.; Álvarez, J.; Peláez, S.; Robles, A.; Ojeda, J.; Francoso, J.; Cajaraville, D.; Fraile-Jurado, P.; et al. Análisis preliminar de la vulnerabilidad de la costa de Andalucía a la potencial subida del nivel del mar asociada al cambio climático; 2011.
- Pilkey, O.; Davis, T.; Nummedal, D.; Howard, J. An Analysis of Coastal Recession Models: North Carolina Coast. In Sea-Level Fluctuation and Coastal Evolution; SEPM Society for Sedimentary Geology: 1987; Volume 41, p. 0.
- Simeoni, U.; Corbau, C. Coastal vulnerability related to sea-level rise. Geomorphology 2009, 107, 1-2. [CrossRef]
- IPCC. AR5 Climate Change 2014. Contribution of working group I to the fifth assessment report of the intergovernmental panel on climate change 2014, 1535, 2014.
- Boak, E.; Turner, I. Shoreline Definition and Detection: A Review. Journal of Coastal Research Journal of Coastal Research 2005, 21, 688-703. [CrossRef]
- Ojeda, J. Métodos para el cálculo de la erosión costera. Revisión, tendencias y propuesta. Boletín de la Asociación de Geógrafos Españoles, 30, 103-118. 2000.
- Winckler, P.; Contreras-Lopez, M.; Larraguibel, C.; Vicuña, S.; Mora, J.; Esparza, C.; Salcedo, J.; Gelcich, S.; Fariña, J.; Martinez, C.; et al. Determinación del riesgo de los impactos del Cambio Climático en las costas de Chile. 2019. [CrossRef]
- Vidal, C.; Losada, M.; Medina, R.; Losada, I. Modelos de morfodinámica de playas. Ingeniería del agua 1995, 2. [CrossRef]
- Morales, E.; Winckler, P.; Herrera, M. Costas de Chile. Medio Natural, Cambio Climático, Ingeniería Oceánica y Gestión Costera; Servicio Hidrográfico y Oceanográfico de la Armada de Chile: 2020.
- SHOA. Pub. 3009 Tablas de Marea de la Costa de Chile; Servicio Hidrográfico y Oceanográfico de la Armada de Chile: 2002.
- Koroglu, A.; Ranasinghe, R.; Jiménez, J.; Dastgheib, A. Comparison of Coastal Vulnerability Index applications for Barcelona Province. Ocean & Coastal Management 2019, 178, 104799. [CrossRef]
- Ibarra, D.; Ballesteros, G.; Sánchez, J.; García, P.; Belmonte, F. Evaluación del índice de vulnerabilidad costera en la Manga del Mar Menor (Murcia, España). Anales de Geografía de la Universidad Complutense 2020, 40, 373-392. [CrossRef]
- Pendleton, E.; Thieler, E.; Williams, S. Importance of Coastal Change Variables in Determining Vulnerability to Sea- and Lake-Level Change. Journal of Coastal Research 2010, 261. [CrossRef]
- Del Rio, L.; Gracia, F.J. Erosion risk assessment of active coastal cliffs in temperate environments. Geomorphology 2009, 112, 82-95. [CrossRef]
- Gómez-Pazo, A.; Pérez-Alberti, A. Vulnerabilidad de las costas de Galicia a los temporales marinos en el contexto del cambio global. Sémata: Ciencias Sociais e Humanidades 2017, 29. [CrossRef]
- Füssel, H.M.; Klein, R.J.T. Climate change vulnerability assessments: An evolution of conceptual thinking. Climatic Change 2006, 75, 301-329. [CrossRef]
Figure 1.
Map of the study area located on the southern coast of the Valparaíso Region, Chile.
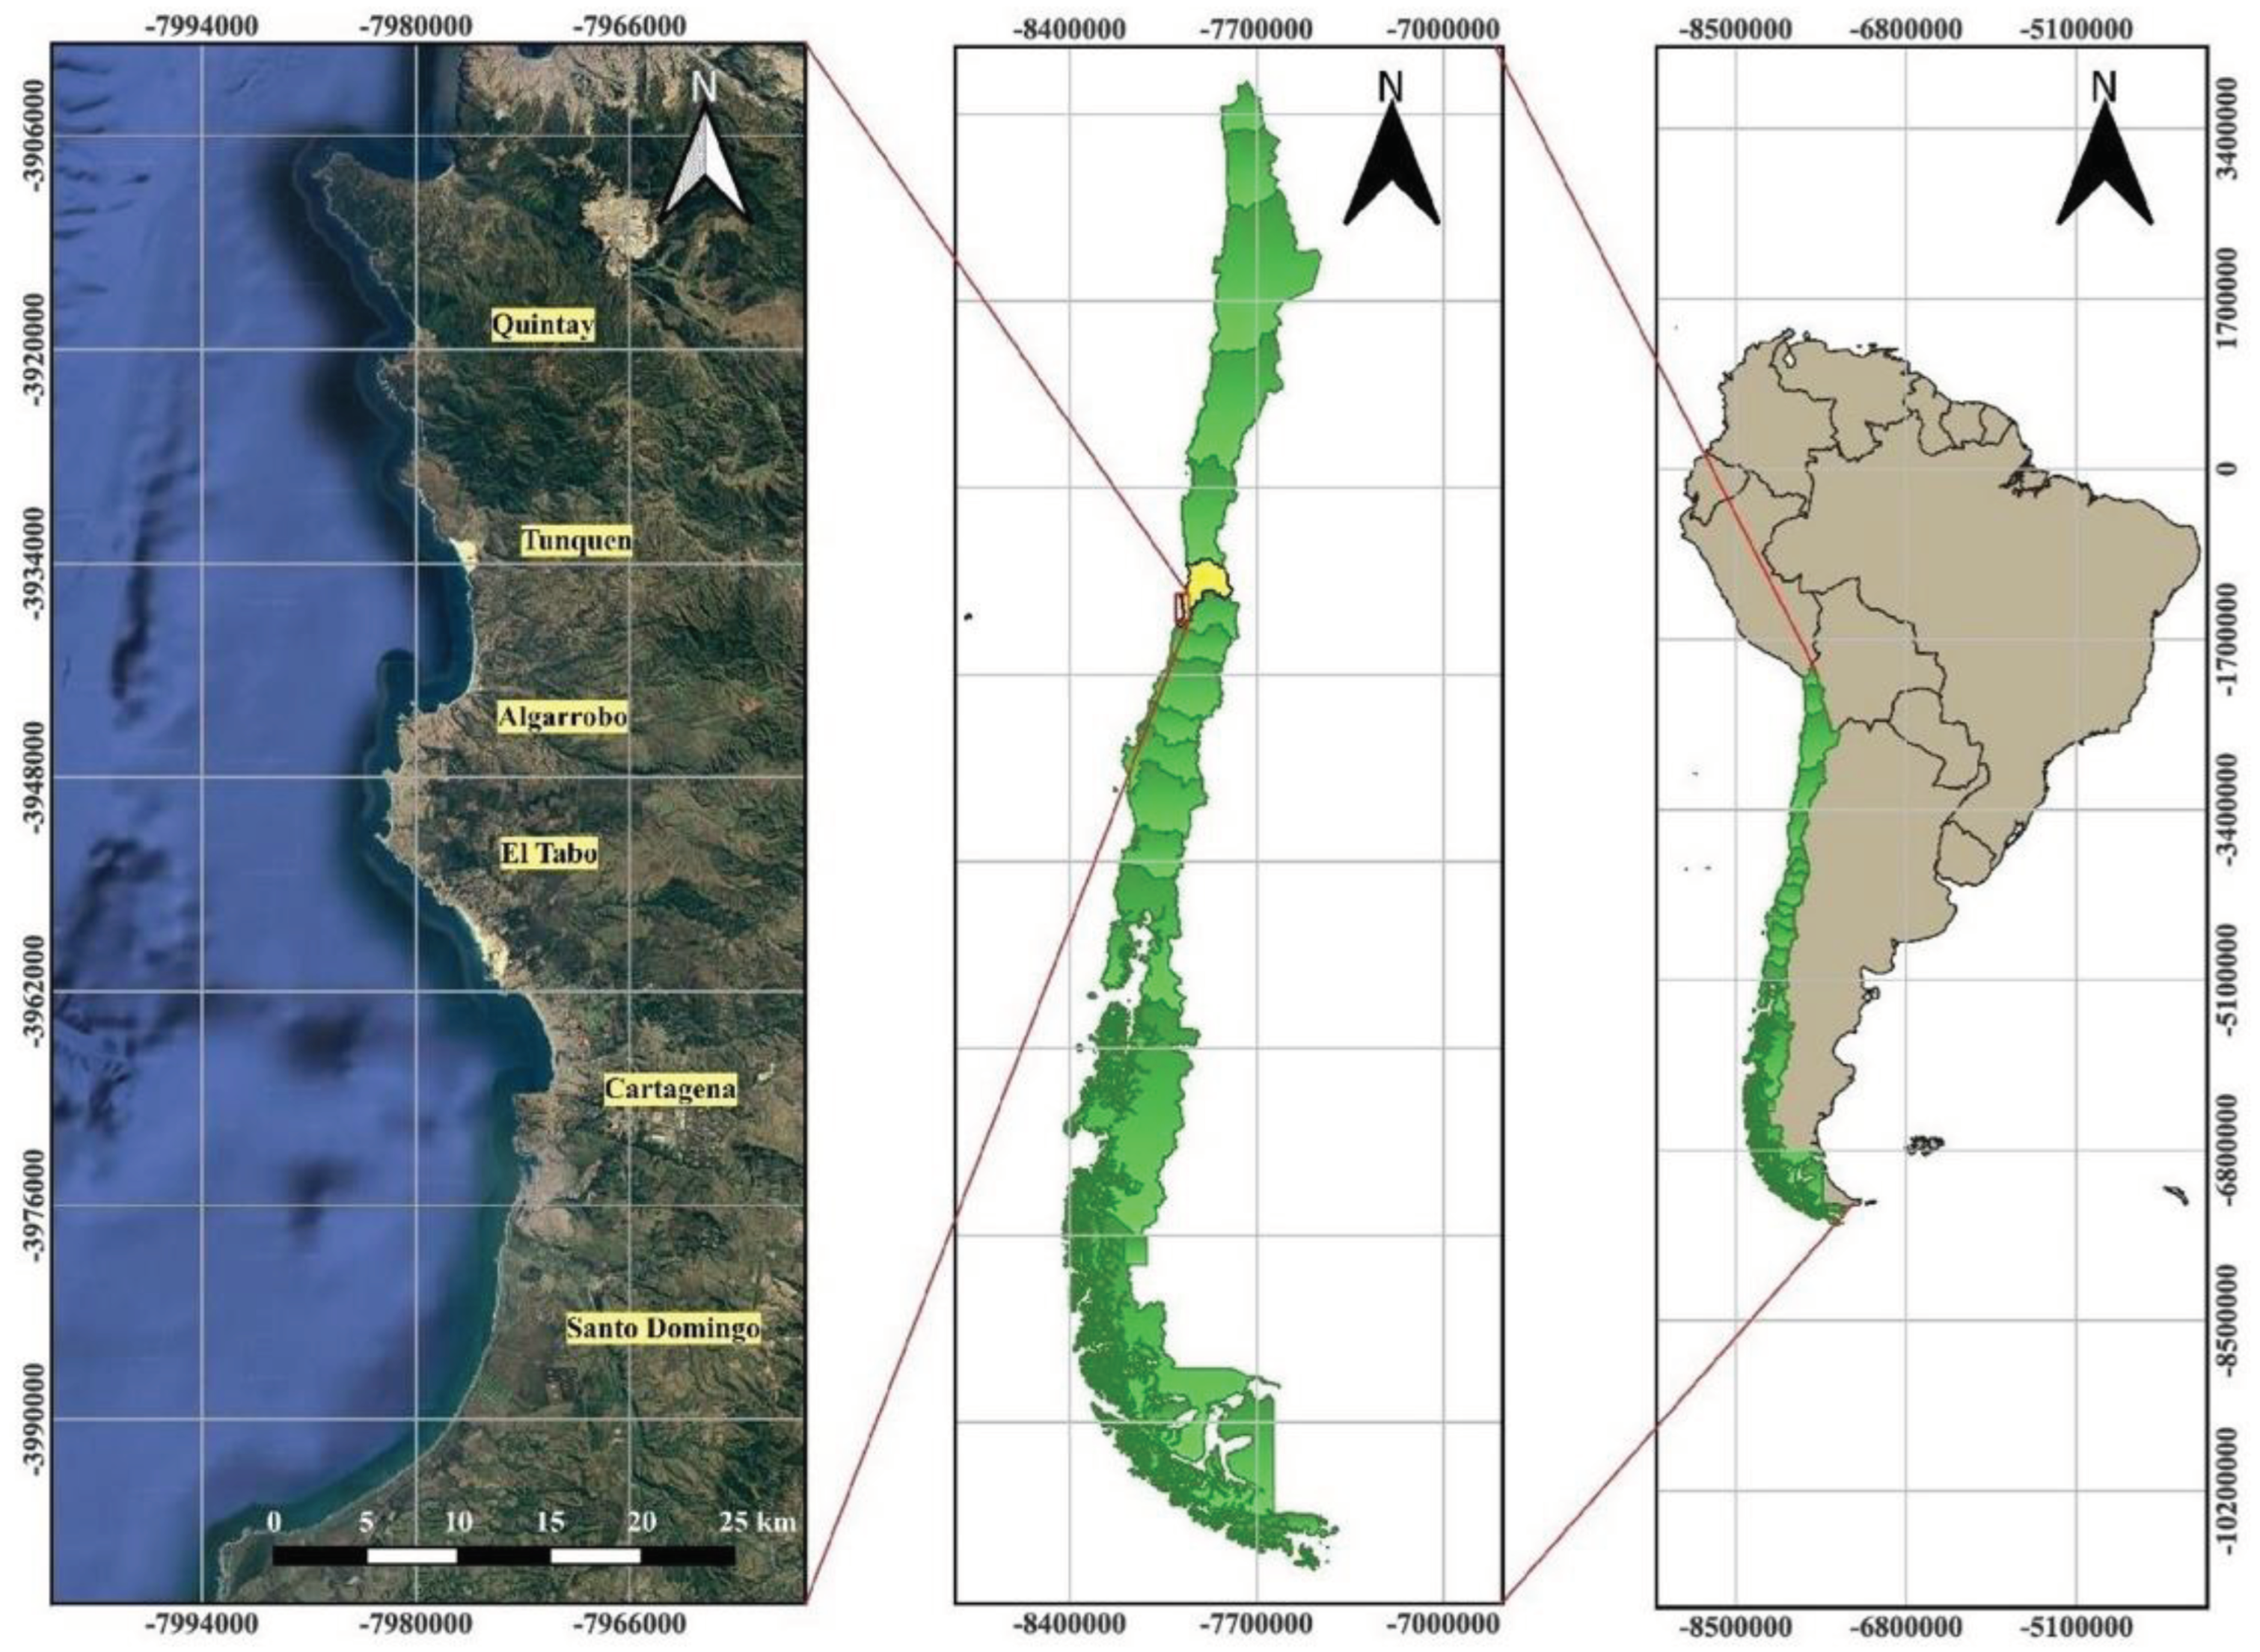
Figure 2.
Monthly tidal curve representative of Valparaíso elaborated by SHOA in its publication 3009 (vertical axis presents the height in cm.) [35].
Figure 2.
Monthly tidal curve representative of Valparaíso elaborated by SHOA in its publication 3009 (vertical axis presents the height in cm.) [35].
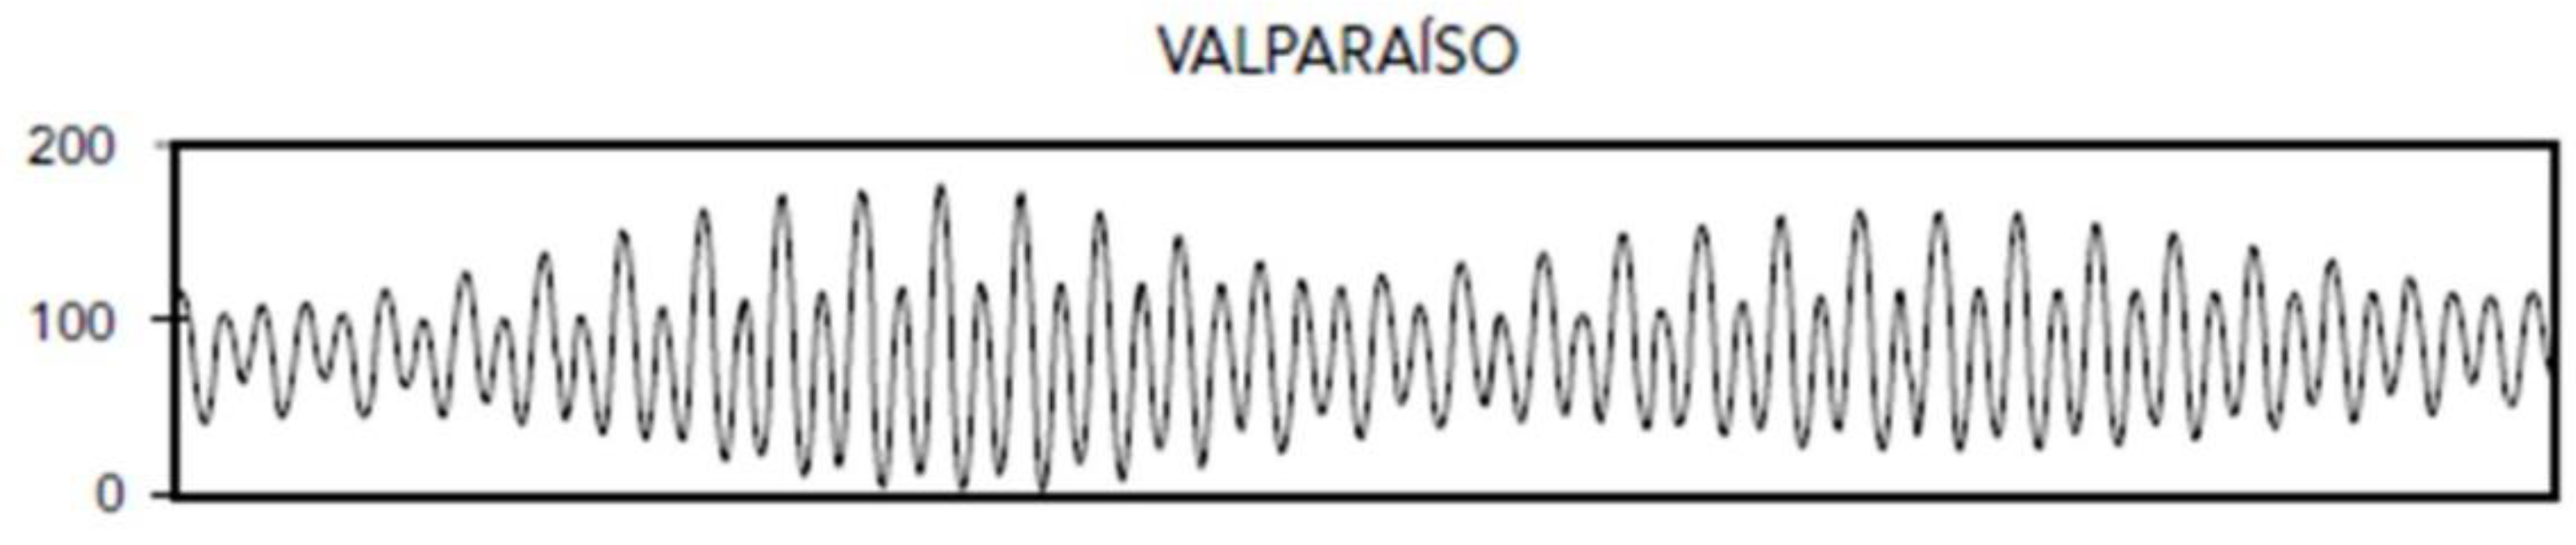
Figure 3.
Classification of the variable "Geomorphology" along the southern coast of the Valparaíso Region.
Figure 3.
Classification of the variable "Geomorphology" along the southern coast of the Valparaíso Region.
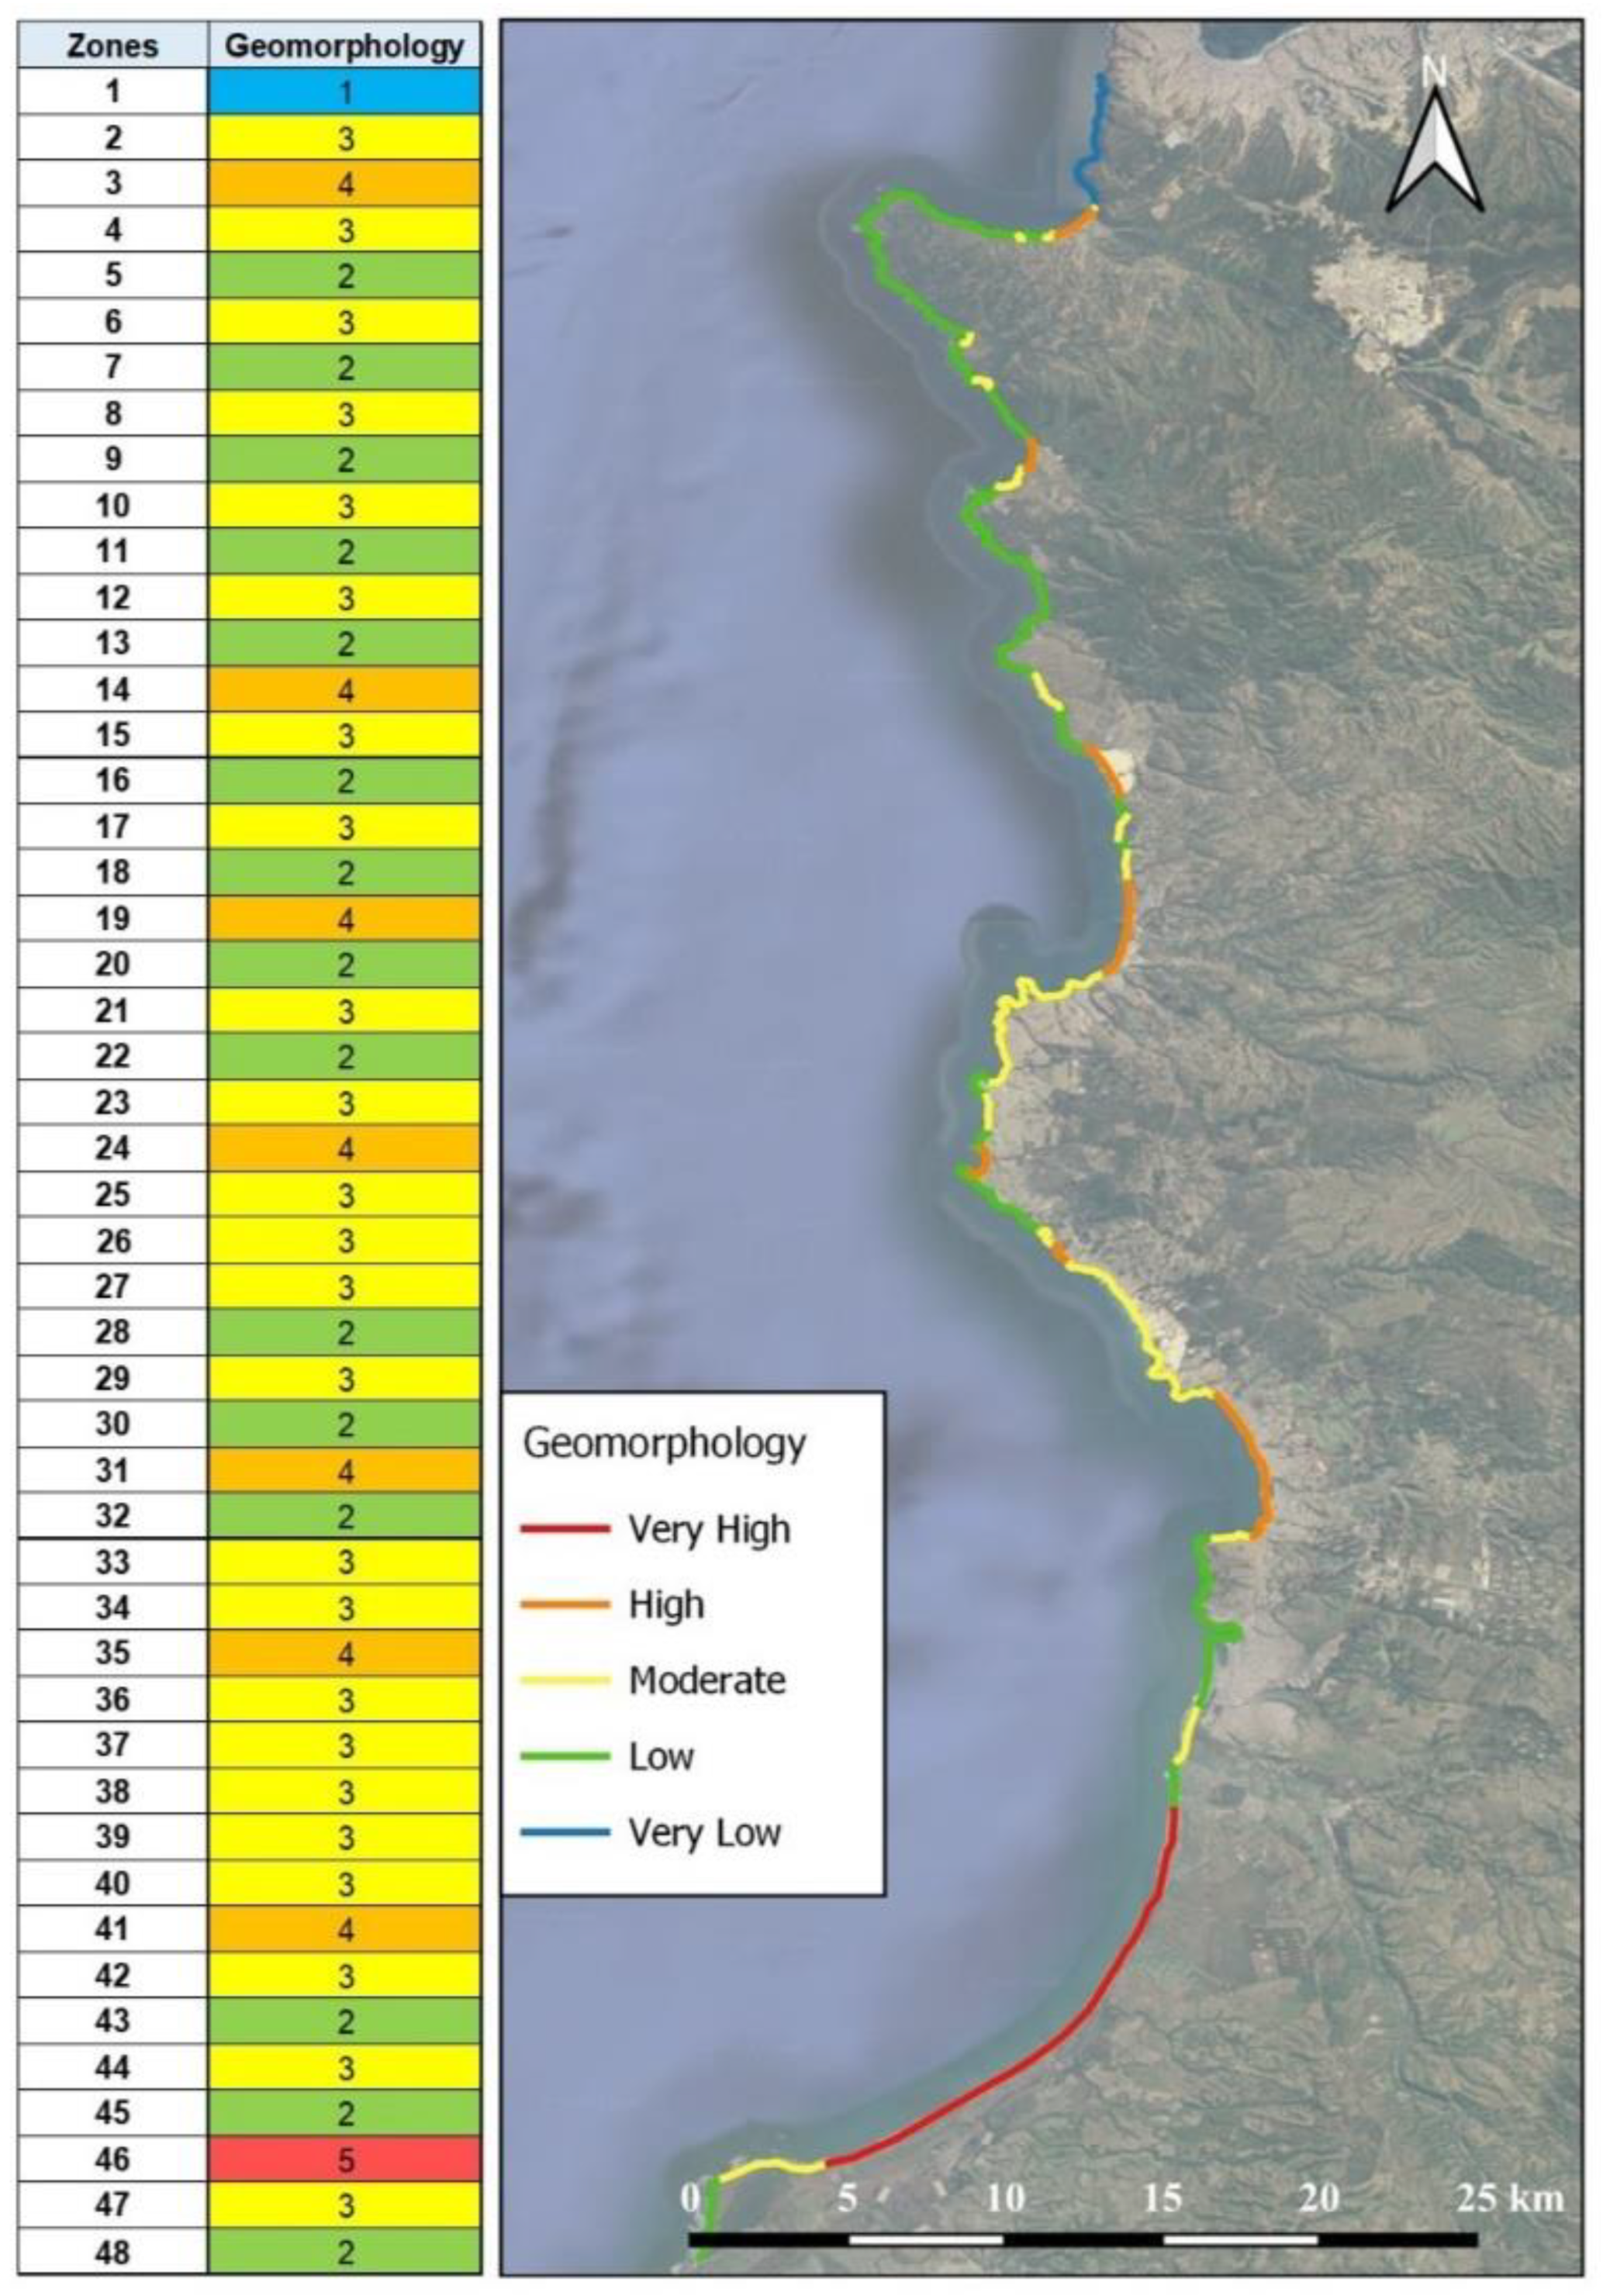
Figure 4.
Classification of the variable "Coastal slope" along the southern coast of the Valparaíso Region.
Figure 4.
Classification of the variable "Coastal slope" along the southern coast of the Valparaíso Region.
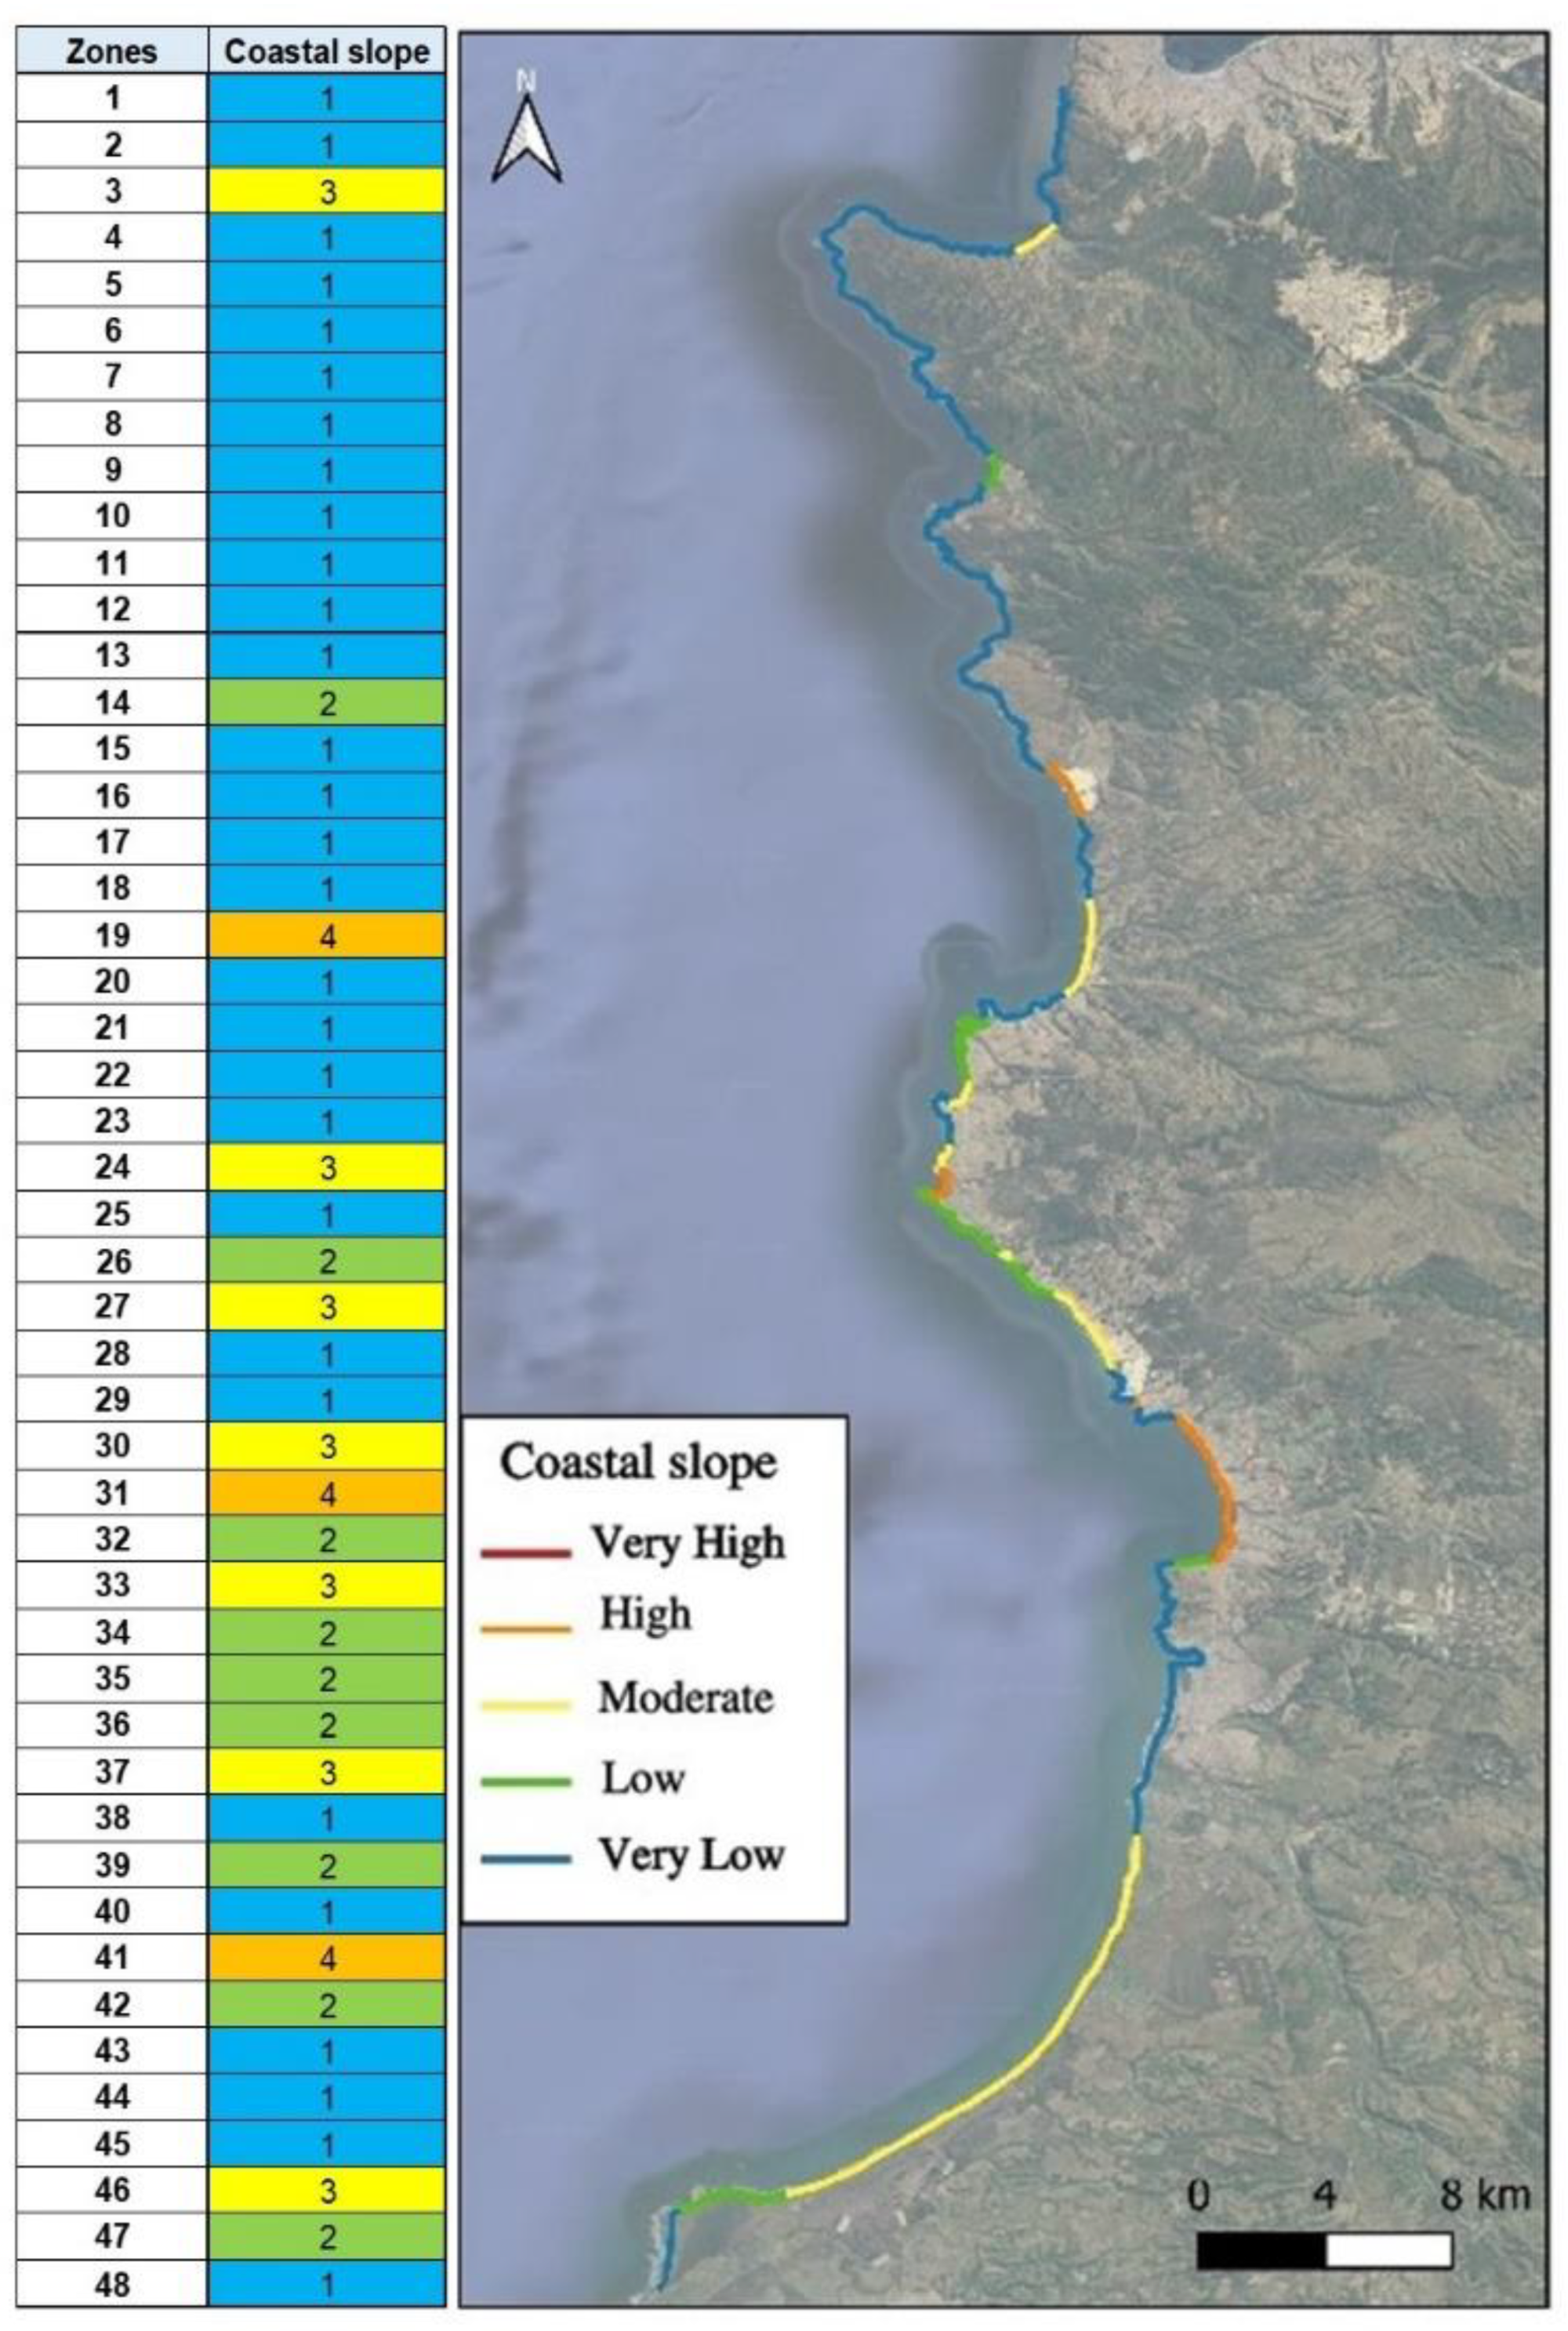
Figure 5.
Classification of the variable "Sea level" along the southern coast of the Valparaíso Region.
Figure 5.
Classification of the variable "Sea level" along the southern coast of the Valparaíso Region.
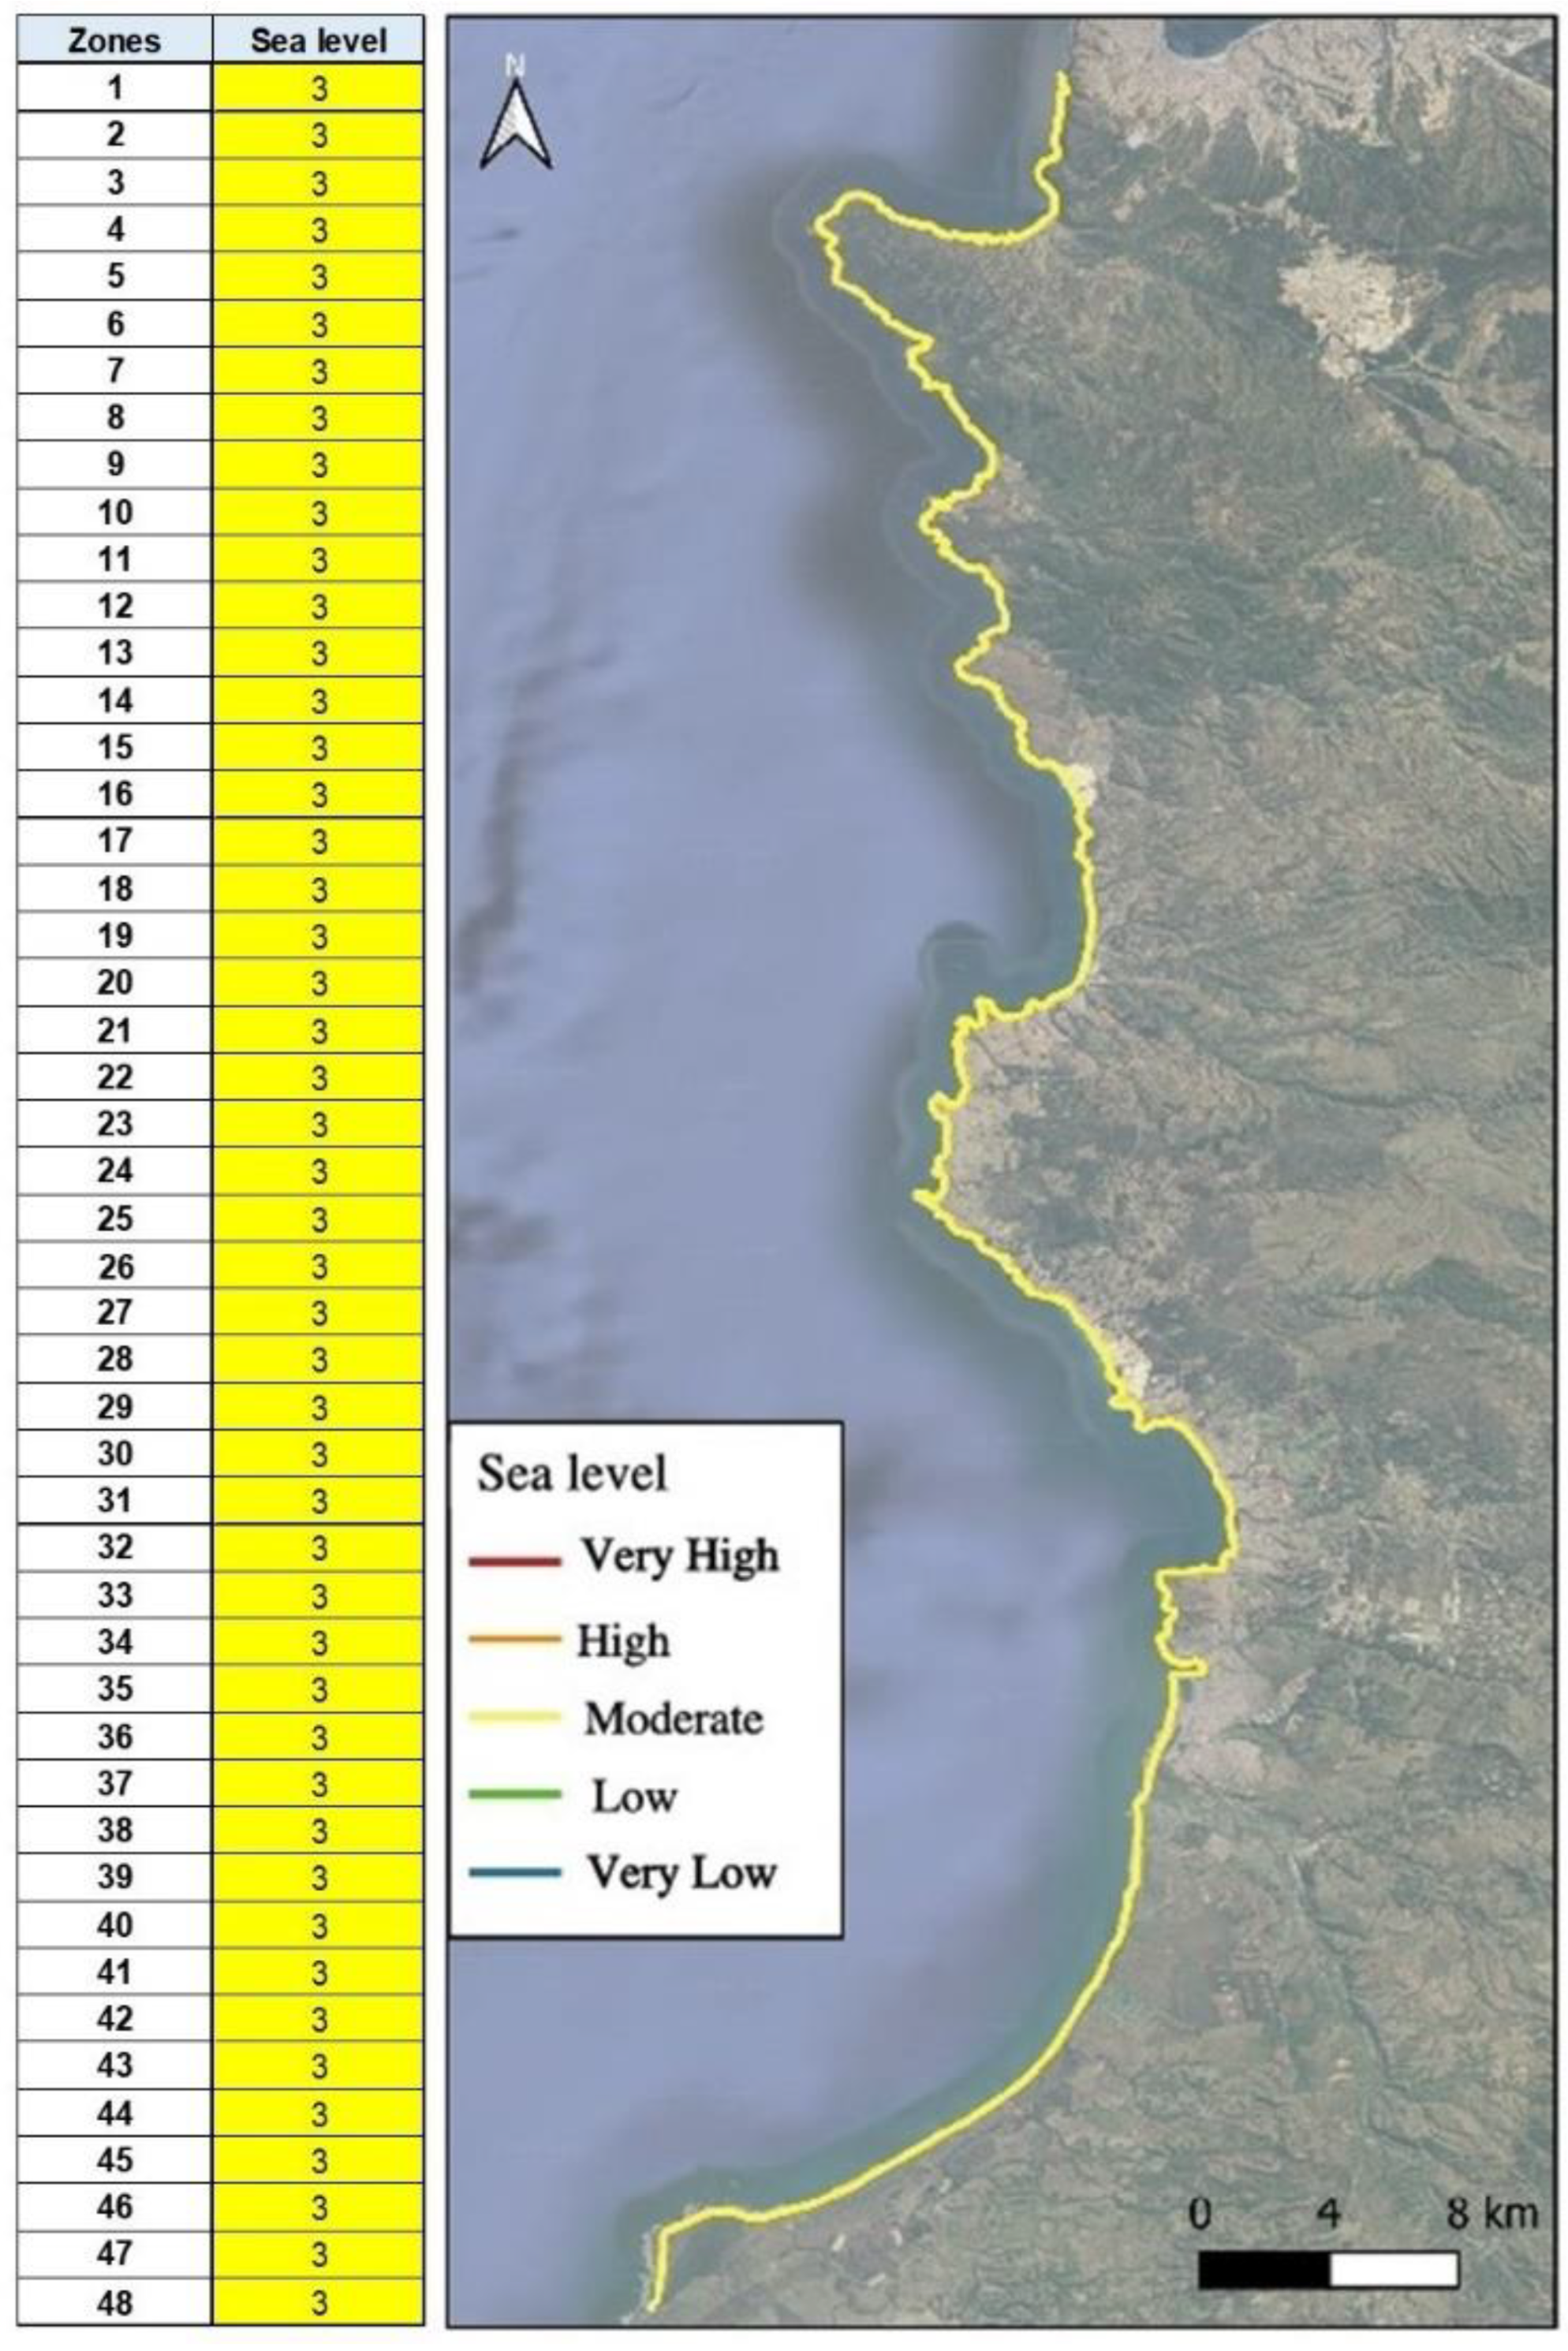
Figure 6.
Classification of the variable " coastal erosion " along the southern coast of the Valparaíso Region.
Figure 6.
Classification of the variable " coastal erosion " along the southern coast of the Valparaíso Region.
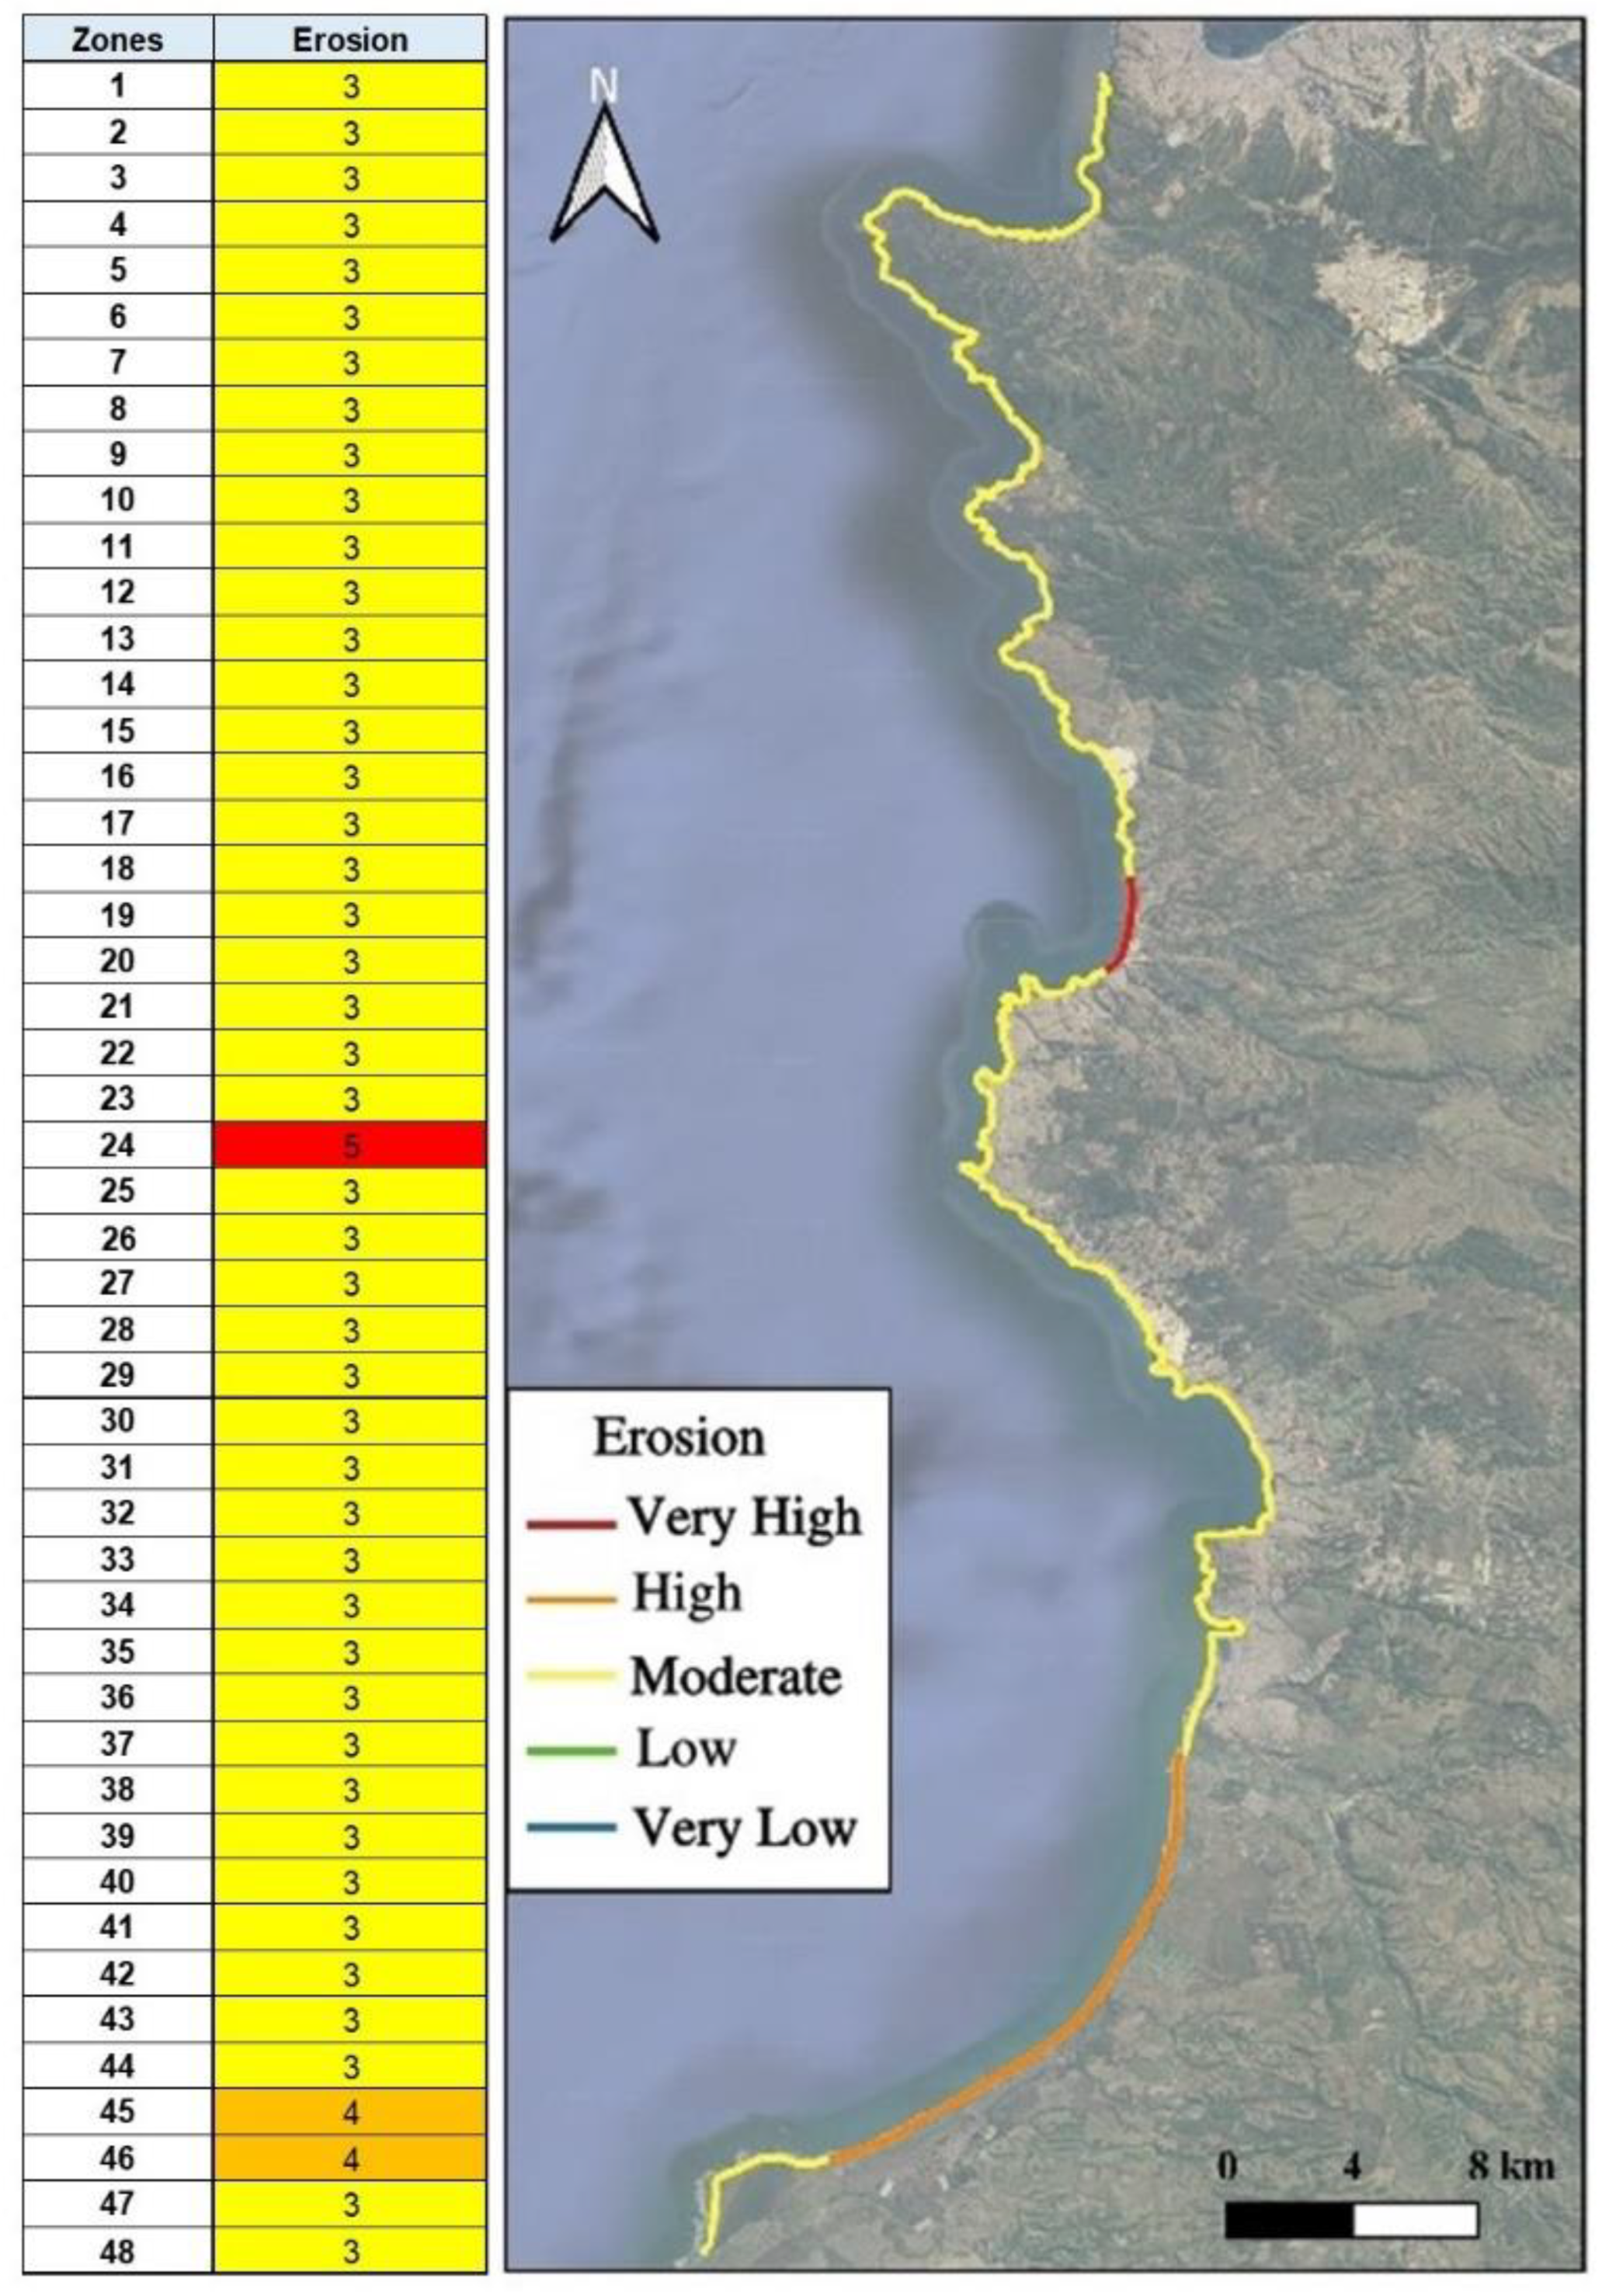
Figure 7.
Classification of the variable "Tidal Range" along the southern coast of the Valparaíso Region.
Figure 7.
Classification of the variable "Tidal Range" along the southern coast of the Valparaíso Region.
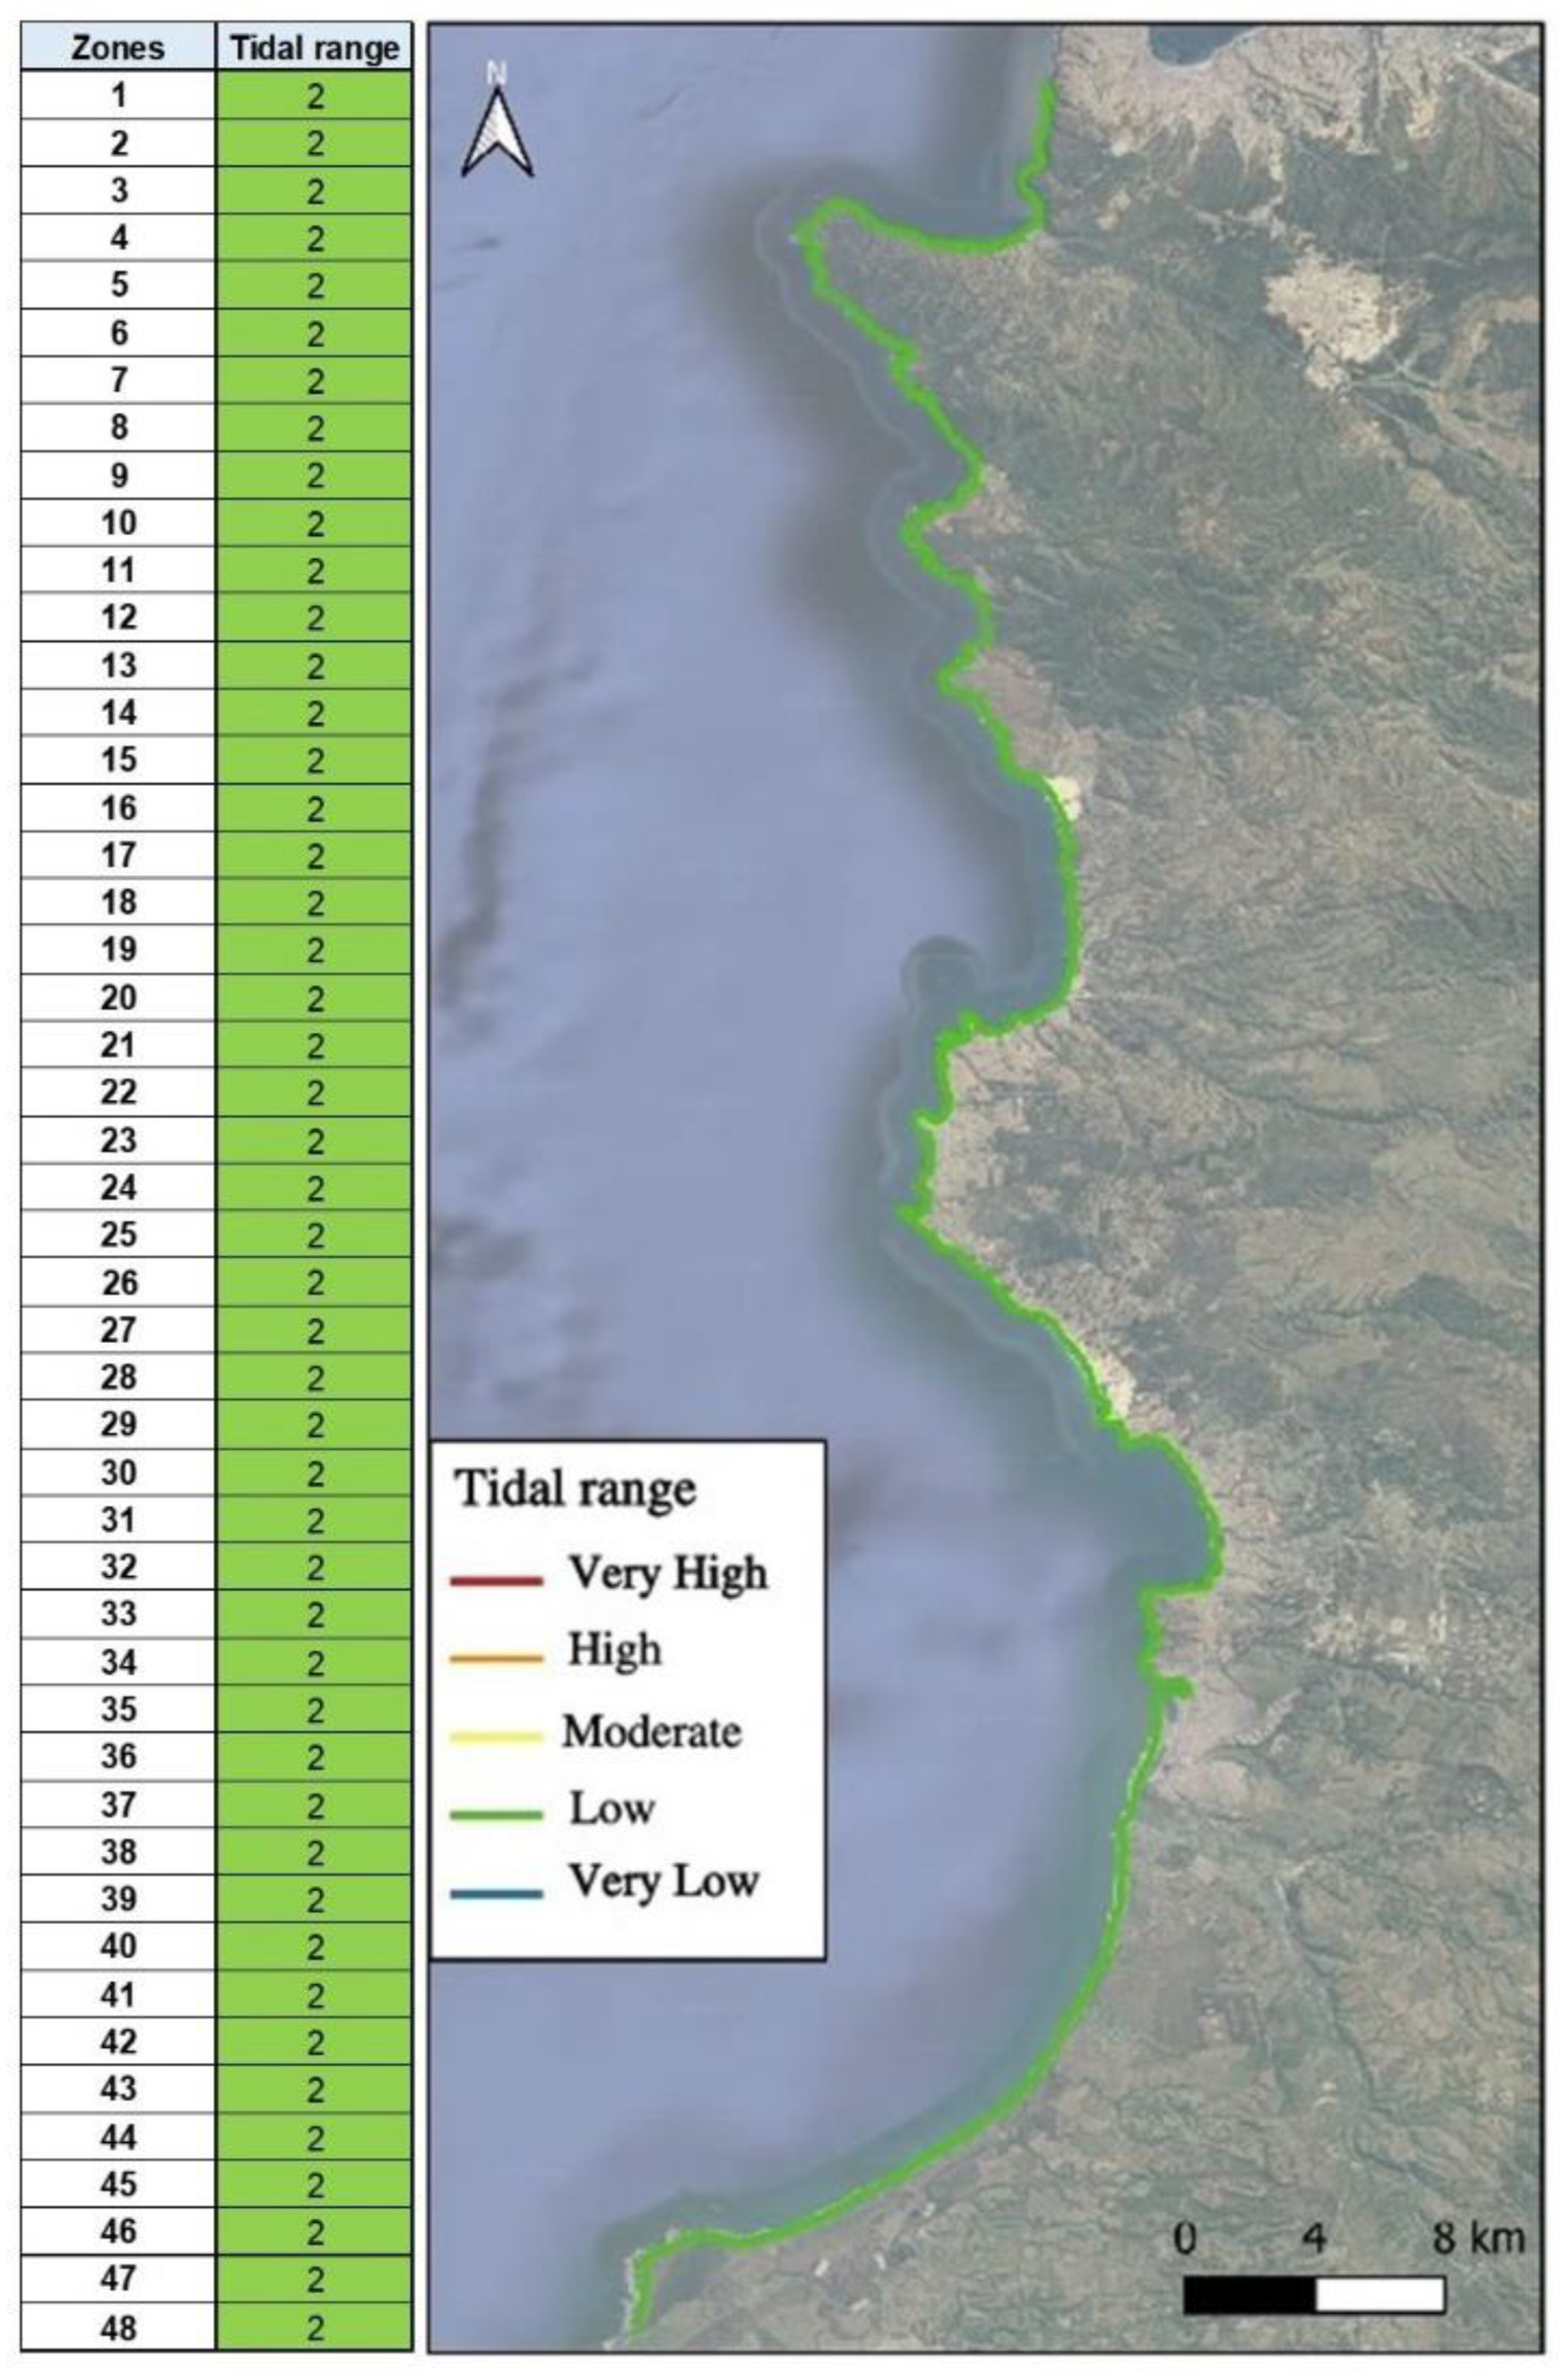
Figure 8.
Classification of the variable "Wave Height" along the southern coast of the Valparaíso Region.
Figure 8.
Classification of the variable "Wave Height" along the southern coast of the Valparaíso Region.
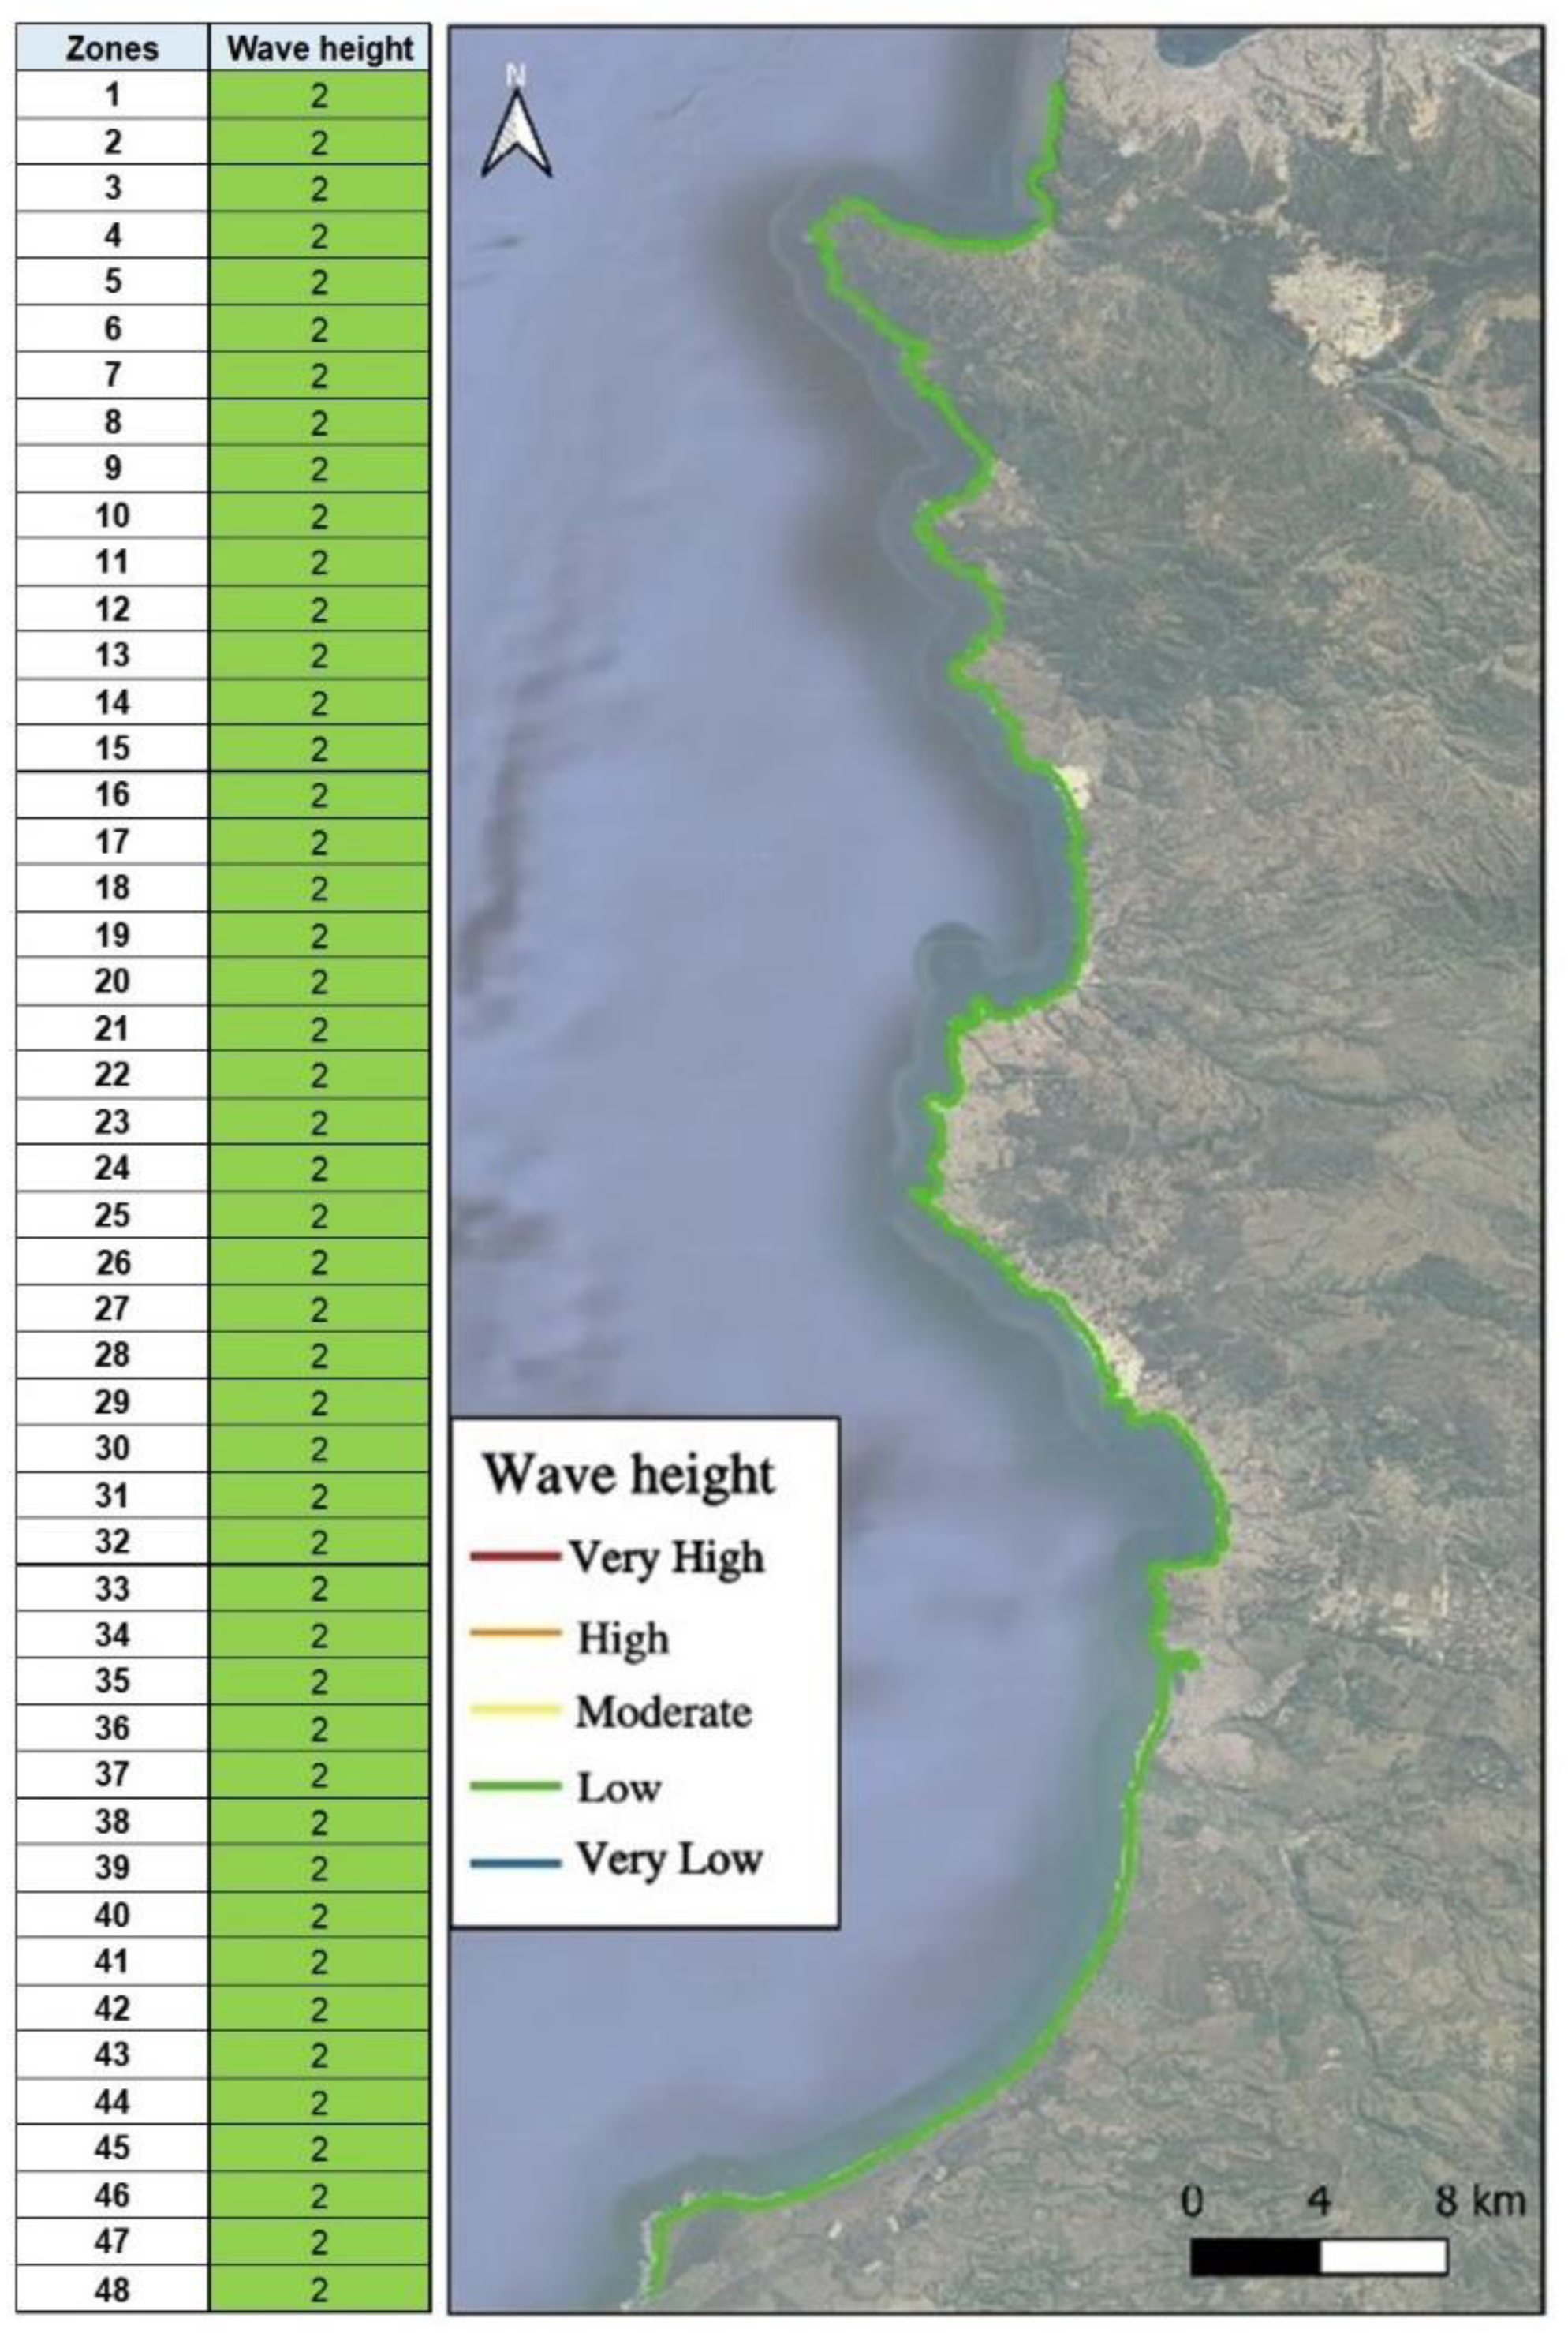
Figure 9.
Coastal Vulnerability Index applied to the southern coast of the Valparaíso Region.
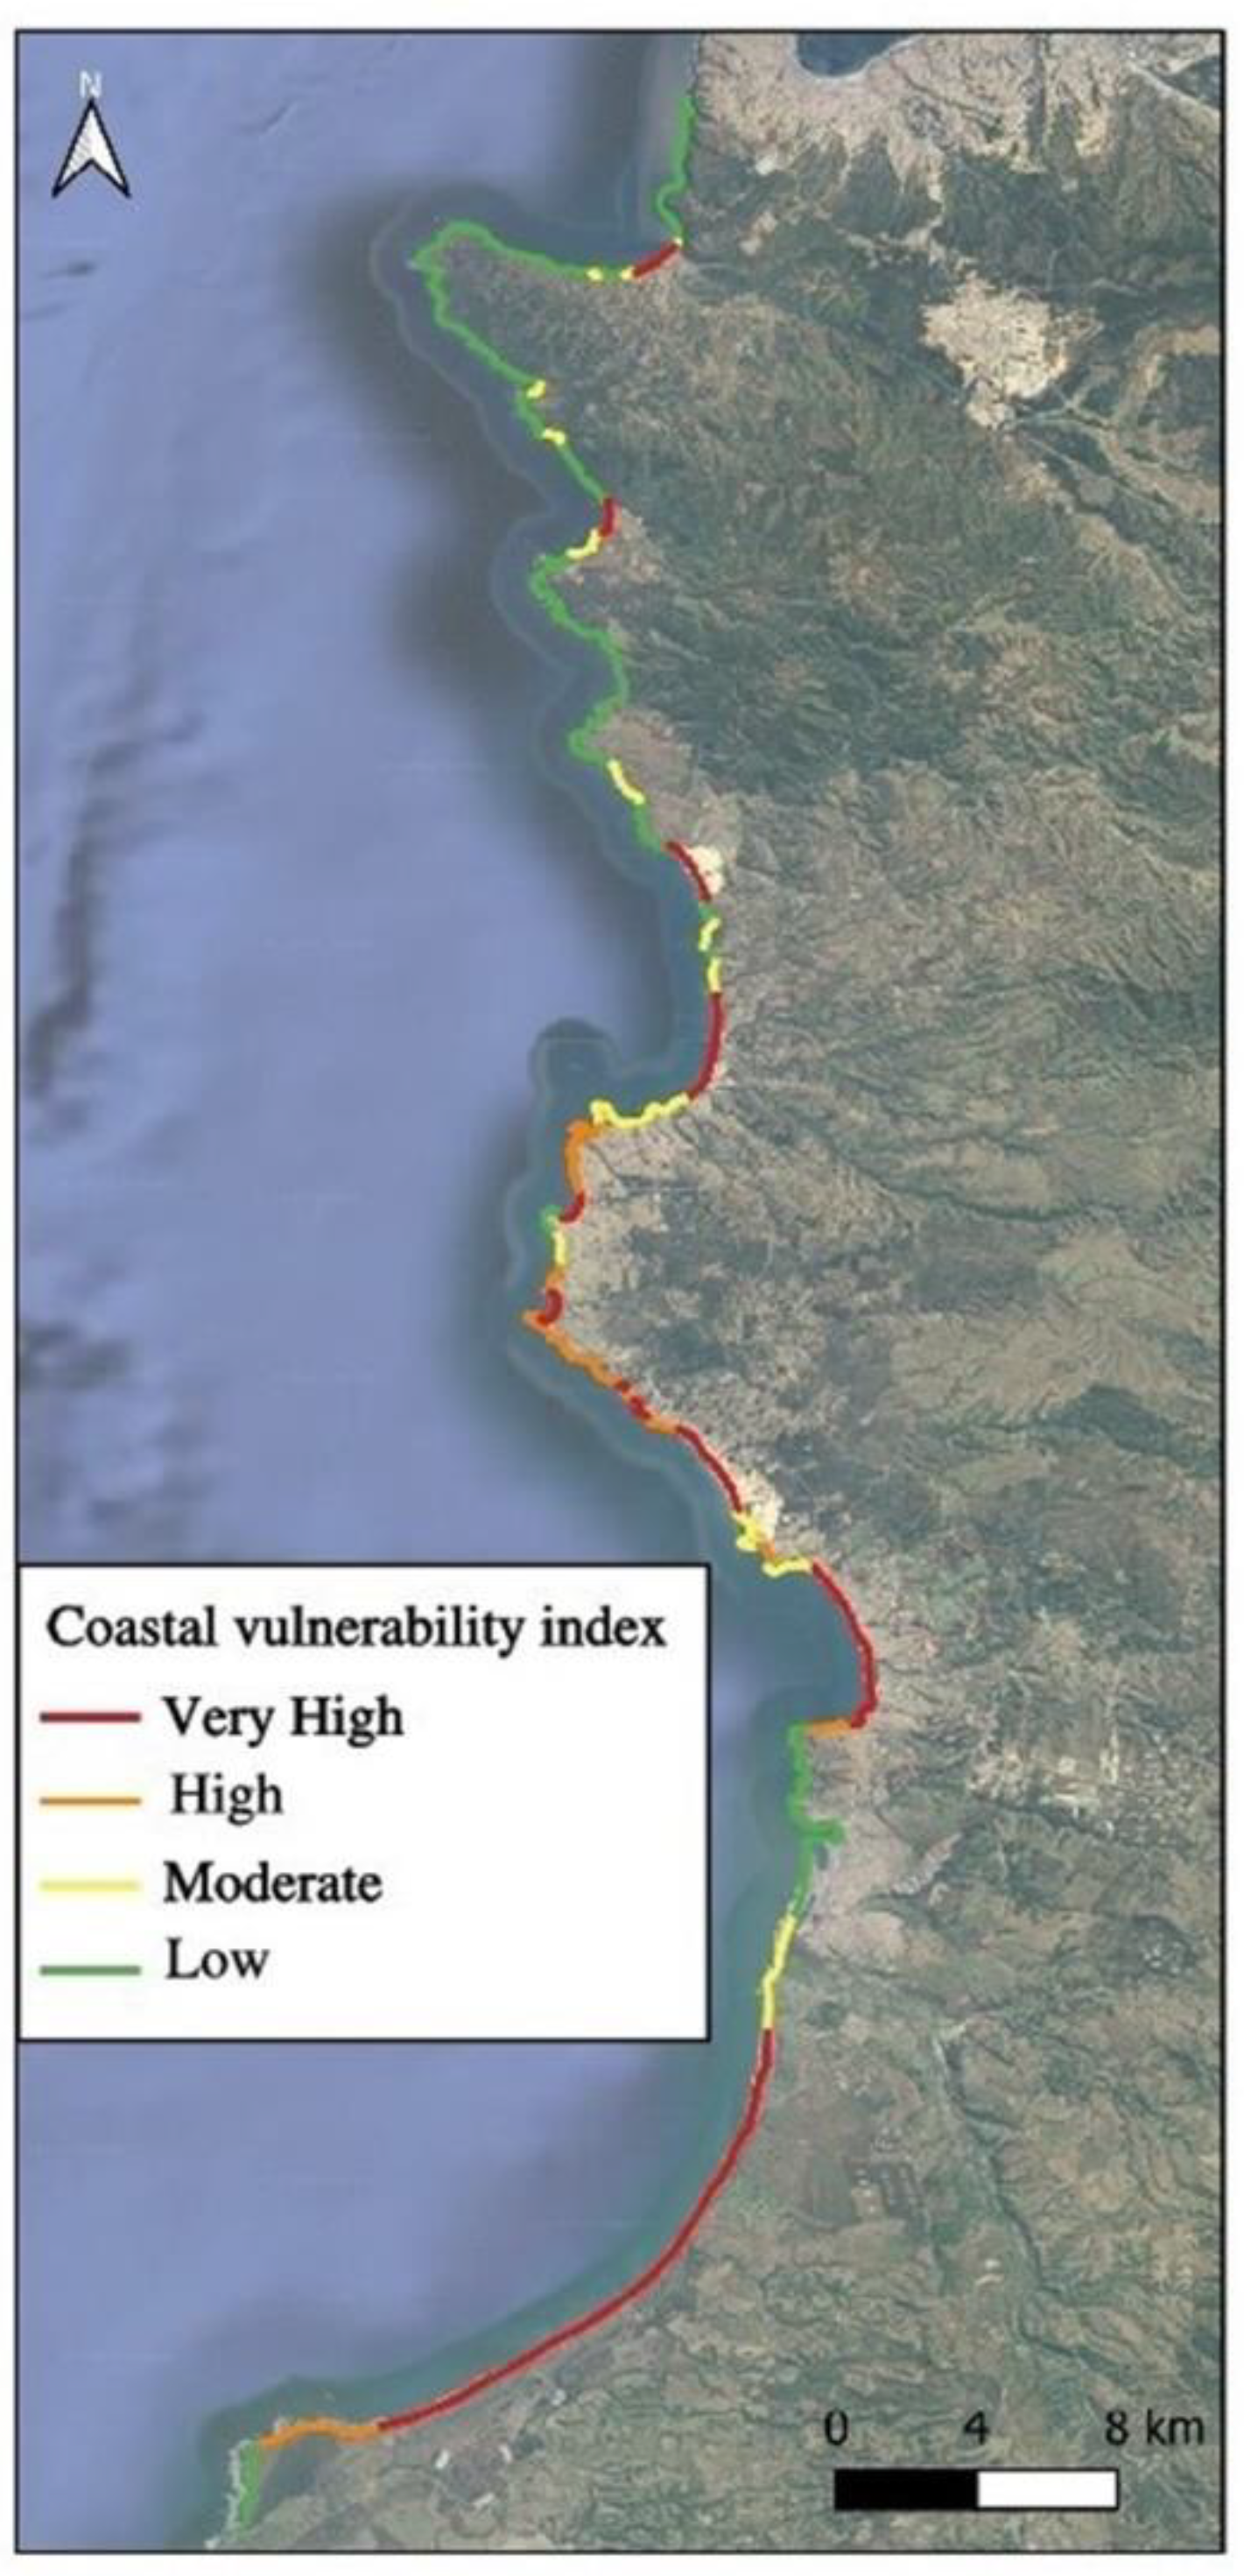

Table 1.
Gornitz Coastal Vulnerability Index Variables (1991).
| Variables | Very low 1 |
Low 2 |
Moderate 3 |
High 4 |
Very high 5 |
|---|---|---|---|---|---|
| Geomorphology | Rocky coastline, Coastal cliffs, Fjords | Medium cliffs, jagged coasts | Low cliffs, glacial drift, alluvial plains | Boulder beaches, estuary and lagoons | Barrier beaches, sandy beaches, marshes, deltas, mangroves, coral reefs. |
| coastal slope (%) | > 1,2 | 1,20 − 0,90 | 0,90 − 0,60 | 0,60 − 0,30 | < 0,3 |
| mean sea level change (mm/year) |
≤ -1,10 | -1,0 − 0,99 | 1,0 − 2,0 | 2,10 − 4,00 | ≥ 4,10 |
| coastal uprising | Within the range of Eustatic Uplift Data |
Sinking of the coast |
|||
| Shoreline displacement (m/year) | ≥ 2,1 | 1,0 − 2,0 | -1,0 − +1,0 | -1,1 − -2,0 | ≤ -2,0 |
| accretion | stability | Erosion | |||
| Tidal range, m (mean) | ≤ 0,99 | 1,0 − 1,9 | 2,0 − 4,0 | 4,1 − 6,0 | ≥ 6,1 |
| Micro tide | Meso tide | Macro tidal | |||
| Wave height, m (max) | 0 − 2,9 | 3,0 − 4,9 | 5,0 − 5,9 | 6,0 − 6,9 | ≥ 7,0 |
Table 2.
Numerical quantification of the Coastal Vulnerability Index for the southern coast of the Valparaíso Region.
Table 2.
Numerical quantification of the Coastal Vulnerability Index for the southern coast of the Valparaíso Region.
| Zone | Geomorphology | Coastal slope | Sea Level | Wave height | Tidal range | Wave height | CVI | Range |
|---|---|---|---|---|---|---|---|---|
| 1 | 1 | 1 | 3 | 3 | 2 | 2 | 2,45 | LOW |
| 2 | 3 | 1 | 3 | 3 | 2 | 2 | 4,24 | MODERATE |
| 3 | 4 | 3 | 3 | 3 | 2 | 2 | 8,49 | VERY HIGH |
| 4 | 3 | 1 | 3 | 3 | 2 | 2 | 4,24 | MODERATE |
| 5 | 2 | 1 | 3 | 3 | 2 | 2 | 3,46 | LOW |
| 6 | 3 | 1 | 3 | 3 | 2 | 2 | 4,24 | MODERATE |
| 7 | 2 | 1 | 3 | 3 | 2 | 2 | 3,46 | LOW |
| 8 | 3 | 1 | 3 | 3 | 2 | 2 | 4,24 | MODERATE |
| 9 | 2 | 1 | 3 | 3 | 2 | 2 | 3,46 | LOW |
| 10 | 3 | 1 | 3 | 3 | 2 | 2 | 4,24 | MODERATE |
| 11 | 2 | 1 | 3 | 3 | 2 | 2 | 3,46 | LOW |
| 12 | 3 | 1 | 3 | 3 | 2 | 2 | 4,24 | MODERATE |
| 13 | 2 | 1 | 3 | 3 | 2 | 2 | 3,46 | LOW |
| 14 | 4 | 2 | 3 | 3 | 2 | 2 | 6,93 | VERY HIGH |
| 15 | 3 | 1 | 3 | 3 | 2 | 2 | 4,24 | MODERATE |
| 16 | 2 | 1 | 3 | 3 | 2 | 2 | 3,46 | LOW |
| 17 | 3 | 1 | 3 | 3 | 2 | 2 | 4,24 | MODERATE |
| 18 | 2 | 1 | 3 | 3 | 2 | 2 | 3,46 | LOW |
| 19 | 4 | 4 | 3 | 3 | 2 | 2 | 9,80 | VERY HIGH |
| 20 | 2 | 1 | 3 | 3 | 2 | 2 | 3,46 | LOW |
| 21 | 3 | 1 | 3 | 3 | 2 | 2 | 4,24 | MODERATE |
| 22 | 2 | 1 | 3 | 3 | 2 | 2 | 3,46 | LOW |
| 23 | 3 | 1 | 3 | 3 | 2 | 2 | 4,24 | MODERATE |
| 24 | 4 | 3 | 3 | 5 | 2 | 2 | 10,95 | VERY HIGH |
| 25 | 3 | 1 | 3 | 3 | 2 | 2 | 4,24 | MODERATE |
| 26 | 3 | 2 | 3 | 3 | 2 | 2 | 6,00 | HIGH |
| 27 | 3 | 3 | 3 | 3 | 2 | 2 | 7,35 | VERY HIGH |
| 28 | 2 | 1 | 3 | 3 | 2 | 2 | 3,46 | LOW |
| 29 | 3 | 1 | 3 | 3 | 2 | 2 | 4,24 | MODERATE |
| 30 | 2 | 3 | 3 | 3 | 2 | 2 | 6,00 | HIGH |
| 31 | 4 | 4 | 3 | 3 | 2 | 2 | 9,80 | VERY HIGH |
| 32 | 2 | 2 | 3 | 3 | 2 | 2 | 4,90 | HIGH |
| 33 | 3 | 3 | 3 | 3 | 2 | 2 | 7,35 | VERY HIGH |
| 34 | 3 | 2 | 3 | 3 | 2 | 2 | 6,00 | HIGH |
| 35 | 4 | 2 | 3 | 3 | 2 | 2 | 6,93 | VERY HIGH |
| 36 | 3 | 2 | 3 | 3 | 2 | 2 | 6,00 | HIGH |
| 37 | 3 | 3 | 3 | 3 | 2 | 2 | 7,35 | VERY HIGH |
| 38 | 3 | 1 | 3 | 3 | 2 | 2 | 4,24 | MODERATE |
| 39 | 3 | 2 | 3 | 3 | 2 | 2 | 6,00 | HIGH |
| 40 | 3 | 1 | 3 | 3 | 2 | 2 | 4,24 | MODERATE |
| 41 | 4 | 4 | 3 | 3 | 2 | 2 | 9,80 | VERY HIGH |
| 42 | 3 | 2 | 3 | 3 | 2 | 2 | 6,00 | HIGH |
| 43 | 2 | 1 | 3 | 3 | 2 | 2 | 3,46 | LOW |
| 44 | 3 | 1 | 3 | 3 | 2 | 2 | 4,24 | MODERATE |
| 45 | 2 | 1 | 3 | 4 | 2 | 2 | 4,00 | MODERATE |
| 46 | 5 | 3 | 3 | 4 | 2 | 2 | 10,95 | VERY HIGH |
| 47 | 3 | 2 | 3 | 3 | 2 | 2 | 6,00 | HIGH |
| 48 | 2 | 1 | 3 | 3 | 2 | 2 | 3,46 | LOW |
Disclaimer/Publisher’s Note: The statements, opinions and data contained in all publications are solely those of the individual author(s) and contributor(s) and not of MDPI and/or the editor(s). MDPI and/or the editor(s) disclaim responsibility for any injury to people or property resulting from any ideas, methods, instructions or products referred to in the content. |
© 2024 by the authors. Licensee MDPI, Basel, Switzerland. This article is an open access article distributed under the terms and conditions of the Creative Commons Attribution (CC BY) license (http://creativecommons.org/licenses/by/4.0/).
Copyright: This open access article is published under a Creative Commons CC BY 4.0 license, which permit the free download, distribution, and reuse, provided that the author and preprint are cited in any reuse.


