Submitted:
05 March 2024
Posted:
06 March 2024
You are already at the latest version
Abstract
Microplastics, which are plastic particles smaller than 5 mm in size, are a growing environmental concern since they have been found in oceans, rivers, lakes, and even on land. These tiny particles can escape water filtration systems and end up in water bodies as well as through the degradation of the larger plastic products causing serious environmental and food safety concerns. This research represents the magnitude of this pollution, characterization of microplastic contamination, its type of polymer, and possible sources of this pollution in the rivers around Dhaka, Bangladesh. Quantitative analyses were done following the method suggested by the NOAA and other conventional methods. Among the rivers, Buriganga has the highest microplastic pollution with 3.654 items/L in surface water and 43.125 items/kg in sediment. The concentration in Shitalakshya and Turag rivers are 3.011 items/L and 2.051 items/L in surface water and 34.875 and 17.875 items/kg in sediment respectively. ANOVA test revealed a significant difference between the concentration level of microplastic in the surface water of the Burigana and Turag rivers. A positive correlation between the concentration level of microplastic in the surface water and the sediment was also found. On average 58% of the microplastics were found to be fibrous in surface water. Qualitative analyses were done to find the characteristics and chemical composition of the microplastics. Through the use of FTIR spectroscopy, the study identified different kinds of synthetic polymers in the sample including polyamide (Nylon), polyethylene (PE), polystyrene (PS), polypropylene (PP), polyethersulfone (PES), polyvinyl chloride (PVC), and polyethylene terephthalate (PET) and polyethylene were the most abundant polymer in the samples. This study involved the investigation of three distinct rivers located in the vicinity of Dhaka city
Keywords:
microplastics
; microplastic pollution
; water pollution
; rivers of Dhaka
; Bangladesh
Introduction
Plastics are a vast variety of synthetic or semi-synthetic materials composed primarily of polymers. Over there is limited information available in this area. There is also a lot of room for improvement in determining the origin and source of microplastics, which was lacking in the most recent studies. However, researchers are currently working on this topic and discovering new information that can help us understand this pollution that is contaminating the freshwater ecosystem and posing a health risk. This study seeks to discover, quantify, and characterize microplastics in water bodies (Buriganga, Shitolakhshya, and Turag rivers) surrounding Dhaka. The primary goal of this study is to quantitatively assess the presence and abundance of microplastics. The utilization of a digital microscope will facilitate the assessment of microplastic particle abundance, hence offering a comprehensive evaluation of the concentration of microplastic pollution present in both water and sediment samples. Another key purpose is to analyze the particles in terms of shape, size, and most crucially, chemical composition, utilizing FTIR techniques, to determine the origin of the plastic particle. In the past 70 years, the output of plastics has steadily increased, rising from 1.5 million metric tons (Mt) in the 1950s to 375.5 million metric tons in 2020 [1]. The commercial benefits of durability, cost-effectiveness, versatility, elasticity, and resilience have increased the supply of products made of plastics [2,3]. The term “microplastics” refers to plastic debris with a length of fewer than five millimeters. This is currently a serious worry for aquatic ecology as well as for humans since we find pollution in our water streams and the environment. Depending on how they are formed, microplastics can be classed as either primary or secondary microplastics. Primary microplastics are tiny plastic particles discharged directly into the environment via home and industrial effluents, spills, and sewage discharge, or indirectly via runoff. Meanwhile, After being exposed to the marine environment, larger plastic objects degrade into microscopic plastic fragments, giving rise to what are known as secondary microplastics. which can further degrade to smaller particles. Even though the ocean is the major sink for microplastics but microplastics can stay years in freshwater systems such as rivers before they are carried into the ocean. In Bangladesh, Dhaka has the highest plastic usage with a very low recycling percentage of plastic waste and hence probably the highest plastic waste and the highest microplastic pollution in the environment including freshwater systems. So, it is not presumptuous to assert that rivers around Dhaka transport a huge amount of microplastics into the other major freshwater rivers in the vicinity. Thus, the first step in comprehending the negative effects of this pollutant on the aquatic ecosystem is to evaluate the occurrence of microplastics in the waterbodies around Dhaka city and quantify the concentration of microplastics in these waterbodies. As micro-plastic analysis is a relatively new field of study,
Literature Review
Plastic pollution was first discovered in the water in the 1970s, and if current trends continue, there will be more plastic than fish in the ocean by 2050 [4]. Early in the 21st century, environmental scientists initiated research on marine microplastics [5]. Microplastics can originate from a wide number of sources, one of which being bigger plastic trash that, over time, breaks down into ever-smaller fragments. Few studies have examined plastic breakdown when many degradation processes are present in the environment. Weight loss, changes in tensile strength, molecular structure, and the discovery of specific microbial strains to utilize specific polymer types have all been the primary foci of existing investigations. Both the type of degradation mechanism being studied (such as heat deterioration) and the resulting experimental data characterize the degradation processes [6]. The structural integrity of macro-plastic debris is degraded as a result of a confluence of physical, chemical, and biological processes, which ultimately results in fragmentation [7]. The disintegration of macro-plastic waste is affected by several elements, including those of the environment (such as sunlight and temperature) and the polymer itself (size, density). Larger pieces of trash made of plastic degrade more quickly when exposed to the sun’s ultraviolet (UV) rays, a process known as “photodegradation” [8] The polymer matrix undergoes oxidation as a result of the sun’s ultraviolet light, which ultimately results in the breaking of bonds [7,8,9]. The generation of micro-plastic by the fragmentation of larger pieces into tiny ones is most efficient on beaches due to the high levels of ultraviolet light, the physical abrasion by waves, and the availability [7,10] of oxygen, and the turbulence [11] Once these pieces are submerged in surface waters or deep settings, the rate of breakdown is slowed because of the lower temperatures and the decreased amount of UV light [10]
The morphological data obtained from the samples of microplastics can be utilized to suggest where the microplastics may have originated. Line and fiber, for instance, are typically manufactured from fishing lines, clothing, or other types of textiles, whereas film is typically manufactured from bags or other types of wrapping materials [12]
The majority of microplastics come from sources located on land as well as marine environments [13,14] Land-based sources are the major contributor (80%) of microplastics to the environment, partly due to the global reliance on plastic-based goods such as plastic bags; improperly discarding things containing plastic [8,15] Also, it’s commonly acknowledged that WWTPs (waste water treatment facilities) are a major entrance point for particles into the environment [16,17,18] Microplastics from the widespread use of personal care products (PCPs) and synthetic particles (nylon, polyester) from the laundry are transported through wastewater treatment plants (WWTPs) [8,15]. It has been hypothesized that microplastics from land can enter the ocean through the freshwater ecosystem [19]. Particles of micro-plastics originating from land-based sources make their way directly into freshwater habitats through the disposal of plastic debris, the movement of these particles by the wind (an aspect that has attracted less research), and contributions from WWTPs [19,20] This shows that freshwater ecosystems represent an important link to the greater marine environment. Plastic materials used in fisheries and aquaculture can be a source of micro-plastics entering the environment. Additionally, it has been estimated that approximately 10% of the plastic pellets found on beaches are the result of pellets that have been discarded during shipping activities [21].
Micro-plastics whose densities are higher than those of the surrounding seawater will eventually accumulate in sediments [22,23]whereas those with a low-density rise to the water surface [24]. Microplastic concentrations in marine sediments have increased dramatically; on heavily impacted beaches, micro-plastics can account for as much as 3.3% of the sediment weight [25,26,27]. The fact that marine coastal shallow sediments, submarine canyons, and the deep sea all serve as sinks for microplastics is well acknowledged (Alomar et al., 2016). The mobility and disintegration of plastics once they enter the aquatic environment will produce a variety of parent materials, fragmented particles of varying sizes, and other non-polymer degradation products. By analyzing the size distribution of microplastics across the globe, we can identify the locations where most plastics end up floating on the water’s surface [28]
Many different kinds of life may absorb microplastics from the ocean and its sediments. This can be achieved in a variety of ways, including inhalation, ingestion, and cutaneous absorption (e.g., gills). Depending on the size and shape of the microplastics, they may cause physical irritation. Smooth, spherical pieces of plastic may be easier to get rid of than smaller, more angular pieces, which can get stuck in the gills and digestive system [5].
Based on the existing literature on microplastic pollution and its extent in freshwater systems, the primary objective of this reseach is to identify the presence and quantity of microplastic particle in the freshwater system and to identify potential sources of microplastics that enter the environment.
Research Methodology
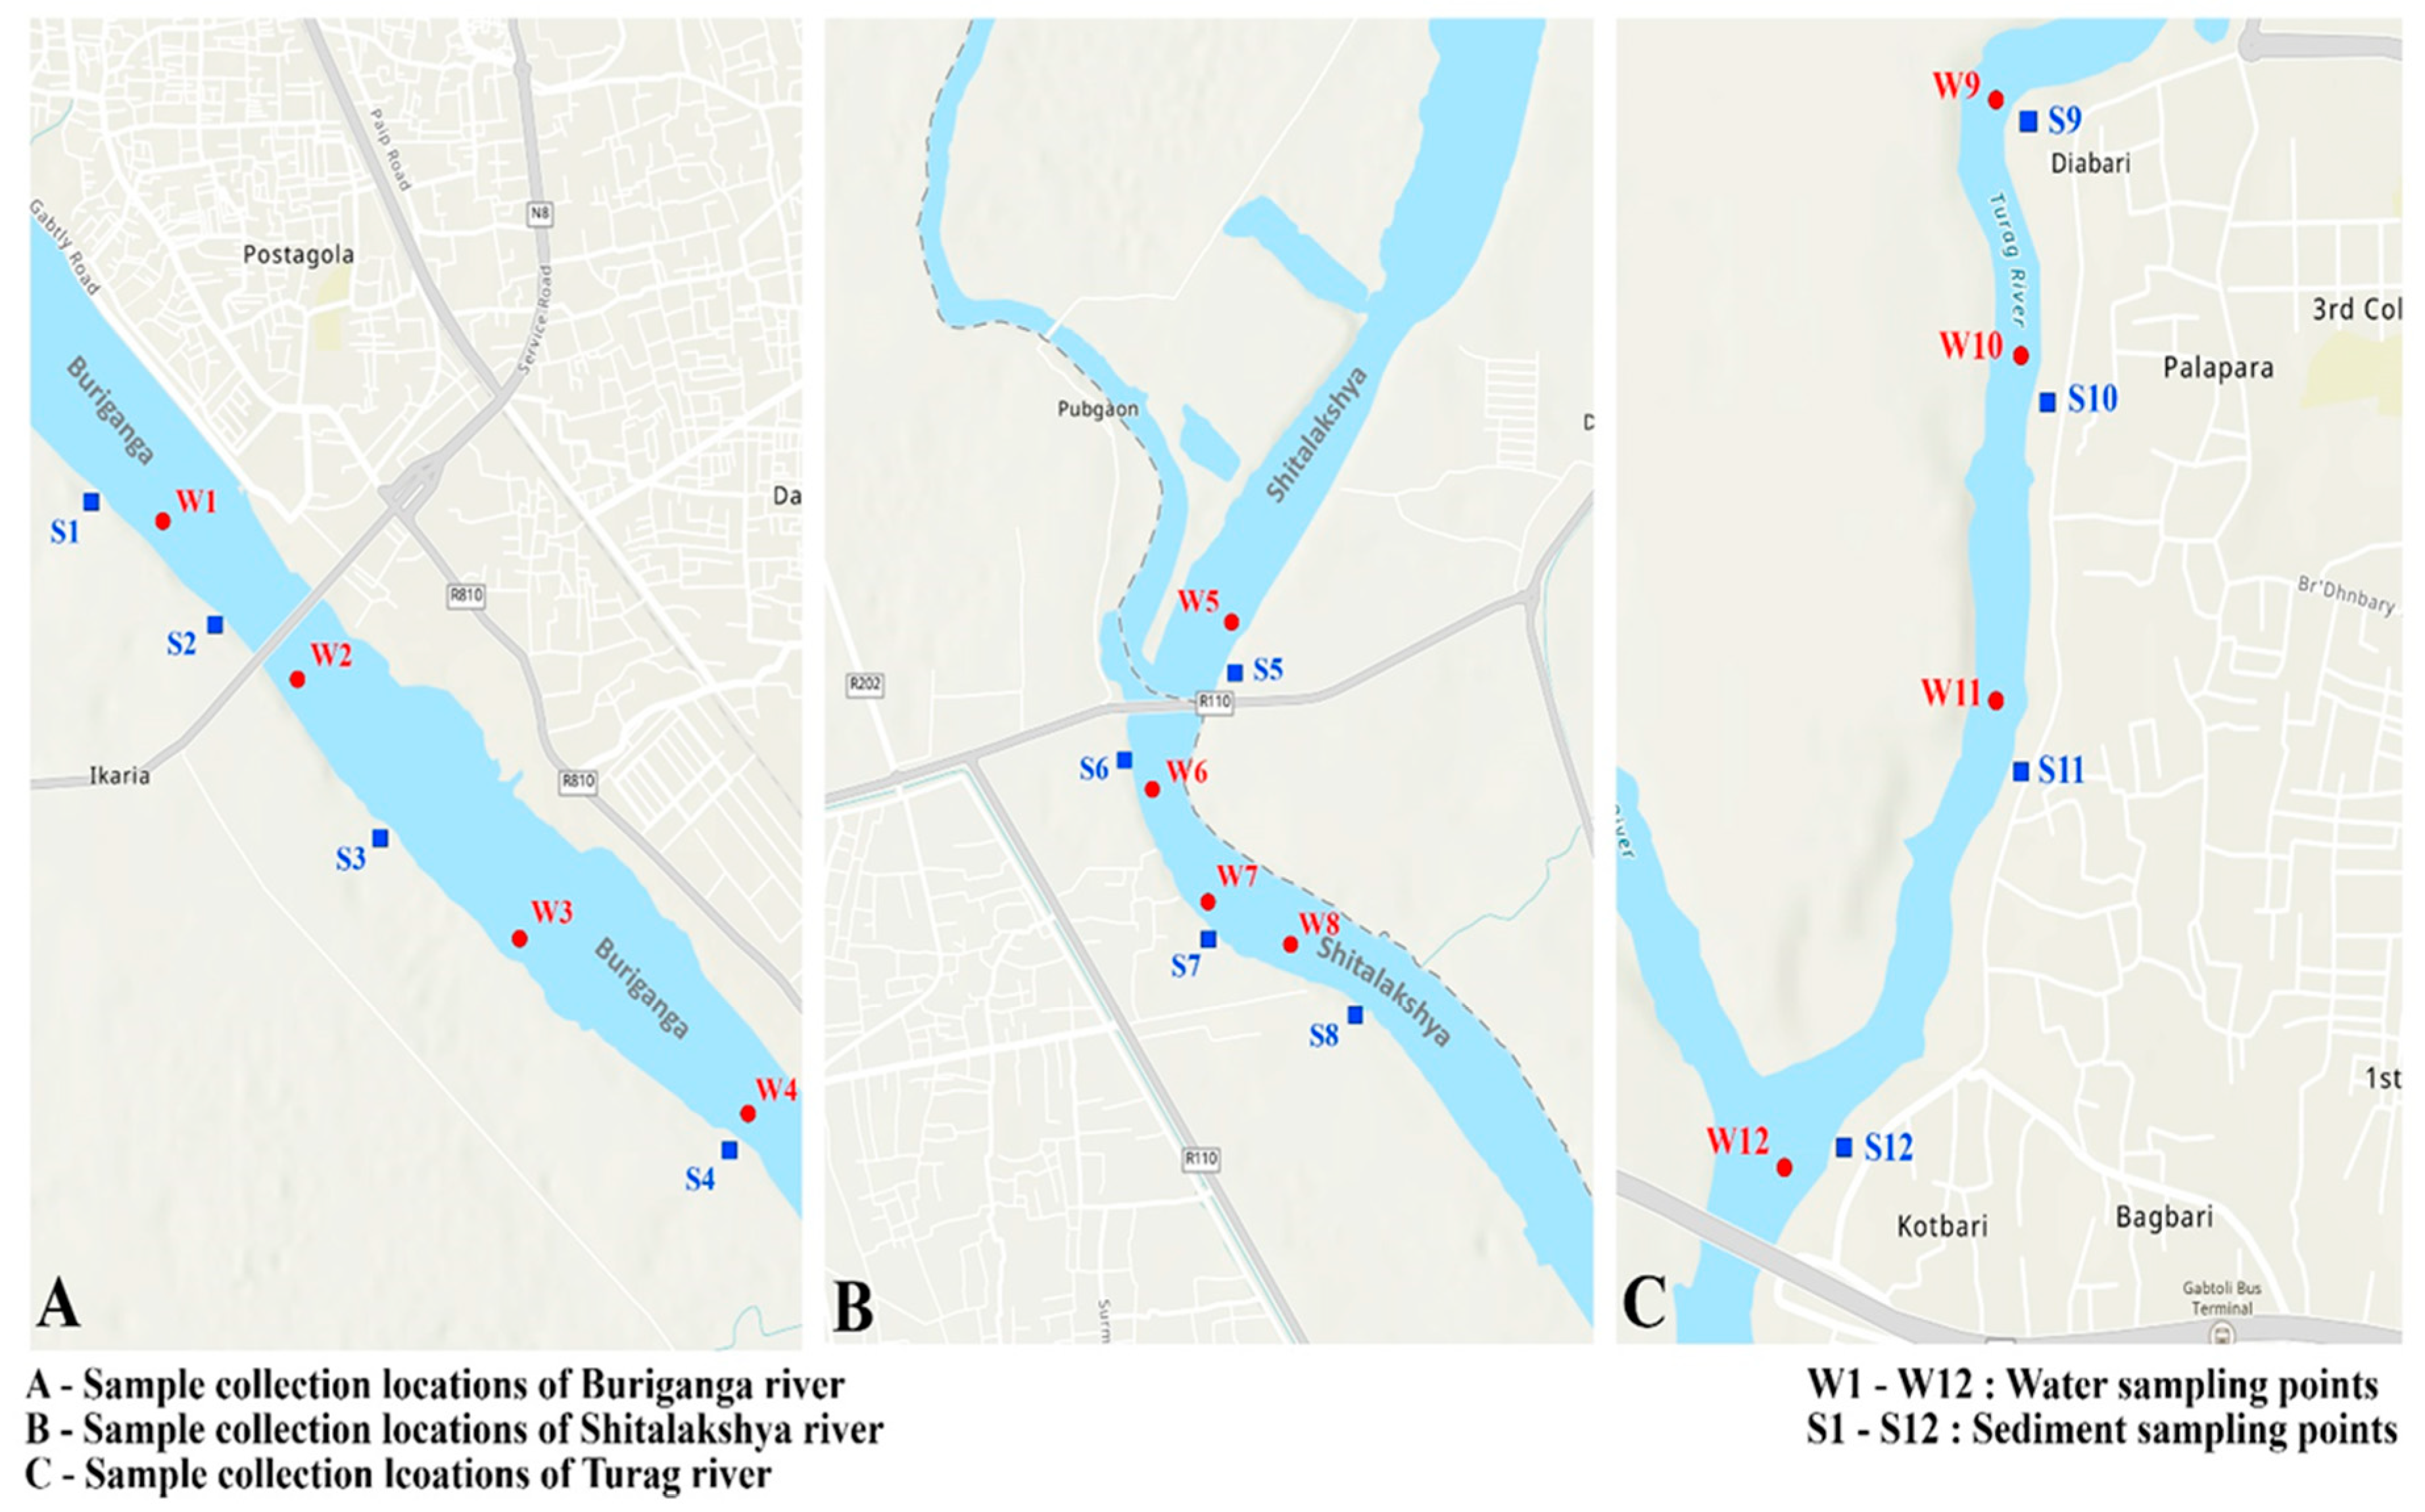
Three main rivers around Dhaka (Buringanga, Shitalakshya, Turag) was considered as primary locations for sampling. Buriganga river flows by the southwest outskirts of Dhaka. Its length is 27 km and its catchment covers an area of approximately 429 km2. It is one of the most polluted rivers in the world.Shitalakshya river is on the eastern side of Dhaka with a length of 110 km and it is a distributary of the Brahmaputra river. Turag river originating from Bangshi river is 62 km long and flows by the western outskirts of Dhaka.
Water samples were collected separately from four points at each location. Water samples were taken using a manta trawl [29,30] (opening: 0.12184 m2) with a manta net mesh size of 50 μm. All the retained particles in the manta net were collected into a glass jar using lab-grade distilled water. For calculating the water volume passing through the net, the flow velocity of water was measured.
Figure 1.
Location of sampling.
Furthermore, for sediment sample collection, four composite samples were collected from four points of each location. As microplastic abundance is higher at a depth of 0 to 5 cm [31,32], sediment samples were collected at a depth of 0 to 5 cm. From the shorelines of Burigana, Shitalakshya & Turag, river sediment samples of 1.602 kg, 1.878 kg & 1.578 kg were collected respectively.
Preparation of Samples
In the laboratory, the water samples were filtered through a stainless steel sieve with a mesh size of 5 mm. Then the water samples were treated with 30% hydrogen peroxide (H2O2) with an iron catalyst at 50˚C for 1 hour [33] to digest the organic matter from the sample. Floatation of Microplastics was done by density separation using sodium chloride salt solution (NaCl) (density of the saturated solution 1.2 g/cm3) for 24 hours [34]. Larger floating particles were extracted into a petri dish after visual inspection using metal forceps and all smaller particles were collected via filtration through 50 μm filter paper.
Sediment samples were oven dried at 90˚C for 24 hours for dry mass calculation [35]. After determining the dry mass of each sample, the sediment samples were disaggregated using deionized water and were washed through stainless steel sieve of 5 mm with deionized water. All of the particles remaining on the sieve were collected in a glass bowl again using deionized water. To increase the density of the solution by saturating the solution with sodium chloride (NaCl) (density of the saturated solution 1.2 g/cm3) so that the Micro-plastics particles can float in the solution. The bowl was covered with aluminum foil so that no airborne microplastics doesn’t hinder the sample and kept for 24 hours for settling of the sediment grains and floatation of the microplastics particles. Larger particles were extracted using metal forceps after visual inspection while for extracting the smaller particles the solution was passed through a sieve with a mesh size of 50 μm. The retaining particles on the sieve were collected in a beaker using deionized water. This process was done three times to reduce the chance of losing any MP particles. To remove organic matter 30% Hydrogen Peroxide (H2O2) with iron (Fe) catalyst was heated at 50˚C for 1 hr to digest organic matter [33]
Identification of Microplastic in Water and Sediment Sample
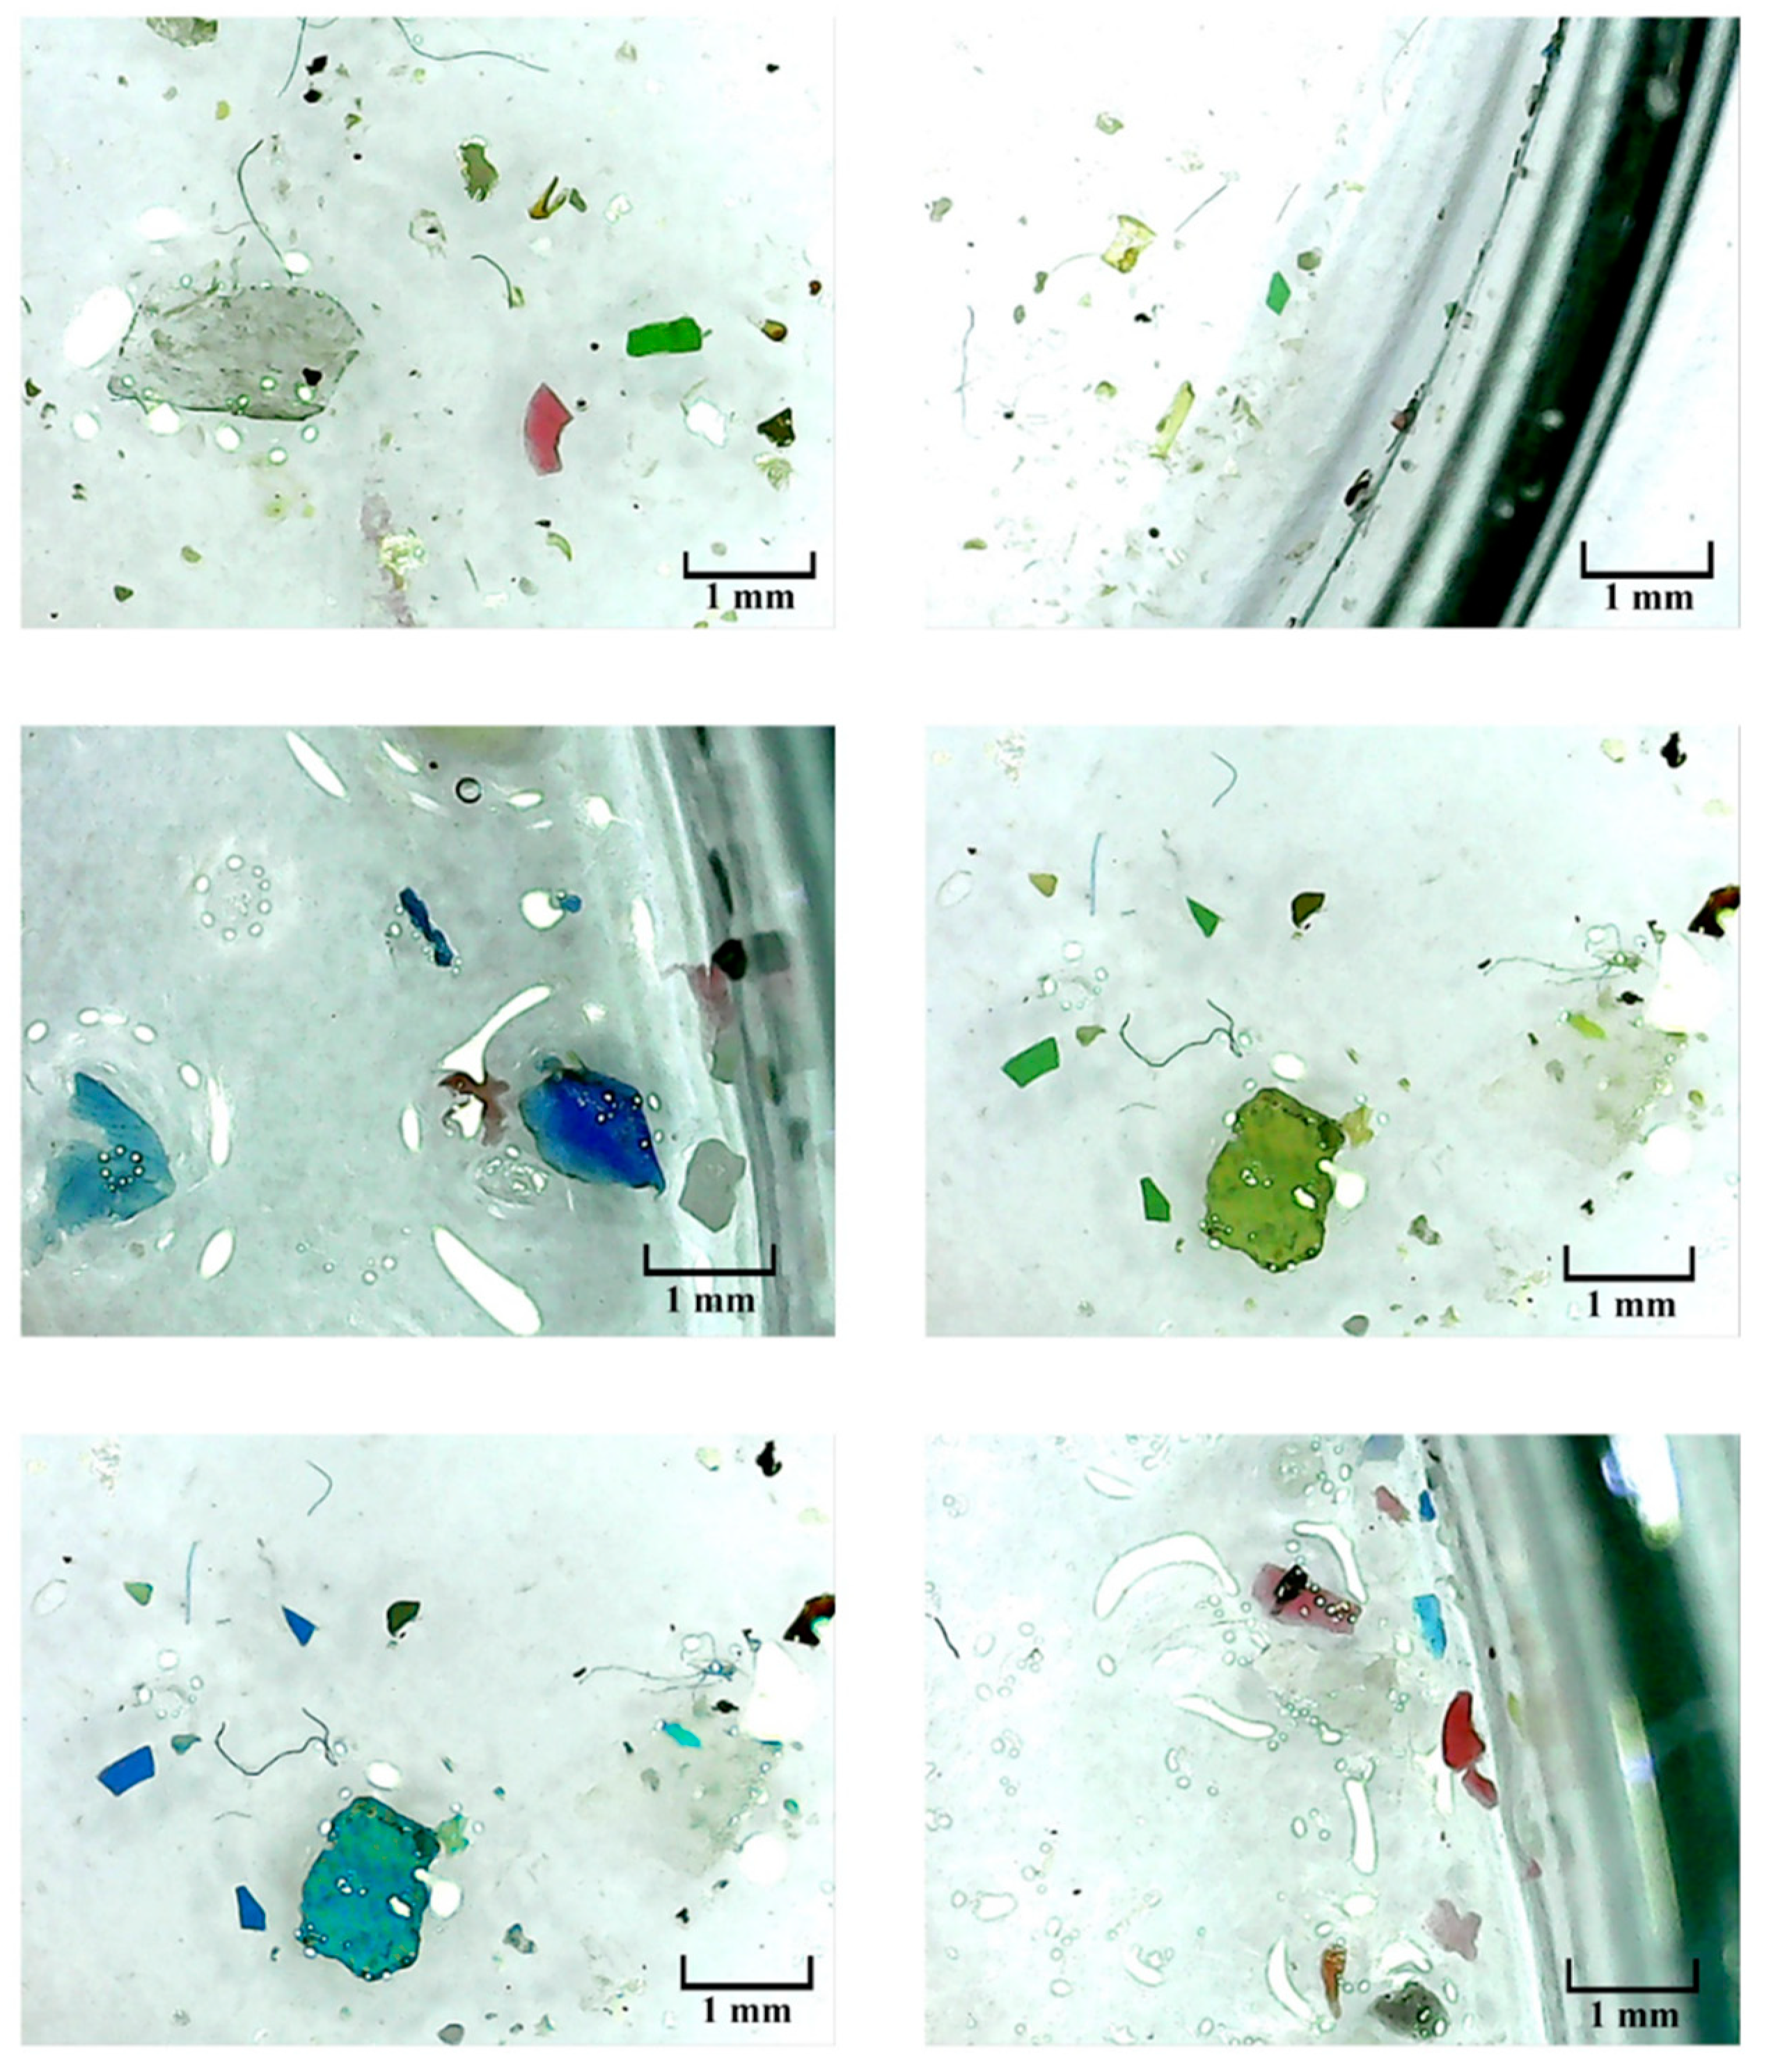
Visual identification of microplastic from the extracted sample was done using a digital microscope with 1000x magnification. The device was also used to determine the shapes, sizes, and colors of the presumable microplastic particles [36]. Potential microplastic particles of different shapes were identified including fibers, films, foams, and fragments. The most common type of particle was found to be fibers and they were uniform in diameter for the whole fiber length with a smooth surface. The visually identified particles were further analyzed by Fourier transform infrared spectroscopy (FTIR) to identify their polymer types [37,38].
Figure 2.
Photos captured during the identification of microplastic using digital microscope.
Data Analysis
IBM SPSS statistics 26, MS Excel, and OriginPro software were used for the processing and presentation of data. ANOVA test with post hoc Tukey test was conducted to find which site was significantly different from the other. Pearson correlation test was used to determine the correlation between Micro-plastic level and landscape usage or population.
Result and Discussion
In Buriganga, a total of 2931 microplastic particles were found in water samples with a concentration of 3.654 items/liters, and a total of 345 microplastic particles were found in sediment samples with a concentration of 43.125 items/kg. In Shitalakshya, a total of 2421 microplastic particles were found with a concentration of 3.011 particles/liters, and a total of 279 microplastic particles were found in sediment samples with a concentration of 34.875 items /kg. In Turag, a total of 1639 microplastic particles were found with a concentration of 2.051 items/liters, and a total of 143 microplastic particles were found in sediment samples with a concentration of 17.875 items/kg.

Table 1.
Microplastics level of water and sediment sample at each sampling site.
| Location | Water Sample | Sediment Sample | ||
| Sampling Points | Microplastics count | Mean ± SD | ||
| Buriganga River | W1 | 402 | 733 ± 207 | 345 |
| W2 | 856 | |||
| W3 | 724 | |||
| W4 | 949 | |||
| Shitalakshya River | W5 | 719 | 605 ± 127 | 289 |
| W6 | 699 | |||
| W7 | 398 | |||
| W8 | 605 | |||
| Turag River | W9 | 383 | 410 ± 19 | 143 |
| W10 | 404 | |||
| W11 | 433 | |||
| W12 | 419 | |||
The water sample size for each sampling point was 200 liters and the sediment sample size for each point was 2 kg.
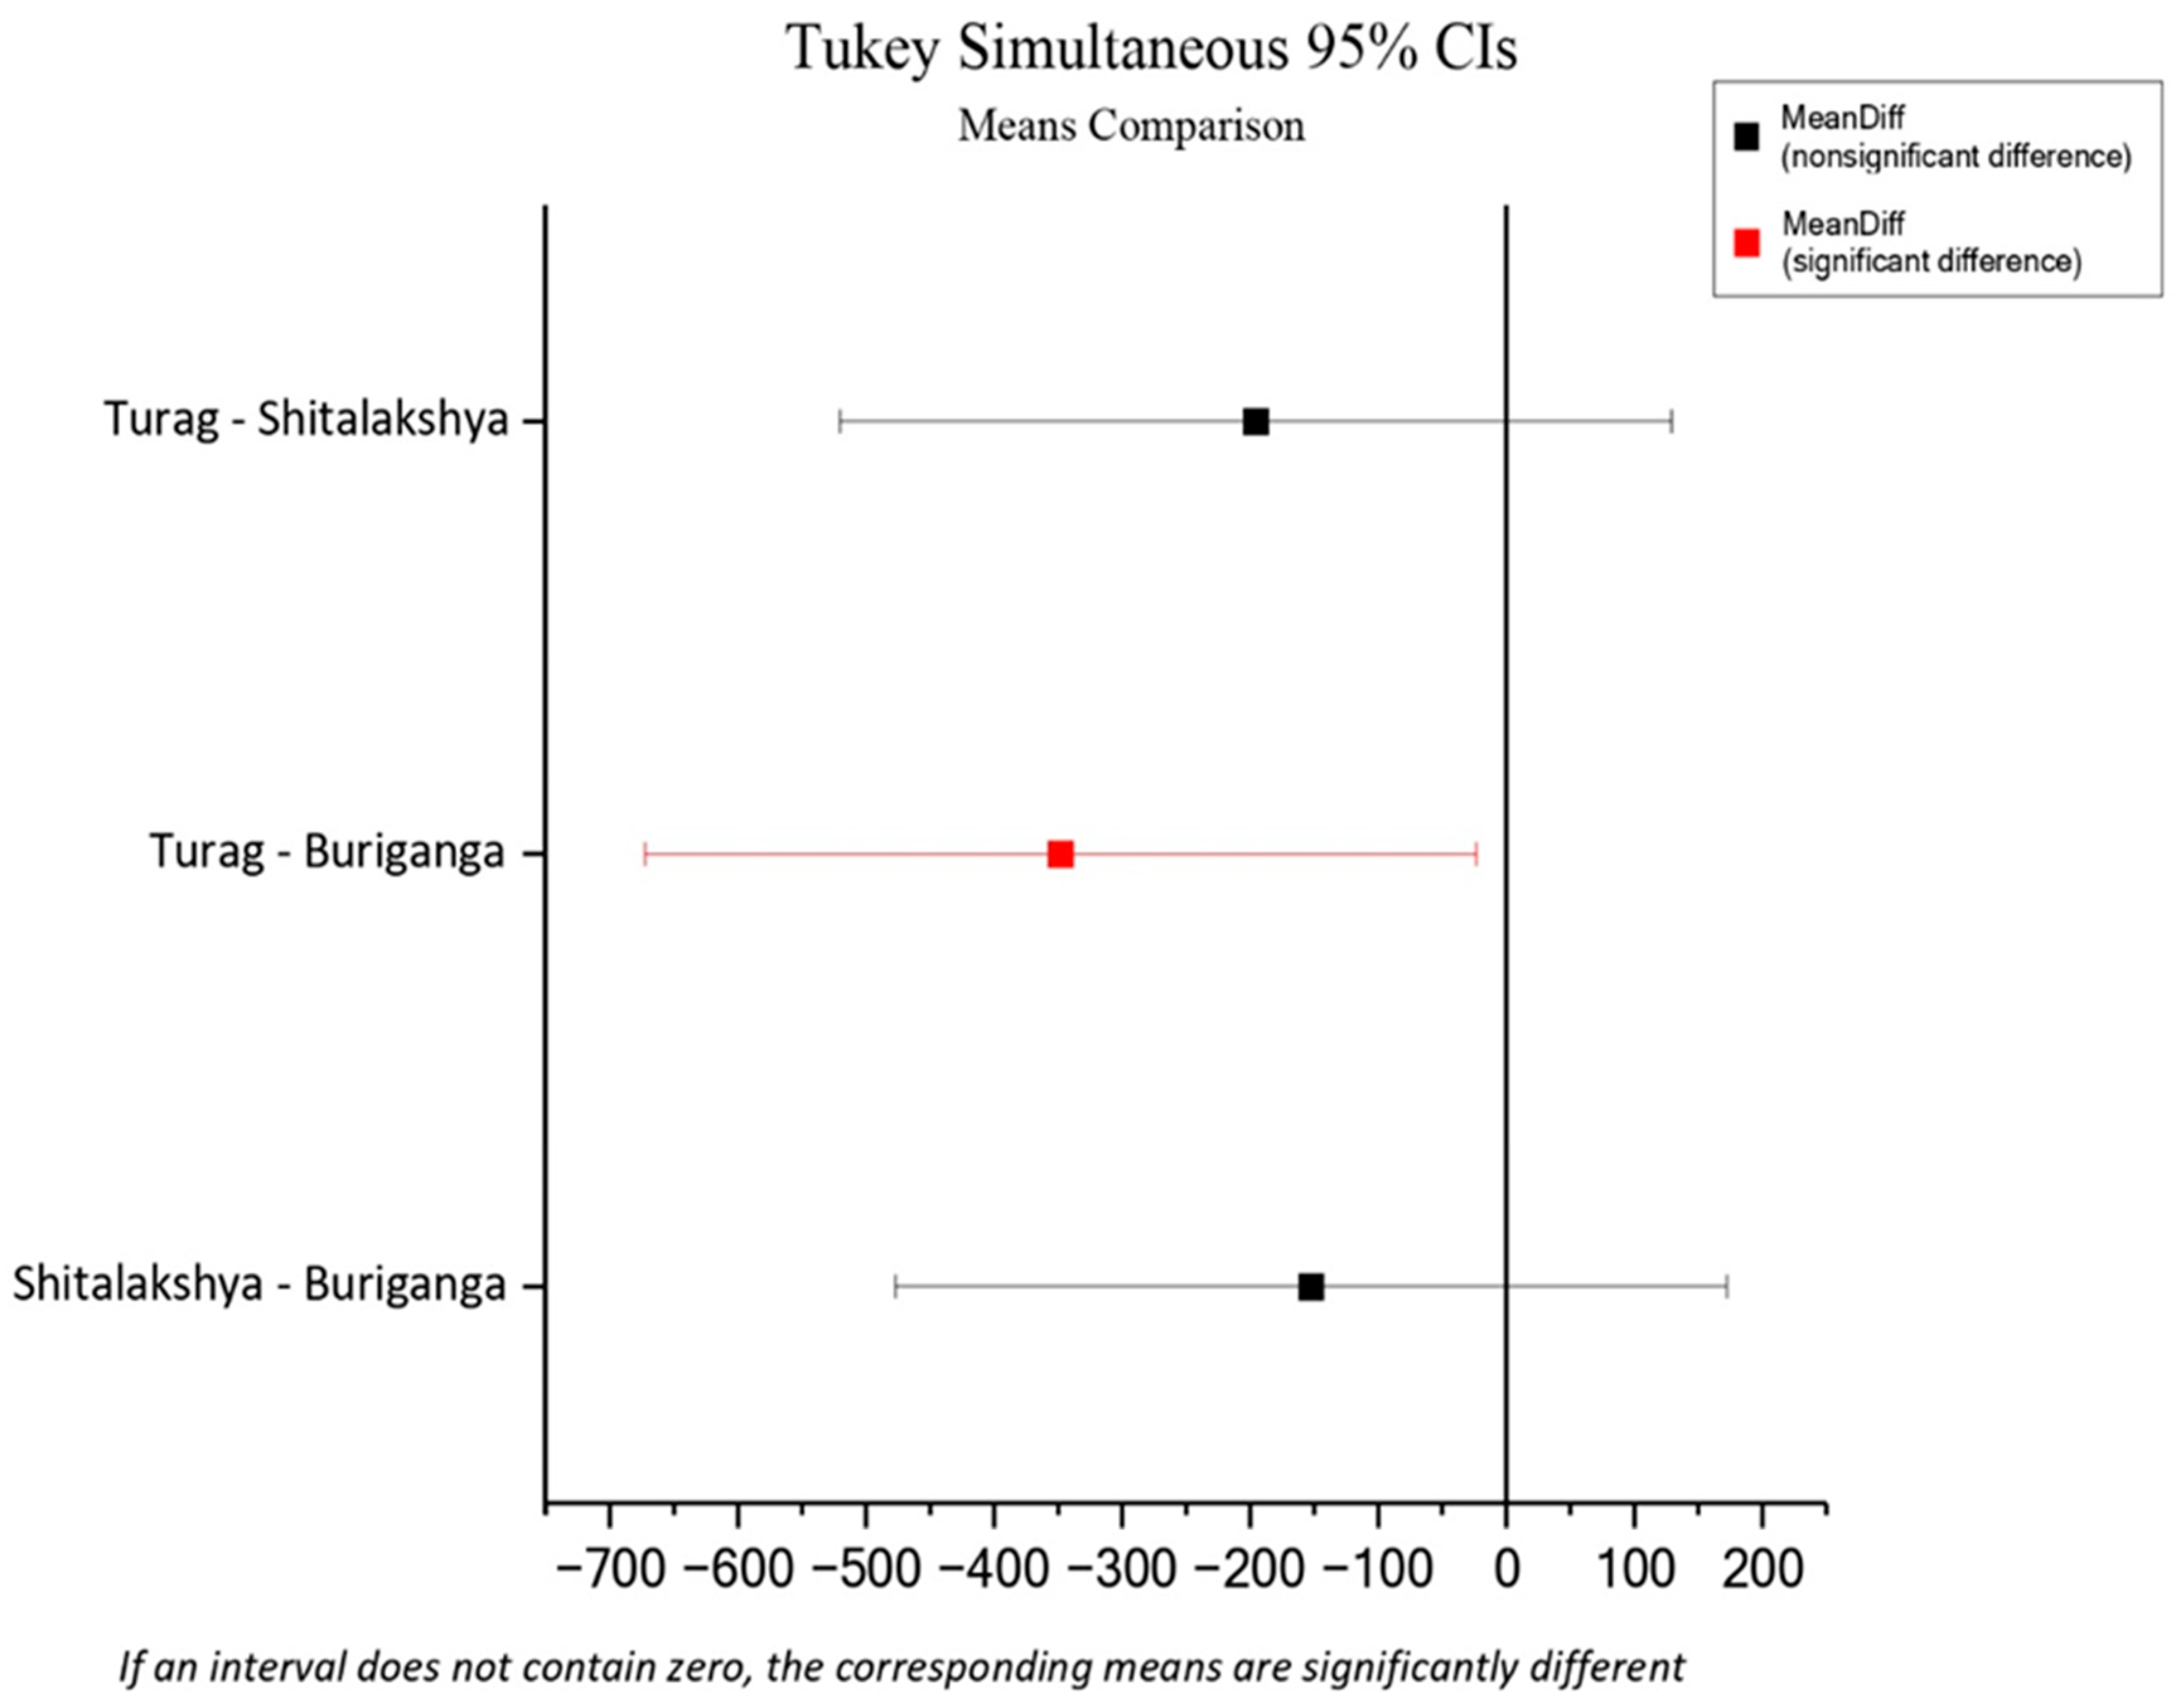
Between the water sample microplastics and the sediment sample microplastics, a Pearson correlation coefficient of 0.997 was found at the 0.05 level of significance ( p = 0.049 < 0.05 ). This means that the number of microplastics in the water and sediment of each location are correlated. ANOVA test showed an overall significant difference between the microplastics levels of water samples from different locations (p = 0.0441<0.05). Furthermore, Tukey’s test showed that there were no statistically significant differences in microplastics levels of water samples between Buriganga and Shitalakshya (p = 0.4239>0.05), Shitalakshya and Turag (p = 0.2637>0.05) but the microplastic levels of water samples from Buriganga and Turag showed a statistically significant difference at the 95% confidence level (p = 0.0365<0.05).
Figure 3.
Means comparison between locations (ANOVA).
Morphological Comparison
By Size of Microplastics
The combined distribution of both water and sediment microplastics of each location by their size is reported in figure 4.8. Sizes of microplastics were divided into six categories: <0.5, 0.5-1, 1-2, 2-3, 3-4, and 4-5 mm. It was observed that microplastics of size less than 1 mm constituted 67.629% of all microplastics. The microplastic count decreases as the size range increases. The least percentage of Microplastics was observed in the range of 4 – 5 mm.
Figure 4.
Combined distribution of both water and sediment microplastics of each location by their size.
Figure 4.
Combined distribution of both water and sediment microplastics of each location by their size.
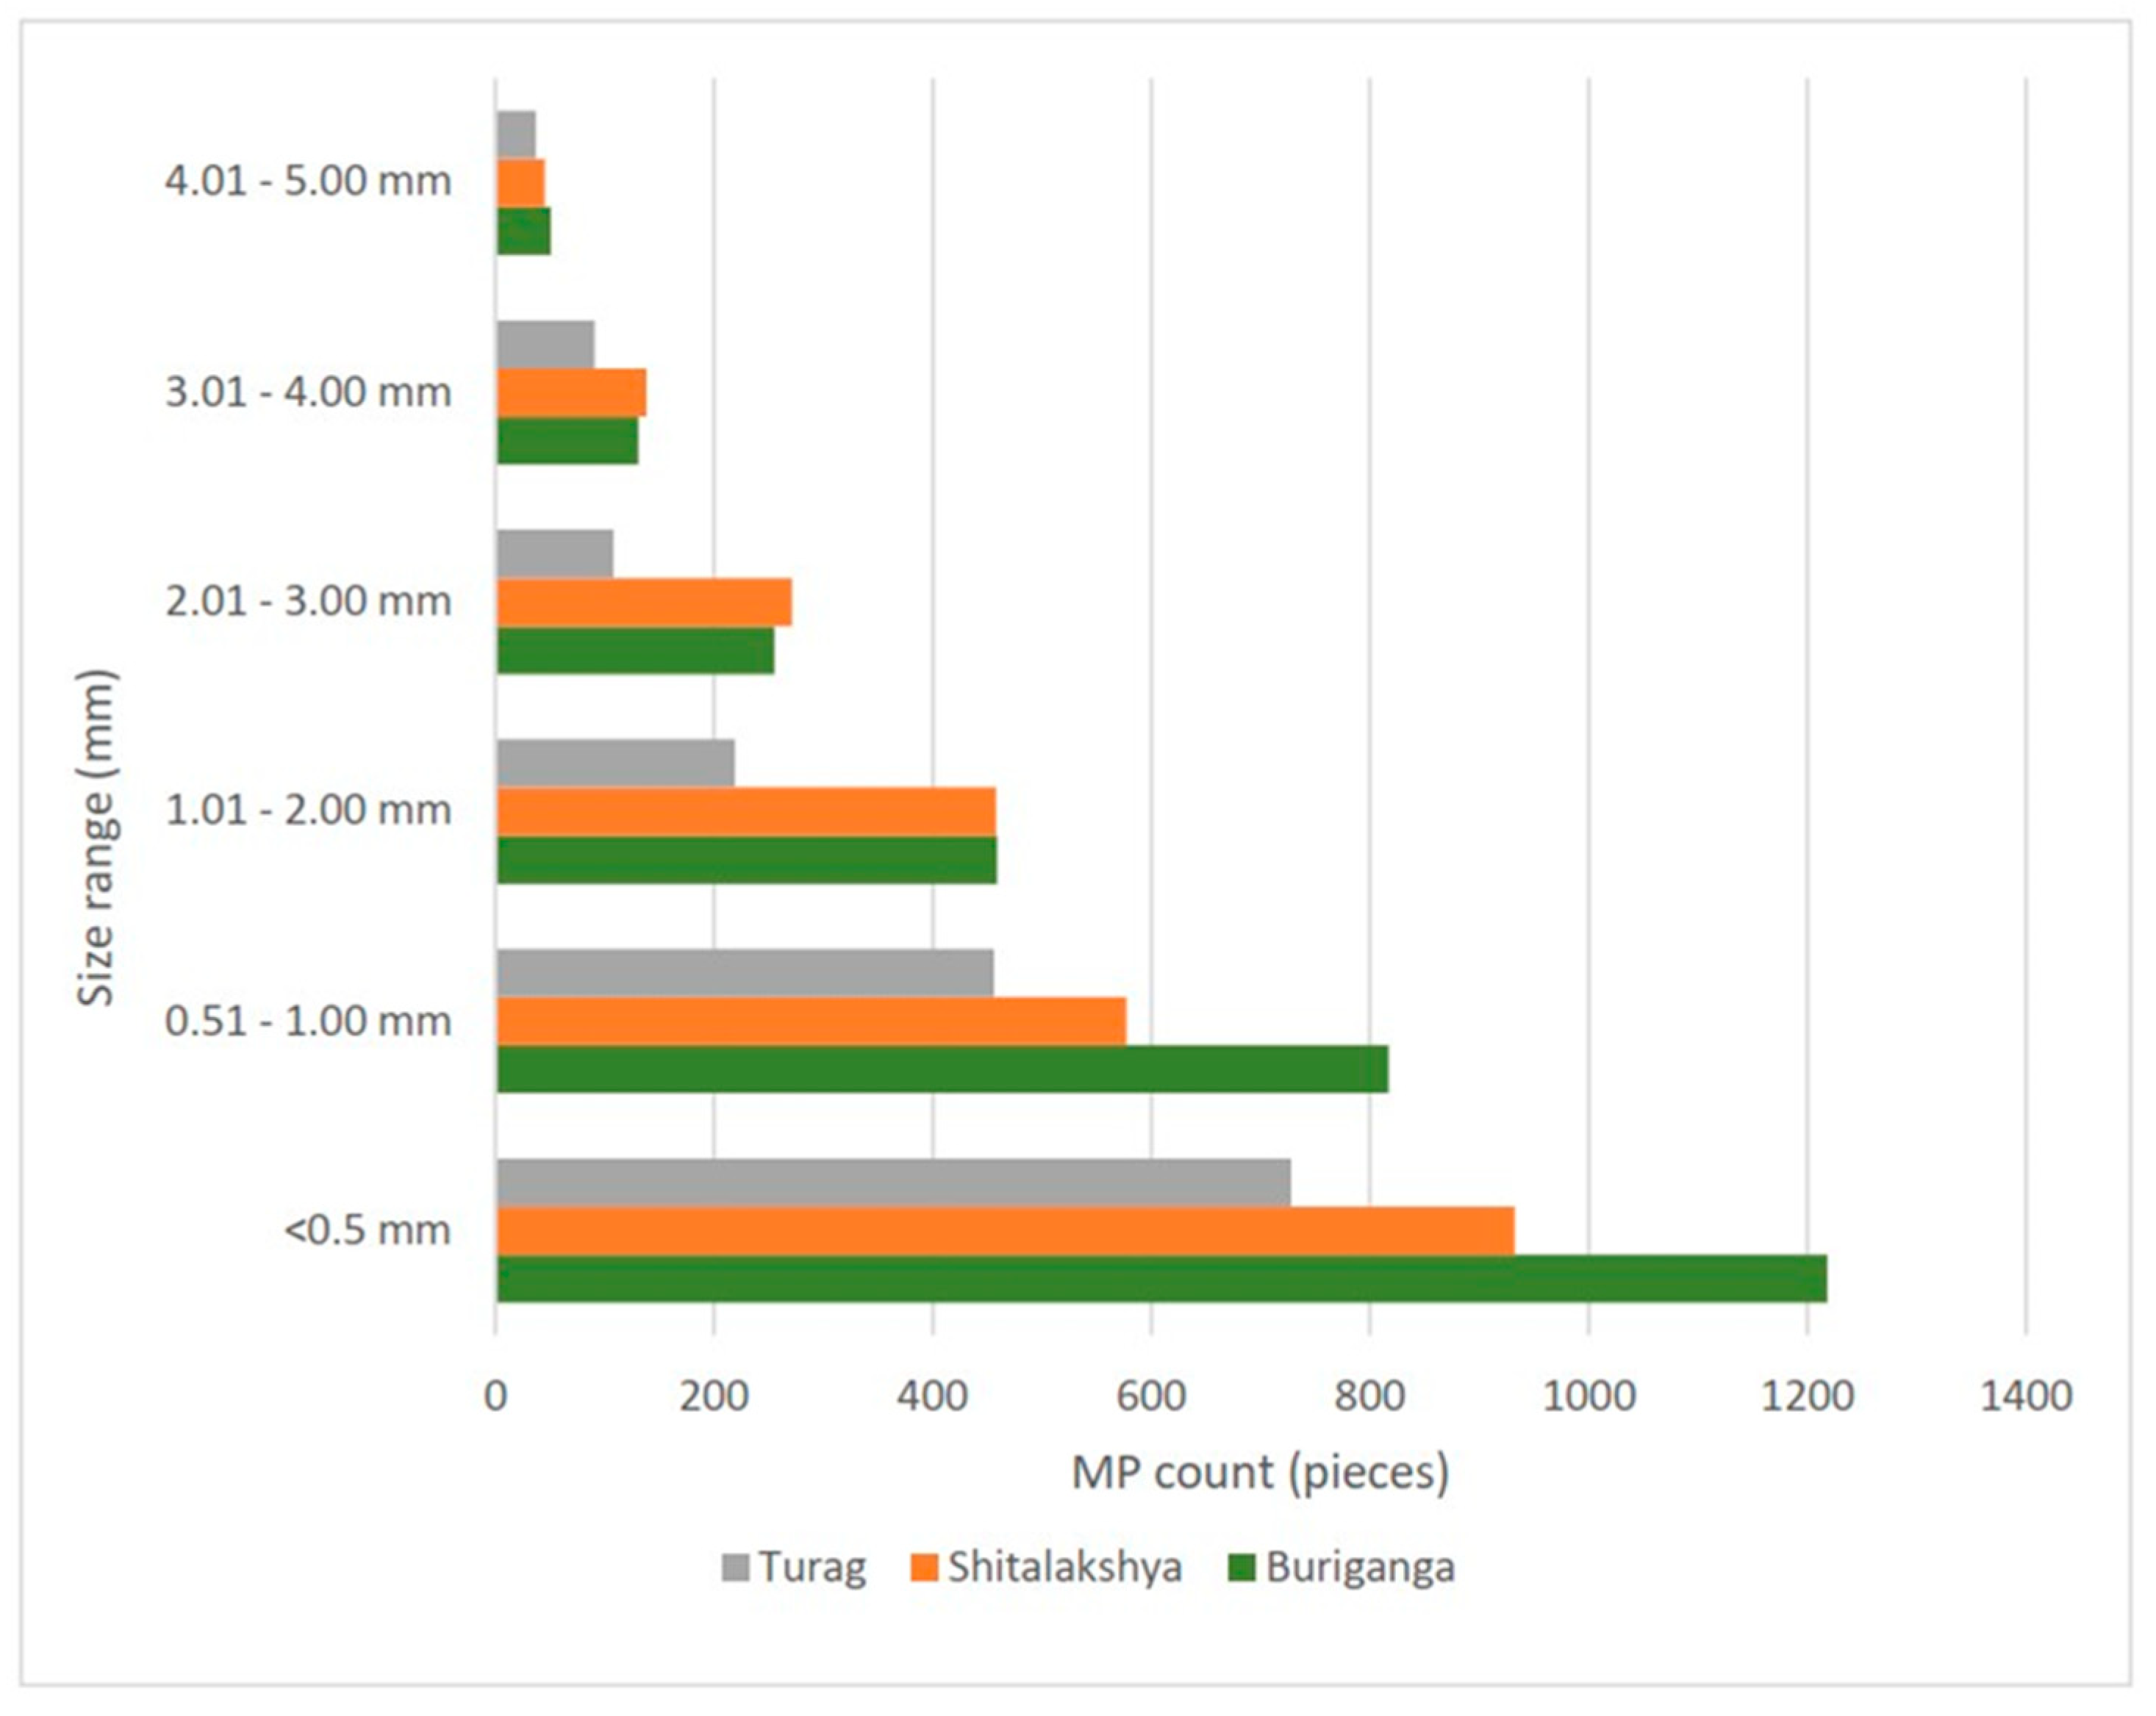
Figure 5.
Combined mean size distribution and standard deviation of all locations.
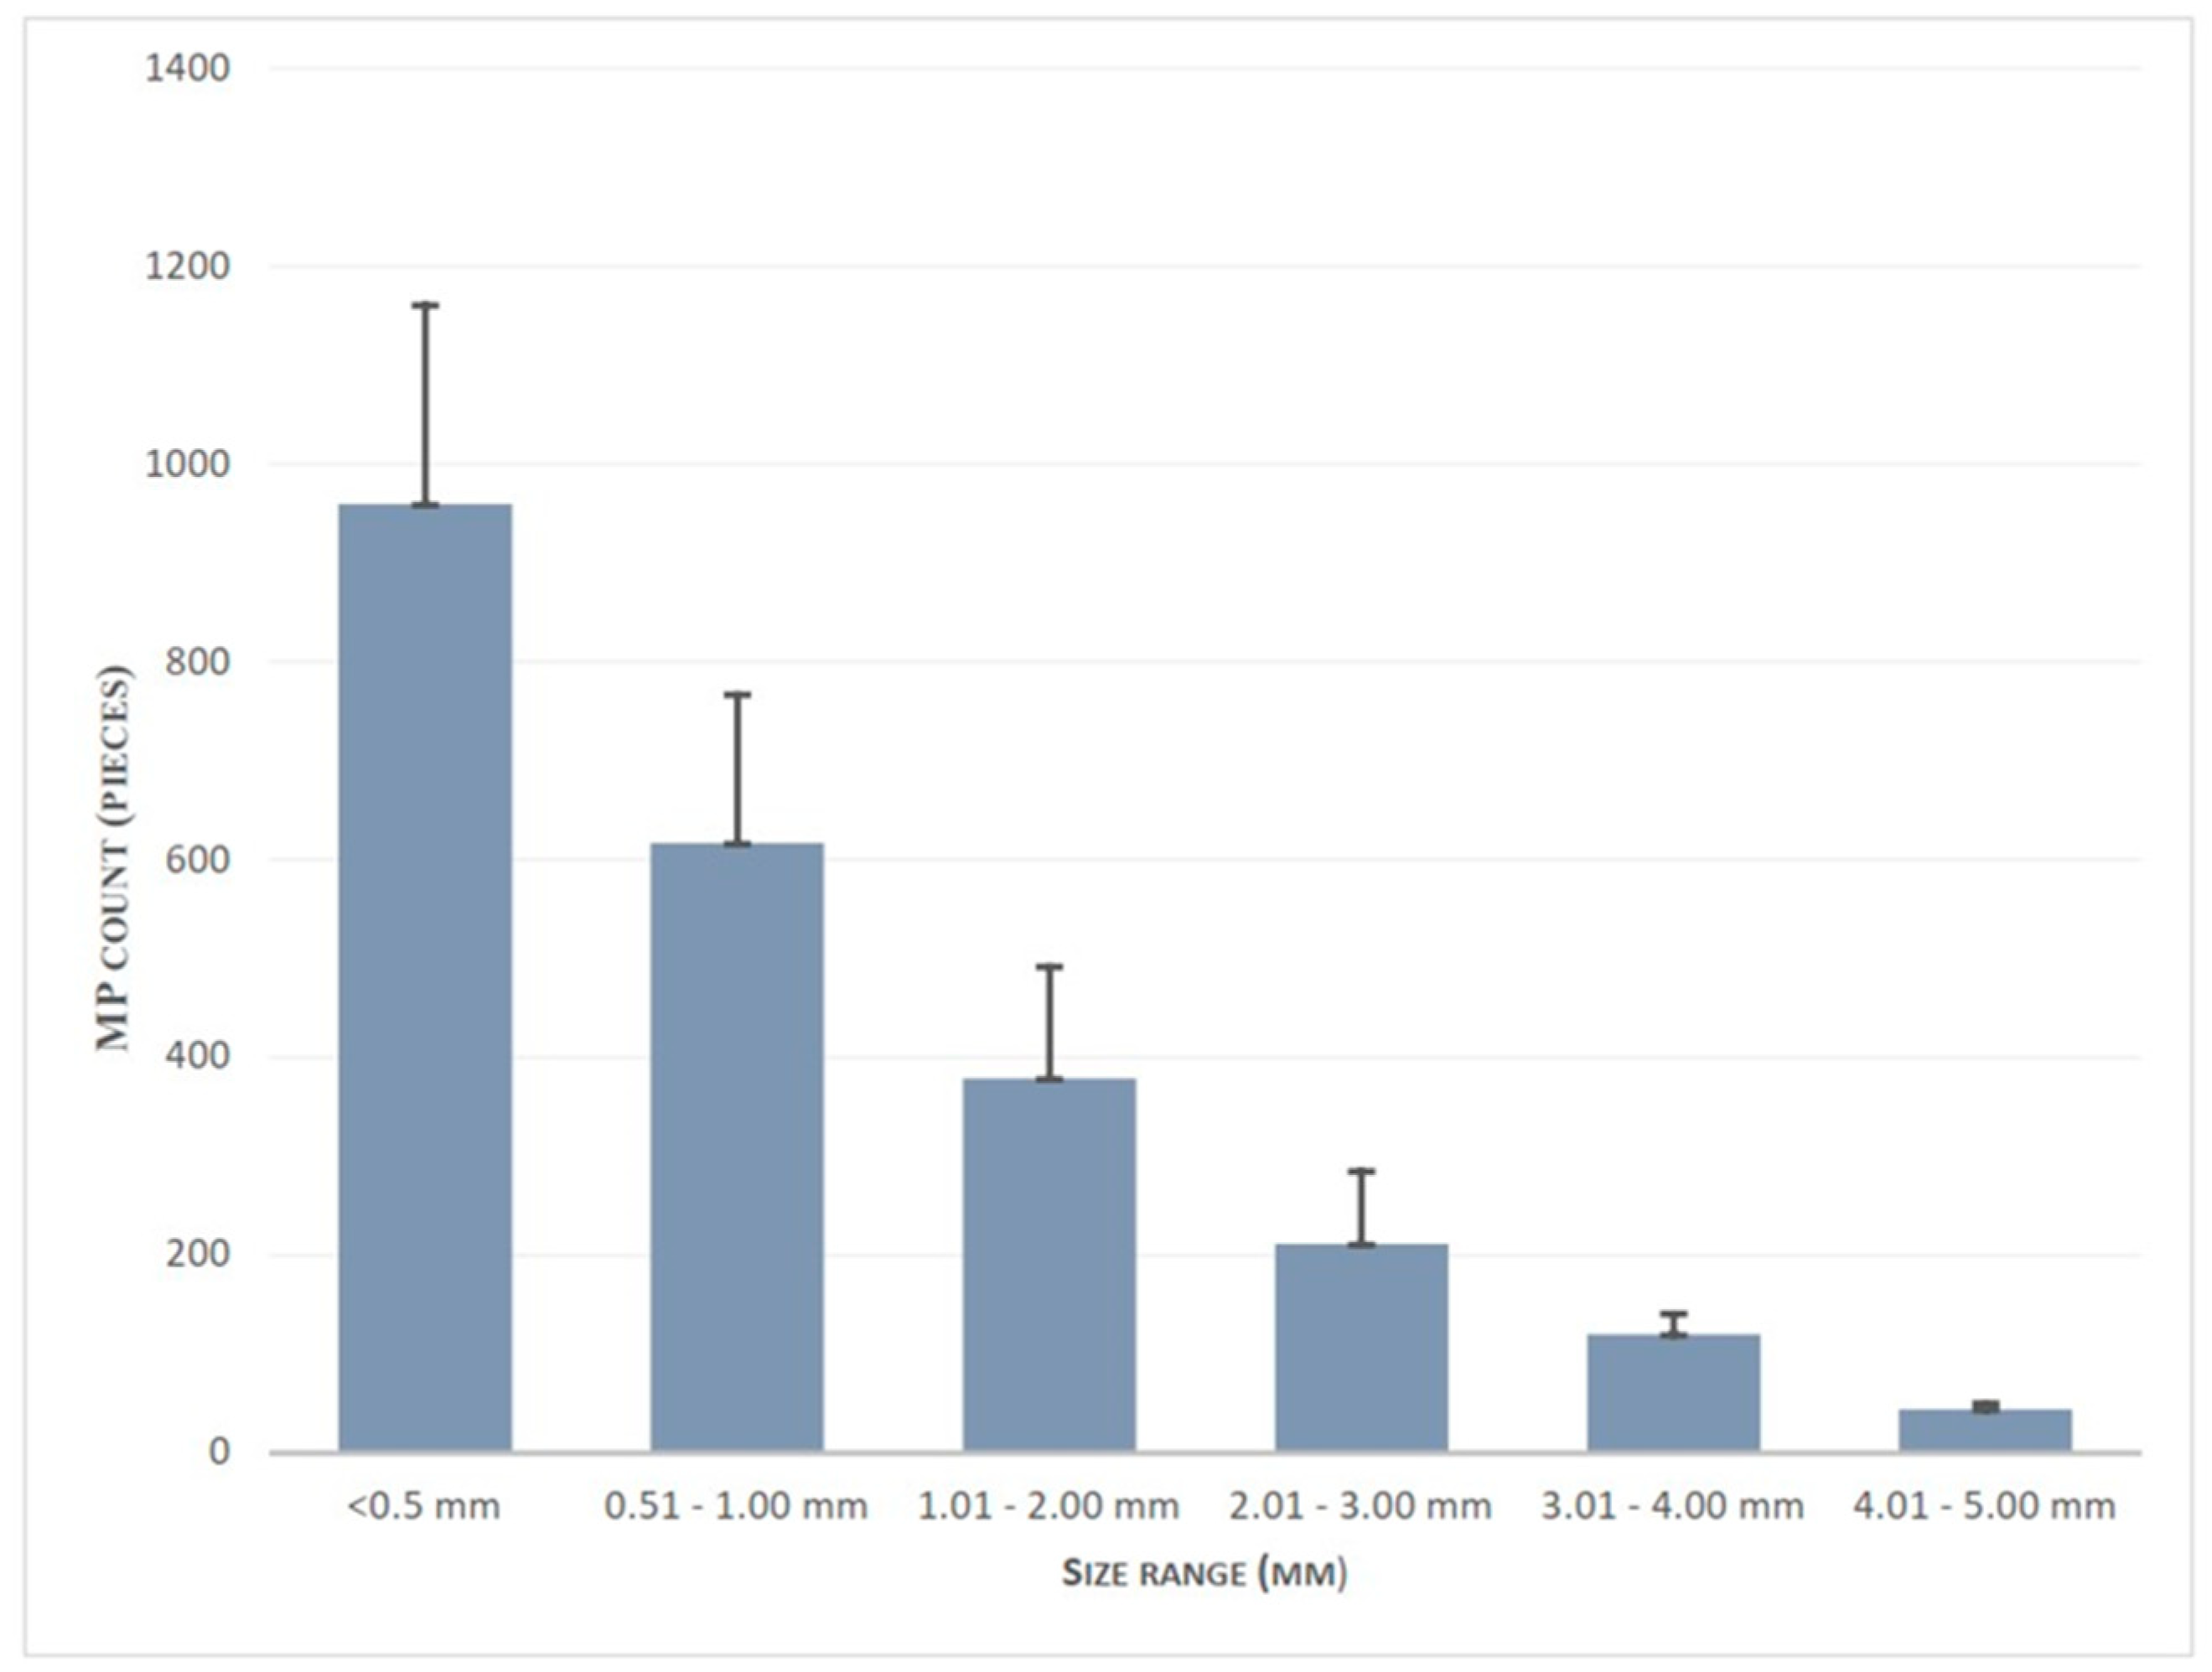
The combined size distribution and standard deviation of all locations are shown in figure 4.9. It is evident that as the size range increases, there is a corresponding decrease in the standard deviation, indicating that larger size range data exhibit less dispersion. This finding provides more evidence that larger microplastics are less frequently observed across various locations and sample types.
By Shape Type and Color of Microplastics
The percentage of shape type in each location and sample type are visualized in figure 4.10. From there it can be seen that the water sample of each location contains a higher percentage of fibrous microplastics. This finding echoes many previous studies(Feng et al., 2021; L. Hu et al., 2018; Lin et al., 2018; W. Luo et al., 2019) where a higher percentage of fibrous microplastics were reported as well. On average fibrous microplastics accounted for 58% of all Microplastics found in water samples
Figure 6.
Percent abundance of microplastics type, (A) Water Sample, (B) Sediment Sample.
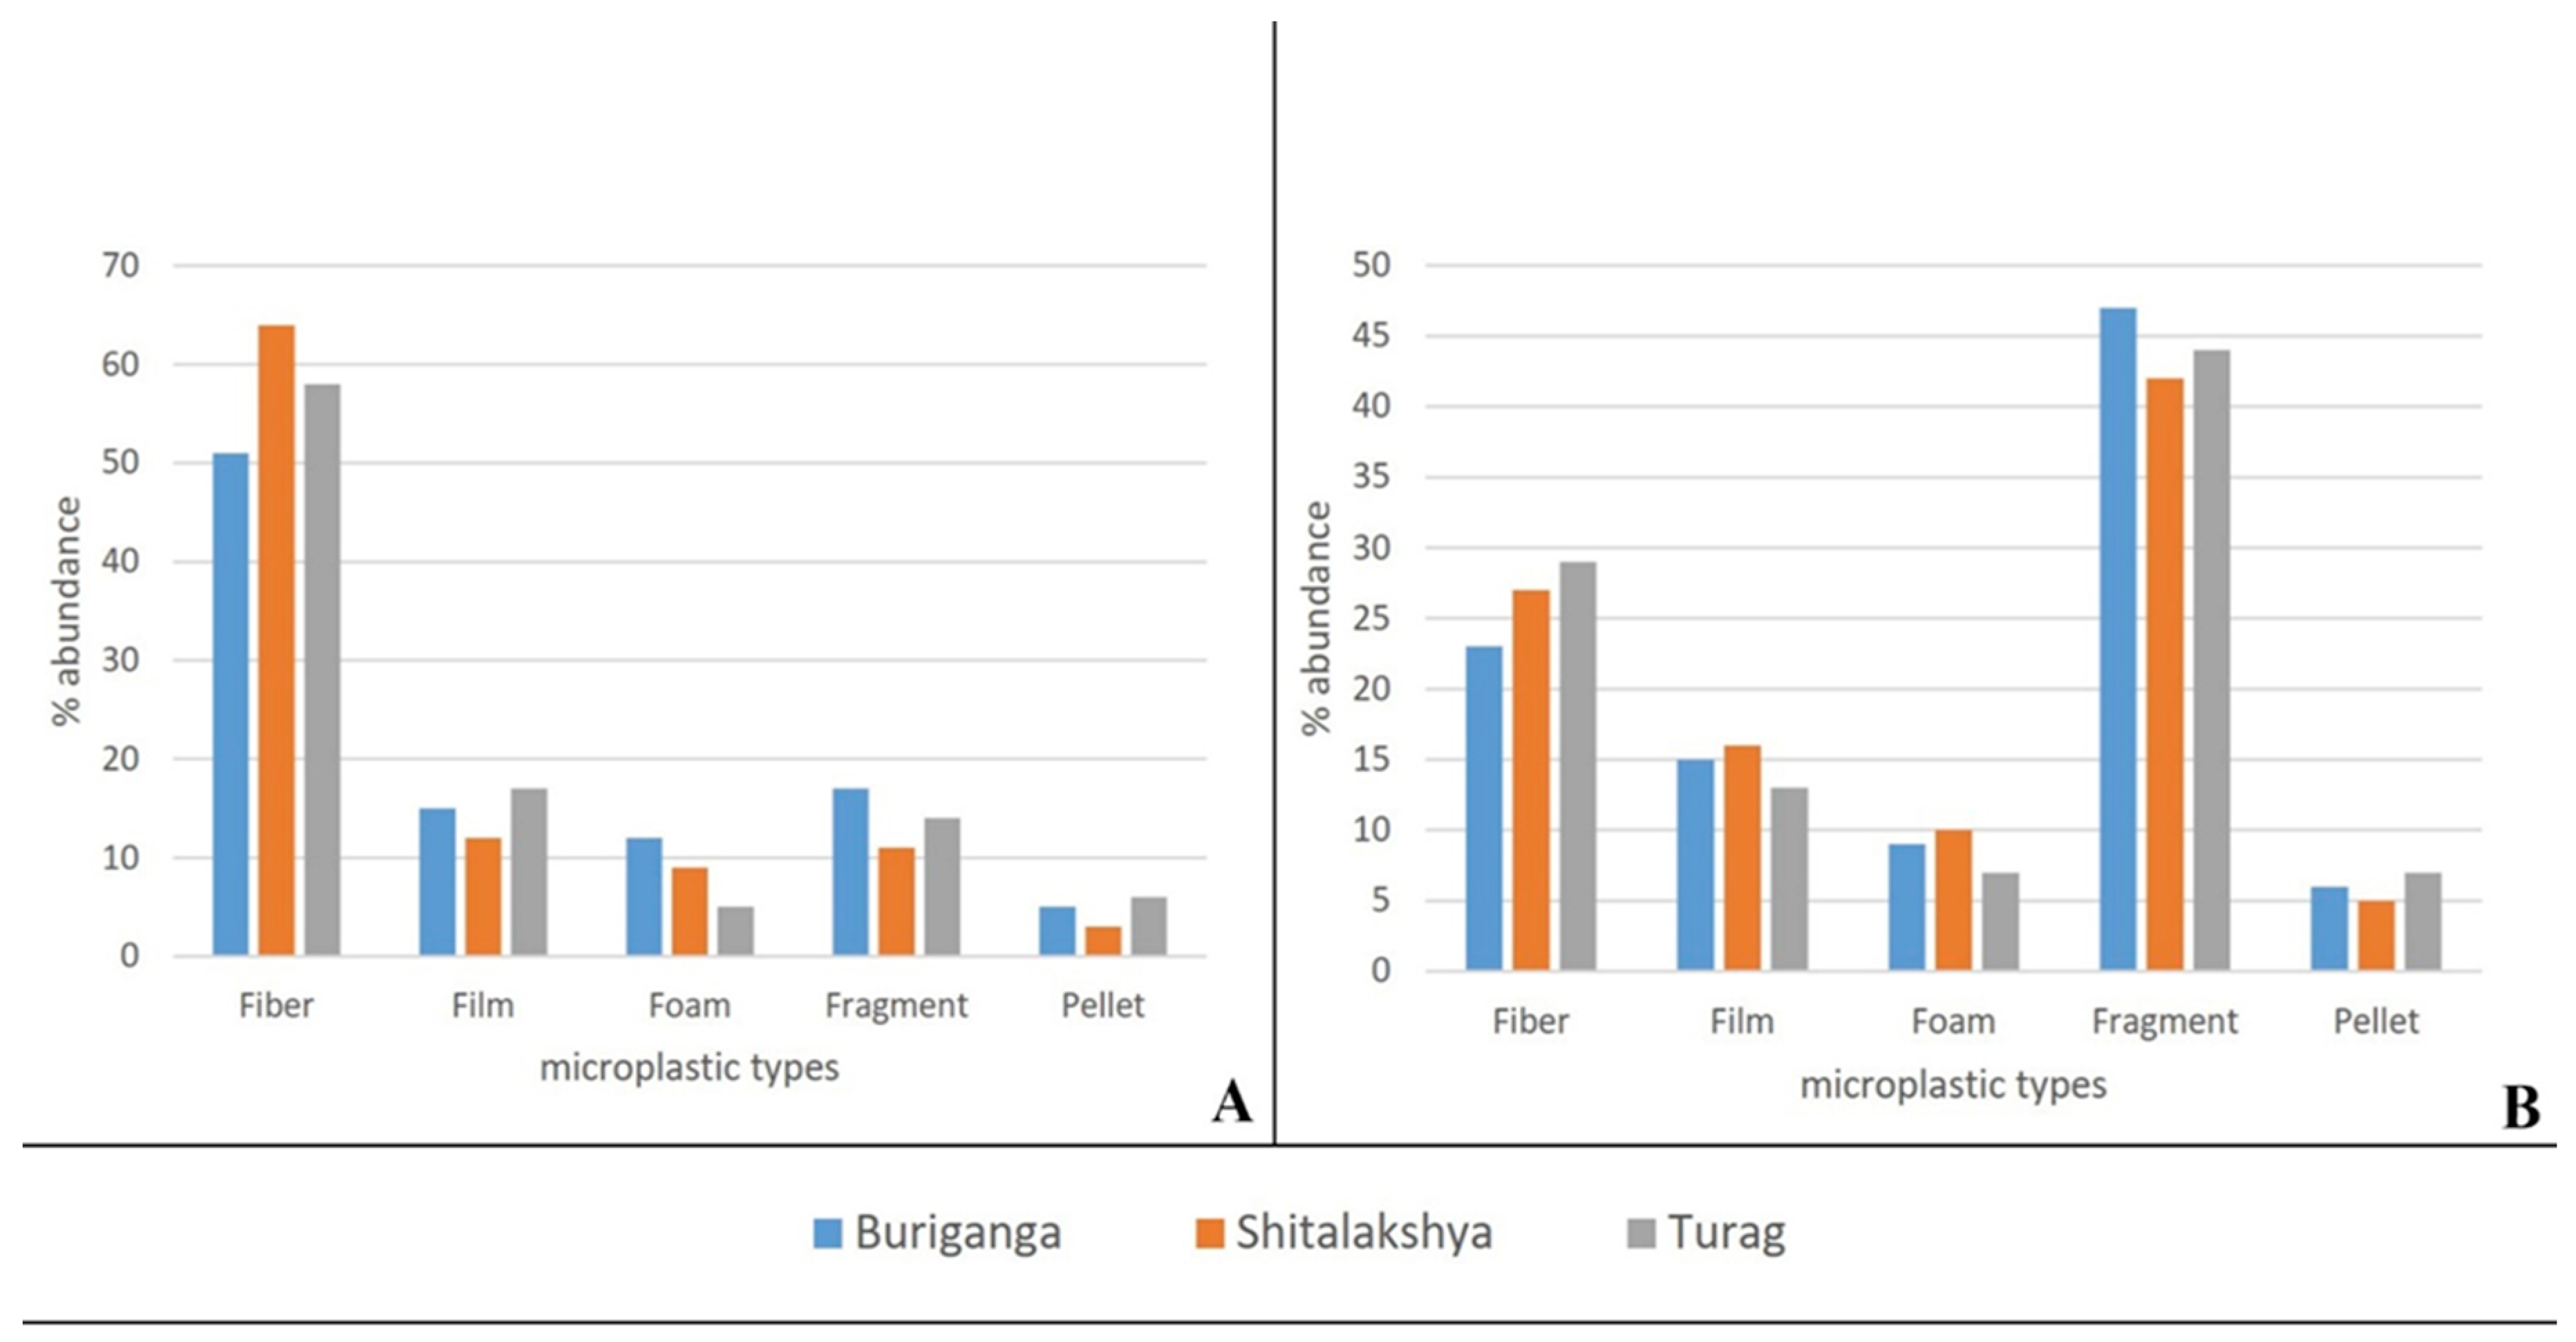
On the contrary, Fragments were the dominant type in sediment samples of all locations. On average 44% of all microplastics found in sediment samples were fragment type. This finding conforms with many previous studies(Abidli et al., 2018; Jian et al., 2020) where fragments were dominant in sediment samples.
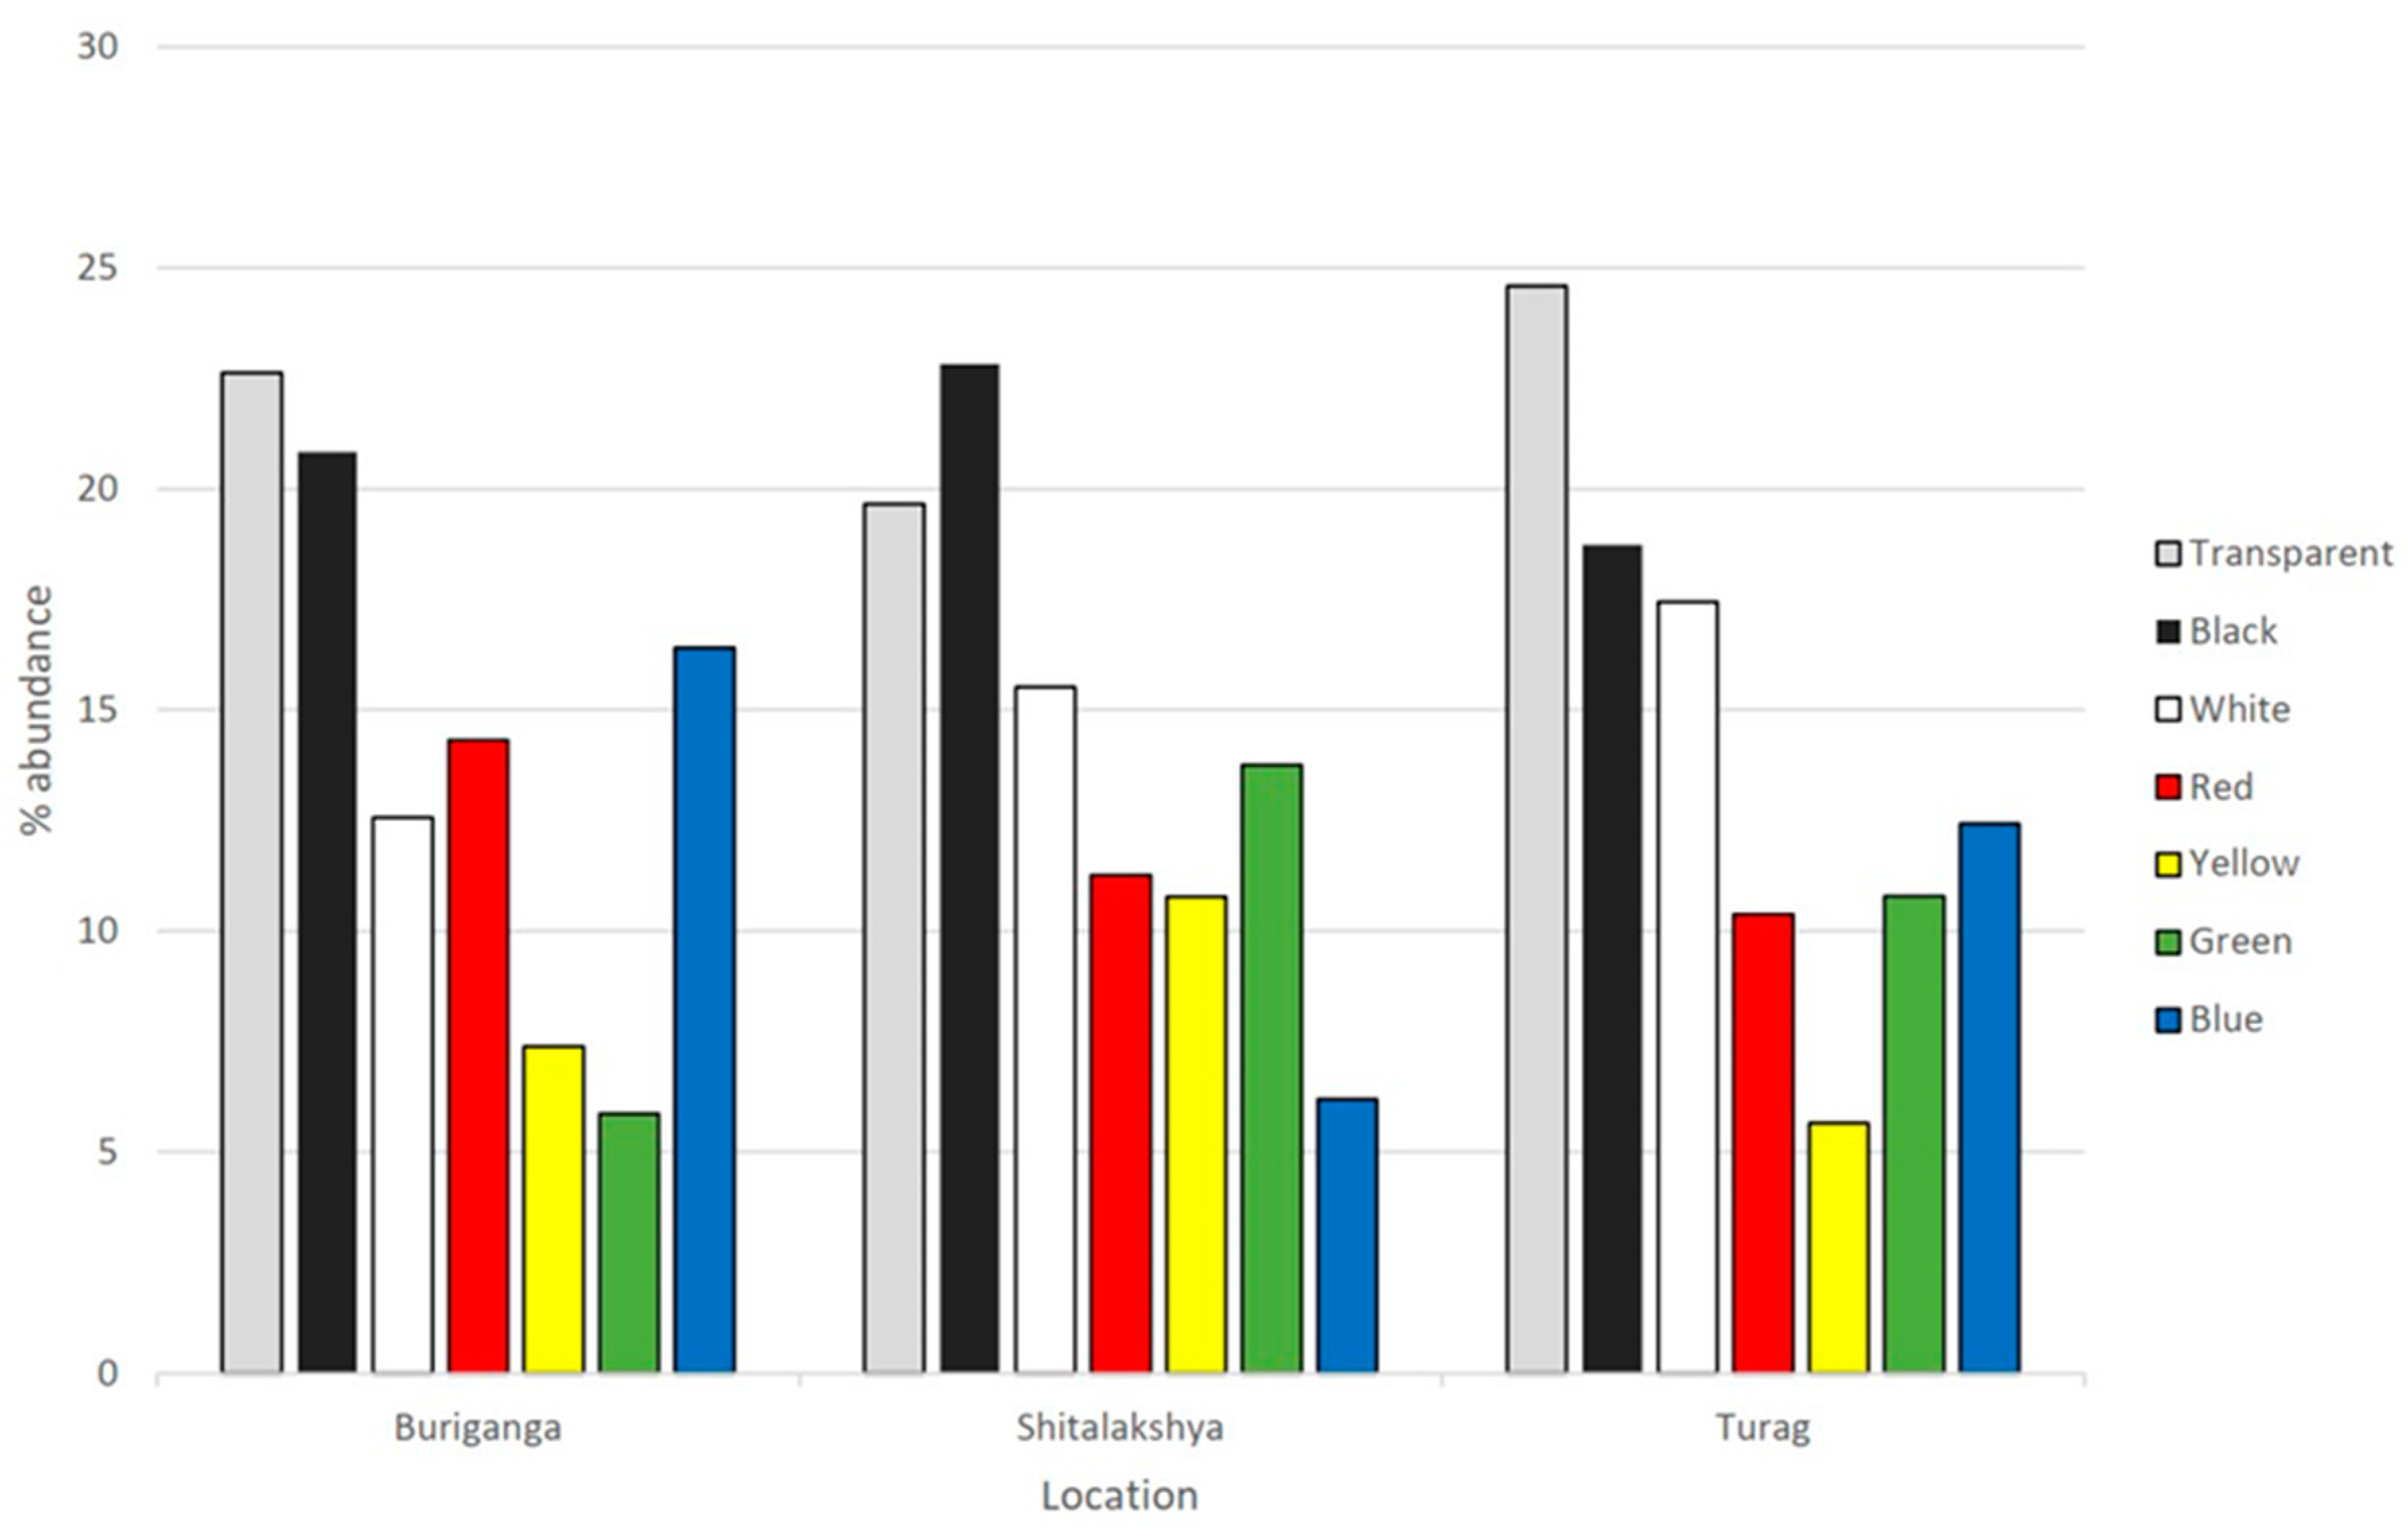
Microplastics come in a wide range of colors, indicating a variety of sources for plastics(C. Li et al., 2020) The high variation of color in microplastics found in our study can be explained by the disparity of land use in our study location.
Figure 7.
Color percent abundance by location.
Chemical Composition of Microplastics
The microplastic particles found in our samples were furthur analyzed to find out their chemical composition. According to a study(Tagg et al., 2015), this approach is the most trustworthy and non-destructive method of studying Microplastics. The PA (polyamide or commonly known as nylon), PE (polyethylene), PES (polyethersulfone), PET (polyethylene terephthalate), PP (Polypropylene), PS (polystyrene), and PVC (polyvinyl chloride) FTIR spectra from water and sediment microplastics are displayed in figure 4.12.
Figure 8.
FTIR spectra of PA, PE, PES, PET, PP, PS, and PVC from water and sediment microplastics collected from the samples of Buriganga, Shitalakshya, and Turag rivers.
Figure 8.
FTIR spectra of PA, PE, PES, PET, PP, PS, and PVC from water and sediment microplastics collected from the samples of Buriganga, Shitalakshya, and Turag rivers.


The most prevalent type of plastic we discovered in our study region was PA (polyamide or nylon), and PES (polyester). PA and PES constituted 26.66% and 23.33% of all the microplastic particles that were analyzed. The high amount of PA and PES can be linked with the high amount of fibrous-type microplastics found in the water samples. Nylon fiber is very commonly used in nets, ropes, threads, carpets, tires, clothing, etc. Polyester fiber is a very common and popular synthetic fiber in clothing usage. Another commonly encountered microplastic was PE (polyethylene), which is widely used as packaging material.
Discussion of the Outcome
The result of this study shows how microplastic concentrations vary between these water bodies and also in the sediments. This variation may depend on various factors, such as river locations (upper or lower tributary), population density in the catchment area, plastic consumption and waste in the city, and many other factors. Rivers are particularly susceptible to plastic contamination as a result of the region’s population and industrial density and human activities. From the locations where samples were obtained from the Buriganga and Shitalakshya rivers, the population density and industrial activities were quite dense, whereas the population and industrial density were less dense in the sample collection zones of the Turag river. This may be one of the variables influencing the microplastic concentration in river water and sediments. Microplastic concentrations in water and sediment are highest in the Buriganga river, followed by the Shitalakshya and the Turag. There is cause for concern about the prevalence of microplastics in any freshwater system, but this is especially true when that water supplies our drinking water or sustains aquatic life in and around urban areas. This harms the ecological health of the country’s surface waters as a whole. In both sediment and water, different types of microplastics, such as fiber, fragment, film, foam, and pellet were observed.
Figure 9.
Percent abundance of microplastics type.
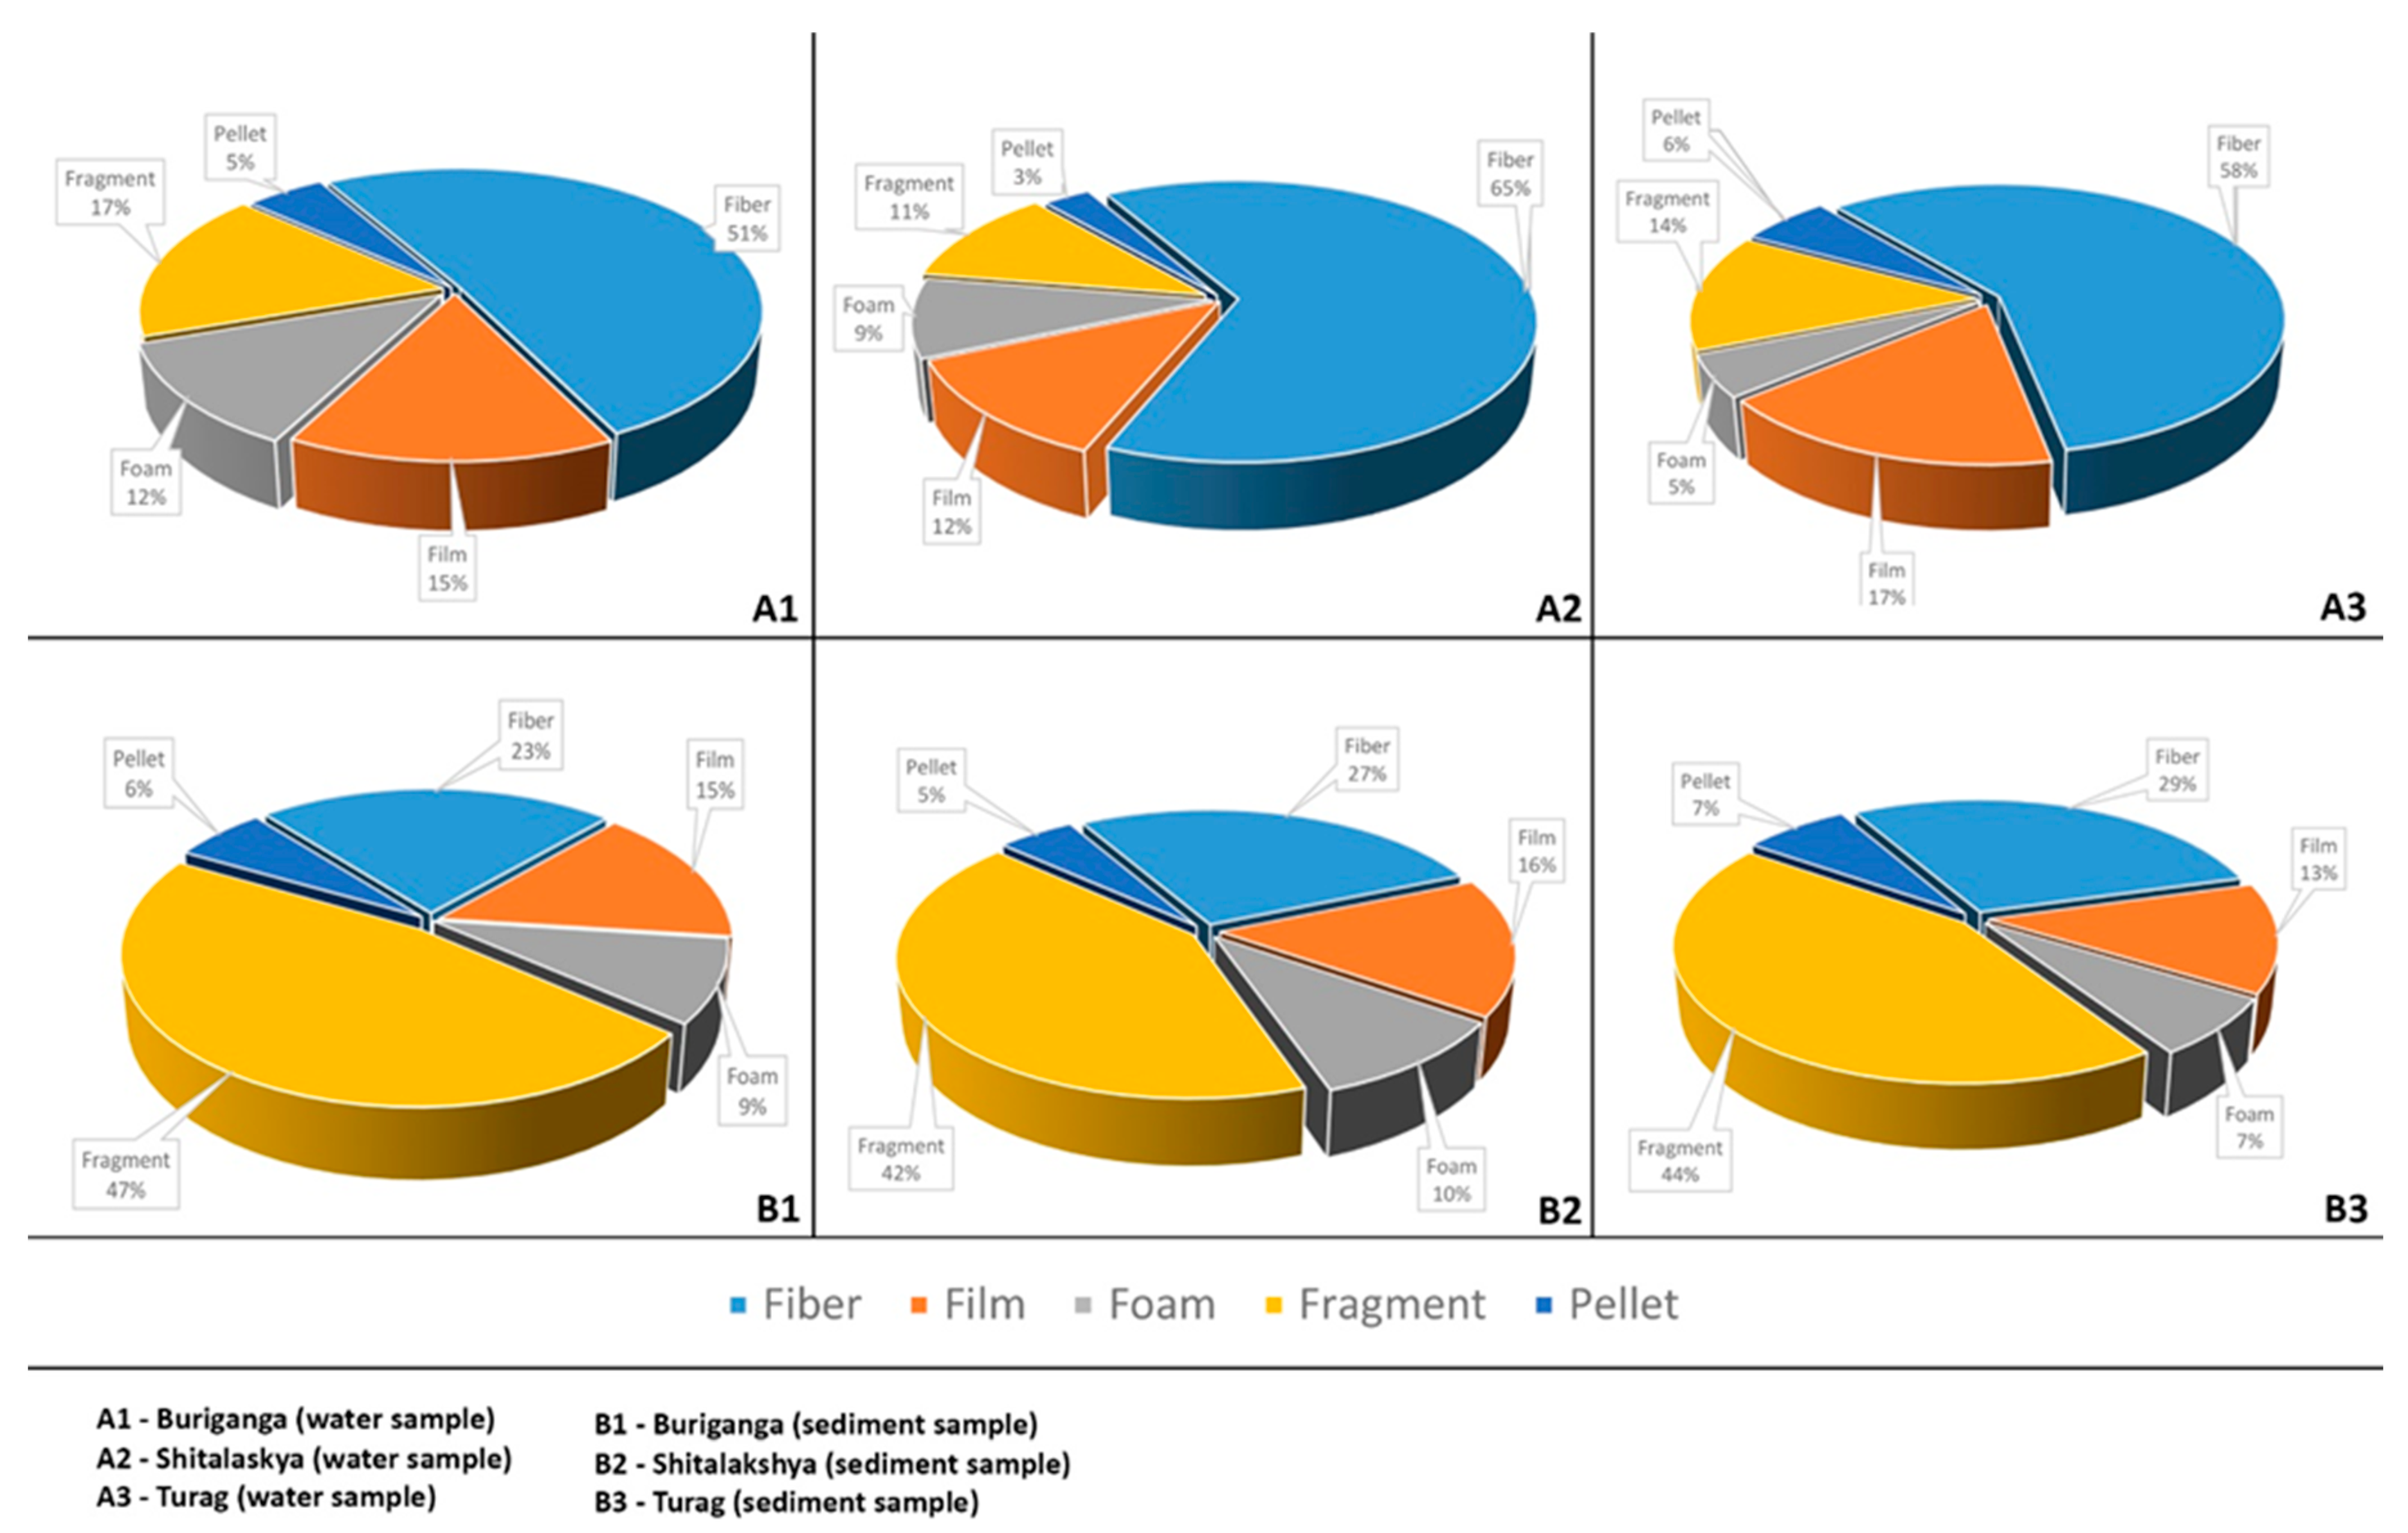
Figure 4.13(A1, A2, A3) demonstrates that fibers predominate in the Buriganga, Shitalakshya, and Turag river water samples. Where a large proportion of fragment-type microplastics were detected in sediment samples from figure 4.13(B1, B2, B3). Clothing is one source of microplastic fibers in the environment. As is well known, there are numerous textile factories on the banks of these rivers (Buriganga, Shitalaskhya, and Turag) that may be contaminating river water with microplastics. Along with tire industries and other plastic waste sources, industrial wastewater can be a primary cause of pollution, which may lead to further contamination owing to the degradation of plastic waste.
For chemical characterization, FTIR analysis was conducted. PA (polyamide or nylon) and PES (polyethylene sulfide) were the most frequent plastics in our study area (polyester). PA and PES represented 26,66% and 23,33 % of all examined microplastic particles, respectively. There is a correlation between the high levels of PA and PES and the high levels of fibrous-type microplastics detected in the water samples. The usage of nylon fiber in nets, ropes, threads, carpets, tires, garments, etc. is widespread. Polyester fiber is an extremely common and widely used synthetic fabric in apparel. PE (polyethylene), an extensively utilized packaging material, was another often encountered Microplastics That can give us some basic information about the possible origin of the microplastics, as determined by Fourier transform infrared (FTIR) research.
Conclusion
In today’s plastics era, where urban rivers and water streams are predominantly contaminated with microplastic pollution, the issue of microplastic pollution is increasingly becoming a topic of discussion. Through the use of a digital microscope, the presence of microplastics was identified as being abundant in the rivers Buringanga, Turag, and Shitolokkha during our investigation. Both the water and the sediment sample revealed the presence of contamination.
In the meanwhile, visual identification and counting have assisted us in quantifying the microplastics in the river. This will give us information on the state of the pollution in those water bodies and how severely it can affect us. Additionally, this is a problem for the aquatic environment. One of the key objectives of our research was to categorize the microplastic particles following their prerequisites, and as part of that endeavor, we have arranged the plastic particles in this study in accordance with their shape, size, and concentration. The FTIR analysis was performed so that we could have a better understanding of the chemical features. This will allow us to have a better notion of the types of plastics that are contaminating the river, and it may also provide us with the information that we need for additional analysis.
References
- Global plastic production 2021. Statista https://www.statista.com/statistics/282732/global-production-of-plastics-since-1950/.
- Plastic rain in protected areas of the United States | Science. https://www.science.org/doi/10.1126/science.aaz5819.
- Beyond plastic waste | Science. https://www.science.org/doi/10.1126/science.aao6749.
- Van Rensburg, M.L.; Nkomo, S.L.; Dube, T. The ‘plastic waste era’; social perceptions towards single-use plastic consumption and impacts on the marine environment in Durban, South Africa. Applied Geography 2020, 114, 102132. [Google Scholar] [CrossRef]
- Wagner, M.; et al. Microplastics in freshwater ecosystems: What we know and what we need to know. Environ Sci Eur 2014, 26, 12. [Google Scholar] [CrossRef] [PubMed]
- Lambert, S. & Wagner, M. Microplastics Are Contaminants of Emerging Concern in Freshwater Environments: An Overview. in Freshwater Microplastics : Emerging Environmental Contaminants? (eds. Wagner, M. & Lambert, S.) 1–23 (Springer International Publishing, 2018). [CrossRef]
- Cole, M.; Lindeque, P.; Halsband, C.; Galloway, T.S. Microplastics as contaminants in the marine environment: A review. Marine Pollution Bulletin 2011, 62, 2588–2597. [Google Scholar] [CrossRef]
- Auta, H.S.; Emenike, C.U.; Fauziah, S.H. Distribution and importance of microplastics in the marine environment: A review of the sources, fate, effects, and potential solutions. Environ Int 2017, 102, 165–176. [Google Scholar] [CrossRef]
- Andrady, A.L. Microplastics in the marine environment. Mar Pollut Bull 2011, 62, 1596–1605. [Google Scholar] [CrossRef]
- Shim, W.J.; Thomposon, R.C. Microplastics in the Ocean. Arch Environ Contam Toxicol 2015, 69, 265–268. [Google Scholar] [CrossRef]
- Barnes, D.K.A.; Galgani, F.; Thompson, R.C.; Barlaz, M. Accumulation and fragmentation of plastic debris in global environments. Philos Trans R Soc Lond B Biol Sci 2009, 364, 1985–1998. [Google Scholar] [CrossRef]
- Wu, C.; Zhang, K.; Xiong, X. Microplastic Pollution in Inland Waters Focusing on Asia. in Freshwater Microplastics : Emerging Environmental Contaminants? (eds. Wagner, M. & Lambert, S.) 85–99 (Springer International Publishing, 2018). [CrossRef]
- Auta, H.S.; Emenike, C.U.; Fauziah, S.H. Distribution and importance of microplastics in the marine environment: A review of the sources, fate, effects, and potential solutions. Environ Int 2017, 102, 165–176. [Google Scholar] [CrossRef]
- Duis, K.; Coors, A. Microplastics in the aquatic and terrestrial environment: Sources (with a specific focus on personal care products), fate and effects. Environmental Sciences Europe 2016, 28, 2. [Google Scholar] [CrossRef]
- Lebreton, L.C.M.; et al. River plastic emissions to the world’s oceans. Nat Commun 2017, 8, 15611. [Google Scholar] [CrossRef] [PubMed]
- Carr, S.A.; Liu, J.; Tesoro, A.G. Transport and fate of microplastic particles in wastewater treatment plants. Water Res 2016, 91, 174–182. [Google Scholar] [CrossRef]
- Mintenig, S.M.; Int-Veen, I.; Löder, M.G.J.; Primpke, S.; Gerdts, G. Identification of microplastic in effluents of waste water treatment plants using focal plane array-based micro-Fourier-transform infrared imaging. Water Research 2017, 108, 365–372. [Google Scholar] [CrossRef] [PubMed]
- Ziajahromi, S.; Neale, P.A.; Rintoul, L.; Leusch, F.D.L. Wastewater treatment plants as a pathway for microplastics: Development of a new approach to sample wastewater-based microplastics. Water Res 2017, 112, 93–99. [Google Scholar] [CrossRef]
- Eerkes-Medrano, D.; Thompson, R.C.; Aldridge, D.C. Microplastics in freshwater systems: A review of the emerging threats, identification of knowledge gaps and prioritisation of research needs. Water Res 2015, 75, 63–82. [Google Scholar] [CrossRef]
- Scherer, C.; Brennholt, N.; Reifferscheid, G.; Wagner, M. Feeding type and development drive the ingestion of microplastics by freshwater invertebrates. Sci Rep 2017, 7, 17006. [Google Scholar] [CrossRef]
- Patil, D.B.J. Extraction of Liquid Fuel from Waste Plastic. in (2017). 2017.
- Alomar, C.; Estarellas, F.; Deudero, S. Microplastics in the Mediterranean Sea: Deposition in coastal shallow sediments, spatial variation and preferential grain size. Marine Environmental Research 2016, 115, 1–10. [Google Scholar] [CrossRef]
- Woodall, L.C.; et al. The deep sea is a major sink for microplastic debris. R Soc Open Sci 2014, 1, 140317. [Google Scholar] [CrossRef] [PubMed]
- Suaria, G.; Aliani, S. Floating debris in the Mediterranean Sea. Marine Pollution Bulletin 2014, 86, 494–504. [Google Scholar] [CrossRef] [PubMed]
- Boucher, C.; Morin, M.; Bendell, L.I. The influence of cosmetic microbeads on the sorptive behavior of cadmium and lead within intertidal sediments: A laboratory study. Regional Studies in Marine Science 2016, 3, 1–7. [Google Scholar] [CrossRef]
- Van Cauwenberghe, L.; Devriese, L.; Galgani, F.; Robbens, J.; Janssen, C.R. Microplastics in sediments: A review of techniques, occurrence and effects. Mar Environ Res 2015, 111, 5–17. [Google Scholar] [CrossRef]
- Van Cauwenberghe, L.; Claessens, M.; Vandegehuchte, M.B.; Janssen, C.R. Microplastics are taken up by mussels (Mytilus edulis) and lugworms (Arenicola marina) living in natural habitats. Environmental Pollution 2015, 199, 10–17. [Google Scholar] [CrossRef]
- Eriksen, M.; et al. Plastic Pollution in the World’s Oceans: More than 5 Trillion Plastic Pieces Weighing over 250,000 Tons Afloat at Sea. PLoS ONE 2014, 9, e111913. [Google Scholar] [CrossRef]
- Zhang, L.; et al. Distribution of microplastics in surface water and sediments of Qin river in Beibu Gulf, China. Sci Total Environ 2020, 708, 135176. [Google Scholar] [CrossRef]
- Kashiwabara, L.M.; et al. Microplastics and microfibers in surface waters of Monterey Bay National Marine Sanctuary, California. Mar Pollut Bull 2021, 165, 112148. [Google Scholar] [CrossRef]
- Zandhi, R.; Yuliadi, L.P.S.; Ismail, M.R.; Yuniarti, M.S. Conditions for Sediment Coating Microplastic in Mangrove Ecosystems in Kupang and Rote, East Nusa Tenggara, Indonesia. World News of Natural Sciences 2019, 50–58. [Google Scholar]
- Wang, J.; Wang, M.; Ru, S.; Liu, X. High levels of microplastic pollution in the sediments and benthic organisms of the South Yellow Sea, China. Sci Total Environ 2019, 651, 1661–1669. [Google Scholar] [CrossRef]
- Prata, J.C.; et al. Identifying a quick and efficient method of removing organic matter without damaging microplastic samples. Sci Total Environ 2019, 686, 131–139. [Google Scholar] [CrossRef] [PubMed]
- Cutroneo, L.; Reboa, A.; Geneselli, I.; Capello, M. Considerations on salts used for density separation in the extraction of microplastics from sediments. Mar Pollut Bull 2021, 166, 112216. [Google Scholar] [CrossRef]
- Li, J.; et al. Microplastics in sediment cores as indicators of temporal trends in microplastic pollution in Andong salt marsh, Hangzhou Bay, China. Regional Studies in Marine Science 2020, 35, 101149. [Google Scholar] [CrossRef]
- Hidalgo-Ruz, V.; Gutow, L.; Thompson, R.C.; Thiel, M. Microplastics in the marine environment: A review of the methods used for identification and quantification. Environ Sci Technol 2012, 46, 3060–3075. [Google Scholar] [CrossRef] [PubMed]
- Korez, Š.; Gutow, L.; Saborowski, R. Microplastics at the strandlines of Slovenian beaches. Mar Pollut Bull 2019, 145, 334–342. [Google Scholar] [CrossRef]
- Cincinelli, A.; et al. Microplastic in the surface waters of the Ross Sea (Antarctica): Occurrence, distribution and characterization by FTIR. Chemosphere 2017, 175, 391–400. [Google Scholar] [CrossRef]
Disclaimer/Publisher’s Note: The statements, opinions and data contained in all publications are solely those of the individual author(s) and contributor(s) and not of MDPI and/or the editor(s). MDPI and/or the editor(s) disclaim responsibility for any injury to people or property resulting from any ideas, methods, instructions or products referred to in the content. |
© 2024 by the authors. Licensee MDPI, Basel, Switzerland. This article is an open access article distributed under the terms and conditions of the Creative Commons Attribution (CC BY) license (https://creativecommons.org/licenses/by/4.0/).
Copyright: This open access article is published under a Creative Commons CC BY 4.0 license, which permit the free download, distribution, and reuse, provided that the author and preprint are cited in any reuse.


