
Submitted:
29 February 2024
Posted:
29 February 2024
You are already at the latest version
Abstract
The level of development of the innovation factor plays a crucial role in supporting the high-quality development of China's economy. To advance the development of regional innovation factor allocation efficiency along the Belt and Road. This article introduces the super-efficiency SBM-DEA-Malmquist model for the static and dynamic analysis of innovation factor allocation efficiency in 17 provinces along the Belt and Road from 2012 to 2021. The Moran index model analyzes the spatial correlation. The results show that: (1) The overall innovation factor allocation efficiency along the Belt and Road is not high, and there are obvious differences among different regions. The eastern region is the highest compared to other regions. (2) According to the efficiency decomposition results, pure technical efficiency is the main reason for the low innovation factor allocation efficiency. (3) Through the Malmquist index and decomposition index, it is found that pure technical efficiency and scale efficiency are key factors in improving technical efficiency. (4) The analysis of spatial correlation reveals a strong spatial agglomeration feature among the provinces along the Belt and Road. The innovation factor allocation efficiency is mainly manifested in the L-L type. Finally, according to the analysis results, suggestions and policies are put forward to improve the innovation factor allocation efficiency in the regions along the Belt and Road.
Keywords:
Innovation factor allocation efficiency
; Super-efficient SBM-DEA
; Malmquist
; Spatial correlation
1. Introduction
The Belt and Road Initiative was first proposed by China in 2013 [1,2,3]. It aims to strengthen economic cooperation with other countries, promote regional connectivity, and foster shared economic prosperity. China is entering a "new normal" development phase of medium-high speed, optimized structure, new kinetic energy, and multiple challenges. The effectiveness of the reliance on factors of production and investment to drive economic growth is beginning to wane. In terms of the distribution of innovation factors and the development of regional innovation levels, China still faces many challenges [4,5].
The report of the 20th National Congress of the Communist Party of China stressed the promotion of high-quality economic development [6] by constructing the Belt and Road. It also highlighted the importance of thoroughly implementing the strategy of developing the country through science and education, the strategy of empowering the country through talents, and the strategy of innovation-driven development. In this context, cooperation in science, technology, and innovation is seen as an important support for promoting high-quality economic development in the construction of the Belt and Road, as well as an important link in the expansion of new areas and new spaces. To accelerate the construction of a new pattern of scientific and technological innovation cooperation under the Belt and Road. It is necessary to strengthen scientific and technological cooperation in important scientific and technological innovation directions and key areas [7,8]. This initiative will inject new momentum and unleash new potential for promoting high-quality economic development along the Belt and Road. High-quality economic development means achieving high-quality allocation of innovation factors and efficient input and output of innovation factors. Therefore, through the strategic policies of the Belt and Road and regional cooperation and exchange platforms, the innovation factor allocation efficiency will be continuously improved. It plays an important role in promoting the upgrading of industrial structure and accelerating high-quality economic development in the regions along the Belt and Road. This paper examines the innovation factor allocation efficiency in the regions along the Belt and Road by combining spatial correlation. To enhance the innovation factor allocation efficiency and strengthen the spatial correlation between regions along the Belt and Road, this text provides reference suggestions for promoting high-quality economic development in these areas.
Scholars have done a lot of research on the factors of innovation. Blzaek discovered that the level of innovation capability and performance primarily relies on human resources, capital, and knowledge [9]. Wang and Yang, through their study of the Yangtze River Delta region in China, contend that the performance of technological innovation is primarily influenced by the input of innovation factors [10]. Gao et al. believed that improving the efficiency of factor allocation of labor and capital can accelerate green innovation [11]. Xu et al. examined 254 prefecture-level cities in China and concluded that innovation pilot city policies have the potential to enhance the allocation level of innovation factor [12]. Kogan et al. asserted that technological innovation was the primary driver behind the substantial medium-term fluctuations in aggregate economic growth and total factor productivity [13]. According to Cao et al., the efficiency of science and technology resource allocation was predominantly influenced by R&D personnel and R&D funds [14]. As research on innovation factor allocation deepens, an increasing number of scholars are examining the innovation factor allocation efficiency across regions and through various models. Xu et al. examined the innovation factor allocation efficiency in 30 provinces in China using the random forest method. The findings revealed that the innovation factor allocation efficiency in most provinces did not reach an effective state [15]. Wang and Liu studied China's innovation efficiency and resource allocation using the improved HK model from the perspective of price [16]. Ji et al. employed the two-stage network DEA model to investigate the innovation factor allocation efficiency in China's metropolitan areas. Their findings revealed significant disparities in efficiency among these areas [17]. Liu and Wang utilized the Griliches-Jaffe model and discovered a positive correlation between regional innovation elements, allocative efficiency, and innovation performance [18]. Wang and Jin employed the three-stage DEA model and concluded that it was essential to eliminate the influence of environmental factors and random disturbances to accurately measure the innovation factor allocation efficiency [19]. Meng et al. examined the innovation factor allocation efficiency in the Yangtze River Economic Belt and identified a consistent upward trend in the region's innovation factor allocation efficiency [20]. Wang and Yang investigated the innovation factor allocation efficiency in the Yangtze River Delta using the translog-production function. They emphasized the necessity of optimizing the innovation factor allocation efficiency to drive high-quality development in the Yangtze River Delta [21]. Xu and Zhao constructed a coupling degree model to evaluate the coupling degree between the innovation factor allocation subsystem and high-quality economic development in eight economic zones of China. Their analysis highlighted the necessity for further enhancement of the overall coupling level [22].
Through the analysis of the main related literature, First, most scholars still choose traditional innovation factors such as capital, technology, and labor force in the index selection of innovation factor allocation efficiency, ignoring data index factors. The research methods of innovation factor allocation efficiency mostly choose the traditional DEA model, and its efficiency value has an upper limit of 1. Second, most studies on the innovation factor allocation efficiency do not consider the undesirable output in the process of economic development. Third, from the perspective of the research area, most works of literature mainly study the innovation factor allocation efficiency in a certain province or the whole country and have not yet involved the research on the regions along the Belt and Road in China. At the same time, there is also a lack of spatial correlation analysis on the innovation factor allocation efficiency between different regions. Given this, this study chooses to study the innovation factor allocation efficiency along the Belt and Road in China. The geographical location and economic development disparities among these regions are intricate and varied. This paper concentrates on analyzing the level of innovation factor in the regions along the Belt and Road in China, as well as assessing the innovation factor allocation efficiency. A scientific analysis of the variations in the level of regional innovation factor along the Belt and Road, as well as an exploration of the spatial correlation between regions. The objective of this study is to conduct a scientific and reasoned analysis of the variations in innovation factor allocation efficiency among regions and the spatial correlation along the Belt and Road. It aims to identify the primary factors contributing to differences in regional innovation factor allocation efficiency and provide sensible recommendations to enhance innovation factor allocation efficiency and reduce disparities among regions along the Belt and Road. To contribute to the high-quality economic development of these regions in China.
The primary work of this study includes: (1) Developing a multi-dimensional innovation factor index system and calculating innovation factor allocation efficiency based on human, capital, technology, and data innovation factor indices. This approach enhances the precision of studying the level of innovation factor allocation. (2) The aim is to investigate and analyze the innovation factor allocation efficiency along China's Belt and Road, contributing to the promotion of high-quality economic development in regions along the Belt and Road. (3) The introduced super-efficient SBM-DEA-Malmquist model for non-desired outputs addresses the limitation where the efficiency value of decision-making units (DMUs) cannot exceed 1. In this paper, an analysis is conducted on the differences in the innovation factor allocation efficiency among various provinces, considering both static and dynamic perspectives. The study also involves horizontal and vertical comparisons. (4) The Moran index is employed to analyze the spatial correlation characteristics of the level of regional innovation factor allocation along the Belt and Road. This analysis aims to identify the spatial connections between different regions and elucidate the differences in the innovation factor allocation efficiency.
The subsequent chapters of this study are organized as follows: the second section introduces the model method, the third section performs the empirical analysis, and the fourth section presents the research conclusion along with relevant suggestions and future research directions.
2. Model Method
2.1. Super-Efficiency SBM-DEA Model
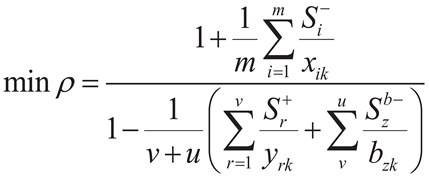
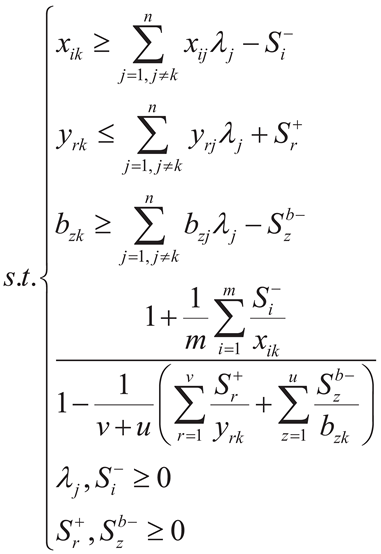
Data envelopment analysis (DEA) was proposed by Charnes et al in 1978 to evaluate the efficiency of non-parametric comprehensive evaluation [23]. One advantage of the DEA model is that it eliminates the need to set specific model forms and parameters. It calculates efficiency evaluations for multiple DMUs with multiple inputs and outputs, thus preventing calculation errors that may arise from parameter setting. Therefore, this method is widely used by scholars in efficiency evaluation research. Nonetheless, the traditional DEA model overlooks the radial and guiding problems. Addressing the calculation errors arising from radial and relaxation variables, Tone [24] introduced a non-radial and non-oriented SBM-DEA model incorporating relaxation variables. This model builds upon the traditional DEA model and effectively resolves redundancy and relaxation issues related to input-output factors. Nevertheless, the SMB-DEA model fails to address the issue where multiple DMUs are simultaneously at the efficiency front. Additionally, it is constrained by the limitation that the efficiency value cannot exceed 1, hindering its ability to distinguish and rank multiple effective DMUs [24]. Consequently, building upon the original model, Tone introduced the super-efficiency SBM-DEA model. This model not only overcomes the limitation of the efficiency value of DMU not exceeding 1 but also addresses the issue of unexpected output arising from the input-output production process. As a result, it enhances the accuracy of DMU efficiency calculations and optimizes the shortcomings of the traditional DEA model. To address the aforementioned issues, this study assesses the innovation factor allocation efficiency in 17 provinces along the Belt and Road from 2012 to 2021. This is achieved by constructing a super-efficient SBM-DEA model that incorporates non-expected output considerations [25]. The formula for constructing the model is as follows:
 |
(1) |
 |
(2) |
Where A represents the innovation factor allocation efficiency. When  ,
it signifies that the DMU is in an efficient state. Furthermore, the higher the efficiency value, the more effective the innovation factor allocation efficiency is considered to be. When
,
it signifies that the DMU is in an efficient state. Furthermore, the higher the efficiency value, the more effective the innovation factor allocation efficiency is considered to be. When  , DMU is invalid.
  ,
,  , and
, and  represent the quantities of inputs, desired outputs, and non-desired outputs, respectively, in the context of innovation factor allocation. The slack redundancy variables for inputs, desired outputs, and undesired outputs in the innovation factor allocation are represented by
  ,
,  , and
, and  , respectively.
  is the weight variable.
,
it signifies that the DMU is in an efficient state. Furthermore, the higher the efficiency value, the more effective the innovation factor allocation efficiency is considered to be. When , DMU is invalid. , , and represent the quantities of inputs, desired outputs, and non-desired outputs, respectively, in the context of innovation factor allocation. The slack redundancy variables for inputs, desired outputs, and undesired outputs in the innovation factor allocation are represented by , , and , respectively. is the weight variable.2.2. Malmquist Index Model
Since the super-efficient SBM-DEA model is limited to analyzing the static efficiency of the innovation factor allocation level in the provinces along the Belt and Road, it cannot capture the dynamic time-series change trend of the innovation factor allocation efficiency value, resulting in certain limitations. Therefore, this article uses the Malmquist index model to study the dynamic changing trends of innovation factor allocation efficiency. Malmquist index model can not only compare and analyze the inter-period of DMU. It can also further analyze the trend of the comprehensive technical efficiency and technological progress of the decomposition.
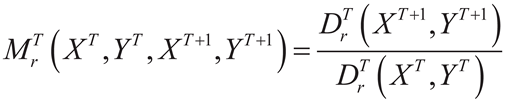
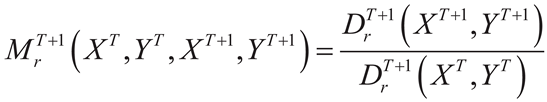
The Malmquist index was originally proposed to solve the consumption index. Caves et al [26] improved it and applied it to Malmquist productivity to measure the dynamic change trend of DMU. The formula for the Malmquist productivity index model is as follows:
 |
(3) |
 |
(4) |
Formulas (8) and (9) are the Malmquist total factor productivity index of period T and period T+1.  and
and  are inputs and outputs for periods T and T+1.
  and
and  represent distance functions for time T and time T+1. The formula of the comprehensive productivity index under the definition of geometric average is:
and are inputs and outputs for periods T and T+1. and represent distance functions for time T and time T+1. The formula of the comprehensive productivity index under the definition of geometric average is: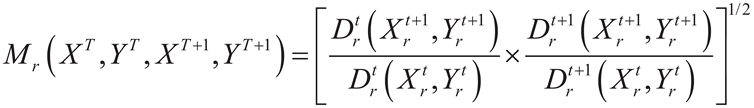 |
(5) |
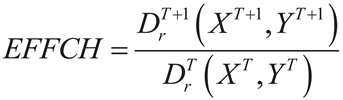
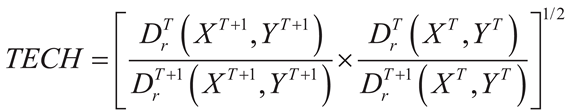
If  is greater than 1, it means that total factor productivity is on an upward trend, otherwise it is on a downward trend. According to Fare et al, under the definition of variable returns to scale (VRS), the total factor productivity (TFP) index can be decomposed into comprehensive technical efficiency (EFFCH) and technological progress (TECH). Therefore, the relationship between the indices is as follows:
is greater than 1, it means that total factor productivity is on an upward trend, otherwise it is on a downward trend. According to Fare et al, under the definition of variable returns to scale (VRS), the total factor productivity (TFP) index can be decomposed into comprehensive technical efficiency (EFFCH) and technological progress (TECH). Therefore, the relationship between the indices is as follows: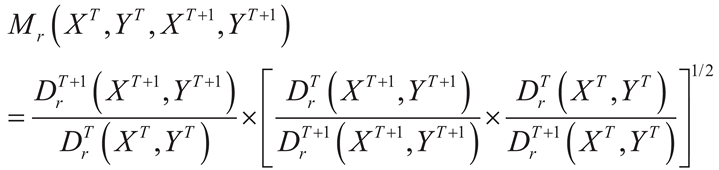 |
(6) |
 |
(7) |
 |
(8) |
Technical efficiency index (PECH) and scale efficiency (SECH) are the two components of technical efficiency decomposition. The distance function under VRS can be obtained by adding the restrictive condition of constant return to scale (CRS) to the technical efficiency change index. The formula is as follows:
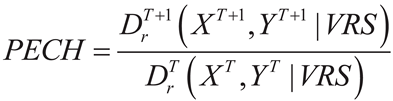 |
(9) |
 |
(10) |
In summary, the Malmquist index model is as follows:
 |
(11) |
2.3. Spatial Autocorrelation Analysis Method
Spatial autocorrelation is a statistical method used to evaluate spatial data distribution characteristics and interrelationships. The fundamental concept is that there might be a form of dependence or similarity among data values situated in spatially adjacent or close locations. This dependence or similarity tends to diminish or vanish as the distance increases. The paper employs the Global Moran's I index and Local Moran's I index [27] to perform spatial autocorrelation analysis on the innovation factor allocation efficiency in provinces along the Belt and Road. The specific model is constructed as follows:
 |
(12) |
 |
(13) |
where A and B are the Global Moran's I and Local Moran's I values, respectively.  indicates the number of provinces studied.
  and
and  represent different spatial units.
  and
and  denote the innovation factor allocation efficiency in provinces
  and
and  .
.  and
and  represent the mean and variance of innovation factor allocative efficiency, respectively.
  is the spatial weight matrix. Global spatial autocorrelation can analyze the degree of variation and agglomeration of innovation factor allocation efficiency across the entire space. The Local Moran Index is designed to analyze the degree of spatial agglomeration among provinces along the Belt and Road. The value of
  ranges from [-1,1]. If
  , the innovation factor allocation efficiency exhibits a positive correlation in the spatial distribution, and the closer the value is to 1, the stronger the degree of spatial aggregation. If
  , then the provinces are spatially negatively correlated. If
  , it indicates that the innovation factor allocation efficiency across provinces is spatially uncorrelated and randomly distributed.
indicates the number of provinces studied. and represent different spatial units. and denote the innovation factor allocation efficiency in provinces and . and represent the mean and variance of innovation factor allocative efficiency, respectively. is the spatial weight matrix. Global spatial autocorrelation can analyze the degree of variation and agglomeration of innovation factor allocation efficiency across the entire space. The Local Moran Index is designed to analyze the degree of spatial agglomeration among provinces along the Belt and Road. The value of ranges from [-1,1]. If , the innovation factor allocation efficiency exhibits a positive correlation in the spatial distribution, and the closer the value is to 1, the stronger the degree of spatial aggregation. If , then the provinces are spatially negatively correlated. If , it indicates that the innovation factor allocation efficiency across provinces is spatially uncorrelated and randomly distributed.2.4. Sample Selection and Variable Data Sources
There are 18 provinces along the Belt and Road in China. Nevertheless, owing to the absence of input-output data for Xizang in the statistical yearbook, this paper focuses on studying the innovation factor allocation efficiency in the remaining 17 provinces (municipalities and autonomous regions) along the Belt and Road in China. The sample data span from 2012 to 2021. To better investigate the regional differences in the innovation factor allocation efficiency along the Belt and Road, this paper categorizes the regions in China into four distinct regions. Among them, Shanghai, Zhejiang, Fujian, Guangdong, and Hainan are classified as part of the southeast region. Heilongjiang, Jilin, and Liaoning are classified as part of the northeast region. Chongqing, Yunnan, and Guangxi are classified as part of the southwest region. Inner Mongolia, Shaanxi, Gansu, Qinghai, Ningxia, and Xinjiang are classified as part of the northwest region. The region division is shown in Figure 1. The selection of sample data and variables in this study mainly comes from the China Statistical Yearbook, China Science and Technology Statistical Yearbook, China High-Tech Industry Statistical Yearbook, and Wind database, as well as provincial and regional statistical bureaus.
2.5. Input-Output Variable Selection
2.5.1. Input Index
This study considers the actual development of regional innovation levels along the Belt and Road in China, drawing upon available data and existing literature regarding the development of innovation factor levels. It primarily focuses on four aspects: talent factor, capital factor, technology factor, and data factor. Five input indicators are selected: full-time equivalent of R&D personnel, internal expenditure of R&D funds, financial expenditure on science and technology, expenditure on purchasing domestic and foreign advanced technology, and the number of mobile phone subscribers.
2.5.2. Output Index
The output of innovation factor in the context of high-quality economic development is primarily assessed in terms of scientific and technological outcomes and economic benefits. This study chooses the amount of patent authorization indicator to represent scientific and technological achievements, and utilizes the amount of technology market contracts and sales volume of new products indicator variables to gauge the level of economic benefits. These selections can illustrate the market value generated by innovation outcomes and the capacity for economic benefits resulting from technological innovation.
2.5.3. Non-Expected Output Index
The non-expected output indicators selected in this study mainly include the production of solid hazardous waste, the discharge of sulfur dioxide in waste water and the chemical oxygen demand in wastewater discharge. The evaluation index system is shown in Table 1.
3. Empirical Results
3.1. Results of the Super-Efficiency SBM-DEA Model
Using the super-efficient SBM-DEA model, the innovation factor allocation efficiency is assessed for provinces along the Belt and Road from 2012 to 2021. The findings are presented in Table 2 and Figure 2.
As depicted in Table 2, the average innovation factor allocation efficiency among provinces along the Belt and Road in China fluctuated between 0.412 and 0.834 from 2012 to 2021, displaying an overall trend of growth with fluctuations. To some extent, this indicates that China has achieved positive outcomes by adhering to the path of independent innovation with Chinese characteristics and implementing the innovation-driven development strategy since late 2012. From the mean value of each province, there are great differences in the innovation factor allocation efficiency among regions, and the input-output distribution of the innovation factor is unbalanced. From 2012 to 2021, Shanghai has the highest average innovation facto allocation efficiency, reaching 1.034, indicating effectiveness in the DEA model. Situated in the southeast coastal region, Shanghai has sustained a balanced development of both input and output of innovation factor, complementing its high-quality economic growth. Zhejiang, Fujian, Guangdong, and Hainan are likewise situated in the southeastern coastal regions. Their respective average innovation factor allocation efficiency is 0.977, 0.389, 0.814, and 0.645. Except for Fujian, the efficiency of the other three provinces is above the medium level. Thanks to their geographical advantage and supportive national policies, these three provinces rank in the middle to upper levels in terms of innovation factor allocation. The average innovation factor allocation efficiency in Liaoning, Jilin, and Heilongjiang in Northeast China is 0.55, 0.797, and 0.283, respectively. Being a significant industrial province, only Jilin surpasses the overall average level of innovation factor. This may stem from the robust growth of the industrial economy in these regions, potentially overlooking the contribution of scientific and technological innovation to development, thus exacerbating the structural contradictions within these areas. On the contrary, the average innovation factor allocation efficiency is relatively low in Guangxi, Yunnan, and Chongqing in the Southwest, as well as in Inner Mongolia, Shaanxi, Gansu, Ningxia, and Xinjiang in the Northwest. Only Chongqing and Shaanxi are more efficient than the overall average. The low level of innovation factor in these areas is attributed to their inland location, unlike the coastal areas where the economy is relatively developed, yet scientific and technological innovation is relatively weak. Hence, it is evident that the innovation factor allocation efficiency varies significantly among different regions.
According to Figure 2, overall, the total average innovation factor allocation efficiency of the provinces along the Belt and Road is 0.571. The overall level of efficiency is not high, probably due to the large disparity in the level of economic development and technological innovation among regions. Regionally, the innovation factor allocation efficiency in the southeast, northeast, southwest, and northwest regions is 0.772, 0.545, 0.493, and 0.455, respectively. The data indicates that the innovation factor allocation efficiency is highest in the Southeast, followed by the Northeast, Southwest, and Northwest. The innovation factor allocation efficiency decreases from the eastern coastal areas to the western regions of the mainland. Table 3 ranks the provinces along the Belt and Road based on their average innovation factor allocation efficiency from 2012 to 2021.
3.1.1. Decomposition Results of Innovation Factor Allocation Efficiency
To further investigate the key factors contributing to
changes in the innovation factor allocation efficiency in the provinces along
the Belt and Road. In this study, innovation factor allocation efficiency is
decomposed into pure technical efficiency and scale efficiency components. The
performance relationship of the three is as follows: innovation factor
allocation efficiency (TE) pure technical
efficiency (PTE) scale
efficiency (SE). The decomposition results are shown in Figure 3.
Figure 3 illustrates
that from 2012 to 2021, the average values of TE, PTE, and SE in the provinces
along the Belt and Road are 0.571, 0.689, and 0.838, respectively. That is, SE>PTE>TE. Overall, the changes in SE
and TE tend to be similar, while PTE generally mirrors TE except for a downward
trend in 2012-2014.
According to the regional decomposition results shown in Figure 4, significant differences exist in the PTE among the four regions along the Belt and Road from 2012 to 2021. The average PTE for the Southeast, Northeast, Southwest and Northwest are 0.890, 0.585, 0.574 and 0.632 respectively. The sorting results are as follows: Southeast > Northwest > Northeast > Southwest. The reason is that the Southeast region is close to the coast and has a more developed economy, which gives it a unique advantage over other regions in terms of policy support, technological innovation and the introduction of talents. Landlocked and
limited by their geographical locations, other regions have less developed
economies compared to the southeastern coastal regions, and they have a
relatively weak attraction for skilled personnel. The low level of PTE development indicates that the development of
innovative elements lags far behind that of the developed areas along the
southeastern coast. From
the perspective of the SE development level, there is little difference between
the four regions. The
average SE values for the Southeast, Northeast, Southwest, and Northwest are
0.874, 0.891, 0.886, and 0.757, respectively. The
four regions were ranked as Northeast > Southwest > Southeast > Northwest. The analyses of PTE and SE
indicate that the development level of SE is closer to the DEA efficiency
frontier, suggesting a relatively efficient state. It can be concluded that future efforts should
prioritize technological advancement to stimulate innovation. Continuously expanding the
production scale may result in output redundancy, hindering the innovation
factor allocation efficiency. Therefore, regions along the Belt and Road should
enhance governmental regulatory systems, rigorously manage resource allocation,
optimize regional industrial structures, mitigate output redundancy, and
consistently foster innovation levels within the Belt and Road regions.
3.2. Malmquist Index Model Results
This section employs the panel data DEA-Malmquist index model to compute the TFP of innovation factor allocation among the provinces along the Belt and Road in China from 2012 to 2021. The findings are presented in Table 5.
Table 4 reveals that the TFP of overall innovation factor allocation in the 17 provinces along the Belt and Road exceeds 1 during the period 2012-2021. The average TFP over the past 10 years stands at 1.165, indicating an average annual growth rate of innovation factors at 16.5%. It shows that from 2012 to 2021, the allocation efficiency of innovation facto allocation efficiency has made great progress. The level of innovation factors in the provinces along the Belt and Road has experienced a consistent upward trend over the past 10 years. Regarding the decomposition index, the EFFCH has shown minimal fluctuation over the decade, with an average value of 1.026 and an average annual growth rate of 2.6%. TECH exhibits a more significant trend of fluctuation, averaging 1.124 with an annual growth rate of 12.4%. Figure 5 illustrates that TFP and TECH in the provinces along the Belt and Road exhibit similar fluctuation trends. This indicates that TECH has the most significant impact on TTFP during the period 2012-2021, underscoring the crucial role of technological innovation in enhancing the level of innovation factors.
Further examination of EFFCH in Figure 5 reveals that the fluctuation trends of EFFCH and PECH from 2012 to 2019 align closely, suggesting that EFFCH is primarily influenced by PECH. Similarly, during the period 2019-2021, EFFCH exhibits fluctuations mirroring those of SECH. Overall, PECH and SECH emerge as the primary factors influencing EFFCH enhancement. From 2012 to 2021, PECH maintains an average value of 1.010, exhibiting an average annual growth rate of 1%, while SECH holds an average value of 1.012, with an average annual growth rate of 1.2%.
Table 5 indicates that, except Fujian, all other provinces and cities demonstrate a TFP greater than 1. This indicates that the level of innovation factor allocation in the 17 provinces and cities along the Belt and Road has been on the rise, and the development trend is favorable from 2012 to 2021. Ningxia exhibits the highest TFP, with an average annual increase of 62.8%, while Fujian records the lowest TFP at 0.944, with an average annual decrease of 5.6%. Among these, 12 provinces and cities, such as Inner Mongolia, Heilongjiang, Shanghai, and Zhejiang, have experienced average annual increases of over 10%, comprising a total of 70.6%. Except for Fujian, the other four provinces saw increases of less than 10%. This indicates that these regions have achieved a more balanced and comprehensive input and output of innovation factors, leading to significant advancements in technological innovation, industrial structure, management level, and institutional reform. Conversely, Fujian's decline in TFP is primarily influenced by TECH. Moving forward, it should prioritize the enhancement of science and technology, introduce a broader range of scientific and technological achievements to drive innovation, and consistently bolster supervision, management, and the optimization of the region's industrial structure.
3.3. Spatial Autocorrelation Analysis
3.3.1. Global Spatial Autocorrelation Analysis
Building upon the aforementioned static and dynamic analyses of innovation factor allocation efficiency, it is evident that spatial correlations may exist among regions along the Belt and Road. Hence, it becomes imperative to investigate the spatial distribution of efficiency, to understand the internal relationships of innovation factor allocation efficiency from a global spatial perspective. According to formula (12), the global Moran index of the allocation efficiency of innovation factors in the regions along the Belt and Road in China during 2012-2021 is calculated. The calculation results are shown in Table 6.
Table 6 illustrates that the global Molan index values for innovation factor allocation efficiency among provinces along the Belt and Road from 2012 to 2016 all exceed 0, with Z-value surpassing their respective critical values. Moreover, the P-value is significant at the 1% and 5% levels. This suggests that the allocation efficiency of innovation factors in the regions along the Belt and Road during this period exhibits a pronounced agglomeration characteristic in spatial distribution. The P-value for 2017 is 0.200, failing to meet the significance threshold and indicating spatial uncorrelation. Moreover, during the period 2018-2021, the spatial distribution of regional efficiency along the Belt and Road exhibits considerable instability. The innovation factor allocation efficiency transitioned from spatial correlation in 2018 to spatial non-correlation in 2019-2020. However, it exhibited significant spatial correlation in 2021, with significance at the 5% level. This suggests a declining trend in the spatial distribution agglomeration of innovation factor allocation efficiency along the Belt and Road from 2012 to 2021. Figure 6 illustrates the trend of the global Moran Index from 2012 to 2021.
As can be seen from Figure 3, the Global Moran index has declined from 0.582 in 2012 to 0.367 in 2021. The concentration degree of spatial distribution of innovation factor allocation efficiency across all regions exhibits a significant fluctuating trend. Between 2012 and 2014, the global Moran index value for innovation factor allocation efficiency along the Belt and Road exhibited a slight upward trend. This may be attributed to the initiation of the Belt and Road development plan in 2013. Initially, the developed areas along the southeast coast enhanced their scientific and technological innovation systems, fostering extensive exchanges and collaborations with various regions in the innovation field, thereby propelling rapid advancements in innovation levels among the regions along the route. Consequently, the spatial distribution of innovation factor allocative efficiency during this period exhibits strong correlation and clustering. Between 2015 and 2017, the Moran Index experienced a significant decrease, leading to a reduction in the degree of spatial correlation agglomeration along the route. This can be attributed to the vigorous promotion of economic development along the Belt and Road during this period, leading to a constant balance between innovation input and output in the regions along the route. Between 2017 and 2021, the global Moran index value exhibited an initial decrease followed by an increase, with the index value for 2020 at 0.040, indicating no spatial correlation among regions. This coincided with the year of the coronavirus outbreak in China. In 2021, the value surged to 0.367, indicating a substantial increase, likely attributable to the effective epidemic control measures implemented by the Chinese government and the accelerated regional innovation development within the framework of an innovation-driven strategy. These factors have further elevated the spatial correlation degree of innovation factor allocative efficiency among the regions along the route.
3.3.2. Local Spatial Autocorrelation Analysis
While the global spatial Moran index portrays the overall spatial distribution of innovation factor allocation efficiency across the 17 provinces and cities along the Belt and Road in China, it fails to capture the local spatial distribution relations within the region. Hence, the study investigates the spatial agglomeration of innovation factor allocation efficiency within local areas. In this study, the local Moran index of innovation factor allocation efficiency is computed for the years 2012, 2015, 2018, and 2021 using equation (13). The calculation results allow for the categorization of the local concentration of innovation factor allocation efficiency into four quadrants. The first quadrant corresponds to the H-H type, signifying high innovation factor allocation efficiency within the region as well as in neighboring regions. In the second quadrant, denoted as L-H type, the region exhibits low innovation factor allocation efficiency, while the efficiency in the surrounding region is high. The third quadrant, identified as L-L, signifies low-efficiency values in both the region itself and its surroundings. Finally, the fourth quadrant, labeled H-L, indicates higher innovation factor allocation efficiency within the region compared to its neighboring regions. The results of the quadrantal distribution are shown in Figure 7.
Figure 7 reveals that the majority of the local Moran index values for innovation factor allocation efficiency along the Belt and Road are concentrated in the third quadrant, suggesting that the innovation factor allocation efficiency along the Belt and Road is predominantly of the L-L type. In the Southeast region, Shanghai and Zhejiang consistently fall into the first quadrant, reflecting their more developed economies and ongoing advancements in scientific and technological innovation. However, Fujian, Guangdong, and Hainan, also situated in the southeast coastal area, experience relatively significant changes. Apart from being in the first quadrant in 2012, all subsequent observations in Fujian fall into the second quadrant. This suggests that the allocation efficiency of innovation factors in Fujian is suboptimal, possibly attributed to an overemphasis on economic growth at the expense of innovative technology development. In 2012, 2015, 2018 and 2021, Guangdong is located in the second, fourth and first quadrants respectively. It shows that innovative technology has been improving in recent years. Except for 2021, Hainan is in the third quadrant, and the rest are in the fourth quadrant. In the Northeast region, most areas fall into the first and fourth quadrants, except Jilin, which is situated in the fourth quadrant in 2018 and 2021. Generally, provinces in the Northeast exhibit lower levels of innovation factors compared to those in the Southeast, indicative of less advanced innovative technologies. In 2021, apart from Guangxi located in the first quadrant, southwest regions predominantly fall into the second and third quadrants. Notably, Guangxi demonstrates H-H characteristics in 2021, likely owing to its proximity to Guangdong, which could stimulate the development of technological innovation through radiation effects. Xinjiang and Gansu in the Northwest are always in the third quadrant, and Inner Mongolia is in the third quadrant in all years except 2015 and Qinghai except 2018. The relatively low development of innovation levels in these two regions is primarily attributed to geographical constraints, which significantly hinder the enhancement of innovation factor allocation efficiency. Ningxia and Shaanxi primarily fall into the third and fourth quadrants. Their landlocked nature exacerbates the trend of bifurcation in the innovation factor allocation efficiency due to limited exchanges with more developed regions.
Overall, the number of provinces classified as H-H increased from three in 2012 to four in 2018, primarily concentrated in the southeast and southwest regions. These provinces possess advantages in innovative technologies and exhibit stronger abilities to influence neighboring regions. The number of L-H-type provinces was low at one in 2012 but increased to five in 2021, constituting 29% of the provinces along the route. These provinces exhibit a high concentration type around the perimeter and a low in the middle due to geographic location and other constraints. The number of L-L-type provinces decreased from 11 in 2012 to 6 in 2021, primarily concentrated in the northwestern region. These regions exhibit slow economic development, are economically underdeveloped, and possess a relatively poor base of innovative technology. Additionally, it is challenging for neighboring regions to provide a robust radiation drive, resulting in low innovation factor allocation efficiency. While the number of H-L provinces remains constant, there is a shift in the provinces from Ningxia and Hainan in 2012 to Shaanxi and Jilin in 2021.
4. Conclusion and Policy Recommendation
4.1. Conclusion
This study investigates the innovation factor allocation efficiency in regions along the Belt and Road in China from 2012 to 2021, focusing on high economic quality as a perspective. The study first conducts a static measurement of innovation factor allocation efficiency using the super-efficient SMB-DEA model with non-expected output. Then, it utilizes the Malmquist index model to dynamically assess the innovation factor allocation efficiency in the regions along the Belt and Road, facilitating horizontal and vertical comparisons. Finally, spatial correlation analysis is performed employing global and local Moran index models. The study draws the following main conclusions.
- The average innovation factor allocation efficiency of regions along China's Belt and Road from 2012 to 2021 is 0.571. Specifically, the average innovation factor allocation efficiencies for the Southeast, Northeast, Southwest, and Northwest regions are 0.772, 0.545, 0.493, and 0.455, respectively. The performance is Southeast Northeast Southwest Northwest. Overall, the performance of innovation factor allocation efficiency is not high, exhibiting significant regional disparities and a trend of decline from the eastern coastal region to the western part of the country.
- Examining the PTE and SE components of the decomposition of innovation factor allocation efficiency in the regions along China's Belt and Road, their average values for the period 2012-2021 are 0.689 and 0.838, respectively. The results of the decomposition along the line area show SE>PTE>TE. The SE exhibits the highest level of development and is closer to the DEA efficiency frontier, indicating a relatively efficient state. Conversely, the PTE shows the lowest level. Consequently, it can be inferred that the PTE is the primary cause of inefficiencies impacting the innovation factor allocation efficiency
- A dynamic analysis of the innovation factor allocation efficiency in 17 provinces along the Belt and Road in China revealed that their average TFP value over the period 2012-2021 was 1.165, representing an average annual growth rate of 16.5% in innovation factors. This suggests an increasing utilization rate of innovation factor inputs and outputs across all regions. The trend graphs of Malmquist and decomposition indices indicate that PECH and SECH play crucial roles in enhancing EFFCH, while TECH has the most significant impact on TFP.
- Spatial correlation analysis reveals a high spatial correlation among the 17 provinces along the route. The global Moran index declines from 0.582 in 2012 to 0.367 in 2021, indicating fluctuations in the overall spatial distribution of the clustering degree of innovation factor allocation efficiency in each region. Further analysis using the local Moran index concludes that the innovation factor allocation efficiency of the regions along the Belt and Road primarily falls into the L-L type.
4.2. Policy Recommendation
Based on the above conclusions, the following suggestions are put forward for how to improve the innovation factor allocation efficiency.
- Optimize the allocation of funds for innovative factor inputs, enhance supervision, and vigorously promote economic development. To mobilize the enthusiasm of regions along the Belt and Road for developing innovation factors, it is essential to strengthen and enhance the financial market system. This includes optimizing the mechanism for fiscal expenditure on science and technology, coordinating the promotion of direct and indirect financing, introducing innovative financial products, and providing tailored financial lending services for various scientific and technological enterprises. Additionally, there should be encouragement for insurance institutions to enhance the system of scientific and technological insurance products. Furthermore, establishing a specialized science and technology innovation fund regulator is crucial to bolstering follow-up testing and evaluation of projects and ensuring effective fund utilization. Simultaneously, the government should enact policies supporting innovation fund investments, foster a fair market environment, and activate the potential value of the innovation factor market in each region. Utilizing capital, talent, technology, data, and other innovation factor elements in the innovation factor market activities is vital. This approach aims to continuously enhance the innovation factor allocation efficiency while promoting economic development through innovation.
- Encouraging scientific and technological innovation, facilitating regional talent mobility, and establishing a regional support mechanism for innovation factors. The overall innovation factor allocation efficiency in the Belt and Road region is relatively low, as indicated by the higher level of innovation factor development in the southeast coastal region compared to other regions. Regional governments should develop policies to stimulate scientific and technological innovation, including providing financial support for research, implementing preferential taxation, and strengthening intellectual property protection. They should establish high-level research platforms for outstanding talents, create funds for innovation, and enhance collaboration with enterprises, universities, and research institutes to promote the transformation and application of research results. High-tech firms should foster an innovation culture, improve incentives for innovation, and attract and cultivate talent. Banks should offer flexible financing for high-tech innovation enterprises. Encouraging regional mobility among research talent and supporting talent flow from high- to low-level regions can facilitate knowledge exchange and innovation. Establishing an innovation support mechanism can aid regions with weak innovation by leveraging resources from stronger regions. Government intervention should prioritize central and western regions, aiming to bridge regional disparities and achieve high-quality development.
- Enhancing the upgrading of regional industrial structure and enhancing the ecological system for innovation factor allocation. The regions along China's Belt and Road exhibit geographical complexity and diversity, leading to significant differences in economic levels. The innovation factor allocation efficiency in these regions is predominantly of the L-L type. To achieve shared development, regions should optimize their industrial structure and facilitate the structural upgrading of industrial innovation allocation. Consequently, high-tech enterprises across provinces should increase investment in scientific research funding, gradually expand industry scale, and consistently standardize enterprise fund supervision systems to mitigate resource waste and other issues. The government should not only offer macro-level financial guarantees for enterprises but also assume an organizational role in core technology research and development, emphasizing the theme of high-tech enterprise scientific and technological innovation. Each region should leverage its industrial and resource advantages to propel in-depth upgrading of modern industrial structures and traditional industries, fostering a high-standard technology industry trading platform. Additionally, deep integration of traditional and modern data and information industries is essential to create a digital innovation ecosystem for information sharing, accelerating digitalization efforts, and enhancing innovation factor flow among regions along China's Belt and Road. By leveraging both government and market roles, we can fortify and enhance the ecosystem for innovation factor allocation.
Author Contributions
Conceptualization, P.L. and G.H.; methodology, P.L.; software, P.L.; validation, P.L., G.H.; formal analysis, P.L.; investigation, X.L.; resources, H.Y.; data curation, H.Y.; writing—original draft preparation, P.L.; writing—review and editing, G.H.; visualization, P.L.; supervision, X.L.; project administration, P.L.; funding acquisition, G.H. All authors have read and agreed to the published version of the manuscript.
Acknowledgments
This research is funded by 2022 Hebei Province Social Science Development Research Project (20220202109).
Conflicts of Interest
The authors declare that they have no conflicts of interest.
References
- Huang, Y. (2016). Understanding China's Belt & Road initiative: motivation, framework and assessment. China Economic Review, 40, 314-321. [CrossRef]
- Johnston, L. A. (2019). The Belt and Road Initiative: what is in it for China?. Asia & the Pacific Policy Studies, 6(1), 40-58. [CrossRef]
- Tekdal, V. (2018). China's Belt and Road Initiative: at the crossroads of challenges and ambitions. The Pacific Review, 31(3), 373-390. [CrossRef]
- Wei, S. J. Wei, S. J., Xie, Z., & Zhang, X. (2017). From “made in China” to “innovated in China”: Necessity, prospect, and challenges. Journal of Economic Perspectives, 31(1), 49-70. [CrossRef]
- Zhang, F., Wu, F., & Cooke, P. (2010). China’s changing national and regional innovation systems and regional distribution of R&D. Geography Compass, 4(6), 532-544. [CrossRef]
- Liang, S., & Tan, Q. (2024). Can the digital economy accelerates China's export technology upgrading? Based on the perspective of export technology complexity. Technological Forecasting and Social Change, 199, 123052. [CrossRef]
- Zhang, Y., Zhang, Z., Jin, H., Tu, W., & Liu, Y. (2024). Innovation and OFDI along the Belt and Road. Technological Forecasting and Social Change, 200, 123136. (. [CrossRef]
- Ma, W., Bo, N., & Wang, X. (2024). Can greater openness improve green economy efficiency of countries along the belt and Road Initiative?. Heliyon. [CrossRef]
- Blažek, J., Žížalová, P., Rumpel, P., Skokan, K., & Chládek, P. (2013). Emerging regional innovation strategies in Central Europe: institutions and regional leadership in generating strategic outcomes. European urban and regional studies, 20(2), 275-294. [CrossRef]
- Jianmin, W., & Li, Y. (2020). Does factor endowment allocation improve technological innovation performance? An empirical study on the Yangtze River Delta region. Science of the Total Environment, 716, 137107. [CrossRef]
- Gao, Q., Cheng, C., & Sun, G. (2023). Big data application, factor allocation, and green innovation in Chinese manufacturing enterprises. Technological Forecasting and Social Change, 192, 122567. [CrossRef]
- Xu, Y., Wang, Z. C., & Tao, C. Q. (2024). Can innovative pilot city policies improve the allocation level of innovation factors?–Evidence from China. Technological Forecasting and Social Change, 200, 123135. [CrossRef]
- Kogan, L. Kogan, L., Papanikolaou, D., Seru, A., & Stoffman, N. (2017). Technological innovation, resource allocation, and growth. The Quarterly Journal of Economics, 132(2), 665-712. [CrossRef]
- Cao, Y. H., You, J. X., Shi, Y. J., & Hu, W. (2021). Research on the allocation efficiency and influencing factors of scientific and technological resources in the Yangtze river delta city group. Sustainability, 13(14), 7951. (, 14. [CrossRef]
- Xu, M., Qi, Y., Tao, C., & Zhang, S. (2022). A Random Forest Method for Identifying the Effectiveness of Innovation Factor Allocation. Computational Intelligence and Neuroscience, 2022. (. [CrossRef]
- Wang, B., & Liu, Y. (2023). Calculating regional innovation efficiency and factor allocation in China: the price signal perspective. Applied Economics, 1-19. [CrossRef]
- Ji, Y., Cai, H., & Wang, Z. (2023). Impact of industrial synergy on the efficiency of innovation resource allocation: Evidence from chinese metropolitan areas. Land, 12(1), 177. [CrossRef]
- Liu, M. L., & Wang, J. (2022). Regional innovation Factors, Allocation Efficiency and Innovation Performance. Statistics & Decisio (09), 169-174. [CrossRef]
- Wang, X. Y., & Jin, G. H. (2023). Research on the efficiency of innovation factor allocation from the perspective of high-qualityeconomic development in China: Analysis based on three-stage DEA-Malmguist-Tobit model. Price:Theory & Practice (12),174-178+204. [CrossRef]
- Men, X. P., Li, X. H., & He, J. Y. (2022). Regional Differences and Dynamic Evolution of Allocation Efficiency of Innovation Factors: Statistical Measurement Based on the Yangtze River Economic Belt. Statistics & Decisio (17), 97-102. [CrossRef]
- Wang, J. M., & Yang, L. (2020). Innovation Elements,Allocation Efficiency and the Performance of Innovation in the Yangtze River Delta Region. Shanghai Journal of Economic (01), 75-85. [CrossRef]
- Xu, Y., & Zhao, J. F. (2020). Measurement of the Coupling Degree of Innovation Elements Allocation and Economic High-Quality Development in China. Journal of Quantitative & Technological (10), 46-64. [CrossRef]
- Charnes, A., Cooper, W. W., & Rhodes, E. (1978). Measuring the efficiency of decision making units. European journal of operational research, 2(6), 429-444. 6). [CrossRef]
- Tone, K. (2001). A slacks-based measure of efficiency in data envelopment analysis. European journal of operational research, 130(3), 498-509. [CrossRef]
- Zhong, K., Wang, Y., Pei, J., Tang, S., & Han, Z. (2021). Super efficiency SBM-DEA and neural network for performance evaluation. Information Processing & Management, 58(6), 102728.
- Caves, D. W., Christensen, L. R., & Diewert, W. E. (1982). The economic theory of index numbers and the measurement of input, output, and productivity. Econometrica: Journal of the Econometric Society, 1393-1414. [CrossRef]
- Zhang, H., Hu, J., Hao, F., & Zhang, Y. (2024). Spatio-temporal evolution of provincial ecological footprint and its determinants in China: A spatial econometric approach. Journal of Cleaner Production, 434, 140331. [CrossRef]
Figure 1.
Map of regional division along the Belt and Road.
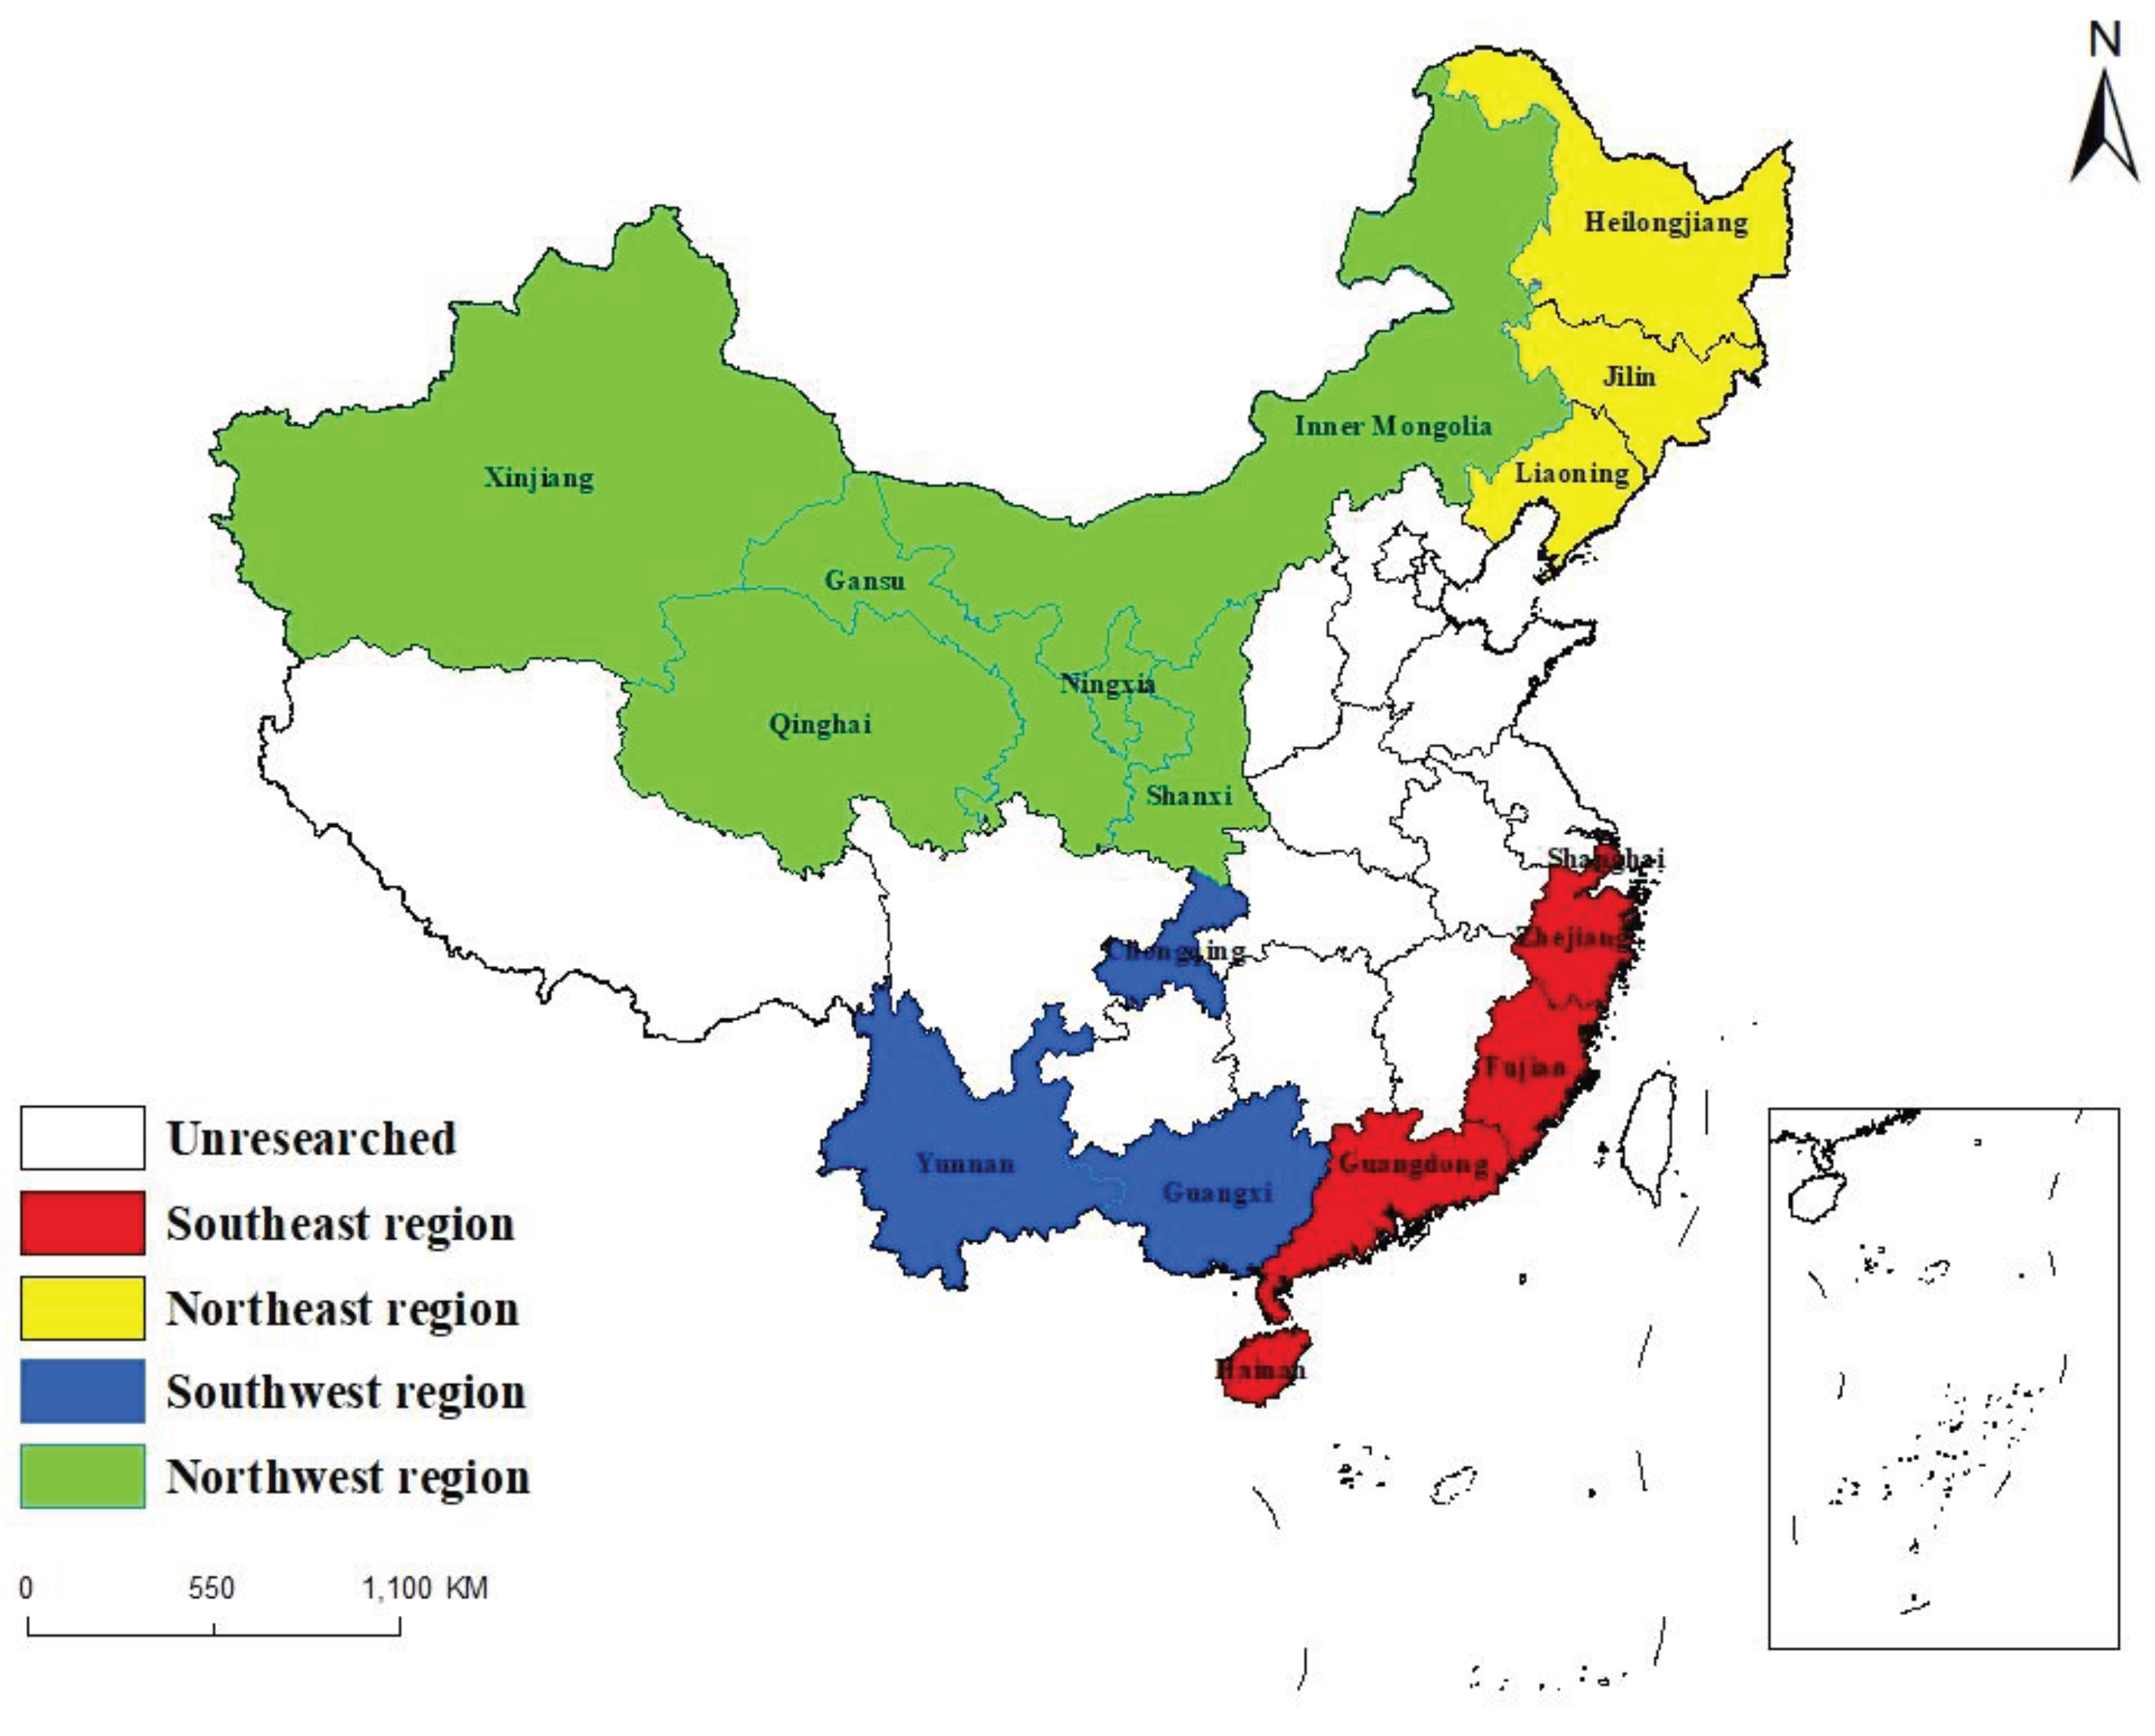
Figure 2.
Average innovation factor allocation efficiency in regions along the Belt and Road.
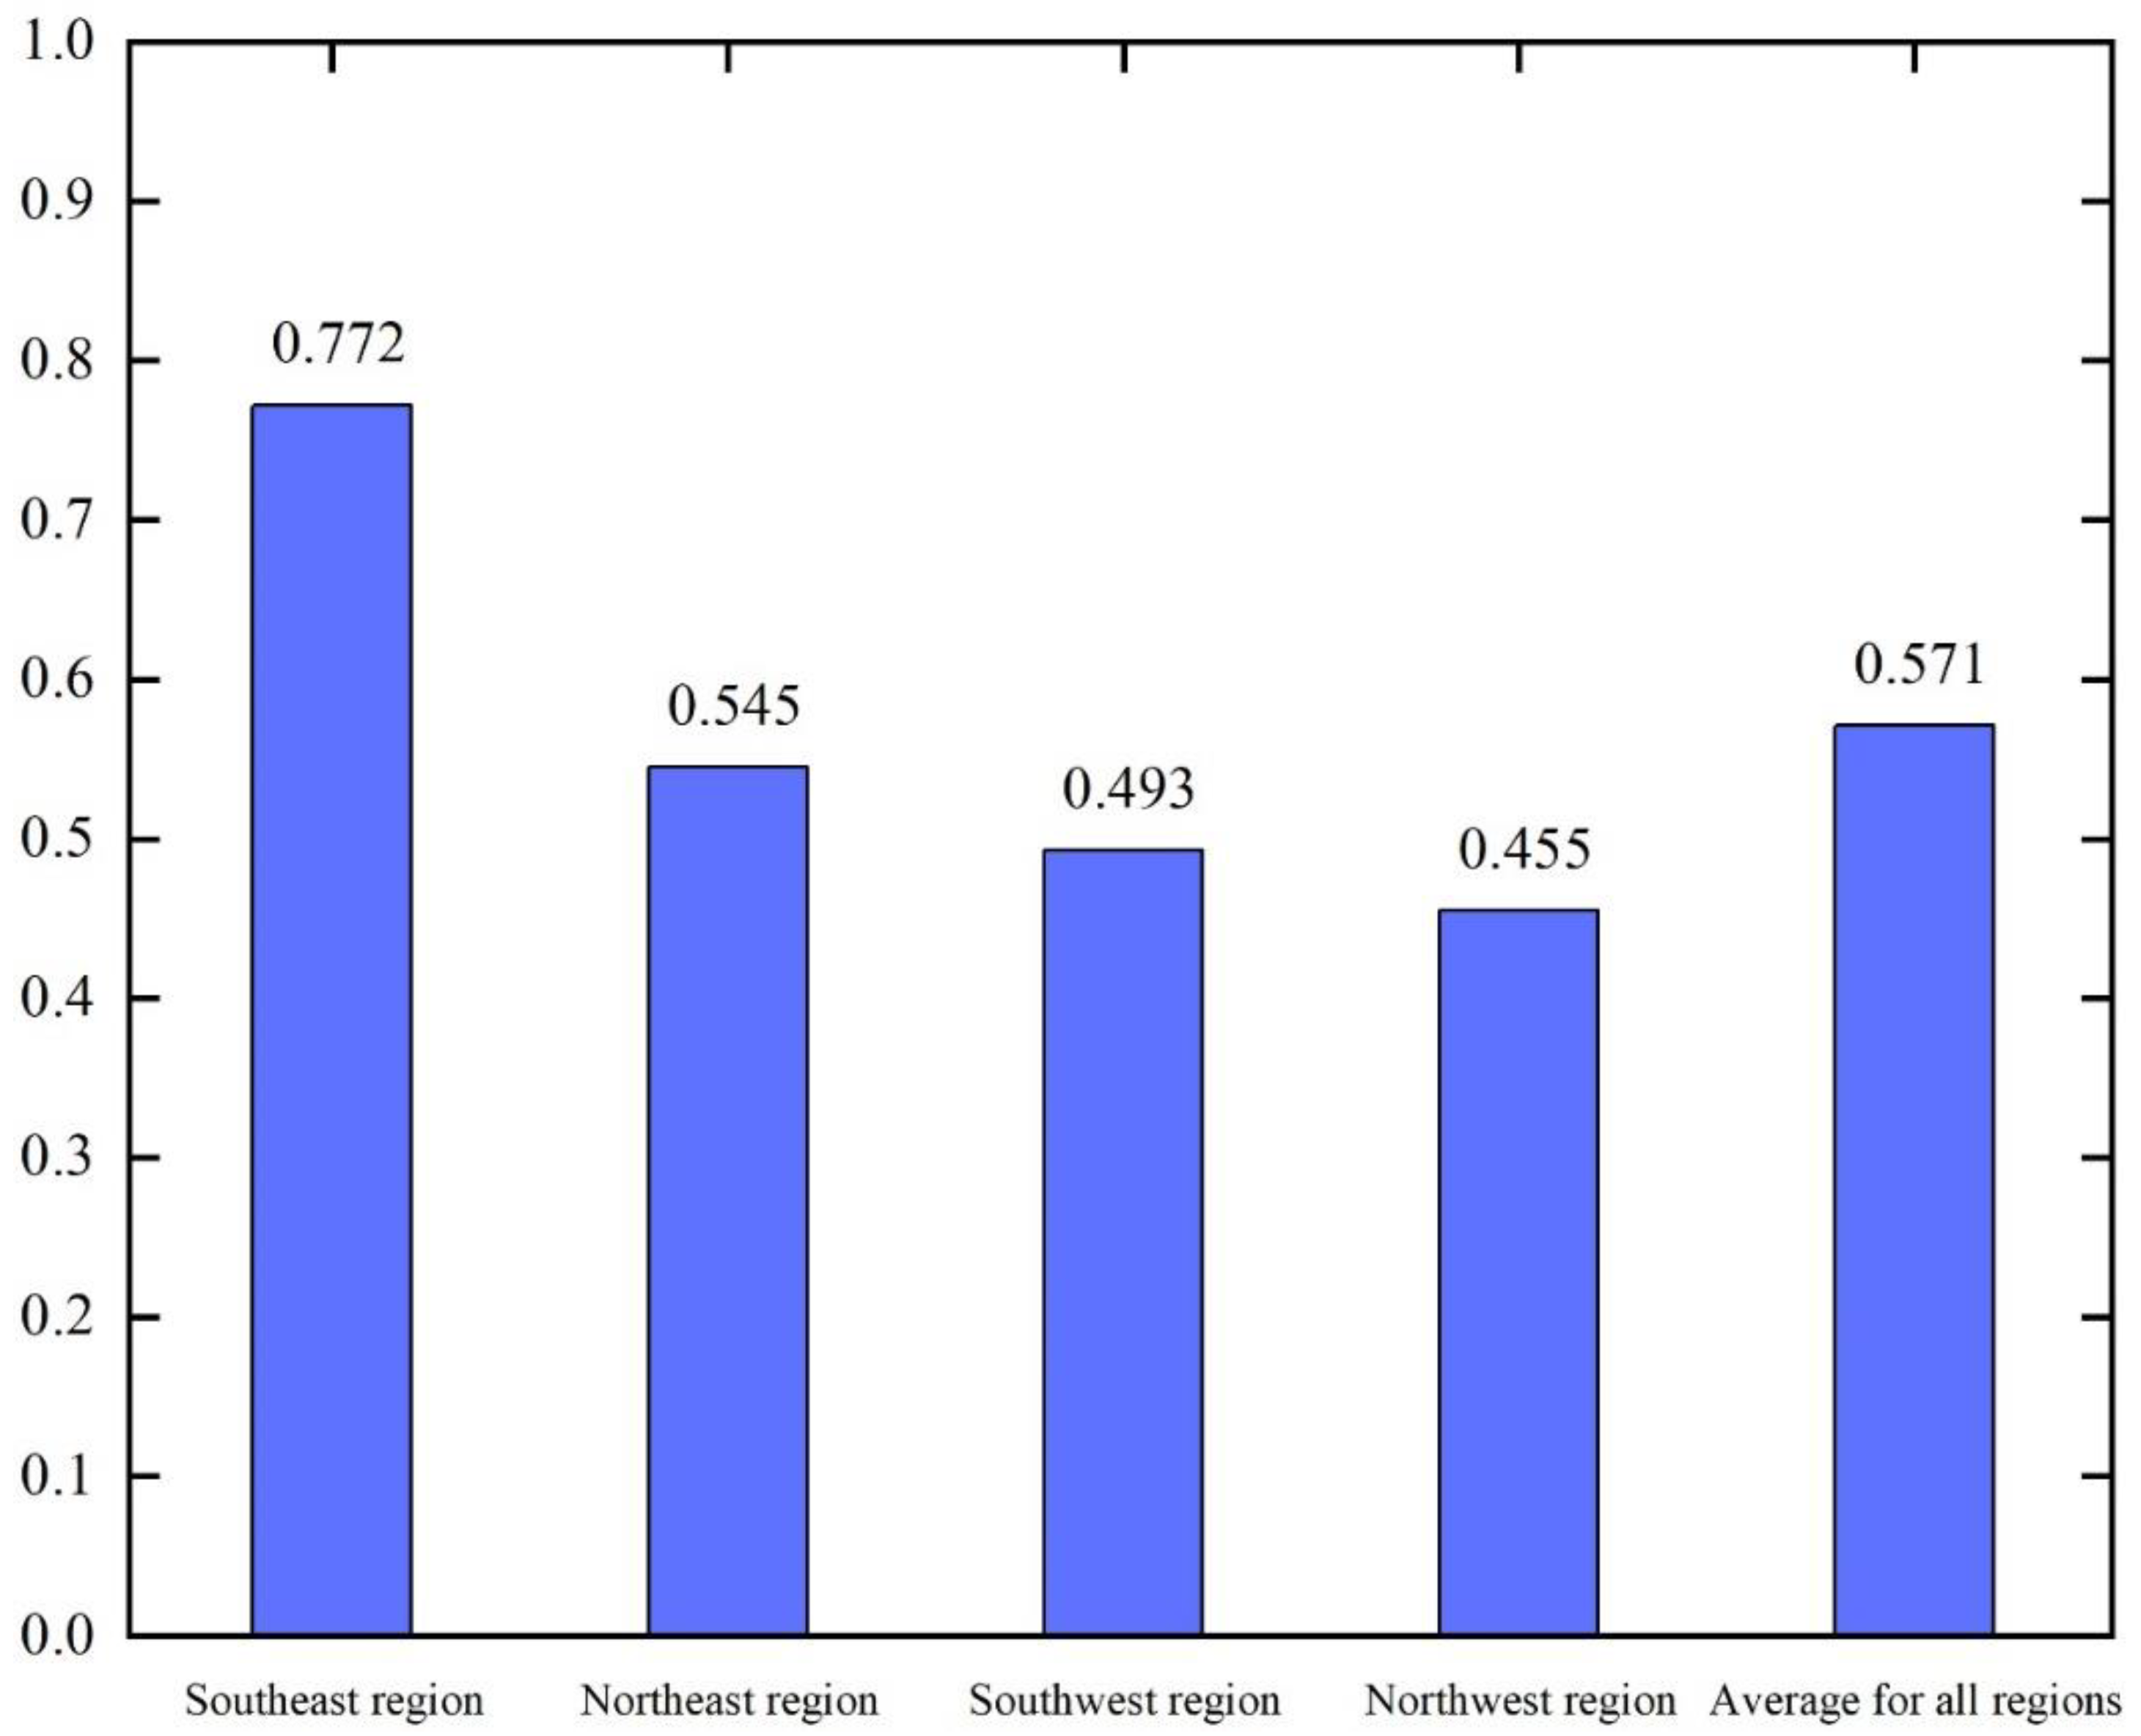
Figure 3.
Results of the decomposition of the innovation factor allocation efficiency and trends in change.
Figure 3.
Results of the decomposition of the innovation factor allocation efficiency and trends in change.
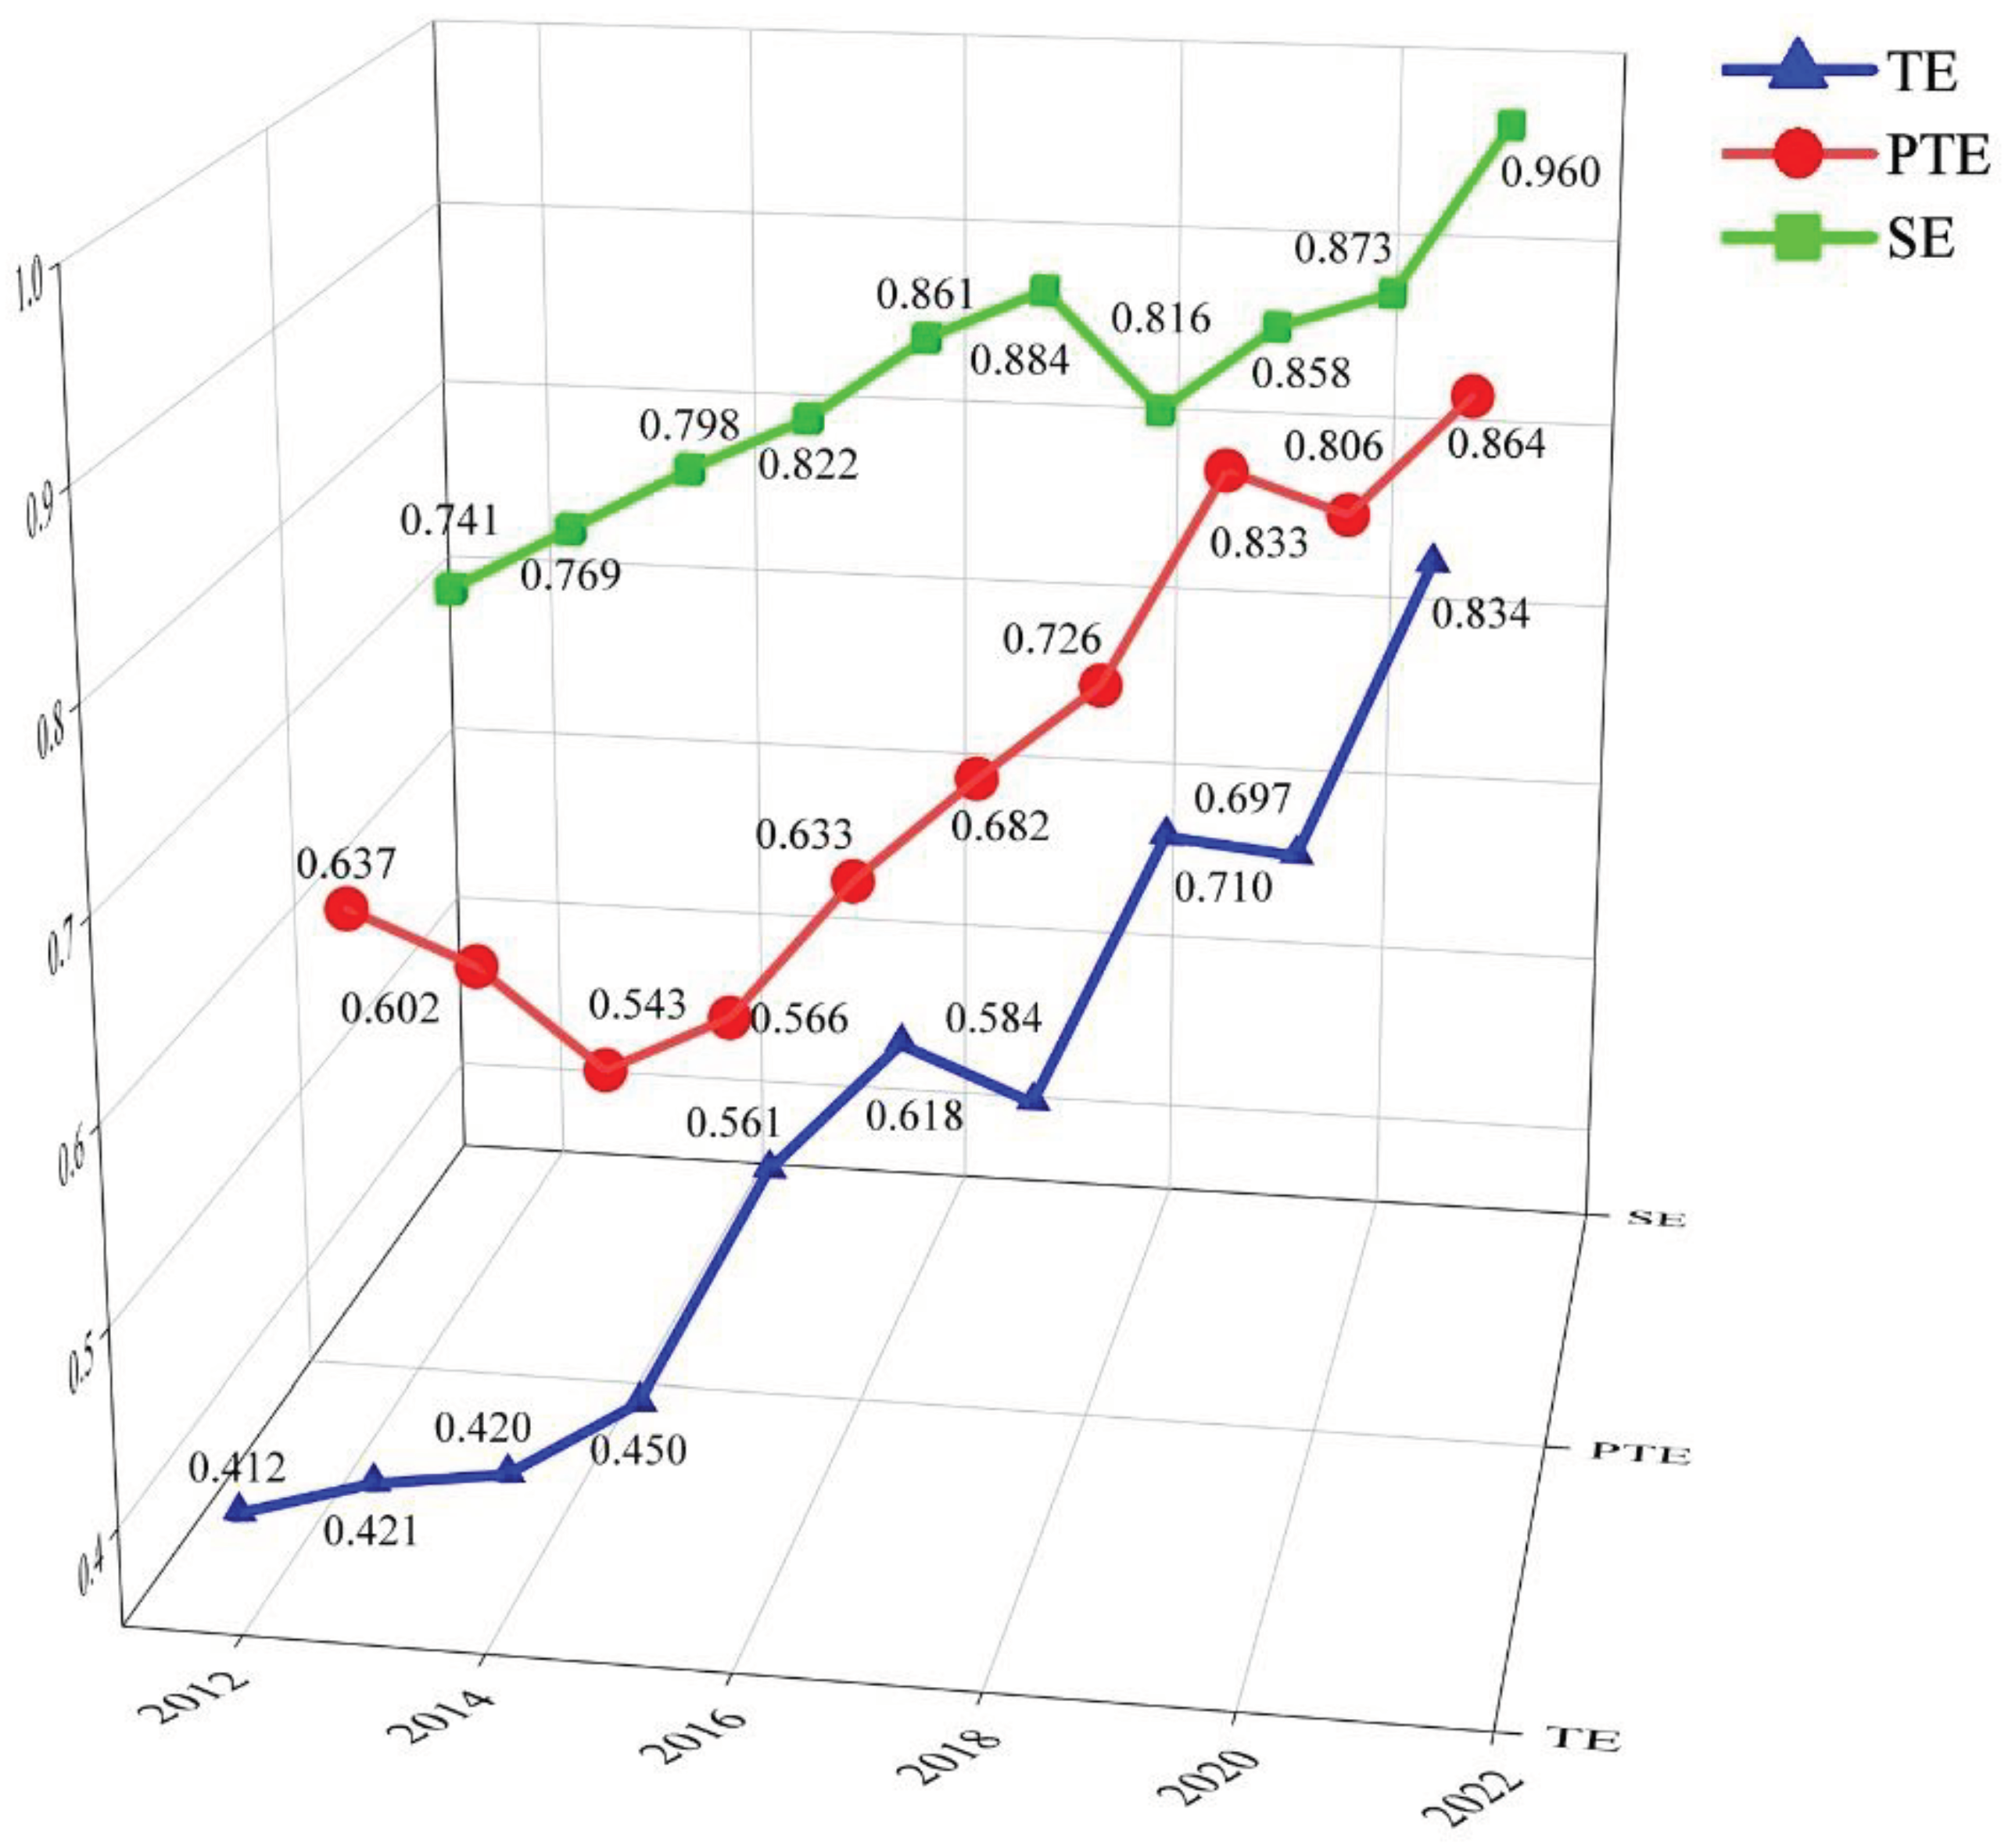
Figure 4.
Decomposition results of the innovation factor allocation efficiency in regions along the route.
Figure 4.
Decomposition results of the innovation factor allocation efficiency in regions along the route.
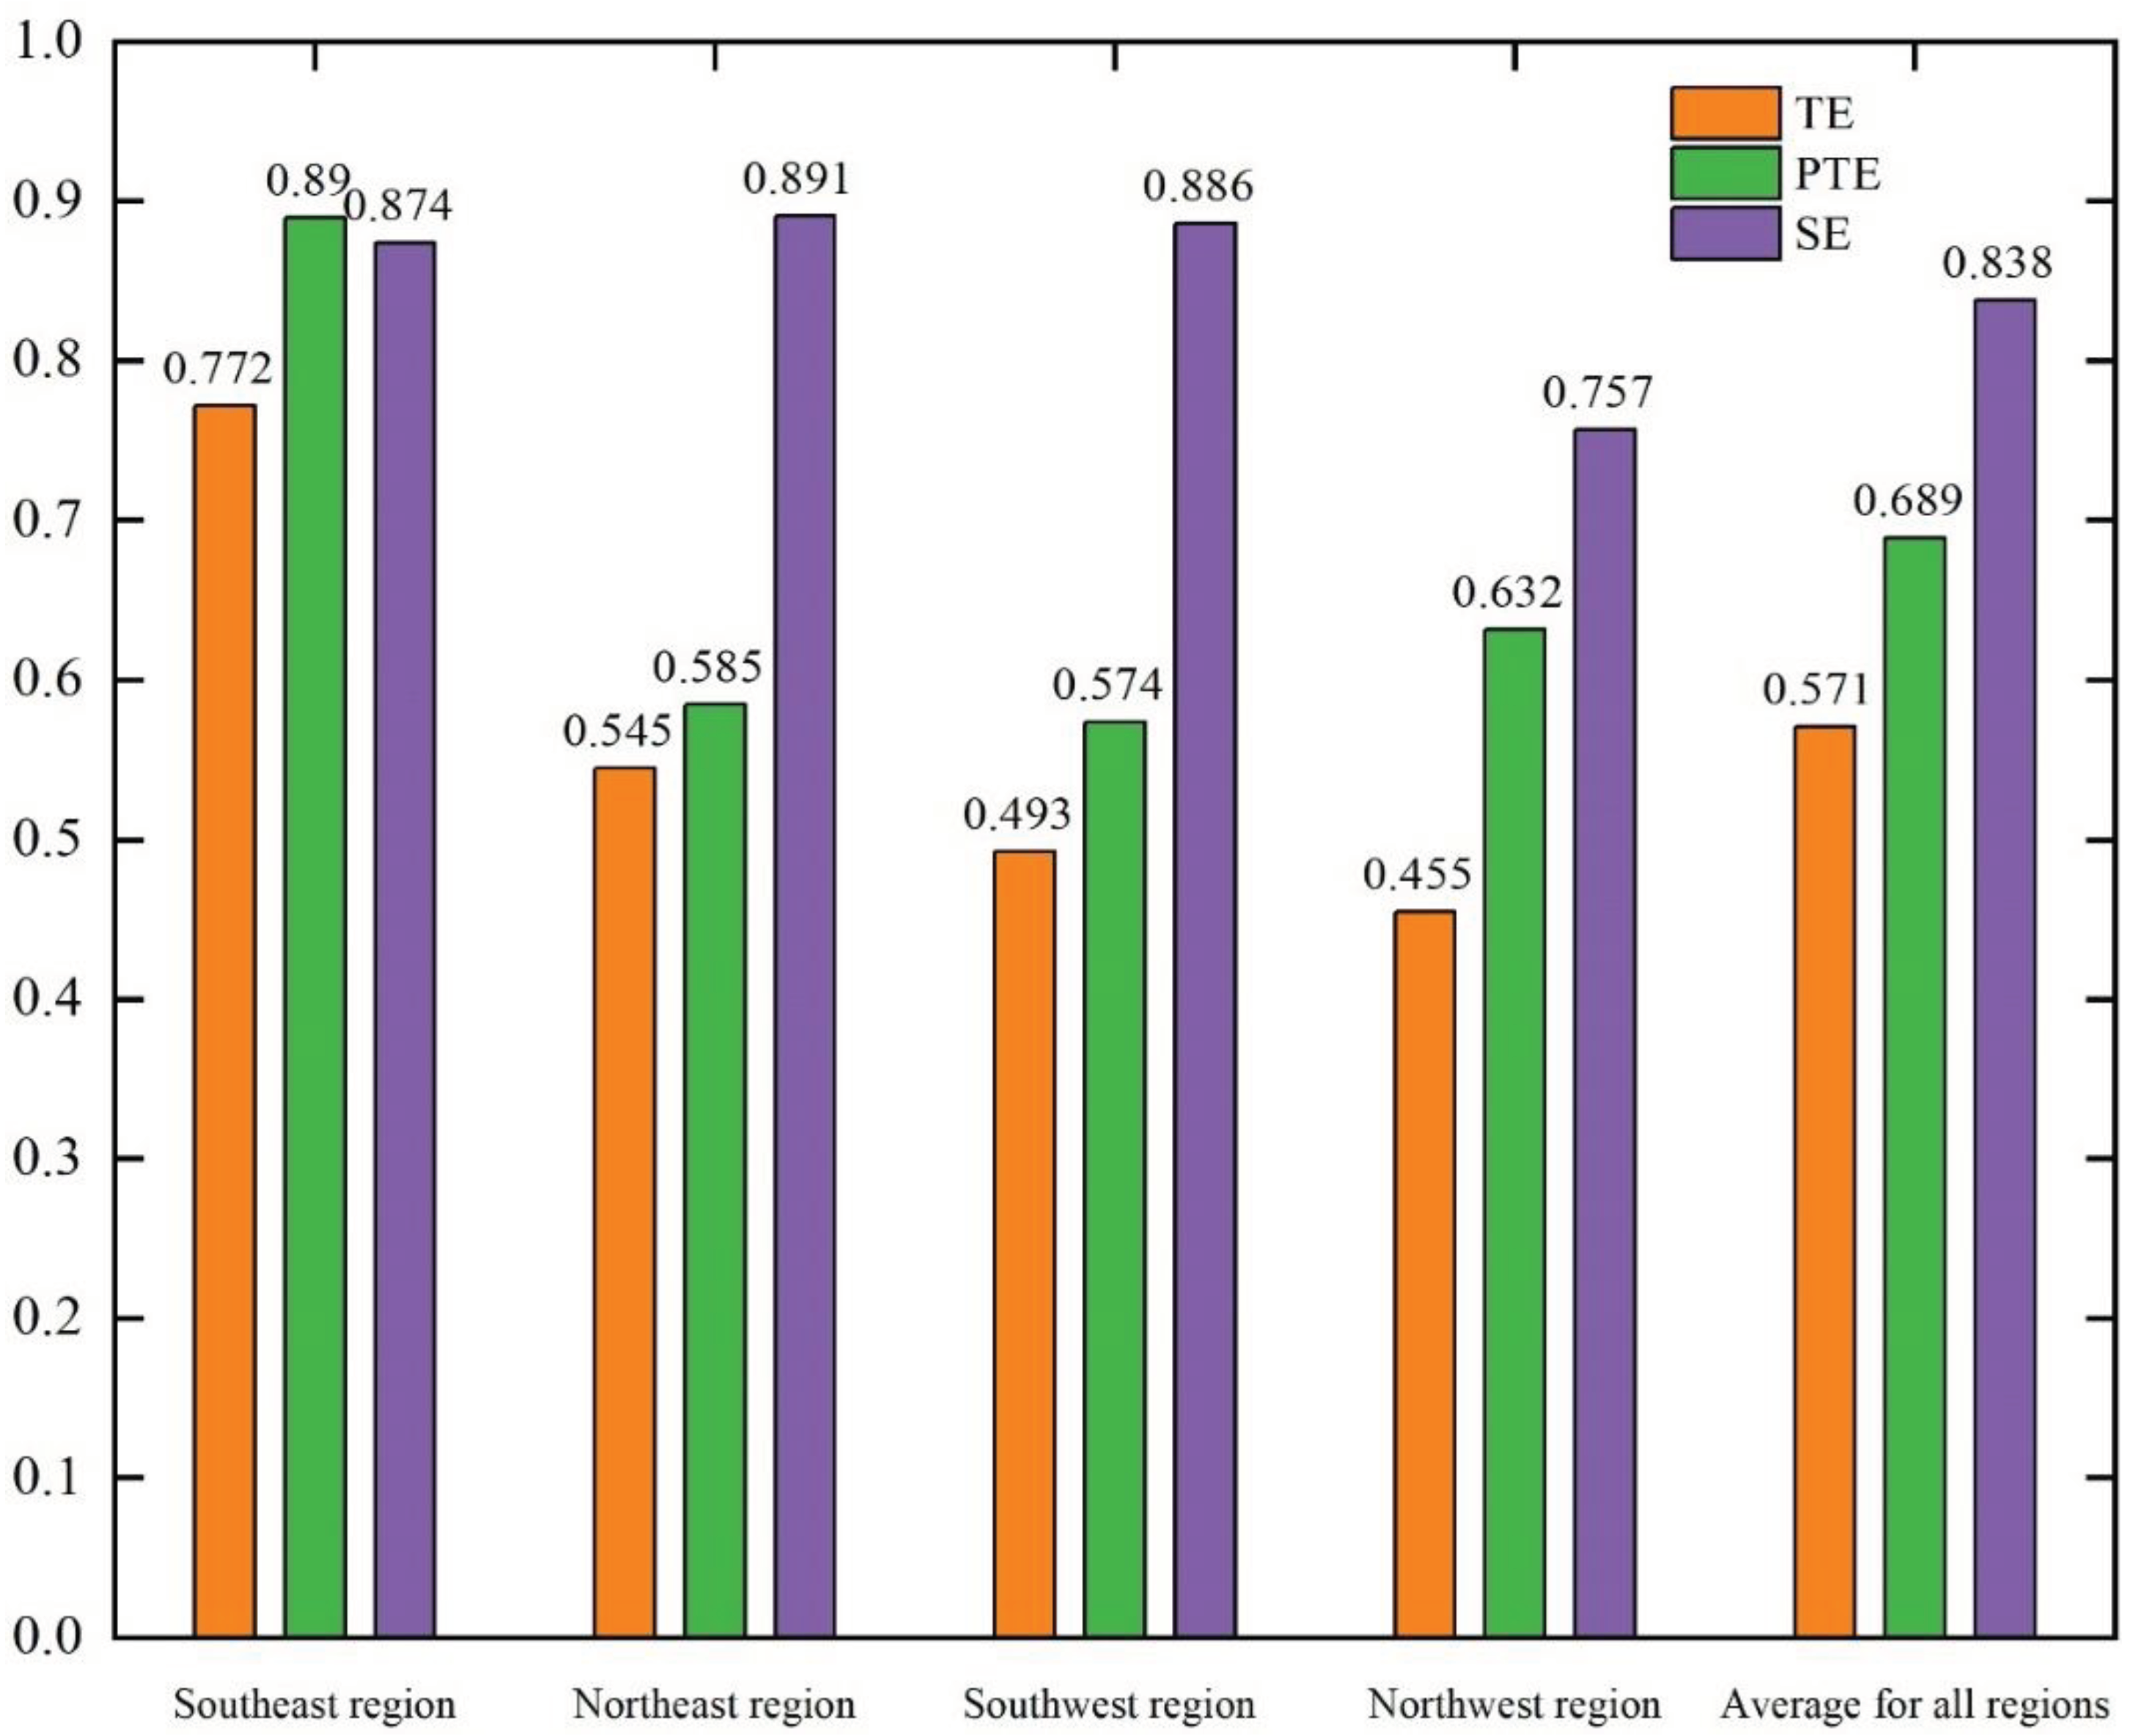
Figure 5.
Trends in Malmquist and decomposition indices.
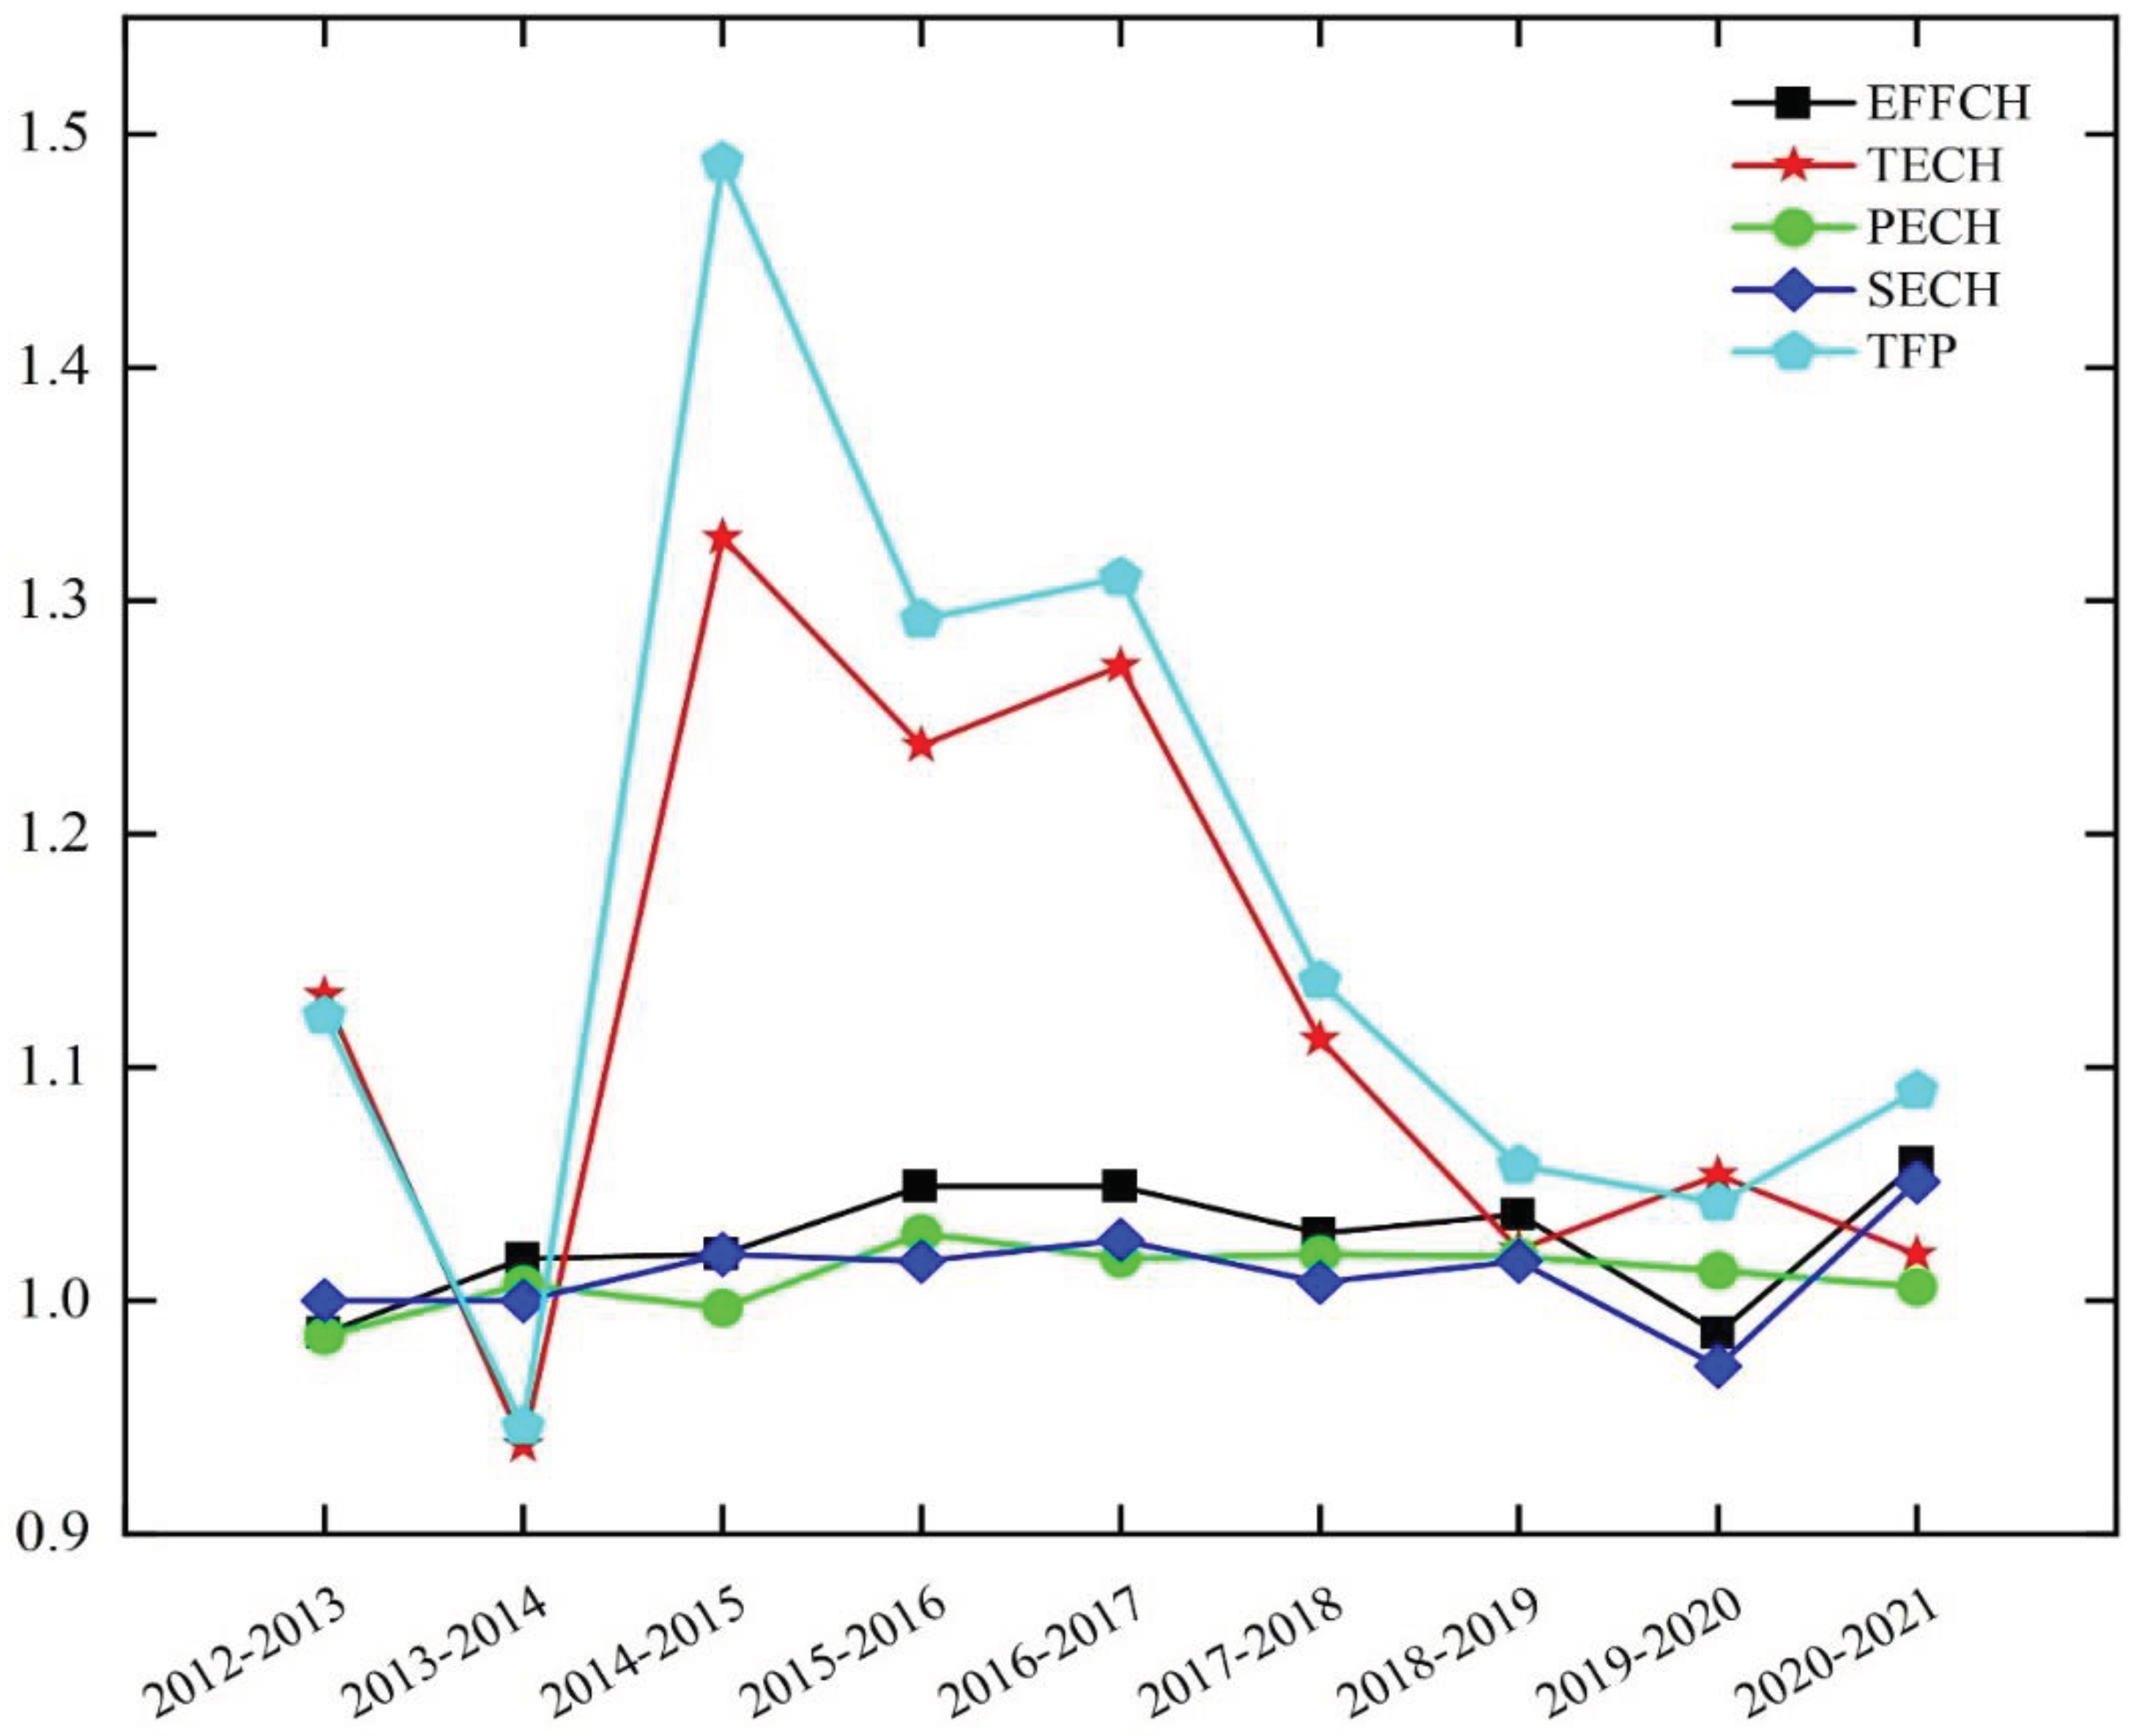
Figure 6.
Changing trend of Moran index.
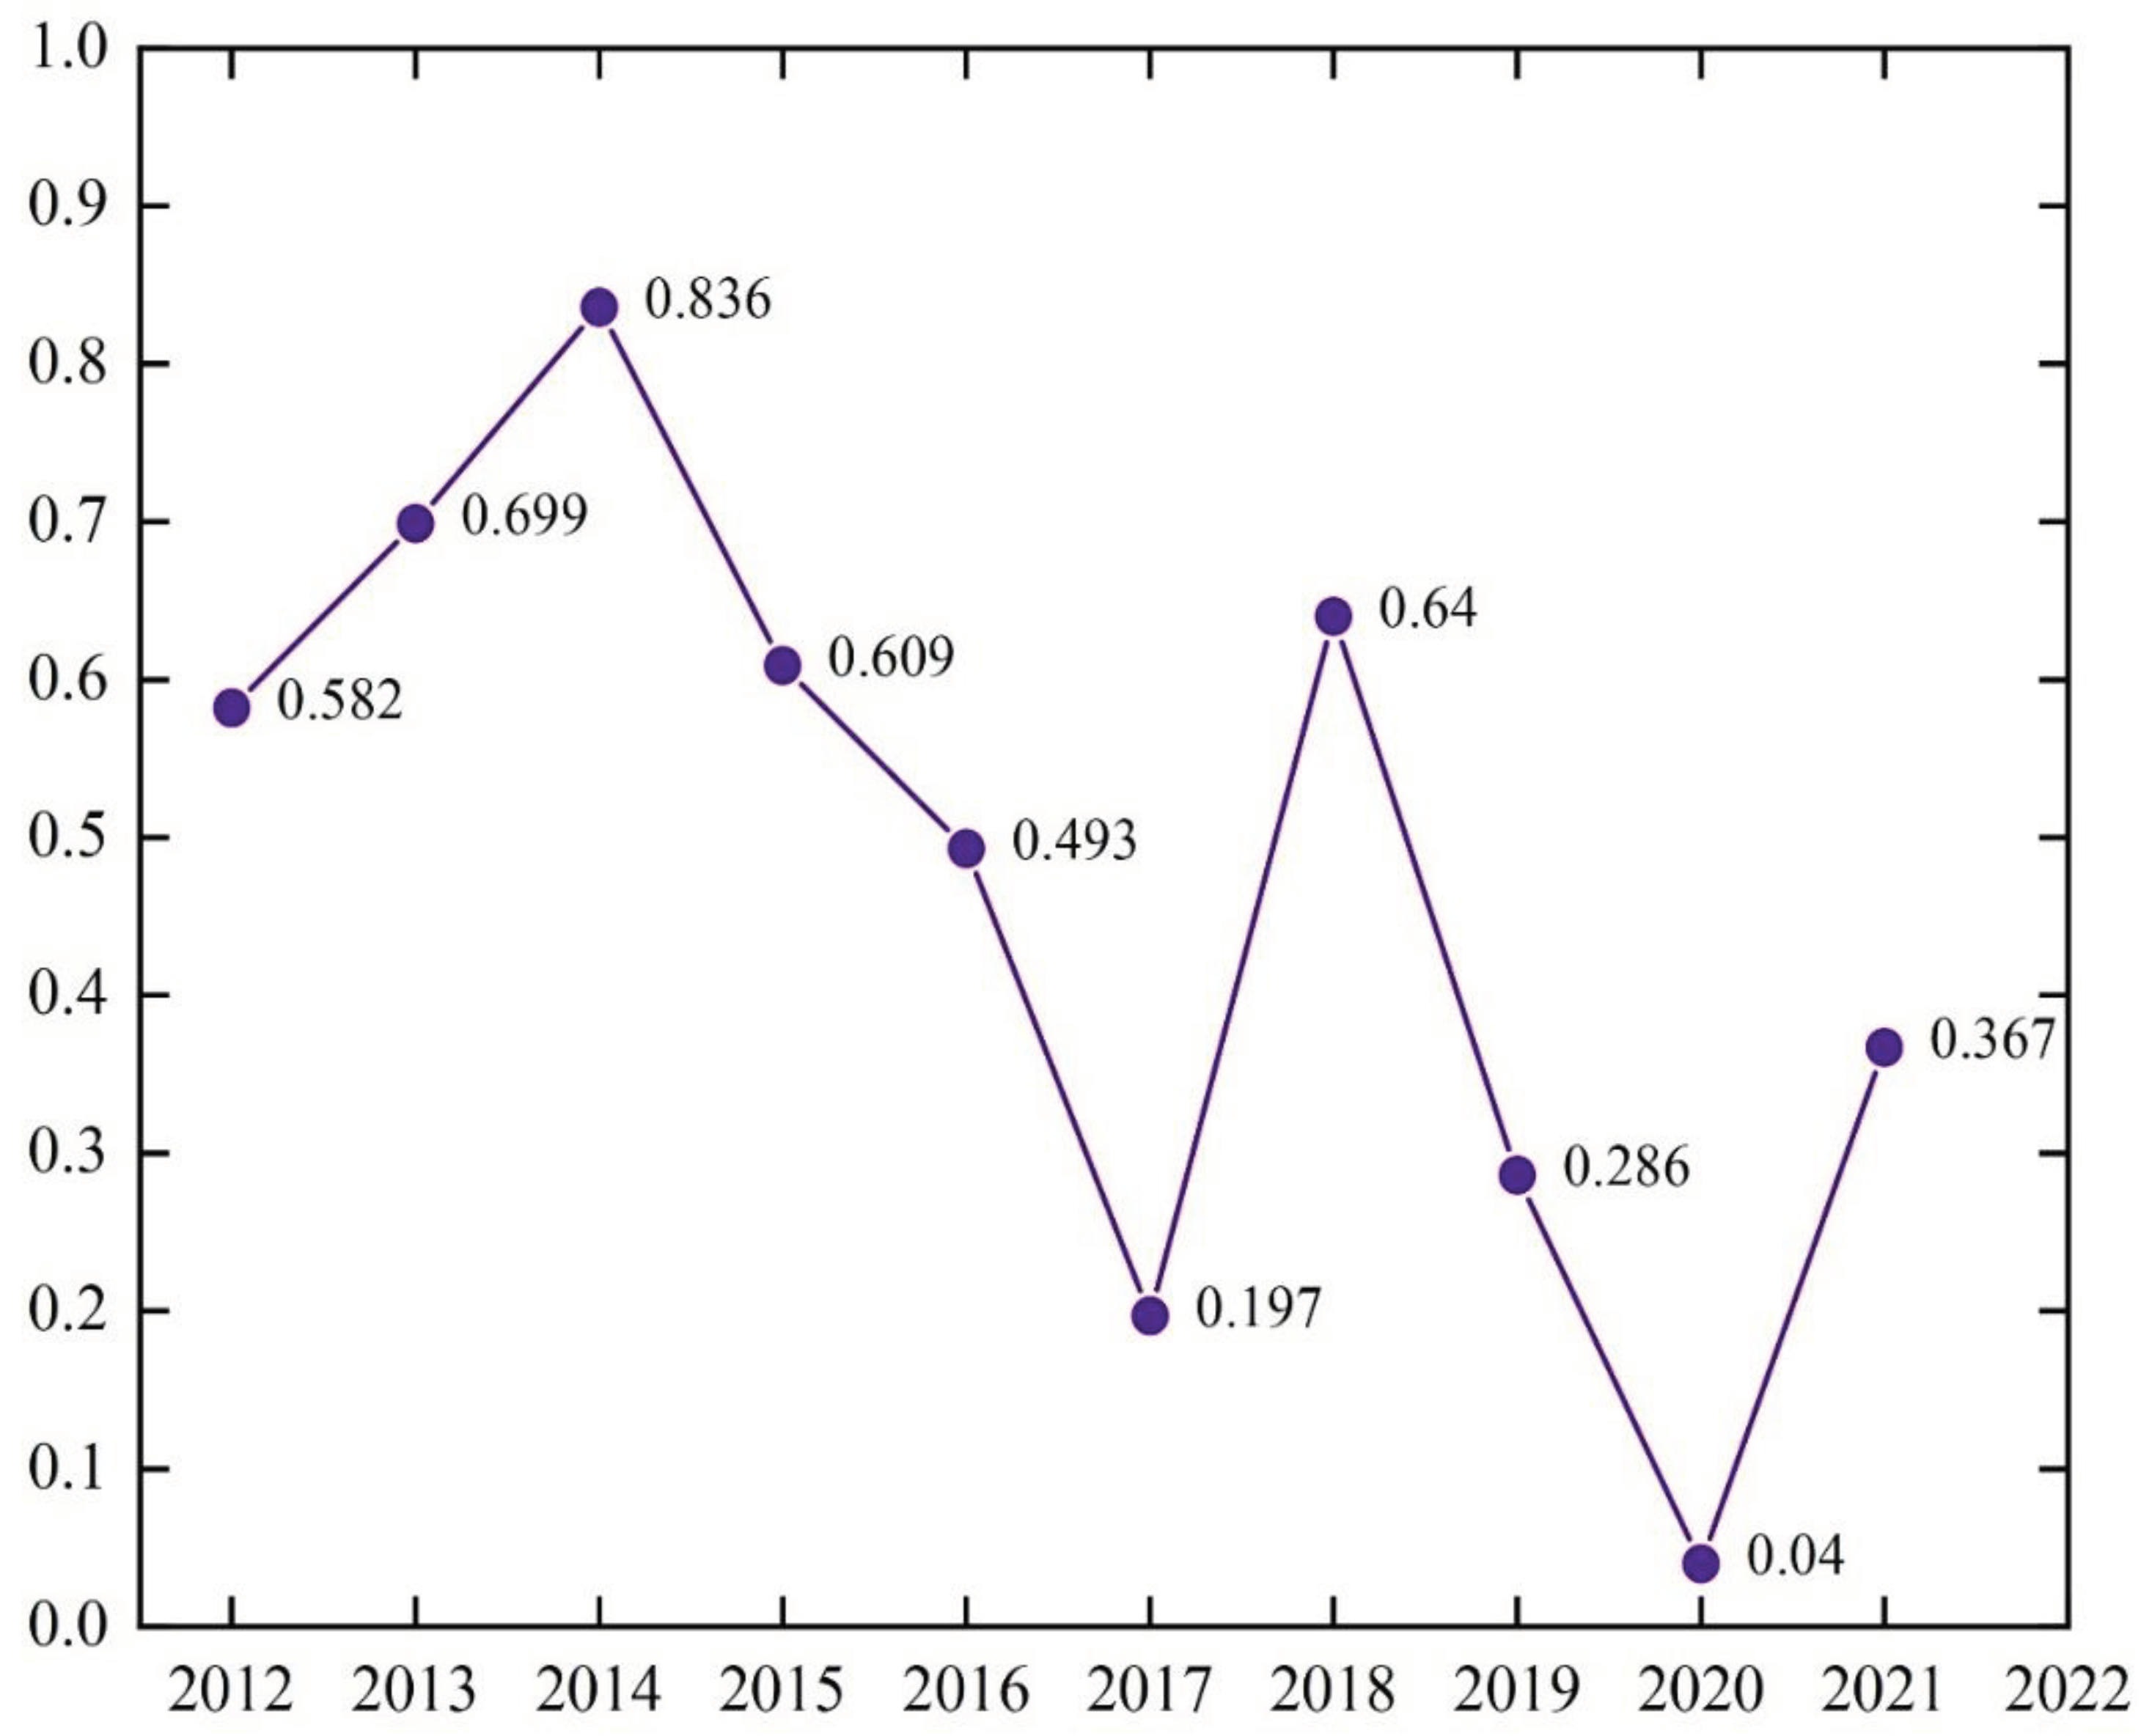
Figure 7.
Distribution of local Molan index quadrantal results.
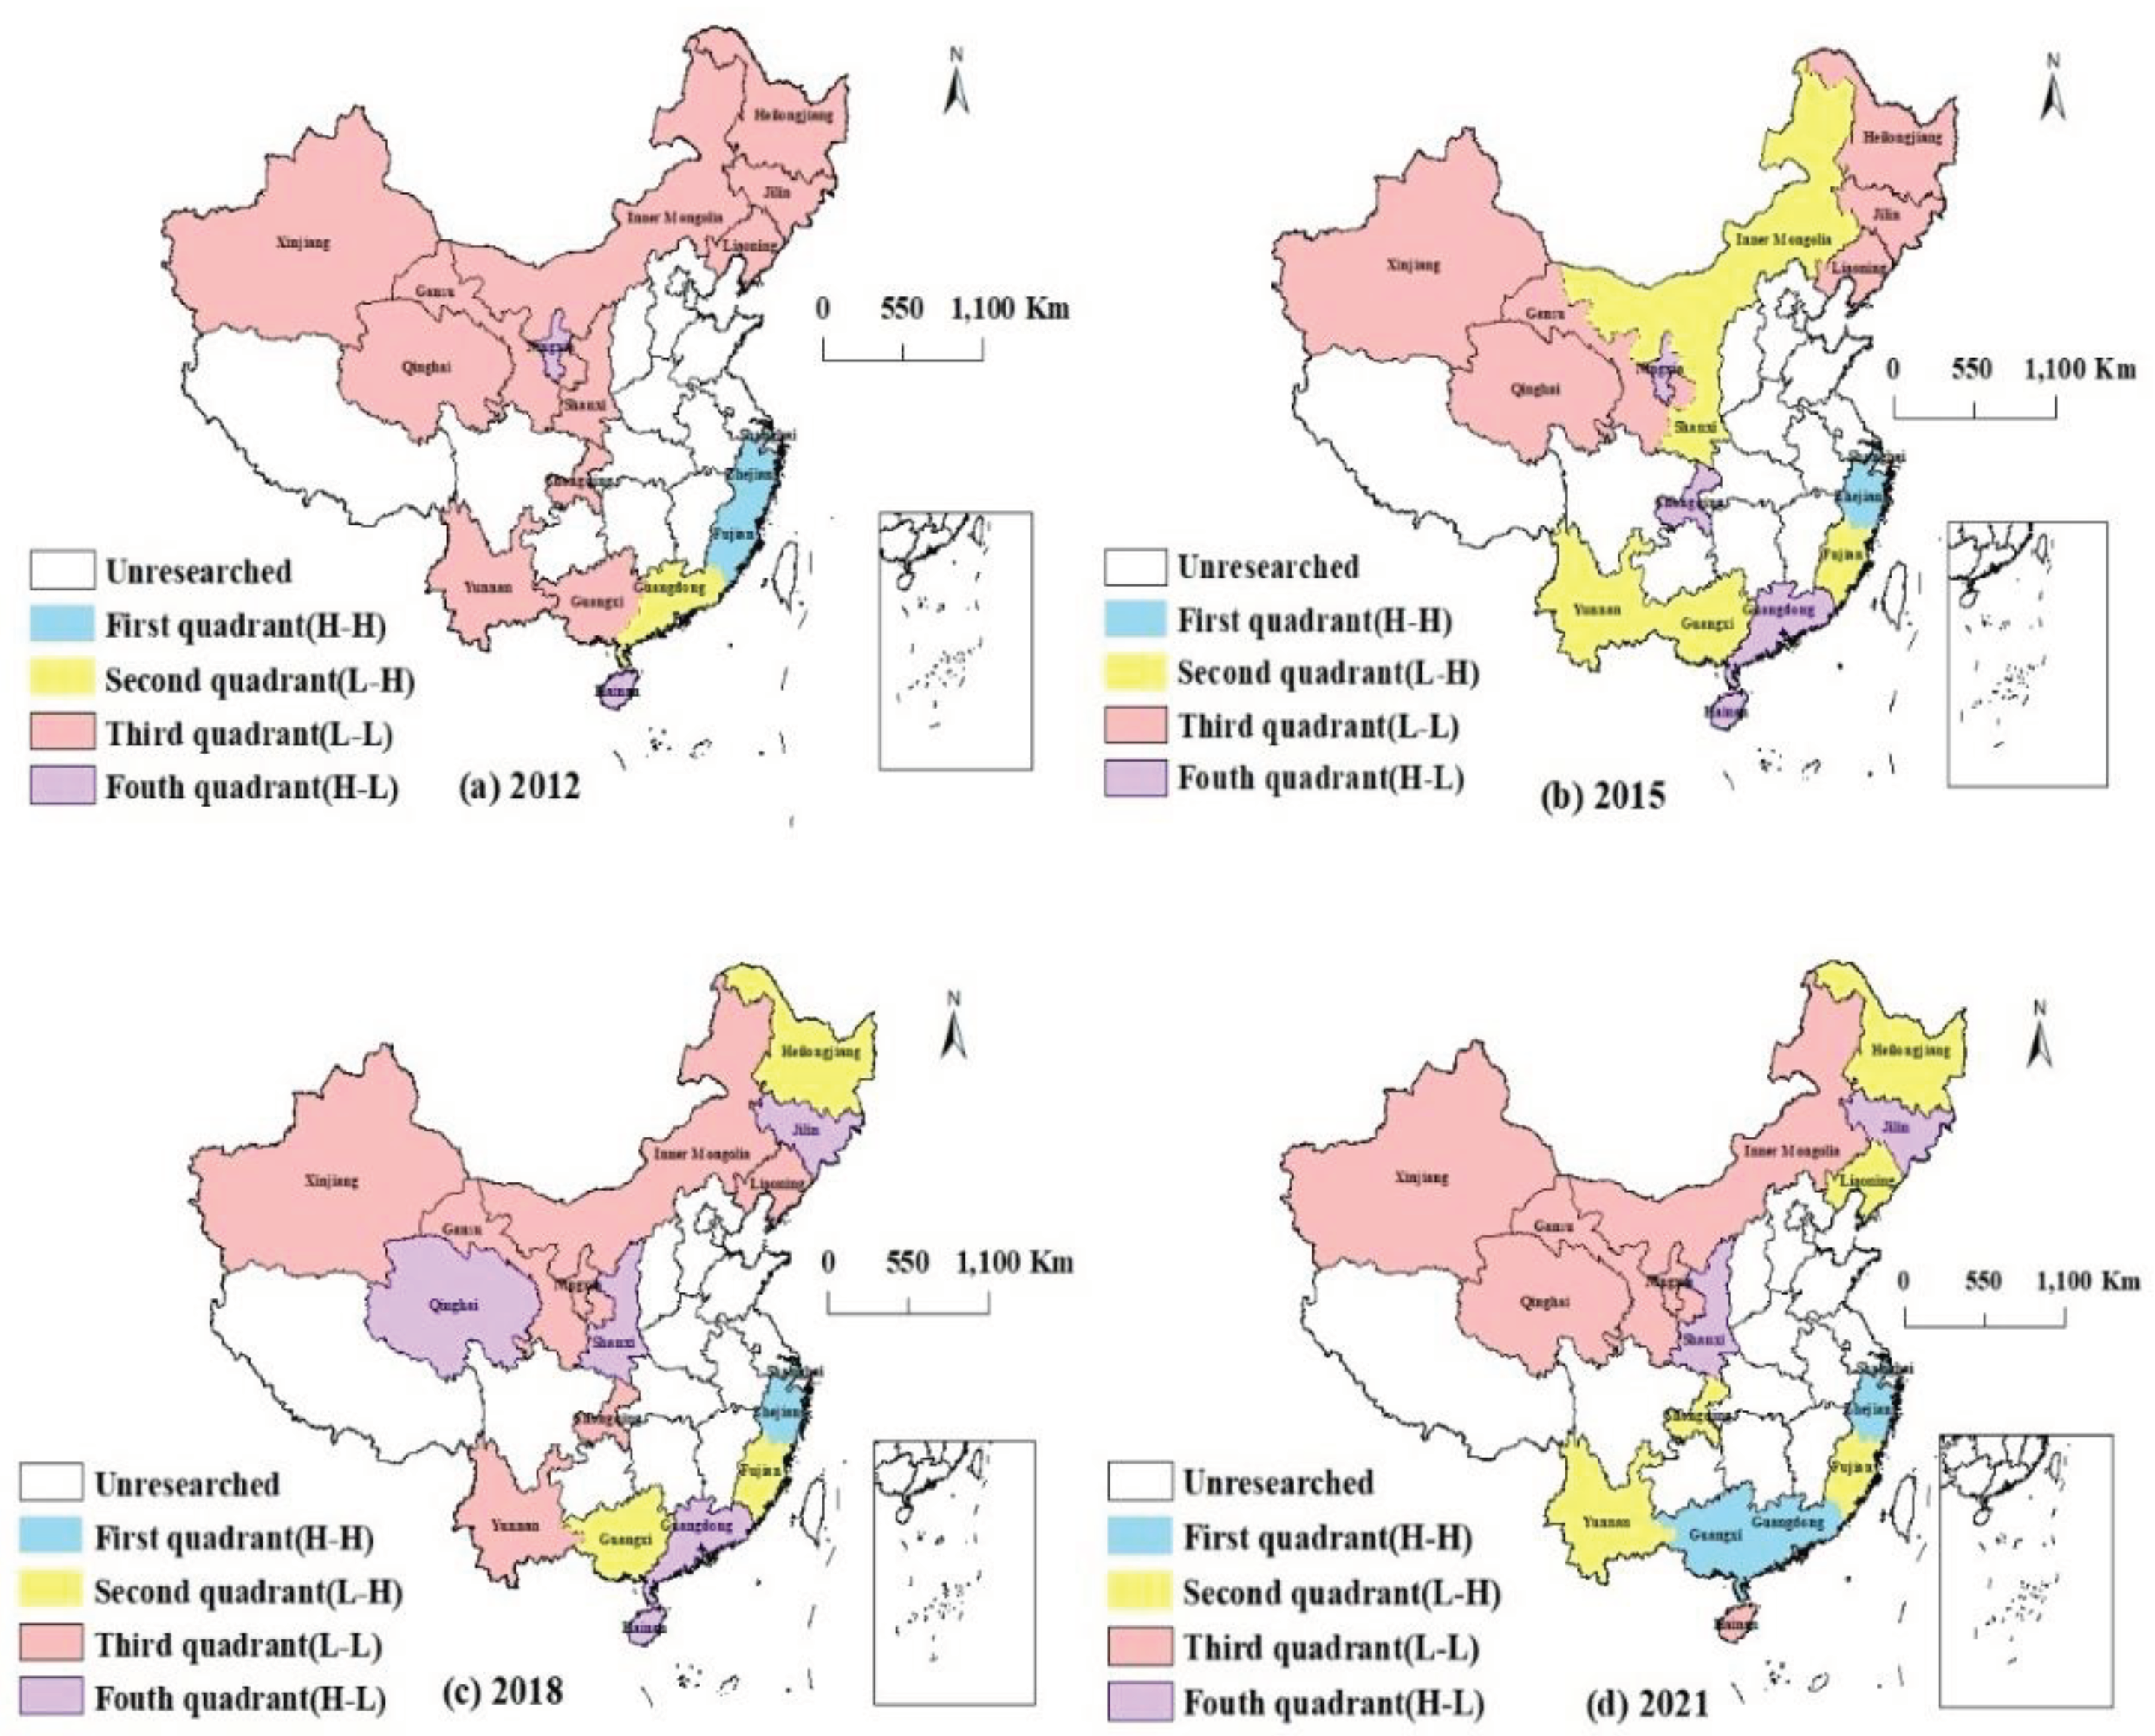

Table 1.
Evaluation index system of innovation factor allocation efficiency.
| Type | Primary index | Secondary index | Unit |
| Innovation input index | Talent factor | Full-time equivalent of R&D personnel | Person-year |
| Capital factor | Internal expenditure of R&D funds | 10000 yuan | |
| Financial expenditure on science and technology | Billion yuan | ||
| Technology factor | Expenditure on purchasing domestic and foreign advanced technology | 10000 yuan | |
| Data factor | Number of mobile phone subscribers | 10000 households | |
| Innovation output index | Technological outcomes | Patent authorization | Piece |
| Economic benefits | Amount of technology market contracts | Billion yuan | |
| Sales volume of new products | 10000 yuan | ||
| Non-expected output | Production of solid hazardous waste | 10000 tons | |
| Discharge of sulfur dioxide in wastewater | 10000 tons | ||
| Chemical oxygen demand in wastewater discharge | 10000 tons |
Table 2.
Innovation factor allocation efficiency of provinces and cities along the Belt and Road from 2012 to 2021.
Table 2.
Innovation factor allocation efficiency of provinces and cities along the Belt and Road from 2012 to 2021.
| Province | 2012 | 2013 | 2014 | 2015 | 2016 | 2017 | 2018 | 2019 | 2020 | 2021 | Mean |
| Inner Mongolia | 0.218 | 0.125 | 0.054 | 0.056 | 0.051 | 0.108 | 0.140 | 0.153 | 0.148 | 0.263 | 0.132 |
| Liaoning | 0.396 | 0.336 | 0.353 | 0.454 | 0.501 | 0.562 | 0.680 | 0.664 | 0.597 | 1.001 | 0.555 |
| Jilin | 1.042 | 0.155 | 0.279 | 0.195 | 1.002 | 1.049 | 1.054 | 1.132 | 1.026 | 1.036 | 0.797 |
| Heilongjiang | 0.153 | 0.191 | 0.150 | 0.139 | 0.175 | 0.250 | 0.358 | 0.394 | 0.477 | 0.539 | 0.283 |
| Shanghai | 1.008 | 1.017 | 1.008 | 1.029 | 1.050 | 1.020 | 1.016 | 1.059 | 1.056 | 1.079 | 1.034 |
| Zhejiang | 0.743 | 1.036 | 1.004 | 1.001 | 1.019 | 1.011 | 1.008 | 1.059 | 0.744 | 1.140 | 0.977 |
| Fujian | 1.122 | 0.560 | 0.372 | 0.298 | 0.170 | 0.201 | 0.223 | 0.275 | 0.308 | 0.357 | 0.389 |
| Guangdong | 0.371 | 1.005 | 0.473 | 0.635 | 0.659 | 1.020 | 0.883 | 1.037 | 1.024 | 1.037 | 0.814 |
| Guangxi | 0.037 | 0.126 | 0.074 | 0.128 | 1.037 | 1.028 | 0.567 | 0.342 | 1.025 | 1.063 | 0.543 |
| Hainan | 0.125 | 0.343 | 1.005 | 0.105 | 1.000 | 1.016 | 0.740 | 1.000 | 0.094 | 1.017 | 0.645 |
| Chongqing | 0.479 | 0.337 | 1.016 | 1.015 | 1.034 | 1.174 | 0.354 | 0.371 | 0.478 | 1.008 | 0.727 |
| Yunnan | 0.232 | 0.183 | 0.180 | 0.189 | 0.216 | 0.255 | 0.247 | 0.208 | 0.159 | 0.237 | 0.211 |
| Shanxi | 0.408 | 1.071 | 0.374 | 0.602 | 1.014 | 0.543 | 0.743 | 1.083 | 1.250 | 1.205 | 0.829 |
| Gansu | 0.401 | 0.365 | 0.407 | 0.338 | 0.282 | 0.346 | 0.493 | 1.000 | 1.054 | 1.008 | 0.569 |
| Qinghai | 0.086 | 0.151 | 0.253 | 0.387 | 0.193 | 0.744 | 1.206 | 0.189 | 1.041 | 1.057 | 0.531 |
| Ningxia | 0.103 | 0.118 | 0.092 | 1.036 | 0.084 | 0.105 | 0.174 | 1.099 | 1.000 | 1.005 | 0.482 |
| Xinjiang | 0.080 | 0.037 | 0.038 | 0.039 | 0.044 | 0.069 | 0.041 | 1.010 | 0.362 | 0.127 | 0.185 |
| Mean | 0.412 | 0.421 | 0.420 | 0.450 | 0.561 | 0.618 | 0.584 | 0.710 | 0.697 | 0.834 | 0.571 |
Table 3.
Ranking results of average innovation factor allocation efficiency.
| Value of efficiency | Region |
| >1 | Shanghai |
| 0.8-1 | Zhejiang, Shanxi, Guangdong |
| 0.6-0.8 | Jilin, Chongqing, Hainan |
| 0.4-0.6 | Gansu, Liaoning, Guangxi, Qinghai, Ningxia |
| 0.2-0.4 | Fujian, Heilongjiang, Yunnan |
| 0-0.2 | Xinjiang, Inner Mongolia |
Table 4.
Decomposition results of Malmquist index.
| Year | EFFCH | TECH | PECH | SECH | TFP |
| 2012-2013 | 0.986 | 1.131 | 0.985 | 1.000 | 1.122 |
| 2013-2014 | 1.018 | 0.938 | 1.007 | 1.000 | 0.946 |
| 2014-2015 | 1.020 | 1.327 | 0.997 | 1.020 | 1.488 |
| 2015-2016 | 1.049 | 1.238 | 1.029 | 1.017 | 1.292 |
| 2016-2017 | 1.049 | 1.272 | 1.018 | 1.026 | 1.310 |
| 2017-2018 | 1.029 | 1.112 | 1.020 | 1.008 | 1.137 |
| 2018-2019 | 1.037 | 1.022 | 1.019 | 1.017 | 1.058 |
| 2019-2020 | 0.986 | 1.054 | 1.013 | 0.972 | 1.042 |
| 2020-2021 | 1.059 | 1.020 | 1.006 | 1.051 | 1.090 |
| Mean | 1.026 | 1.124 | 1.010 | 1.012 | 1.165 |
Table 5.
Malmquist index results of provinces along the Belt and Road.
| Province | EFFCH | TECH | PECH | SECH | TFP |
| Inner Mongolia | 1.112 | 1.024 | 1.065 | 1.021 | 1.126 |
| Liaoning | 1.000 | 1.042 | 1.000 | 1.000 | 1.042 |
| Jilin | 1.024 | 1.020 | 1.000 | 1.023 | 1.043 |
| Heilongjiang | 1.098 | 1.076 | 1.081 | 1.009 | 1.166 |
| Shanghai | 1.000 | 1.232 | 1.000 | 1.000 | 1.232 |
| Zhejiang | 1.000 | 1.167 | 1.000 | 1.000 | 1.167 |
| Fujian | 1.013 | 0.946 | 1.011 | 1.000 | 0.944 |
| Guangdong | 1.000 | 1.095 | 1.000 | 1.000 | 1.095 |
| Guangxi | 1.001 | 1.103 | 1.001 | 1.000 | 1.108 |
| Hainan | 1.045 | 1.070 | 1.000 | 1.045 | 1.148 |
| Chongqing | 1.000 | 1.193 | 1.000 | 1.000 | 1.193 |
| Yunnan | 1.023 | 1.094 | 1.017 | 1.002 | 1.107 |
| Shanxi | 1.000 | 1.191 | 1.000 | 1.000 | 1.191 |
| Gansu | 1.000 | 1.155 | 1.000 | 1.000 | 1.155 |
| Qinghai | 1.000 | 1.448 | 1.000 | 1.000 | 1.448 |
| Ningxia | 1.106 | 1.238 | 1.000 | 1.106 | 1.628 |
| Xinjiang | 1.018 | 1.013 | 1.003 | 1.004 | 1.011 |
| Mean | 1.026 | 1.124 | 1.010 | 1.012 | 1.165 |
Table 6.
Results of global Moreland index of provinces along the Belt and Road.
| Year | Global Moran's I | Z-value | P-value |
| 2012 | 0.582 | 2.263 | 0.012 |
| 2013 | 0.699 | 2.532 | 0.006 |
| 2014 | 0.836 | 3.053 | 0.001 |
| 2015 | 0.609 | 2.236 | 0.013 |
| 2016 | 0.493 | 1.834 | 0.033 |
| 2017 | 0.197 | 0.841 | 0.200 |
| 2018 | 0.640 | 2.358 | 0.009 |
| 2019 | 0.286 | 1.142 | 0.127 |
| 2020 | 0.040 | 0.075 | 0.470 |
| 2021 | 0.367 | 1.694 | 0.042 |
Disclaimer/Publisher’s Note: The statements, opinions and data contained in all publications are solely those of the individual author(s) and contributor(s) and not of MDPI and/or the editor(s). MDPI and/or the editor(s) disclaim responsibility for any injury to people or property resulting from any ideas, methods, instructions or products referred to in the content. |
© 2024 by the authors. Licensee MDPI, Basel, Switzerland. This article is an open access article distributed under the terms and conditions of the Creative Commons Attribution (CC BY) license (http://creativecommons.org/licenses/by/4.0/).
Copyright: This open access article is published under a Creative Commons CC BY 4.0 license, which permit the free download, distribution, and reuse, provided that the author and preprint are cited in any reuse.


