
Submitted:
27 February 2024
Posted:
28 February 2024
You are already at the latest version
Abstract
This study presents the synthesis and electrochemical evaluation of nitrogen-doped vanadium oxide (N-V2O3/C) as a cathode material for aqueous zinc-ion batteries (AZIBs), using a hydrothermal method. Compared to undoped V2O3/C, N-V2O3/C exhibits enhanced electrical conductivity, capacity, and electrochemical kinetics, attributed to the incorporation of pyridinic and pyrrolic nitrogen. Initial charge-discharge cycles indicate phase transitions to amorphous vanadium oxides, enhancing conductivity. N-V2O3/C shows a high specific capacity of 168.4 mAh g−1 at 10 A g−1 and remarkable reversibility, highlighted by the transient existence of intermediate species during cycling. Optimal electrochemical performance is achieved with a vanadium to nitrogen molar ratio of 2:3, indicating the significant impact of nitrogen doping concentration on the material’s efficiency. This work underscores the potential of N-V2O3/C as a superior cathode material for AZIBs.
Keywords:
nitrogen-doped vanadium oxide
; cathode
; aqueous zinc-ion batteries
; phase transition
1. Introduction
Amid growing concerns over climate change and environmental degradation, the exploration and development of renewable energy sources, including solar and wind energy, have garnered substantial global interest [1,2]. The efficient harnessing of these renewable resources necessitates advancements in energy storage technologies that not only offer high conversion efficiencies but also ensure elevated safety standards. Lithium-ion batteries (LIBs) have emerged as a prominent solution for high-efficiency energy storage, gaining widespread adoption across various portable electronic markets [3,4]. Nonetheless, the scalability of LIBs is hampered by significant drawbacks, such as safety concerns, the high cost of production, and the scarcity of lithium reserves beneath the Earth's surface [5].
In this context, aqueous zinc-ion batteries (AZIBs) have been identified as potent alternatives for large-scale energy storage applications, thanks to their myriad benefits [6,7]. These include enhanced safety, reduced manufacturing costs, straightforward production processes, and superior capacity and power density metrics. The global abundance of zinc, coupled with its ease of extraction and compatibility with aqueous electrolytes, further accentuates the appeal of AZIBs. Moreover, the majority of AZIB systems utilize neutral or mildly acidic aqueous solutions, offering a safer and more environmentally friendly alternative to the organic electrolytes used in traditional battery technologies [8,9,10]. Given these substantial advantages, AZIBs are increasingly viewed as viable successors to LIBs in the quest for sustainable and safe large-scale energy storage solutions [11,12].
The cathode plays a critical role in dictating the electrochemical performance of batteries, particularly in the domain of aqueous zinc-ion batteries (AZIBs) [13,14,15]. Therefore, the development of high-performance cathode materials is crucial for the effective deployment of AZIB technology. Vanadium-based compounds, a prevalent category of cathode materials for AZIBs, offer a wide array of coordination polyhedra and crystal structures attributed to the multiple oxidation states of vanadium (V2+, V3+, V4+, and V5+) [16]. This variability facilitates high theoretical capacities. Notably, compounds such as V2O5 [17,18,19], VO2 [20,21], VS4 [22], VOPO4 [23], MnV2O4 [24], and V6O13 [25] have been extensively explored and reported.
Despite their potential, vanadium-based materials are hindered by inadequate conductivity and sluggish kinetic responses. To mitigate these limitations, integration with carbon materials has been pursued to amplify the electrochemical attributes of vanadium-based compositions [26]. Notably, composites of vanadium oxides and carbon nanomaterials are distinguished by their enhanced electrical conductivity and expanded ion diffusion pathways, which contribute to their pronounced reversibility. Furthermore, the inherent challenges of low wettability and reactivity in pristine carbon materials necessitate their functionalization or doping with heteroatoms (e.g., N, P, S) to foster improved performance characteristics. Within the scope of heteroatom-doped carbonaceous nanomaterials engineering, N doping emerges as a pivotal technique for augmenting surface energy and reactivity through charge polarization enhancement, thereby elevating the efficacy of devices dedicated to electrochemical energy storage or conversion [27]. Despite these advancements, the domain of heteroatom doping within vanadium-based materials remains underexplored, indicating a significant avenue for future research.
Expanding upon prior analyses, this study integrates heteroatoms into carbon matrices to augment the electrochemical attributes of vanadium oxides. Utilizing a hydrothermal synthesis approach, we engineered nitrogen-doped, carbon-coated V2O3 (denoted as N-V2O3/C) and assessed its electrochemical prowess as a cathode in AZIBs, juxtaposed against its undoped counterpart, V2O3/C. Observations post the inaugural charge-discharge cycle indicated a phase transition in both electrode variants, culminating in the formation of amorphous vanadium oxides.
Analytical methods, including X-ray photoelectron spectroscopy (XPS), disclosed an elevation in the V5+ ratio subsequent to the initial charging event, thereby establishing a cornerstone for enhanced electrochemical performance. Electrochemical evaluation demonstrated that nitrogen doping, manifesting through the presence of pyridinic and pyrrolic nitrogen species, significantly uplifted the cyclic capacity and electron diffusion rates. Further scrutiny into the zinc storage mechanism elucidated the emergence and subsequent dissolution of novel phases throughout the charging and discharging sequences, signaling pronounced reversibility. Additionally, the study delved into the quantification of nitrogen doping levels, determining that an optimal electrochemical response was realized at a vanadium to nitrogen source molar ratio of 2:3.
2. Results and Discussion
2.1. Material Characterization
In contrast to the commonly utilized nitrogen source, urea, the thiourea molecule features a less stable C=S double bond and amino p-π conjugated bonds, thereby facilitating a more ready detachment of nitrogen. Leveraging this property, thiourea was chosen as the nitrogen precursor, vanadium acetylacetonate as the vanadium source, and glucose as the carbon scaffold, for the hydrothermal synthesis of N-V2O3/C. The structural paradigm of V2O3, depicted in Figure 1a, showcases a trigonal crystal system (space group c) characterized by a three-dimensional lattice conducive to electron mobility within vanadium-vanadium (V-V) chain frameworks, thus exhibiting metallic properties. Vanadium atoms are strategically positioned within two-thirds of the octahedral sites formed by oxygen atoms. This arrangement is further complemented by the connectivity of two [VO6] octahedra with their neighboring atoms through shared corners, faces, and edges, culminating in a tunnel-like three-dimensional matrix. Such a configuration is optimally designed to support the facile insertion and extraction of metal ions, pivotal for the material's electrochemical performance.
The X-ray diffraction (XRD) patterns reveal the successful synthesis of the desired product. Within the V2O3/C composite, the absence of characteristic carbon peaks suggests the involvement of carbon in an amorphous form, which does not impede the crystallinity of V2O3 (Figure 1b). Furthermore, the presence of a nitrogen-doped carbon coating in the N-V2O3/C composite does not hinder the formation of V2O3, as evidenced in Figure 1c.
The microstructural characteristics of the synthesized specimens were examined through scanning electron microscopy (SEM). SEM images of V2O3/C, depicted in Figures 2a-c at varying magnifications, illustrate that the composite is composed of nanoparticles with irregular shapes. Conversely, N-V2O3/C is characterized by nanospheres of a more uniform and regular morphology, as shown in Figures 2d-f. Energy-dispersive X-ray spectroscopy (EDS) mapping of N-V2O3/C, provided in Figure 2g, demonstrates a homogeneous distribution of the elements V, O, and N. The extensive presence of carbon is due to the conductive adhesive, highlighting its role in the composite's structure.
2.2. Electrochemically Induced Phase Transition
In this study, 3M Zn(CF3SO3)2 was employed as the electrolyte, with zinc foil serving as the anode and synthesized products utilized as cathodes to fabricate button cells, aimed at evaluating their electrochemical performance. Initial tests involved constant current charge-discharge assessments, depicted in Figures 3a and 3d. Notably, a distinct difference was observed in the electrochemical profiles between the initial and subsequent cycles of the two cells, indicating a pronounced overcharging phenomenon.
For the cell incorporating V2O3/C as the cathode material, an initial discharge capacity of 52 mAh g−1 was recorded, which significantly increased to a charging capacity of 1618 mAh g−1. In the cycles that followed, the capacity reached a relatively stable value of approximately 284.3 mAh g−1, with the observed voltage plateaus at 1.10/0.99 V and 0.62/0.87 V, respectively. Similarly, the cell featuring N-V2O3/C as the cathode exhibited an initial discharge capacity of 335.2 mAh g−1 and a charging capacity of 1773.1 mAh g−1. Subsequently, the capacity of this cell stabilized around 332.2 mAh g−1, with voltage plateaus at 1.18/1.01 V and 0.68/0.87 V, respectively.
Cyclic voltammetry (CV) analysis was conducted at a scan rate of 0.1 mV s−1 for both cells, with results presented in Figures 3b and 3e. The analysis revealed a significant shift in the positions of oxidation and reduction peaks from the first cycle to subsequent cycles in both cells, indicative of irreversible phase transformations. Specifically, the initial cycle for V2O3/C was characterized by pronounced oxidation peaks at 0.68 and 1.52 V. In contrast, during the second cycle, these peaks were observed to migrate to 0.96/0.79 V and 1.22/1.09 V, respectively, with subsequent cycles demonstrating considerable overlap, implying the formation of a phase transition product with favorable reversibility. Similarly, the oxidation and reduction peak positions of N-V2O3/C closely matched those of V2O3/C, suggesting analogous reaction mechanisms. This alignment is corroborated by constant current charge and discharge profiles, which exhibited notable consistency across cycles, further confirming the reversibility of the phase transition product, in a manner comparable to V2O3/C.
To gain comprehensive insights into the electrochemical changes occurring within the cells, XRD analyses were performed on the cathode materials post-charging, as illustrated in Figures 3c and 3f. The analyses demonstrated that following the initial charging process, the distinct characteristic peaks of both V2O3/C and N-V2O3/C were eradicated, indicating a transformation to an amorphous, non-crystalline state.
Post-cycling morphological transformations of V2O3/C and N-V2O3/C electrodes were meticulously examined via scanning electron microscopy (SEM). The analysis revealed that, throughout the course of electrochemical reactions, the V2O3/C electrodes underwent a morphological evolution from irregularly shaped nanoparticles to nanorods of diminished diameter (refer to Figures 4a-b). In a contrasting manner, N-V2O3/C electrodes transitioned from well-defined nanospheres to nanosheets (illustrated in Figures 4c-d). This alteration significantly enhanced their specific surface area, thereby optimizing them for improved Zn2+ ion storage capabilities.
The morphological and microstructural evolutions of N-V2O3/C following its phase transition were meticulously characterized through High-Resolution Transmission Electron Microscopy (HRTEM). Prior to electrochemical cycling, Figure 5a delineates the material's initial structure as nanospheres encased by irregular entities, which were identified as amorphous carbon. The HRTEM imagery distinctly highlighted lattice fringes, elucidating that the introduction of nitrogen doping and carbon encapsulation preserved the crystalline integrity of V2O3.
This finding is in harmony with the crystallinity observations reported in the XRD analysis (refer to Figure 1c). The Selected Area Electron Diffraction (SAED) pattern of N-V2O3/C, depicted in Figure 5c, before cycling, exhibited luminous diffraction rings. These rings correspond to the (012), (024), and (018) crystallographic planes of V2O3, affirming the polycrystalline essence of the material. Post-charging, the N-V2O3/C specimens transformed into more voluminous, albeit irregular and thinner structures, as illustrated in Figures 5d and 5e. The SAED pattern after cycling, shown in Figure 5f, revealed a diffuse halo devoid of sharp boundaries, a manifestation that aligns with the XRD findings post-cycling. This unequivocally corroborates the electrochemical induction of a phase transition to an amorphous state after the initial cycle of charging and discharging.
XPS was utilized to elucidate the chemical compositions and the states of elements within N-V2O3/C, both prior to and subsequent to the inaugural charging cycle, with the findings illustrated in Figures 6. The survey spectrum, as presented in Figure 6a, confirmed the presence of N, vanadium (V), oxygen (O), and carbon (C) in the pristine N-V2O3/C. Notably, post-charging, the spectrum also revealed the presence of Zn. Detailed examination of the V 2p fine spectrum, depicted in Figure 6b, revealed that the binding energies in the pristine sample were predominantly observed at 524.8/517.7 eV and 523.4/516.7 eV, indicative of the oxidation states V4+ and V5+, respectively. Following the charging process, the oxidation states of vanadium remained as V4+ and V5+. However, a discernible augmentation in the proportion of V5+ was evident from the enhanced intensity and area of the respective peaks, setting a foundation for an escalated occurrence of redox reactions in subsequent stages [28].
Additionally, the investigation into the N component within N-V2O3/C unveiled that the initial N binding energies were predominantly positioned at 399.6, 400.4, and 401.8 eV. These correspond to V-N bonds, pyrrolic N, and graphitic N, respectively, as illustrated in Figure 6c. Post-charging, the formation of pyridinic N was observed, with both pyrrolic and pyridinic N exhibiting more negative electronegativities. This characteristic is advantageous for enhancing the transport rate of Zn2+ ions.
2.3. Electrochemical Performance
To investigate the post-phase transition electrochemical behavior of V2O3/C and N-doped V2O3/C, these materials were utilized as cathodes within AZIBs. Initially subjected to a current density of 0.2 A g−1, the cycling performance depicted in Figure 7a demonstrates that both V2O3/C and N-V2O3/C exhibited notably high specific capacities for both charging and discharging within the initial 10 cycles, alongside a coulombic efficiency surpassing 100%. This phenomenon is ascribed to the phase transition experienced by the cathode materials under subdued current densities, which precluded the attainment of a fully stable structural configuration, thereby leading to the misalignment of charge and discharge profiles. Beyond the preliminary 10 cycles, a commendable degree of stability was observed for both electrodes; V2O3/C recorded a capacity of 284.6 mAh g−1, whereas N-V2O3/C demonstrated a superior capacity of 331.1 mAh g−1. Subsequent to the initial evaluation, cycling performance at an escalated current density of 5 A g−1 was assessed, as illustrated in Figure 7b. Mirroring the low-current density findings, an activation process for the electrodes was discernible. Following an extended cycling duration of approximately 150 cycles, a stabilization in capacities was noted, with V2O3/C attaining a capacity of 242.6 mAh g−1 and N-V2O3/C achieving a capacity of 264.1 mAh g−1, each maintaining a coulombic efficiency of 100%.
The rate performance of V2O3/C and N-V2O3/C following the stabilization of phase transition was systematically evaluated across a spectrum of current densities, namely 0.2, 0.5, 0.8, 1.0, 3.0, and 5.0 A g−1, as illustrated in Figure 7c. Initial observations reveal that, at lower current densities, the specific capacities of both materials exhibit considerable similarity. However, with an increment in current density, N-V2O3/C not only manifests enhanced specific capacities but also displays augmented stability, underscoring its remarkable resilience against high current demands. This finding aligns with the patterns discerned during the cycling performance assessments, where the augmented electrochemical robustness of N-V2O3/C was evident. Remarkably, upon the diminution of current densities, both V2O3/C and N-V2O3/C succeeded in reinstating their original specific capacities, thereby demonstrating their exceptional rate capabilities.
Further, Figure 7d delineates the constant current charge-discharge profiles for both electrodes across varying current densities, mirroring the observed rate performances. A noteworthy aspect of these profiles is the presence of two pronounced and analogous charge-discharge plateaus, pinpointed at 0.97/1.07 V and 1.02/1.22 V, respectively. These plateaus are in harmony with the oxidation and reduction peak positions previously identified in the CV analysis of N-V2O3/C.
Figure 8 delineates the enduring cycling performance of both V2O3/C and N-V2O3/C under a substantial current load of 10 A g−1. In the initial cycles, V2O3/C demonstrated an initial specific capacity of 110.3 mAh g−1, in contrast to N-V2O3/C, which registered a notably lower capacity of 40.6 mAh g−1. However, an upward trajectory in the capacities of both materials was observed thereafter, a phenomenon attributed to the progressive activation of the electrodes. Upon reaching full activation, the specific capacities were recorded at 151.6 mAh g−1 for V2O3/C and an elevated 168.4 mAh g−1 for N-V2O3/C. Post 900 cycles, V2O3/C’s capacity was reduced to 56.2 mAh g−1, correlating to a capacity retention rate of 37%. Contrastingly, N-V2O3/C showcased remarkable endurance, maintaining a capacity of 160.5 mAh g−1 even after 1000 cycles, which translates to an impressive retention rate of 95%. These findings underscore the substantial enhancement in capacity retention and cycling stability conferred by nitrogen doping.
To elucidate the kinetic mechanisms underlying the electrochemical behavior of V2O3/C and N-V2O3/C, CV analyses were conducted across a spectrum of scan rates (0.1, 0.2, 0.4, 0.6, 0.8, 1.0 mV s−1), with the results depicted in Figures 9a and 9d. Observations revealed analogous oxidation and reduction peaks for both materials, suggesting the occurrence of comparable electrochemical reactions. Notably, an escalation in scan rate led to a polarization-induced shift of these peaks to higher and lower potentials for oxidation and reduction processes, respectively. The empirical relationship between the peak current (i) and the scan rate (v) is formalized as follows:
i = avb
log(i) = log(a) + blog(v)
Within these formulations, parameters a and b are indicative of the system's electrochemical dynamics, with b serving as a determinant of the dominant control mechanism—diffusion or pseudocapacitance. Specifically, a b value nearing 1.0 is indicative of pseudocapacitive control, whereas a value approaching 0.5 signifies diffusion dominance. Intermediate b values suggest a mixed control mechanism. The linear regression analyses of log(i) versus log(v) for both V2O3/C and N-V2O3/C, presented in Figures 9b and 9e, respectively, yielded b values predominantly within the range of 0.5 to 1.0, implying a significant influence from both diffusion and pseudocapacitance on the electrochemical reactions. Crucially, a b value of 1.0 for both materials underscores the substantial role of pseudocapacitive behavior in certain electrode processes, contributing to their enhanced rate capabilities. Additionally, CV profiles at a scan rate of 0.1 mV s−1, showcased in Figures 9c and 9f, alongside the deduced pseudocapacitive contributions of 85% for V2O3/C and 86% for N-V2O3/C.
Figure 10 illustrates the variation in pseudocapacitive contribution rates for the electrode materials V2O3/C and N-V2O3/C across a spectrum of scan rates. The pseudocapacitive contributions for V2O3/C are recorded at 85%, 91%, 94%, 96%, 97%, and 98% for increasing scan rates, respectively. Conversely, the corresponding values for N-V2O3/C are slightly higher, being 86%, 92%, 95%, 97%, 98%, and 99%, respectively. This upward trend in pseudocapacitance with escalating scan rates signifies a shift towards more capacitive-dominated electrochemical reactions for both materials, a trait that enhances cyclic durability especially under conditions of high current. Remarkably, the consistently higher pseudocapacitive contributions observed for N-V2O3/C as compared to V2O3/C underscore superior electrochemical kinetics. This distinction not only underpins an improved diffusion rate for Zn2+ ions but also aligns with the observed enhancements in cyclic and rate performances of the materials.
Electrochemical impedance spectroscopy (EIS) analyses were executed employing an electrochemical workstation, with outcomes illustrated in Figure 11a. These outcomes revealed a semicircle in the high-frequency range, indicative of charge transfer resistance, and a linear slope in the low-frequency range, indicative of ion diffusion processes. Importantly, the N-V2O3/C exhibited a markedly reduced charge transfer resistance in comparison to V2O3/C, which aligns with their respective electrochemical performances. Upon conducting four cycles, a notable reduction was observed in both charge transfer resistance and ion diffusion for N-V2O3/C, as demonstrated in Figure 11b, thereby augmenting its electronic conductivity. This enhancement substantiates the observed initial capacity increment throughout the cycling process.
The Zn2+ diffusion coefficient was quantified employing the Galvanostatic Intermittent Titration Technique (GITT), which substantiated the enhancement of ionic kinetics subsequent to nitrogen doping. The GITT experimentation was executed with a specified current density of 0.1 A g−1, a relaxation time (τ) of 30 minutes, and measurement intervals set at 60 seconds. Figure 12b reveals that the diffusion coefficient for V2O3/C was observed to lie between 10−11 and 10−12 cm2 s−1. Conversely, for N-V2O3/C, the Zn2+ diffusion coefficient was determined to be within the range of 10−10 to 10−11 cm2 s−1.
2.4. Mechanistic Investigation
To elucidate the zinc storage mechanism within the N-V2O3/C matrix following its phase transition, ex-XRD examinations were performed throughout the third charge/discharge cycle. Figure 13b reveals minimal alterations in peak positions during the initial discharge phase, aligning with observations post the inaugural charge cycle (refer to Figure 3f). Notably, discharging to 0.8 V resulted in the emergence of a novel peak at 22.4°, indicative of a reaction between Zn2+ ions and N-V2O3/C, culminating in the formation of Znx(N-V2O3/C). The intensity of this peak was further amplified upon discharging to 0.2 V. Conversely, the peak's intensity waned as the charging process reached 0.9 V and, upon completion of charging to 1.6 V, all peaks representative of intermediate phases vanished. This phenomenon underscores the structure’s pronounced reversibility concerning Zn2+ ion intercalation and deintercalation processes.
XPS analyses were conducted to elucidate the elemental state transformations in N-V2O3/C throughout the third charging and discharging cycle. Initially, the Zn 2p spectrum exhibited no detectable Zn signals (Figure 14a). This absence changed upon discharging the material to 0.2 V, at which point a prominent pair of Zn 2p peaks at 1022.2 eV and 1045.1 eV became evident, denoting the successful intercalation of Zn2+ ions. However, upon full recharge to 1.6 V, these Zn 2p peaks markedly diminished in intensity, albeit not vanishing entirely, hinting at a partial, irreversible incorporation of Zn2+ ions.
The valence state dynamics of V were detailed in Figure 14b, where initial spectra revealed two peak pairs located at 524.8/517.7 eV and 523.4/516.7 eV, attributed to the V4+ and V5+ oxidation states in V 2p3/2, respectively. The discharge to 0.2 V resulted in a notable shift in the V4+/V5+ ratio, which was further altered upon recharging to 1.6 V. At this juncture, an increase in the V5+ content was observed, indicating the reversion of vanadium valence states post-Zn2+ deintercalation.
Additionally, changes in the chemical state of nitrogen, as indicated by N 1s spectra (Figure 14c), were observed. A marginal increase in pyridinic nitrogen content was detected following discharge to 0.2 V, which amplified upon complete recharge. This alteration is posited to account for the accelerated diffusion rate of Zn2+ ions in N-V2O3/C relative to its V2O3/C counterpart during the electrochemical cycle.
2.4. Investigation of Nitrogen Content
To investigate the impact of nitrogen doping levels on performance, the synthesis process involved varying the molar ratios of the vanadium source acetylacetonate vanadium to the nitrogen source thiourea as 2:1, 2:2, 2:3, and 2:4, using 0.076 g, 0.152 g, 0.228 g, and 0.304 g of thiourea respectively. These were designated as N-V2O3/C-1, N-V2O3/C-2, N-V2O3/C-3, and N-V2O3/C-4, respectively.
From the cycling performance at a current density of 0.2 A g−1 (Figure 15a), it can be observed that these materials all undergo similar cycling experiences. In the first 10 charge-discharge cycles, their charge and discharge profiles do not overlap, with the Coulombic efficiency exceeding 100%, indicative of a transition from phase change to stability. After 10 cycles, the charge and discharge begin to stabilize, among which N-V2O3/C-3 exhibits the highest capacity after 50 cycles, reaching 331.1 mAh g−1. Figure 15b presents the cycling performance at a current density of 5 A g−1. It is evident that their cycling processes are similar, among which N-V2O3/C-3 has the highest initial capacity. When reaching a stable cycle, N-V2O3/C-2 exhibits a relatively higher capacity, but its retention rate is not as favorable. After 500 cycles, N-V2O3/C-3 shows the highest capacity and the best retention rate, achieving 111%.
In Figure 15c, the rate performance of N-V2O3/C electrodes, with varying levels of nitrogen doping, is evaluated across a series of current densities: 0.1, 0.2, 0.5, 0.8, 1.0, 3.0, and 5.0 A g−1. Notably, the electrode designated N-V2O3/C-3 consistently demonstrated the most superior capacity, exhibiting negligible variation over the tested current density range. Furthermore, this electrode's ability to recover its initial capacity upon the reduction of current density to lower rates signifies its exceptional rate capability. Electrochemical impedance spectroscopy (EIS) analysis, depicted in Figure 15d, reveals that N-V2O3/C-3 possesses the minimal electrochemical charge transfer and ionic diffusion resistances among the tested materials, establishing a robust basis for its outstanding electrochemical attributes. The observed lower contact resistance of N-V2O3/C-3 also provides insight into its enhanced initial capacity, further validating the material's electrochemical efficiency.
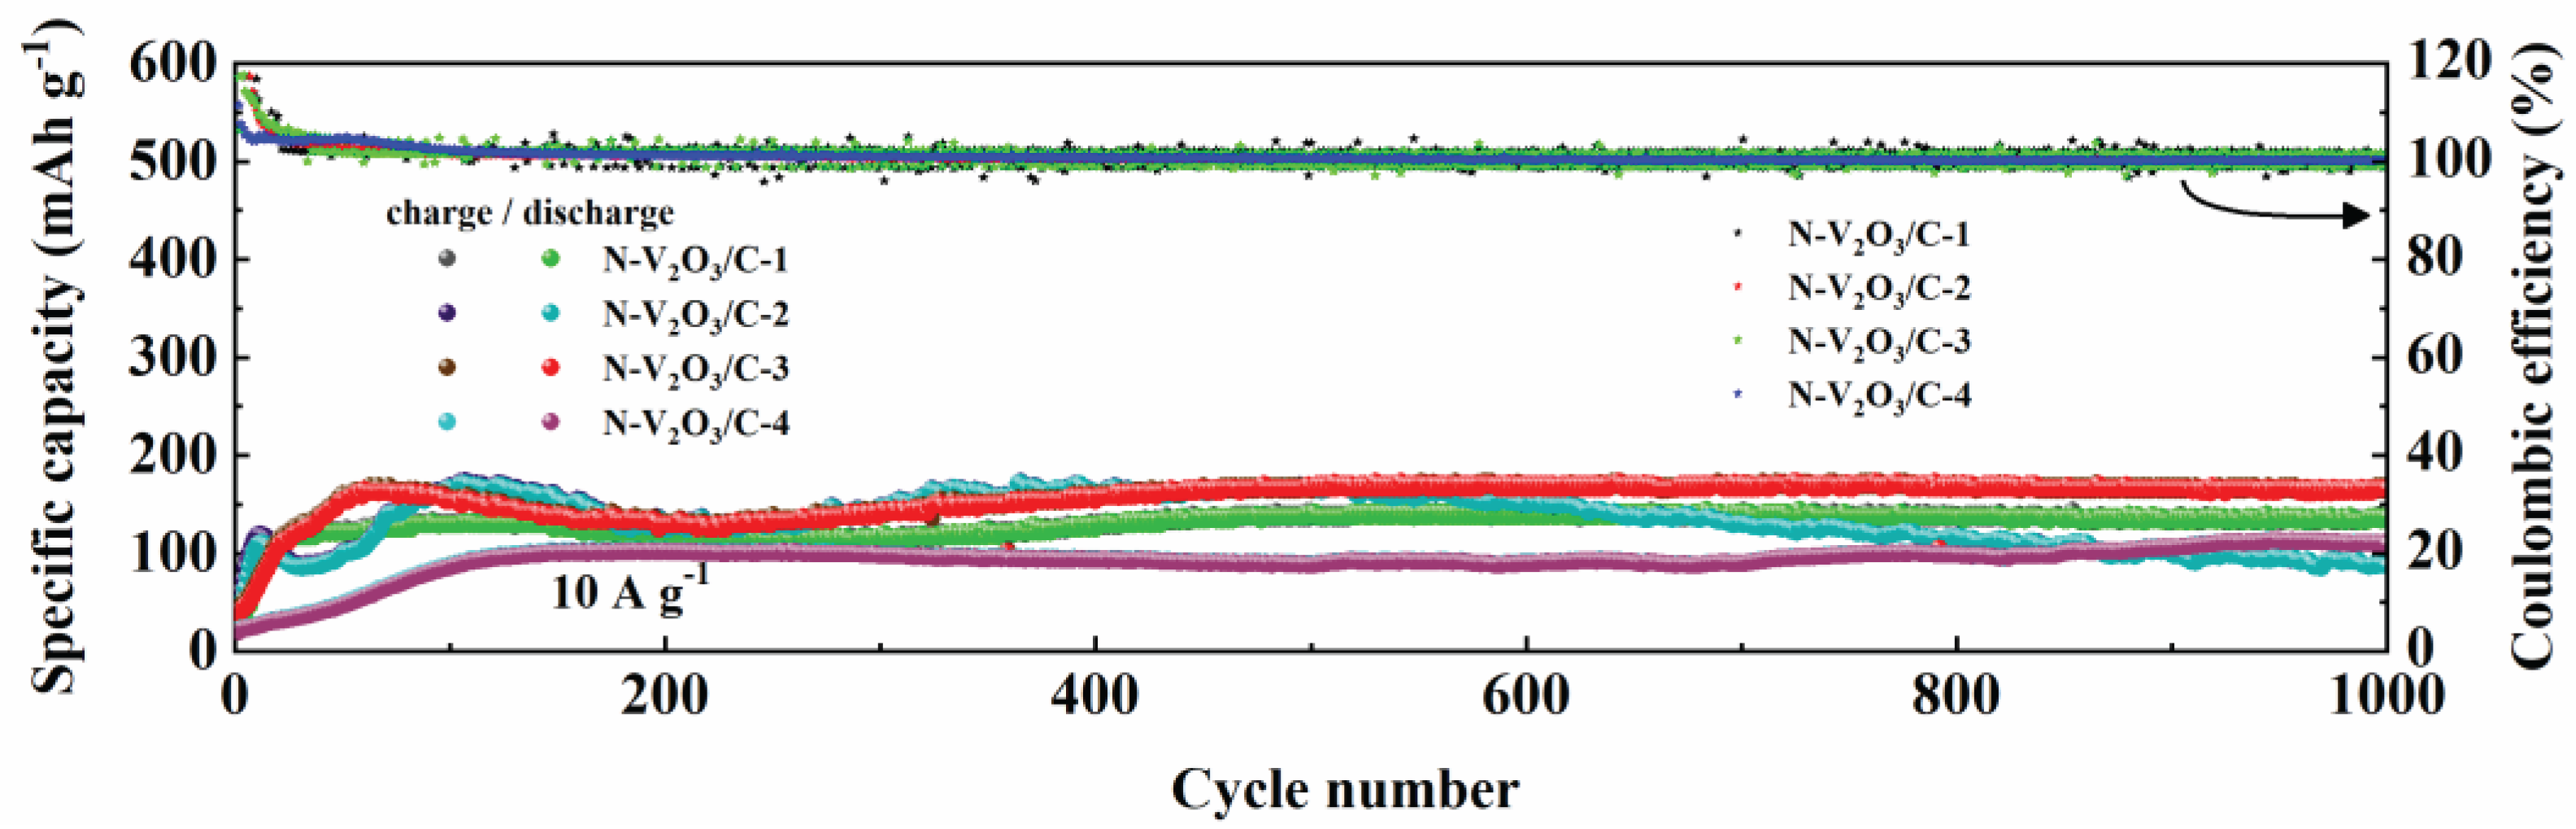
The long-term cycling stability of N-V2O3/C electrodes, differentiated by their nitrogen content, was rigorously evaluated under a high current density condition of 10 A g−1. As depicted in Figure 16, a trend towards stabilization was observed for all materials after an initial 100 cycles. Upon extending the cycling to 1000 cycles, the following observations were made: N-V2O3/C-1 demonstrated a stable capacity of 135.7 mAh g−1, maintaining a retention rate of 100%. N-V2O3/C-2 recorded a capacity of 87.1 mAh g−1, with a significantly lower retention rate of 51%. N-V2O3/C-3 showcased a superior capacity of 168.5 mAh g−1, accompanied by a retention rate of 102%, whereas N-V2O3/C-4 achieved a capacity of 109.9 mAh g−1, marking the highest retention rate among the samples at 111%. Notably, while N-V2O3/C-4 exhibited the highest retention rate, its initial capacity was comparatively lower. Conversely, N-V2O3/C-3 not only presented the highest initial capacity but also maintained a relatively high retention rate, underscoring that the electrochemical performance reached its zenith when the vanadium and nitrogen sources were combined at a molar ratio of 2:3. This composition was found to yield the most favorable outcomes in terms of both capacity and durability.
3. Materials and Methods
3.1. Preparation of Material
Initially, following a molar ratio of vanadium source to nitrogen source of 2:1, 0.6 g of acetylacetonate vanadium, 0.152 g of thiourea, and 0.4 g of glucose were dissolved in 70 mL of isopropanol and sonicated for 60 minutes. Subsequently, the solution was transferred into a 100 mL autoclave and maintained at 180°C for 24 hours. After the autoclave cooled down, the product was washed several times with ethanol and dried at 80°C for 12 hours to obtain the precursor. The obtained precursor was then calcined in a tube furnace under an argon atmosphere at 600°C for 2 hours with a heating rate of 10°C per minute. This process yielded nitrogen-doped carbon-coated V2O3, designated as N-V2O3/C. By excluding thiourea from the reactants under otherwise identical conditions, carbon-coated V2O3, named V2O3/C, was obtained.
To investigate the impact of nitrogen doping levels on performance, the synthesis was carried out by varying the molar ratios of the vanadium source, acetylacetonate vanadium, to the nitrogen source, thiourea, as 2:1, 2:2, 2:3, and 2:4, using 0.076 g, 0.152 g, 0.228 g, and 0.304 g of thiourea, respectively. These were designated as N-V2O3/C-1, N-V2O3/C-2, N-V2O3/C-3, and N-V2O3/C-4, respectively.
3.3. Structure and Morphology Characterization
The physical and structural properties of all materials prepared during the electrochemical process were identified and analyzed using Cu Kα radiation (XRD, Smart Lab SE). The morphology and crystalline structure of the materials were characterized using a SEM (Hitachi SU8010) and a TEM (FEI Talos F200X). The elemental distribution was characterized using the SEM-EDX method. The elemental composition and valence state changes of powder samples and electrode slices were analyzed using XPS (Thermo ESCALAB 250Xi).
3.4. Electrochemical Measurements
In the experimental setup for the evaluation of electrochemical cells, a CR2032-type coin cell configuration was utilized as the prototype structure. The assembly of these cells incorporated zinc foil as the anode material and titanium foil as the current collector, with filter paper acting as the electrolyte separator. The entire cell assembly process was conducted in an electrolytic solution of 3 M Zn(CF3SO3)2, under standard laboratory conditions at ambient temperature. For the electrochemical characterization of these cells, CV and EIS analyses were performed using a CHI 760E electrochemical workstation within a predefined voltage range of 0.2 to 1.8 V. Additionally, the LAND battery testing system was employed to meticulously evaluate the electrochemical performance of the assembled cells under study.
4. Conclusions
In summary, we synthesized N-V2O3/C using a hydrothermal method and evaluated its electrochemical performance as a cathode material for AZIBs, in comparison with V2O3/C. Initial charge-discharge cycles revealed that both electrode types experienced phase transitions, resulting in the formation of amorphous vanadium oxides. This transformation significantly enhanced the electrical conductivity within the battery system. Notably, the integration of pyridinic and pyrrolic nitrogen into the structure of the nitrogen-doped electrode materials was found to substantially improve electronic conductivity, capacity, and electrochemical kinetics. Specifically, N-V2O3/C demonstrated a remarkable capacity of 168.4 mAh g−1 at a high current density of 10 A g−1. Detailed analysis of the zinc storage mechanism in the phase-transformed products identified the emergence of intermediate species during the charge-discharge cycle, which subsequently vanished upon full charge, indicating a high degree of reversibility. Moreover, a systematic investigation into the effect of nitrogen doping concentration revealed that the electrochemical performance of N-V2O3/C was notably superior when prepared with a vanadium to nitrogen molar ratio of 2:3, thereby achieving the most favorable outcomes.
Author Contributions
Conceptualization, H.L. and H.C.; methodology, H.L. and Y.Z.; software, Y.Z.; validation, H.L., H.C. and Y.Z.; formal analysis, H.L. and H.C.; investigation, H.L., H.C. and Y.Z.; resources, H.C.; data curation, Y.Z.; writing—original draft preparation, H.L.; writing—review and editing, H.L., H.C. and Y.Z.; visualization, H.C. and Y.Z.; supervision, H.L.; project administration, H.L.; funding acquisition, H.L. All authors have read and agreed to the published version of the manuscript.
Funding
This research was funded by the National Natural Science Foundation of China, grant number 22065032, and Undergraduate Education and Teaching Research and Reform Project of Universities in Xinjiang Autonomous Region, grant number XJGXPTJG-202205. The APC was funded by High Level Overseas Educated Talents Returning to China Funding Candidate Program, grant number 2019160.
Data Availability Statement
The data presented in this study are available on request from the corresponding author.
Acknowledgments
The authors acknowledge the shiyanjia lab (www. shiyanjia.com) for the TEM tests.
Conflicts of Interest
The authors declare no conflict of interest.
References
- Algarni, S.; Tirth, V.; Alqahtani, T.; Alshehery, S.; Kshirsagar, P. Contribution of renewable energy sources to the environmental impacts and economic benefits for sustainable development. Sustain. Energy. Techn. 2023, 56, 103098. [Google Scholar] [CrossRef]
- Franssen, T.; de Wilde, M. A clean energy future isn’t set in stone. Nat. Geosci. 2021, 14, 636–637. [Google Scholar] [CrossRef]
- Zheng, Y.; Yao, Y.; Ou, J.; Li, M.; Luo, D.; Dou, H.; Li, Z.; Amine, K.; Yu, A.; Chen, Z. A review of composite solid-state electrolytes for lithium batteries: fundamentals, key materials and advanced structures. Chem. Soc. Rev. 2020, 49, 8790–8839. [Google Scholar] [CrossRef]
- Xu, J.; Cai, X.; Cai, S.; Shao, Y.; Hu, C.; Lu, S.; Ding, S. High-energy lithium-ion batteries: recent progress and a promising future in applications. Energy Environ. Mater. 2023, 6, e12450. [Google Scholar] [CrossRef]
- Wang, Y.; Chen, R.; Chen, T.; Lv, H.; Zhu, G.; Ma, L.; Wang, C.; Jin, kZ.; Liu, J. Emerging non-lithium ion batteries. Energy Storage Mater. 2023, 4, 103–129. [Google Scholar] [CrossRef]
- Song, M.; Tan, H.; Chao, D.; Fan, H.J. Recent advances in Zn-ion batteries. Adv. Funct. Mater. 2018, 28, 1802564. [Google Scholar] [CrossRef]
- Nie, C.; Wang, G.; Wang, D.; Wang, M.; Gao, X.; Bai, Z.; Wang, N.; Yang, J.; Xing, Z.; Dou, S. Recent progress on Zn anodes for advanced aqueous zinc-ion batteries. Adv. Energy Mater. 2023, 13, 2300606. [Google Scholar] [CrossRef]
- Yan, H.; Zhang, X.; Yang, Z.; Xia, M.; Xu, C.; Liu, Y.; Yu, H.; Zhang, L.; Shu, J. Insight into the electrolyte strategies for aqueous zinc ion batteries. Coordin. Chem. Rev. 2022, 452, 214297. [Google Scholar] [CrossRef]
- Shuai, H.; Liu, R.; Li, W.; Yang, X.; Lu, H.; Gao, Y.; Xu, J.; Huang, K. Recent advances of transition metal sulfides/selenides cathodes for aqueous zinc-ion batteries. Adv. Energy Mater. 2023, 13, 2202992. [Google Scholar] [CrossRef]
- Li, H.; Ma, L.; Han, C.; Wang, Z.; Liu, Z.; Tang, Z.; Zhi, C. Advanced rechargeable zinc-based batteries: Recent progress and future perspectives. Nano Energy 2023, 62, 550–587. [Google Scholar] [CrossRef]
- Wang, X.; Zhang, Z.; Xi, B.; Chen, W.; Jia, Y.; Feng, J.; Xiong, S. Advances and perspectives of cathode storage chemistry in aqueous zinc-ion batteries. ACS Nano 2021, 15, 9244–9272. [Google Scholar] [CrossRef]
- Gao, S.; Zhang, Z.; Mao, F.; Liu, P.; Zhou, Z. Advances and strategies of electrolyte regulation in Zn-ion batteries. Mater. Chem. Front. 2023, 7, 3232–3258. [Google Scholar] [CrossRef]
- Chen, L.; An, Q.; Mai, L. Recent advances and prospects of cathode materials for rechargeable aqueous zinc-ion batteries. Adv. Mater. Interfaces 2019, 6, 1900387. [Google Scholar] [CrossRef]
- Li, G.; Sun, L.; Zhang, S.; Zhang, C.; Jin, H.; Davey, K.; Liang, G.; Liu, S.; Mao, J.; Guo, Z. Developing cathode materials for aqueous zinc ion batteries: challenges and practical prospects. Adv. Energy Mater. 2024, 34, 2301291. [Google Scholar] [CrossRef]
- Wang, S.; Zhang, H.; Zhao, K.; Liu, W.; Luo, N.; Zhao, J.; Wu, S.; Ding, J.; Fang, S.; Cheng, F. Designing interstitial boron-doped tunnel-type vanadium dioxide cathode for enhancing zinc ion storage capability. Carbon Energy 2023, 5, e330. [Google Scholar] [CrossRef]
- Xu, X.; Xiong, F.; Meng, J.; Wang, X.; Niu, C.; An, Q.; Mai, L. Vanadium-based nanomaterials: A promising family for emerging metal-ion batteries. Adv. Funct. Mater. 2020, 30, 1904398. [Google Scholar] [CrossRef]
- Yan, M.; He, P.; Chen, Y.; Wang, S.; Wei, Q.; Zhao, K.; Xu, X.; An, Q.; Shuang, Y.; Shao, Y.; Mueller, K.T.; Mai, L.; Liu, J.; Yang, J. Water-lubricated intercalation in V2O5·nH2O for high-capacity and high-rate aqueous rechargeable zinc batteries. Adv. Mater. 2018, 30, 1703725. [Google Scholar] [CrossRef] [PubMed]
- Wang, X.; Li, Y.; Wang, S.; Zhou, F.; Das, P.; Sun, C.; Zheng, S.; Wu, Z.-S. 2D amorphous V2O5/graphene heterostructures for high-safety aqueous Zn-ion batteries with unprecedented capacity and ultrahigh rate capability. Adv. Energy Mater. 2020, 10, 2000081. [Google Scholar] [CrossRef]
- Zhang, Y.; Qin, J.; Batmunkh, M.; Li, W.; Fu, H.; Wang, L.; Al-Mamun, M.; Qi, D.; Liu, P.; Zhang, S.; Zhong, Y.L. Scalable spray drying production of amorphous V2O5–EGO 2D heterostructured xerogels for high-rate and high-capacity aqueous zinc ion batteries. Small 2022, 18, 2105761. [Google Scholar] [CrossRef]
- Li, Z.; Ren, Y.; Mo, L.; Liu, C.; Hsu, K.; Ding, Y.; Zhang, X.; Li, X.; Hu, L.; Ji, D.; Cao, G. Impacts of oxygen vacancies on zinc ion intercalation in VO2. ACS Nano 2020, 14, 5581–5589. [Google Scholar] [CrossRef] [PubMed]
- Zhang, Z.; Xi, B.; Wang, X.; Ma, X.; Chen, W.; Feng, J.; Xiong, S. Oxygen defects engineering of VO2·xH2O nanosheets via in situ polypyrrole polymerization for efficient aqueous zinc ion storage. Adv. Funct. Mater. 2021, 31, 2103070. [Google Scholar] [CrossRef]
- Zhu, Q.; Xiao, Q.; Zhang, B.; Yan, Z.; Liu, X.; Chen, S.; Ren, Z.; Yu, Y. VS4 with a chain crystal structure used as an intercalation cathode for aqueous Zn-ion batteries. J. Mater. Chem. A 2020, 8, 10761–10766. [Google Scholar] [CrossRef]
- Shi, H.-Y.; Song, Y.; Qin, Z.; Li, C.; Guo, D.; Liu, X.-X.; Sun, X. Inhibiting VOPO4⋅x H2O decomposition and dissolution in rechargeable aqueous zinc batteries to promote voltage and capacity stabilities. Angew. Chem. Int. Edit. 2019, 58, 16057–16061. [Google Scholar] [CrossRef] [PubMed]
- Wei, S.; Chen, S.; Su, X.; Qi, Z.; Wang, C.; Ganguli, B.; Zhang, P.; Zhu, K.; Cao, Y.; He, Q.; Cao, D.; Guo, X.; Wen, W.; Wu, X.; Ajayan, P.M.; Song, L. Manganese buffer induced high-performance disordered MnVO cathodes in zinc batteries. Energy Environ. Sci. 2021, 14, 3954–3964. [Google Scholar] [CrossRef]
- Shan, L.; Zhou, J.; Zhang, W.; Xia, C.; Guo, S.; Ma, X.; Fang, G.; Wu, X.; Liang, S. Highly reversible phase transition endows V6O13 with enhanced performance as aqueous zinc-ion battery cathode. Energy Technol. 2019, 7, 1900022. [Google Scholar] [CrossRef]
- Xing, Z.; Xu, G.; Han, J.; Chen, G.; Lu, B.; Liang, S.; Zhou, J. Facing the capacity fading of vanadium-based zinc-ion batteries. Trends Chem. 2023, 5, 380–392. [Google Scholar] [CrossRef]
- Ou, L.; Liu, Z.; Zhou, Y.; Ou, H.; Zhu, J.; Cao, X.; Fang, G.; Zhou, J.; Liang, S. Pseudocapacitance-dominated zinc storage enabled by nitrogen-doped carbon stabilized amorphous vanadyl phosphate. Chem. Eng. J. 2021, 426, 131868. [Google Scholar] [CrossRef]
- Yuan, J.; Gan, Y.; Mou, J.; Ma, X.; Li, X.; Meng, J.; Xu, L.; Zhang, X.; He, H.; Liu, J. Electrochemically induced amorphous and porous VOx/N-doped carbon spheres as a cathode for advanced aqueous zinc-ion batteries. Inorg. Chem. Front. 2023, 10, 984–990. [Google Scholar] [CrossRef]
Figure 1.
(a) Structure of V2O3; XRD patterns of (b) V2O3/C and (c) N-V2O3/C.
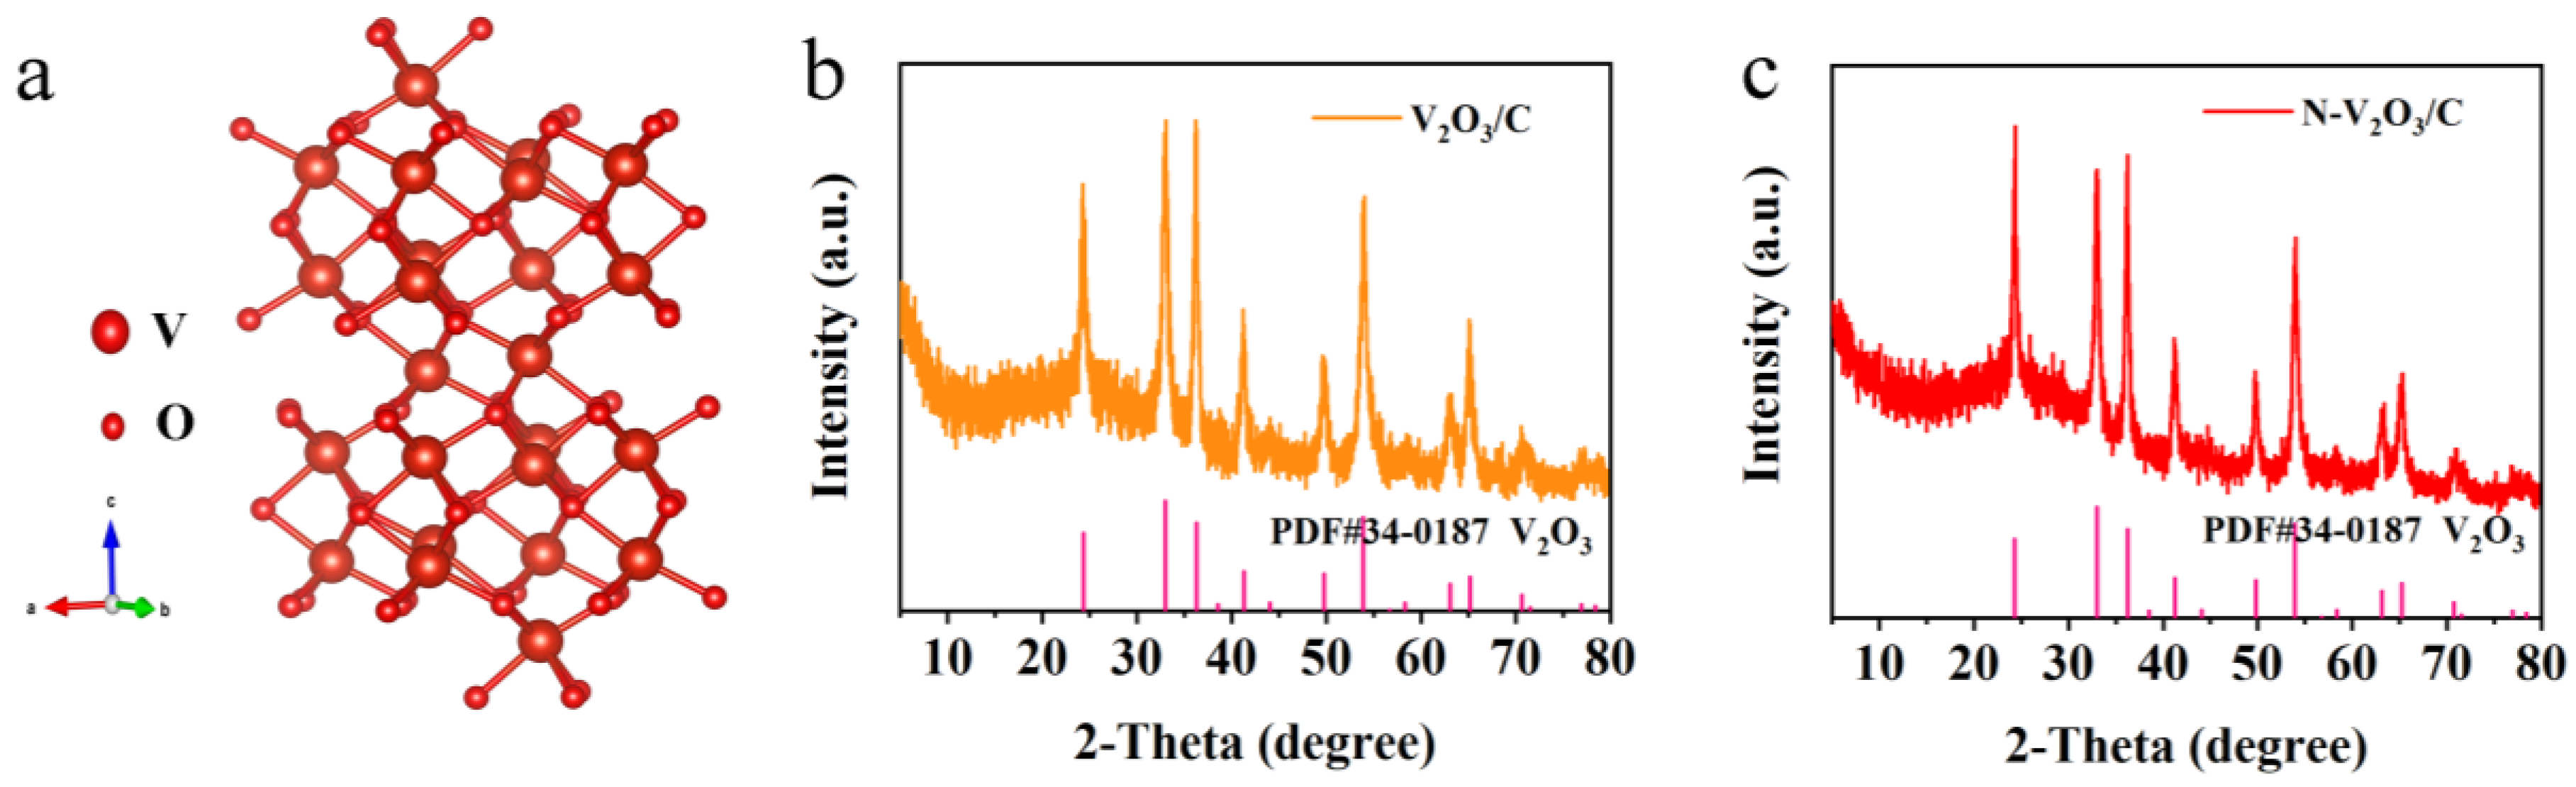
Figure 2.
SEM at different multiples of (a-c) V2O3/C, (d-f) N-V2O3/C; (g) EDS mapping of N-V2O3/C.
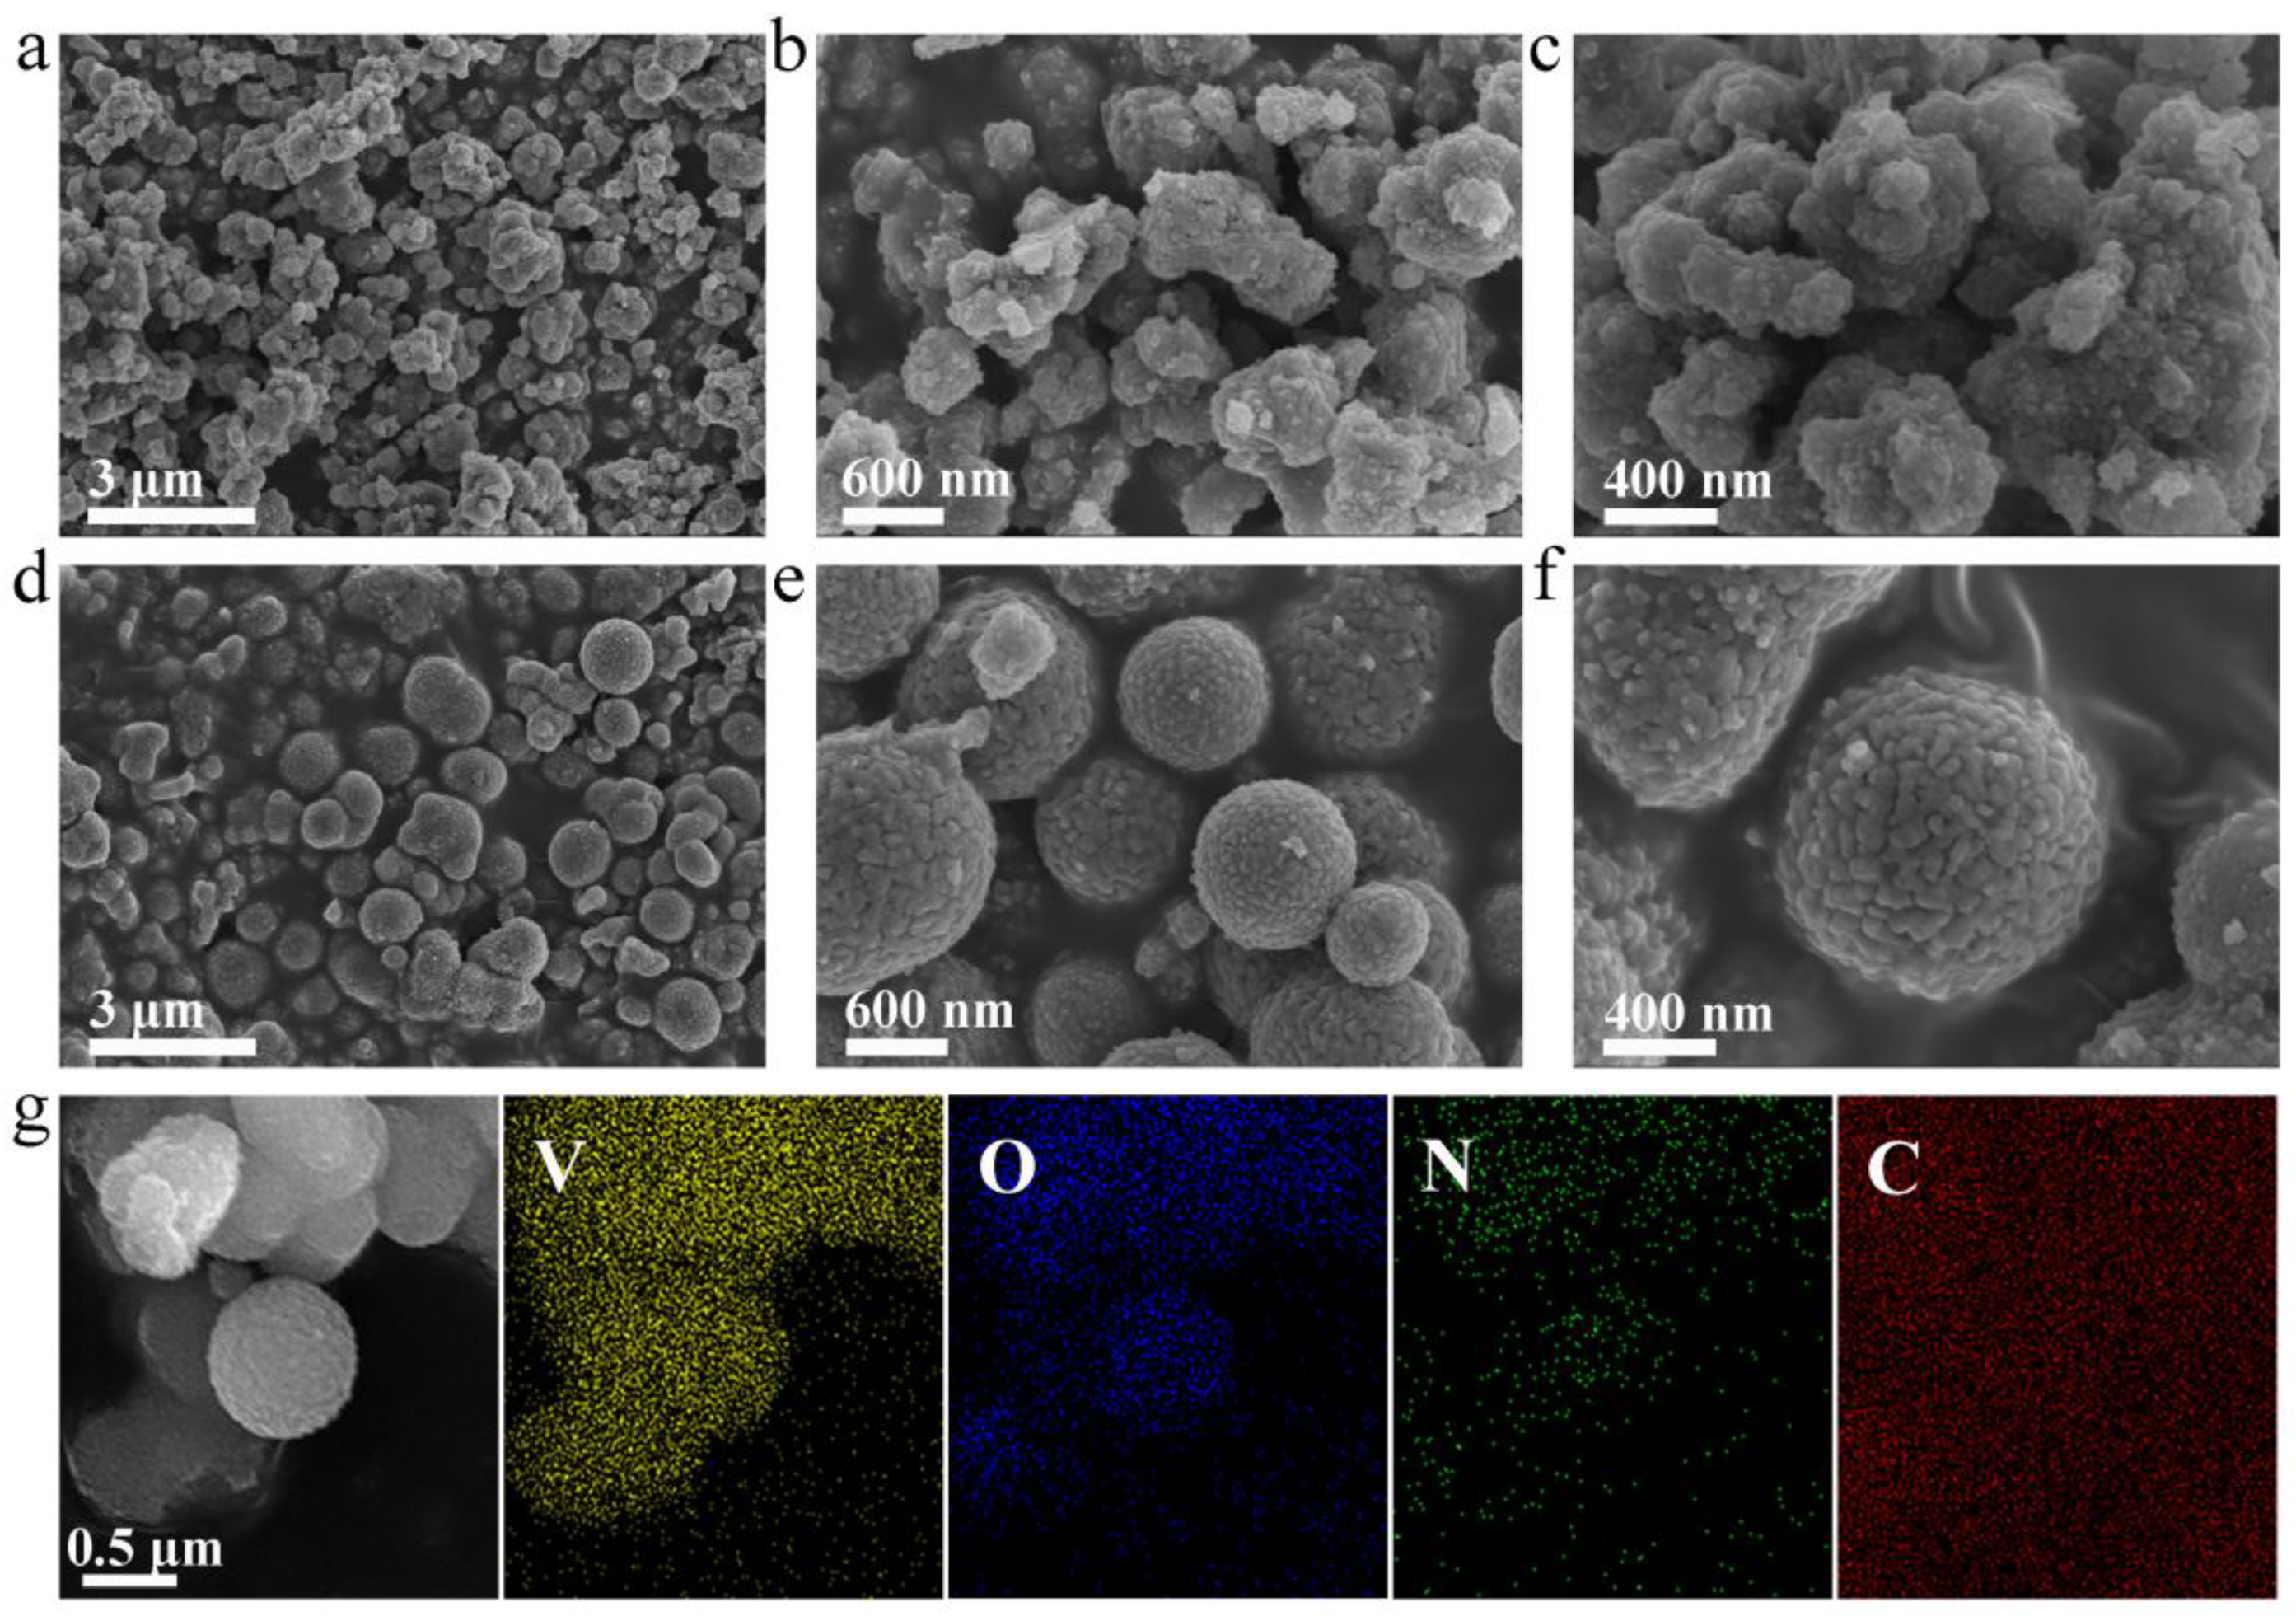
Figure 3.
V2O3/C of (a) constant current charge/discharge curve, (b) CV curve at 0.1 mV s−1 sweep rate, (c) XRD pattern after the completion of the first charge; N-V2O3/C of (d) constant current charge/discharge curve, (e) CV curve at 0.1 mV s−1 sweep rate, (f) XRD patterns after the completion of the first charge.
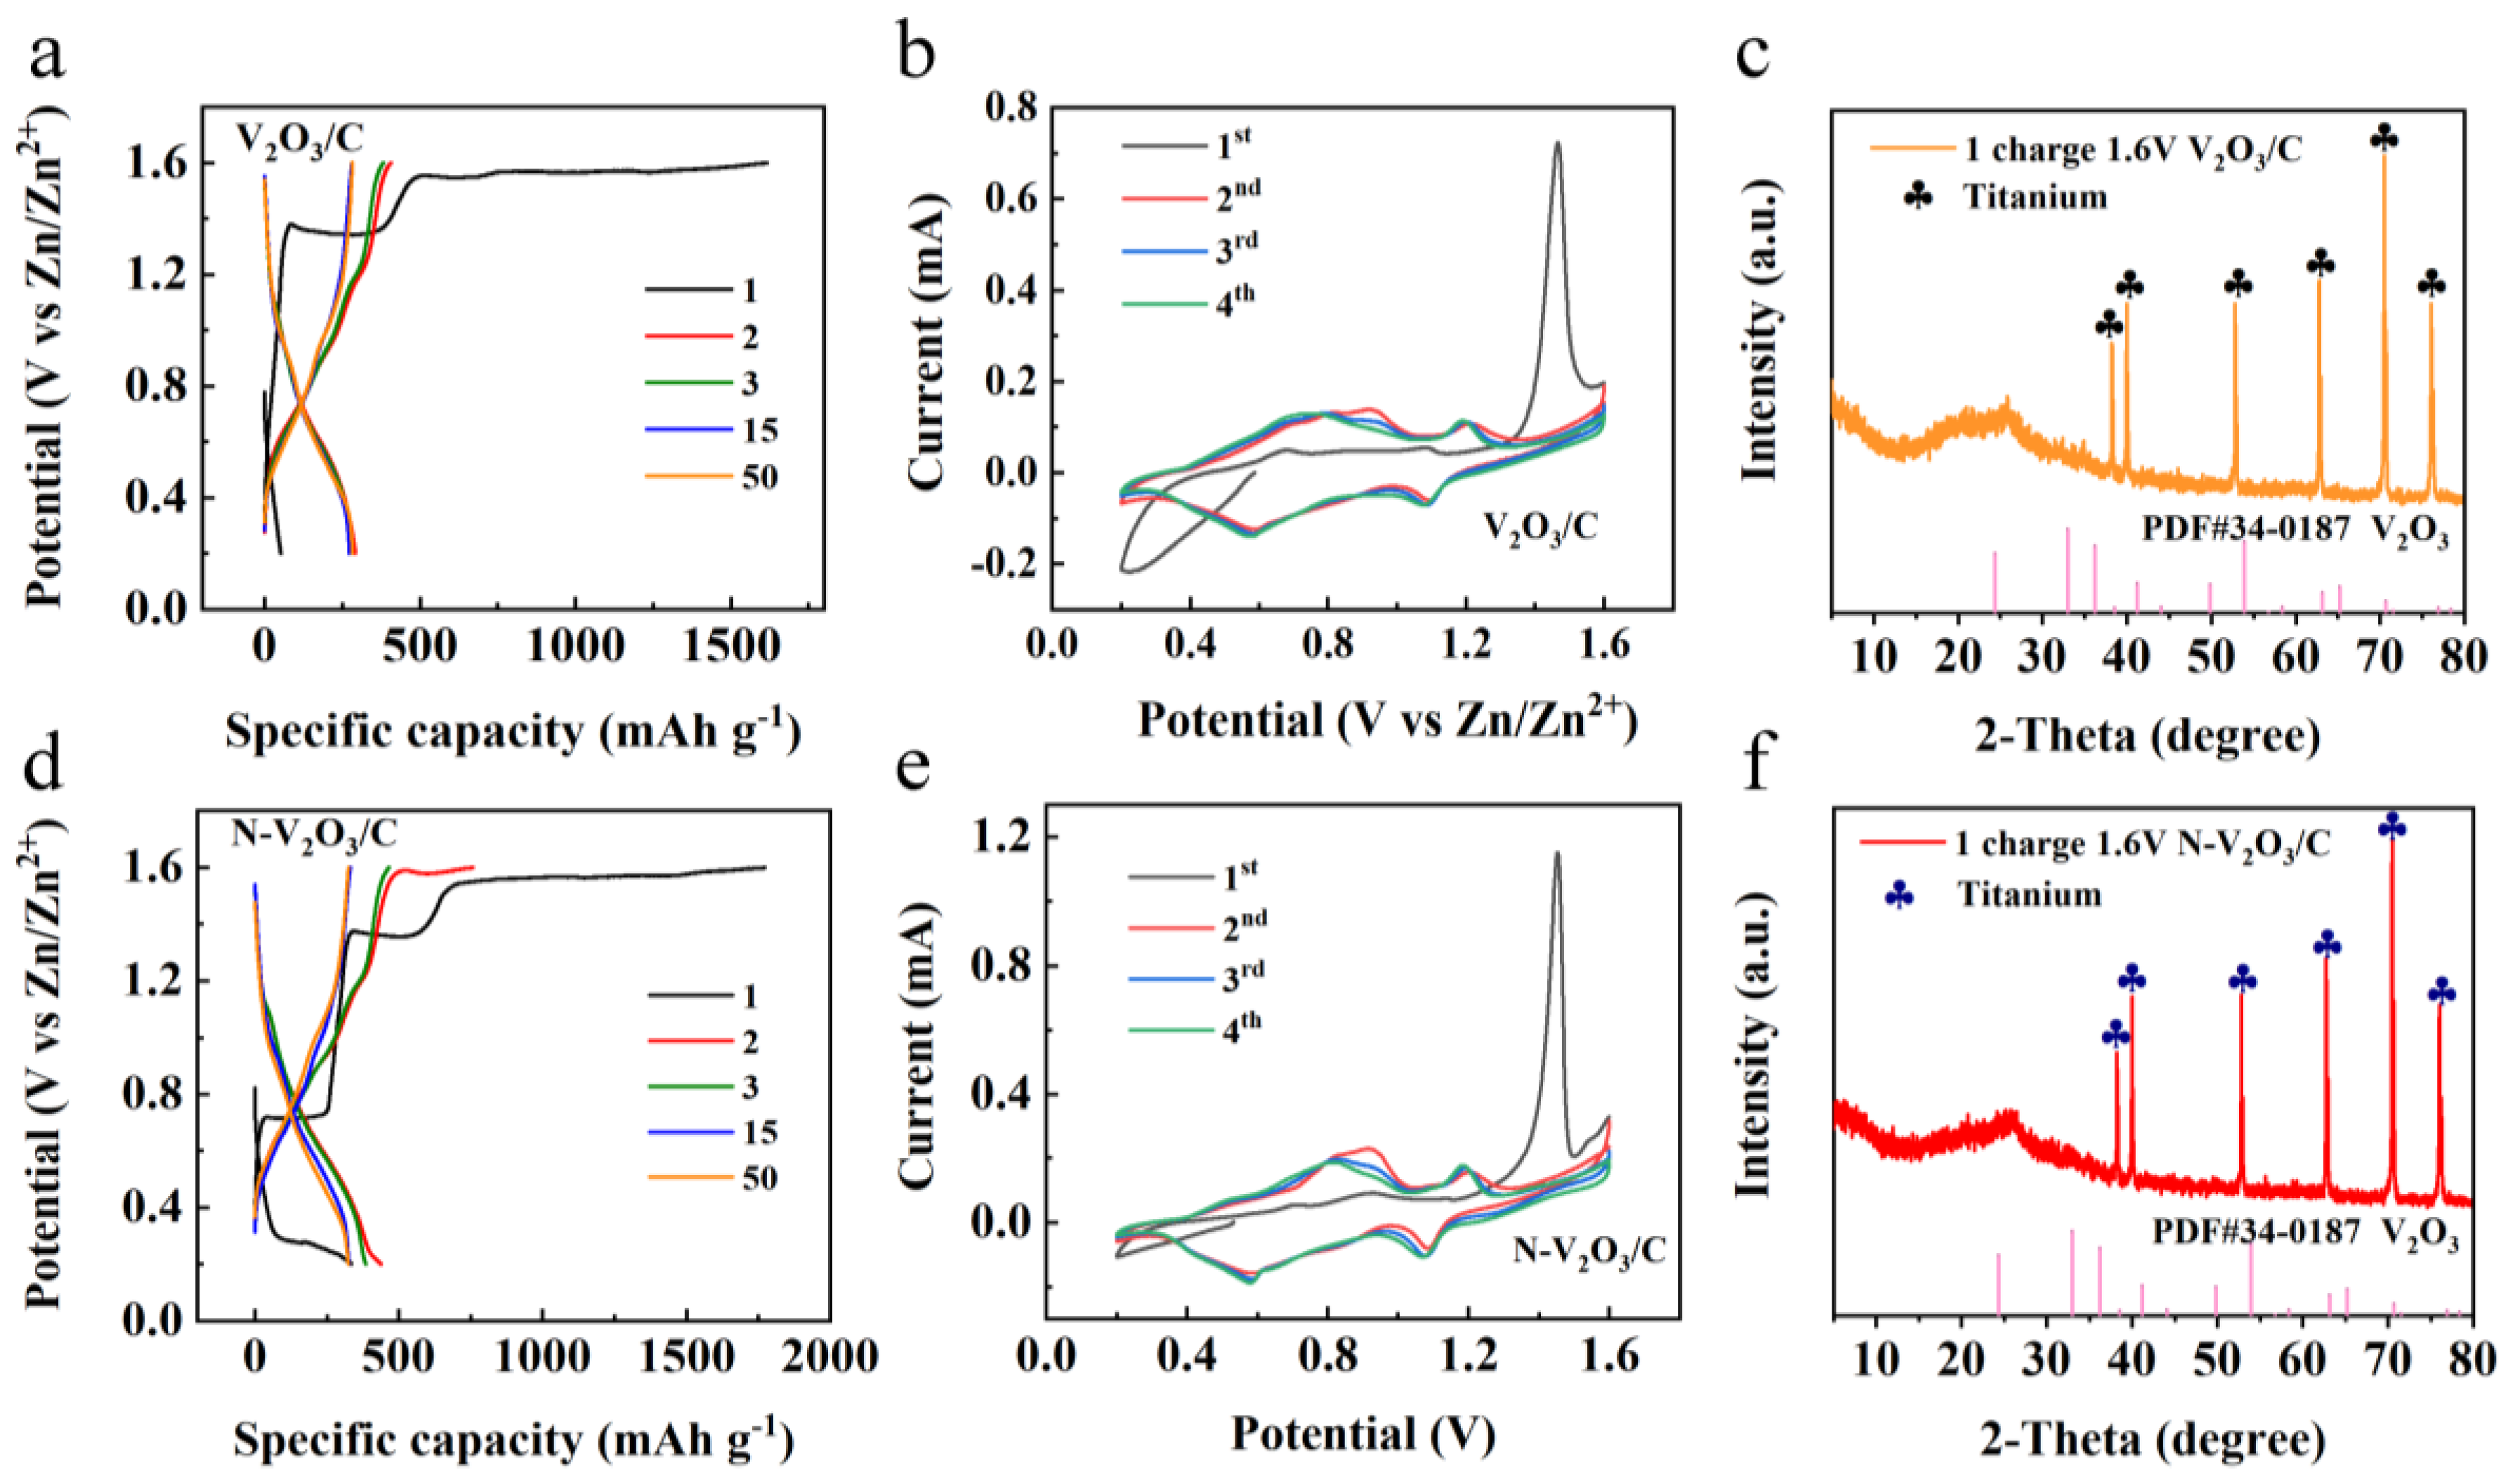
Figure 4.
SEM images after cycle of (a-b) V2O3/C, (c-d) N-V2O3/C.
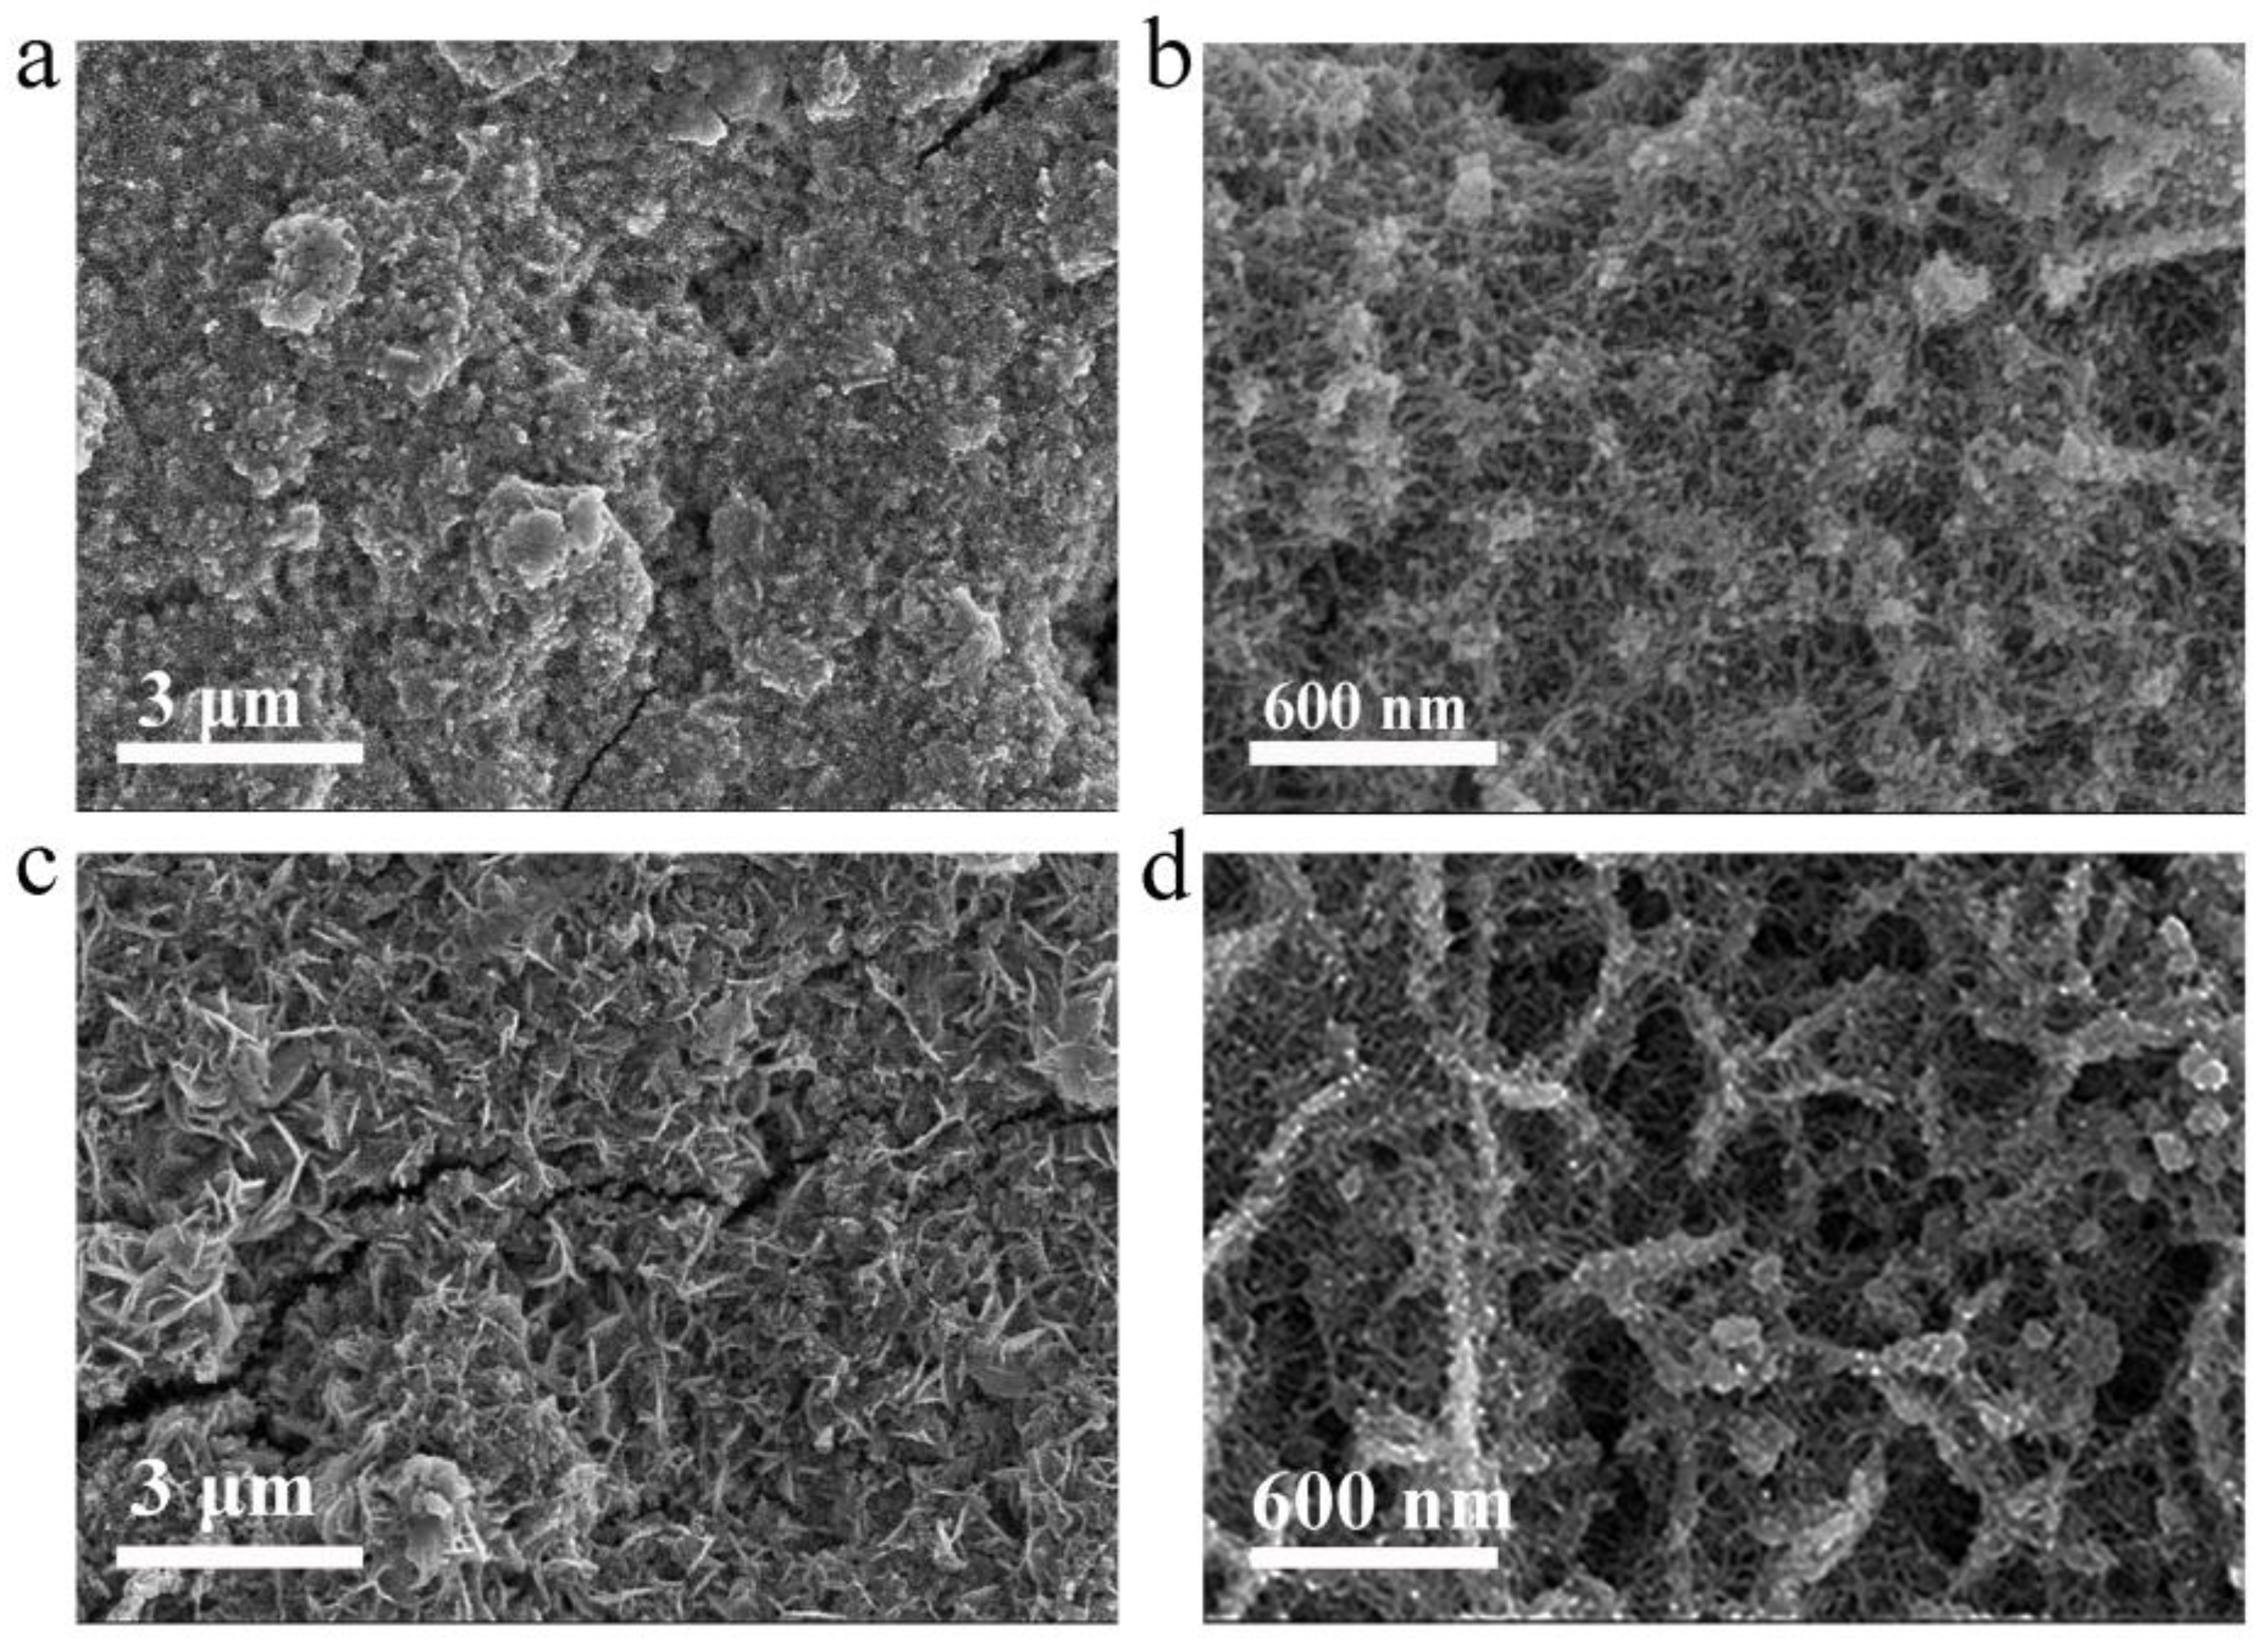
Figure 5.
N-V2O3/C before cycling (a) TEM image, (b) HRTEM image, (c) selected area electron diffraction; N-V2O3/C after cycling TEM (d) and (e), (f) selected area electron diffraction.
Figure 5.
N-V2O3/C before cycling (a) TEM image, (b) HRTEM image, (c) selected area electron diffraction; N-V2O3/C after cycling TEM (d) and (e), (f) selected area electron diffraction.
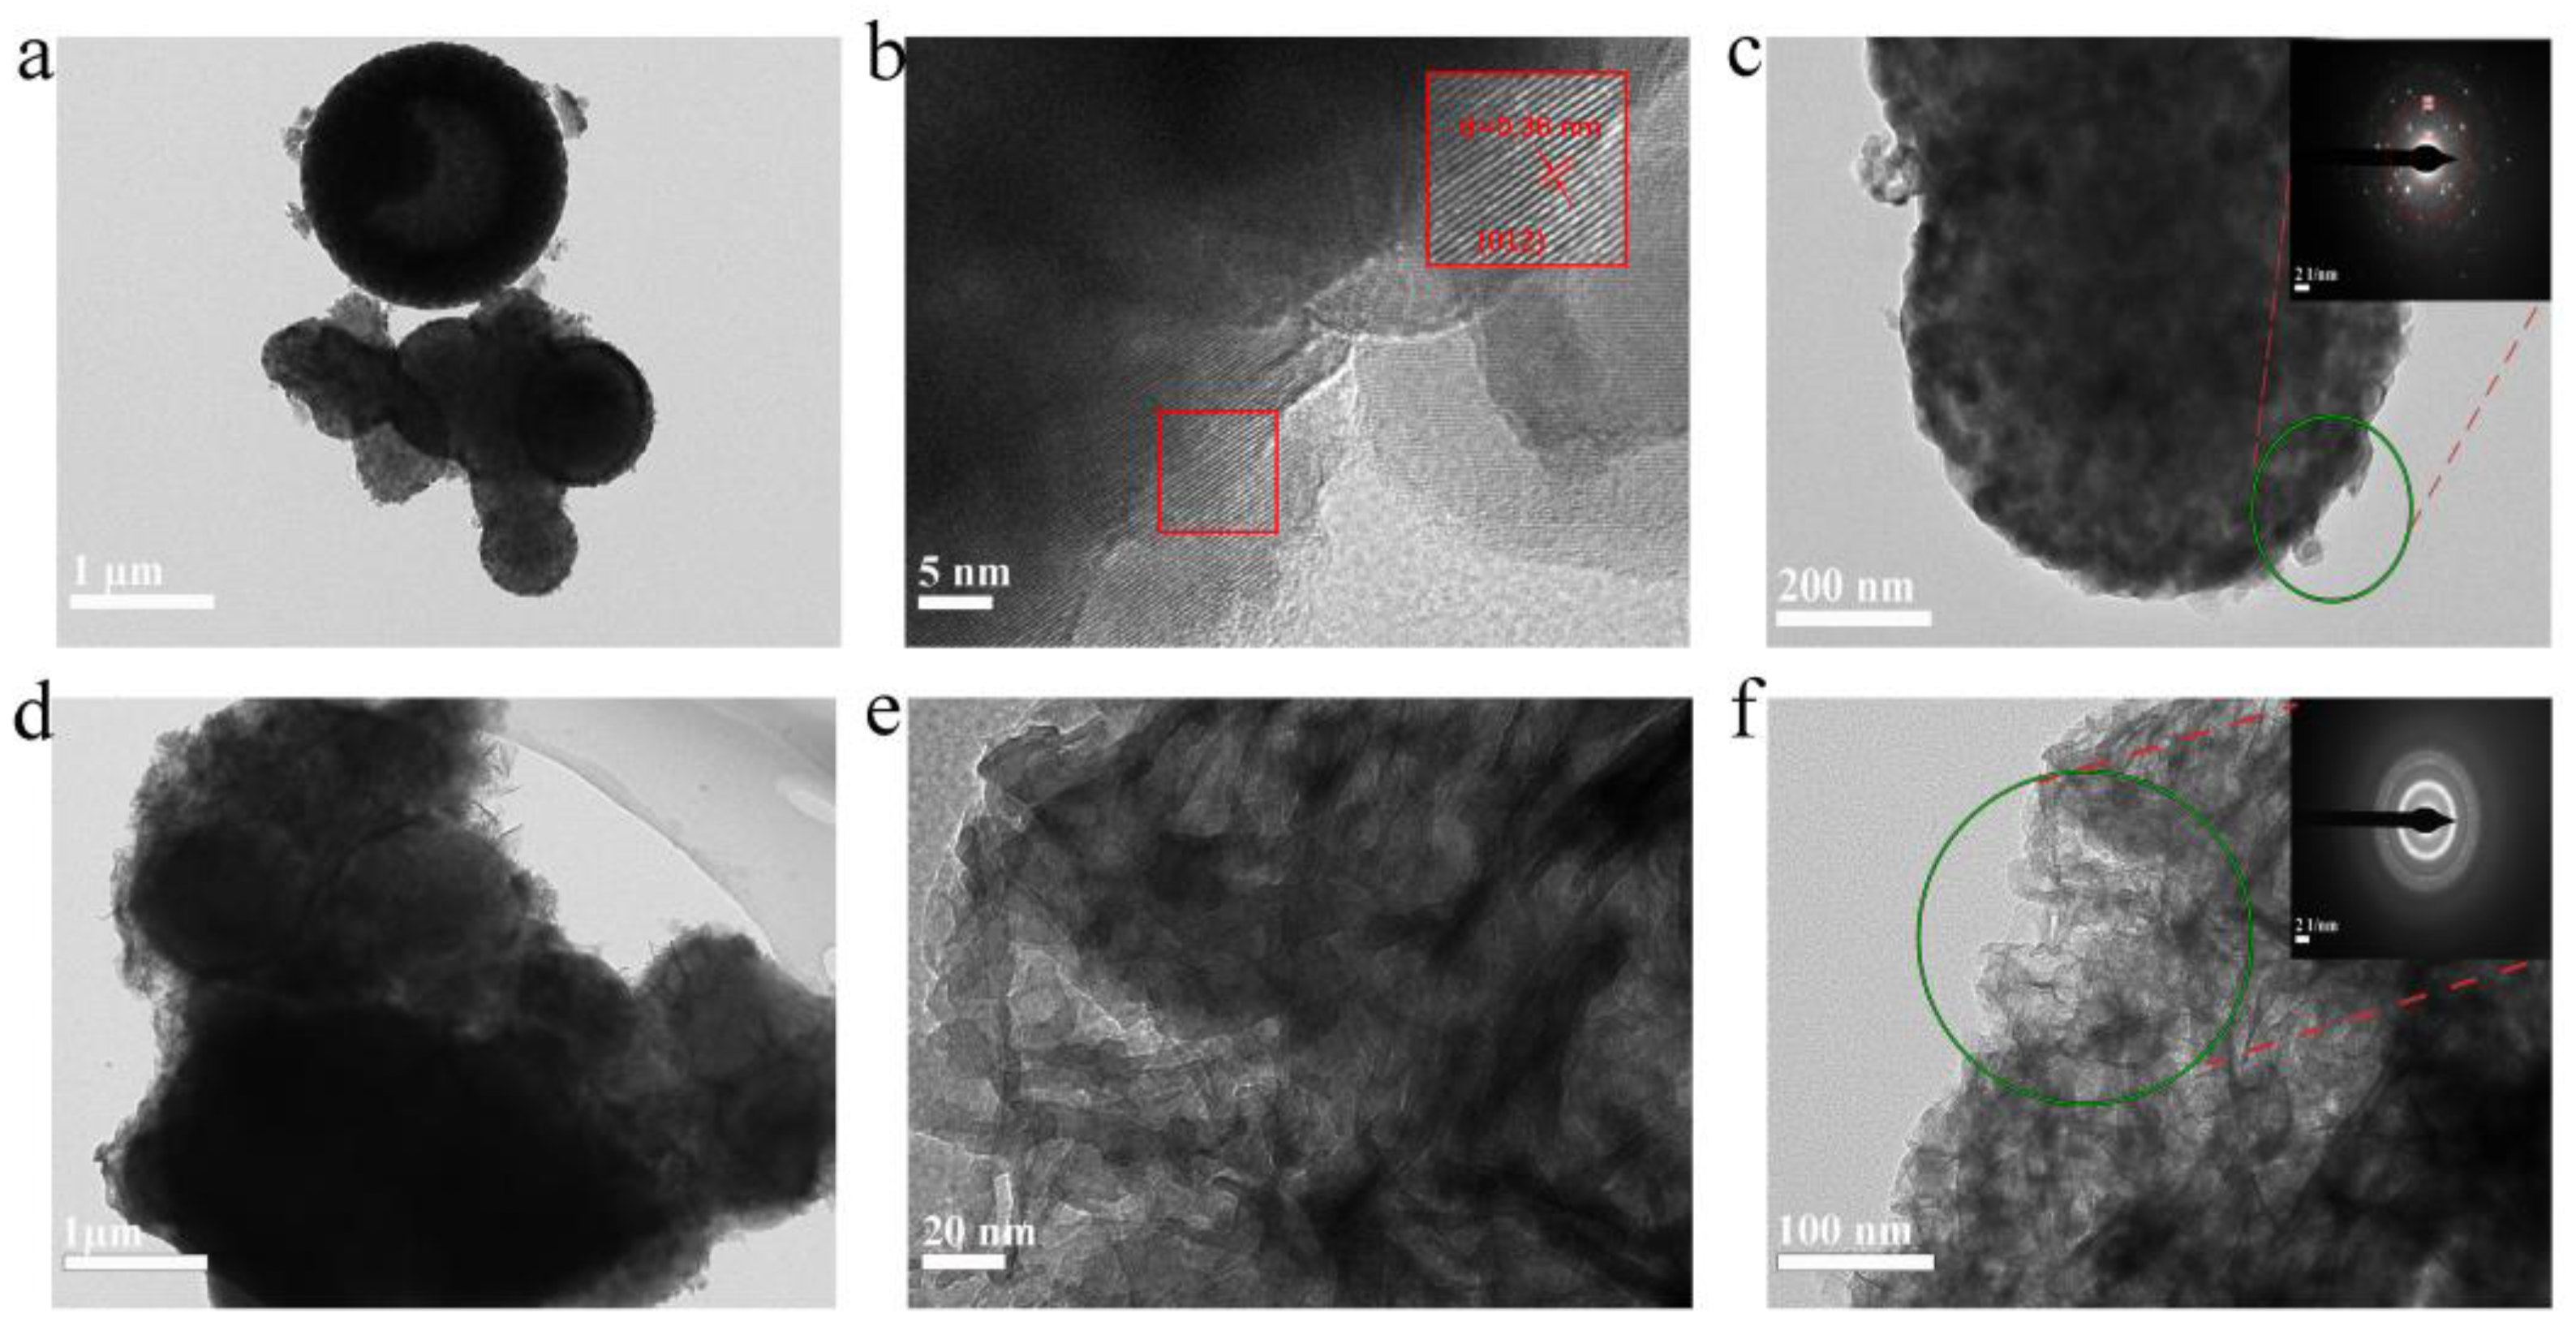
Figure 6.
(a) XPS full spectrum information of N-V2O3/C; (b) XPS fine spectrum of V 2p in N-V2O3/C; (c) XPS high-resolution spectra of N 1s in N-V2O3/C.
Figure 6.
(a) XPS full spectrum information of N-V2O3/C; (b) XPS fine spectrum of V 2p in N-V2O3/C; (c) XPS high-resolution spectra of N 1s in N-V2O3/C.
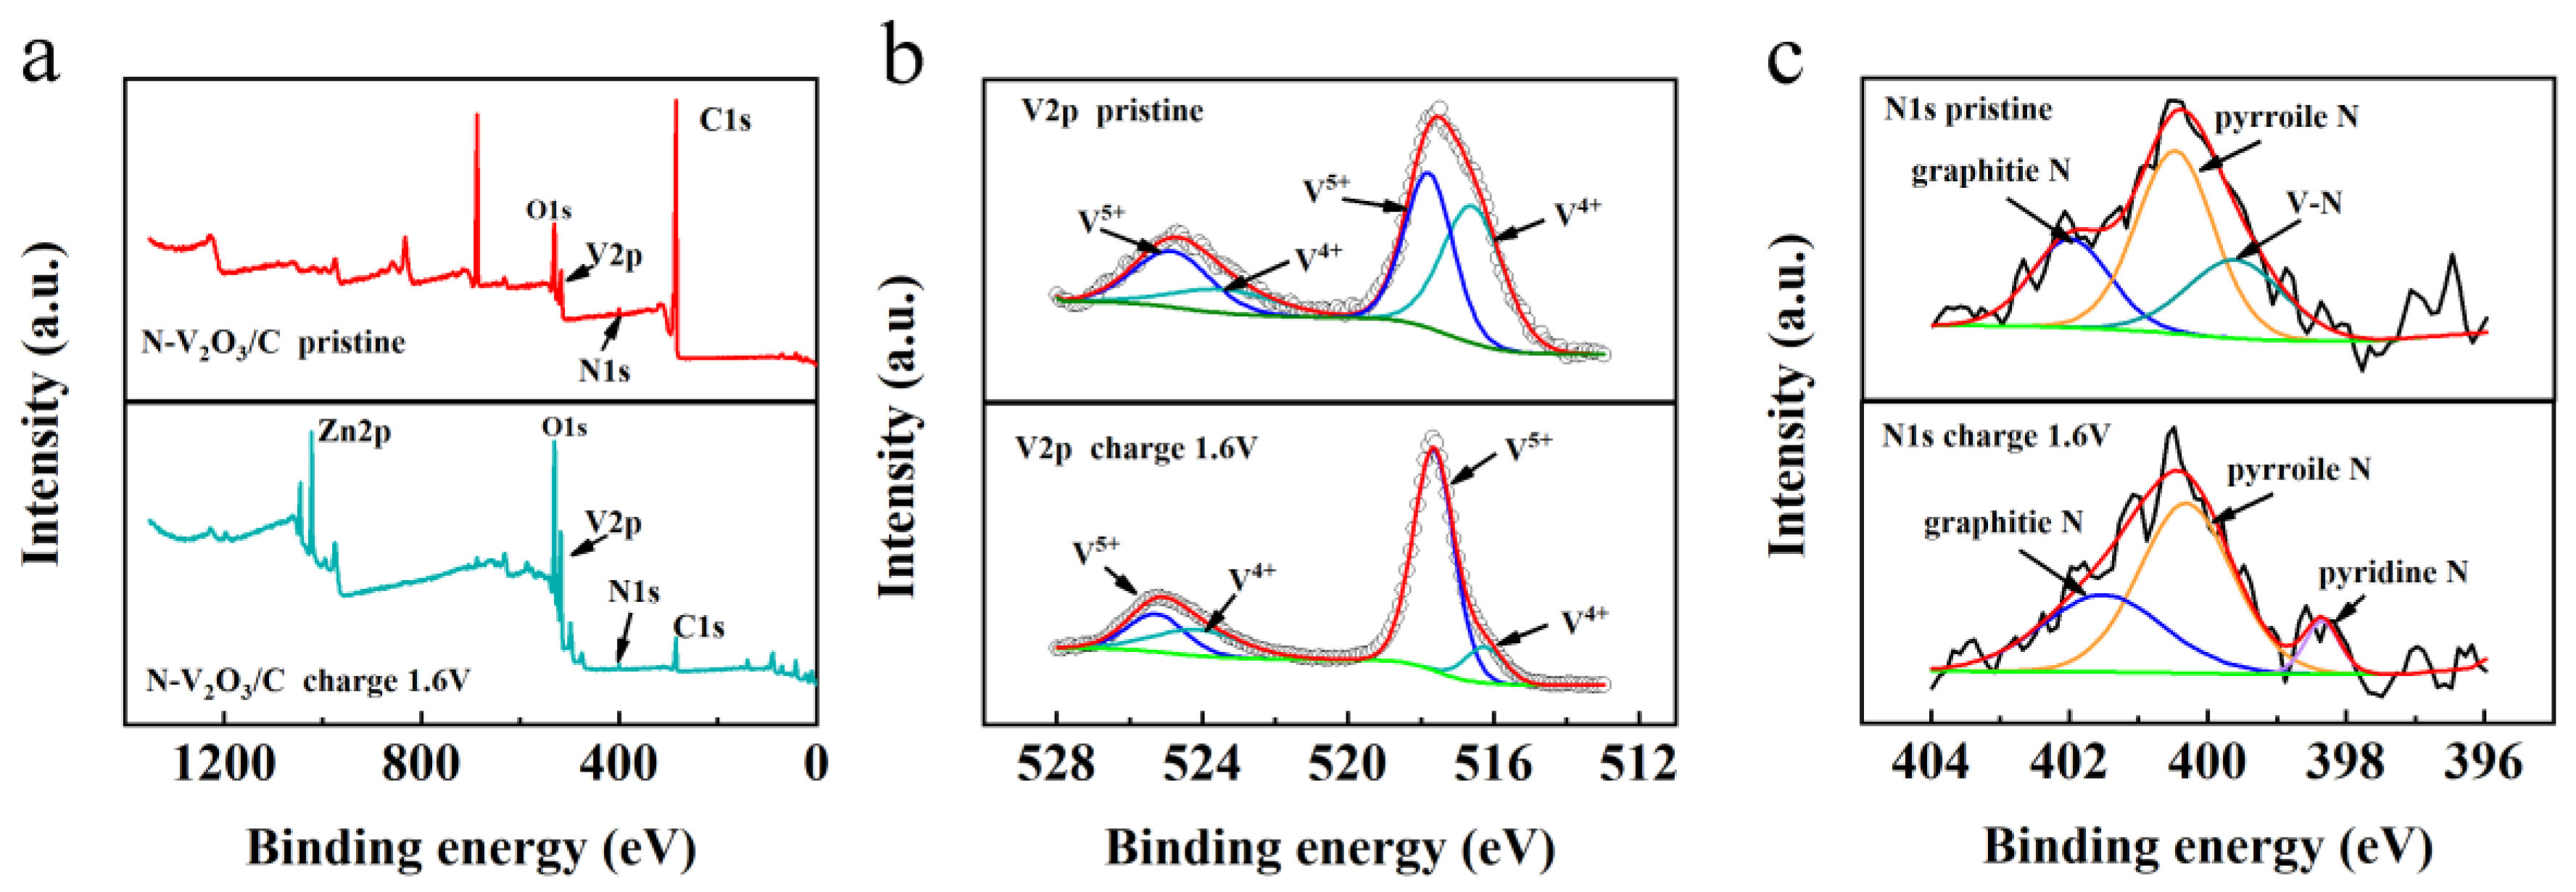
Figure 7.
Electrochemical performance of V2O3/C and N-V2O3/C after phase change (a) cycling performance at 0.2 A g−1, (b) cycling performance at 5 A g−1, (c) rate performance, (d) constant current charge-discharge curves at different current densities.
Figure 7.
Electrochemical performance of V2O3/C and N-V2O3/C after phase change (a) cycling performance at 0.2 A g−1, (b) cycling performance at 5 A g−1, (c) rate performance, (d) constant current charge-discharge curves at different current densities.
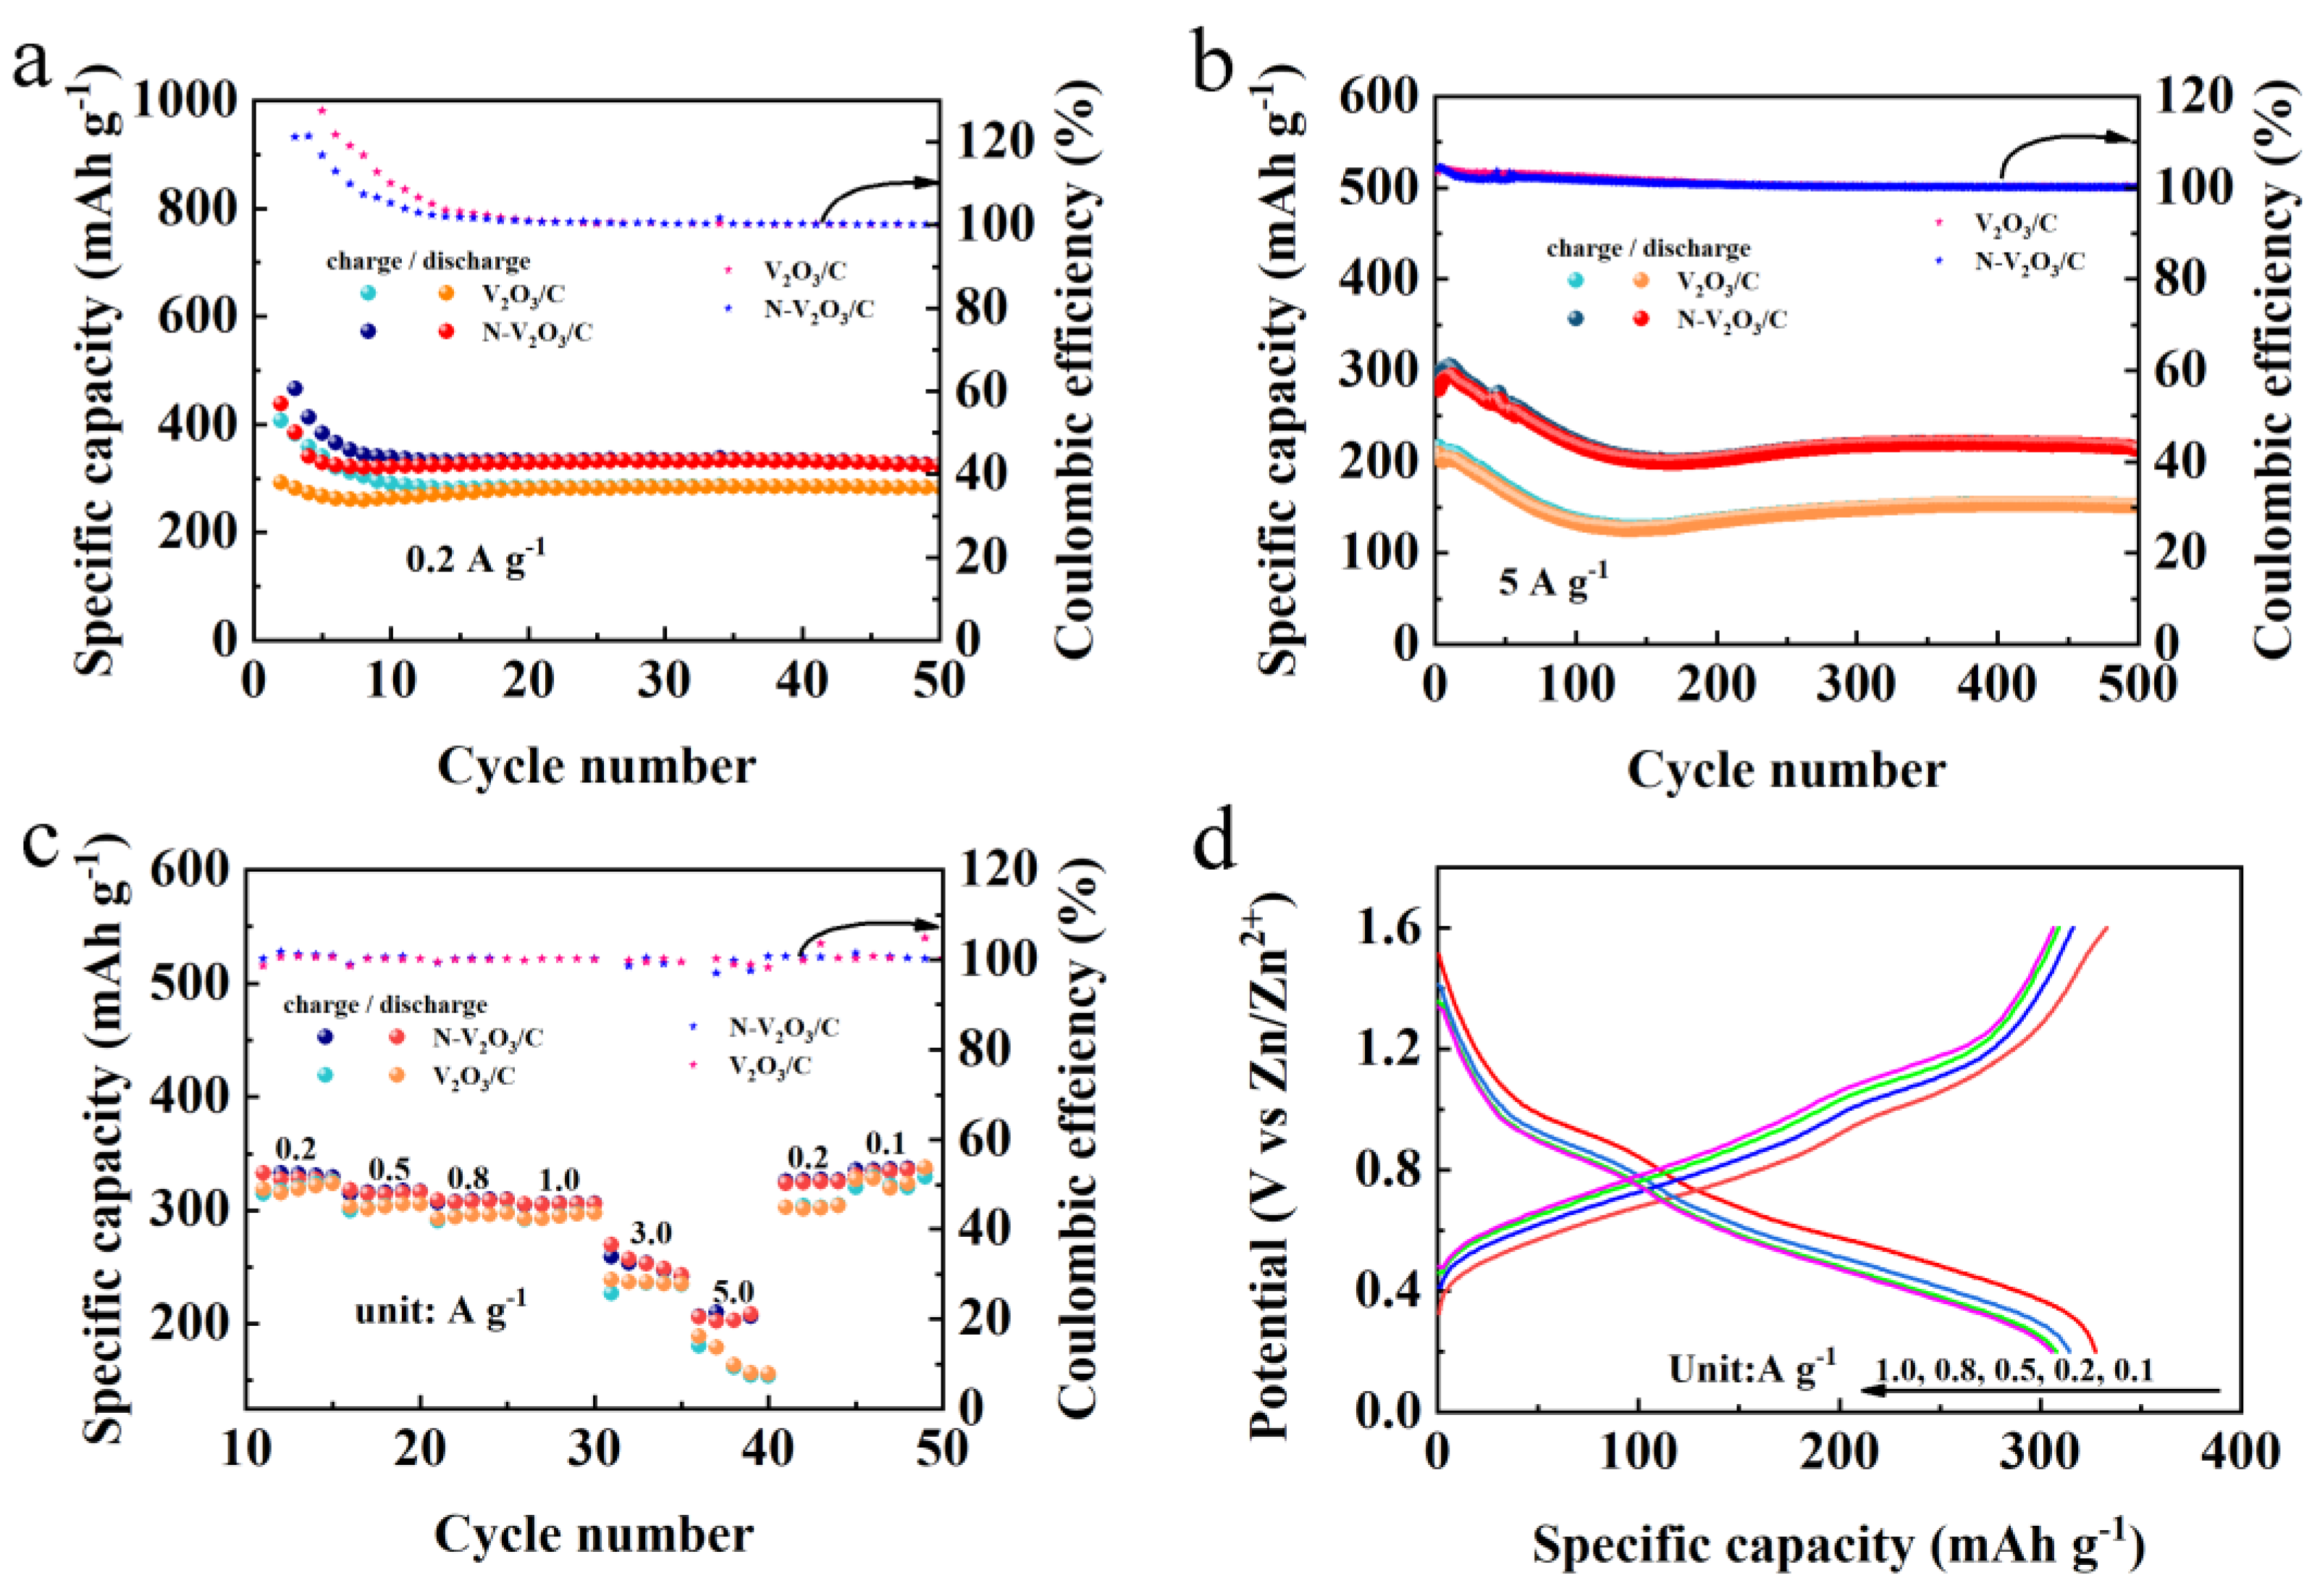
Figure 8.
Long cycle performance of V2O3/C and N-V2O3/C at 10 A g−1.
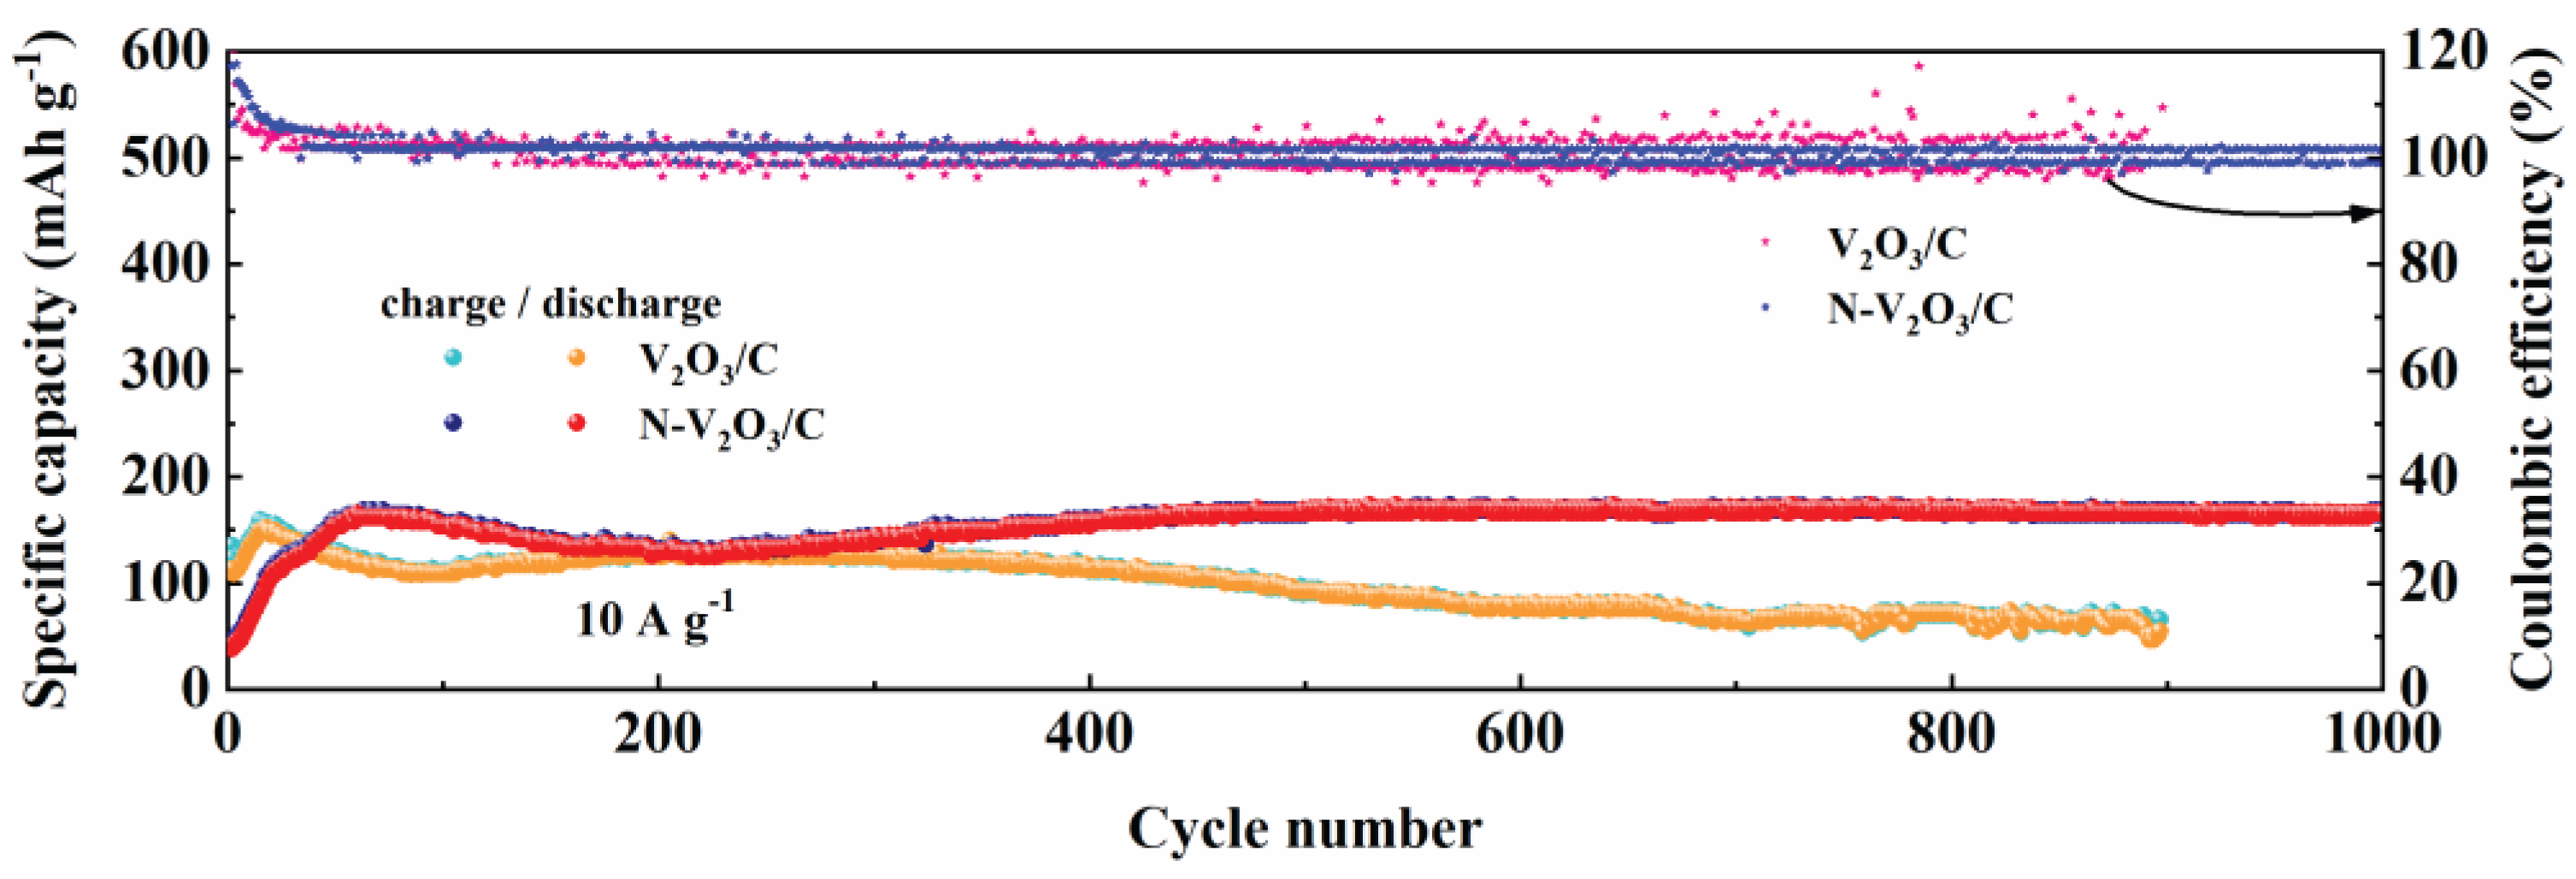
Figure 9.
CV curves at different sweep speeds (a) V2O3/C, (d) N-V2O3/C; Linear fit curves of log(i) versus log(v) (b) V2O3/C, (e) N-V2O3/C; CV curves at 0.1 mV s−1 sweep speed (c) V2O3/C, (f) N-V2O3/C.
Figure 9.
CV curves at different sweep speeds (a) V2O3/C, (d) N-V2O3/C; Linear fit curves of log(i) versus log(v) (b) V2O3/C, (e) N-V2O3/C; CV curves at 0.1 mV s−1 sweep speed (c) V2O3/C, (f) N-V2O3/C.
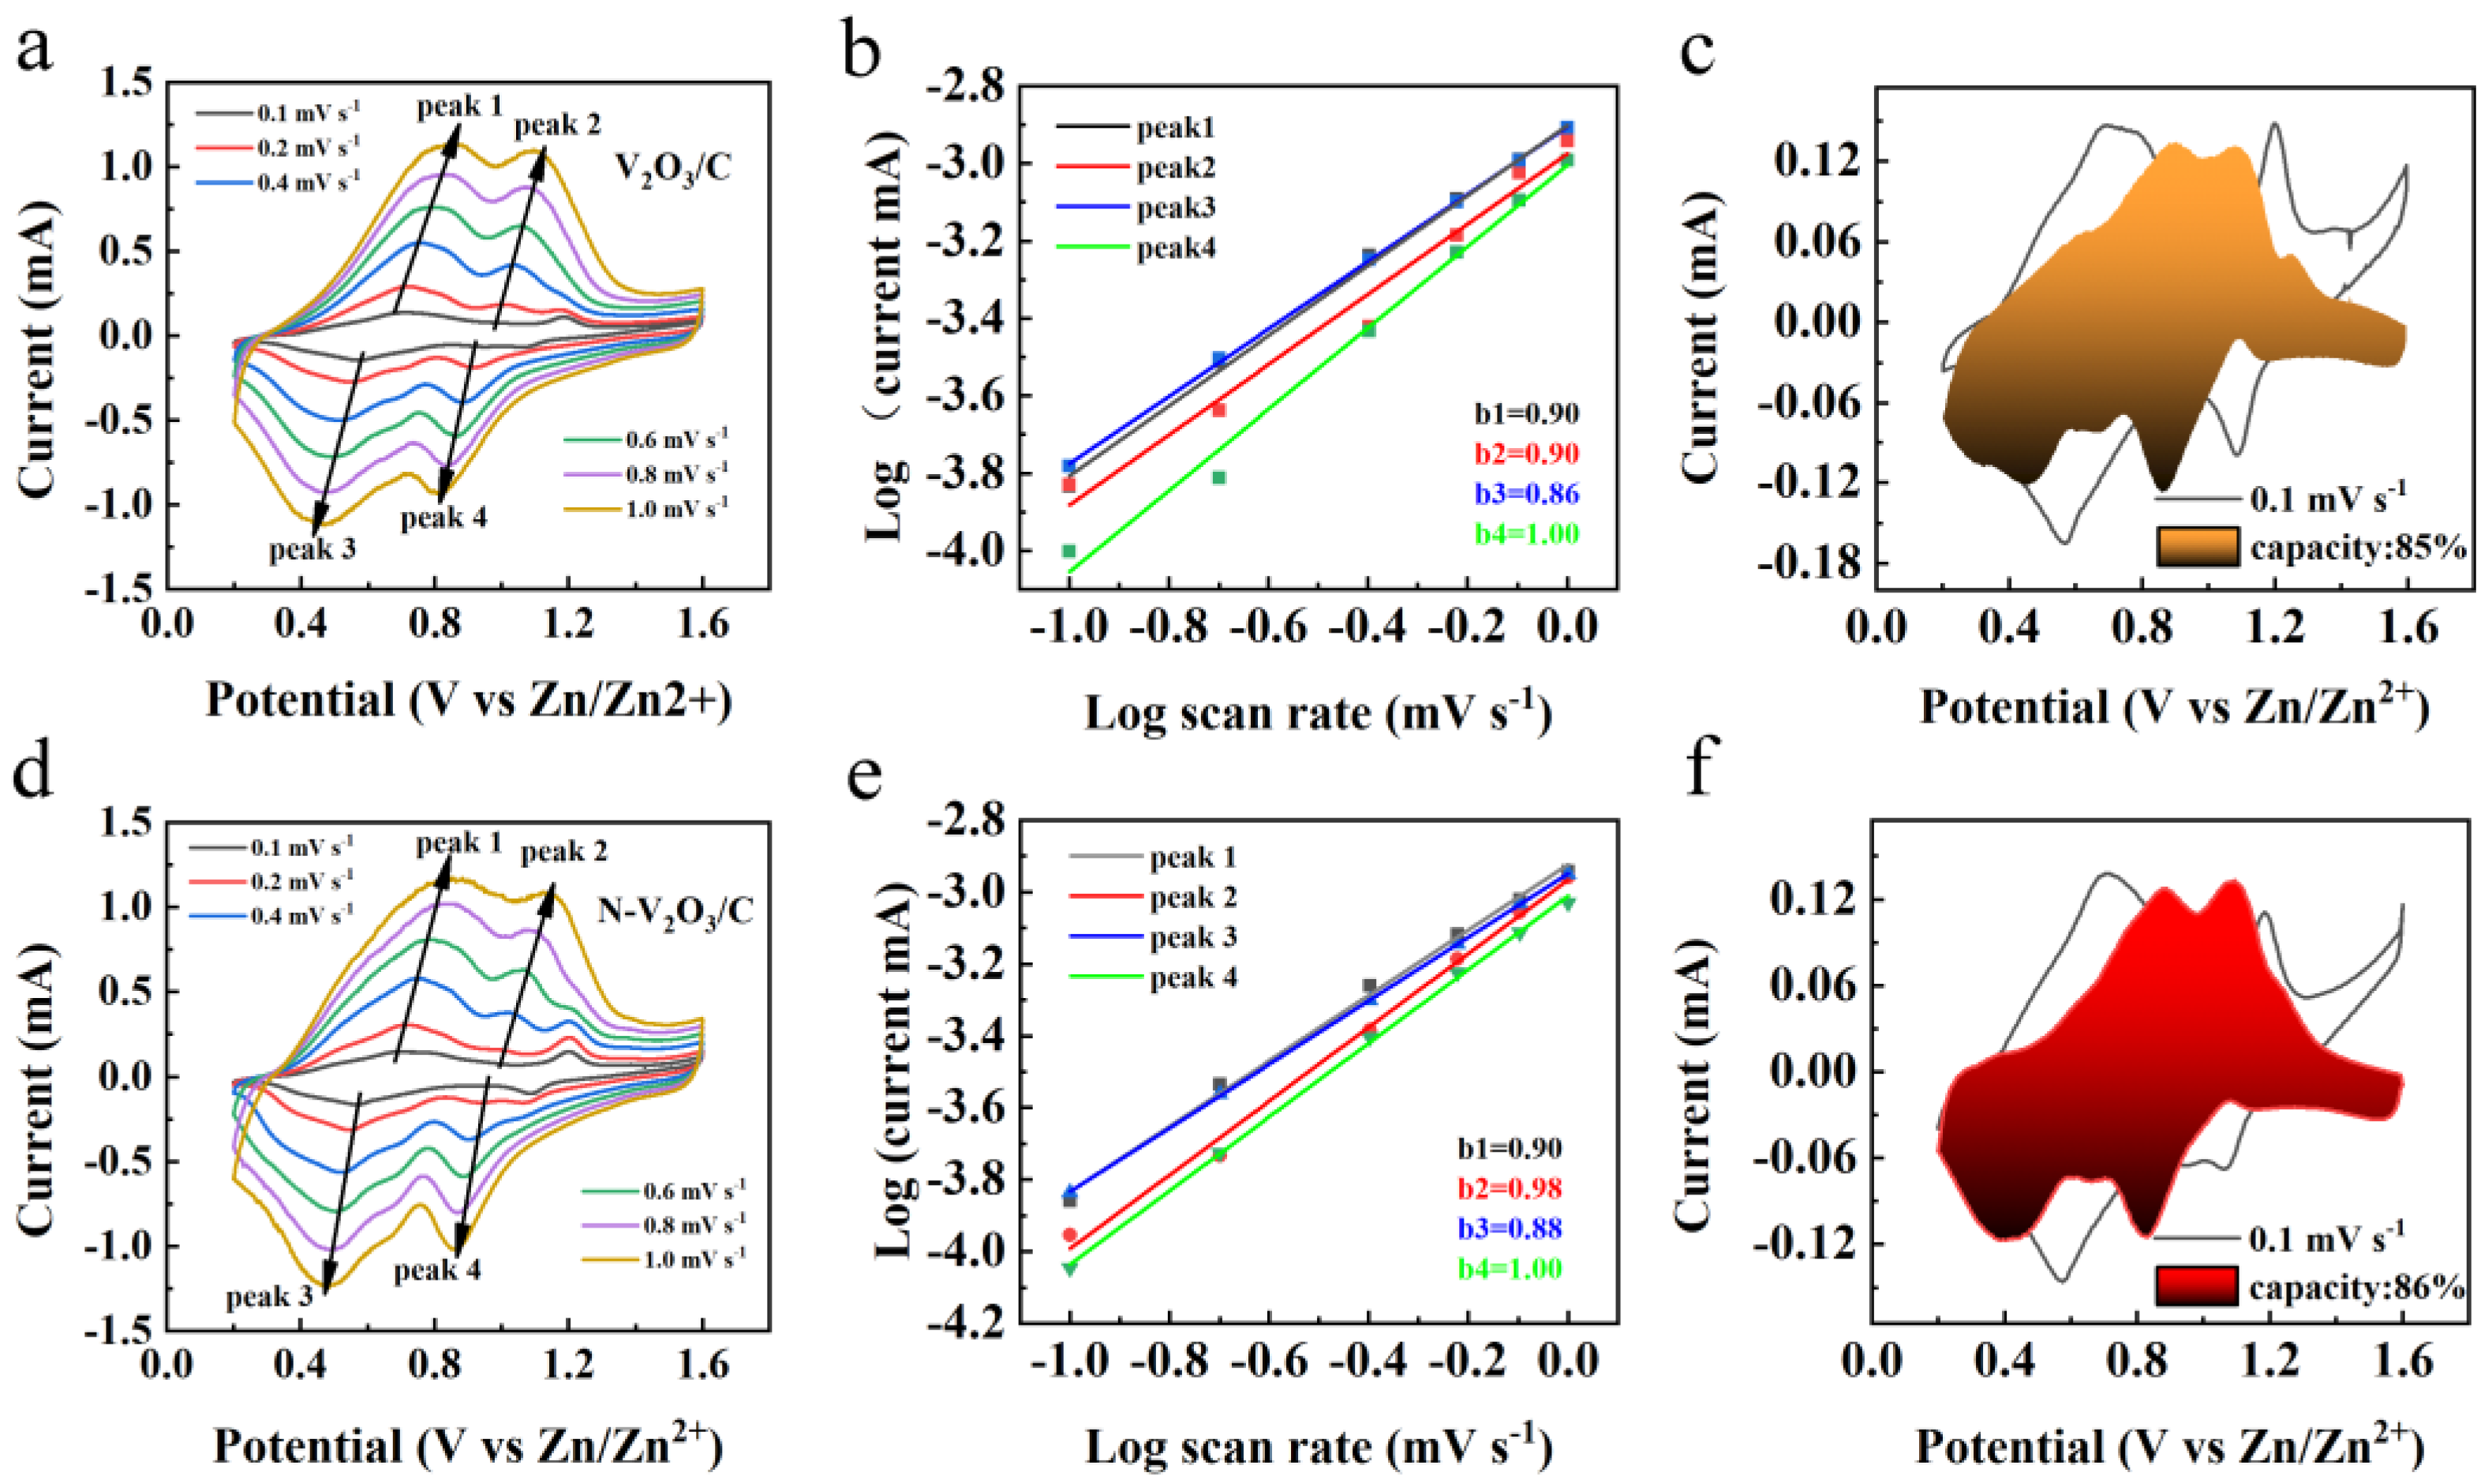
Figure 10.
Capacitance contribution diagram at different sweep speeds (a) V2O3/C, (b) N-V2O3/C.
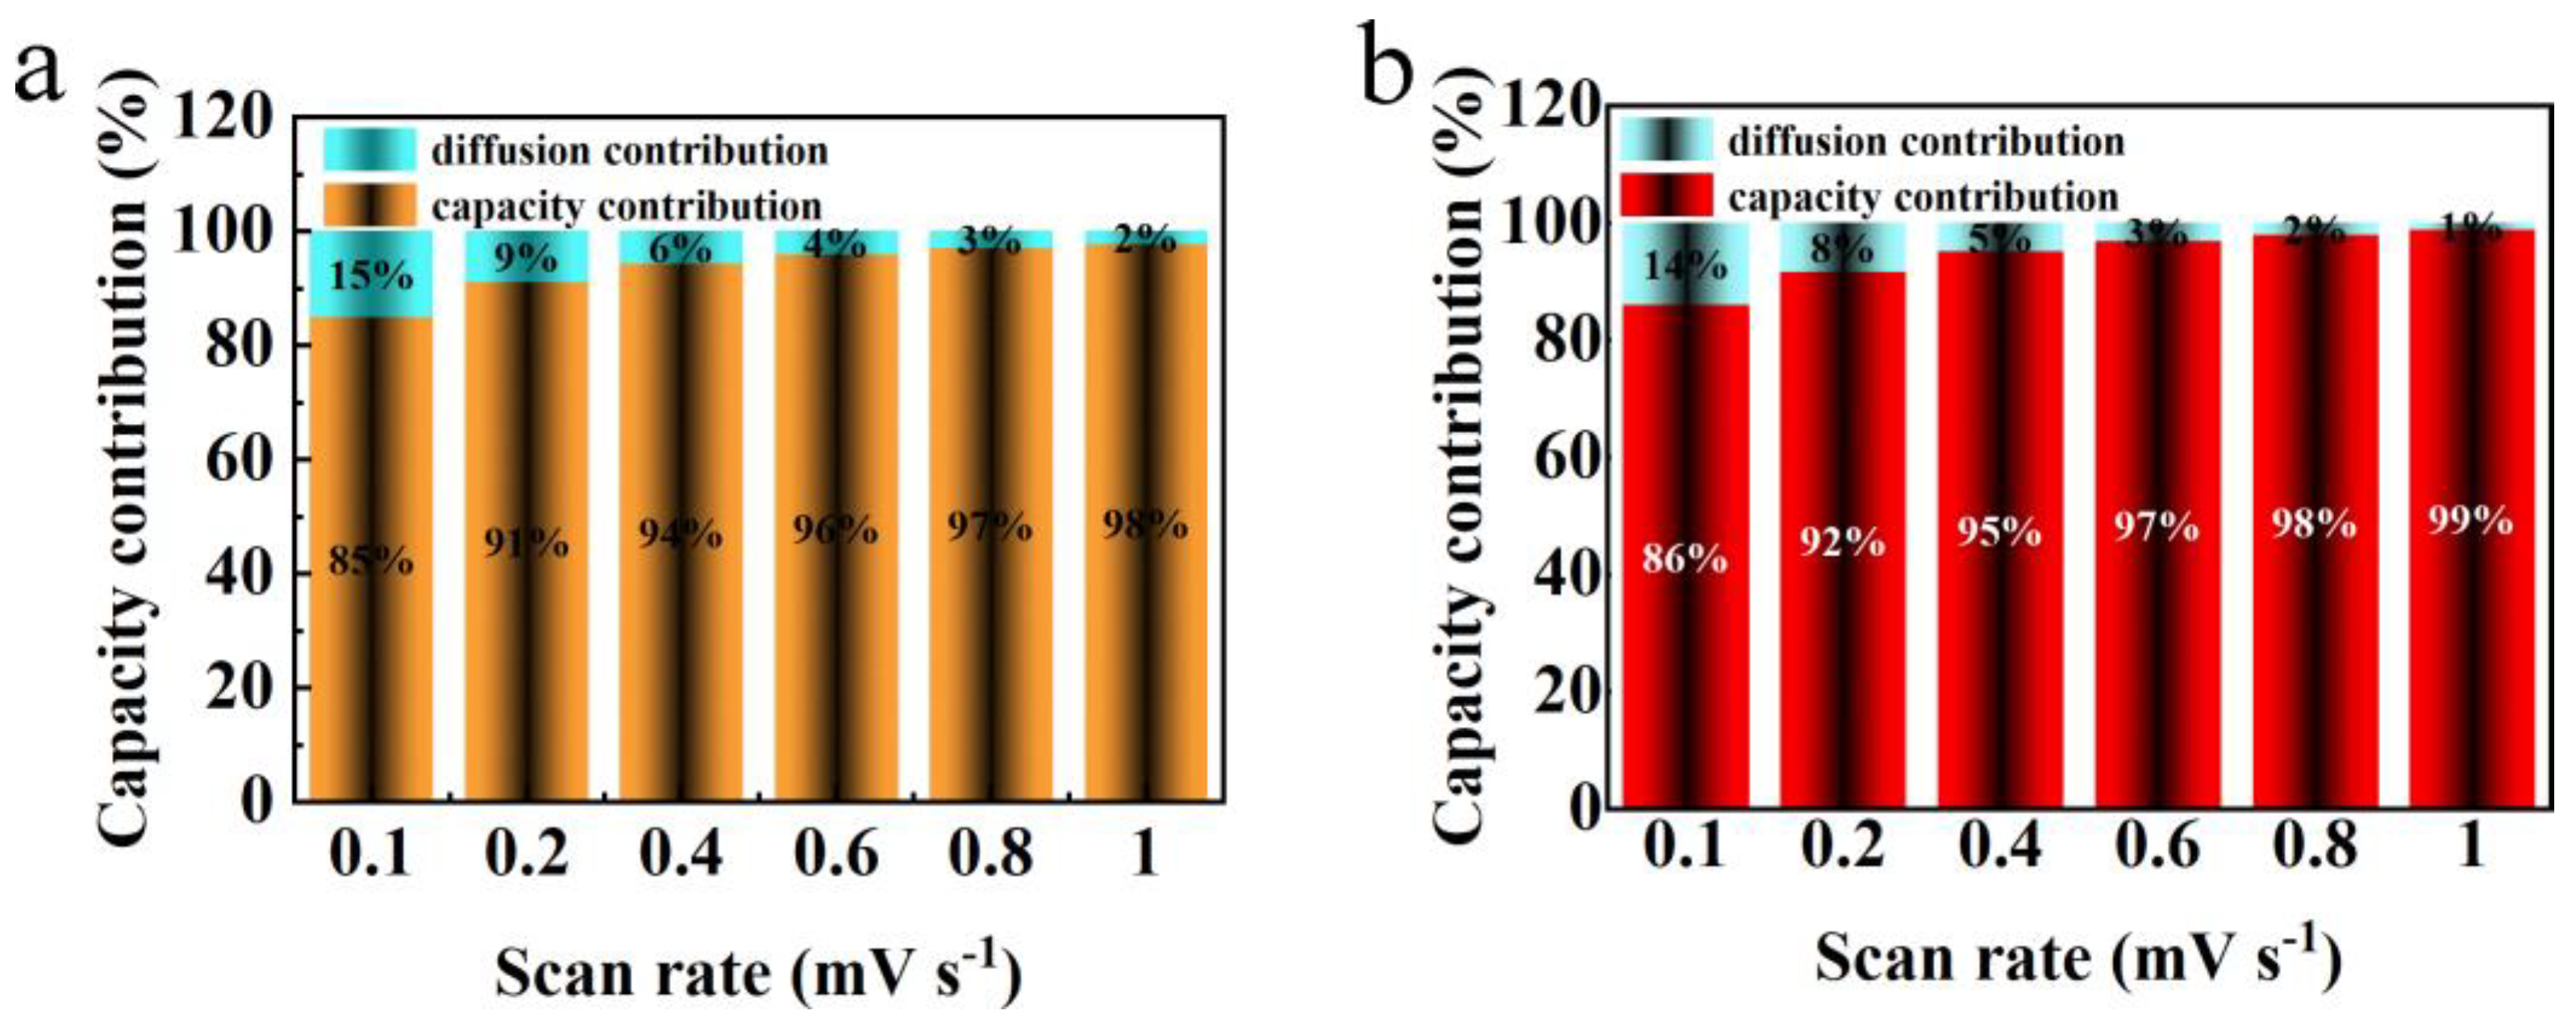
Figure 11.
(a) impedance of V2O3/C and N-V2O3/C, (b) impedance of N-V2O3/C after cycling.
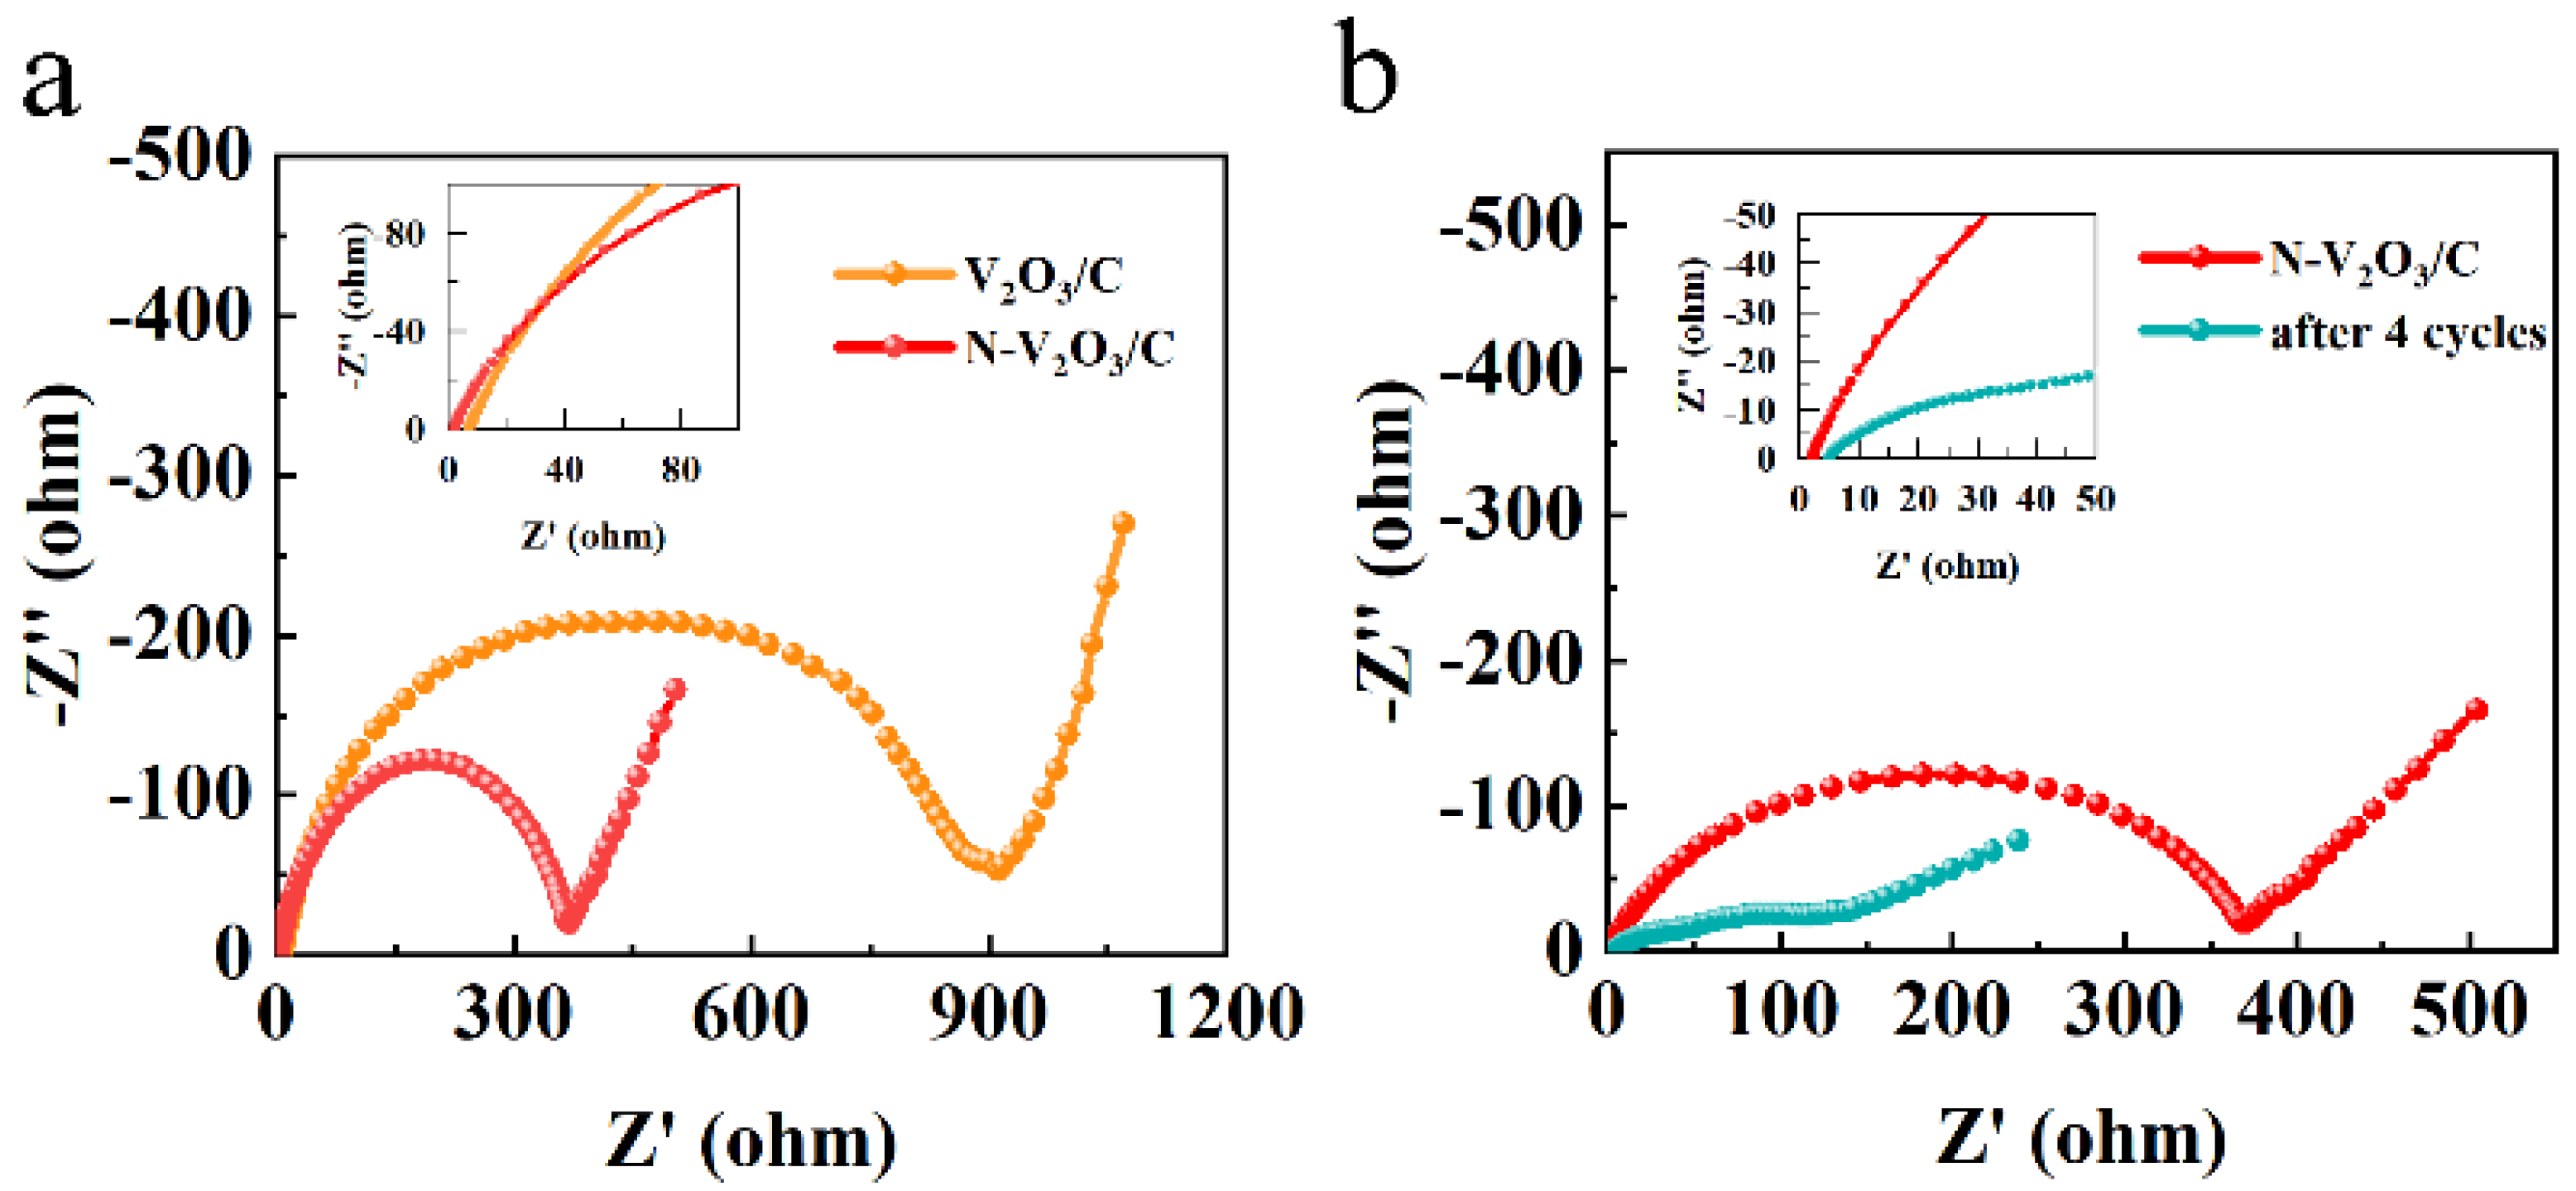
Figure 12.
GITT curves of V2O3/C and N-V2O3/C (a) at current density of 0.1 A g−1, (b) Zn2+ diffusion coefficient.
Figure 12.
GITT curves of V2O3/C and N-V2O3/C (a) at current density of 0.1 A g−1, (b) Zn2+ diffusion coefficient.
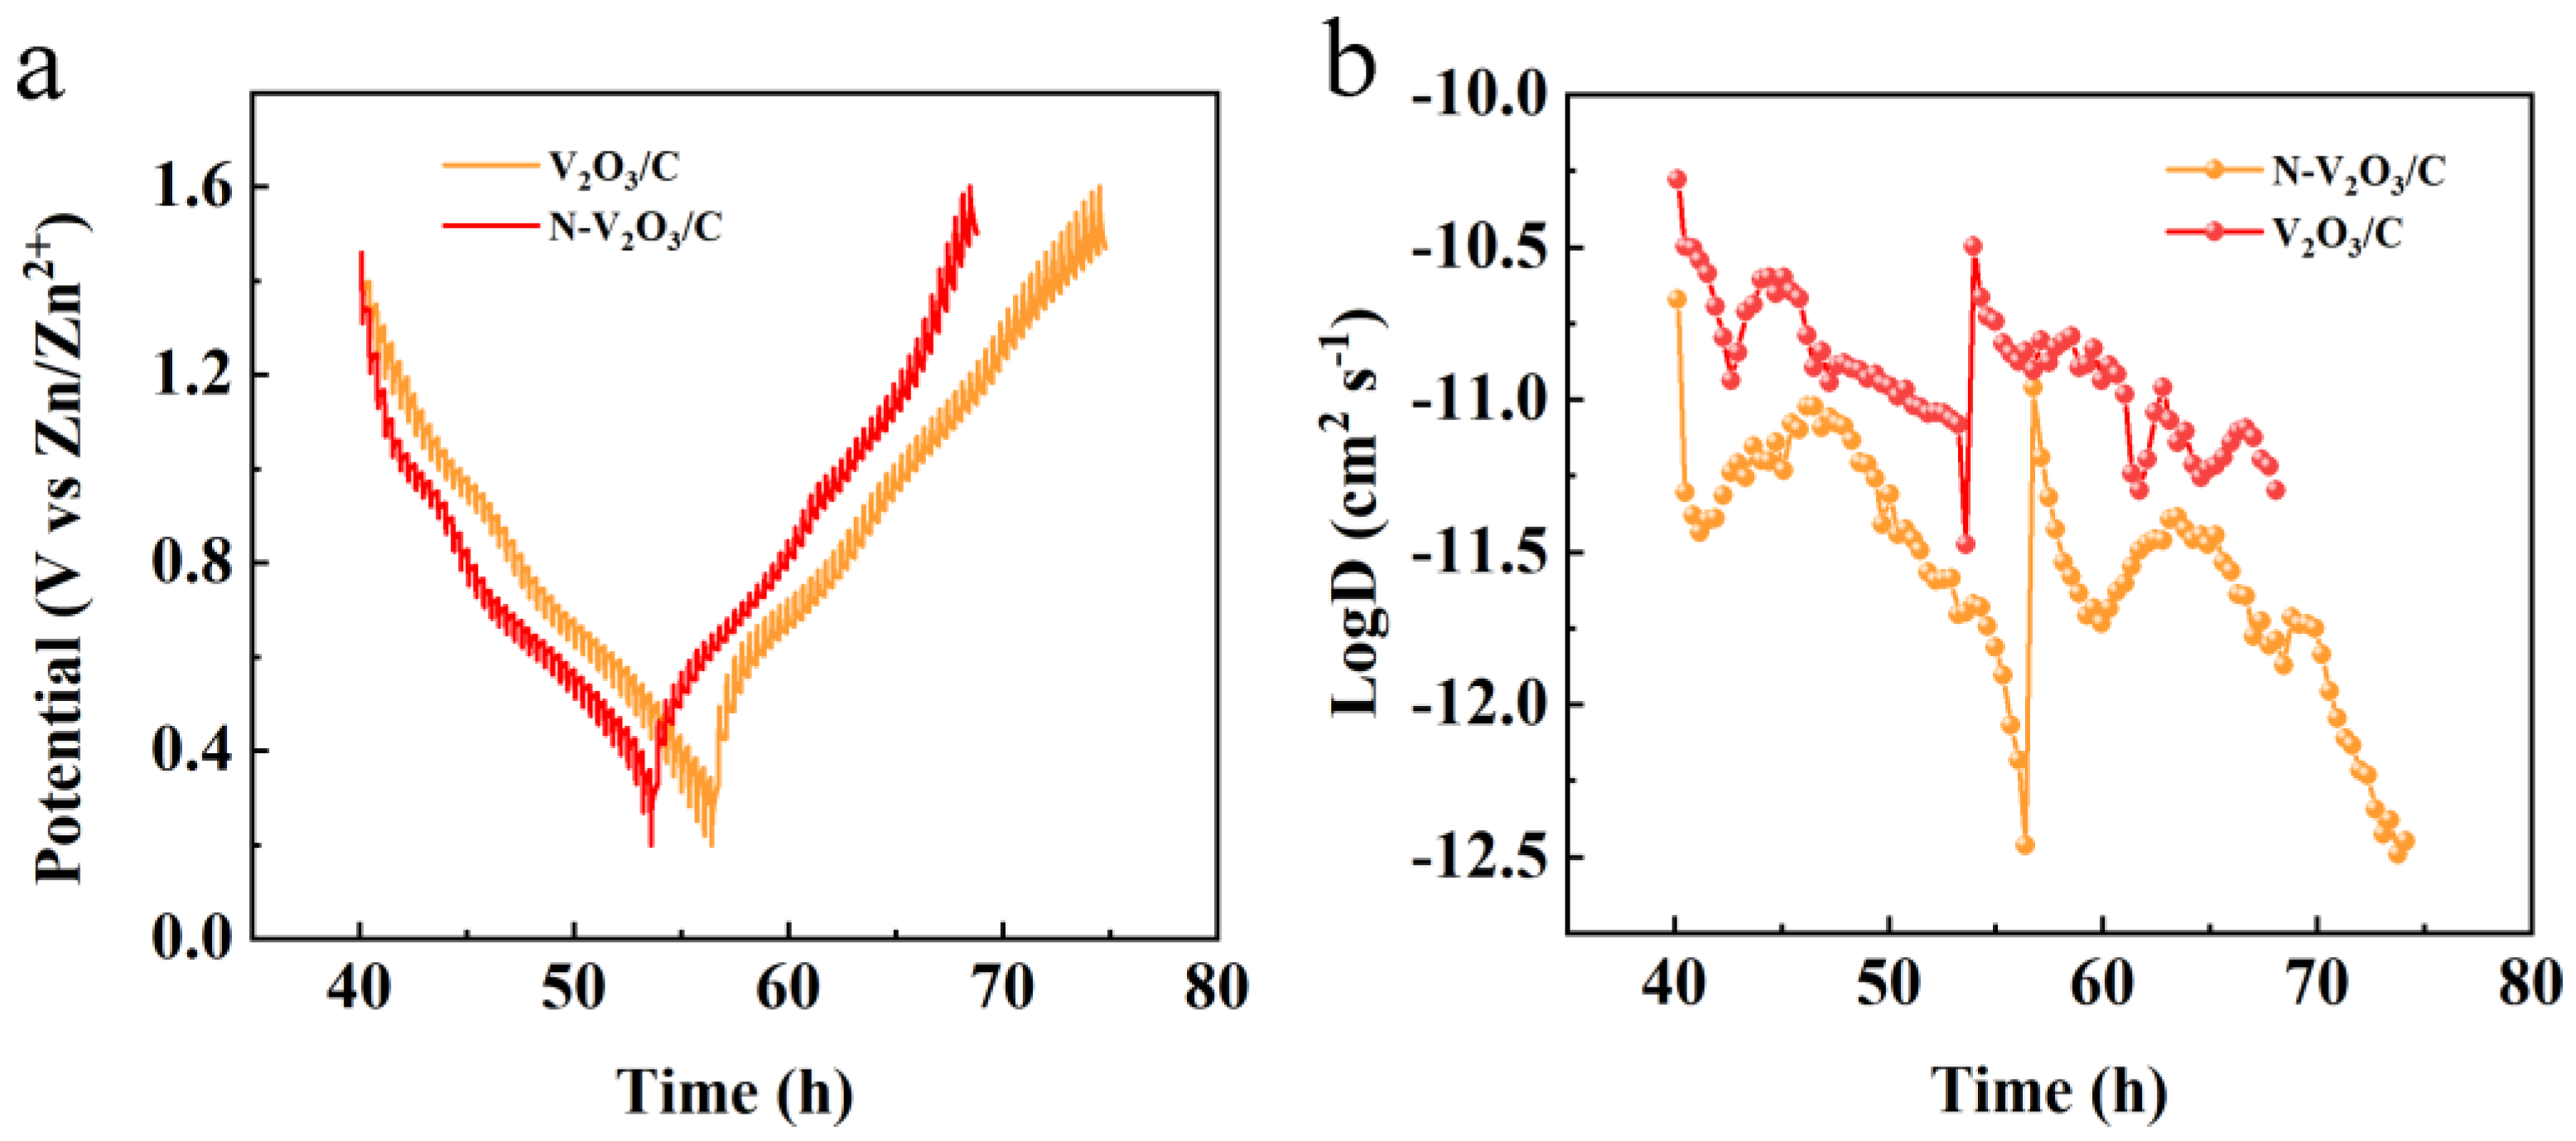
Figure 13.
(a) Third constant current charge-discharge curve of N-V2O3/C at a current density of 0.1 A g−1, (b) ex-XRD of N-V2O3/C during the 3rd charge-discharge.
Figure 13.
(a) Third constant current charge-discharge curve of N-V2O3/C at a current density of 0.1 A g−1, (b) ex-XRD of N-V2O3/C during the 3rd charge-discharge.
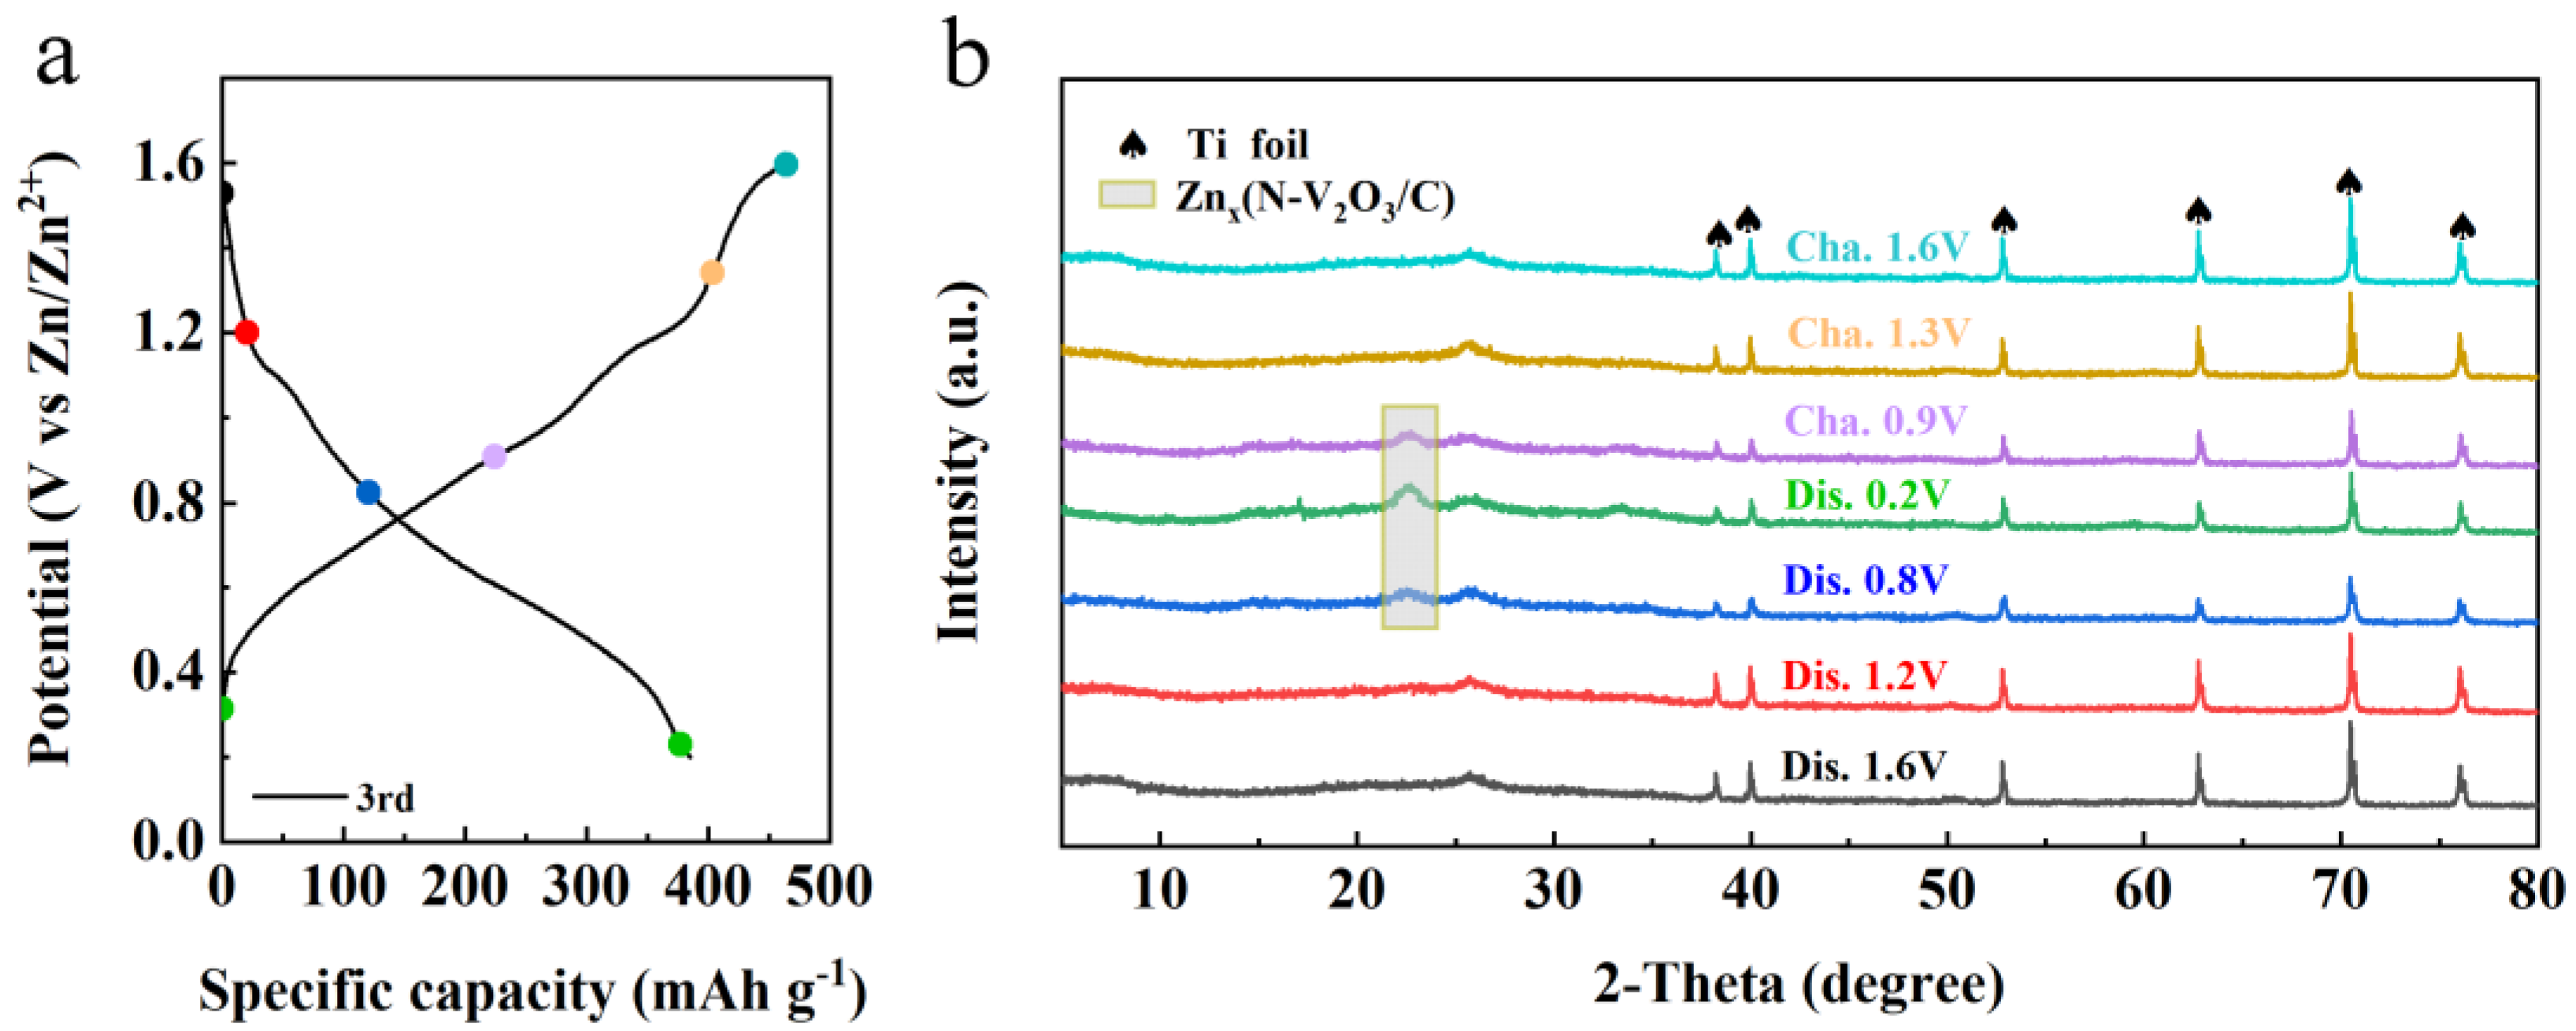
Figure 14.
Ex-XPS during the 3rd charge-discharge of N-V2O3/C (a) Zn 2p, (b) V 2p and (c) N 1s.
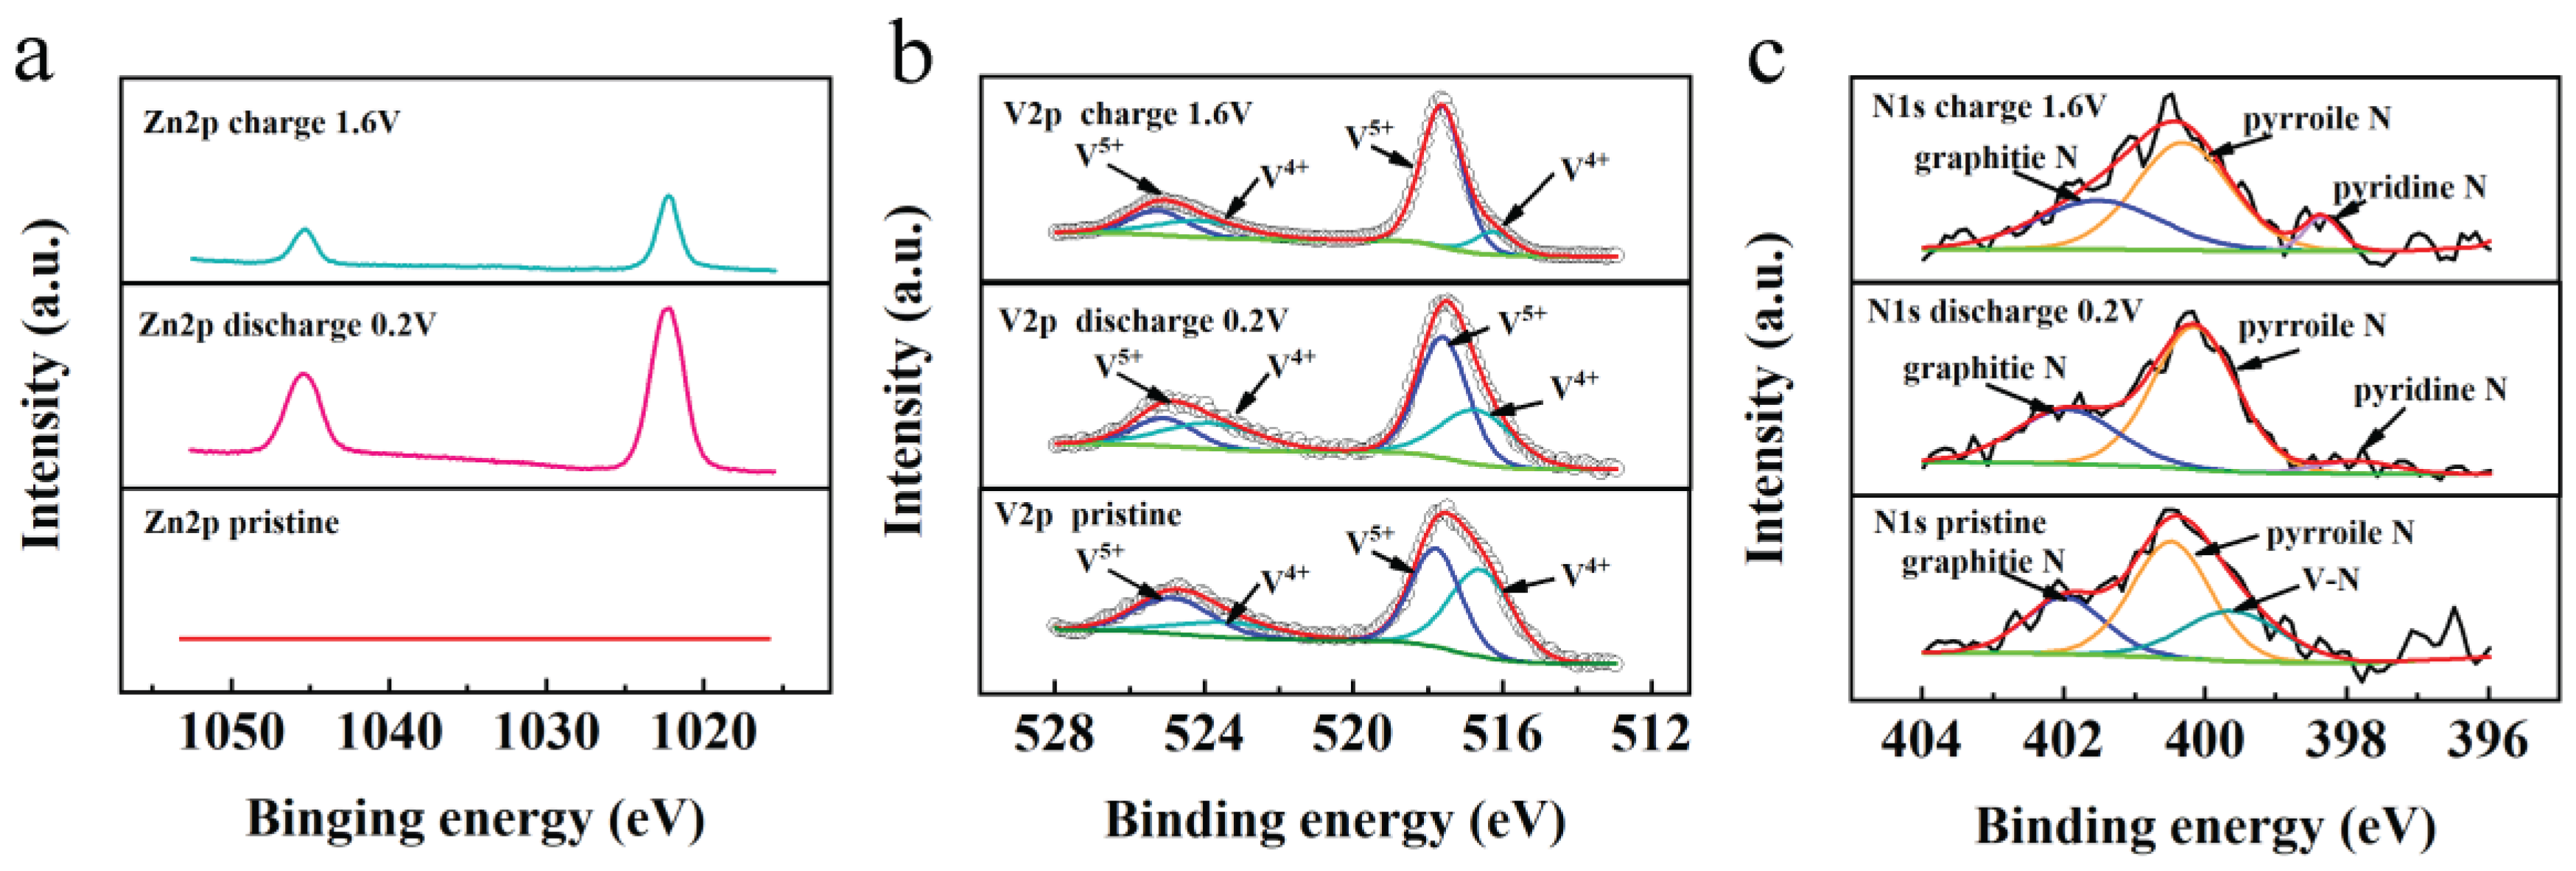
Figure 15.
Electrochemical performance of N-V2O3/C-1, N-V2O3/C-2, N-V2O3/C-3, N-V2O3/C-4 (a) cycling performance at 0.2 A g−1, (b) cycling performance at 5 A g−1, (c) rate performance at different current densities, (d) impedance.
Figure 15.
Electrochemical performance of N-V2O3/C-1, N-V2O3/C-2, N-V2O3/C-3, N-V2O3/C-4 (a) cycling performance at 0.2 A g−1, (b) cycling performance at 5 A g−1, (c) rate performance at different current densities, (d) impedance.
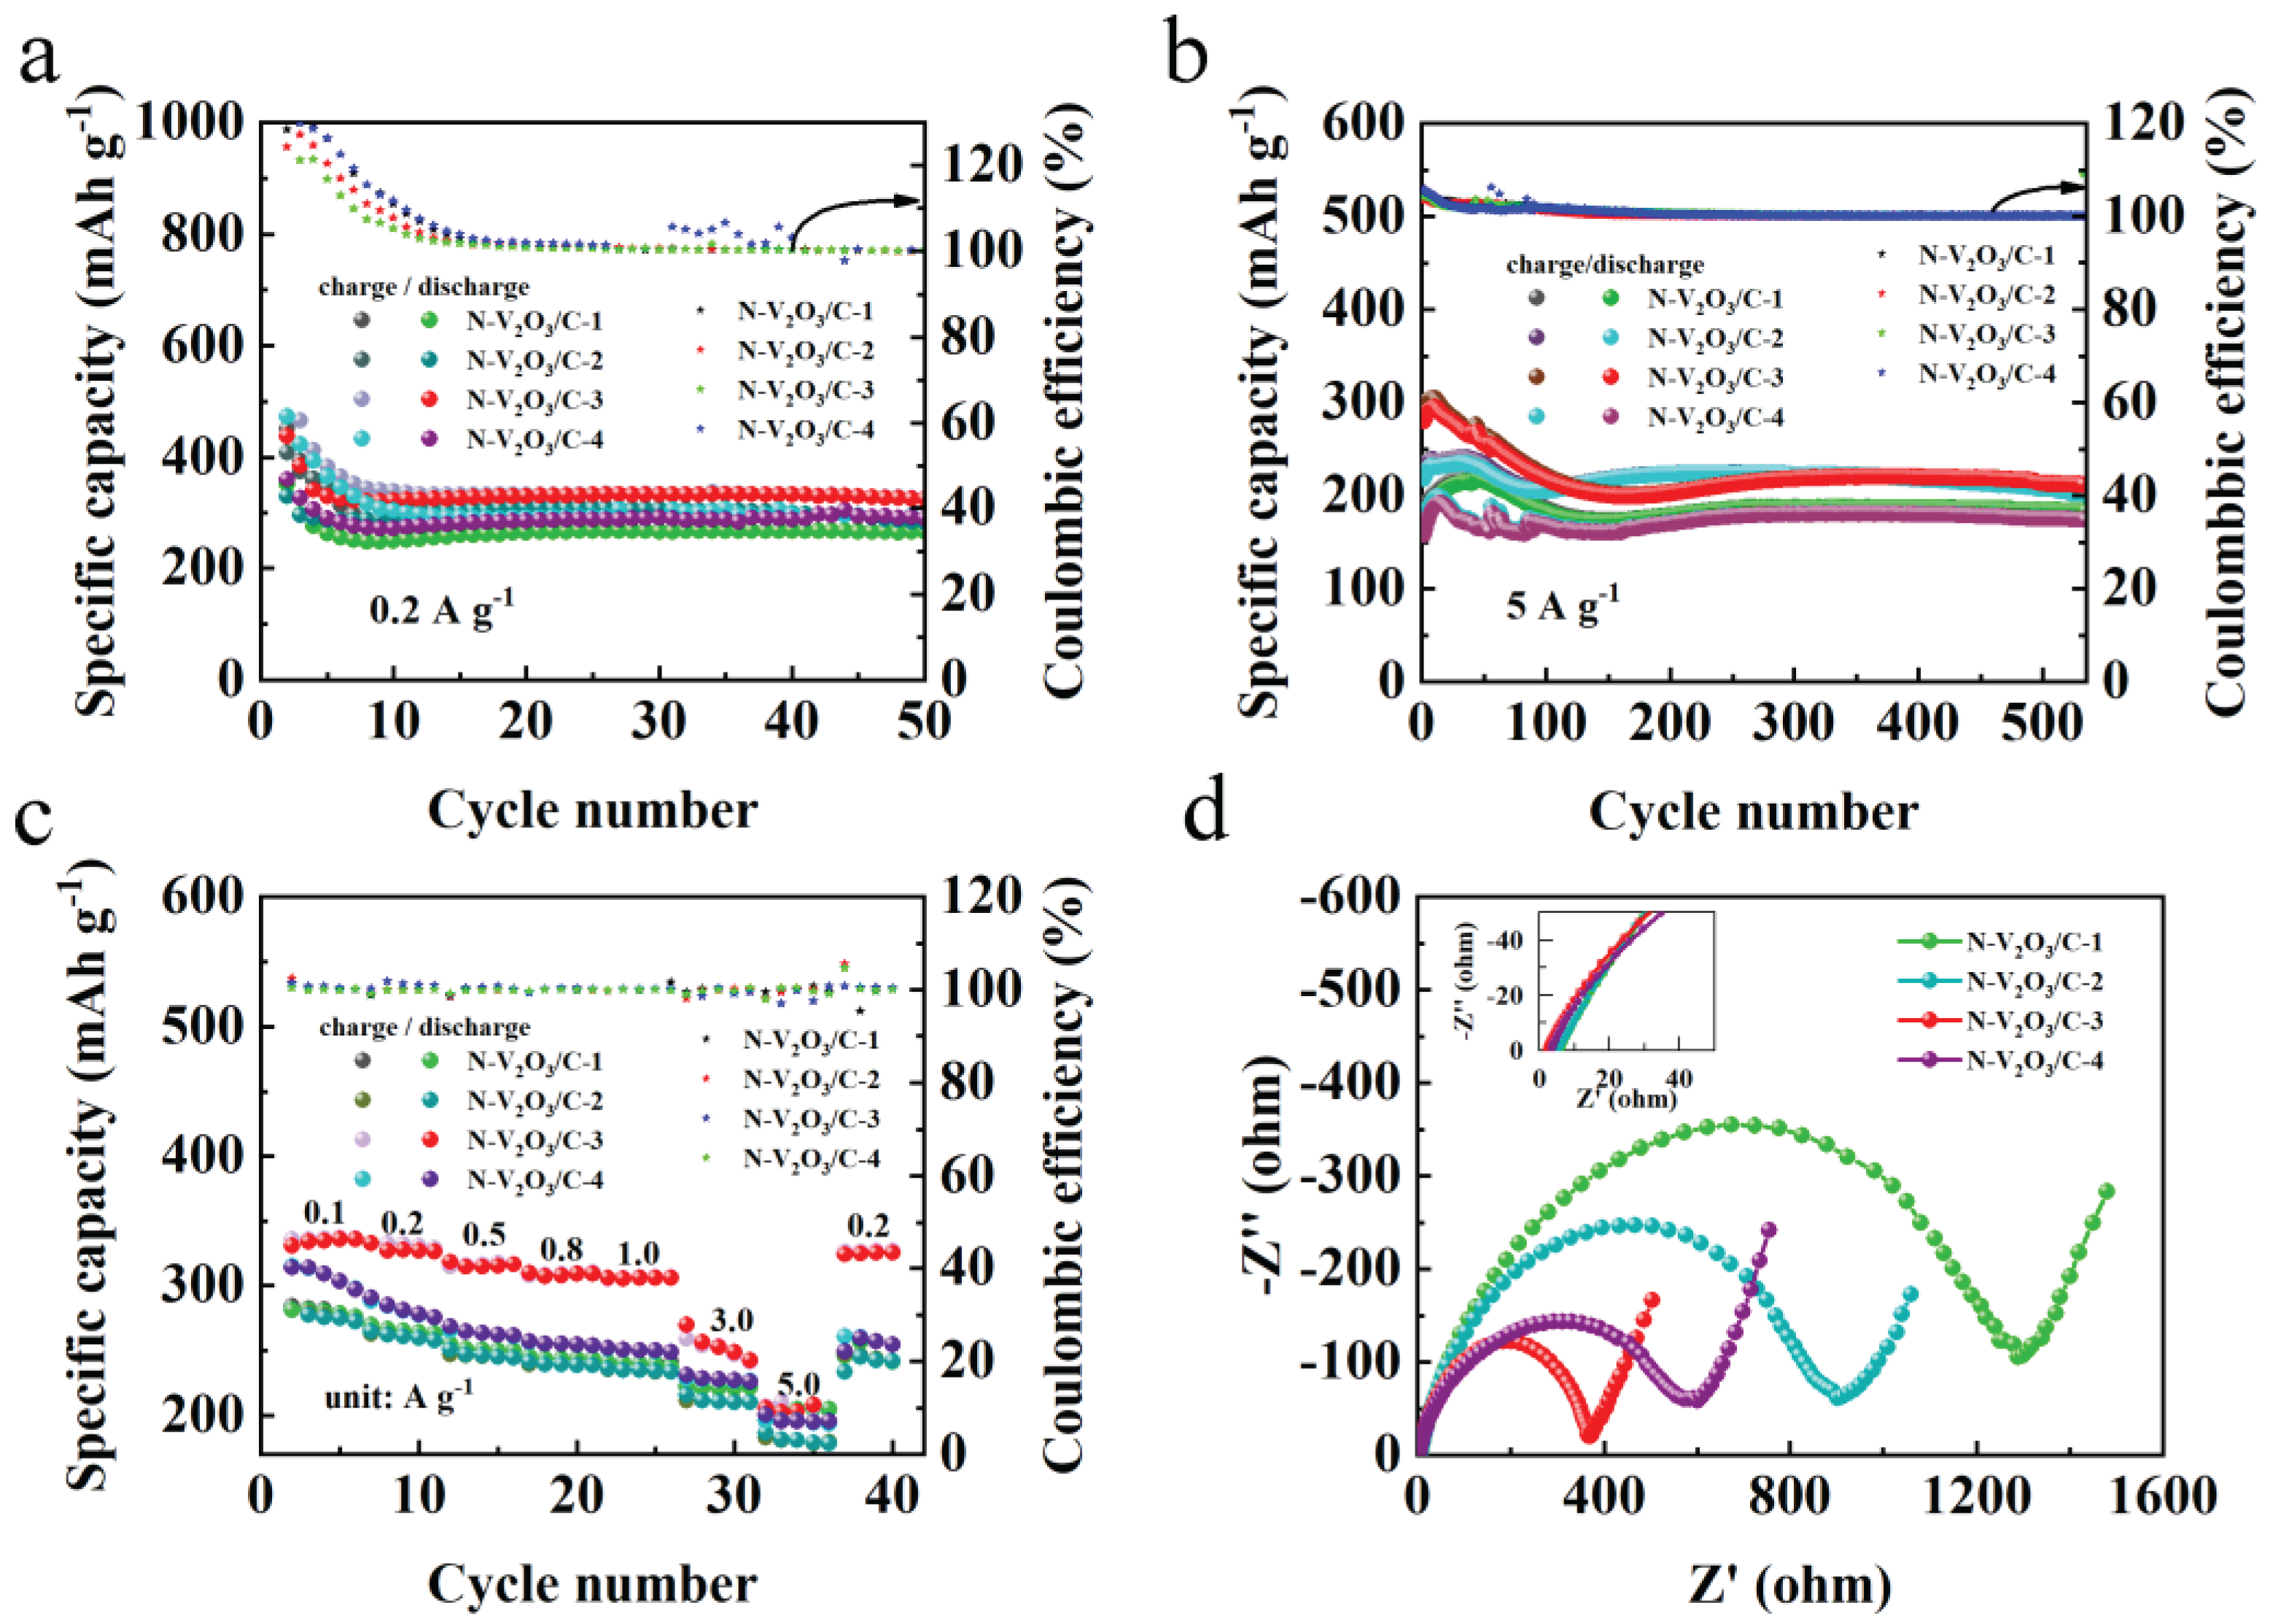
Figure 16.
Long cycle performance of N-V2O3/C-1, N-V2O3/C-2, N-V2O3/C-3, N-V2O3/C-4 at 10 A g−1.
Disclaimer/Publisher’s Note: The statements, opinions and data contained in all publications are solely those of the individual author(s) and contributor(s) and not of MDPI and/or the editor(s). MDPI and/or the editor(s) disclaim responsibility for any injury to people or property resulting from any ideas, methods, instructions or products referred to in the content. |
© 2024 by the authors. Licensee MDPI, Basel, Switzerland. This article is an open access article distributed under the terms and conditions of the Creative Commons Attribution (CC BY) license (http://creativecommons.org/licenses/by/4.0/).
Copyright: This open access article is published under a Creative Commons CC BY 4.0 license, which permit the free download, distribution, and reuse, provided that the author and preprint are cited in any reuse.


