
Submitted:
25 February 2024
Posted:
27 February 2024
You are already at the latest version
Abstract
From a structural point of view, understanding interfacial electrostatic features of ligand-receptor complexes is crucial for biophysics-based design of therapeutics with improved efficacy and safety. Here, with a high-throughput structural feature extraction approach, this article reports a set of electrostatic structural features from glucagon-like peptide-1 (GLP-1) and GLP-1 receptor (GLP-1R) complex structures determined using experimental tools. Leveraging a set of computational structural biophysical analyses, this article systematically characterized the electrostatic interactions within the GLP-1-GLP-1R complexes with two sets of criteria to identify interfacial salt bridges and hydrogen bonds. Overall, the results here reveal intricate details of electrostatic interactions critical for GLP-1 binding to its receptor GLP-1R, providing biophysical insights into the stabilization of the GLP-1-GLP-1R complex structure and the molecular basis of GLP-1/GLP-1R signaling. Furthermore, the electrostatic structural features extracted from GLP-1 and GLP-1R complex structures are useful in the development of a machine learning-based ligand-receptor binding affinity calculating model, i.e., a GLP-1-GLP-1R-specific general intermolecular binding affinity calculator (GIBAC), paving the way for accelerated discovery and structure-based design of drug candidates targeting the GLP-1/GLP-1R system with improved efficacy and safety.
Keywords:
GLP-1
; GLP-1R
; High-throughput feature extraction
; Electrostatic structural features
; general intermolecular binding affinity calculator (GIBAC)
1. Introduction
Direct binding and interaction between ligands and receptors plays a fundamental role in various biological processes, including signal transduction, membrane protein trafficking, cell communication, and drug pharmacology [1,2,3,4]. Understanding the intricate details of these interactions, particularly the structural features at the binding interface of ligand and receptor, is crucial for unraveling the underlying mechanisms and designing effective therapeutics [5,6,7]. Among the myriad of ligand-receptor systems, the glucagon-like peptide-1 (GLP-1) and its cognate receptor, GLP-1 receptor (GLP-1R), constitute a pivotal axis in metabolic regulation and insulin secretion [8,9,10]. GLP-1, an incretin hormone secreted by enteroendocrine intestinal L-cells, exerts its physiological effects by binding to GLP-1R, a G-protein-coupled receptor predominantly expressed in pancreatic β-cells, among other tissues [11,12,13]. Activation of GLP-1R initiates a signaling cascade leading to enhanced insulin release, inhibition of glucagon secretion, and regulation of satiety, making it an attractive target for the treatment of type 2 diabetes and obesity [14,15,16].
To date, a wide range of experimental structures have been determined for the GLP-1/GLP-1R complex, constituting the structural basis of GLP-1/GLP-1R interactions, particularly the structural electrostatic features at the binding interface [17,18,19]. Here, with a set of computational structural biophysical analyses for currently available experimental GLP-1/GLP-1R complex structures, this article systematically characterized the electrostatic interactions within the GLP-1-GLP-1R complexes with two sets of criteria to identify interfacial salt bridges and hydrogen bonds. By structurally elucidating the electrostatic landscape of GLP-1/GLP-1R interactions, this article aims to provide valuable insights into the molecular basis of ligand recognition and receptor activation, with structural and biophysical implications for rational design and development of therapeutics with improved efficacy and safety targeting the GLP-1/GLP-1R axis.
2. Motivation
Thanks to the continued development of experimental structural biology and the half-a-century old Protein Data Bank (PDB) [20,21], a comprehensive structural biophysical (CSB) analysis becomes possible [22,23,24] for specific ligand-receptor [25,26,27], antigen-antibody [28] or enzyme-substrate [29,30,31] complex structures deposited in PDB, expanding our understanding of the structural and biophysical basis of their interfacial structural stability, and facilitating the design of drug analogues with improved affinity to their interacting partners [6,32].
Semaglutide is a human GLP-1 analogue with 94% structural homology with native human GLP-1, with 3 important modifications: an amino acid substitution at position 8 that makes it less susceptible to degradation by dipeptidyl peptidase-4; lysine acylation of the peptide backbone, with a spacer and C-18 fatty di-acid chain at position 26 that provides strong, specific binding to albumin; and another amino acid substitution at position 34, which prevents C=18 fatty di-acid binding at the wrong site [33]. Interestingly, a semaglutide analogue was for the first time reported with a simple Val27-Arg28 exchange in its peptide backbone in 2021 [7]. Semaglutide is a glucagon-like peptide 1 analog used for the treatment of patients with type 2 diabetes mellitus. With 94% sequence similarity to human GLP-1, semaglutide is a glucagon-like peptide-1 receptor (GLP-1R) agonist, which binds directly to GLP-1R, causing various beneficial downstream effects that reduce blood glucose. Specifically, the amino acid sequence of GLP-1 is listed in italics in fasta format as below,
>SemaglutideNative
HAEGTFTSDVSSYLEGQAAKEFIAWLVRGRG
The amino acid sequence of the semaglutide analogue with a simple Val27-Arg28 exchange in its peptide backbone is listed in italics in fasta format as below,
>SemaglutideMutant
HAEGTFTSDVSSYLEGQAAKEFIAWLRVGRG
Of further interest, a new pair of structure-stabilizing interfacial salt bridges between Glu104 of chain A (GLP-1R) and Arg27 of chain B (semaglutide) are entirely due to the Val27-Arg28 exchange in the semaglutide peptide backbone, according to the binding affinity of semaglutide and GLP-1R calculated using Prodigy [34,35]. Nonetheless, the design of the semaglutide analogue with a simple Val27-Arg28 exchange was on a manual basis of close naked-eye inspection of the GLP-1-GLP-1R binding interface 4ZGM [19,36], and hand-picked from a set of analogue candidates of semaglutide to ensure improved ligand-receptor binding affinity [34,35] with minimum modification (i.e., a simple Val27-Arg28 exchange) to the backbone of semaglutide. Here, this article employs a high-throughput approach for extraction of electrostatic structural features from GLP-1-GLP-1R complexes towards the construction of a GLP-1-GLP-1R-based mini general intermolecular binding affinity calculator (GIBAC) with adequate accuracy and efficiency [2]. Overall, the motivation here stems from the pressing need within the drug discovery and design community for efficient methods to assess intermolecular binding affinities, particularly in the context of peptide-receptor interactions. By focusing on GLP-1-GLP-1R complexes, pivotal targets in diabetes and obesity [37,38], this article aims to showcase the utility of our miniaturized GIBAC approach in rapidly elucidating key electrostatic interactions critical for ligand-receptor binding for the purpose of discovery and design of therapeutics for diabetes and obesity with improved efficacy and safety.
3. Materials and Methods
As of March 11, 2024, a total of 44 experimental structures have been deposited in Protein Data Bank (PDB) [20] as listed in Table 1, according to a text query: QUERY: Polymer Entity Description = "Glucagon-like peptide 1 receptor" of the Protein Data Bank [20]. Among them, only two experimental structures represent the GLP-1-GLP-1R complex, with PDB IDs: 3IOL [17,18] and 4ZGM [19,36], respectively, providing an accurate structural basis of the GLP-1-GLP-1R interaction specificity for subsequent comprehensive structural biophysical (CSB) analysis of the two structural models (two yellow rows in Table 1).
Of the two experimental structures represent the GLP-1-GLP-1R complex, with PDB IDs: 3IOL [17,18] and 4ZGM [19,36], two sets of amino acid sequences are listed in italics in fasta format as below,
>3IOL_1|Chain A|Glucagon-like peptide 1 receptor|Homo sapiens (9606)
GSHMRPQGATVSLWETVQKWREYRRQCQRSLTEDPPPATDLFCNRTFDEYACWPDGEPGSFVNVSCPWYLPWASSVPQGHVYRFCTAEGLWLQKDNSSLPWRDLSECEESKRGERSSPEEQLLFLY
>3IOL_2|Chain B|Glucagon|Homo sapiens (9606)
HAEGTFTSDVSSYLEGQAAKEFIAWLVKGRG
>4ZGM_1|Chain A|Glucagon-like peptide 1 receptor|Homo sapiens (9606)
RPQGATVSLWETVQKWREYRRQCQRSLTEDPPPATDLFCNRTFDEYACWPDGEPGSFVNVSCPWYLPWASSVPQGHVYRFCTAEGLWLQKDNSSLPWRDLSECEESKRGERSSPEEQLLFLY
>4ZGM_2|Chain B|Semaglutide peptide backbone; 8Aib,34R-GLP-1(7-37)-OH|Homo sapiens (9606)
HAEGTFTSDVSSYLEGQAAKEFIAWLVRGRG
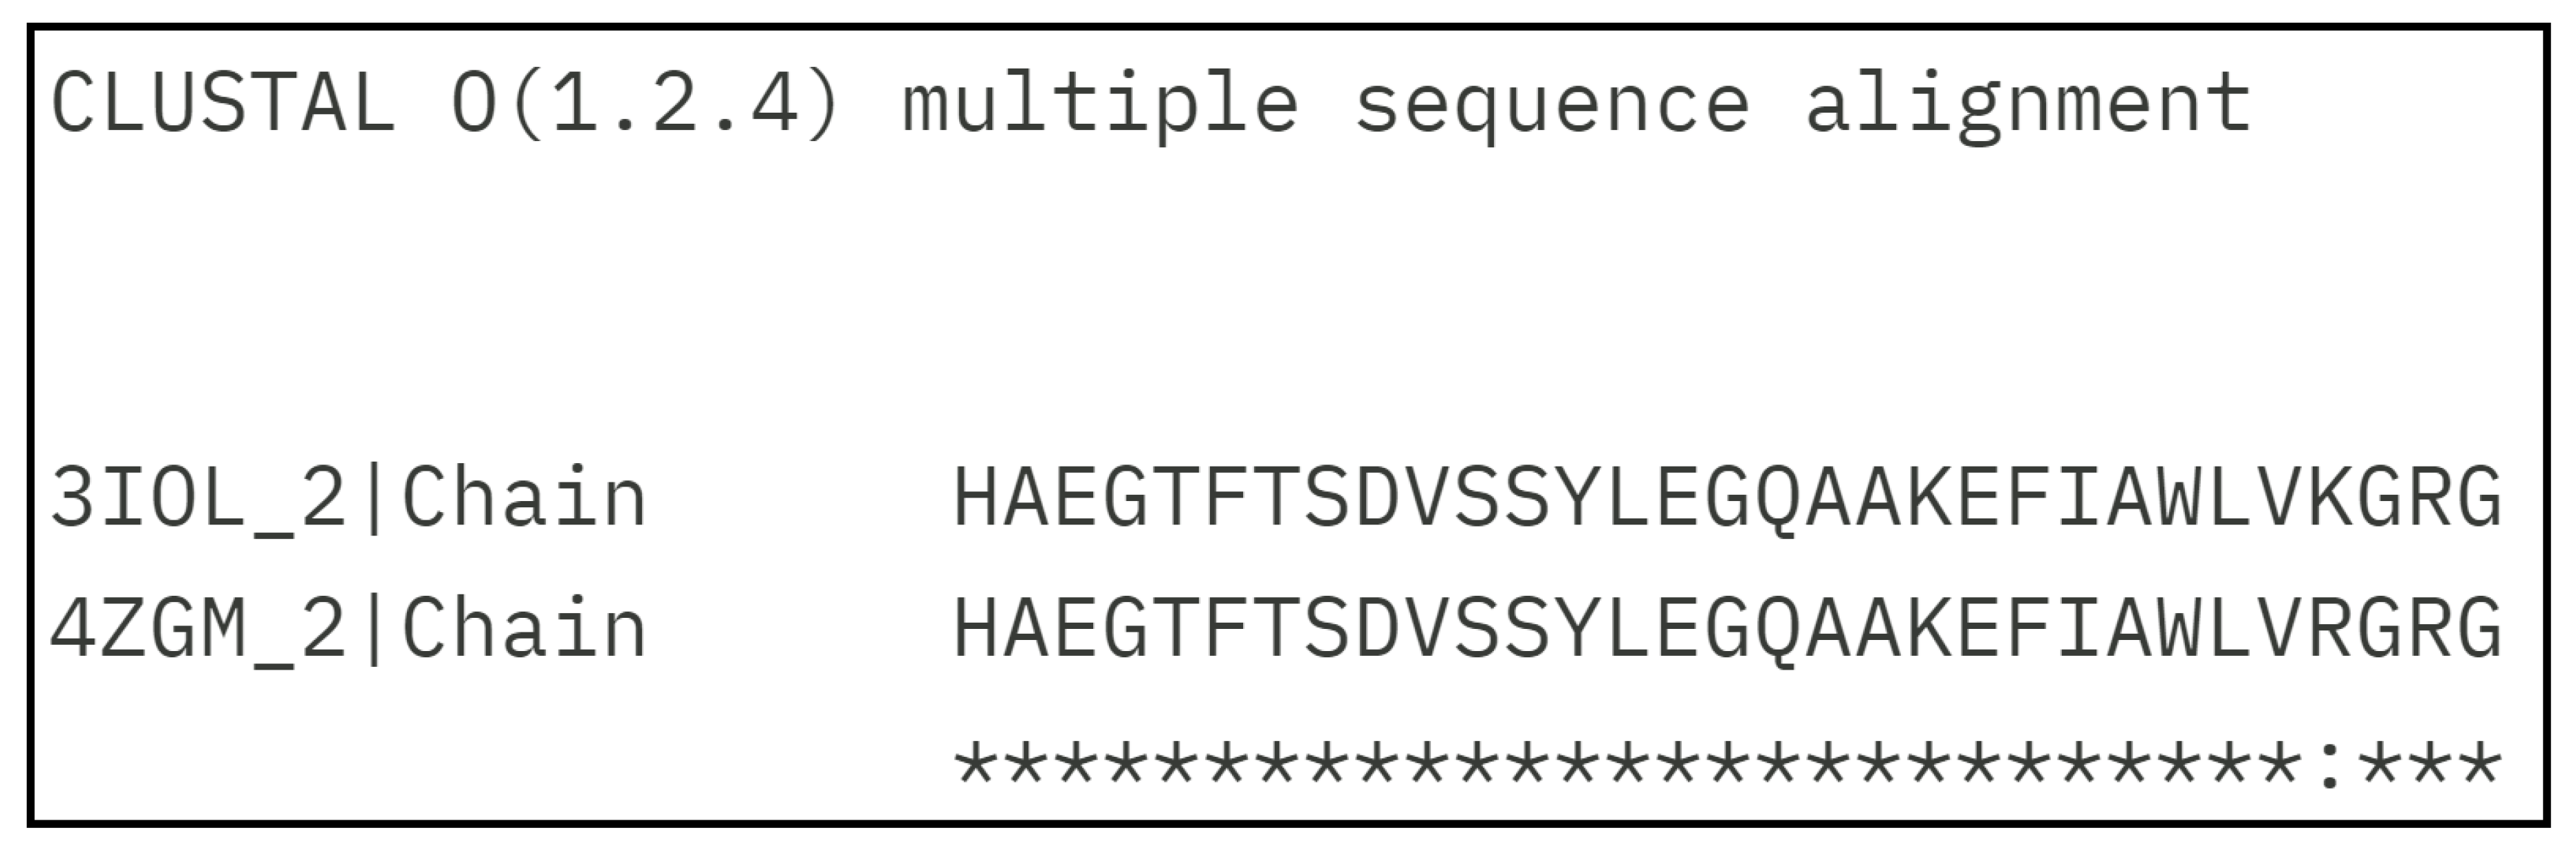
With the amino acid sequence alignment as shown in Figure 1, it is quite clear that the sequences GLP-1 for 3IOL [17,18] and 4ZGM [19,36] is at position 33 or 34, i.e., an exchange of lysine and arginine, while the GLP-1R sequences for 3IOL [17,18] and 4ZGM [19,36] are in complete alignment, except for the presence of one N-terminal four residue fragment (GSHM) in 3IOL [17,18] and the absence of it (GSHM) at N-terminal in 4ZGM [19,36].
Figure 1.
GLP-1 amino acid sequence alignment by Clustal Omega [39] of two experimental structures represent the GLP-1-GLP-1R complex, with PDB IDs: 3IOL [17,18] and 4ZGM [19,36].
After the atomic coordinates file for PDB IDs: 3IOL [17,18] and 4ZGM [19,36] were downloaded from the PDB [20] website, Chimera [40] was employed to manually add hydrogen atoms to the structural model of the two structural models representing the GLP-1-GLP-1R complex structures, with file names 3IOH.pdb and 4ZGH.pdb, respectively. Afterwards, the two hydrogen-added structural models were subject to a set of comprehensive structural biophysical (CSB) analysis as described in [22] to identify key residue-specific interactions at the GLP-1-GLP-1R binding interface and uncover the interstructural biophysics underlying the GLP-1-GLP-1R complex structure.
Specifically, the CSB analysis here [22] consists of the structural identification of salt bridges and side chain hydrogen bonds at the binding interface of GLP-1 and GLP-1R. Given the fact that native proteins are in dynamic equilibrium with their less-structured, partially folded and/or unfolded states [41], this article uses two sets of screening criteria for the structural identification of potential hotspots at the GLP-1-GLP-1R binding interface in the two structural models i.e., PDB IDs: 3IOL [17,18] and 4ZGM [19,36].
First, the same set of criteria (referred to as the old criteria below) as in [22] was used, i.e., the interfacial salt bridge analysis was conducted with an in-house python script only for titrateable residues (Asp, Glu, Lys, Arg and His), 4.0 Å was used as the cutoff distance for the two oppositely charged groups [22,42]. The hydrogen bond analysis was also conducted for only side chain nuclei with an in-house python script, and employed two geometric criteria: (a) a cutoff value of the angle formed by acceptor (A), donor (D) and hydrogen (H) () of 30° (b) a cutoff value of donor-acceptor distance at 3.0 Å. That is, a hydrogen bond is only considered to be formed if is not larger than 30° and the donor-acceptor distance is not larger than 3.0 Å [22,42].
Afterwards, a new set of criteria (referred to as the new criteria below) was used to account for the GLP-1-GLP-1R complex structures, i.e., the interfacial salt bridge analysis was conducted with an in-house python script only for titrateable residues (Asp, Glu, Lys, Arg and His), 6.0 Å was used as the cutoff distance for the two oppositely charged groups [22,42]. The hydrogen bond analysis was also conducted for only side chain nuclei with an in-house python script, and employed two geometric criteria: (a) a cutoff value of the angle formed by acceptor (A), donor (D) and hydrogen (H) () of 50°; (b) a cutoff value of donor-acceptor distance at 5.0 Å. That is, a hydrogen bond is only considered to be formed if is not larger than 50° and the donor-acceptor distance is not larger than 5.0 Å [22,42].
Here, the in-house python scripts essentially are the same as those used in [43], except for the differences in three key parameters related to the screening criteria, i.e., the salt bridge distance cutoff in Å, cutoff angle in ° for hydrogen bonding network screening, and the cutoff distance (in Å) of donor-acceptor for hydrogen bonding network screening.
4. Results
4.1. Residue-specific electrostatic interactions at the GLP-1-GLP-1R binding interface: a structural screening with the old criteria
For the two experimental structures represent the GLP-1-GLP-1R complex, with PDB IDs: 3IOL [17,18] and 4ZGM [19,36], a set of residue-specific electrostatic interactions at the GLP-1-GLP-1R binding interface were identified with a structural screening with the old criteria, including salt bridges at the GLP-1-GLP-1R binding interface for both 3IOL [17,18] and 4ZGM [19,36] as included in Table 2 and side chain hydrogen bonds at the GLP-1-GLP-1R binding interface for both 3IOL [17,18] and 4ZGM [19,36] as included in Table 3.
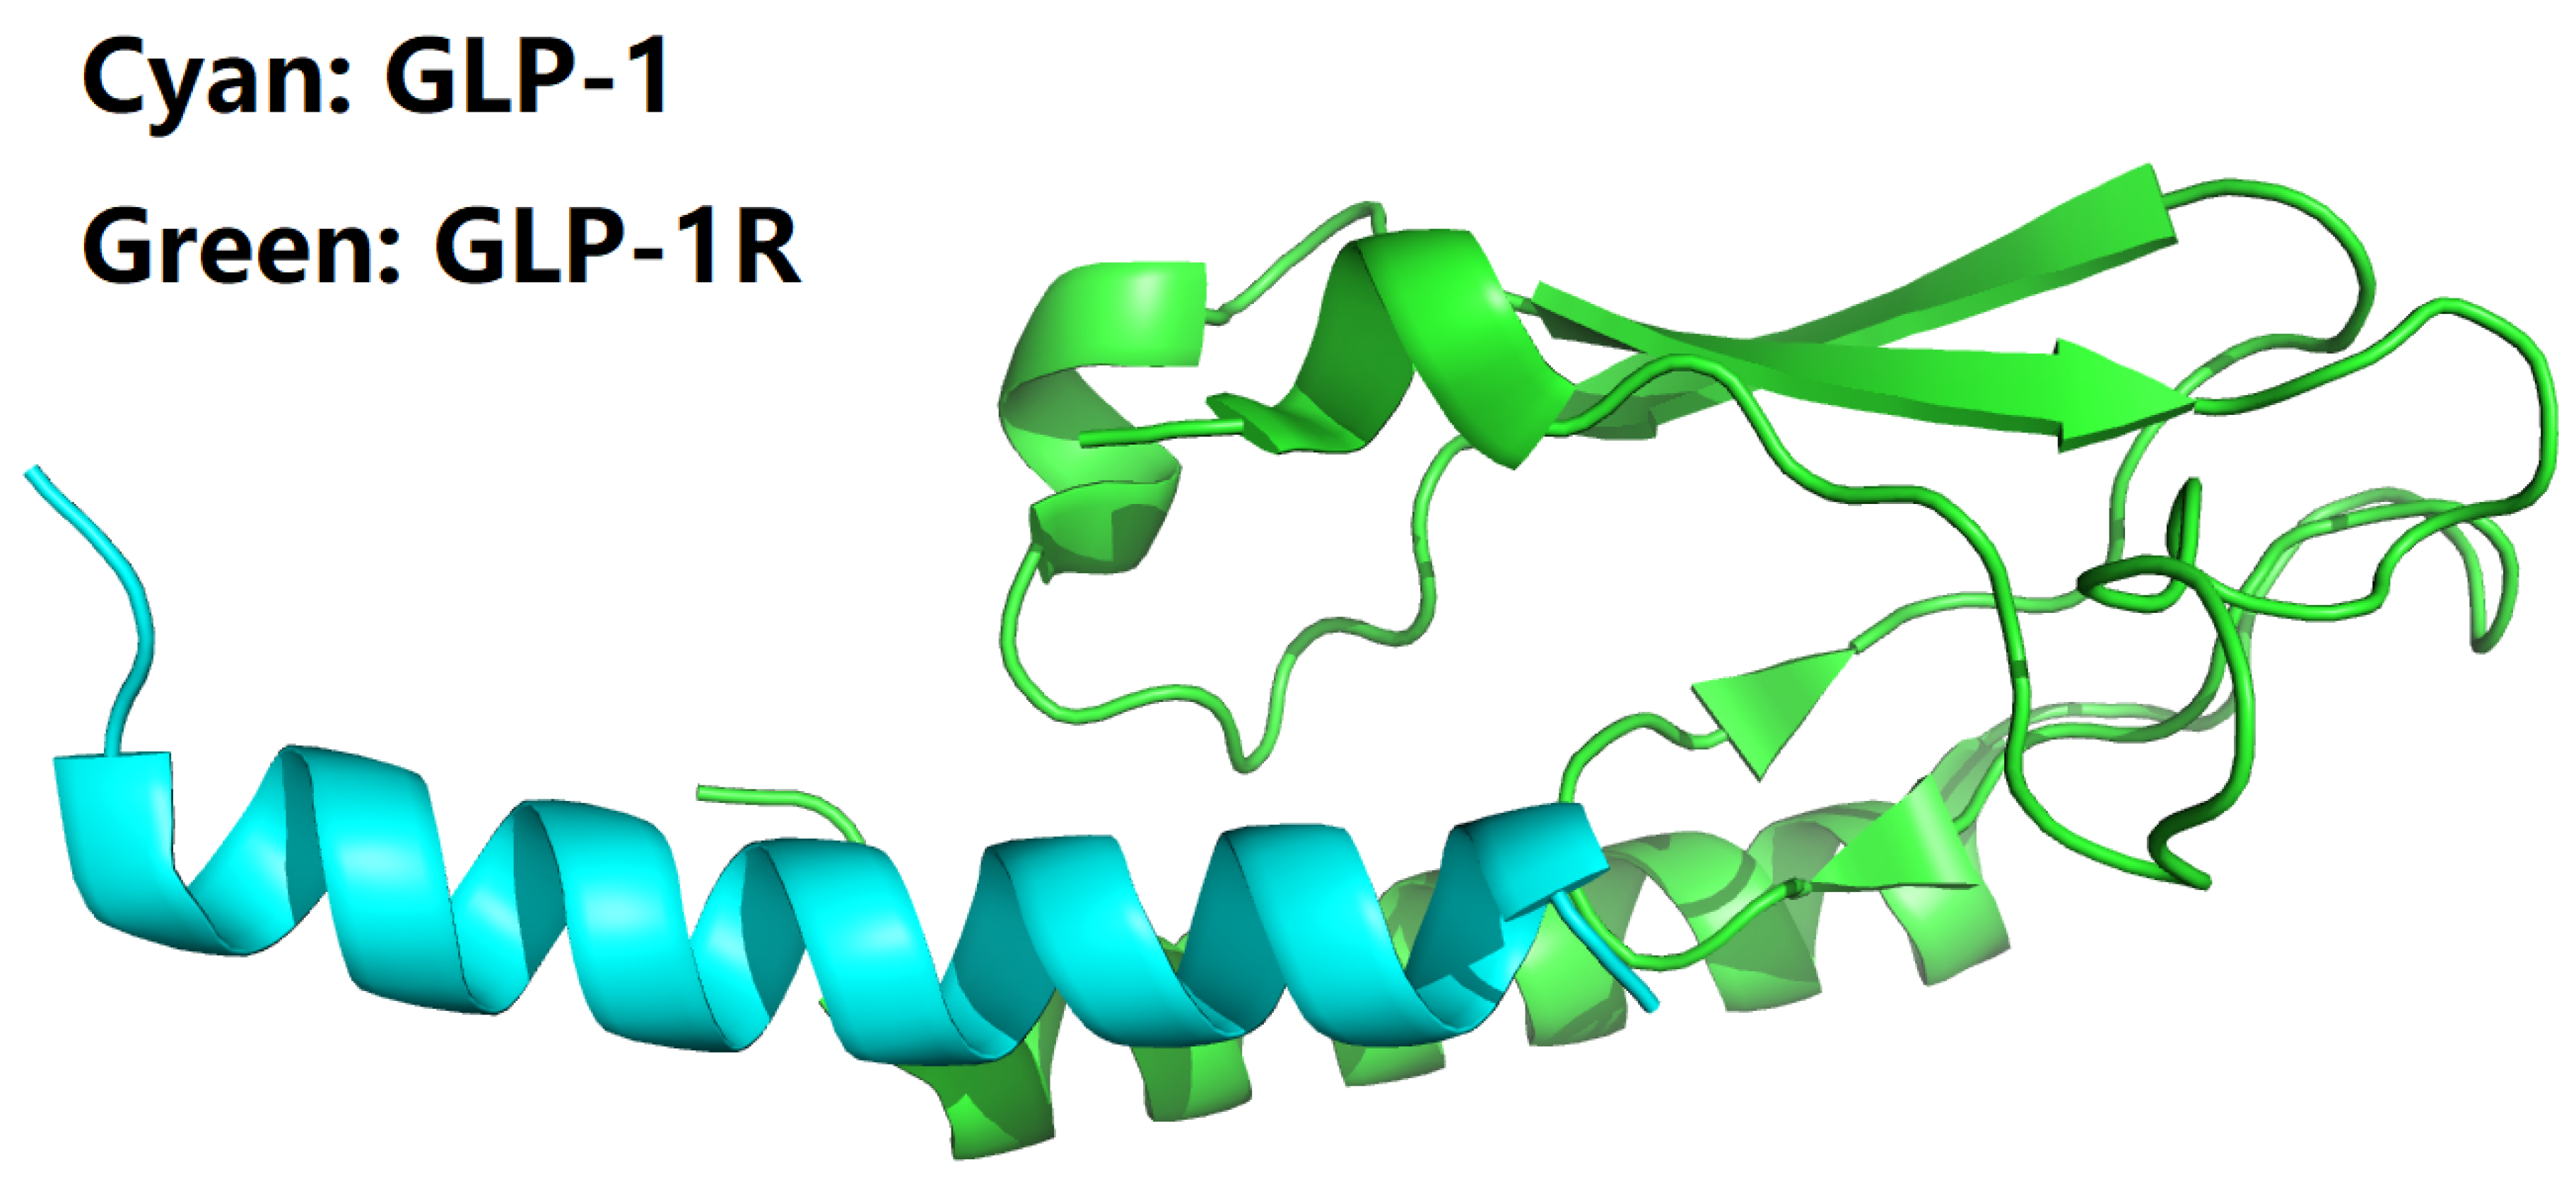
Figure 2.
Structural model of the B27Arg-B28Val mutant of semaglutide peptide backbone (cyan cartoon) in complex with the GLP-1 receptor extracellular domain (green cartoon). This figure is prepared by PyMol [44] with PDB ID 3IOL [17,18].
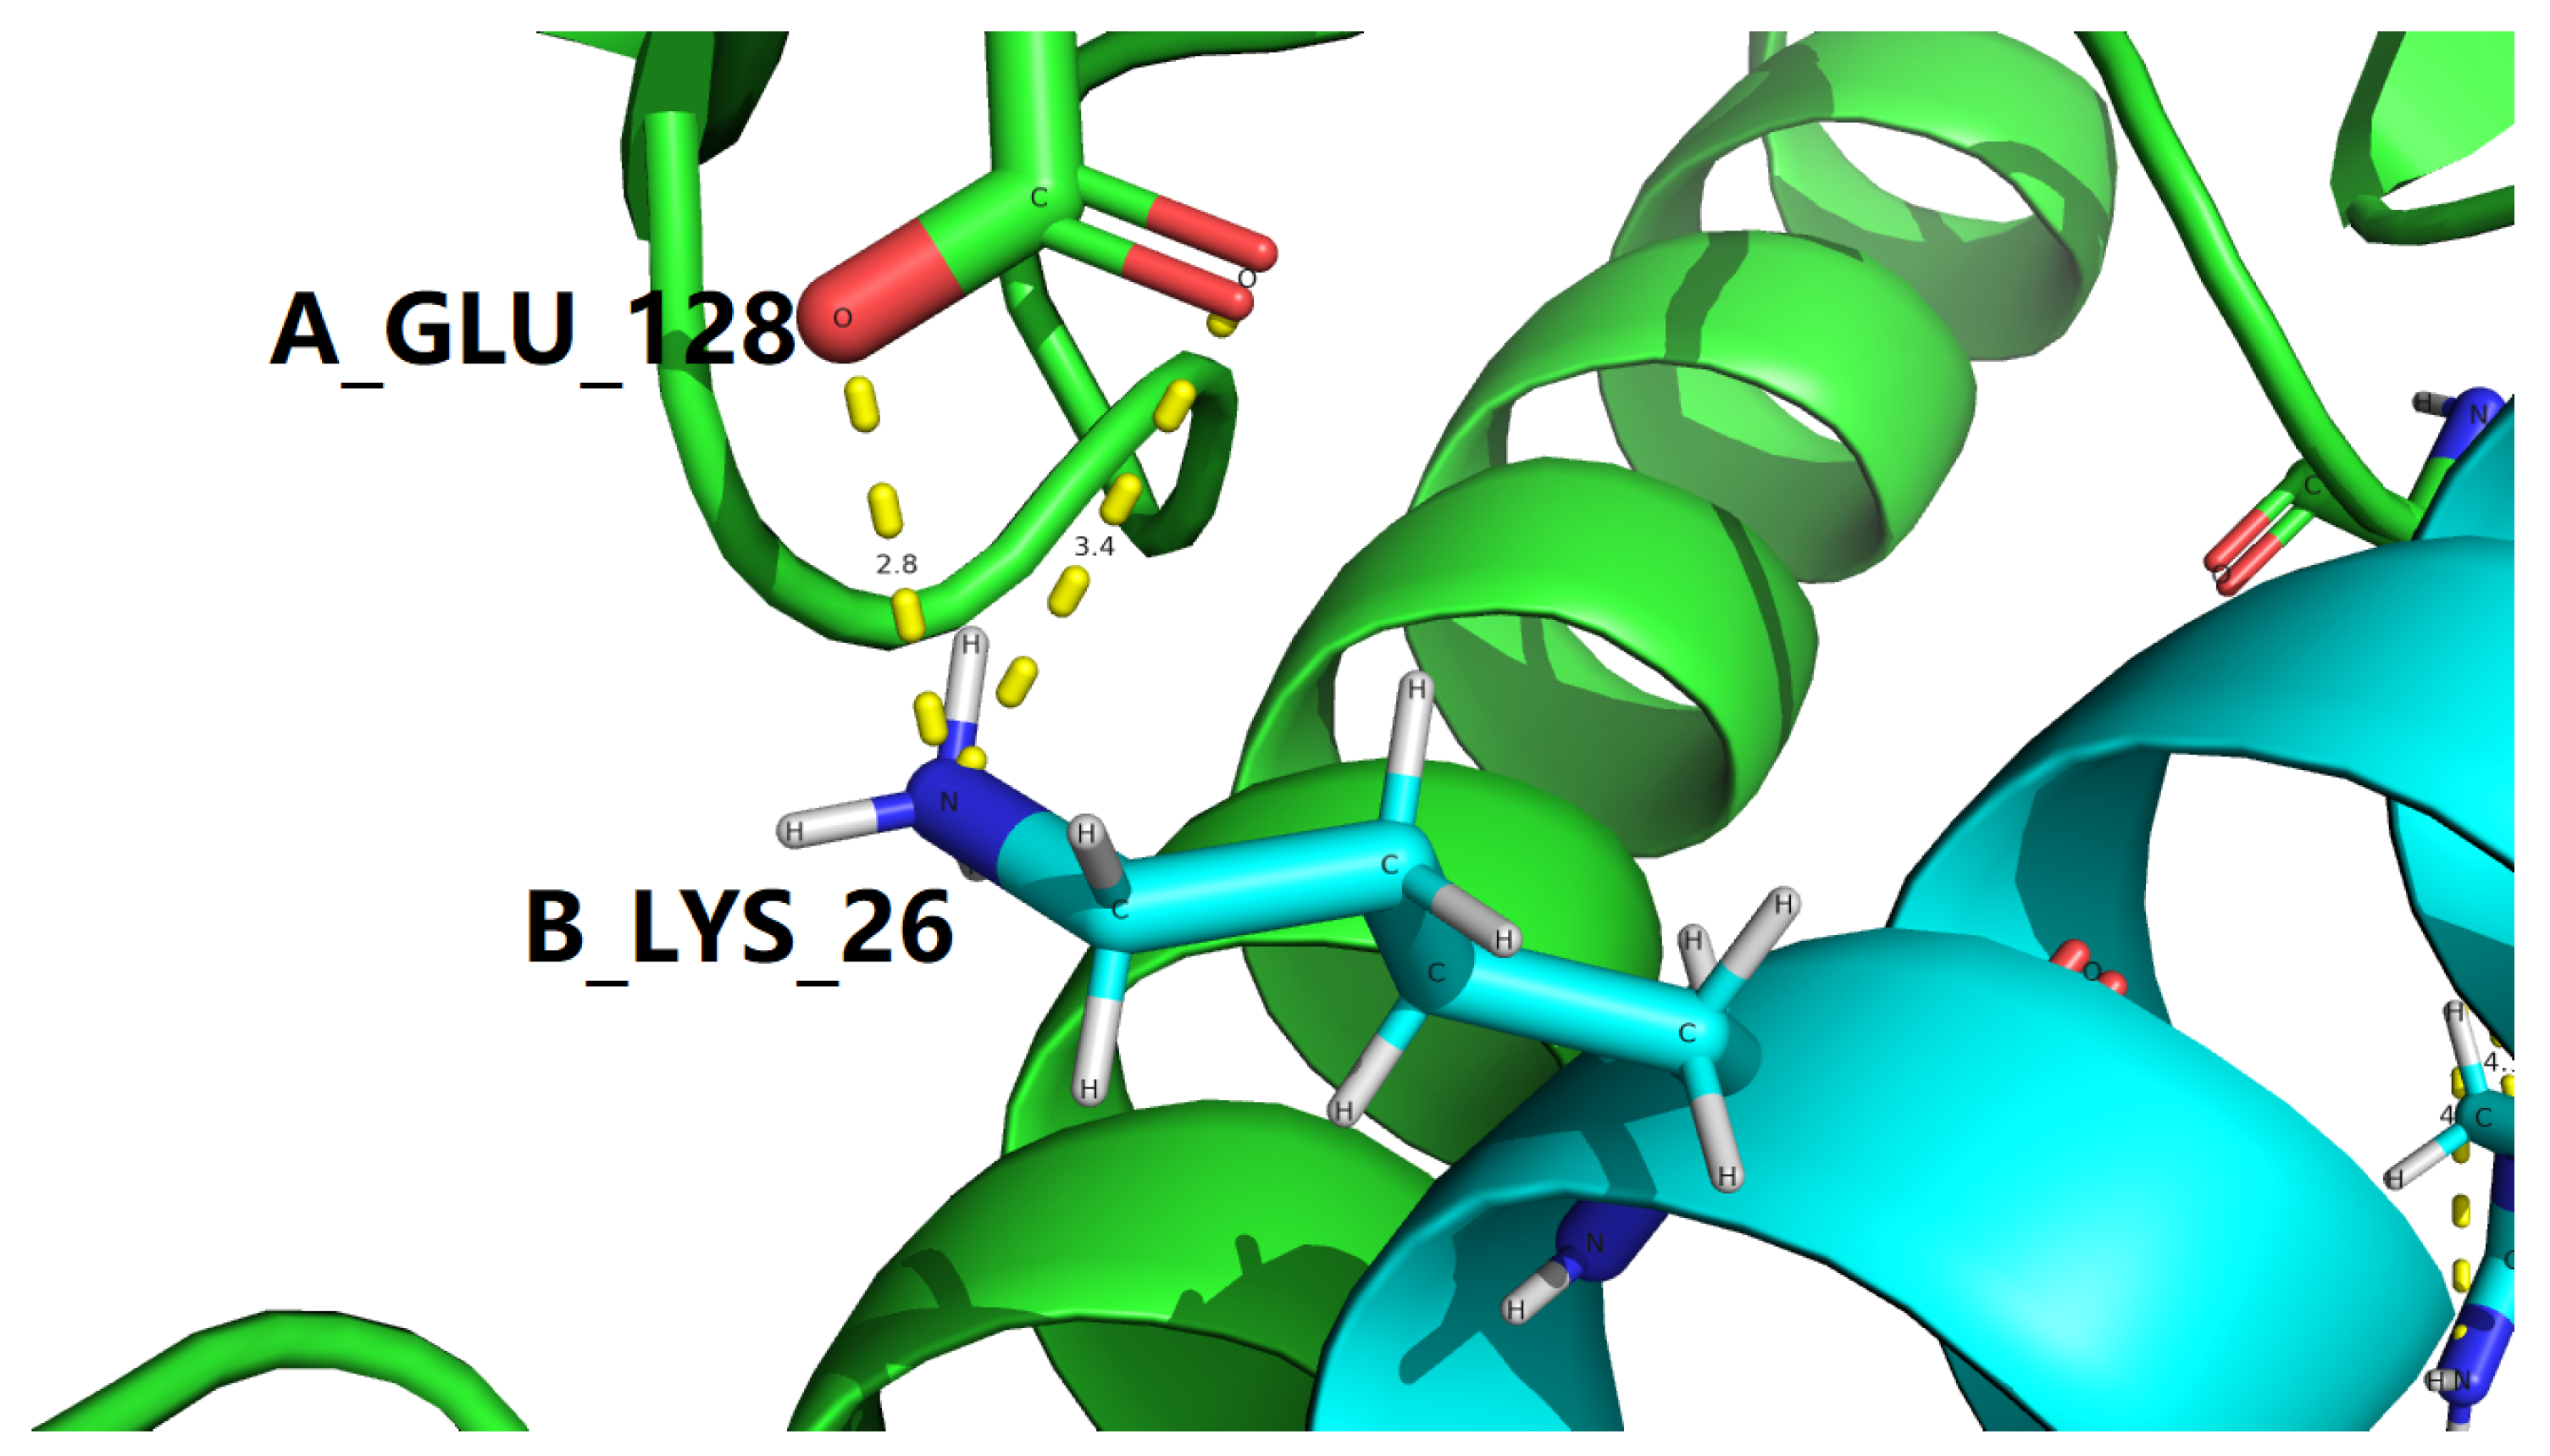
To make it as clear and concise as possible, all interfacial salt bridges are tabulated in Table 4 for two experimental structures represent the GLP-1-GLP-1R complex, with PDB IDs: 3IOL [17,18] and 4ZGM [19,36]. Coincidentally, the two sets of interfacial salt bridges which contribute towards the stabilization of the complex structure of GLP-1 and GLP-1R are identical for 3IOL [17,18] and 4ZGM [19,36], i.e., two interfacial salt bridges (3.212 and 2.924 Å) between Lys26 of GLP-1 and Glu128 of GLP-1R for 3IOL [17,18], as shown by yellow dotted lines in Figures 3 and 4, and two interfacial salt bridges (3.409 and 2.771 Å) between Lys26 of semaglutide and Glu128 of GLP-1R for 4ZGM [19,36], as shown by yellow dotted lines in Figures 5 and 6.
Figure 3.
One interfacial salt bridge (Table 4) between semaglutide peptide backbone (cyan cartoon) in complex with the GLP-1 receptor extracellular domain (green cartoon). This figure is prepared by PyMol [44] with PDB ID 3IOL [17,18]. In this figure, the color scheme is the same as in Figure 2.
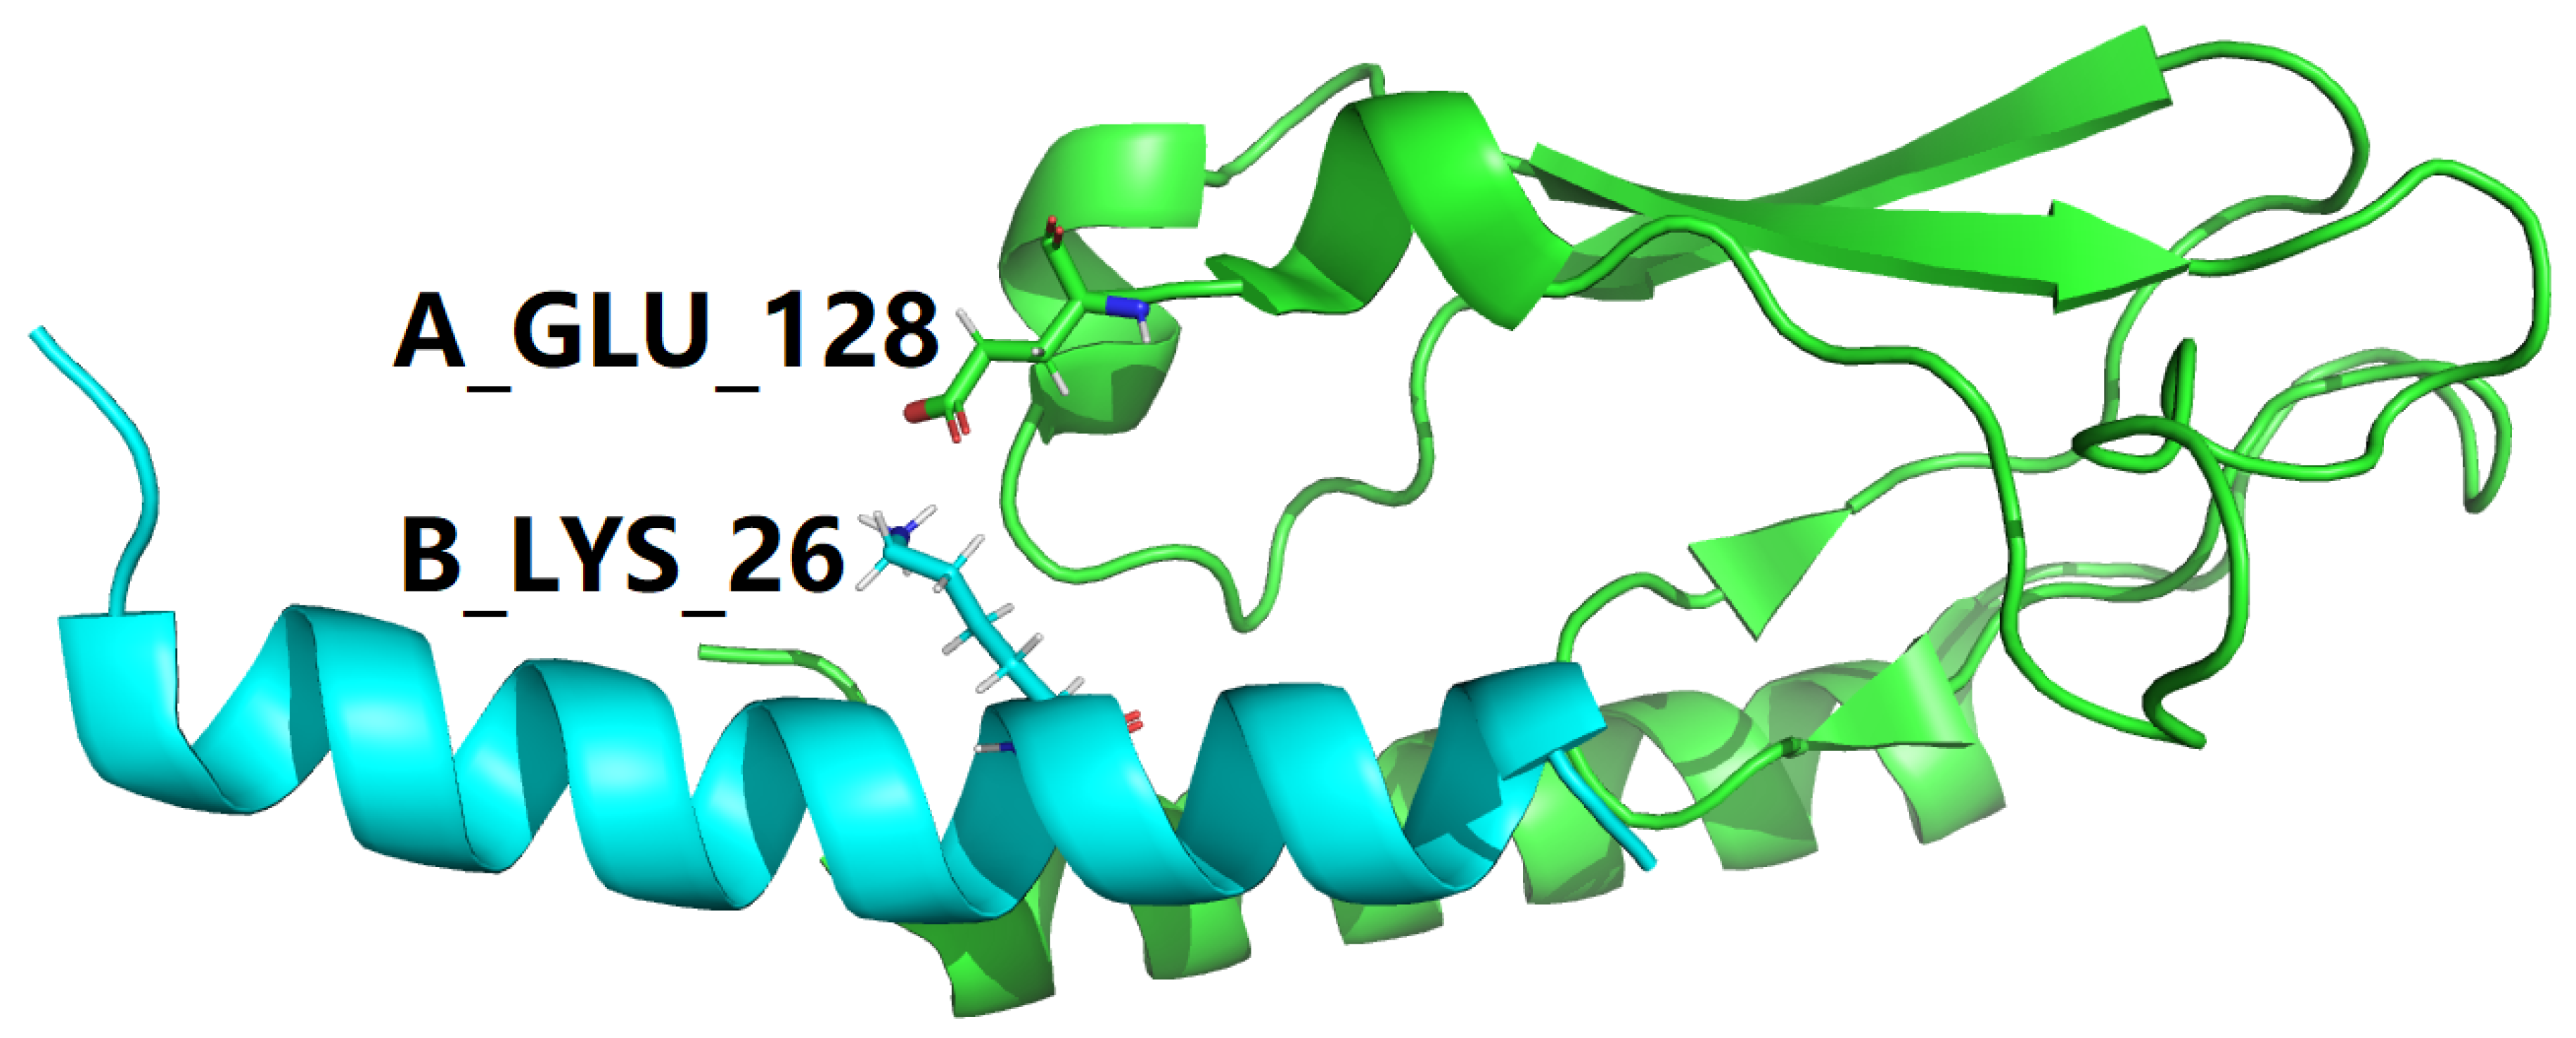
Figure 4.
One interfacial salt bridge (yellow dotted lines, Table 4) between semaglutide peptide backbone (cyan cartoon) in complex with the GLP-1 receptor extracellular domain (green cartoon). This figure is prepared by PyMol [44] with PDB ID 3IOL [17,18]. In this figure, the color scheme is the same as in Figure 2.
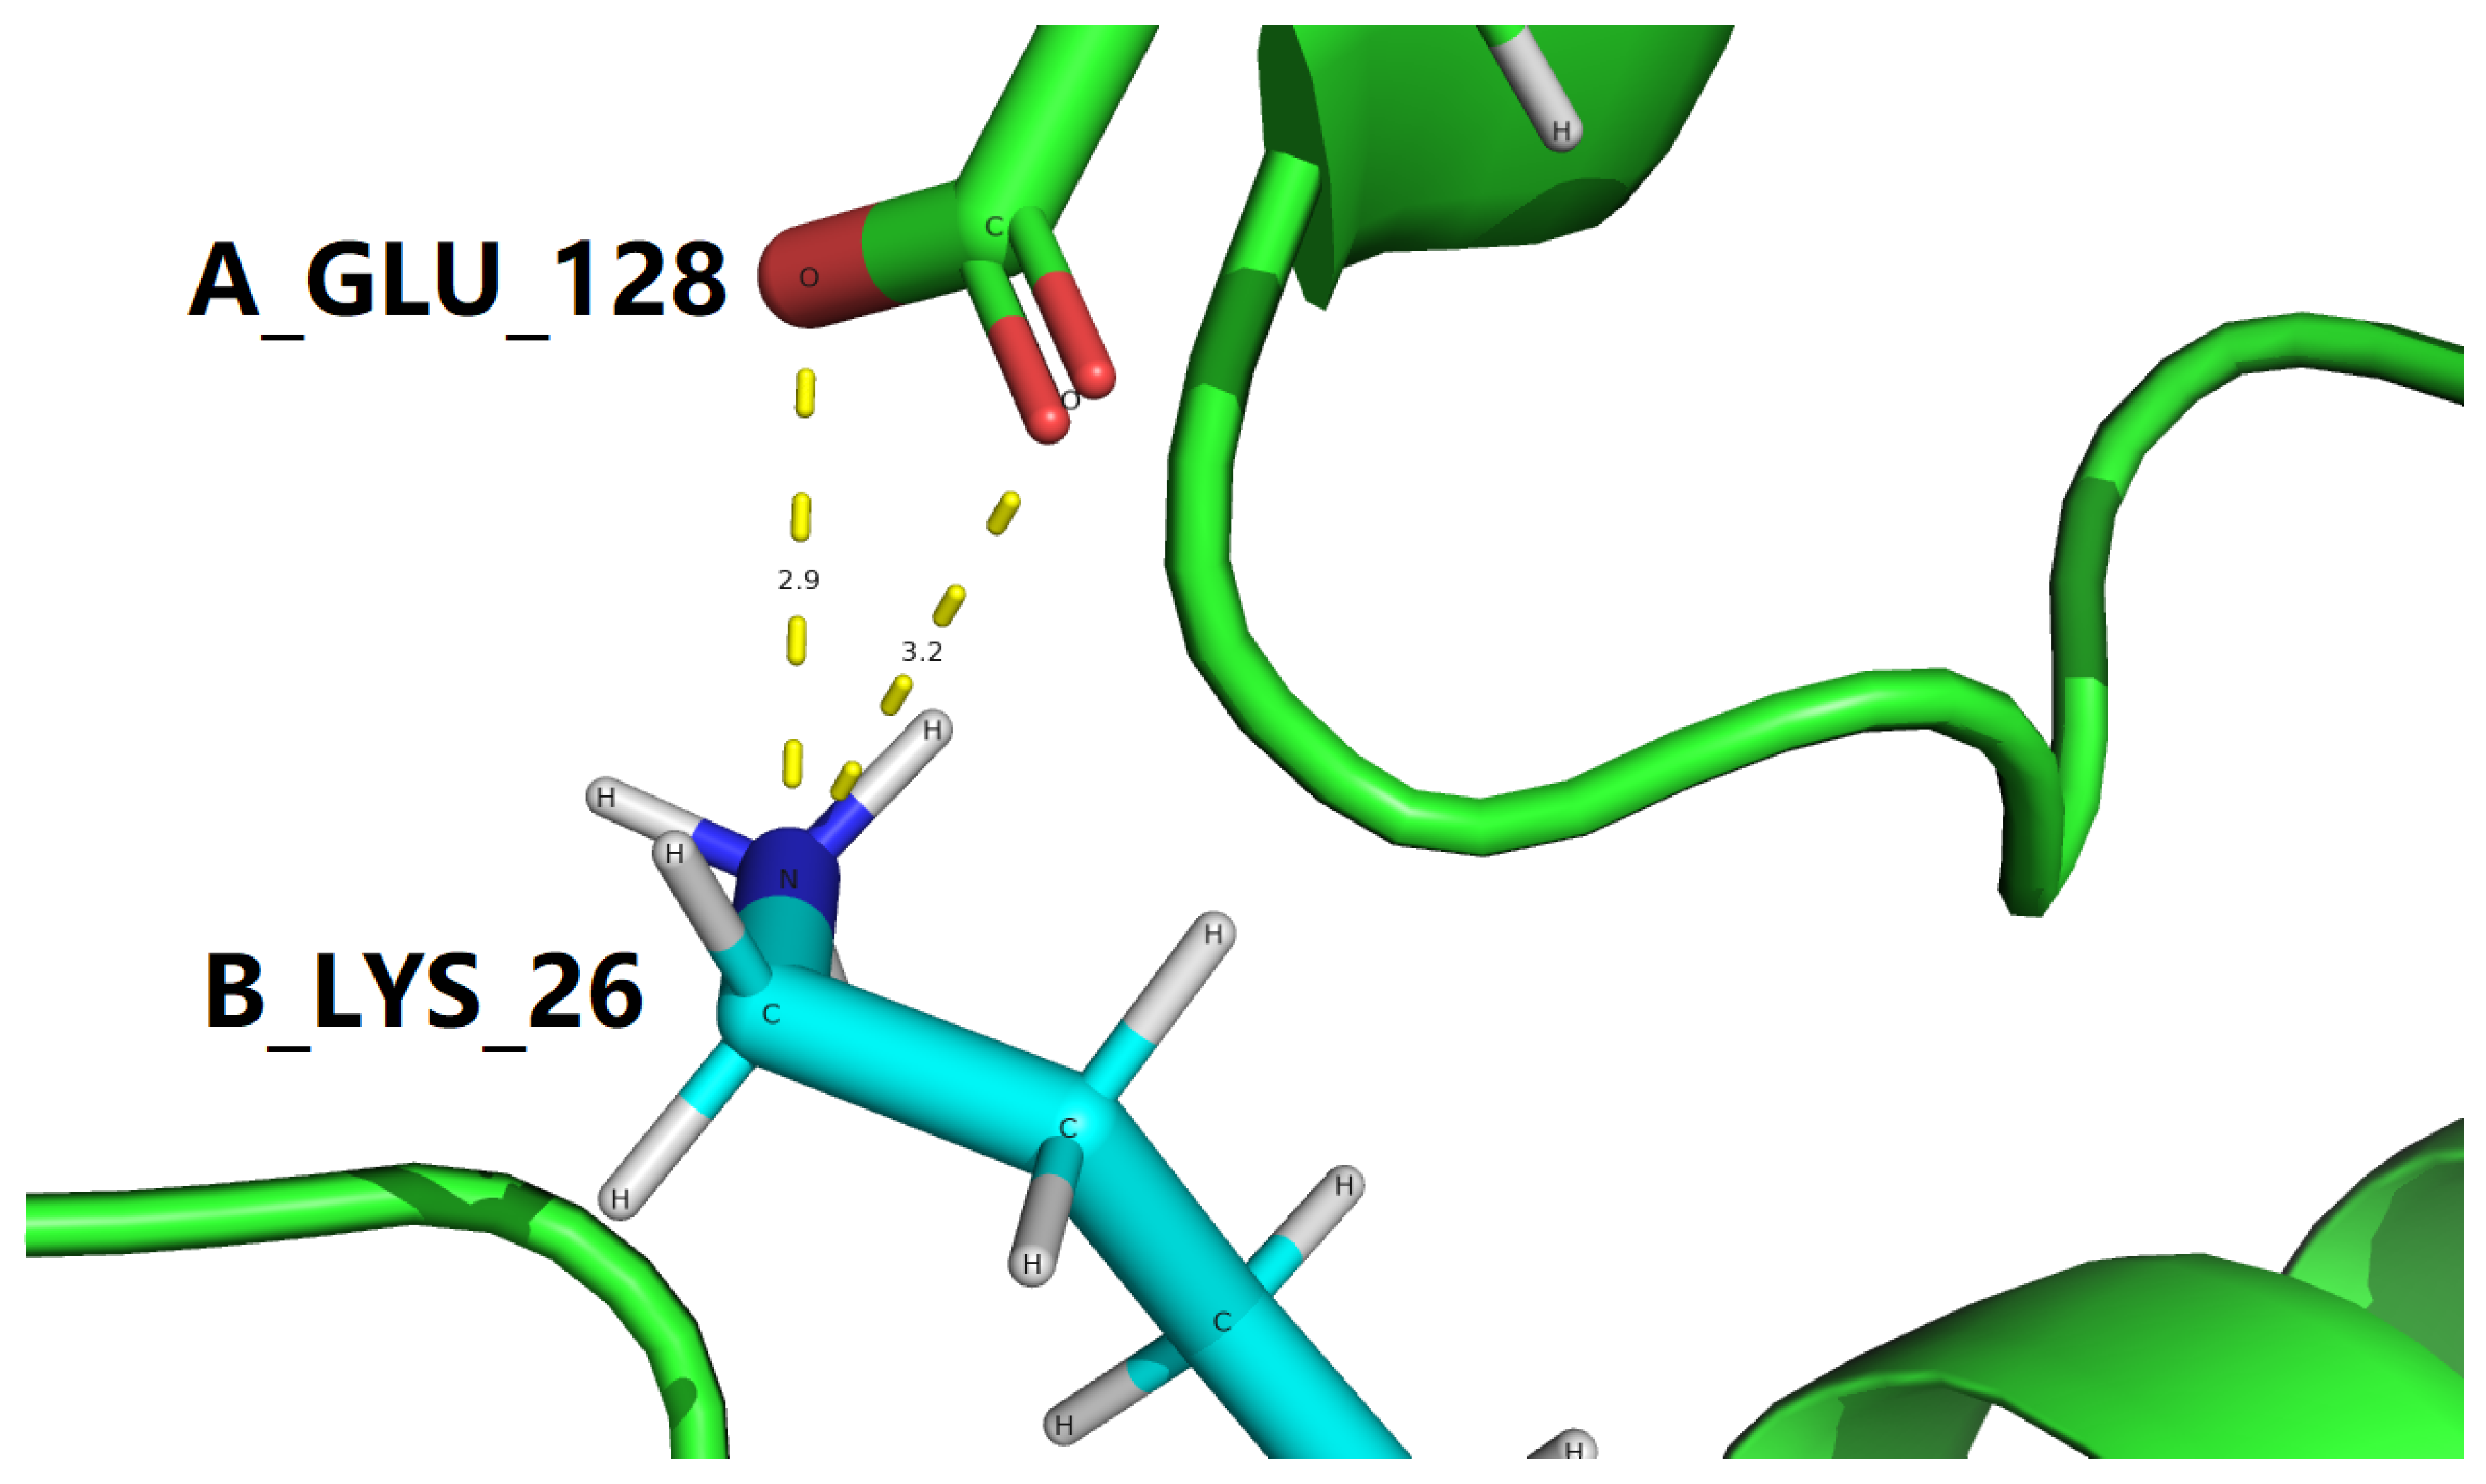
Figure 5.
Structural model of the B27Arg-B28Val mutant of semaglutide peptide backbone (cyan cartoon) in complex with the GLP-1 receptor extracellular domain (green cartoon). This figure is prepared by PyMol [44] with PDB ID 4ZGM [19,36]. In this figure, the color scheme is the same as in Figure 2.
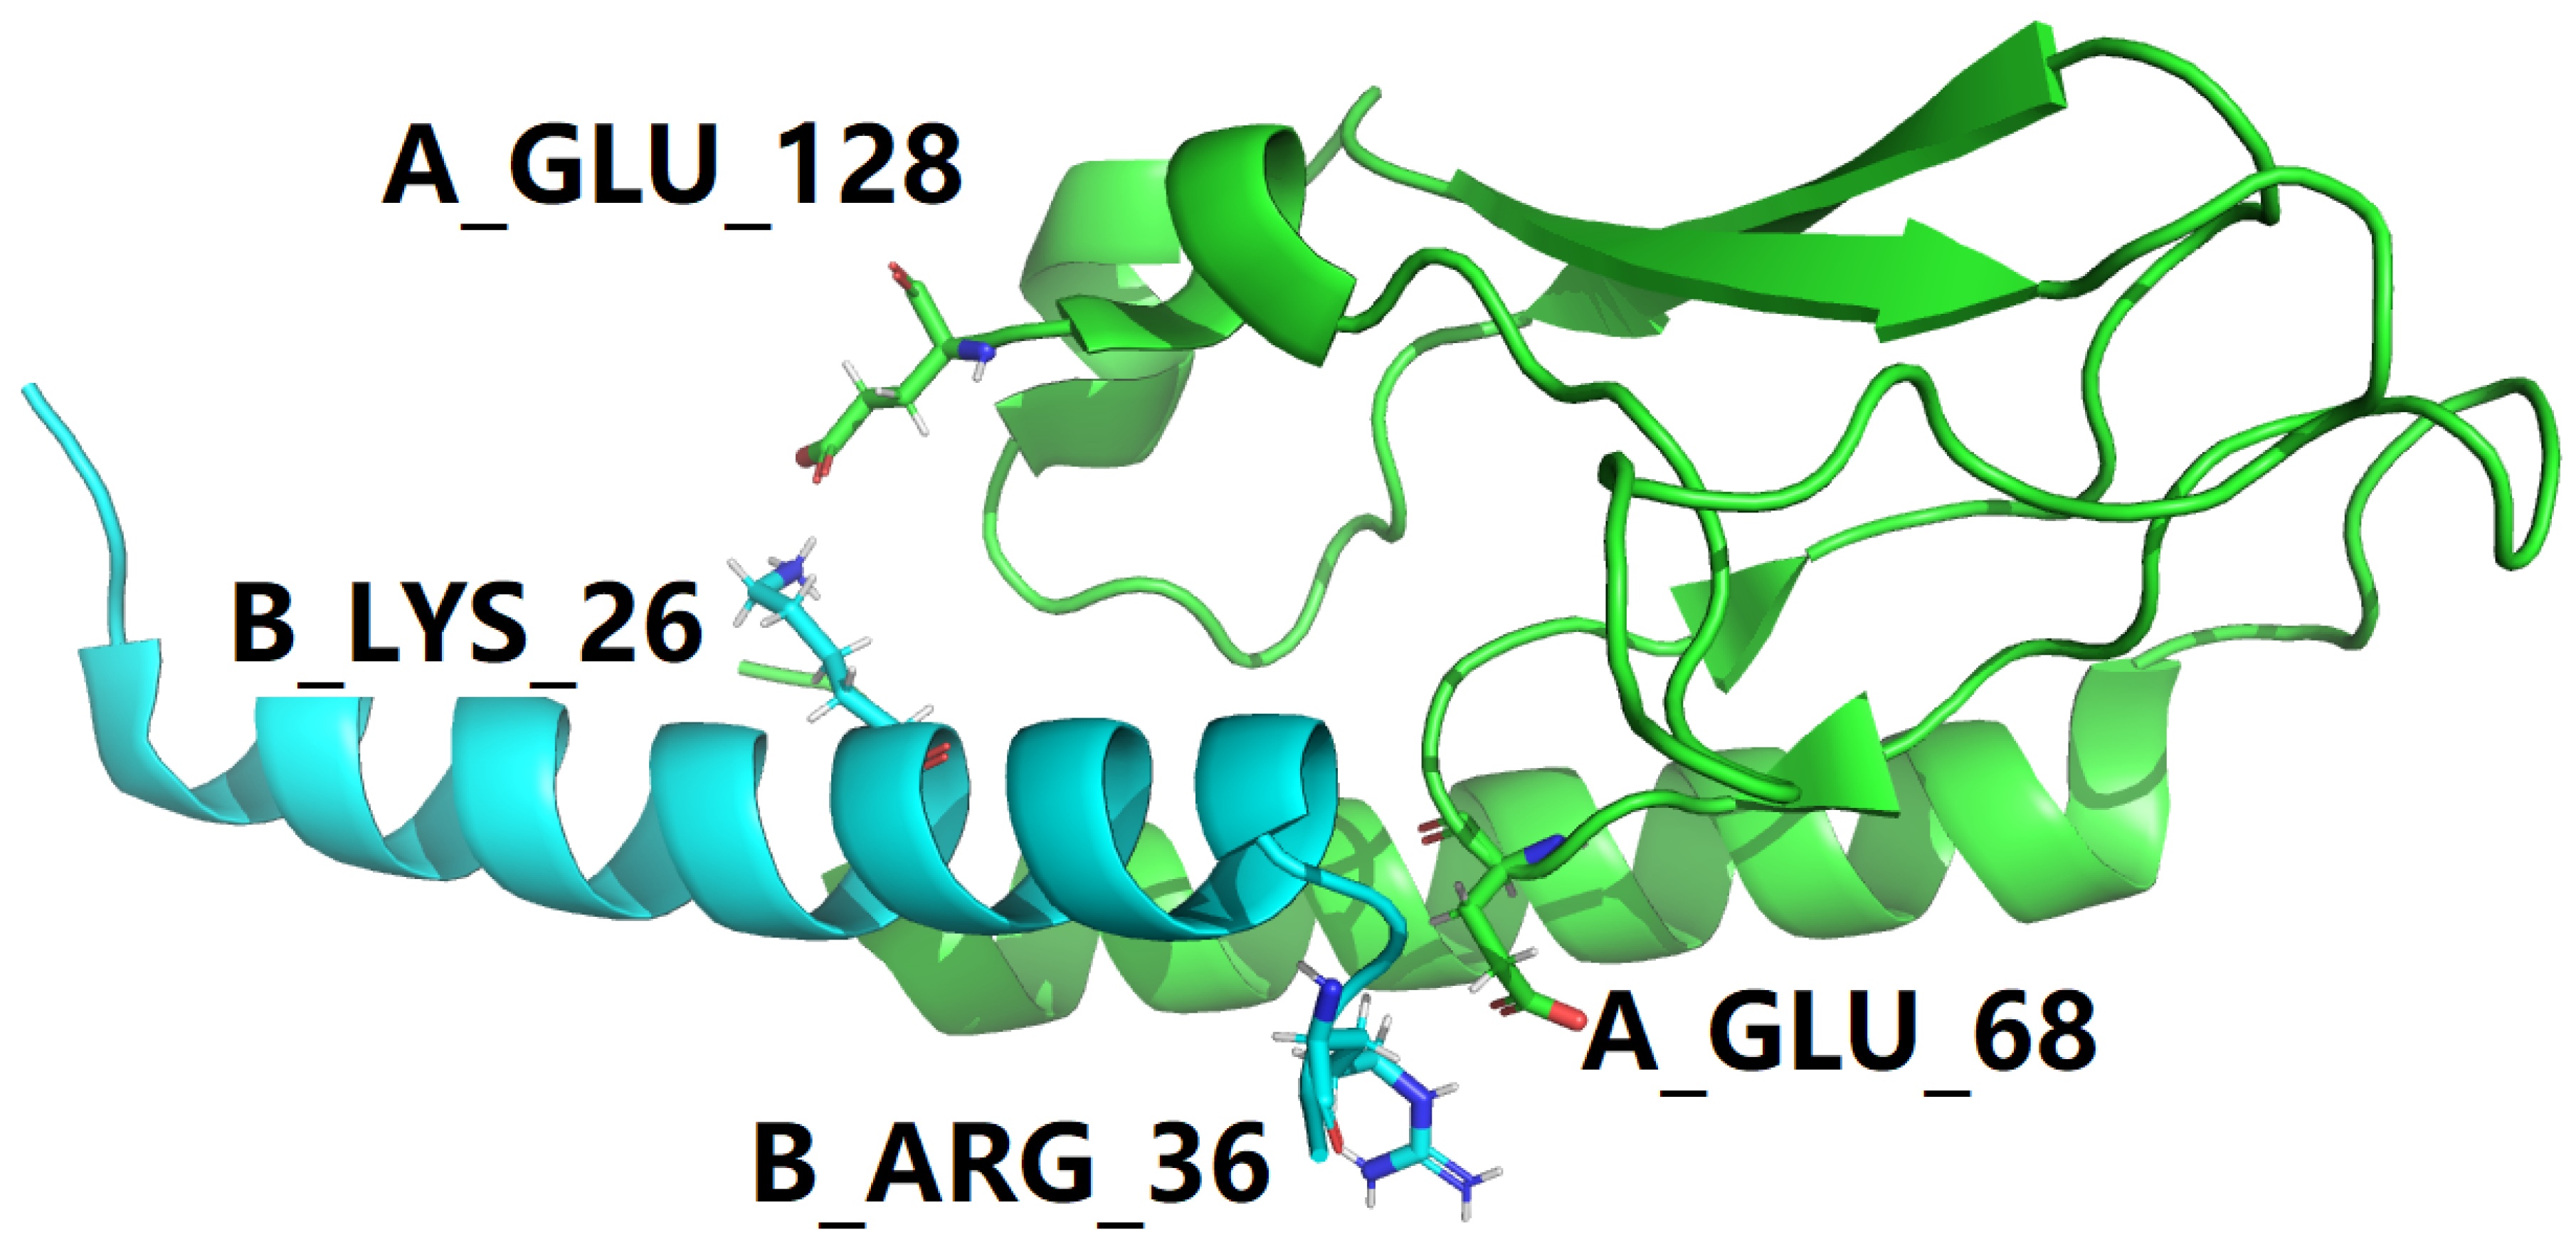
Figure 6.
Structural model of the B27Arg-B28Val mutant of semaglutide peptide backbone (cyan cartoon) in complex with the GLP-1 receptor extracellular domain (green cartoon). This figure is prepared by PyMol [44] with PDB ID 4ZGM [19,36]. In this figure, the color scheme is the same as in Figure 2.
In addition to the structure-stabilizing interfacial salt bridges mentioned above, a set of side chain hydrogen bonds at the GLP-1-GLP-1R binding interface for both 3IOL [17,18] and 4ZGM [19,36] are also included in Table 3. Seperately, for PDB ID 3IOL [17,18], the set of side chain hydrogen bonds at the GLP-1-GLP-1R binding interface were included in Table 5, while for PDB ID 4ZGM [19,36], the set of side chain hydrogen bonds at the GLP-1-GLP-1R binding interface were included in Table 6.
Among the two sets of side chain hydrogen bonds at the GLP-1-GLP-1R binding interface (Table 5 and Table 6), one extraordinary interfacial side chain hydrogen bond was found to exist between the oppositely charged side chains of Lys26 of semaglutide and Glu128 of GLP-1R for 4ZGM [19,36], as described with the details in Table 7. Of further structural and biophysical interest, this outstanding interfacial side chain hydrogen bond is formed between the same pair of oppositely charged amino acid residues as the pair of residues in two interfacial salt bridges (3.212 and 2.924 Å) between Lys26 of GLP-1 and Glu128 of GLP-1R for 3IOL [17,18], as shown by yellow dotted lines in Figures 3 and 4, and two interfacial salt bridges (3.409 and 2.771 Å) between Lys26 of semaglutide and Glu128 of GLP-1R for 4ZGM [19,36], as shown by yellow dotted lines in Figures 5 and 6.
4.2. Residue-specific electrostatic interactions at the GLP-1-GLP-1R binding interface: a structural screening with the new criteria
As discussed above in the section of Materials and Methods, native proteins are in dynamic equilibrium with their less-structured, partially folded and/or unfolded states [41], this article uses two sets of screening criteria for the structural identification of potential hotspots at the GLP-1-GLP-1R binding interface in the two structural models i.e., PDB IDs: 3IOL [17,18] and 4ZGM [19,36]. Therefore, for the two experimental structures represent the GLP-1-GLP-1R complex, with PDB IDs: 3IOL [17,18] and 4ZGM [19,36], a set of residue-specific electrostatic interactions at the GLP-1-GLP-1R binding interface were identified with a structural screening with the new criteria, including salt bridges at the GLP-1-GLP-1R binding interface for both 3IOL [17,18] and 4ZGM [19,36] as included in Table 8 and Table 9 and side chain hydrogen bonds at the GLP-1-GLP-1R binding interface for both 3IOL [17,18] and 4ZGM [19,36] as included in Table 10, Table 11, Table 12 and Table 13, and also shown in Figure 7.
Figure 7.
Structural model of the B27Arg-B28Val mutant of semaglutide peptide backbone (cyan cartoon) in complex with the GLP-1 receptor extracellular domain (green cartoon). This figure is prepared by PyMol [44] with PDB ID 4ZGM [19,36]. In this figure, the color scheme is the same as in Figure 2.
For the two experimental structures represent the GLP-1-GLP-1R complex, with PDB IDs: 3IOL [17,18] and 4ZGM [19,36], a set of residue-specific electrostatic interactions at the GLP-1-GLP-1R binding interface were identified with a structural screening with the new criteria, including salt bridges at the GLP-1-GLP-1R binding interface for both 3IOL [17,18] and 4ZGM [19,36] as included in Table 8 and side chain hydrogen bonds at the GLP-1-GLP-1R binding interface for both 3IOL [17,18] and 4ZGM [19,36] as included in Table 10 and Table 11.
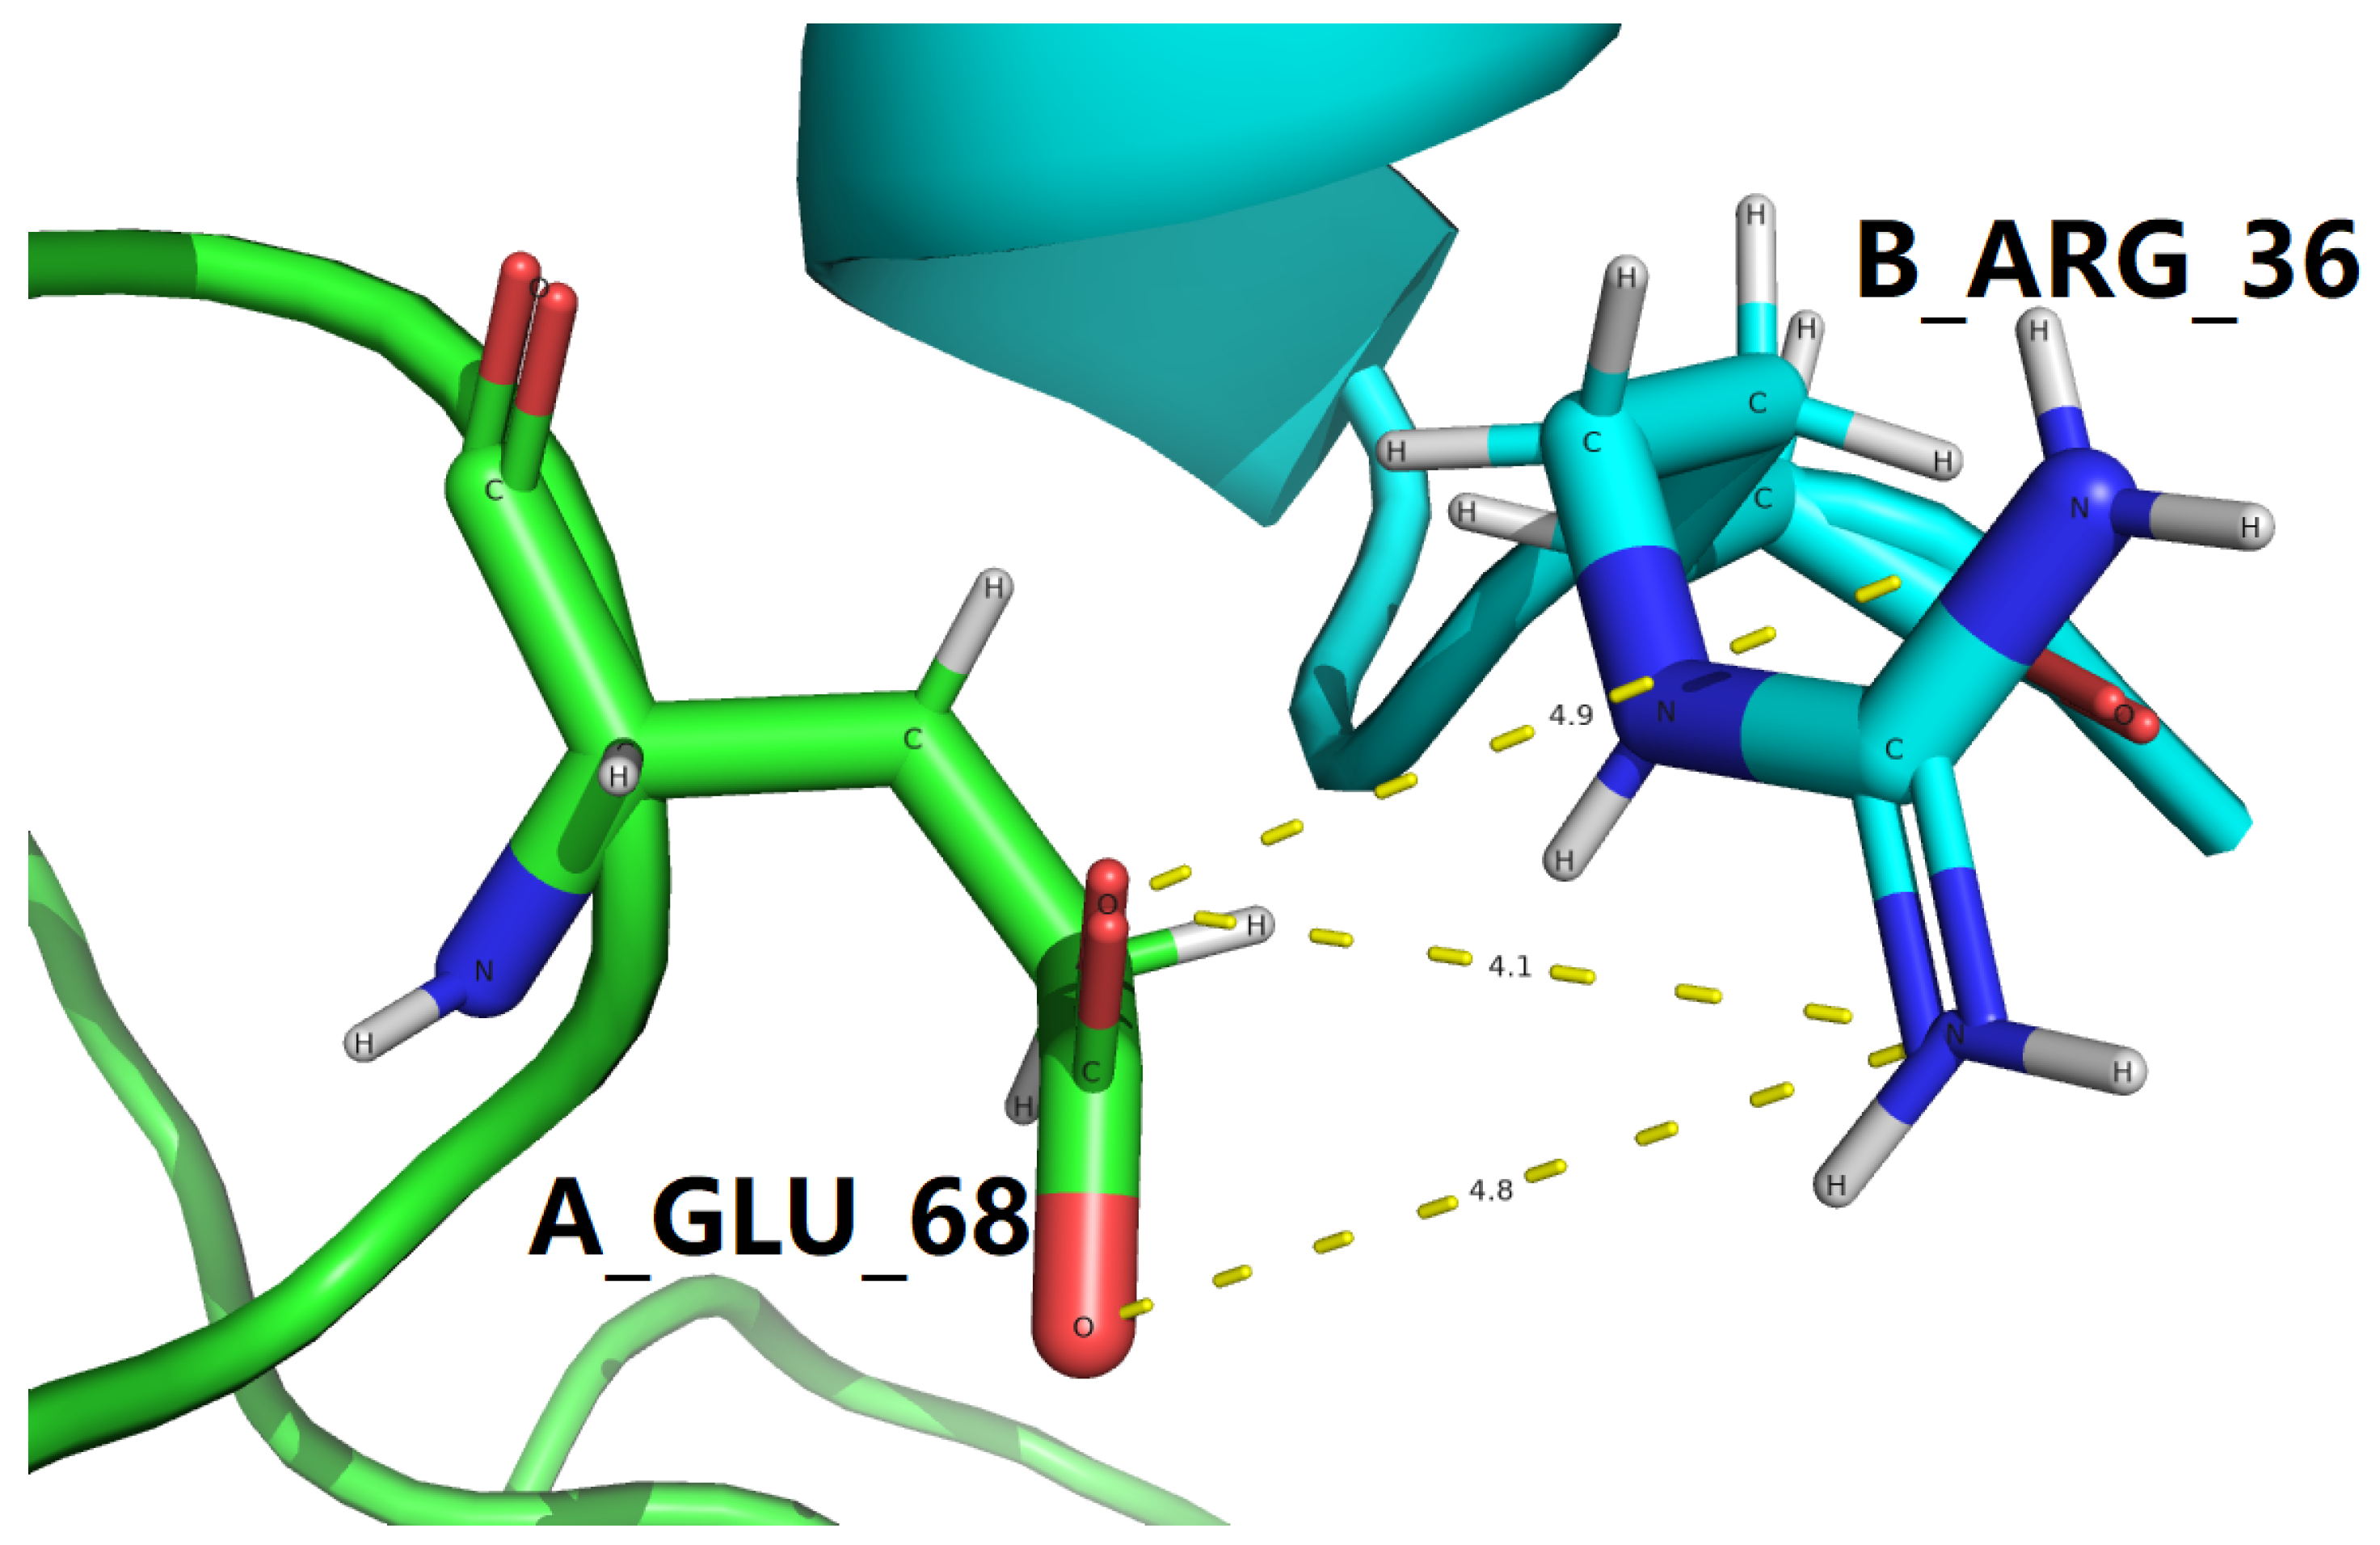
To make it as clear and concise as possible, all interfacial salt bridges are tabulated in Table 9 for two experimental structures represent the GLP-1-GLP-1R complex, with PDB IDs: 3IOL [17,18] and 4ZGM [19,36]. With a close comparison between Table 4 and Table 9, all four interfacial salt bridges in Table 4 are also present in Table 9. However, three additional interfacial salt bridges (according to the new criteria) are identified to be formed between B_ARG_36 of semaglutide backbone and A_GLU_68 of GLP-1R in 4ZGM [19,36], as shown in Figures 5 and 7. Therefore, at the binding interface of semaglutide backbone and GLP-1R, two interfacial salt bridges are like two electrostatic clips [22], stabilizing the complex structure of semaglutide backbone and GLP-1R and facilitating the downstream signal related to the metabolism [33,38,45].
In addition to the structure-stabilizing interfacial salt bridges mentioned above, a set of side chain hydrogen bonds at the GLP-1-GLP-1R binding interface for both 3IOL [17,18] and 4ZGM [19,36] are also included in Table 10 and Table 11, respectively.
Here, in this article, the two experimental structures with PDB IDs: 3IOL [17,18] and 4ZGM [19,36] are both determined by X-ray crystallography, which is a non-dynamic method due to preparation of samples and crystallization. Therefore, a new criteria was also employed here for a high-throughput screening of electrostatic interactions for the two experimental structures with PDB IDs: 3IOL [17,18] and 4ZGM [19,36].
Among the two sets of side chain hydrogen bonds at the GLP-1-GLP-1R binding interface (Table 12 and Table 13), one extraordinary interfacial side chain hydrogen bond was found to exist between the oppositely charged side chains of Ser18 of GLP-1 and Thr29 of GLP-1R for 4ZGM [19,36], as described with the details in Table 7. Of further structural and biophysical interest, three additional interfacial hydrogen bonds (according to the new criteria) are identified to be formed between B_ARG_36 of semaglutide backbone and A_GLU_68 of GLP-1R in 4ZGM [19,36], as listed in Table 12 and Table 13.
5. Conclusion
With two sets of computational structural biophysical analyses of two experimental structures of the GLP-1-GLP-1R complex (PDB IDs: 3IOL [17,18] and 4ZGM [19,36]), this article employed a high-throughput approach for the extraction of electrostatic structural features from GLP-1-GLP-1R complexes, including two sets of interfacial structure-stabilizing salt bridges and hydrogen bonds for the GLP-1-GLP-1R complex structures. These electrostatic structural features contribute to the elucidation of the direct binding and interaction between GLP-1 and GLP-1R, providing biophysical insights into the stabilization of the GLP-1-GLP-1R complex structure and the molecular basis of GLP-1/GLP-1R signaling. Furthermore, this study underscores the significance of integrating computational approaches with experimental ligand-receptor structures to advance our understanding of protein-ligand interactions and accelerate drug discovery [46,47] efforts in the field of diabetes and metabolic disorders.
6. Towards a GLP-1-GLP-1R-based mini GIBAC: a brief future perspective
On August 11, 2022, the concept of a general intermolecular binding affinity calculator (GIBAC) was for the first time proposed in a preprint [48], which defined a collective set of the standards (as defined below) of a truly general intermolecular binding affinity calculator, i.e, a truly GIBAC:
- a truly GIBAC needs to take genetic variations into account;
- a truly GIBAC needs to work even without structural information;
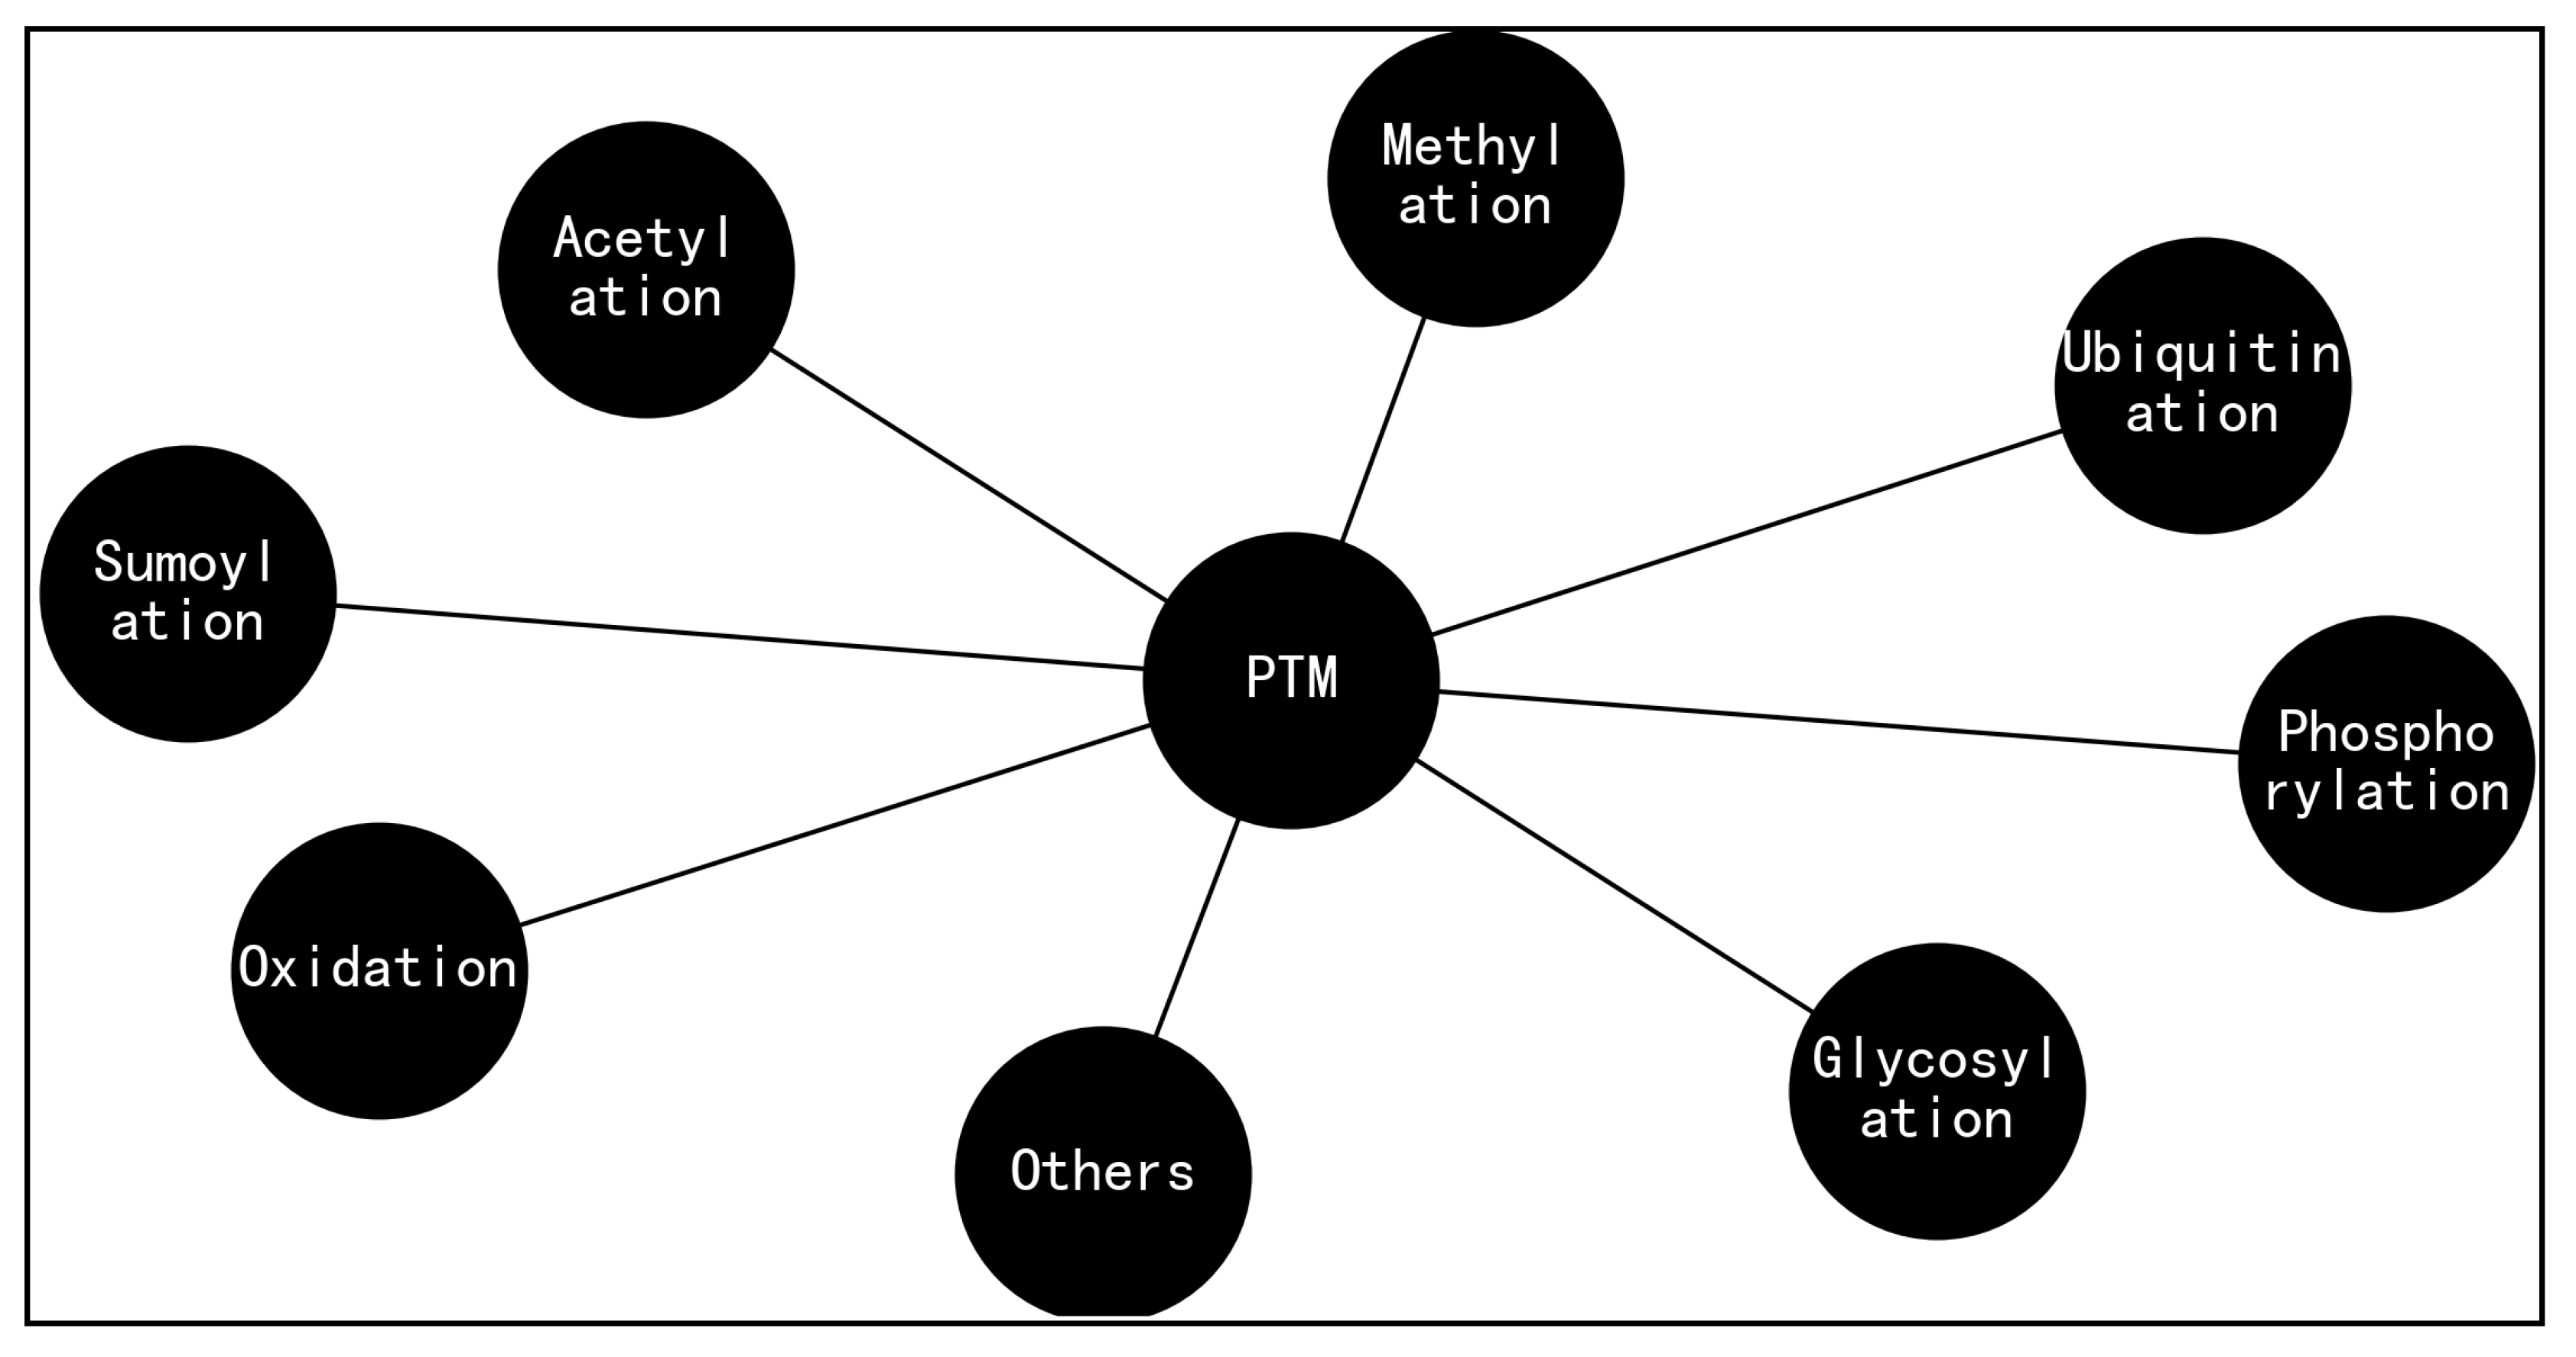
- for a truly GIBAC, a variety of factors need to be taken into account, such as temperature, pH [49,50], site-specific protonation states (e.g., side chain pKa of protein) [51,52], post-translational modifications (PTMs, Figure 8) [25,53,54], post-expression modifications (PEMs) [7,55], buffer conditions [56], et cetera;
- a truly GIBAC is able to be used the other way around, i.e., to be used as a search engine for therapeutic candidate(s). With such a GIBAC-based search engine, a list of therapeutic candidates can be retrieved and ranked according to drug-target Kd value(s), with input parameters including drug target(s) and a desired drug-target Kd value or a range of it.
Figure 8.
A range of post-translational modifications (PTMs) for biomolecules such as protein, where side chain placement and energy minimization algorithms [57] are useful to incorporate structural information of PTMs (Figure 8) and PEMs [7,55] into structural models of biomolecules such as protein, similar to the way the structure of semaglutide is modified with a C-18 fatty di-acid chain at position 26 that provides strong, specific binding to albumin [33].
As is known, the entire space of molecular types and drug modalities is vast [58], extending far beyond proteins and small molecules, which makes a comprehensive physics-based exploration practically impossible and unnecessary [59]. Nonetheless, AI algorithms rely on huge amounts of data to learn and train continuously, where its quantity and quality is inextricably linked to the performance of the model [60,61].
As charted out previously in [48], therefore, the construction of GIBAC requires two key ingredients, i.e., data and algorithm, where algorithm is like the engine of a car, and data the appropriate fuel or power source of it. Here, this article argues that in addition to data and algorithm, the construction of a real GIBAC with adequate accuracy and efficiency also requires our knowledge of biophysics underlying the structure, folding, dynamics, and the direct binding and interaction between ligand and receptor, e.g., the electrostatic structural features extracted from the two experimental structures represent the GLP-1-GLP-1R complex, with PDB IDs: 3IOL [17,18] and 4ZGM [19,36].
To sum up, the development of a GLP-1-GLP-1R-based mini GIBAC perspective represents a promising strategy for extracting electrostatic structural features from ligand-receptor complexes and advancing drug discovery efforts targeting the GLP-1/GLP-1R axis. By combining computational modeling with experimental validation, a GLP-1-GLP-1R-based mini GIBAC offers a powerful tool for elucidating the molecular basis of ligand recognition and receptor activation, paving the way for the development of next-generation therapeutics with improved efficacy and safety for patients with diabetes and/or obesity [14,15,16].
7. Ethical statement
No ethical approval is required.
8. Declaration of generative AI and AI-assisted technologies in the writing process
During the preparation of this work, the author used OpenAI’s ChatGPT in order to improve the readability of the manuscript, and to make it as concise and short as possible. After using this tool, the author reviewed and edited the content as needed and takes full responsibility for the content of the publication.
Author Contributions
Conceptualization, W.L.; methodology, W.L.; software, W.L.; validation, W.L.; formal analysis, W.L.; investigation, W.L.; resources, W.L.; data duration, W.L.; writing–original draft preparation, W.L.; writing–review and editing, W.L.; visualization, W.L.; supervision, W.L.; project administration, W.L.; funding acquisition, not applicable.
Funding
This research received no external funding.
Conflicts of Interest
The author declares no conflict of interest.
References
- Reyes-Alcaraz, A.; Lucero Garcia-Rojas, E.Y.; Merlinsky, E.A.; Seong, J.Y.; Bond, R.A.; McConnell, B.K. A NanoBiT assay to monitor membrane proteins trafficking for drug discovery and drug development. Communications Biology 2022, 5. [Google Scholar] [CrossRef]
- Li, W.; Vottevor, G. Towards a Truly General Intermolecular Binding Affinity Calculator for Drug Discovery & Design 2023. [CrossRef]
- Fuji, H.; Qi, F.; Qu, L.; Takaesu, Y.; Hoshino, T. Prediction of Ligand Binding Affinity to Target Proteins by Molecular Mechanics Theoretical Calculation. Chemical and Pharmaceutical Bulletin 2017, 65, 461–468. [Google Scholar] [CrossRef]
- Firth, S.M.; Ganeshprasad, U.; Baxter, R.C. Structural Determinants of Ligand and Cell Surface Binding of Insulin-like Growth Factor-binding Protein-3. Journal of Biological Chemistry 1998, 273, 2631–2638. [Google Scholar] [CrossRef]
- Ampudia-Blasco, F.J. Biosimilars and Novel Insulins. American Journal of Therapeutics 2020, 27, e52–e61. [Google Scholar] [CrossRef]
- Li, W. Designing rt-PA Analogs to Release its Trapped Thrombolytic Activity. Journal of Computational Biophysics and Chemistry 2021, 20, 719–727. [Google Scholar] [CrossRef]
- Li, W. Strengthening Semaglutide-GLP-1R Binding Affinity via a Val27-Arg28 Exchange in the Peptide Backbone of Semaglutide: A Computational Structural Approach. Journal of Computational Biophysics and Chemistry 2021, 20, 495–499. [Google Scholar] [CrossRef]
- Wan, W.; Qin, Q.; Xie, L.; Zhang, H.; Wu, F.; Stevens, R.C.; Liu, Y. GLP-1R Signaling and Functional Molecules in Incretin Therapy. Molecules 2023, 28, 751. [Google Scholar] [CrossRef] [PubMed]
- D’Alessio, D. Is GLP-1 a hormone: Whether and When? Journal of Diabetes Investigation 2016, 7, 50–55. [Google Scholar] [CrossRef] [PubMed]
- Bailey, C.J.; Flatt, P.R.; Conlon, J.M. An update on peptide-based therapies for type 2 diabetes and obesity. Peptides 2023, 161, 170939. [Google Scholar] [CrossRef] [PubMed]
- Tian, L.; Jin, T. The incretin hormone GLP-1 and mechanisms underlying its secretion. Journal of Diabetes 2016, 8, 753–765. [Google Scholar] [CrossRef] [PubMed]
- Bany Bakar, R. GLP1: the early steps of a success story. Nature Reviews Endocrinology 2023, 19, 255–255. [Google Scholar] [CrossRef]
- Wu, F.; Yang, L.; Hang, K.; Laursen, M.; Wu, L.; Han, G.W.; Ren, Q.; Roed, N.K.; Lin, G.; Hanson, M.A.; Jiang, H.; Wang, M.W.; Reedtz-Runge, S.; Song, G.; Stevens, R.C. Full-length human GLP-1 receptor structure without orthosteric ligands. Nature Communications 2020, 11. [Google Scholar] [CrossRef]
- Trujillo, J.M.; Nuffer, W.; Ellis, S.L. GLP-1 receptor agonists: a review of head-to-head clinical studies. Therapeutic Advances in Endocrinology and Metabolism 2014, 6, 19–28. [Google Scholar] [CrossRef] [PubMed]
- Chavda, V.P.; Ajabiya, J.; Teli, D.; Bojarska, J.; Apostolopoulos, V. Tirzepatide, a New Era of Dual-Targeted Treatment for Diabetes and Obesity: A Mini-Review. Molecules 2022, 27, 4315. [Google Scholar] [CrossRef] [PubMed]
- Wilbon, S.S.; Kolonin, M.G. GLP1 Receptor Agonists-Effects beyond Obesity and Diabetes. Cells 2023, 13, 65. [Google Scholar] [CrossRef] [PubMed]
- Underwood, C.R.; Garibay, P.; Knudsen, L.B.; Hastrup, S.; Peters, G.H.; Rudolph, R.; Reedtz-Runge, S. Crystal Structure of Glucagon-like Peptide-1 in Complex with the Extracellular Domain of the Glucagon-like Peptide-1 Receptor. Journal of Biological Chemistry 2010, 285, 723–730. [Google Scholar] [CrossRef]
- Reedtz-Runge, S. Crystal structure of Glucagon-Like Peptide-1 in complex with the extracellular domain of the Glucagon-Like Peptide-1 Receptor, 2009. [CrossRef]
- Lau, J.; Bloch, P.; Schäffer, L.; Pettersson, I.; Spetzler, J.; Kofoed, J.; Madsen, K.; Knudsen, L.B.; McGuire, J.; Steensgaard, D.B.; Strauss, H.M.; Gram, D.X.; Knudsen, S.M.; Nielsen, F.S.; Thygesen, P.; Reedtz-Runge, S.; Kruse, T. Discovery of the Once-Weekly Glucagon-Like Peptide-1 (GLP-1) Analogue Semaglutide. Journal of Medicinal Chemistry 2015, 58, 7370–7380. [Google Scholar] [CrossRef] [PubMed]
- Berman, H.; Henrick, K.; Nakamura, H. Announcing the worldwide Protein Data Bank. Nature Structural & Molecular Biology 2003, 10, 980–980. [Google Scholar] [CrossRef]
- Li, W. Li, W. Half-a-century Burial of ρ, θ and φ in PDB 2021. [CrossRef]
- Li, W. How do SMA-linked mutations of SMN1 lead to structural/functional deficiency of the SMA protein? PLOS ONE 2017, 12, e0178519. [Google Scholar] [CrossRef]
- Li, W. Delving deep into the structural aspects of a furin cleavage site inserted into the spike protein of SARS-CoV-2: A structural biophysical perspective. Biophysical Chemistry 2020, 264, 106420. [Google Scholar] [CrossRef]
- Kortemme, T.; Kim, D.E.; Baker, D. Computational Alanine Scanning of Protein-Protein Interfaces. Science Signaling 2004, 2004, pl2–pl2. [Google Scholar] [CrossRef]
- Li, W. How Structural Modifications of Insulin Icodec Contributes to Its Prolonged Duration of Action: A Structural and Biophysical Perspective 2023. [CrossRef]
- Li, Y.; Liang, Z.; Tian, Y.; Cai, W.; Weng, Z.; Chen, L.; Zhang, H.; Bao, Y.; Zheng, H.; Zeng, S.; Bei, C.; Li, Y. High-affinity PD-1 molecules deliver improved interaction with PD-L1 and PD-L2. Cancer Science 2018, 109, 2435–2445. [Google Scholar] [CrossRef]
- Li, W. Delving Deep into the Structural Aspects of the BPro28-BLys29 Exchange in Insulin Lispro: A Structural Biophysical Lesson 2020. [CrossRef]
- Li, W. Extracting the Interfacial Electrostatic Features from Experimentally Determined Antigen and/or Antibody-Related Structures inside Protein Data Bank for Machine Learning-Based Antibody Design 2020. [CrossRef]
- Wong, S.K.; Li, W.; Moore, M.J.; Choe, H.; Farzan, M. A 193-Amino Acid Fragment of the SARS Coronavirus S Protein Efficiently Binds Angiotensin-converting Enzyme 2. Journal of Biological Chemistry 2003, 279, 3197–3201. [Google Scholar] [CrossRef]
- Ho, M.W.; O’Brien, J.S. Gaucher’s Disease: deficiency of CID β-Glucosidase and Reconstitution of Enzyme Activity In Vitro. Proc. Natl. Acad. Sci. USA 1971, 68, 2810–2813. [Google Scholar] [CrossRef]
- Abraham, E.P.; Chain, E. An enzyme from bacteria able to destroy penicillin. Nature 1940, 146, 837–837. [Google Scholar] [CrossRef]
- Li, W. Strengthening Semaglutide-GLP-1R Binding Affinity Via a Val27-Arg28 Exchange in the Peptide Backbone of Semaglutide: A Computational Structural Approach. Journal of Computational Biophysics and Chemistry 2021, pp. 1–5. [CrossRef]
- Hjerpsted, J.B.; Flint, A.; Brooks, A.; Axelsen, M.B.; Kvist, T.; Blundell, J. Semaglutide improves postprandial glucose and lipid metabolism, and delays first-hour gastric emptying in subjects with obesity. Diabetes, Obesity and Metabolism 2017, 20, 610–619. [Google Scholar] [CrossRef] [PubMed]
- Vangone, A.; Bonvin, A.M. Contacts-based prediction of binding affinity in protein–protein complexes. eLife 2015, 4. [Google Scholar] [CrossRef] [PubMed]
- Xue, L.C.; Rodrigues, J.P.; Kastritis, P.L.; Bonvin, A.M.; Vangone, A. PRODIGY: a web server for predicting the binding affinity of protein–protein complexes. Bioinformatics 2016, p. btw514. [CrossRef]
- Reedtz-Runge, S. Crystal structure of Semaglutide peptide backbone in complex with the GLP-1 receptor extracellular domain, 2015. [CrossRef]
- Maselli, D.B.; Camilleri, M., Effects of GLP-1 and Its Analogs on Gastric Physiology in Diabetes Mellitus and Obesity. In Diabetes: from Research to Clinical Practice; Springer International Publishing, 2020; p. 171–192. [CrossRef]
- Drucker, D.J. GLP-1 physiology informs the pharmacotherapy of obesity. Molecular Metabolism 2022, 57, 101351. [Google Scholar] [CrossRef] [PubMed]
- Sievers, F.; Wilm, A.; Dineen, D.; Gibson, T.J.; Karplus, K.; Li, W.; Lopez, R.; McWilliam, H.; Remmert, M.; Söding, J. Fast, scalable generation of high-quality protein multiple sequence alignments using Clustal Omega. Molecular Systems Biology. 2011, 7, 539–543. [Google Scholar] [CrossRef] [PubMed]
- Pettersen, E.F.; Goddard, T.D.; Huang, C.C.; Couch, G.S.; Greenblatt, D.M.; Meng, E.C.; Ferrin, T.E. UCSF Chimera: A visualization system for exploratory research and analysis. Journal of Computational Chemistry 2004, 25, 1605–1612. [Google Scholar] [CrossRef] [PubMed]
- Yuan, Y.; Cao, D.; Zhang, Y.; Ma, J.; Qi, J.; Wang, Q.; Lu, G.; Wu, Y.; Yan, J.; Shi, Y.; Zhang, X.; Gao, G.F. Cryo-EM structures of MERS-CoV and SARS-CoV spike glycoproteins reveal the dynamic receptor binding domains. Nature Communications 2017, 8. [Google Scholar] [CrossRef]
- Li, W. Structural and Functional Consequences of the SMA-Linked Missense Mutations of the Survival Motor Neuron Protein: A Brief Update. In Novel Aspects on Motor Neuron Disease; IntechOpen, 2019. [CrossRef]
- Deciphering critical amino acid residues to modify and enhance the binding affinity of ankyrin scaffold specific to capsid protein of human immunodeficiency virus type 1. Asian Pacific Journal of Allergy and Immunology 2017. [CrossRef]
- DeLano, W.L. Pymol: An open-source molecular graphics tool. CCP4 Newsletter On Protein Crystallography 2002, 40, 82–92. [Google Scholar]
- Caparrotta, T.M.; Evans, M. PEGylated insulin Lispro, (LY2605541)-a new basal insulin analogue. Diabetes, Obesity and Metabolism 2013, 16, 388–395. [Google Scholar] [CrossRef]
- Lewis, K. Antibiotics: recover the lost art of drug discovery. Nature 2012, 485, 439–440. [Google Scholar] [CrossRef]
- Lee, S.; Sayin, A.; Cauchi, R.J.; Grice, S.; Burdett, H.; Baban, D.; Van, d.H.M. Genome-Wide expression analysis of a spinal muscular atrophy model: towards discovery of new drug targets. Plos One 2008, e1404, 1–11. [Google Scholar] [CrossRef]
- Li, W. Towards a General Intermolecular Binding Affinity Calculator 2022. [CrossRef]
- Yang, A.S.; Honig, B. On the pH Dependence of Protein Stability. Journal of Molecular Biology 1993, 231, 459–474. [Google Scholar] [CrossRef] [PubMed]
- Harris, T.K.; Turner, G.J. Structural Basis of Perturbed pKa Values of Catalytic Groups in Enzyme Active Sites. IUBMB Life (International Union of Biochemistry and Molecular Biology: Life) 2002, 53, 85–98. [Google Scholar] [CrossRef]
- Li, W. Gravity-driven pH adjustment for site-specific protein pKa measurement by solution-state NMR. Measurement Science and Technology 2017, 28, 127002. [Google Scholar] [CrossRef]
- Hansen, A.L.; Kay, L.E. Measurement of histidine pKa values and tautomer populations in invisible protein states. Proceedings of the National Academy of Sciences 2014, 111, E1705–E1712. [Google Scholar] [CrossRef] [PubMed]
- Herget, S.; Ranzinger, R.; Maass, K.; Lieth, C.W. GlycoCT—a unifying sequence format for carbohydrates. Carbohydrate Research 2008, 343, 2162–2171. [Google Scholar] [CrossRef]
- Foster, J.M.; Moreno, P.; Fabregat, A.; Hermjakob, H.; Steinbeck, C.; Apweiler, R.; Wakelam, M.J.O.; Vizcaíno, J.A. LipidHome: A Database of Theoretical Lipids Optimized for High Throughput Mass Spectrometry Lipidomics. PLoS ONE 2013, 8, e61951. [Google Scholar] [CrossRef]
- Weiss, M. Design of ultra-stable insulin analogues for the developing world. Journal of Health Specialties 2013, 1, 59. [Google Scholar] [CrossRef]
- Olsson, M.H.M.; Søndergaard, C.R.; Rostkowski, M.; Jensen, J.H. PROPKA3: Consistent Treatment of Internal and Surface Residues in Empirical pKa Predictions. Journal of Chemical Theory and Computation 2011, 7, 525–537. [Google Scholar] [CrossRef] [PubMed]
- Canzar, S.; Toussaint, N.C.; Klau, G.W. An exact algorithm for side-chain placement in protein design. Optimization Letters 2011, 5, 393–406. [Google Scholar] [CrossRef]
- Kang, M.; Lu, Y.; Chen, S.; Tian, F. Harnessing the power of an expanded genetic code toward next-generation biopharmaceuticals. Current Opinion in Chemical Biology 2018, 46, 123–129. [Google Scholar] [CrossRef] [PubMed]
- Lipinski, C.; Hopkins, A. Navigating chemical space for biology and medicine. Nature 2004, 432, 855–861. [Google Scholar] [CrossRef]
- Li, W. Visualising the Experimentally Uncharted Territories of Membrane Protein Structures inside Protein Data Bank 2020. [CrossRef]
- Evans, R.; O’Neill, M.; Pritzel, A.; Antropova, N.; Senior, A.; Green, T.; Žídek, A.; Bates, R.; Blackwell, S.; Yim, J.; Ronneberger, O.; Bodenstein, S.; Zielinski, M.; Bridgland, A.; Potapenko, A.; Cowie, A.; Tunyasuvunakool, K.; Jain, R.; Clancy, E.; Kohli, P.; Jumper, J.; Hassabis, D. Protein complex prediction with AlphaFold-Multimer 2021. [CrossRef]

Table 1.
Experimentally determined GLP-1R-related structures in the Protein Data Bank (PDB [20]) as of March 11, 2024 with a QUERY: Polymer Entity Description = "Glucagon-like peptide 1 receptor". In this table, the two structural models representing the complex structures of ligand-bound GLP-1R are highlighted in two yellow rows, i.e., PDB IDs: 3IOL [17] and 4ZGM [36].
| PDB ID | Structure Title |
|---|---|
| 8JIS | Cryo-EM structure of the GLP-1R/GCGR dual agonist peptide15-bound human GLP-1R-Gs complex |
| 8JIP | Cryo-EM structure of the GLP-1R/GCGR dual agonist MEDI0382-bound human GLP-1R-Gs complex |
| 8JIR | Cryo-EM structure of the GLP-1R/GCGR dual agonist SAR425899-bound human GLP-1R-Gs complex |
| 7X8R | Cryo-EM structure of the Boc5-bound hGLP-1R-Gs complex |
| 7X8S | Cryo-EM structure of the WB4-24-bound hGLP-1R-Gs complex |
| 7S15 | GLP-1 receptor bound with Pfizer small molecule agonist |
| 7RG9 | cryo-EM of human Glucagon-like peptide 1 receptor GLP-1R in apo form |
| 7RGP | cryo-EM of human Glucagon-like peptide 1 receptor GLP-1R bound to tirzepatide |
| 7VBH | Cryo-EM structure of the GIPR/GLP-1R/GCGR triagonist peptide 20-bound human GLP-1R-Gs complex |
| 7VBI | Cryo-EM structure of the non-acylated tirzepatide (LY3298176)-bound human GLP-1R-Gs complex |
| 7LLL | Exendin-4-bound Glucagon-Like Peptide-1 (GLP-1) Receptor in complex with Gs protein |
| 7LLY | Oxyntomodulin-bound Glucagon-Like Peptide-1 (GLP-1) Receptor in complex with Gs protein |
| 7S1M | Ex4-D-Ala bound to the glucagon-like peptide-1 receptor/g protein complex (conformer 1) |
| 7S3I | Ex4-D-Ala bound to the glucagon-like peptide-1 receptor/g protein complex (conformer 2) |
| 7RTB | Peptide-19 bound to the Glucagon-Like Peptide-1 Receptor (GLP-1R) |
| 7DUR | Cryo-EM structure of the compound 2-bound human GLP-1 receptor-Gs complex |
| 7EVM | Cryo-EM structure of the compound 2-bound human GLP-1 receptor-Gs complex |
| 7KI0 | Semaglutide-bound Glucagon-Like Peptide-1 (GLP-1) Receptor in Complex with Gs protein |
| 7KI1 | Taspoglutide-bound Glucagon-Like Peptide-1 (GLP-1) Receptor in Complex with Gs Protein |
| 7DUQ | Cryo-EM structure of the compound 2 and GLP-1-bound human GLP-1 receptor-Gs complex |
| 7E14 | Compound2_GLP-1R_OWL833_Gs complex structure |
| 7LCI | PF 06882961 bound to the glucagon-like peptide-1 receptor (GLP-1R):Gs complex |
| 7LCJ | PF 06882961 bound to the glucagon-like peptide-1 receptor (GLP-1R):Gs complex |
| 7LCK | PF 06882961 bound to the glucagon-like peptide-1 receptor (GLP-1R) |
| 6XOX | cryo-EM of human GLP-1R bound to non-peptide agonist LY3502970 |
| 6X18 | GLP-1 peptide hormone bound to Glucagon-Like peptide-1 (GLP-1) Receptor |
| 6X19 | Non peptide agonist CHU-128, bound to Glucagon-Like peptide-1 (GLP-1) Receptor |
| 6X1A | Non peptide agonist PF-06882961, bound to Glucagon-Like peptide-1 (GLP-1) Receptor |
| 7C2E | GLP-1R-Gs complex structure with a small molecule full agonist |
| 6VCB | Cryo-EM structure of the Glucagon-like peptide-1 receptor in complex with G protein, GLP-1 peptide and a positive allosteric modulator |
| 6ORV | Non-peptide agonist (TT-OAD2) bound to the Glucagon-Like peptide-1 (GLP-1) Receptor |
| 5OTT | Extracellular domain of GLP-1 receptor in complex with exendin-4 variant Gly2Hcs/Thr5Hcs |
| 5OTU | Extracellular domain of GLP-1 receptor in complex with GLP-1 variant Ala8Hcs/Thr11Hcs |
| 5OTV | Extracellular domain of GLP-1 receptor in complex with GLP-1 variant Ala8Cyc/Thr11Hcs |
| 5OTW | Extracellular domain of GLP-1 receptor in complex with GLP-1 variant Ala8Hcs/Thr11Cys |
| 5OTX | Extracellular domain of GLP-1 receptor in complex with GLP-1 variant Ala8Cys/Thr11Cys |
| 6GB1 | Crystal structure of the GLP1 receptor ECD with Peptide 11 |
| 6B3J | 3.3 angstrom phase-plate cryo-EM structure of a biased agonist-bound human GLP-1 receptor-Gs complex |
| 5NX2 | Crystal structure of thermostabilised full-length GLP-1R in complex with a truncated peptide agonist at 3.7 Å resolution |
| 5E94 | Antibody-bound Glucagon-like Peptide-1 receptor extracellular domain |
| 4ZGM | Crystal structure of Semaglutide peptide backbone in complex with the GLP-1 receptor extracellular domain |
| 3IOL | Crystal structure of Glucagon-Like Peptide-1 in complex with the extracellular domain of the Glucagon-Like Peptide-1 Receptor |
| 3C59 | Crystal structure of the ligand-bound glucagon-like peptide-1 receptor extracellular domain |
| 3C5T | Crystal structure of the ligand-bound glucagon-like peptide-1 receptor extracellular domain |
Table 2.
Salt bridging screening for two GLP-1-GLP-1R complex structures (PDB IDs: 3IOL [17,18] and 4ZGM [19,36]). In this table, the residue naming scheme is Chain ID_residue name_residue number.
| PDB ID | Residue A | Atom A | Residue B | Atom B | Distance (Å) |
|---|---|---|---|---|---|
| 3IOH | A_ARG_44 | NH2 | A_GLU_41 | OE1 | 3.682 |
| 3IOH | A_ARG_44 | NH2 | A_GLU_41 | OE2 | 2.811 |
| 3IOH | A_ARG_64 | NH2 | A_ASP_74 | OD1 | 3.801 |
| 3IOH | A_ARG_64 | NH2 | A_ASP_74 | OD2 | 2.782 |
| 3IOH | A_ARG_102 | NH1 | A_ASP_67 | OD2 | 3.054 |
| 3IOH | A_ARG_121 | NH1 | A_ASP_67 | OD1 | 3.519 |
| 3IOH | A_ARG_121 | NH1 | A_ASP_67 | OD2 | 2.959 |
| 3IOH | B_LYS_26 | NZ | A_GLU_128 | OE1 | 3.212 |
| 3IOH | B_LYS_26 | NZ | A_GLU_128 | OE2 | 2.924 |
| 4ZGH | A_LYS_38 | NZ | A_GLU_34 | OE1 | 3.823 |
| 4ZGH | A_ARG_44 | NH2 | A_GLU_41 | OE1 | 3.861 |
| 4ZGH | A_ARG_44 | NH2 | A_GLU_41 | OE2 | 2.747 |
| 4ZGH | A_ARG_64 | NH2 | A_ASP_74 | OD1 | 3.779 |
| 4ZGH | A_ARG_64 | NH2 | A_ASP_74 | OD2 | 2.832 |
| 4ZGH | A_ARG_102 | NH1 | A_ASP_67 | OD2 | 3.198 |
| 4ZGH | A_ARG_121 | NH1 | A_ASP_67 | OD1 | 3.561 |
| 4ZGH | A_ARG_121 | NH1 | A_ASP_67 | OD2 | 2.953 |
| 4ZGH | B_LYS_26 | NZ | A_GLU_128 | OE1 | 3.409 |
| 4ZGH | B_LYS_26 | NZ | A_GLU_128 | OE2 | 2.771 |
Table 3.
Side chain hydrogen bonding network analysis for two GLP-1-GLP-1R complex structures (PDB IDs: 3IOL [17,18] and 4ZGM [19,36]). In this table, the residue naming scheme is Chain ID_residue name_residue number, represents the angle formed by acceptor (A), donor (D) and hydrogen (H) .
| PDB | Acceptor (A) | Donor (D) | Hydrogen (H) | D-A (Å) | H-A (Å) | |
| 3IOH | OE1, A_GLU_41 | NE, A_ARG_44 | HE, A_ARG_44 | 2.87 | 1.87 | 4.40 |
| 3IOH | OE2, A_GLU_41 | NH2, A_ARG_44 | HH21, A_ARG_44 | 2.81 | 1.86 | 15.77 |
| 3IOH | OE2, A_GLU_41 | NE2, A_GLN_45 | HE21, A_GLN_45 | 2.80 | 1.81 | 7.74 |
| 3IOH | OD2, A_ASP_74 | NH2, A_ARG_64 | HH22, A_ARG_64 | 2.78 | 1.78 | 5.75 |
| 3IOH | OD2, A_ASP_67 | NE1, A_TRP_72 | HE1, A_TRP_72 | 2.69 | 1.83 | 24.82 |
| 3IOH | OE2, A_GLU_125 | OH, A_TYR_101 | HH, A_TYR_101 | 2.63 | 1.69 | 8.92 |
| 3IOH | OD2, A_ASP_67 | NH1, A_ARG_121 | HH12, A_ARG_121 | 2.96 | 2.09 | 25.64 |
| 3IOH | OD1, A_ASP_122 | OG, A_SER_124 | HG, A_SER_124 | 2.65 | 1.73 | 12.69 |
| 4ZGH | OE1, A_GLU_41 | NE, A_ARG_44 | HE, A_ARG_44 | 2.92 | 2.08 | 10.96 |
| 4ZGH | OE2, A_GLU_41 | NH2, A_ARG_44 | HH21, A_ARG_44 | 2.75 | 1.91 | 11.18 |
| 4ZGH | OE2, A_GLU_41 | NE2, A_GLN_45 | HE21, A_GLN_45 | 2.99 | 2.14 | 5.73 |
| 4ZGH | OD1, A_ASP_74 | NE, A_ARG_64 | HE, A_ARG_64 | 2.97 | 2.12 | 3.34 |
| 4ZGH | OD2, A_ASP_74 | NH2, A_ARG_64 | HH21, A_ARG_64 | 2.83 | 1.98 | 7.04 |
| 4ZGH | OD2, A_ASP_67 | NE1, A_TRP_72 | HE1, A_TRP_72 | 2.80 | 2.02 | 20.99 |
| 4ZGH | OE2, A_GLU_125 | OH, A_TYR_101 | HH, A_TYR_101 | 2.82 | 1.99 | 6.37 |
| 4ZGH | OD2, A_ASP_67 | NH1, A_ARG_121 | HH11, A_ARG_121 | 2.95 | 2.17 | 20.60 |
| 4ZGH | OD1, A_ASP_122 | OG, A_SER_124 | HG, A_SER_124 | 2.67 | 1.91 | 21.21 |
| 4ZGH | OE2, A_GLU_128 | NZ, B_LYS_26 | HZ2, B_LYS_26 | 2.77 | 2.03 | 27.77 |
| 4ZGH | OXT, B_GLY_37 | NE1, B_TRP_31 | HE1, B_TRP_31 | 2.92 | 2.09 | 12.63 |
Table 4.
Interfacial Salt bridging screening for two GLP-1-GLP-1R complex structures (PDB IDs: 3IOL [17,18] and 4ZGM [19,36]). In this table, the residue naming scheme is Chain ID_residue name_residue number.
| PDB ID | Residue A | Atom A | Residue B | Atom B | Distance (Å) |
|---|---|---|---|---|---|
| 3IOH | B_LYS_26 | NZ | A_GLU_128 | OE1 | 3.212 |
| 3IOH | B_LYS_26 | NZ | A_GLU_128 | OE2 | 2.924 |
| 4ZGH | B_LYS_26 | NZ | A_GLU_128 | OE1 | 3.409 |
| 4ZGH | B_LYS_26 | NZ | A_GLU_128 | OE2 | 2.771 |
Table 5.
3IOH-specific side chain hydrogen bonding analysis. In this table, the residue naming scheme is Chain ID_residue name_residue number, represents the angle formed by acceptor (A), donor (D) and hydrogen (H) .
Table 5.
3IOH-specific side chain hydrogen bonding analysis. In this table, the residue naming scheme is Chain ID_residue name_residue number, represents the angle formed by acceptor (A), donor (D) and hydrogen (H) .
| PDB | Acceptor (A) | Donor (D) | Hydrogen (H) | D-A (Å) | H-A (Å) | |
| 3IOH | OE1, A_GLU_41 | NE, A_ARG_44 | HE, A_ARG_44 | 2.87 | 1.87 | 4.40 |
| 3IOH | OE2, A_GLU_41 | NH2, A_ARG_44 | HH21, A_ARG_44 | 2.81 | 1.86 | 15.77 |
| 3IOH | OE2, A_GLU_41 | NE2, A_GLN_45 | HE21, A_GLN_45 | 2.80 | 1.81 | 7.74 |
| 3IOH | OD2, A_ASP_74 | NH2, A_ARG_64 | HH22, A_ARG_64 | 2.78 | 1.78 | 5.75 |
| 3IOH | OD2, A_ASP_67 | NE1, A_TRP_72 | HE1, A_TRP_72 | 2.69 | 1.83 | 24.82 |
| 3IOH | OE2, A_GLU_125 | OH, A_TYR_101 | HH, A_TYR_101 | 2.63 | 1.69 | 8.92 |
| 3IOH | OD2, A_ASP_67 | NH1, A_ARG_121 | HH12, A_ARG_121 | 2.96 | 2.09 | 25.64 |
| 3IOH | OD1, A_ASP_122 | OG, A_SER_124 | HG, A_SER_124 | 2.65 | 1.73 | 12.69 |
Table 6.
4ZGH-specific side chain hydrogen bonding analysis. In this table, the residue naming scheme is Chain ID_residue name_residue number, represents the angle formed by acceptor (A), donor (D) and hydrogen (H) .
Table 6.
4ZGH-specific side chain hydrogen bonding analysis. In this table, the residue naming scheme is Chain ID_residue name_residue number, represents the angle formed by acceptor (A), donor (D) and hydrogen (H) .
| PDB | Acceptor (A) | Donor (D) | Hydrogen (H) | D-A (Å) | H-A (Å) | |
| 4ZGH | OE1, A_GLU_41 | NE, A_ARG_44 | HE, A_ARG_44 | 2.92 | 2.08 | 10.96 |
| 4ZGH | OE2, A_GLU_41 | NH2, A_ARG_44 | HH21, A_ARG_44 | 2.75 | 1.91 | 11.18 |
| 4ZGH | OE2, A_GLU_41 | NE2, A_GLN_45 | HE21, A_GLN_45 | 2.99 | 2.14 | 5.73 |
| 4ZGH | OD1, A_ASP_74 | NE, A_ARG_64 | HE, A_ARG_64 | 2.97 | 2.12 | 3.34 |
| 4ZGH | OD2, A_ASP_74 | NH2, A_ARG_64 | HH21, A_ARG_64 | 2.83 | 1.98 | 7.04 |
| 4ZGH | OD2, A_ASP_67 | NE1, A_TRP_72 | HE1, A_TRP_72 | 2.80 | 2.02 | 20.99 |
| 4ZGH | OE2, A_GLU_125 | OH, A_TYR_101 | HH, A_TYR_101 | 2.82 | 1.99 | 6.37 |
| 4ZGH | OD2, A_ASP_67 | NH1, A_ARG_121 | HH11, A_ARG_121 | 2.95 | 2.17 | 20.60 |
| 4ZGH | OD1, A_ASP_122 | OG, A_SER_124 | HG, A_SER_124 | 2.67 | 1.91 | 21.21 |
| 4ZGH | OE2, A_GLU_128 | NZ, B_LYS_26 | HZ2, B_LYS_26 | 2.77 | 2.03 | 27.77 |
| 4ZGH | OXT, B_GLY_37 | NE1, B_TRP_31 | HE1, B_TRP_31 | 2.92 | 2.09 | 12.63 |
Table 7.
4ZGH-specific interfacial side chain hydrogen bonding analysis, the residue naming scheme is Chain ID_residue name_residue number, represents the angle formed by acceptor (A), donor (D) and hydrogen (H) .
Table 7.
4ZGH-specific interfacial side chain hydrogen bonding analysis, the residue naming scheme is Chain ID_residue name_residue number, represents the angle formed by acceptor (A), donor (D) and hydrogen (H) .
| PDB | Acceptor (A) | Donor (D) | Hydrogen (H) | D-A (Å) | H-A (Å) | |
| 4ZGH | OE2, A_GLU_128 | NZ, B_LYS_26 | HZ2, B_LYS_26 | 2.77 | 2.03 | 27.77 |
Table 8.
Salt bridging screening with the new criteria as defined in the section of Materials and Methods for two GLP-1-GLP-1R complex structures (PDB IDs: 3IOL [17,18] and 4ZGM [19,36]). In this table, the residue naming scheme is Chain ID_residue name_residue number.
| PDB ID | Residue A | Atom A | Residue B | Atom B | Distance (Å) |
|---|---|---|---|---|---|
| 3IOH | A_LYS_38 | NZ | A_GLU_34 | OE1 | 5.019 |
| 3IOH | A_LYS_38 | NZ | A_GLU_34 | OE2 | 5.563 |
| 3IOH | A_ARG_43 | NH1 | A_GLU_68 | OE1 | 5.108 |
| 3IOH | A_ARG_44 | NH1 | A_GLU_41 | OE1 | 5.031 |
| 3IOH | A_ARG_44 | NH1 | A_GLU_41 | OE2 | 4.860 |
| 3IOH | A_ARG_44 | NH2 | A_GLU_41 | OE1 | 3.682 |
| 3IOH | A_ARG_44 | NH2 | A_GLU_41 | OE2 | 2.811 |
| 3IOH | A_ARG_48 | NH1 | A_GLU_41 | OE2 | 5.664 |
| 3IOH | A_ARG_64 | NH1 | A_ASP_53 | OD1 | 5.728 |
| 3IOH | A_ARG_64 | NH1 | A_ASP_53 | OD2 | 4.864 |
| 3IOH | A_ARG_64 | NH1 | A_ASP_74 | OD1 | 5.246 |
| 3IOH | A_ARG_64 | NH1 | A_ASP_74 | OD2 | 4.902 |
| 3IOH | A_ARG_64 | NH2 | A_ASP_53 | OD2 | 5.347 |
| 3IOH | A_ARG_64 | NH2 | A_ASP_74 | OD1 | 3.801 |
| 3IOH | A_ARG_64 | NH2 | A_ASP_74 | OD2 | 2.782 |
| 3IOH | A_HIS_99 | ND1 | A_GLU_125 | OE1 | 4.292 |
| 3IOH | A_HIS_99 | ND1 | A_GLU_125 | OE2 | 5.603 |
| 3IOH | A_ARG_102 | NH1 | A_ASP_67 | OD1 | 4.865 |
| 3IOH | A_ARG_102 | NH1 | A_ASP_67 | OD2 | 3.054 |
| 3IOH | A_ARG_102 | NH2 | A_ASP_67 | OD2 | 5.183 |
| 3IOH | A_ARG_121 | NH1 | A_ASP_67 | OD1 | 3.519 |
| 3IOH | A_ARG_121 | NH1 | A_ASP_67 | OD2 | 2.959 |
| 3IOH | A_ARG_121 | NH2 | A_ASP_67 | OD1 | 5.721 |
| 3IOH | A_ARG_121 | NH2 | A_ASP_67 | OD2 | 5.061 |
| 3IOH | B_LYS_26 | NZ | A_GLU_128 | OE1 | 3.212 |
| 3IOH | B_LYS_26 | NZ | A_GLU_128 | OE2 | 2.924 |
| 4ZGH | A_LYS_38 | NZ | A_GLU_34 | OE1 | 3.823 |
| 4ZGH | A_LYS_38 | NZ | A_GLU_34 | OE2 | 5.820 |
| 4ZGH | A_ARG_43 | NH1 | A_GLU_68 | OE1 | 5.144 |
| 4ZGH | A_ARG_44 | NH1 | A_GLU_41 | OE1 | 5.098 |
| 4ZGH | A_ARG_44 | NH1 | A_GLU_41 | OE2 | 4.740 |
| 4ZGH | A_ARG_44 | NH2 | A_GLU_41 | OE1 | 3.861 |
| 4ZGH | A_ARG_44 | NH2 | A_GLU_41 | OE2 | 2.747 |
| 4ZGH | A_ARG_48 | NH1 | A_GLU_41 | OE2 | 5.698 |
| 4ZGH | A_ARG_64 | NH1 | A_ASP_53 | OD1 | 5.693 |
| 4ZGH | A_ARG_64 | NH1 | A_ASP_53 | OD2 | 4.947 |
| 4ZGH | A_ARG_64 | NH1 | A_ASP_74 | OD1 | 5.111 |
| 4ZGH | A_ARG_64 | NH1 | A_ASP_74 | OD2 | 4.906 |
| 4ZGH | A_ARG_64 | NH2 | A_ASP_53 | OD2 | 5.424 |
| 4ZGH | A_ARG_64 | NH2 | A_ASP_74 | OD1 | 3.779 |
| 4ZGH | A_ARG_64 | NH2 | A_ASP_74 | OD2 | 2.832 |
| 4ZGH | A_HIS_99 | ND1 | A_GLU_125 | OE1 | 4.316 |
| 4ZGH | A_HIS_99 | ND1 | A_GLU_125 | OE2 | 5.690 |
| 4ZGH | A_ARG_102 | NH1 | A_ASP_67 | OD1 | 4.996 |
| 4ZGH | A_ARG_102 | NH1 | A_ASP_67 | OD2 | 3.198 |
| 4ZGH | A_ARG_102 | NH2 | A_ASP_67 | OD2 | 5.343 |
| 4ZGH | A_ARG_121 | NH1 | A_ASP_67 | OD1 | 3.561 |
| 4ZGH | A_ARG_121 | NH1 | A_ASP_67 | OD2 | 2.953 |
| 4ZGH | A_ARG_121 | NH2 | A_ASP_67 | OD1 | 5.760 |
| 4ZGH | A_ARG_121 | NH2 | A_ASP_67 | OD2 | 5.107 |
| 4ZGH | B_LYS_26 | NZ | A_GLU_128 | OE1 | 3.409 |
| 4ZGH | B_LYS_26 | NZ | A_GLU_128 | OE2 | 2.771 |
| 4ZGH | B_ARG_34 | NH1 | B_GLU_27 | OE1 | 5.552 |
| 4ZGH | B_ARG_34 | NH2 | B_GLU_27 | OE1 | 5.072 |
| 4ZGH | B_ARG_36 | NH1 | A_GLU_68 | OE1 | 4.147 |
| 4ZGH | B_ARG_36 | NH1 | A_GLU_68 | OE2 | 4.835 |
| 4ZGH | B_ARG_36 | NH2 | A_GLU_68 | OE1 | 4.893 |
Table 9.
Interfacial salt bridging screening with the new criteria as defined in the section of Materials and Methods for two GLP-1-GLP-1R complex structures (PDB IDs: 3IOL [17,18] and 4ZGM [19,36]). In this table, the residue naming scheme is Chain ID_residue name_residue number.
| PDB ID | Residue A | Atom A | Residue B | Atom B | Distance (Å) |
|---|---|---|---|---|---|
| 3IOH | B_LYS_26 | NZ | A_GLU_128 | OE1 | 3.212 |
| 3IOH | B_LYS_26 | NZ | A_GLU_128 | OE2 | 2.924 |
| 4ZGH | B_LYS_26 | NZ | A_GLU_128 | OE1 | 3.409 |
| 4ZGH | B_LYS_26 | NZ | A_GLU_128 | OE2 | 2.771 |
| 4ZGH | B_ARG_36 | NH1 | A_GLU_68 | OE1 | 4.147 |
| 4ZGH | B_ARG_36 | NH1 | A_GLU_68 | OE2 | 4.835 |
| 4ZGH | B_ARG_36 | NH2 | A_GLU_68 | OE1 | 4.893 |
Table 10.
3IOH-specific side chain hydrogen bonding analysis with the new criteria as defined in the section of Materials and Methods. In this table, the residue naming scheme is Chain ID_residue name_residue number, represents the angle formed by acceptor (A), donor (D) and hydrogen (H) .
Table 10.
3IOH-specific side chain hydrogen bonding analysis with the new criteria as defined in the section of Materials and Methods. In this table, the residue naming scheme is Chain ID_residue name_residue number, represents the angle formed by acceptor (A), donor (D) and hydrogen (H) .
| PDB | Acceptor (A) | Donor (D) | Hydrogen (H) | D-A (Å) | H-A (Å) | |
| 3IOH | OE1, A_GLU_41 | NE, A_ARG_44 | HE, A_ARG_44 | 2.87 | 1.87 | 4.40 |
| 3IOH | OE2, A_GLU_41 | NH2, A_ARG_44 | HH21, A_ARG_44 | 2.81 | 1.86 | 15.77 |
| 3IOH | OE2, A_GLU_41 | NE2, A_GLN_45 | HE21, A_GLN_45 | 2.80 | 1.81 | 7.74 |
| 3IOH | OD2, A_ASP_74 | NH2, A_ARG_64 | HH22, A_ARG_64 | 2.78 | 1.78 | 5.75 |
| 3IOH | OD2, A_ASP_67 | NE1, A_TRP_72 | HE1, A_TRP_72 | 2.69 | 1.83 | 24.82 |
| 3IOH | OE2, A_GLU_125 | OH, A_TYR_101 | HH, A_TYR_101 | 2.63 | 1.69 | 8.92 |
| 3IOH | OD2, A_ASP_67 | NH1, A_ARG_121 | HH12, A_ARG_121 | 2.96 | 2.09 | 25.64 |
| 3IOH | OD1, A_ASP_122 | OG, A_SER_124 | HG, A_SER_124 | 2.65 | 1.73 | 12.69 |
Table 11.
4ZGH-specific side chain hydrogen bonding analysis with the new criteria as defined in the section of Materials and Methods. In this table, the residue naming scheme is Chain ID_residue name_residue number, represents the angle formed by acceptor (A), donor (D) and hydrogen (H) .
Table 11.
4ZGH-specific side chain hydrogen bonding analysis with the new criteria as defined in the section of Materials and Methods. In this table, the residue naming scheme is Chain ID_residue name_residue number, represents the angle formed by acceptor (A), donor (D) and hydrogen (H) .
| PDB | Acceptor (A) | Donor (D) | Hydrogen (H) | D-A (Å) | H-A (Å) | |
| 4ZGH | OE1, A_GLU_41 | NE, A_ARG_44 | HE, A_ARG_44 | 2.92 | 2.08 | 10.96 |
| 4ZGH | OE2, A_GLU_41 | NH2, A_ARG_44 | HH21, A_ARG_44 | 2.75 | 1.91 | 11.18 |
| 4ZGH | OE2, A_GLU_41 | NE2, A_GLN_45 | HE21, A_GLN_45 | 2.99 | 2.14 | 5.73 |
| 4ZGH | OD1, A_ASP_74 | NE, A_ARG_64 | HE, A_ARG_64 | 2.97 | 2.12 | 3.34 |
| 4ZGH | OD2, A_ASP_74 | NH2, A_ARG_64 | HH21, A_ARG_64 | 2.83 | 1.98 | 7.04 |
| 4ZGH | OD2, A_ASP_67 | NE1, A_TRP_72 | HE1, A_TRP_72 | 2.80 | 2.02 | 20.99 |
| 4ZGH | OE2, A_GLU_125 | OH, A_TYR_101 | HH, A_TYR_101 | 2.82 | 1.99 | 6.37 |
| 4ZGH | OD2, A_ASP_67 | NH1, A_ARG_121 | HH11, A_ARG_121 | 2.95 | 2.17 | 20.60 |
| 4ZGH | OD1, A_ASP_122 | OG, A_SER_124 | HG, A_SER_124 | 2.67 | 1.91 | 21.21 |
| 4ZGH | OE2, A_GLU_128 | NZ, B_LYS_26 | HZ2, B_LYS_26 | 2.77 | 2.03 | 27.77 |
| 4ZGH | OXT, B_GLY_37 | NE1, B_TRP_31 | HE1, B_TRP_31 | 2.92 | 2.09 | 12.63 |
Table 12.
3IOH-specific interfacial side chain hydrogen bonding analysis with the new criteria as defined in the section of Materials and Methods. In this table, the residue naming scheme is Chain ID_residue name_residue number, represents the angle formed by acceptor (A), donor (D) and hydrogen (H) .
| PDB | Acceptor (A) | Donor (D) | Hydrogen (H) | D-A (Å) | H-A (Å) | |
| 3IOH | OG1, A_THR_29 | OG, B_SER_18 | HG, B_SER_18 | 3.26 | 2.42 | 24.61 |
| 3IOH | OE1, A_GLU_128 | NZ, B_LYS_26 | HZ1, B_LYS_26 | 3.21 | 2.54 | 41.12 |
| 3IOH | OE2, A_GLU_128 | NZ, B_LYS_26 | HZ1, B_LYS_26 | 2.92 | 2.28 | 42.31 |
Table 13.
4ZGH-specific interfacial side chain hydrogen bonding analysis with the new criteria as defined in the section of Materials and Methods. In this table, the residue naming scheme is Chain ID_residue name_residue number, represents the angle formed by acceptor (A), donor (D) and hydrogen (H) .
| PDB | Acceptor (A) | Donor (D) | Hydrogen (H) | D-A (Å) | H-A (Å) | |
| 4ZGH | OE1, A_GLU_128 | NZ, B_LYS_26 | HZ2, B_LYS_26 | 3.41 | 2.69 | 31.93 |
| 4ZGH | OE2, A_GLU_128 | NZ, B_LYS_26 | HZ2, B_LYS_26 | 2.77 | 2.03 | 27.77 |
| 4ZGH | OE1, A_GLU_68 | NE, B_ARG_36 | HE, B_ARG_36 | 2.75 | 2.13 | 37.73 |
| 4ZGH | OE2, A_GLU_68 | NE, B_ARG_36 | HE, B_ARG_36 | 4.14 | 3.30 | 9.50 |
| 4ZGH | OE2, A_GLU_68 | NH1, B_ARG_36 | HH11, B_ARG_36 | 4.83 | 4.13 | 31.95 |
Disclaimer/Publisher’s Note: The statements, opinions and data contained in all publications are solely those of the individual author(s) and contributor(s) and not of MDPI and/or the editor(s). MDPI and/or the editor(s) disclaim responsibility for any injury to people or property resulting from any ideas, methods, instructions or products referred to in the content. |
© 2024 by the authors. Licensee MDPI, Basel, Switzerland. This article is an open access article distributed under the terms and conditions of the Creative Commons Attribution (CC BY) license (http://creativecommons.org/licenses/by/4.0/).
Copyright: This open access article is published under a Creative Commons CC BY 4.0 license, which permit the free download, distribution, and reuse, provided that the author and preprint are cited in any reuse.


