Submitted:
23 February 2024
Posted:
26 February 2024
You are already at the latest version
Abstract
Analysis of complex DNA mixtures is limited by the selected genetic markers characterized and assay technology. Small panels of short tandem repeats (STRs) are the current standards in most countries. Extension of STRs with hundreds of single nucleotide polymorphisms (SNPs) is now commercially available. The current set of extension SNPs focus on phenotypic and biogeographic ancestry informative SNPs. Larger panels with thousands of SNPs have been developed that can identify up to 10 contributors to forensic DNA samples. Herein, multiple sets of SNPs were selected with the focus of increasing the upper limit of detectable contributors. Larger SNP panel sets with lower minor allele frequency (MAF) alleles can detect large numbers of contributors to in silico mixtures of randomly selected profiles from the 1,000 Genomes project. These results provide a path to enable characterization of complex DNA mixtures that are currently impossible to analyse.
Keywords:
DNA mixture
; single nucleotide polymorphism
; mixture analysis
; high throughput sequencing
; massively parallel sequencing
; SNP panels
Introduction
DNA mixture analysis can identify up to four and rarely more contributors to complex DNA mixtures with STR panels. As the number of mixture contributors increases, a mixture starts to ‘saturate’ as mixture alleles have increased profile allele matches with non-contributor profiles1. The application of SNPs to enhance complex mixture interpretation was proposed by Voskoboinik and Darvasi2. A panel of 2,311 SNPs, with selected target minor allele frequencies of 0.05, has identified up to and including 10 contributors from an experimentally controlled touched samples3. Applying the TranslucentID method to a saturated mixture with 15 contributors enabled the identification of 12 of these contributors with the 2,311 SNP panel1. Targeting SNP polymorphic microhaplotypes enabled identification of up to five contributors in DNA mixtures4. High throughput sequencing of SNPs can be applied to small amounts of DNA from forensic samples3. High-density SNP genotyping microarrays provide an alternative technology for characterizing forensic samples5. Increasing the number of contributors that can be identified from complex DNA mixture samples will enable identifying contributors in forensic cases with multiple contributors.
Statistical analysis of forensic samples is key to identification of mixture contributors and excluding non-contributors. Likelihood ratio calculations and probabilistic genotyping methods are applied to STR mixtures. Tools like EuroForMix6 can be applied to STR mixtures and SNP mixtures with lower number of SNP loci; the computational time required increases as the number of candidate contributors increases. Likelihood ratio calculations required hours for panels of hundreds of SNPs and multiple contributors7; the compute time for current likelihood ratio implementations is currently prohibitive for samples with thousands and tens of thousands of SNP loci. For complex mixtures with large number of SNP loci and/or number of contributors, a computationally efficient method for calculating the probability of random man (person) not excluded, PRMNE8, 9, has been refined and described herein.
Expanding the number of SNP loci with different target minor allele frequencies could increase the number of contributors that can be identified in complex DNA mixtures. Contributors to forensic samples representing 0.5% or more of the forensic sample DNA can be identified by SNP panel sequencing3. Herein, equimolar samples are generated to test increasing numbers of contributors. Leveraging available genetic profiles in the 1,000 genomes project10, reference profiles of millions of SNPs were extracted for ‘rs’ named genetic loci. An in silico equimolar mixture series of millions of SNPs was created by combining from 10 to 50 randomly selected SNP profiles. Thirty SNP panels were designed with target MAF of 0.01, 0.02, …, 0.05 for 5K, 10K, …, 30K SNPs; these panels each characterize small subsets of the SNPs for the reference and mixture profiles. As anticipated, SNP panels with MAFs 0.01 and 0.02 enabled identification of larger numbers of contributors across the mixture series. Large SNP panels with these lower MAFs have the potential of identifying the majority or all of the contributors to complex DNA mixture samples.
Materials and Methods
For each profile, millions of SNPs with ‘rs’ names were extracted from 2,503 profiles from the 1,000 genomes project10. The custom Ruby program vcf_profiles.rb was used to create SNP reference profiles from 1,000 genomes project VCF files. Reference sequences and minor allele frequency were downloaded from dbSNP11. Chromosome and locus position information were leveraged from the 1,000 Genomes VCF profiles. SNP panels were selected with spacing selected to spread selected SNPs relatively evenly across human autosomes. The minimum genomic distance between candidate SNPs considered are 5K: 450,000 base pairs (bp), 10K: 220,000 bp, 15K: 160,000 bp, 20K: 110,000 bp, 25K: 90,000 bp, and 30K: 80,000 bp. These distances were approximated by dividing the length of the autosomes 2.867 billion bp and decreasing to increase the number of SNPs selected to be closer to the target number of SNPs for most of the target MAFs. The custom Ruby program make_mixtures.rb was used to create equimolar mixtures with 10, 12, …, 50 contributors randomly selected from the SNP reference profiles; these mixtures combine the millions of SNP alleles from the selected reference profiles.
SNP Panel Designs
SNP panels with target numbers of up to 5K, 10K, 15K, 20K, 25K, and 30K loci were selected by spacing SNPs across human autosomes with the custom Ruby select_snps.rb program. The five target MAF were 0.01, 0.02, 0.03, 0.04, and 0.05 with MAFs. SNPs with minor allele frequency of plus or minus 0.005 were considered (e.g., for target MAF of 0.01, the SNPs with MAF in (0.005 to 0.015) were candidates). A total of 30 SNP panels were generated. The custom Ruby program fasta_extract.rb was used to create SNP panel FASTA files for each SNP panel. The program extracts the target SNP loci by name from a dbSNP FASTA file for each of the 30 SNP panels created.
Linkage Disequilibrium
Linkage information was pulled from NCBI LDlink12 for adjacent pairs of SNPs. The custom Ruby program ldpair.rb creates a command file to query NCBI LDlink for linkage disequilibrium information between two nearby SNPs. The linkage disequilibrium (LD) for a panel is defined by equation 1 by summing the D’ values for nearest SNP pairs.
Probability of Random Man (Person) Not Excluded – P(RMNE)
Let N represent the number of mixture loci with no called minor alleles. Let q be the average minor allele ratio of these loci. Let p be defined as 1 – q such that p + q = 1. For autosomes with two SNP alleles at a locus, the probability for these alleles can be represented as (p+q)2 = p2 + 2pq + q2 = 1. Subtracting p2 from each side of the equation yields: q2 + 2pq = 1 - p2. Let K be the ratio of one (major:minor) or two minor alleles (minor:minor) to two major alleles (major:major), equation 2:
One or more allele mismatches, i, can occur between a reference profile and a mixture profile. These mismatches can be represented by the combination equation 3:
The probability of random man not excluded, PRMNE, for a mixture compared to a reference profile with L mismatches can be represented as equation 4:
For no mismatches, PRMNE (0) simplifies to equation 5:
For one mismatch, PRMNE (1) simplifies to equation 6:
To simplify computations for L and L+1 mismatches, the PRMNE (L+1) formula (8) can be defined recursively in leveraging PRMNE (L) equation (7):
IdPrism Data Analysis
The 30 SNP panels were loaded into IdPrism. For each SNP panel, the equimolar SNP mixtures were loaded as mixture samples in IdPrism. The SNP pair-wise linkage disequilibrium D’ values were loaded into IdPrism for each SNP panel. SNPs in the mixture samples not included in each SNP panel are ignored. For each SNP mixture, the included reference profiles were each loaded as reference samples in IdPrism for each of the 30 SNP panels. Reference profiles for other mixtures not included in a mixture function as non-contributor reference samples. By chance, some references were randomly included in more than one mixture. Like mixtures, SNPs in the reference samples not included in each SNP panel are ignored. FastID13, integrated into IdPrism, was used to compare mixture and reference samples.
Results
Linkage disequilibrium information was available for the majority of the SNP pairs; sometimes the LDlink results indicated an ‘Internal server error’ or a small number of SNPs were not in dbSNP build 155 (GRCh37); this effected number of SNP pairs between 0.2 – 0.3% of the panel loci. Due to the minimum genomic distance specified and the available SNPs, less than the target number of SNPs were selected automatically for a subset of the SNP panels: M15K05: 13,750, M20K05: 18,008, M25K05: 20,447, M30K03: 29,940, M30K04: 28,590, and M30K05: 21,947 loci.
Analysis of each mixture only identified known contributors for the results summarized herein. By chance, a few reference samples were randomly selected for two or more mixtures. While loading the reference profiles for each mixture, before the set of corresponding contributor reference profiles were loaded into IdPrism, any repeated references that were loaded as a reference were detected as contributors (the IdPrism system supports multiple reference profiles for contributors).
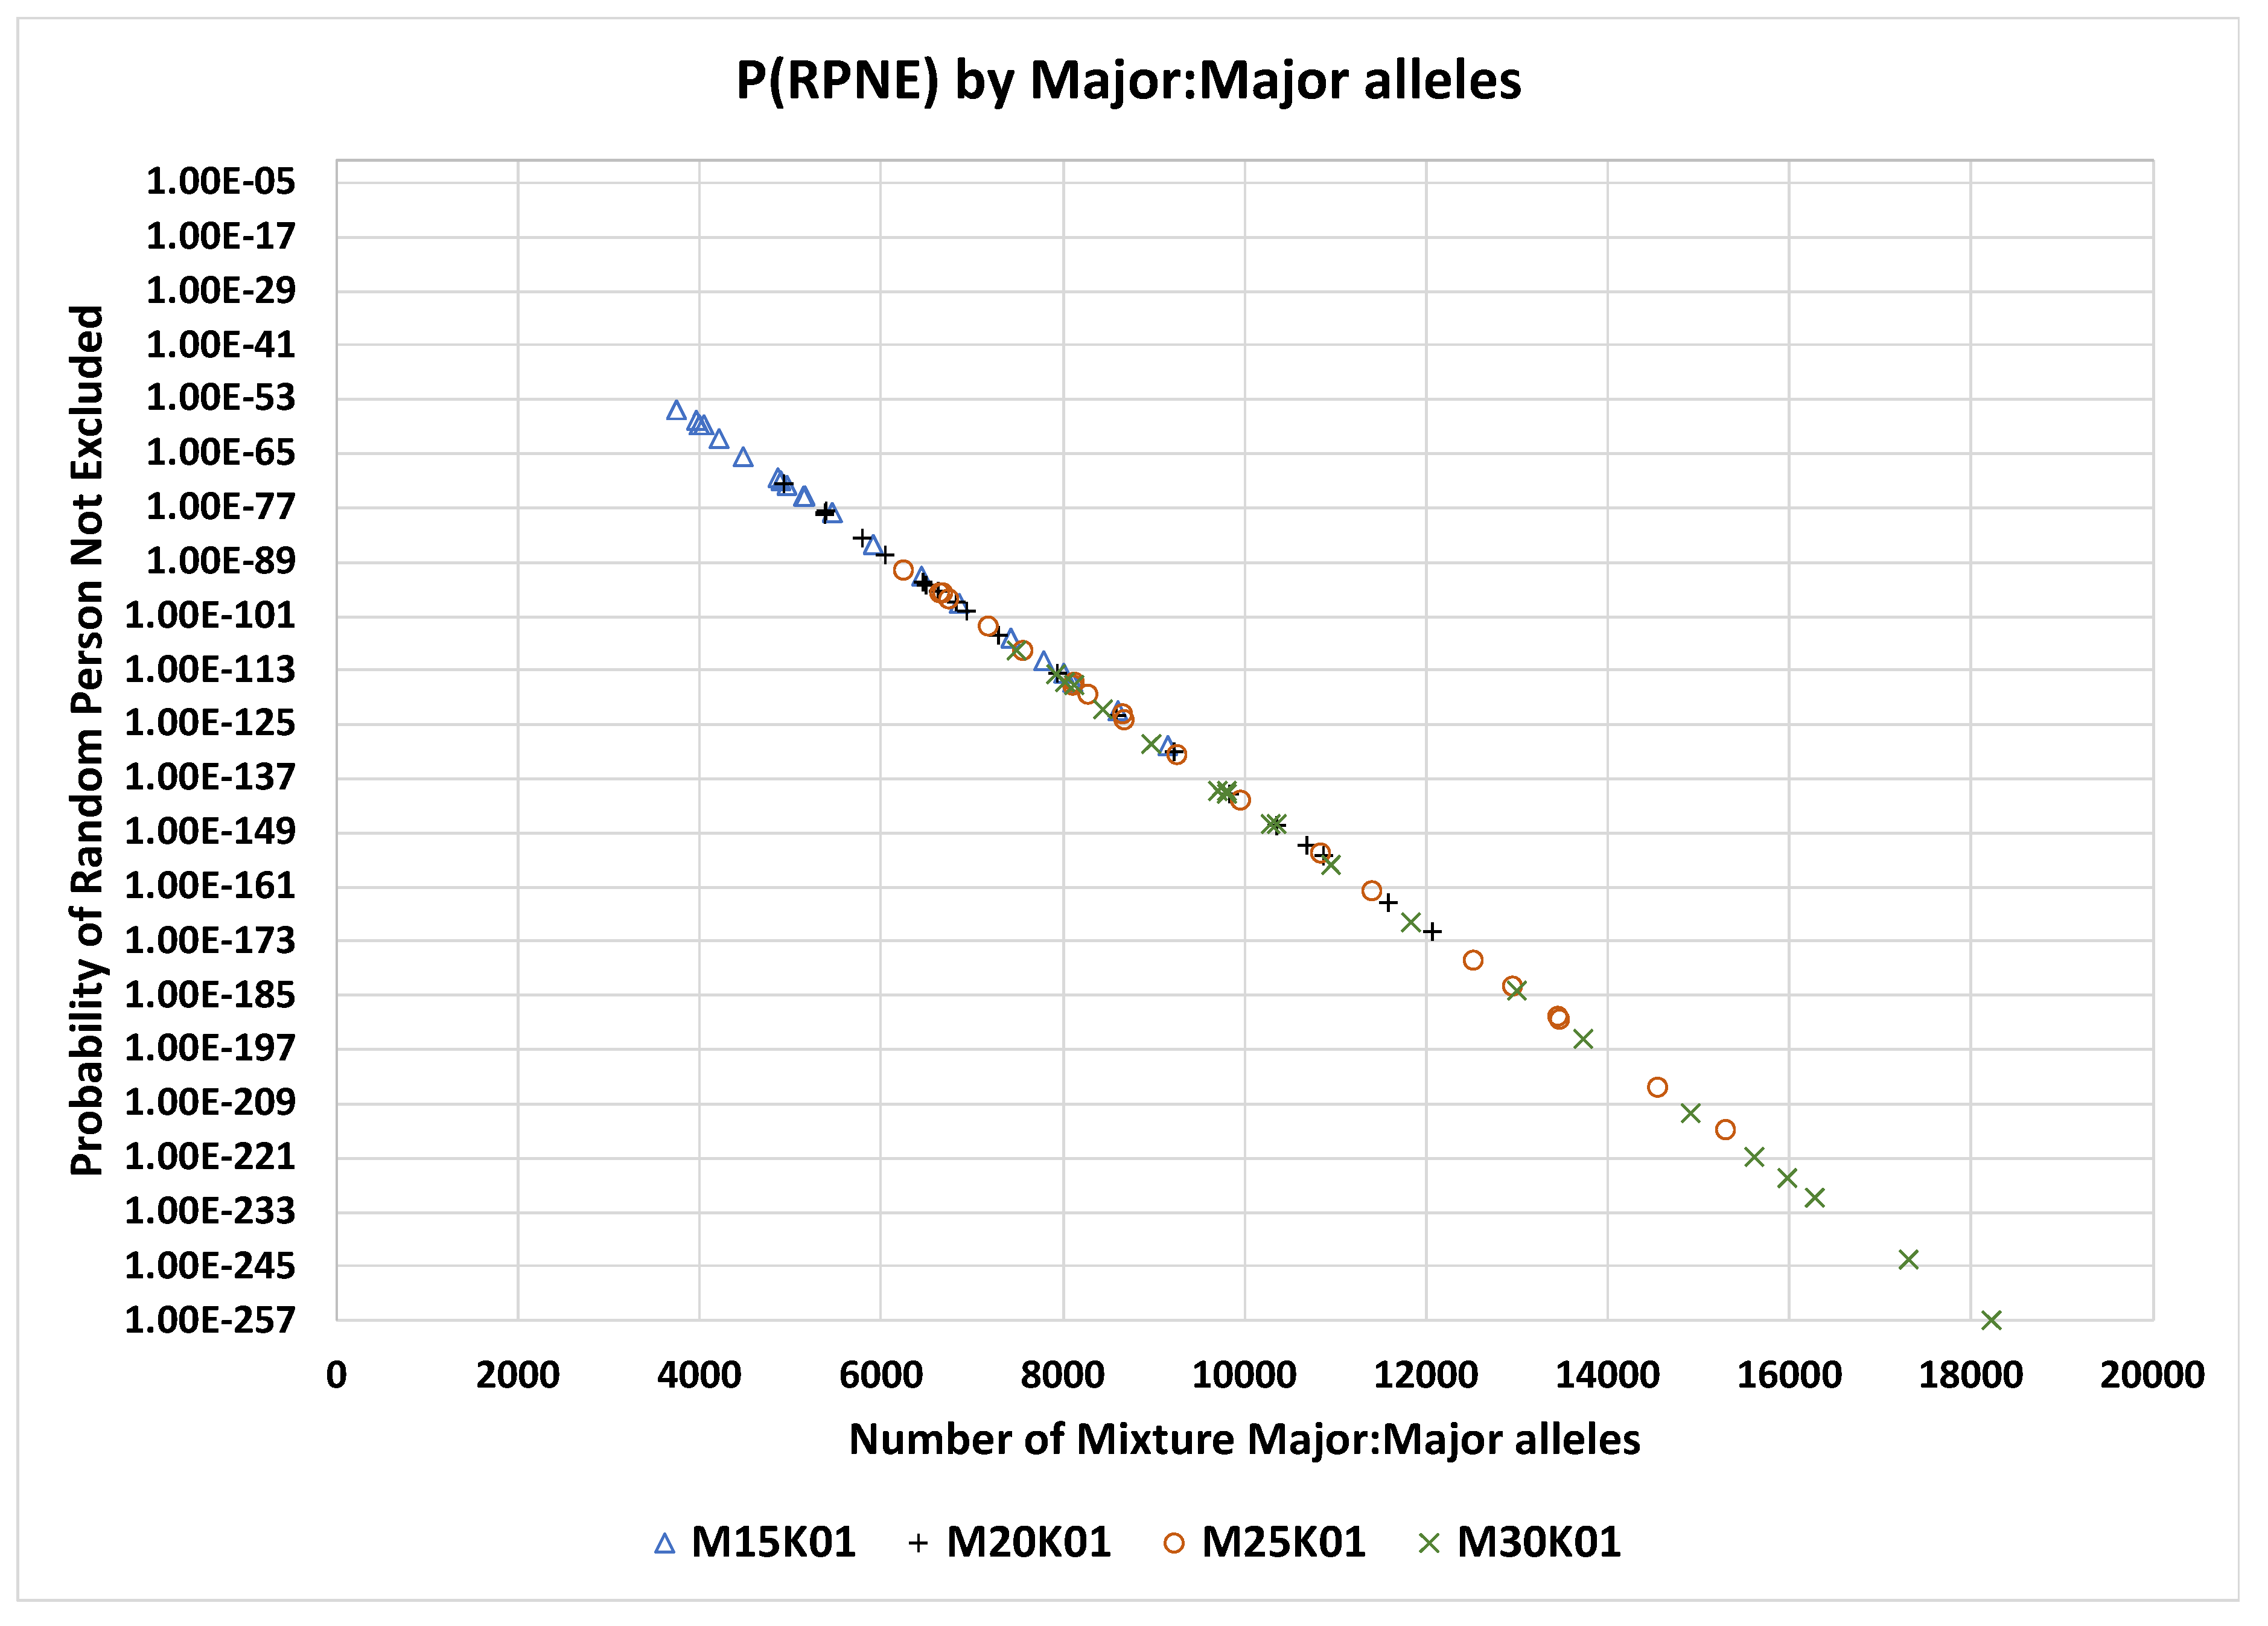
Two parameters were examined for limiting the number of contributors to complex DNA mixtures: (1) number of SNP loci and (2) SNP panel target MAF. The 0.05 MAF panels enabled the detection of 10 or 10, 12 of 12, 14 of 14, and 16 of 16 contributors for 5K SNPs, and 10 of 10, 12 of 12, 14 of 14, 16 of 16, and 18 of 18 contributors for 10K, 15K, 20K, 25K, and 30K SNP panels (Figure 1). The 0.04 MAF panels could identify from 10 of 10, 12 of 12, …, 20 of 20 contributors for 5K to 30K SNP panels (Figure 1). The 0.03 MAF panels could identify up to 10 of 10, 12 of 12, …, 20 of 20 contributors for 5K and additional 22 of 22, 24 of 24, 26 of 26, and 28 of 28 contributors for 10K to 30K SNP panels (Figure 1). The 0.02 MAF panels could identify up to 10 of 10, 12 of 12, ..., 30 of 30 contributors for 5K to 20K SNP panels and additional 32 of 32, 34 of 34, 36 of 36, and 38 of 38 contributors for 25K and 30K SNP panels (Figure 1). The 0.01 MAF panels could identify up to 10 of 10, 12 of 12, …, 44 of 44 contributors for 5K panel and 46 of 46 and 48 of 48 for 10K, and up to 50 of 50 for 15K, 20K, 25K, and 30K SNP panels (Figure 1). The PRMNE is plotted against the number of major:major SNPs in each mixture for all mixtures from 2 to 50 contributors for the 0.01 MAF panels 15K, 20K, 25K, and 30K (Figure 2).
Discussion
Analysis of complex DNA mixtures is a difficult task for current DNA forensic methods. As the number of contributors to complex DNA mixtures increases, the number of alleles matching non-contributor profiles also increases. Sequencing SNP microhaplotypes is an option for increasing the number of contributors in a mixture that can be characterized4. A 0.05 MAF SNP panel of 2,311 loci has identified up to and including 10 touch contributors in complex DNA mixtures3. This article considers possible SNP panel design changes to increase the number of contributors to complex DNA mixtures beyond the 10 identified contributors currently achieved. SNP panels with 5K, 10K, …, 30K loci were designed with target MAF of 0.01, 0.02, 0.03, 0.04, and 0.05 for each of the panel sizes. Reference profiles of millions of SNPs were extracted from the available 1,000 Genomes Project profiles. Randomly selected reference profiles were combined to create equimolar in silico mixtures of 10, 12, …, 50 contributors. The designed 30 SNP panels were able to identify from 16 to 50 contributors (Figure 1). The major:major SNPs in mixture profiles enable the exclusion of non-contributors; non-contributors with minor alleles are these SNP loci enable the differentiation between mixture contributors and non-contributors.
One of the considerations for designing SNP panels is the statistical correction for linkage disequilibrium between linked SNP loci. For adjacent pairs of SNPs, linkage disequilibrium information was pulled from NIH LDlink site12. For pairs of SNPs with the highest linkage disequilibrium of D’ = 1.0, the PRMNE formula effectively treats these as only one SNP not two (i.e., the N-LD term in the formula). The PRMNE values for the 0.01 MAF SNP panels 15K, 20K, 25K, and 30K are illustrated in Figure 2 for all analysed mixtures for these panels. An example mixture is illustrated in Figure 3 for the 0.01 MAF 15K SNP panel with 50 identified contributors; contributor sample, HG03195 is selected with the graph illustrating PRMNE with example increasing number of allele mismatches (Figure 3). Likewise, the estimated concentrations for the 50 identify contributors for the larger 25K SNP panel are illustrated in Figure 4 with contributor HG03112 selected. These results provide a roadmap for designing SNP panels and hybrid STR and SNP panels for characterizing complex DNA mixtures. The lower limit of detection of contributors within complex DNA mixtures is a parameter of the instrument sequencing error rate. Current SNP panels can detect contributors down to between 0.25% to 0.5%14. The 0.01 MAF and 0.02 MAF panels or a combination of them have the potential to identify the majority of the contributors to complex DNA mixtures involving large numbers of contributors.
Figure 2.
PRMNE by number of mixture major:major alleles for MAF 0.01 panels 15K, 20K, 25K, and 30K SNPs.
Figure 2.
PRMNE by number of mixture major:major alleles for MAF 0.01 panels 15K, 20K, 25K, and 30K SNPs.
Summary
Most forensic samples with multiple contributors remain uncharacterized. High throughput sequencing of large SNP panels can identify large number of contributors to complex DNA mixtures. The 0.01 and 0.02 MAF SNP panels provide a framework for designing SNP panels for characterizing complex DNA mixtures. The 30 SNP panels, reference profiles, and in silico mixtures are provided as open data: https://doi.org/10.7910/DVN/DJW92T.
Acknowledgements
DISTRIBUTION STATEMENT A. Approved for public release. Distribution is unlimited. This material is based upon work supported by the Department of the Air Force under Air Force Contract No. FA8702-15-D-0001. Any opinions, findings, conclusions or recommendations expressed in this material are those of the authors) and do not necessarily reflect the views of the Department of the Air Force.
Competing Interests
IdPrism and FastID are included in the patent “Ricke, D. O. et al. Systems and Methods for Genetic Identification and Analysis. International Patent Application US Patent No. 11,655,498 (2023, May 23)”.
References
- Ricke DO, Watkins J, Fremont-Smith P, Petrovick MS, Boettcher T, Schwoebel E. Translucentid: Analysis of complex DNA snp mixtures with large numbers of donors. Australian Journal of Forensic Sciences 2021:53(4): 378-389. [CrossRef]
- Voskoboinik L, Darvasi A. Forensic identification of an individual in complex DNA mixtures. Forensic Sci Int Genet 2011:5(5): 428-435. [CrossRef]
- Petrovick MS, Boettcher T, Fremont-Smith P, Peragallo C, Ricke DO, Watkins J, Schwoebel E. Analysis of complex DNA mixtures using massively parallel sequencing of snps with low minor allele frequencies. Forensic Science International: Genetics 2020:46(102234. [CrossRef]
- Voskoboinik L, Motro U, Darvasi A. Facilitating complex DNA mixture interpretation by sequencing highly polymorphic haplotypes. Forensic Science International: Genetics 2018:35(136-140. [CrossRef]
- Homer N, Szelinger S, Redman M, Duggan D, Tembe W, Muehling J, Pearson JV, Stephan DA, Nelson SF, Craig DW. Resolving individuals contributing trace amounts of DNA to highly complex mixtures using high-density snp genotyping microarrays. PLOS Genetics 2008:4(8): e1000167. [CrossRef]
- Bleka Ø, Storvik G, Gill P. Euroformix: An open source software based on a continuous model to evaluate str DNA profiles from a mixture of contributors with artefacts. Forensic Science International: Genetics 2016:21(35-44. [CrossRef]
- Meiklejohn KA, Scheible MKR, Boggs LM, Dunn RR, Ricke DO. Using fastid to analyze complex snp mixtures from indoor dust. Journal of Forensic Sciences 2023:68(3): 768-779. [CrossRef]
- Voskoboinik L, Darvasi A. Forensic identification of an individual in complex DNA mixtures. Forensic Science International: Genetics 2011:5(5): 428-435. [CrossRef]
- Isaacson J, Schwoebel E, Shcherbina A, Ricke D, Harper J, Petrovick M, Bobrow J, Boettcher T, Helfer B, Zook C et al. Robust detection of individual forensic profiles in DNA mixtures. Forensic Science International: Genetics 2015:14(31-37. [CrossRef]
- Auton A, Abecasis GR, Altshuler DM, Durbin RM, Abecasis GR, Bentley DR, Chakravarti A, Clark AG, Donnelly P, Eichler EE et al. A global reference for human genetic variation. Nature 2015:526(7571): 68-74. [CrossRef]
- Sherry ST, Ward MH, Kholodov M, Baker J, Phan L, Smigielski EM, Sirotkin K. Dbsnp: The ncbi database of genetic variation. Nucleic Acids Research 2001:29(1): 308-311. [CrossRef]
- Ldlink linkage disequilibrium tools National Institutes of Health.
- Ricke, DO. Fastid: Extremely fast forensic DNA comparisons. 2017 IEEE High Performance Extreme Computing Conference (HPEC) 2017: 1-4. [CrossRef]
- Ricke DO, Isaacson J, Watkins J, Fremont-Smith P, Boettcher T, Petrovick M, Wack E, Schwoebel E. The plateau method for forensic DNA snp mixture deconvolution. bioRxiv 2017: 225805. [CrossRef]
Figure 1.
Number of contributors by SNP panels.
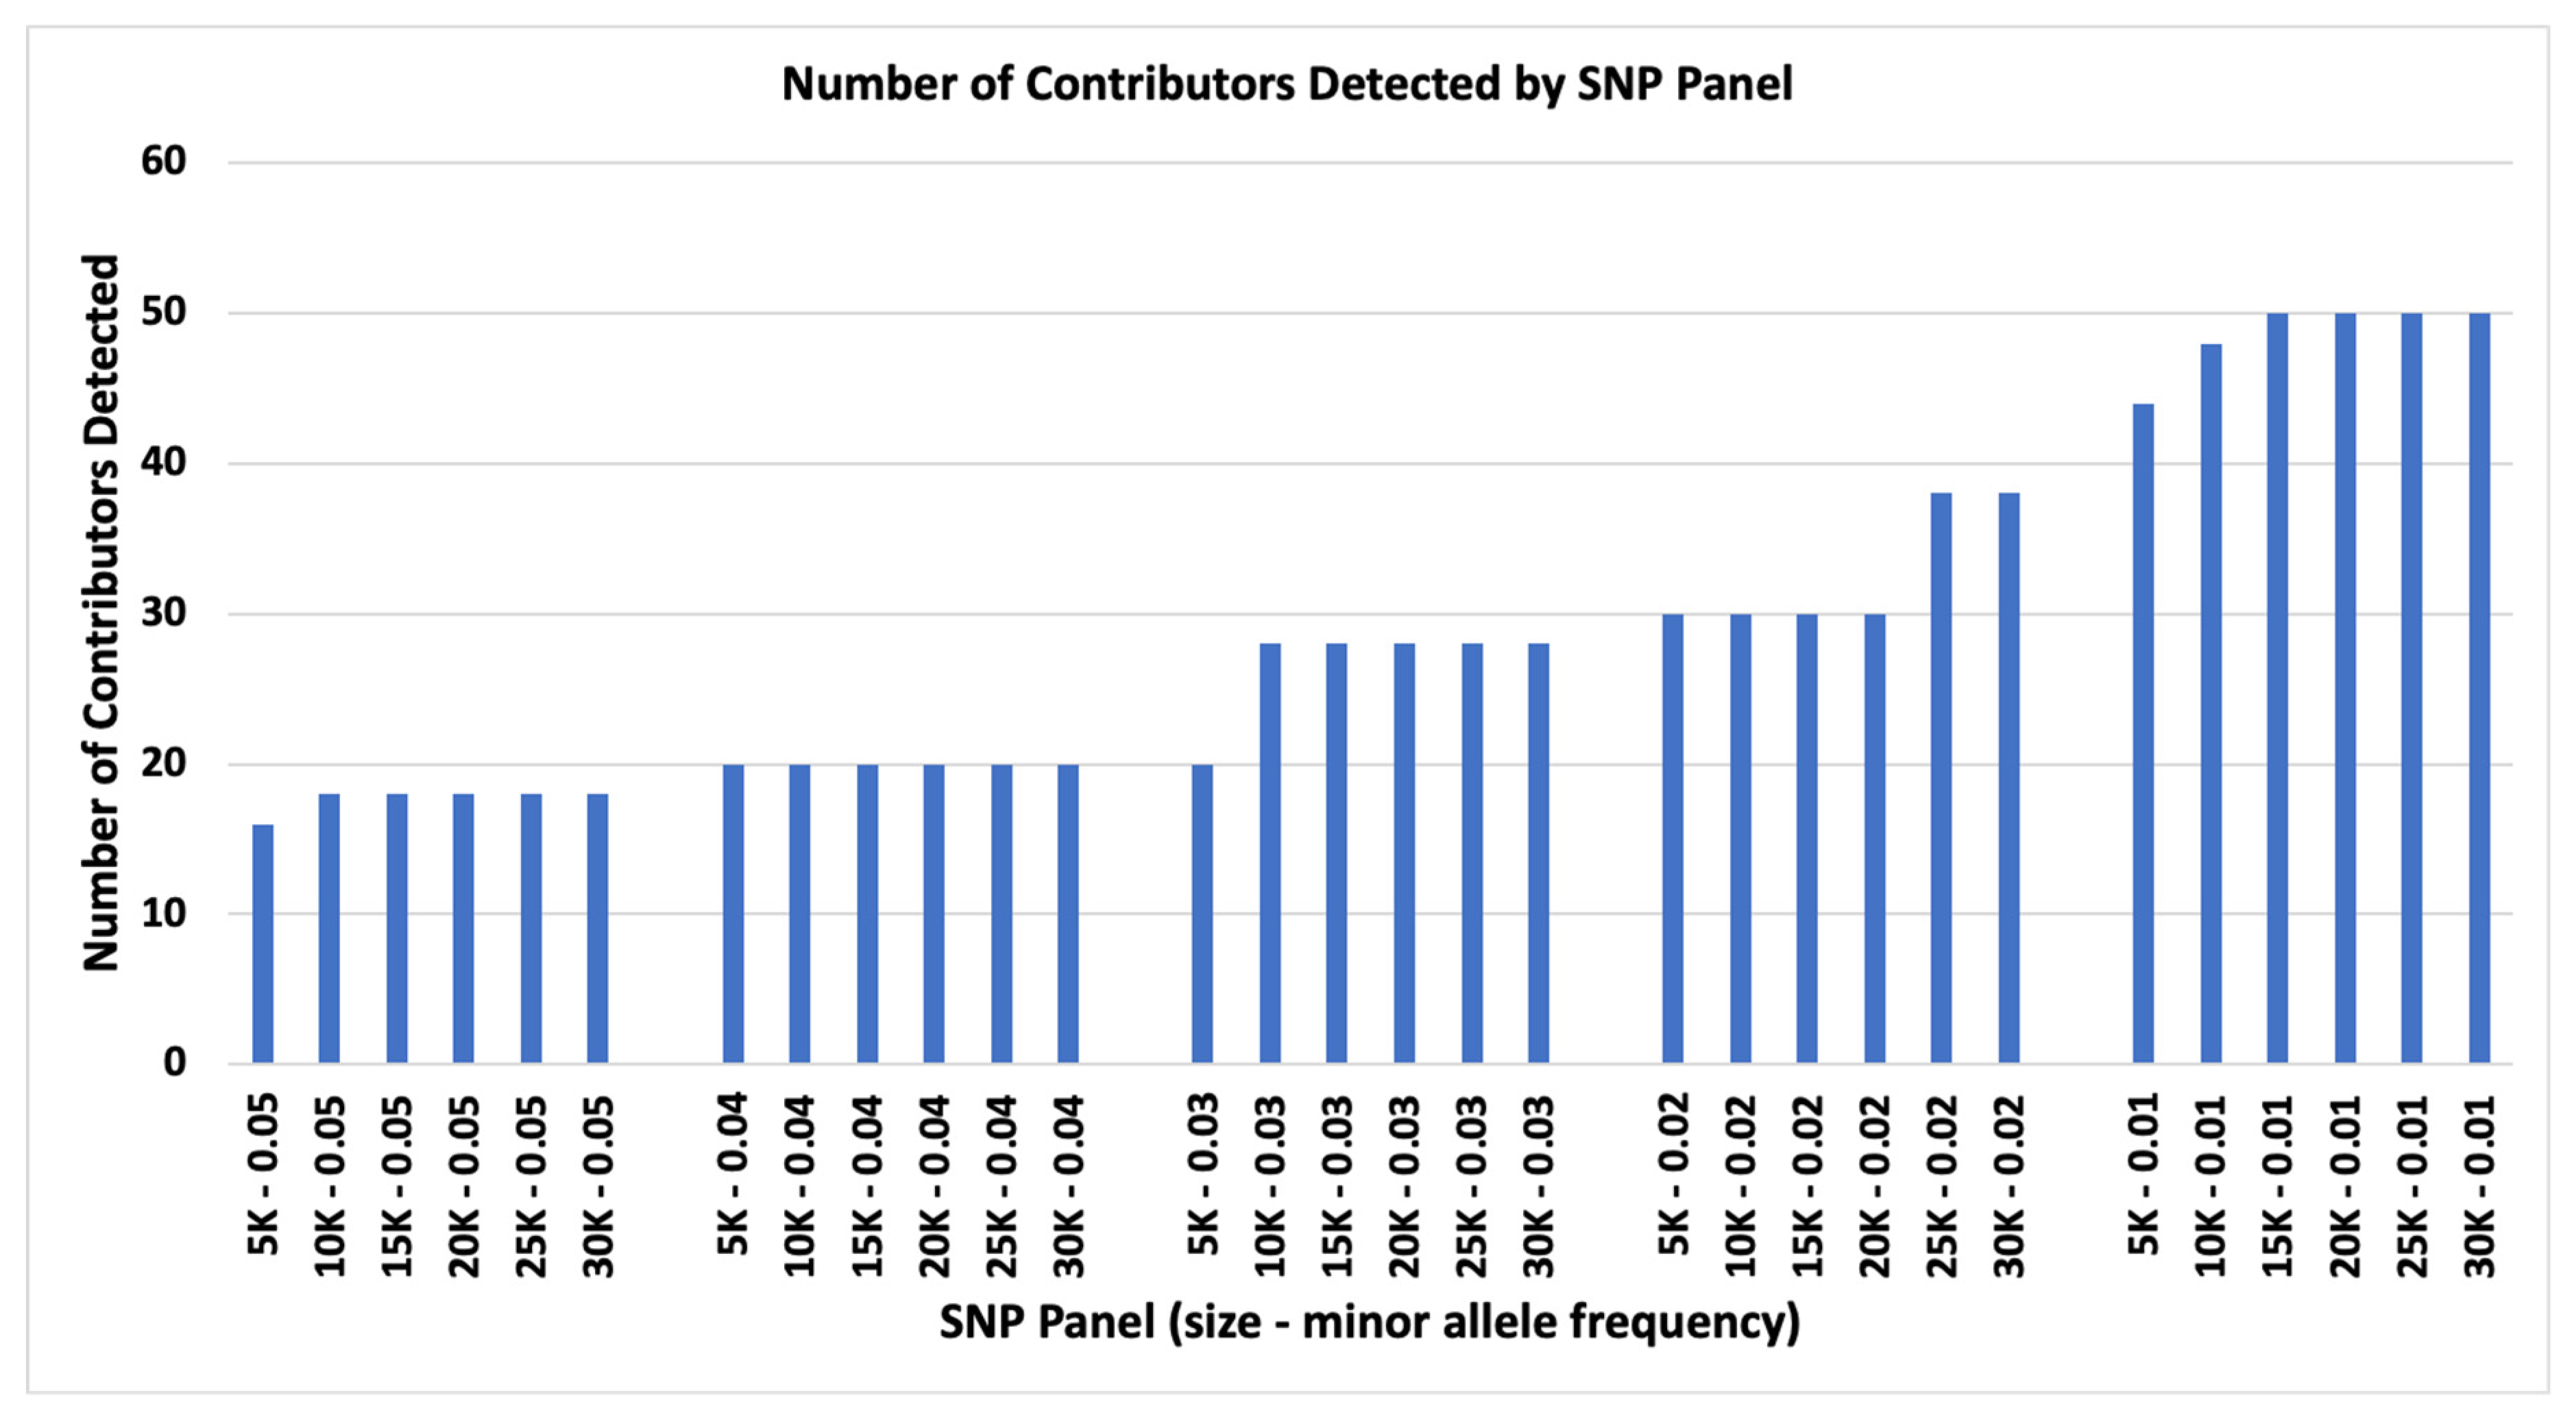
Figure 3.
Panel 15K01 with 50 contributors detected (from IdPrism). An example sample is highlighted indicating an estimated 2.0% contribution with P(RMNE) of 6.7e-56 (-56 on Log10 scale shown).
Figure 3.
Panel 15K01 with 50 contributors detected (from IdPrism). An example sample is highlighted indicating an estimated 2.0% contribution with P(RMNE) of 6.7e-56 (-56 on Log10 scale shown).
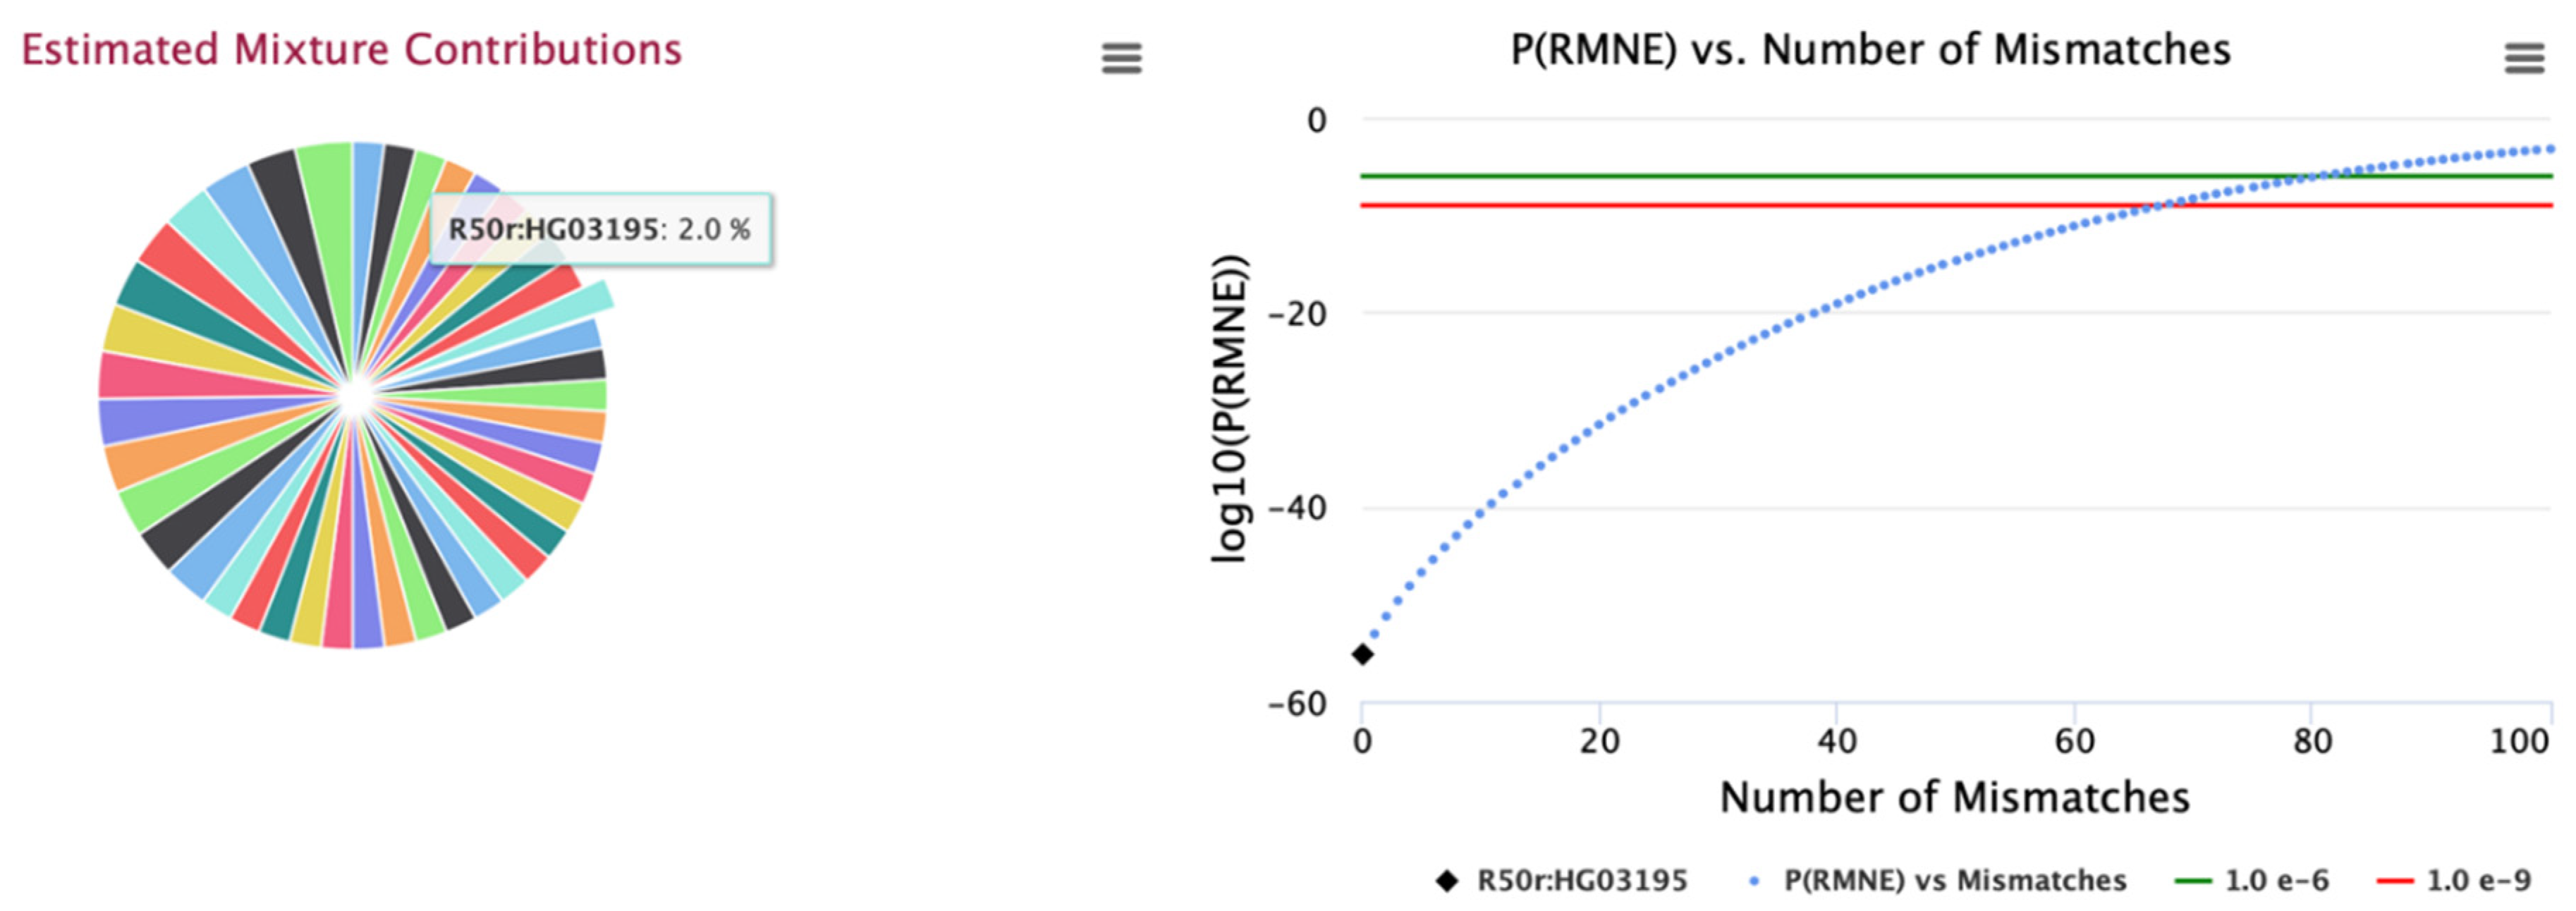
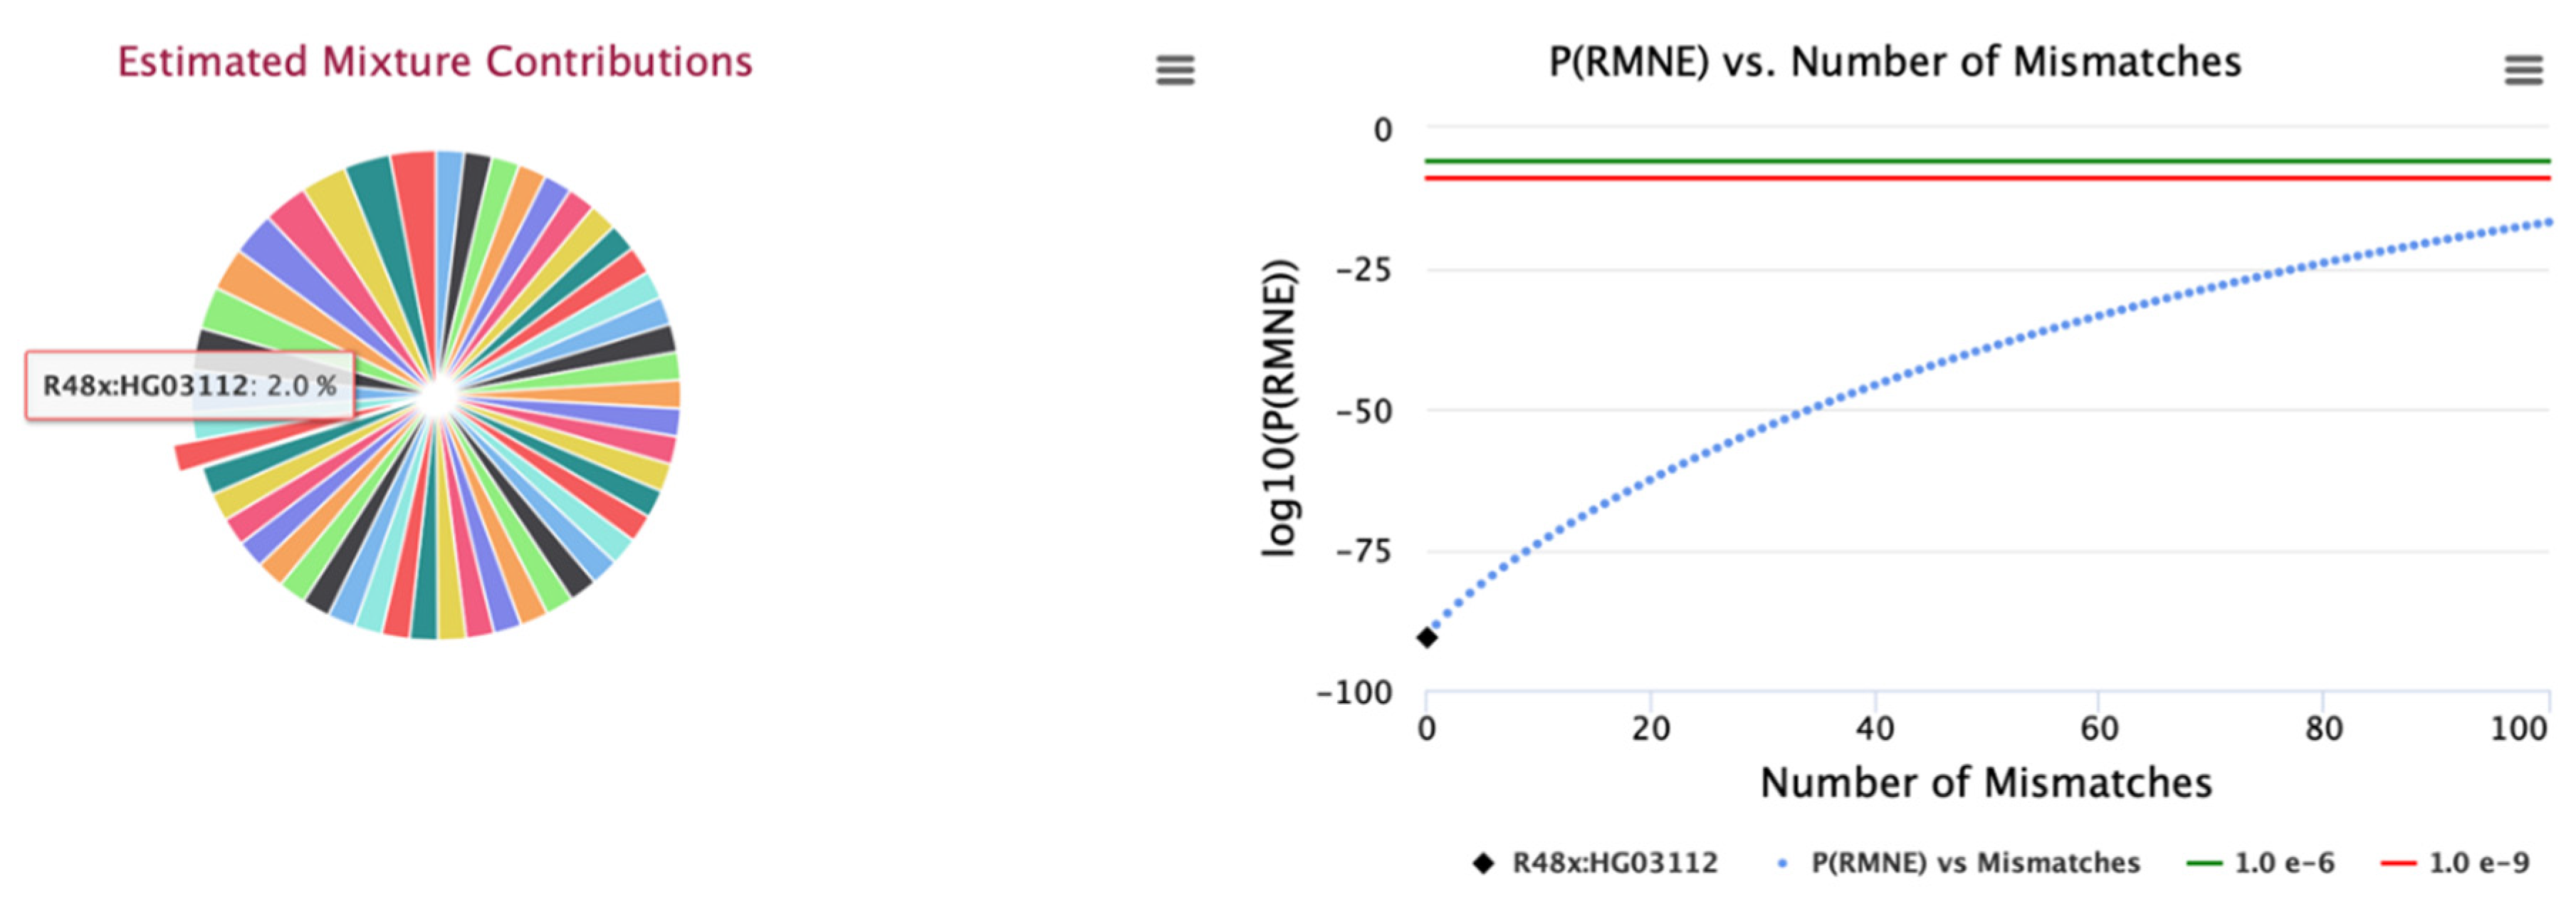
Figure 4.
Panel 25K01 with 50 contributors detected (from IdPrism). An example sample is highlighted indicating an estimated 2.0% contribution with P(RMNE) of 2.2e-91 (-91 on Log10 scale shown).
Figure 4.
Panel 25K01 with 50 contributors detected (from IdPrism). An example sample is highlighted indicating an estimated 2.0% contribution with P(RMNE) of 2.2e-91 (-91 on Log10 scale shown).
Disclaimer/Publisher’s Note: The statements, opinions and data contained in all publications are solely those of the individual author(s) and contributor(s) and not of MDPI and/or the editor(s). MDPI and/or the editor(s) disclaim responsibility for any injury to people or property resulting from any ideas, methods, instructions or products referred to in the content. |
© 2024 by the authors. Licensee MDPI, Basel, Switzerland. This article is an open access article distributed under the terms and conditions of the Creative Commons Attribution (CC BY) license (http://creativecommons.org/licenses/by/4.0/).
Copyright: This open access article is published under a Creative Commons CC BY 4.0 license, which permit the free download, distribution, and reuse, provided that the author and preprint are cited in any reuse.


