
Submitted:
19 February 2024
Posted:
20 February 2024
You are already at the latest version
Abstract
The Mexican Republic ranks fifth in the world in terms of amphibian diversity, and within Mexico, the state of Oaxaca has the greatest amphibian richness and endemism. Unfortunately, various factors, such as land use change and global warming, have caused a global crisis that threatens the conservation of this class. In the state of Oaxaca, few studies of amphibians have been carried out at the state level. Several research has shown that an analysis of beta diversity provides information that can be applied to conservation strategies. In this work, we analyzed the beta diversity at the species level and higher taxon level for the amphibians of Oaxaca and their replacement components and the differences in richness for anurans and caudates separately between physiographic subprovinces. Very high beta diversity was recorded, with higher diversity occurring among caudates than among anurans. Replacement was the component that most contributed to this result, and the subprovinces with substantial environmental differences had the most dissimilar amphibian communities. The results of this study show the need to implement conservation strategies in subprovinces with high amphibian richness and endemism levels, following the example of Sierra Madre de Oaxaca (SMO)
Keywords:
anurans and caudates
; conservation
; dissimilarity
; subprovinces
; replacement
1. Introduction
In Mexico, the class Amphibia has a high global richness level, ranking fifth in the world in terms of diversity with 376 species, of which 67% (252 species) are endemic to the country (Parra-Olea et al., 2014). Mexico has the second most plethodontid species globally, with 132 species, of which 81% are endemic to the country [1]. At the national level, the state of Oaxaca has the greatest diversity of Amphibia, registering 38 genera (32 anurans, 5 caudates and 1 Gymnophiona) and 149 species (106 anurans, 41 caudates and 2 caecilians). Oaxaca contains 40% of the species, 76% of the genera and 80% of the families of amphibians in Mexico. Of this total, 102 are endemic to Mexico (62 anurans, 39 caudates and 1 caecilian), and 60 are endemic to Oaxaca (40.2%: 27 anurans and 33 caudates) (Mata-Silva et al., 2015). In the case of caudates, endemism is extraordinary since 80.48% are endemic to Oaxaca [2].
Unfortunately, amphibians are experiencing the worst extinction crisis in their history [1,3]; for example, in Mexico, more than 41% of amphibian species are critically endangered, endangered or threatened according to the International Union for the Conservation of Nature (IUCN) [3], and 72% of salamander species (95 species) in Mexico are threatened with extinction [4] due to various factors, such as habitat transformation, which is caused by human activities, including agriculture, livestock, logging, and urban development; introduction of exotic species; and the effects of global climate change and emerging infectious diseases [1,4,5]. In addition to this problem, amphibians have limited dispersal capacities, specialized habitats and habits and high rates of endemism [1], which contribute to the fact that at the national scale, they present the highest beta diversity within terrestrial vertebrate species with a high conservation risk [6,7,8]. Given this background, we consider it important to analyze the diversity of amphibians in the state of Oaxaca with novel methodological approaches. In this work, we analyze amphibian beta diversity and its replacement components and the differences in the richness of the amphibians in the physiographic subprovinces of the state of Oaxaca since this type of analysis offers quantitative information that can contribute to a better understanding of the diversity of this group at different scales and that can be reflected in conservation strategies for these species at the state level [9].
2. Materials and Methods
The units of study in this work were the 12 physiographic subprovinces present in the state of Oaxaca that were used for an analysis of the herpetofauna in Oaxaca by Mata-Silva et al. [2]: Balsas Depression (DB); Mountains and Valleys of the West (MVO); Tehuacán Trench (FT); Sierra Madre de Oaxaca (SMO); Gulf Coastal Plain (PCG); Central Valleys of Oaxaca (VCO); Mountains and Valleys of the Center (MVC); Isthmic Depression of Tehuantepec (DIT); Sierra Madre de Chiapas (SMC); Sierra Madre del Sur (SMS); Pacific Coastal Plain (PCP) and Tehuantepec Coastal Plain (PCT) (Figure 1). From the information on amphibians in this work, a database of presence and absence was constructed.
To determine if there is a relationship between the size of the area of the provinces and the richness of amphibians, anurans and caudates, a regression analysis was applied. Beta diversity or dissimilarity was separated into its two components of replacement and differences in richness [10,11,12]. According to this method, the total dissimilarity is 1 minus the similarity coefficient of Jaccard (βcc) or Sorensen (βsor). This dissimilarity is divided into two components: dissimilarity due to turnover (β.sim) and dissimilarity due to differences in richness (βsne) [12,13,14]. This analysis was carried out in the R program using the BAT package [15,16].
This partition was performed both for the dissimilarity in the composition of species and for that in the taxonomic structure considering the composition of taxa higher than the species level, using the method of Bacaro et al. [17], where the total taxonomic dissimilarity, here βsorT is equal to the dissimilarity of the Jaccard or Sorensen coefficient but taking into account higher taxa. The values of βsorT will range from zero when the taxonomic structure of both communities is identical to 1 when the taxonomic structure is totally different [17]. Taxonomic dissimilarity measures the proportion represented by nonshared taxa to the total number of taxa in the two communities. Therefore, the partitioning of βsorT with the procedure of Carvalho et al. [12] provides a dissimilarity component due to the change in the taxon (β.simT) and a dissimilarity component due to the difference in taxon richness (βsneT). To calculate the total taxonomic dissimilarity and its components, we used the categories of order, family, subfamily, genus and species. The analysis was carried out in the R program [16].
To observe the patterns of beta diversity among species and the beta taxonomy between physiographic subprovinces, we performed nonmetric dimensional scaling analysis (NMDS). To visualize clusters between subprovinces, cluster analyses were performed using the pairwise grouping method with the unweighted pair group method with arithmetic mean (UPGMA). The clusters formed were superimposed in the NMDS and were described using cutoff levels at 0.60 of dissimilarity for the total beta diversity and 0.30 of dissimilarity for the replacement components and differences in richness. These analyses were performed in the PRIMER V7® program [18]. Simple linear regression analyses were also performed to explore the existence of a relationship between the beta diversity of species and the beta diversity of higher amphibian taxa for the total beta diversity, turnover and differences in richness of the 12 physiographic subprovinces present in Oaxaca. All the analyses were performed for all amphibians; however, the analyses were performed separately for anurans and caudates separately as these orders present important differences in richness and environmental requirements and their dissimilarity patterns can vary.
3. Results
3.1. Species Richness and Endemism
Nationally, the state of Oaxaca has the highest amphibian species richness, with 149 species; in addition, 54.3% of these amphibians have been recorded in only one subprovince, as well as 48 of the 60 species endemic to Oaxaca (80%, Table 1). In comparison to caudates, anurans were distributed more broadly, in as many as 10 subprovinces (X = 2.87 subprovinces), and the caudates were distributed in as many as three subprovinces (X = 1.3 subprovinces, Table 2). Notably, the SMO had 88 species (62 anurans and 26 caudates), with 70.45% endemism (62 species: 36 anurans and 26 caudates), while nationally, there was 21.6% endemism (19 species) at the national level (17 anurans and 2 caudates) and 49% endemism (43) at the state level (19 anurans and 24 caudates), of which 86.7% (36) are endemic to this subprovince (16 anurans and 20 caudates). A positive and significant relationship was recorded between the richness of all amphibians, anurans and caudates separately and the area of the subprovinces (r 2 = 0.461 p <0.017; r 2 = 0.407 p <0.025; and r 2 = 0.51 p <0.0137, respectively).
3.2. Total Beta Diversity of Amphibian Species at the State Level
The total beta diversity for Oaxacan amphibian species was 86% (βSOR = 0.86) and was higher than that of higher taxa (βSORT = 0.79). Turnover was more important than the differences in richness at the species level (βSIM = 0.74 and βSNE = 0.12) and higher taxa level (βSIMT = 0.63 and βSNET = 0.16). In comparison to the anurans, the caudates presented a higher total beta diversity of species and taxa (caudates βSOR = 0.92 and βSORT = 0.81 and anurans βSOR = 0.84 and βSORT = 0.76), and turnover (caudates βSIM = 0.81, βSIMT = 0.63 and anurans βSIM = 0.72 βSIMT = 0.61) was more important than the differences in richness (anurans; βSNE = 0.12 βSNET = 0.15 and caudates βSNE = 0.11 and βSNET = 0.18 Figure 2). However, when all the subprovinces are analyzed, including where the caudates are not distributed, in comparison to the other factors, the differences in richness were more important (βSIM = 0.11 and βSNE = 0.69). There was no relationship between total beta diversity or turnover and the area of the physiographic provinces (r 2 = 0.031, p <0.1526; r 2 = 0.035, p <0.1318, respectively). The area of the physiographic subprovinces showed a positive and significant relationship (r 2 = 0.1033, p <0.0083).
3.3. Beta Diversity of Amphibians between Pairs of Physiographic Subprovinces
The total beta diversity of amphibians presented the highest values between DB/PCG and DB/DIT (βsor = 1 for both pairs, the DB/SMC βsor = 0.92), and FT/PCT and PCG/VCO (βsor = 0.90 for both pairs, Figure 3). The highest turnover occurred between DB/PCG and DB/DIT (βsim = 1.0), and another 10 pairs showed values greater than 80% (βsim = 0.80) with MVO being involved in five pairs. For the differences in richness, the highest dissimilarity value was obtained between FT and SMO (βsne = 0.72) (Figure 3, Amphibians SP, supplementary material).
For the anurans, 19 pairs showed values above 80%, with the highest being between DB/PCG and DB/DIT (βsor = 1 for both pairs) and DB/SMC and FT/PCT (βsor = 0.90 for both pairs). With respect to turnover, the highest values were between DB/PCG and DB/DIT (βsim = 1.0), followed by those between FT/PCP and FT/PCT (βsim = 0.85 for both). The differences in richness had their highest value between FT and SMO (βsne = 0.63 Figure 3, Anurans SP, supplementary material). The caudates did not have records in five subprovinces, so 21 pairs of 66 possible pairs were analyzed because when comparing subprovinces with and without caudates, the maximum possible beta diversity originated from the effect of the differences in richness; however, when they were eliminated from the analysis, fourteen pairs showed the maximum beta diversity (βsor = 1) caused by turnover (βsim = 1 and βsne = 0). The highest values of the differences in richness were found between SMO/VCO and MVO/VCO (βsne = 0.92 and βsne = 0.8; Figure 3, Caudates SP, supplementary material).
3.4. Determination of Beta Diversity of Species and Higher Taxa
For the total beta diversity of amphibian species, three groups were formed with a similarity of 0.40 (SMO, DB, VCO, MVC, MVO and FT; SMS, PCP, and PCT; and SMC, PCG and DIT) and for the total beta taxonomic diversity, two groups were formed (Figure 4). In the case of anurans at the species level, two groups were formed with a similarity of 40% (MVO, MVC, FT, and VCO and PCT, PCP, SMS, SMC, DIT, and PCG). For the caudates, a group formed with a similarity of 60% (DIT, PCG, and SMC), and the remaining species were not grouped (Figure 4). For the total beta taxonomy, two groups were formed (Figure 4). Regarding the turnover of species and higher taxa of all amphibians, two groups were distinguished with a similarity of 0.60 (MVO, MVC, FT, and VCO and PCT, PCP, SMS, SMC, DIT, and PCG). For the replacement of anurans, three groups formed with a similarity of 0.40 (PCP, PCT, and SMS; DIT, PCG, and SMC; and MVO, MVC, FT, VCO, DB, and SMO). For the caudates, two groups formed (SMO, VCO, and MVO and DIT, SMC, and PCG) as occurred for the replacement of higher taxa (Figure 4). For the differences in richness of amphibians, anurans and caudates at the level of species and higher taxa, a group with a similarity of 0.40 was formed.
3.5. Relationship between Beta Diversity of Species and Higher Taxa
The total taxonomic beta diversity followed the same trend as that of the beta diversity of species since both were positively and significantly related for all amphibians (r 2 = 0.85 p < 0.0001) as were turnover (r 2 = 0.88, p < 0.0001) and differences in richness (r 2 = 0.90, p < 0.0001). The same result was obtained for anurans (total beta: r 2 = 0.86, p < 0.0001; turnover: r 2 = 0.86, p < 0.0001; differences in richness: r 2 = 0.87, p < 0.0001); however, in the caudates, this relationship was less robust (total beta: r 2 = 0.70, p < 0.0002; turnover: r 2 = 0.65, p < 0.0001; differences in richness: r 2 = 0.40, p < 0.0065), probably due to the high species richness and the low richness of higher taxa in this order (Figure 5).
4. Discussion
Among the states in Mexico, Oaxaca has the highest amphibian richness and endemism, with 149 species, of which 60 are endemic to the state (27 anurans and 33 caudates) [2], surpassing the endemism of amphibians recorded in 13 countries on the same continent [19]. According to our results, this amphibian richness in Oaxaca is related to the size of the physiographic subprovinces, given the species-area relationships initially proposed for island biogeography [20], which is recognized as one of the patterns of global diversity [21,22]. This same species-area relationship has been recorded for the herpetofauna of the Caribbean Islands [20] and the Marías Islands in the Mexican Pacific [23] and for the reptiles of the islands of Mexico [24], as well as for amphibians and reptiles in tropical forest fragments [25,26,27]. In addition to the size of the area, factors such as temperature, precipitation, humidity and environmental heterogeneity are factors that influence amphibian richness [8,9,26,27,28].
The total beta diversity was high for all amphibians and anurans and caudates separately, with dissimilarity values greater than 85% in all cases; however, dissimilarity values were higher for the caudates than for the anurans. This result is consistent with the higher beta diversity values of 80% recorded for amphibians at the continental [9] and national scales [6,7,8]. The same trend was found for taxonomic beta diversity, although with lower values, indicating that the amphibian fauna presents in the 12 subprovinces in Oaxaca drastically change their composition both at the level of species and at the level of higher taxa. The total beta diversity of amphibian species between the pairs of subprovinces also showed generally high values (> 80%), indicating a high rate of change between the composition of the amphibian communities between these units. Similar results were obtained by Mata-Silva et al. [2], who used the biogeographic similarity coefficient for the entire state for the herpetofauna in these same subprovinces, and they found that 48% of the possible combinations presented dissimilarities greater than 80%. Similarly, the highest dissimilarities for amphibians in this study were found between DB and other subprovinces, such as FT, PCT, PCG, SMO and VCO [2]. In addition, Calderón-Patrón et al. [29,30] obtained similar dissimilarity values for the beta diversity of species and higher taxa of amphibians between pairs of ecoregions in Hidalgo and between pairs of quadrants at three scales on the Isthmus de Tehuantepec, and Juárez-Ramírez et al. [31] obtained similar values at the local level among the amphibians of three natural protected areas (NPAs) in the state of Veracruz, recording total beta diversity in the three parks ranging from 60 to100%.
In comparison to the differences in richness, turnover contributed more to the total beta diversity of species and taxonomic beta diversity, both for amphibians and anurans and caudates, with the diversity being higher in the latter order, indicating that species substitution between subprovinces is the mechanism that causes variation in the species composition of the analyzed regions. These results are consistent with those recorded for amphibians in some regions of America [9], those recorded at the state level among ecoregions within the state of Hidalgo [30], and those recorded at the local level among the amphibians from three NPAs in the state of Veracruz, with a total beta diversity ranging from 60 and 100% [31,32]. In two pairs, turnover was more important than the differences in richness, and the opposite occurred in one pair [31], and in the three private NPAs in Veracruz, amphibians presented a relatively low dissimilarity values in species composition (values of βcc between 0.27 and 0.48), mainly due to species replacement, with values between 18 and 28% [32]. However, on the Isthmus of Tehuantepec at fine and medium scales, both components contributed similar amounts [29]. In the case of the differences in richness, their contribution to the total beta diversity did not exceed 13% in any group analyzed, which reflects that there is a very high substitution of species among the subprovinces. These results seem to be influenced by historical and spatial factors [9], such as the Pleistocene glaciations, which caused amphibians to use shelters to survive at high latitudes where the temperature decreased; subsequently, as the planet warmed, the surviving species dispersed and repopulated this region, while in the areas near the equator, this phenomenon was less common, which caused the beta diversity of amphibians to be dominated by turnover below the 37th parallel and by differences in richness about this parallel [9].
Regarding the turnover between subprovinces, in comparison to the other subprovinces, MVO, DB and FT presented the highest values, which means that in addition to changes in the composition of amphibian communities, the communities also present important environmental differences and are geographically distant. These results may be due to differences in temperature, precipitation and environmental heterogeneity and the geographical distance between them and/or the size of the area of the subprovinces, as well as the number of records and collections [8,9,28,29,30,31,32,33,34,35] (Figure 1, supplementary materials). For the differences in richness, the highest values were obtained between DB and SMO and the other subprovinces, which was the product of the low species richness (seven) recorded in the DB and the high number of species in the SMO (88).
The highest values of total beta diversity and turnover were higher in caudates than in anurans, which reflects the more restrictive environmental requirements and smaller distribution areas of anurans [28]; for example, Dalmolin et al. [36] evaluated the beta diversity of amphibians in different pools in Brazil and determined that total beta diversity and turnover were related to the depth and vegetation of the pools. In Mexico, the beta diversity of amphibians is associated with the heterogeneity of precipitation [8], which is related to their reproduction water requirements since adults need environmental humidity and colder temperatures to survive [28]. Thus, a greater spatial variation in precipitation within a region indicates a greater variation in local conditions and, therefore, the possibility that numerous species of amphibians inhabit a restricted subset of the region [8]. In addition, some caudates are particularly difficult to study because their detectability is biased by researchers' knowledge of their microhabitats [29]. In addition, salamanders have a lower dispersal capacity [28], as observed in Oaxaca with the amplitude of their distribution.
Amphibians are the most threatened class of terrestrial vertebrates in terms of conservation [1], and according to Alroy [37], at the global level, the extinction of amphibians has accelerated since the 1980s and 1990s, with between 28 and 201 species going extinct and a current extinction probability for frogs of 66.1% [38]. Unfortunately, globally, Mesoamerica has the second highest probability of frogs going extinct at 17.74%, with the main causes being deforestation, the introduction and expansion of the distribution of exotic species and the presence of the fungus Batrachochytrium dendrobatidis [1,37,39] estimated the environmental vulnerability score for the amphibians of Mexico and determined that salamanders are the most threatened order with 87% of them having a high environmental vulnerability; at the same time, 42.6% of anurans have a high environmental vulnerability. Within the Plethodontidae family, some genera in Mexico face critical conservation problems, as indicated by the high proportion of threatened species: Thorius (96%), Chiropterotriton (83%) and Pseudoeurycea (78%) [4].
Regarding the evaluation of amphibian conservation according to the Secretariat of Environment and Natural Resources SEMARNAT [40], of the 149 amphibian species recorded in Oaxaca, only 58 are considered in NOM-059, and 91 species have not been evaluated. In addition, 56.5% of the amphibians endemic to the area are not under any conservation category [2]. Despite the complex scenario for amphibians, it is noted that in Oaxaca, the SMO subprovince implements successful conservation actions in most of its territory based on the efforts of local communities [34]. This information is important because it is the most important subprovince for the conservation of amphibians at the state level as it has the greatest richness (88 species) and endemism (43 species) levels in Mexico; this subprovince contains 95% of the caudates endemic to Mexico and 80.5% of those endemics to Oaxaca. The same observation was found by Mata-Silva et al. [2] for all herpetofauna since the SMO contains the greatest total number of species at 216, of which 88 are amphibians. High richness levels of vascular plants, gymnosperms, oaks, birds and mammals have also been found in this subprovince [6,35,41,42]. Although the SMO is the best preserved region of Oaxaca, 10 species of anurans are experiencing declines in their populations, and 11 anurans in MVC and SMS are also experiencing declining populations [43]; in addition, salamanders of the genus Thorius have been evaluated as critically endangered, endangered and threatened according to the IUCN [3,44] and the high mountain Pseudoeurycea species of Cerro San Felipe have not been observed recently despite search efforts [45].
Supplementary Materials
The following supporting information can be downloaded at the website of this paper posted on Preprints.org. Table S1: Partitions of beta diversity of Amphibia between pairs of physiographic provinces of the state of Oaxaca.; Table S2: Partitions of beta diversity of Anura between pairs of physiographic subprovinces of the state of Oaxaca.; Table S3: Partitions of beta diversity of Caudata between pairs of physiographic subprovinces of the state of Oaxaca.; Table S4: Partitions of taxonomic beta diversity of Amphibia between pairs of physiographic subprovinces of the state of Oaxaca.; Table S5: Partitions of taxonomic beta diversity of Anura between pairs of physiographic provinces of the state of Oaxaca.; Table S6: Partitions of taxonomic beta diversity of Caudata between pairs of physiographic subprovinces of the state of Oaxaca.
Author Contributions
JMCP and KPJ designed the work, performed the statistical analyzes and wrote the manuscript. JLT and ECG contributed to the design and wrote the document.
Funding
Not applicable.
Institutional Review Board Statement
Not applicable.
Data Availability Statement
Not Applicable.
Acknowledgments
The authors are grateful for the support of the University Center of the Coast of the University of Guadalajara, Puerto Vallarta campus for the funding for the translation of the manuscript.
Conflicts of Interest
The authors declare that they have no conflict of interest.
References
- Parra-Olea, G.; Flores-Villela., O.; Mendoza-Almeralla, C. Biodiversity of amphibians in Mexico. Rev Mex Biodivers 2014, 85, 460–466. [Google Scholar] [CrossRef]
- Mata-Silva, V., Johnson, J.D., Wilson, D.; García-Padilla, E. The herpetofauna of Oaxaca, Mexico: composition, physiographic distribution, and conservation status. Mesoam Herpetol. 2015;2(1):6–62.
- Wake, D.; Vredenburg, V.T. Are we in the midst of the sixth mass extinction? A view from the world of amphibians. Proc Natl Acad Sci USA. 2008;115(1):11466–11473. [CrossRef] [PubMed]
- García-Bañuelos, P.; Rovito, S.M., Pineda, E. Representation of Threatened Biodiversity in Protected Areas and Identification of Complementary Areas for Their Conservation: Plethodontid Salamanders in Mexico. Trop Conserv Sci. 2019; 12:1-15. [CrossRef]
- Lips, K.R.; Burrowes, P.A.; Mendelson, J.R; Parra Olea, G. Amphibian population declines in latin America: a synthesis. Biotropica. 2005, 37(2):222–226. [CrossRef]
- Koleff, P.; Soberón, J.; Arita, H.; Dávila, P.; Flores-Villela, O.; Halffter, G.; Lira-Noriega, A.; Moreno, C.E.; Moreno, E.; Munguía, M.; et al. Patrones de diversidad espacial en grupos selectos de especies. In Capital natural de México, vol. I: Conocimiento actual de la biodiversidad. Ciudad de México, México, Conabio; 2008. p. 323-364.
- Ochoa-Ochoa, L.M.; Munguía, M.; Lira-Noriega, A.; Sánchez-Cordero, V.; Flores-Villela, O.; Navarro-Sigüenza, A.; Rodríguez, P. Spatial scale and β-diversity of terrestrial vertebrates in Mexico. Rev Mex Biodivers. 2014;85(3):918–930. [CrossRef]
- Rodríguez, P.; Ochoa-Ochoa, L.M.; Munguía, M.; Sánchez-Cordero, V.; Navarro-Sigüenza, A.; Flores-Villela, O.; Nakamura, M. Environmental heterogeneity explains coarse-scale β-diversity of terrestrial vertebrates in Mexico. PLoS ONE. 2019;14(1):1–13. [CrossRef] [PubMed]
- Baselga, A.; Gómez-Rodríguez, C.; Lobo, J.M. Historical legacies in world amphibian diversity revealed by the turnover and nestedness components of beta diversity. PLoS ONE. 2012;7(2):e32341. [CrossRef] [PubMed]
- Baselga, A. Partitioning the turnover and nestedness components of beta diversity. Global Ecol Biogeogr. 2010;19(1):134–143. [CrossRef]
- Baselga, A. The relationship between species replacement, dissimilarity derived from nestedness, and nestedness. Global Ecol Biogeogr. 2012;21(12):1223–1232. [CrossRef]
- Carvalho, J.C.; Cardoso, P.; Gomes, P. Determining the relative roles of species replacement and species richness differences in generating beta-diversity patterns. Global Ecol Biogeogr. 2012; 21(7):760–771. [CrossRef]
- Carvalho, J.C.; Cardoso, P.; Borges, P.A.V., Schmera, D.; Podani, J. Measuring fractions of beta diversity and their relationships to nestedness: a theoretical and empirical comparison of novel approaches. Oikos. 2013;122(6):825–834. [CrossRef]
- Baselga, A., Leprieur, F. Comparing methods to separate components of beta diversity. Methods Ecol Evol. 2015;6(9):1069–1079. [CrossRef]
- Cardoso, P., Rigal, F.; Carvalho, J.C. BAT - Biodiversity Assessment Tools, an R package for the measurement and estimation of alpha and beta taxon, phylogenetic and functional diversity. Methods Ecol Evol. 2015;6(2):232–236. [CrossRef]
- R Core Team. R: a language and environment for statistical computing. Computer software v4.03. ISBN 3-900051-07-0: URL http://www. R-project. org; 2018. Available from: https://www.r-project.org/ (accessed on 27 March 2021).
- Bacaro, G.; Ricotta, C.; Mazzoleni, S. Measuring beta-diversity from taxonomic similarity. J Veg Sci. 2007;18(6):793–798. [CrossRef]
- Clarke, K.R.; Gorley, R.N. Primer: user manual/tutorial. Primer-E Ltd, Plymouth, UK. 2015.
- IUCN. 2019. The IUCN Red List of Threatened Species. 2019. Available online: https://www.iucnredlist.org/resources/summary-statistics (accessed on 20 January 2021).
- MacArthur, R.H., Wilson, E.O. The theory of island biogeography. Princeton University Press, Princeton, NJ. 1967.
- Rosenzweig, M.L. Species diversity in space and time. Cambridge University Press; United Kingdom. 1995.
- Gaston, K.J. Global Patterns in Biodiversity. Nature, 2000; 405:220–227. [CrossRef]
- Casas-Andreu, G. Anfibios y reptiles de las islas Marías y otras islas adyacentes de la costa de Nayarit, México. Aspectos sobre su biogeografía y conservación. An Inst Biol, Univ Nac Auton Mex, Zool, 1992;63(1):95–112.
- Calderón-Patrón, J.M. Biogeografía de islas: el caso de la herpetofauna mexicana. Tesis de Maestría. Universidad Autónoma del Estado de Hidalgo. México. 2007.
- Bell, K.E.; Donnelly, M.A. Influence of forest fragmentation on community structure of frogs and lizards in northeastern Costa Rica. Conserv Biol. 2006;20(6):1750–1760. [CrossRef]
- Cabrera-Guzmán, E.; Reynoso, V.H. Amphibian and reptile communities of rainforest fragments: minimum patch size to support high richness and abundance. Biodiversity Conserv. 2012;21(12):3243–3265. [CrossRef]
- Russildi, G.; Arroyo-Rodríguez, V., Hernández-Ordóñez, O.; Pineda, E.; Reynoso, V.H. Species- and community-level responses to habitat spatial changes in fragmented rainforests: assessing compensatory dynamics in amphibians and reptiles. Biodiversity Conserv. 2016;25(2):375–392. [CrossRef]
- Vitt, L.J.; Caldwell, J.P. Herpetology: An Introductory Biology of Amphibians and Reptiles: Fourth Edition. Elsevier Inc, Norman, Oklahoma. 2014.
- Calderón-Patrón, J.M.; Moreno, C.E.; Pineda-López, R.; Sánchez-Rojas, G.; Zuria, I. Vertebrate dissimilarity due to turnover and richness differences in a highly beta-diverse region: The role of spatial grain size, dispersal ability and distance. PLoS ONE, 2014;8(12):1–10. [CrossRef]
- Calderón-Patrón, J.M.; Goyenechea, I.; Ortiz-Pulido, R.; Castillo-Cerón, J.; Manríquez, N.; Ramírez-Bautista, A.; Rojas-Martínez, A.E.; Sánchez-Rojas, G.; Zuria, I.; Moreno, C.E. Beta diversity in a highly heterogeneous area: Disentangling species and taxonomic dissimilarity for terrestrial vertebrates. PLoS ONE, 2016;11(8):1–15. [CrossRef]
- Juárez-Ramírez, C.M.; Aguilar-López, J.L.; Pineda, E. Protected natural areas and the conservation of amphibians in a highly transformed mountainous region in Mexico. Herpetol Conserv Biol, 2016;11(1):19–28.
- Aguilar-López, J.L.; Ortiz Lozada, L.; Pelayo-Martínez, J.; Mota-Vargas, C.; Alarcón-Villegas, L.E.; Demeneghi-Calatayud, A.P. Diversidad y conservación de anfibios y reptiles en un área protegida privada de una región altamente transformada en el sur de Veracruz, México. Acta Zool Mex (ns). 2020;36(1):1–14. [CrossRef]
- Calderón-Patrón, J.M.; Moreno, C.E., Zuria, I. Diversidad beta: medio siglo de avances. Rev Mex Biodivers. 2012; 83:879-891. [CrossRef]
- Monroy-Gamboa, A.G.; Sánchez-Cordero, V.; Briones-Salas, M., Lira-Sadee, R.; Maass-Moreno, J.M. Representatividad de los tipos de vegetación en distintas iniciativas de conservación en Oaxaca, México. Bosque. 2015;36(2):199–210. [CrossRef]
- Ramírez-Toro, W.; Torres-Miranda, A.; González-Rodríguez, A.; Ruíz-Sánchez, E.; Luna-Vega, I.; Oyama, K. A multicriteria analysis for prioritizing areas for conservation of oaks (Fagaceae: Quercus) in Oaxaca, Southern Mexico. Trop Conserv Sci, 2017; 10:1-29; 10. [CrossRef]
- Dalmolin, D.A.; Tozetti, A.M., Pereira, M.J.R. Taxonomic and functional anuran beta diversity of a subtropical metacommunity respond differentially to environmental and spatial predictors. PLoS ONE. 2019;14(11):1–16. [CrossRef]
- Alroy, J. Current extinction rates of reptiles and amphibians. Proc Natl Acad Sci USA, 2015;112(42):13003–13008. [CrossRef]
- McCallum, M.L. Amphibian decline or extinction? Current declines dwarf background extinction rate. J Herpetol, 2007; 41:483–491. https://www.jstor.org/stable/4498614.
- Wilson, L.D.; Johnson, J.D.; Mata-Silva, V.A. Conservation reassessment of the amphibians of Mexico based on the EVS measure. Amphib Reptile Conserv, 2013;7(1):97–127(e69). https://biostor.org/reference/192979.
- SEMARNAT. Secretaria de Medio Ambiente y Recursos Naturales. Norma Oficial Mexicana NOM-059-SEMARNAT-2010, Protección ambiental– Especies nativas de México de flora y fauna silvestres– Categorías de riesgo y especificaciones para su inclusión, exclusión o cambio– Lista de especies en riesgo. México. Diario Oficial de la Federación 30 diciembre, 2010.
- García-Mendoza, A. Integración del conocimiento florístico del estado. In Biodiversidad de Oaxaca; García-Mendoza, A.; Ordoñez, M.; Briones-Salas, M.; Eds.; Instituto de Biología, UNAM-Fondo Oaxaqueño para la Conservación, México, 2004; pp. 305–325.
- Contreras-Medina, R.; Luna-Vega, I. Species richness, endemism and conservation of Mexican gymnosperms. Biodiversity Conserv. 2007;16(6):1803–1821. [CrossRef]
- Lips, K.R.; Mendelson, J.R.; Muñoz-Alonso, A.; Canseco-Márquez, L.; Mulcahy, D.G. Amphibian population declines in montane southern Mexico: Resurveys of historical localities. Biol Conserv. 2004; 119(4):555–564. [CrossRef]
- Wake, D.B.; Papenfuss, T.J.; Lynch, J.F. Distribution of salamanders along elevational transects in Mexico and Guatemala. Tulane Publ Zool Bot, Suppl Publ. 1991; 1:303–319.
- Rovito, S.M.; Parra-Olea, G.; Vásquez-Almazán, C.R., Papenfuss, T.J.; Wake, D.B. Dramatic declines in neotropical salamander populations are an important part of the global amphibian crisis. Proc Natl Acad Sci USA. 2009;106(9):3231–3236. [CrossRef]
Figure 1.
Map of subprovinces of Oaxaca: Balsas Depression (DB); Mountains and Valleys of the West (MVO); Tehuacán Trench (TT); Sierra Madre de Oaxaca (SMO); Gulf Coastal Plain (PCG); Central Valleys of Oaxaca (VCO); Mountains and Valleys of the Center (MVC); Isthmic Depression of Tehuantepec (DIT); Sierra Madre de Chiapas (SMC); Sierra Madre del Sur (SMS); Pacific Coastal Plain (PCP) and Tehuantepec Coastal Plain (PCT) (Mata-Silva et al., 2015).
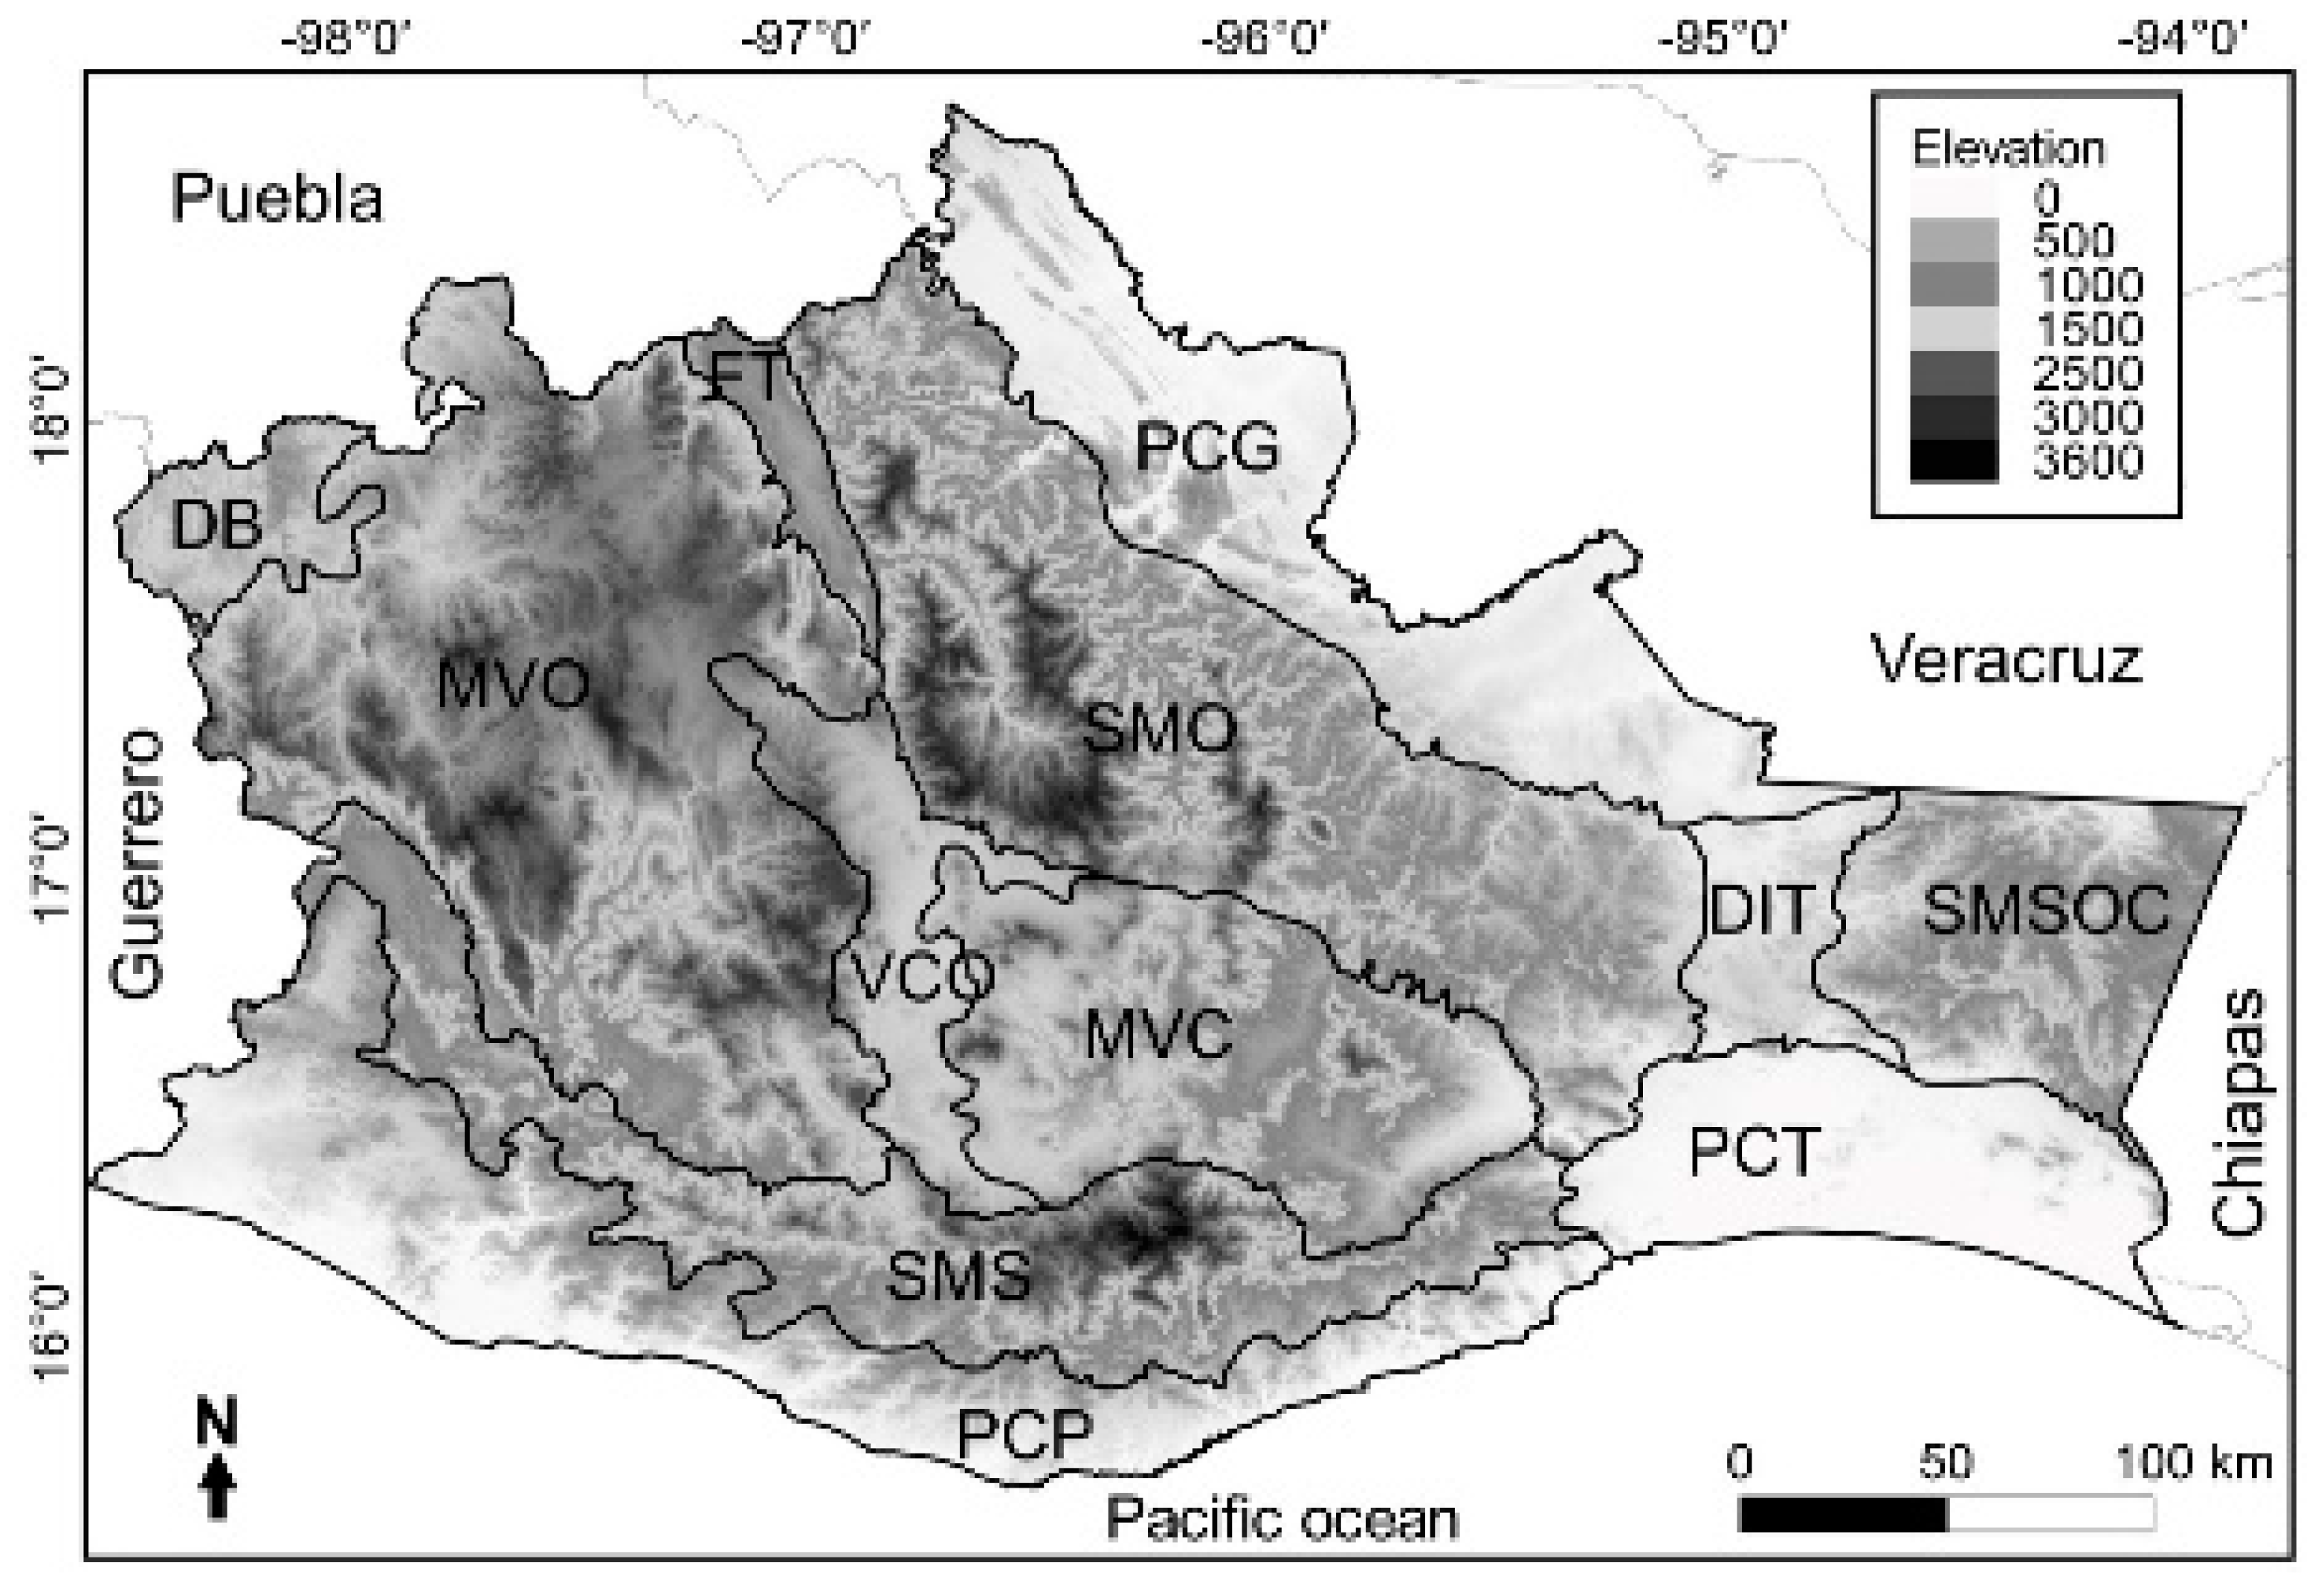
Figure 2.
Total species and taxonomic beta diversity of amphibians, anurans and caudates among the 12 physiographic subprovinces of the state of Oaxaca.
Figure 2.
Total species and taxonomic beta diversity of amphibians, anurans and caudates among the 12 physiographic subprovinces of the state of Oaxaca.
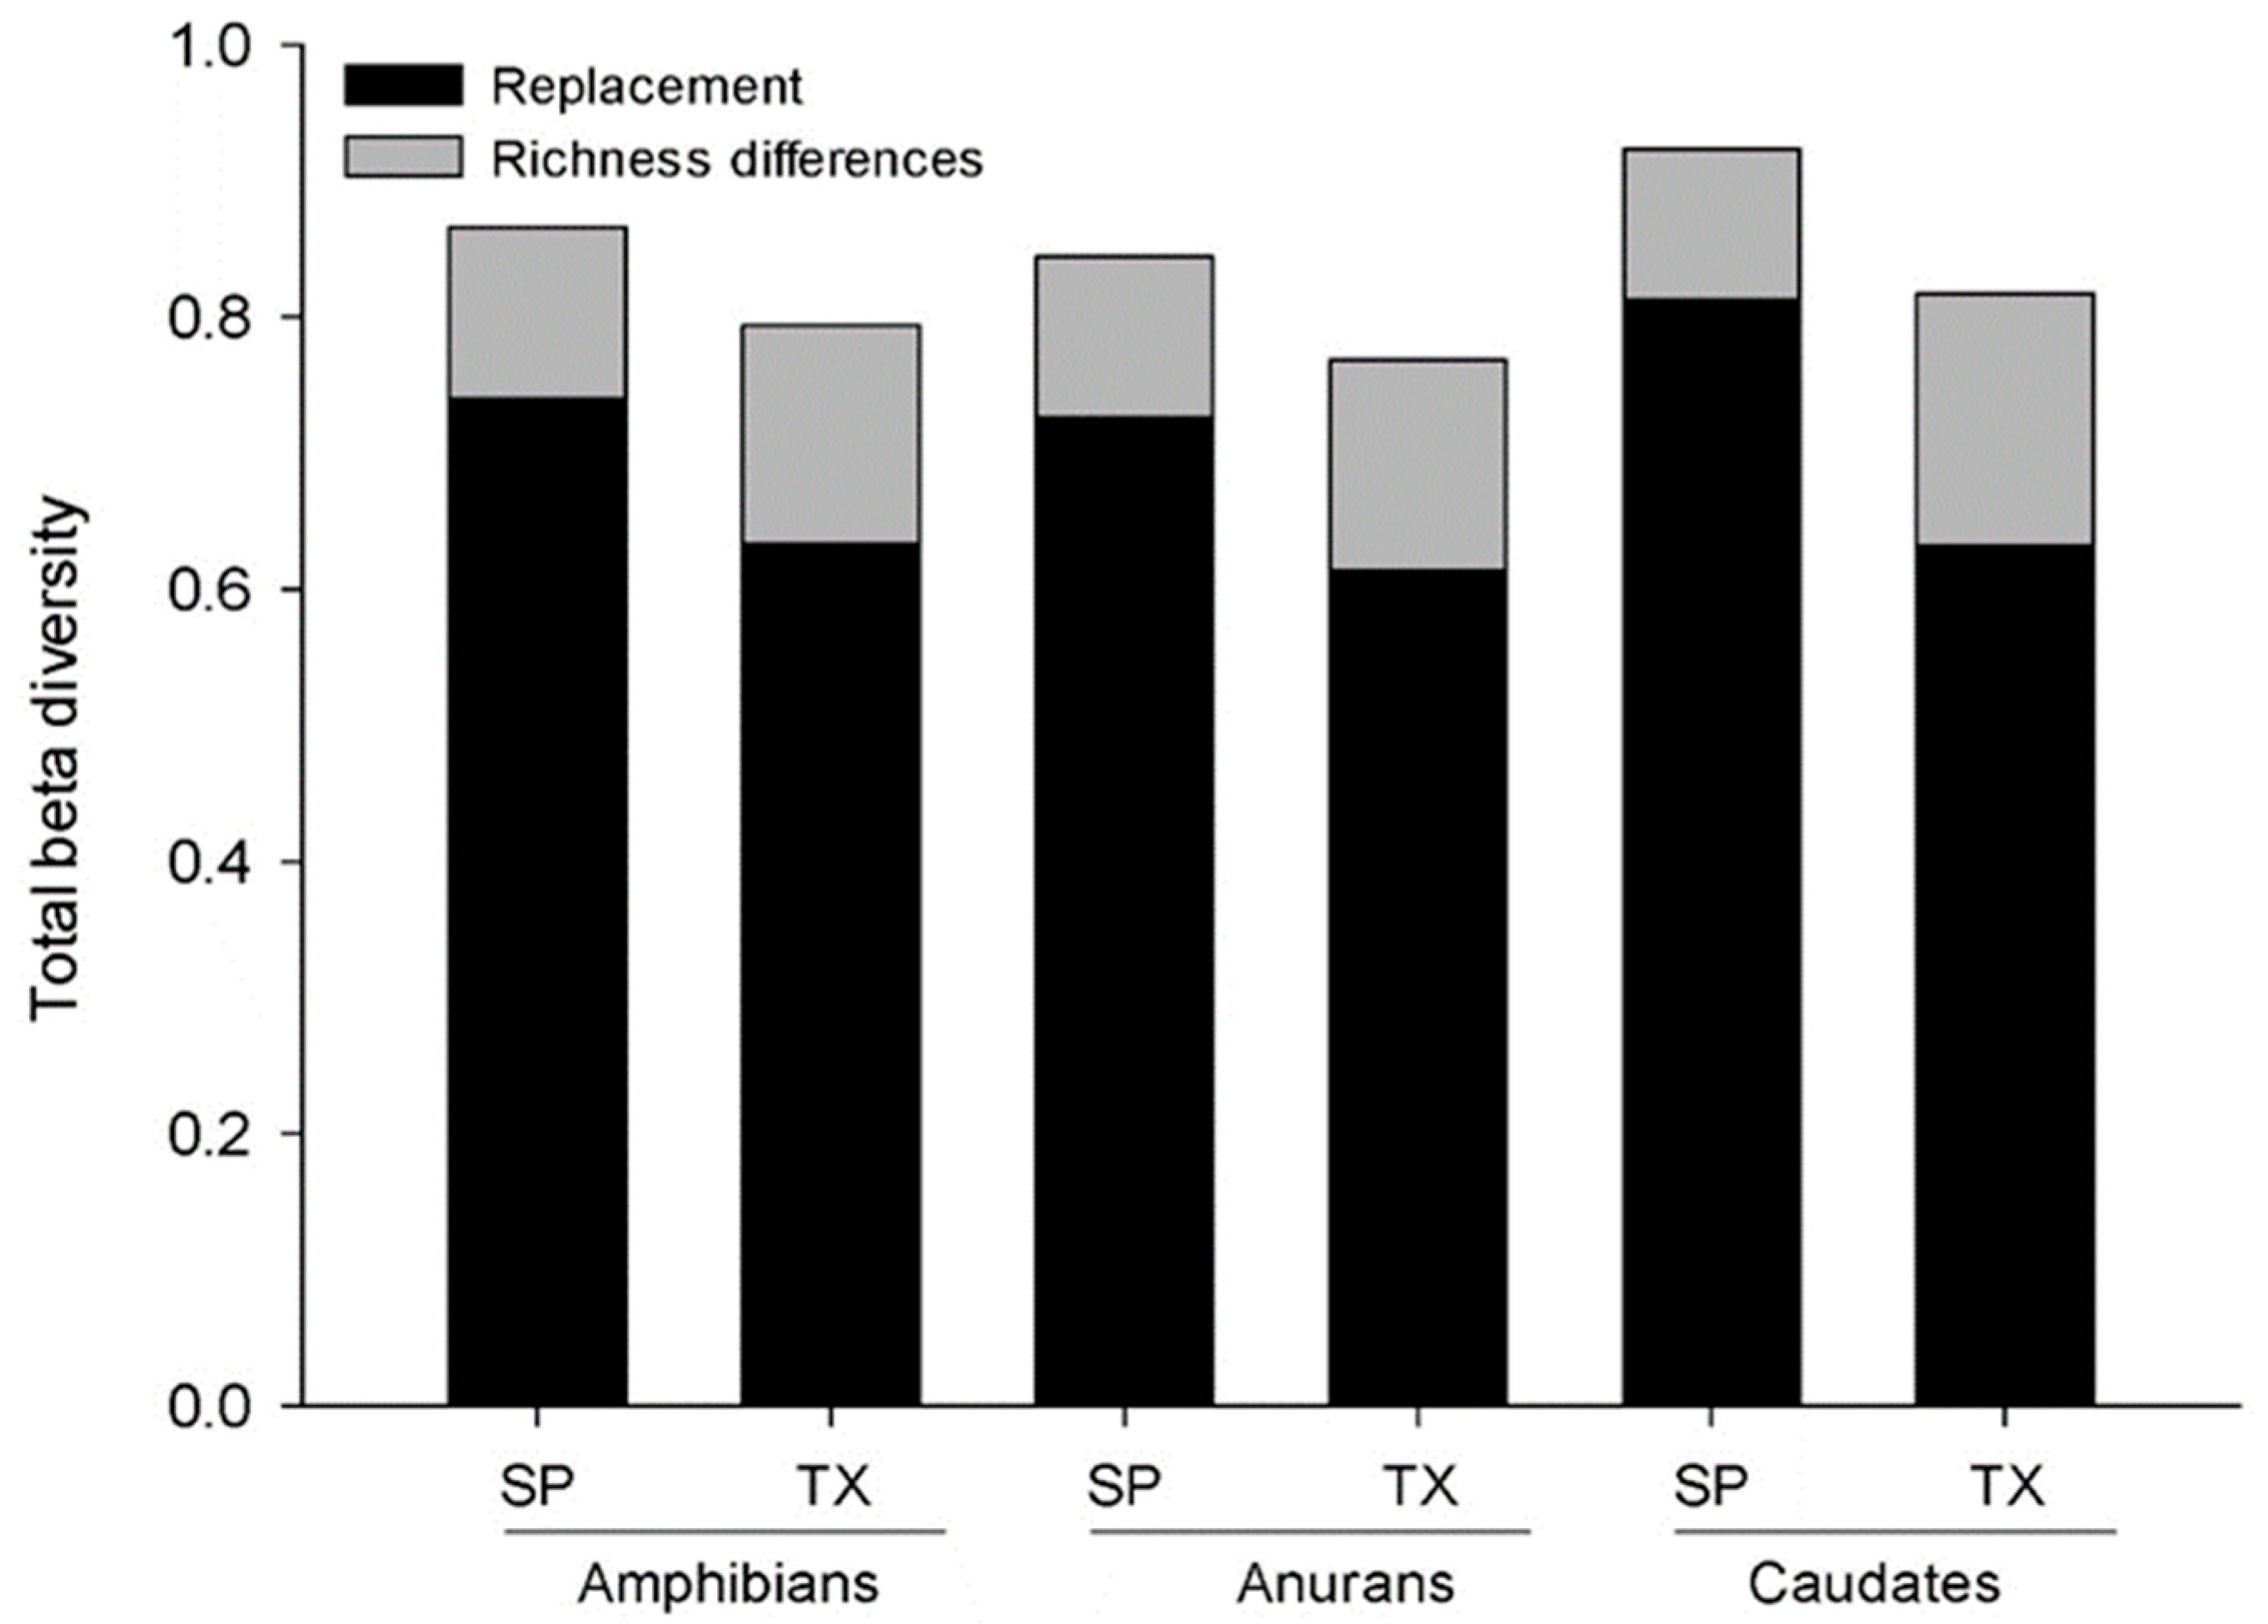
Figure 3.
Species and taxonomic beta diversity calculated between pairs of physiographic subprovinces for amphibians, anurans and caudates.
Figure 3.
Species and taxonomic beta diversity calculated between pairs of physiographic subprovinces for amphibians, anurans and caudates.
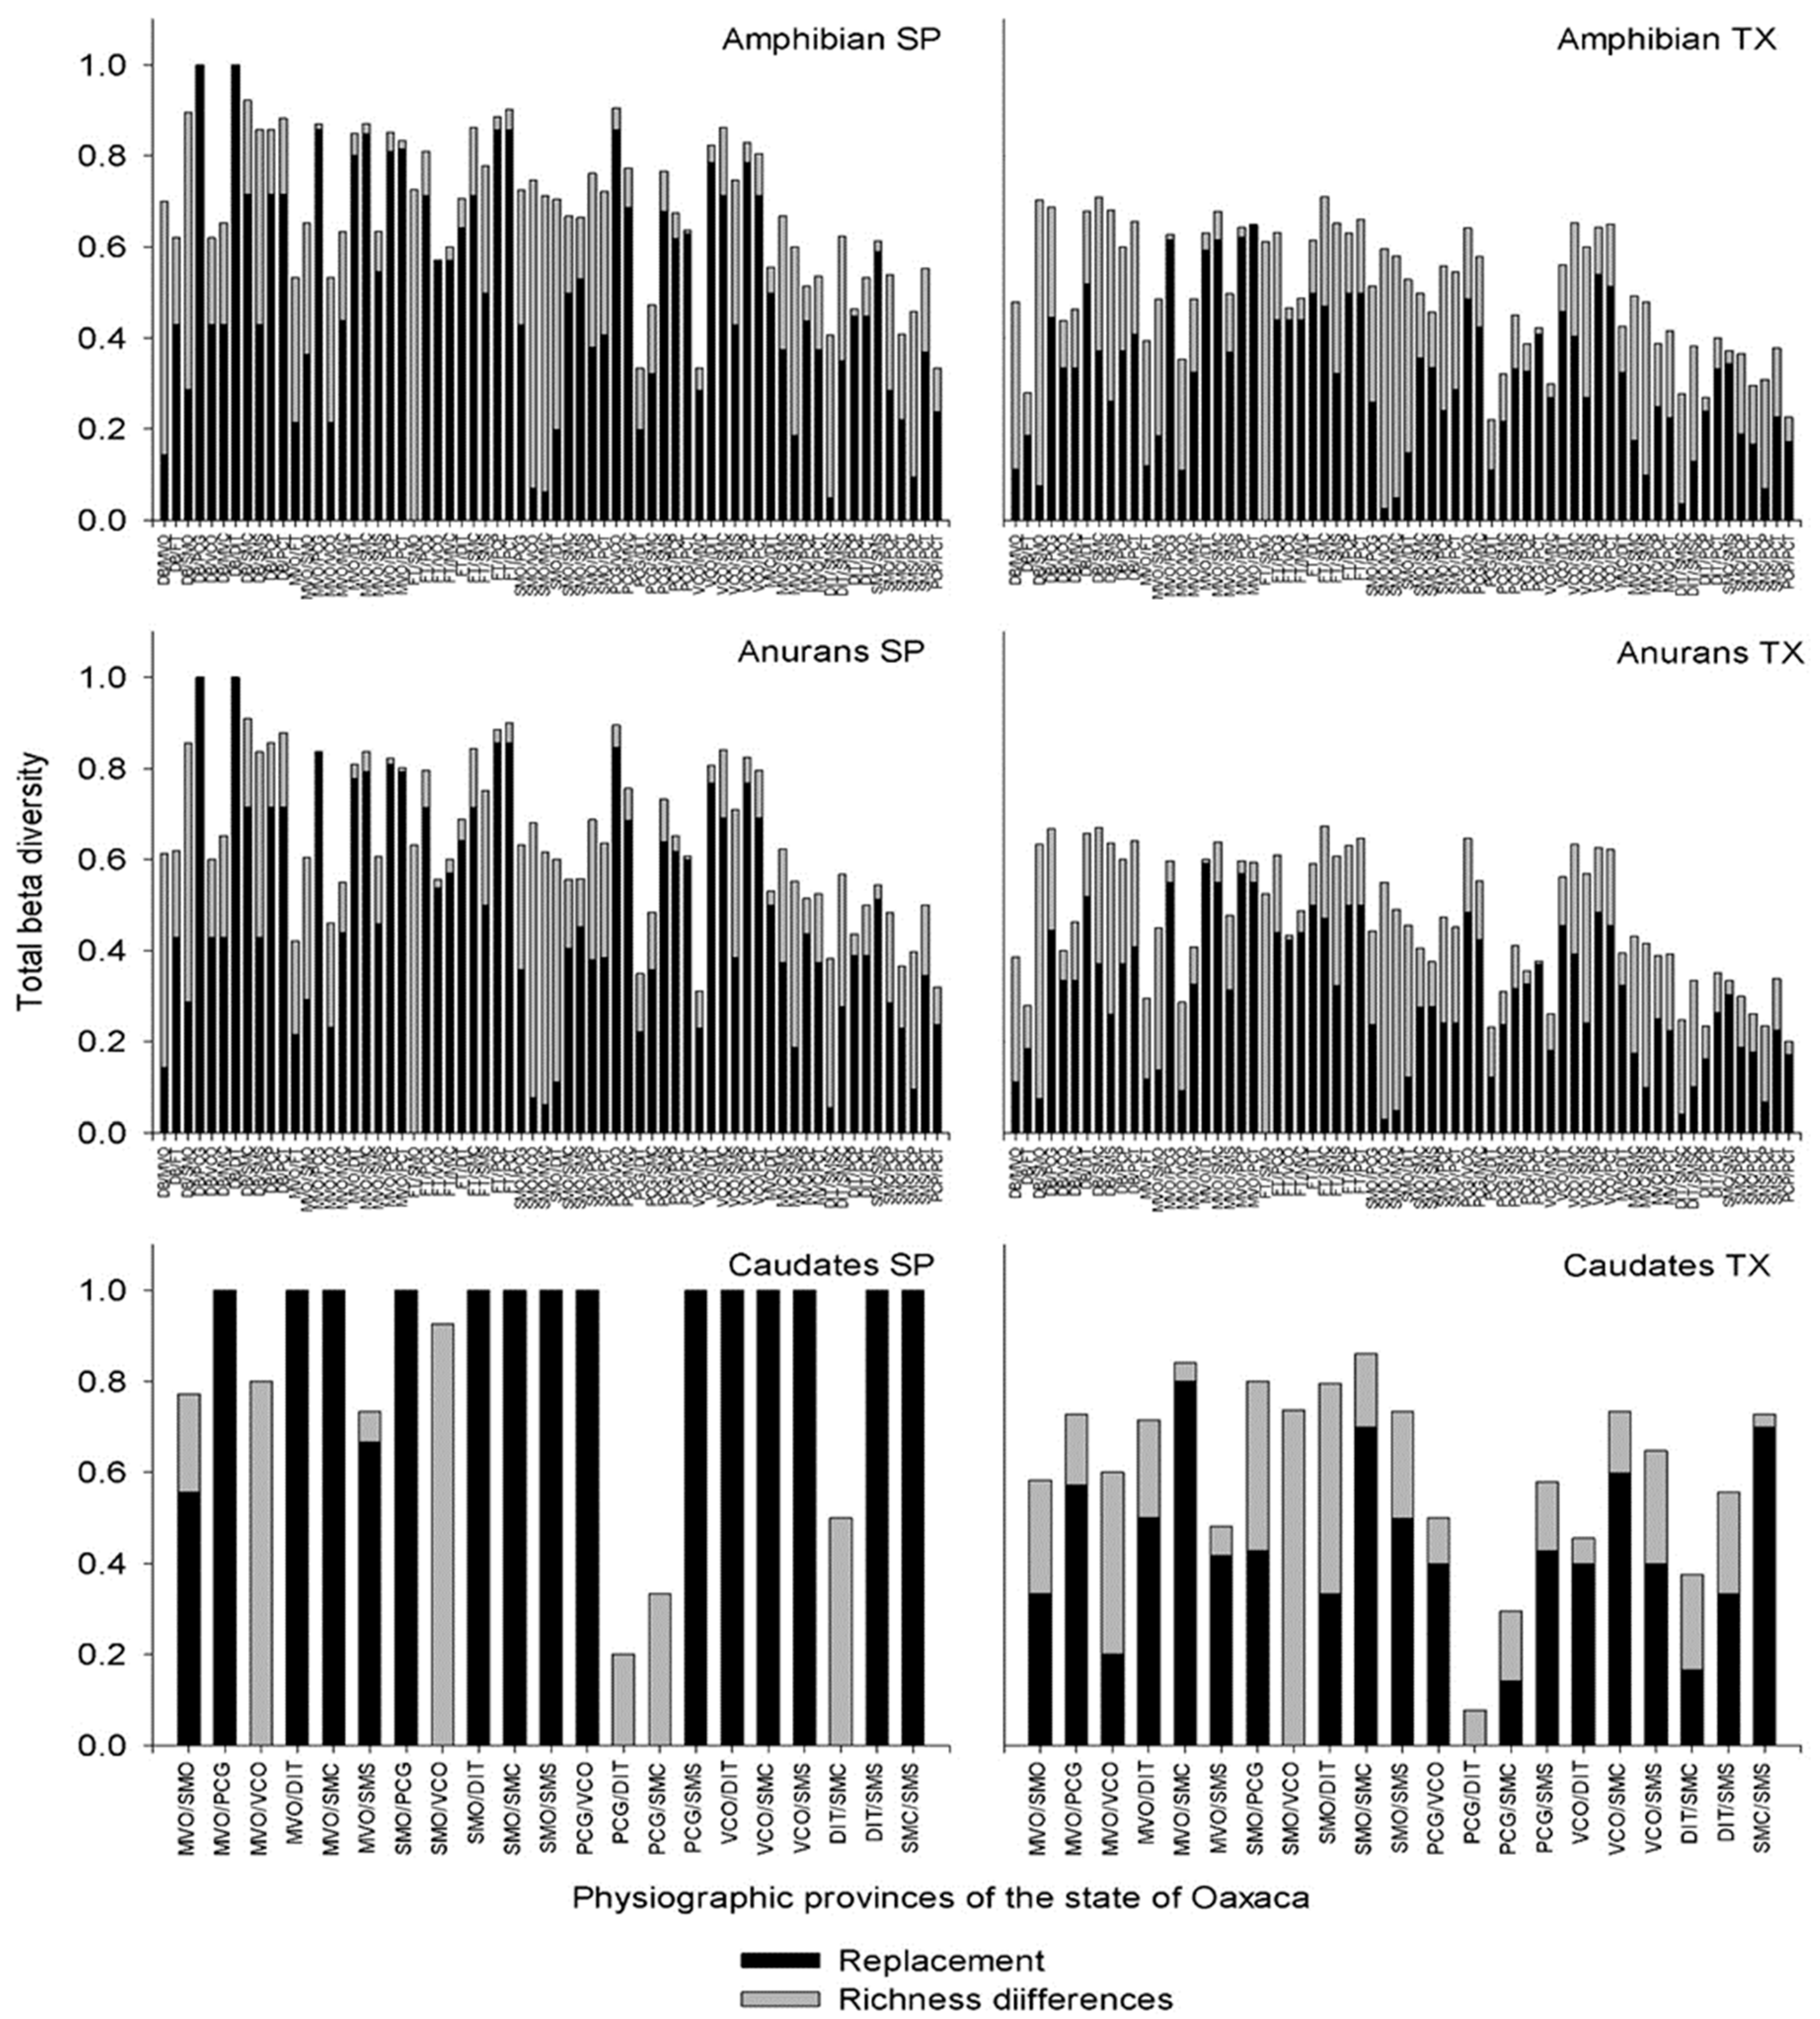
Figure 4.
NMDS ordination analysis for the total species and taxonomic beta diversity, turnover and differences in richness for amphibians, anurans and caudates (that of caudates is new). A) Total beta diversity of anuran species, B) anuran species replacement, C) differences in anuran species richness, D) anuran total taxonomic beta diversity, E) anuran taxonomic replacement, F) differences in anuran taxonomic richness, G) total beta diversity of caudate species, H) caudate species replacement, I) differences in caudate species richness, J) caudate total taxonomic beta diversity, K) caudate taxonomic replacement, and L) caudate taxonomic richness differences.
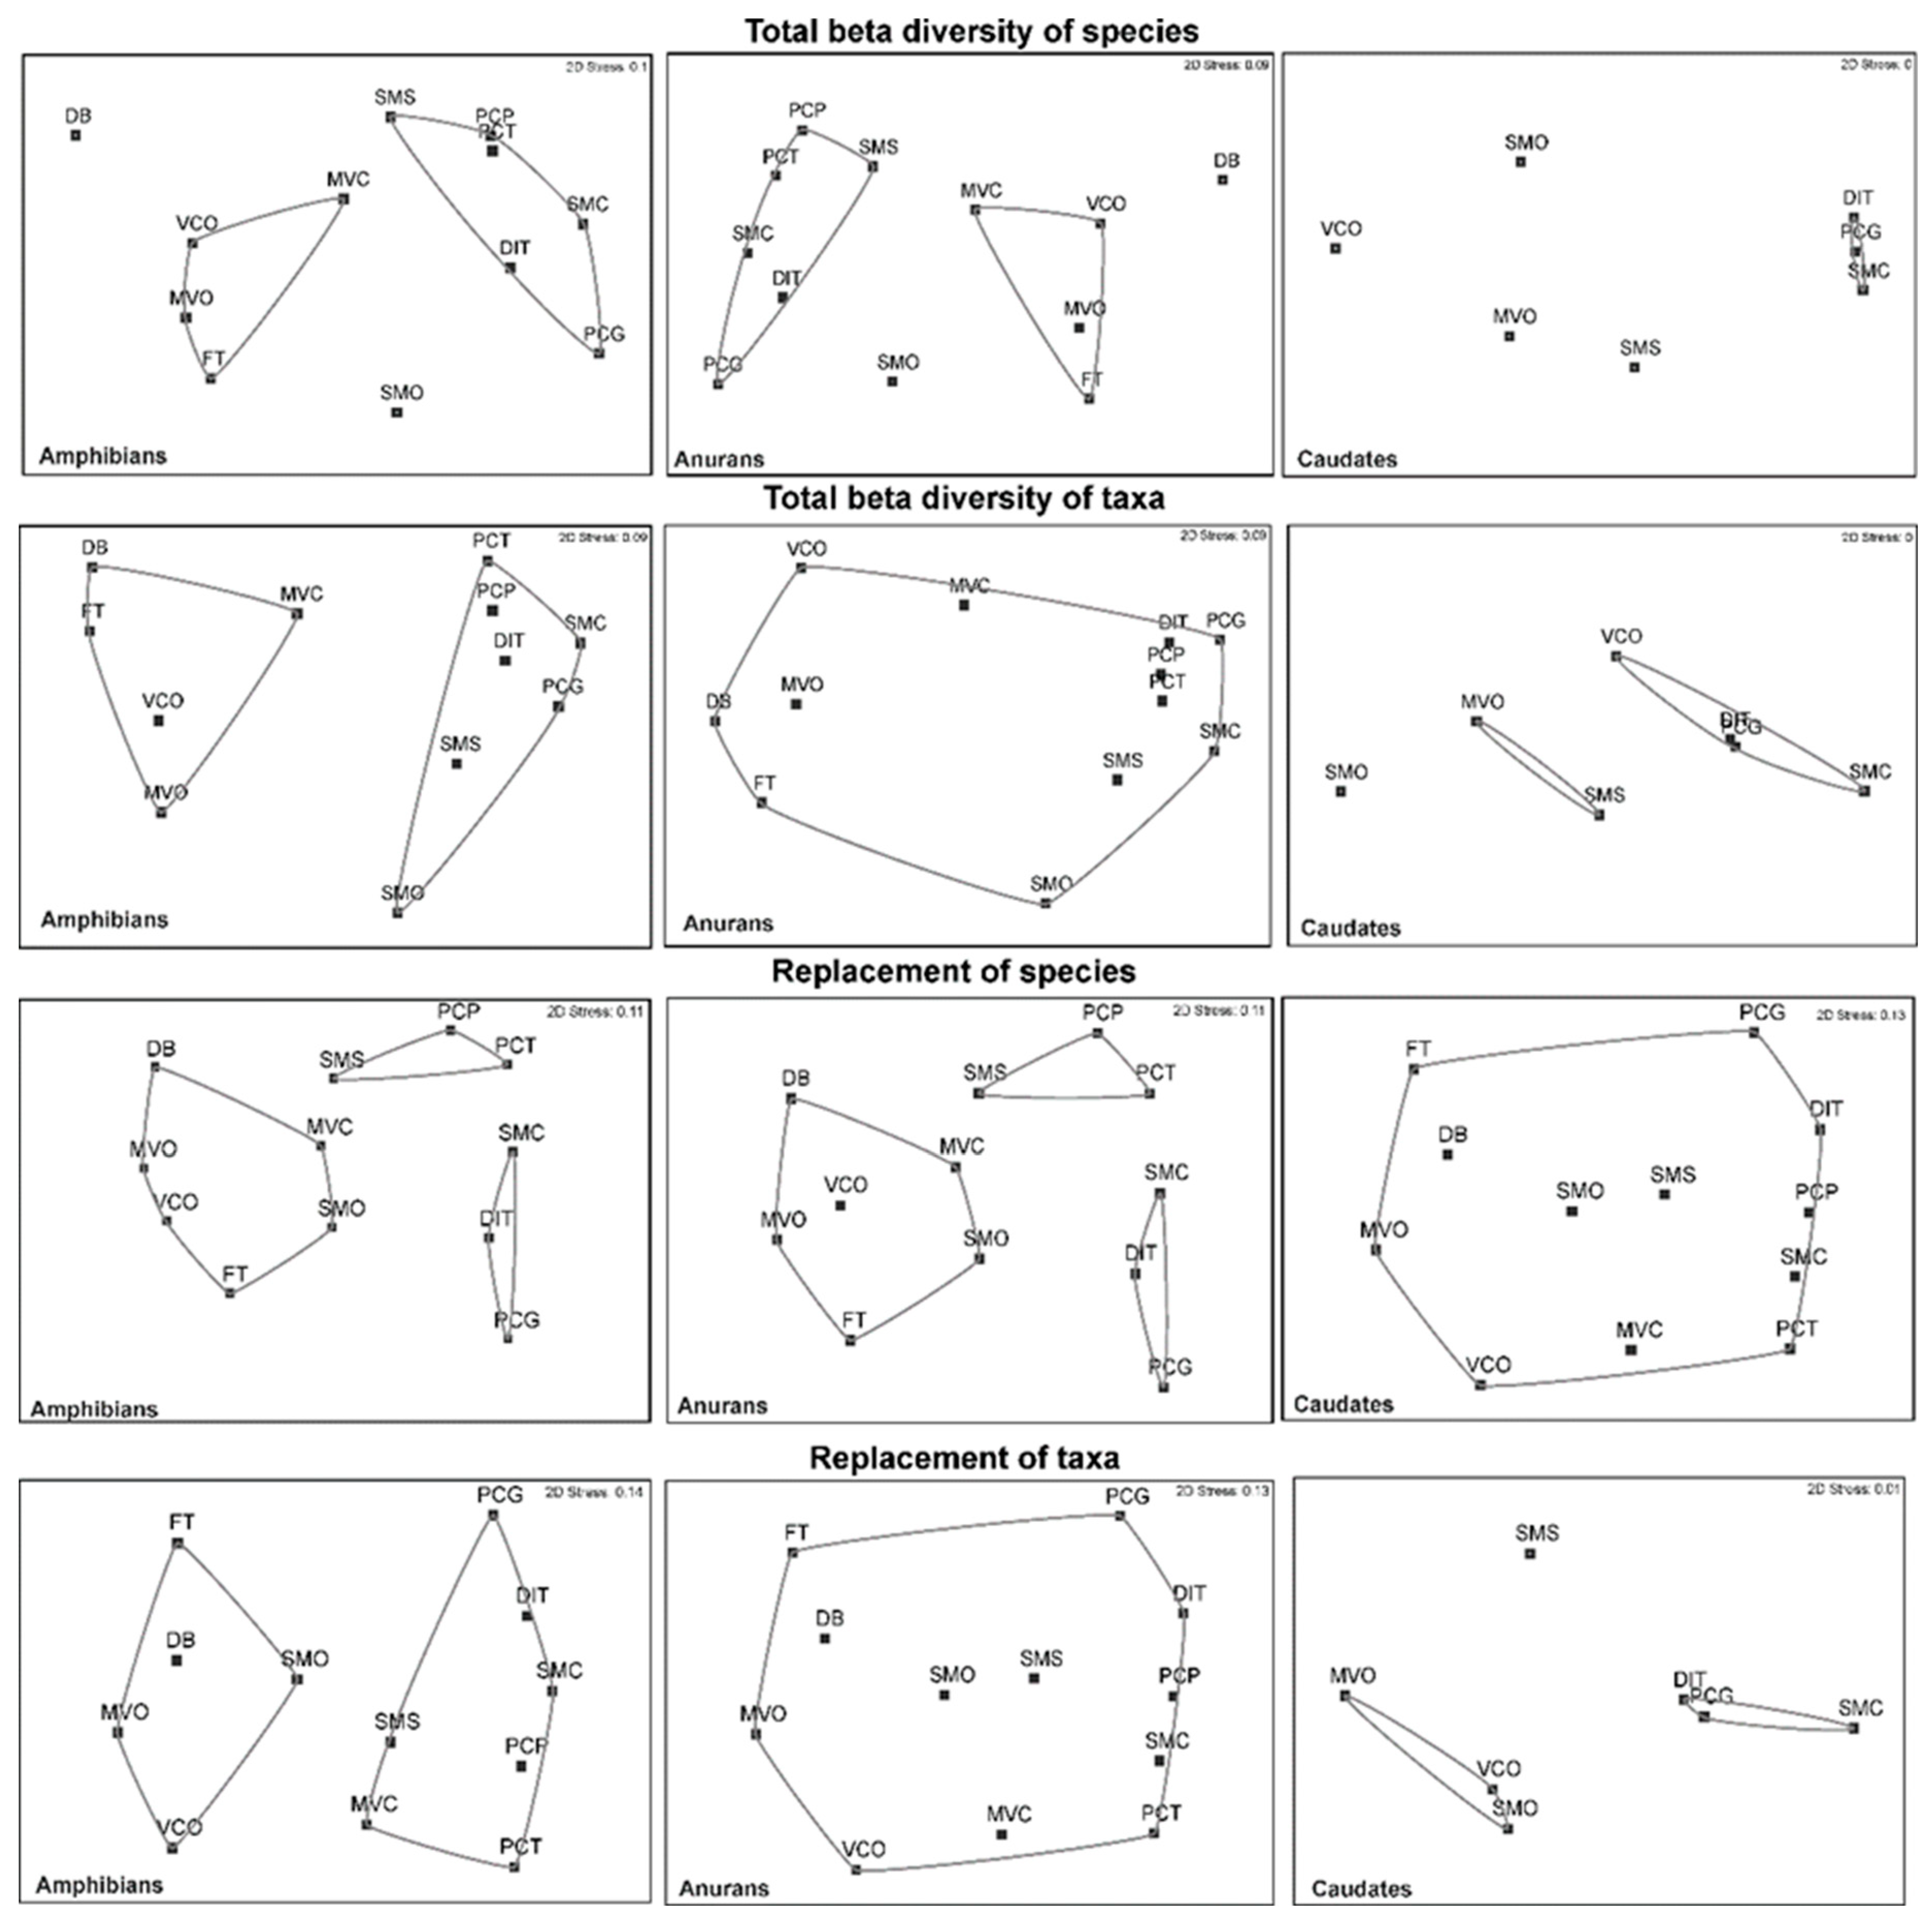
Figure 5.
Correlations between total beta diversity, turnover and differences in richness for species and higher taxa of all amphibians (A, B, and C), anurans (D, E, and F) and caudates (G, H, and I).
Figure 5.
Correlations between total beta diversity, turnover and differences in richness for species and higher taxa of all amphibians (A, B, and C), anurans (D, E, and F) and caudates (G, H, and I).
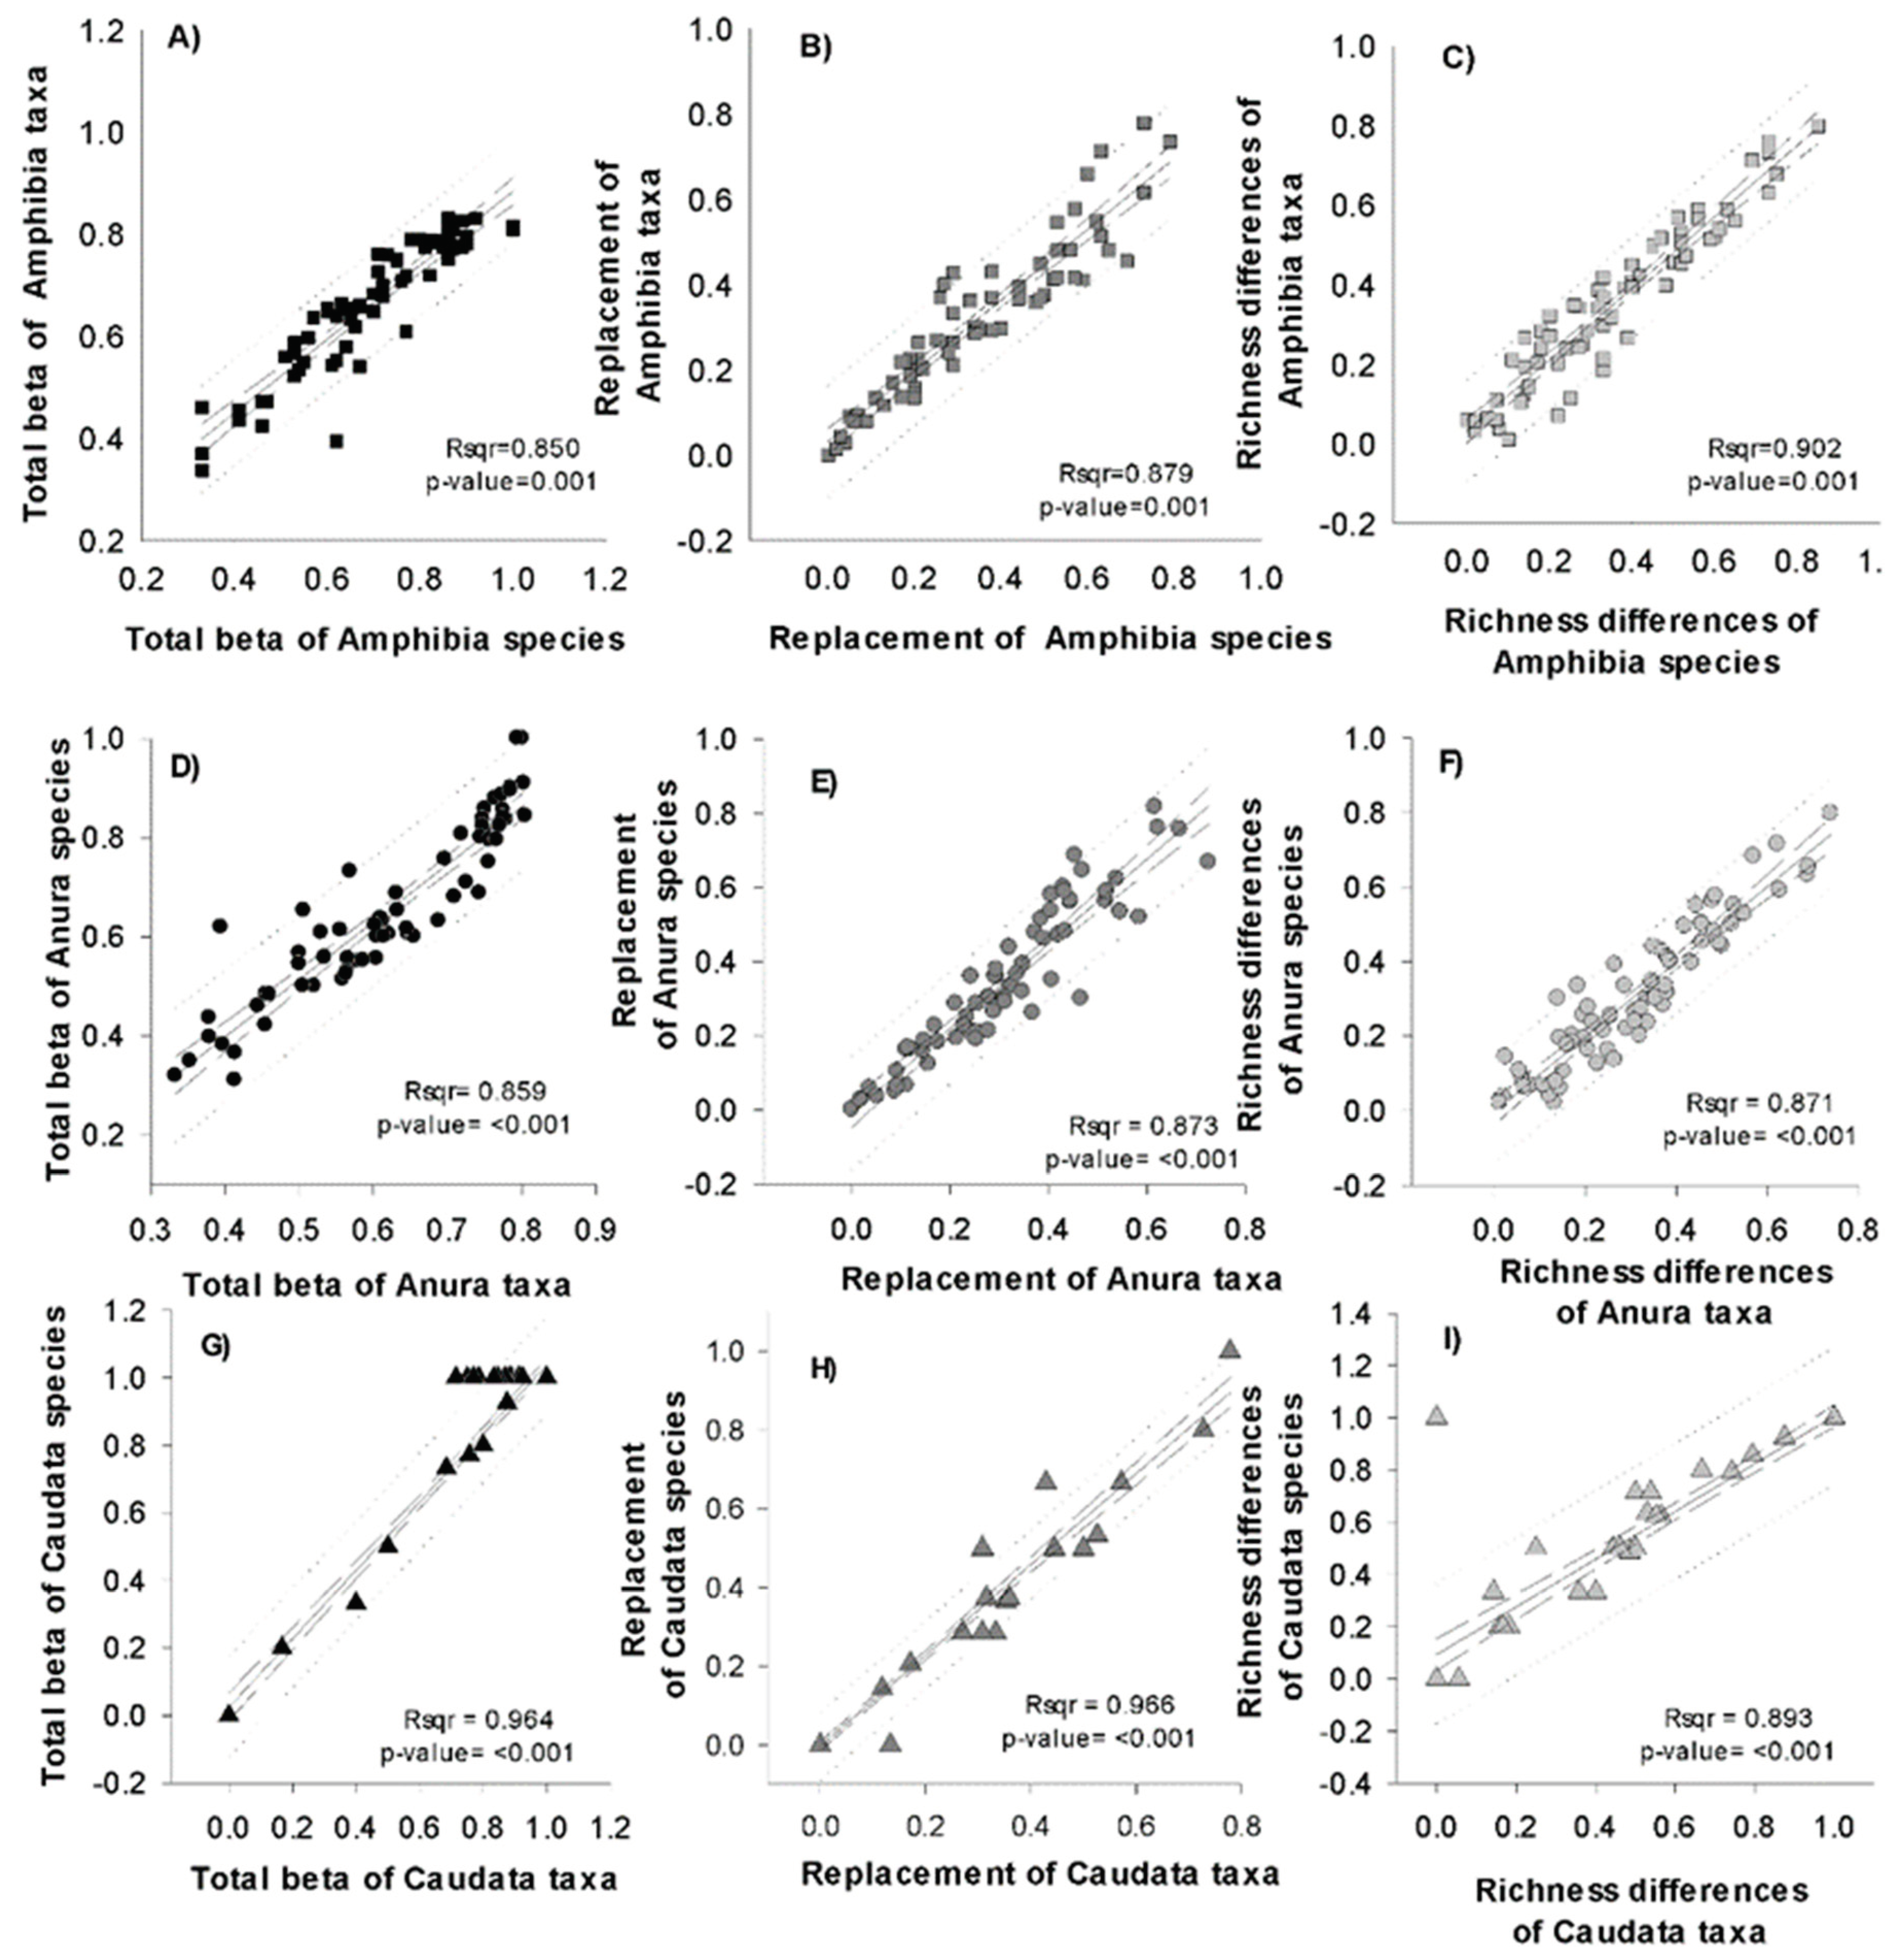

Table 1.
Area, species richness and number of endemics to Mexico and Oaxaca of amphibians, anurans and caudates for the 12 physiographic subprovinces of Oaxaca.
Table 1.
Area, species richness and number of endemics to Mexico and Oaxaca of amphibians, anurans and caudates for the 12 physiographic subprovinces of Oaxaca.
| Subprovinces | Km2 | S Amphibia | S Anura | S Caudata | S Caecilians | Amphibia Mx/Oax | Anura Mx/Oax | Caudata Mx/Oax |
|---|---|---|---|---|---|---|---|---|
| DB | 1788.17 | 7 | 7 | 0 | 0 | 5/0 | 5/0 | 0/0 |
| MVO | 21262.73 | 33 | 24 | 9 | 0 | 27/13 | 18/5 | 9/8 |
| FT | 1134.21 | 14 | 14 | 0 | 0 | 7/0 | 7/0 | 0/0 |
| SMO | 17519.96 | 88 | 62 | 26 | 0 | 62/43 | 36/19 | 26/24 |
| PCG | 7975.92 | 28 | 25 | 3 | 0 | 4/1 | 2/1 | 2/0 |
| VCO | 2267.42 | 14 | 13 | 1 | 0 | 11/2 | 10/1 | 1/1 |
| MVC | 6662.62 | 16 | 16 | 0 | 0 | 8/1 | 8/1 | 0/0 |
| DIT | 2114.12 | 20 | 18 | 2 | 0 | 3/0 | 1/0 | 2/0 |
| SMC | 5816.08 | 44 | 37 | 6 | 1 | 11/01 | 7/0 | 4/1 |
| SMS | 12350.15 | 49 | 42 | 6 | 1 | 32/12 | 25/6 | 7/6 |
| PCP | 9262.06 | 21 | 21 | 0 | 0 | 7/0 | 7/0 | 0/0 |
| PCT | 4298.77 | 27 | 26 | 0 | 1 | 6/1 | 6/1 | 0/0 |
Table 2.
Number of subprovinces occupied by endemic and nonendemic amphibian species for Mexico and Oaxaca.
Table 2.
Number of subprovinces occupied by endemic and nonendemic amphibian species for Mexico and Oaxaca.
| No. Subprovinces | No endemics | Mexico endemics |
Oaxaca endemics | Total |
|---|---|---|---|---|
| 1 | 10 | 23 | 48 | 81 |
| 2 | 12 | 1 | 10 | 23 |
| 3 | 5 | 8 | 2 | 15 |
| 4 | 4 | 1 | 0 | 5 |
| 5 | 4 | 3 | 0 | 7 |
| 6 | 3 | 2 | 0 | 5 |
| 7 | 4 | 3 | 0 | 7 |
| 8 | 1 | 1 | 0 | 2 |
| 9 | 1 | 0 | 0 | 1 |
| 10 | 3 | 0 | 0 | 3 |
| Total | 47 | 42 | 60 | 149 |
Disclaimer/Publisher’s Note: The statements, opinions and data contained in all publications are solely those of the individual author(s) and contributor(s) and not of MDPI and/or the editor(s). MDPI and/or the editor(s) disclaim responsibility for any injury to people or property resulting from any ideas, methods, instructions or products referred to in the content. |
© 2024 by the authors. Licensee MDPI, Basel, Switzerland. This article is an open access article distributed under the terms and conditions of the Creative Commons Attribution (CC BY) license (http://creativecommons.org/licenses/by/4.0/).
Copyright: This open access article is published under a Creative Commons CC BY 4.0 license, which permit the free download, distribution, and reuse, provided that the author and preprint are cited in any reuse.


