
Submitted:
18 February 2024
Posted:
19 February 2024
You are already at the latest version
Abstract
Sustainable development of our society demands recycling of metallic wastes which may contain a variety of metallic impurities. Thus, it is desirable to develop a ‘universal’ structure, such as an amorphous alloy tolerating high concentrations of metallic pollutants. We performed ab initio molecular dynamics simulations to manufacture a novel multicomponent amorphous alloy of twenty elements (20e-HEAA). Analysis reveals both topological and chemical compositional short-range ordering in the obtained 20e-HEAA and formation of B-B clusters. Electronic structure calculations reveal the metallic nature of the amorphous alloy with its Fermi level falling in a valley in the density of states. Moreover, the Zn 3d and Cd 4d electrons exhibit a localized nature and thus, should be excluded from the valence electron concentration (VEC) analysis in the study of high-entropy alloys. The information obtained here is helpful to get insight into multicomponent high entropy materials, especially multicomponent high-entropy amorphous alloys as potential circular metals.
Keywords:
Multicomponent alloys
; High-entropy alloys
; Amorphous alloys
; Valence electron concentration
; Circular metals
; Ab initio molecular dynamics simulations
1. Introduction
Recycling of metallic scrap and discarded parts is crucial for the environment-friendly, sustainable development and circular economy of our society [1,2,3]. Metallic wastes contain various metallic impurities introduced during manufacture, usage, sorting and treatment processes [1,2,5,6]. Many techniques have been developed to deal with metallic impurities in scrap [6,7,8]. Removal of impurities is a widely used approach to obtain purer metals/alloys for circular metals [6,7]. This approach involves several processes and is costly in energy, manpower and time. Another potential approach is to find a material with a single structure, a ‘universal’ phase which can tolerate a broad variety of metallic impurities for recycling metal wastes.
The development of multicomponent high-entropy alloys (MC-HEAs) [9,10,11,12,13] provides us with an opportunity to reach single-phase crystalline materials with desirable properties. Compared to conventional alloys which consist of one or two principal elements, MC-HEAs contain multiple principal elements (typically more than four principal elements) and are designed principally based on configurational entropy, with a contribution that is large enough to stabilize a single-phase or near-single-phase crystalline compound at elevated temperatures.
The development of bulk metallic glasses (BMGs) provides us with another choice. BMGs can be manufactured with relatively slow cooling rates [14,15] and the products are stable at ambient conditions, being used in industry [14,16]. Previous study has revealed the confusion principle, i.e., that an increase in the number of elements may induce difficulties for the liquid to crystallize [17]. Naturally, the addition of principal elements of different atomic size and chemical nature enhances the complexity of the liquid, making crystal nucleation difficult, and thus favoring the formation of amorphous materials.
As shown before, multicomponent high entropy alloys (MC-HEAs) exhibit high stability due to their configurational entropy contribution. For multicomponent high entropy amorphous alloys (MC-HEAAs), the number of configurations is even higher than that of the corresponding crystal phases because they lack both topological and compositional long-range ordering in the amorphous state [18,19]. Thus, a ‘universal’ MC-HEAA may be a good option for recycling of metal wastes.
There have been many investigations on MC-HEAs with structural frames of predominantly face-centered cubic (FCC) lattices, e.g., the Cantor alloys consisting mainly of 3d transition metals [10,11,20] or of body-centered cubic (BCC) lattices, e.g., the Senkov refractory alloys consisting mainly of early transition metals [11,12,13,21]. There have also been investigations on multicomponent bulk glasses (MC-BMG) [14,15,22]. Recently, MC-BMGs with excellent mechanical and physical properties with chemical compositions, e.g., Fe26.7Co26.7Ni26.6Si9B11 [23] and Ti16.7Zr16.7Hf16.7Cu16.7Ni16.7Be16.7 [24] with good mechanical properties were prepared. Luan et al. prepared an equiatomic NbNiZrTiCo glass with high stability at elevated temperature [25].
Theoretical approaches, including parameter-free ab initio molecular dynamics techniques have been applied to MC-HEAs, focusing on the Cantor- and Senkov-based systems [26,27,28]. Parmar, et al. developed a generic strategy for numerically modelling MC-BMGs [29].
Here we explore the formation, stability and structural properties of a high entropy amorphous alloy with 20 elements (20e-HEAA) by means of ab initio molecular dynamics simulations. The 20 metallic elements were chosen for exhibiting a rich variety of atomic sizes, lattices and electronic properties as shown in the following section. This helps enhance the difficulty for the liquid to crystallize. The magnetic 3d transition metals are excluded to reduce computational costs. The simulations reveal the high stability of the amorphous form of the alloy at ambient conditions. We analyze the topological and compositional short-range ordering in the obtained MC-HEAA samples. First-principles electronic structure calculations again show the stability of this multicomponent high-entropy amorphous alloy and reveal the roles of the different types of atomic species in the 20e-HEAA samples.
2. Basic and collective properties of the 20 elements
Based on the classic Hume-Rothery rules for metallic solutions [30], three parameters have been employed to describe the collective behavior of the constituent elements in MC-HEAs or MC-HEAAs [31,32,33]. The first parameter is atomic size difference (δ) which is based on the average atomic size (rav) for the system of n atomic species [30,31],
where ci and ri are the atomic fraction and atomic radius of atom i. The atomic size difference (δ) is defined as,
The unit of δ is percentage, and the δ value for the chosen 20e.
The second parameter is mixing enthalpy ΔHmix which can be approximated as:
where Ωij = 4 Δmix(AB) and Δmix(AB) is the mixing enthalpy of the binary AB alloys [33].
Accordingly, we can also define the average contribution to the mixing enthalpy Δmix(i) for element i in the equiatomic system of n elements as,
The difference of electronegativity values, Δχ as the third parameter is defined as,
where χav = ∑ci χi represents the average value and χi is the Pauling electronegativity value for element i.
Averaged values for other parameters, e.g., the melting temperature or the bulk moduli can be obtained using relations similar to Equation 1.
The values of the basic properties of the chosen elements – lattice types, atomic masses, valence electrons, atomic radii, Pauling electronegativity and melting temperatures – are taken from the literature [30,31,33,34] and are listed in Table 1. The average atomic size (rave) and the related atomic size difference (δ) according to Equations 1 and 2, the average values of mixing enthalpies for each element (Equation 3b) and average value of heat of mixing for the equiatomic 20e system via Equation 3a, and average melting temperature based on the melting points of the elements [33], as well as difference of electronegativity values (Equation 4) are also included in Table 1. We also plot the values of the melting points, Pauling electronegativity data and atomic volumes of the 20 elements and the related average values in Figure 1.
From Figure 1 and Table 1, the 20 atomic species exhibit a rich variety of basic properties. The 20 elements can be divided into five different types:
1). Nine transition metals (TM), (3d) Sc, Ti, V, and Zn, (4d) Mo and Cd, and (5d) Hf, Ta and W. The TMs exhibit three different lattices. It is noted that Zn and Cd are usually classified as transition metals with a VEC number of 12. This indicates that the 10 d-electrons are accounted as valence electrons [10,28]. The role of these d-electrons will be discussed later.
2). Five main group III elements, B, Al, Ga, In and Tl, each of which have three s and p valence electrons. B has the smallest volume among the 20 elements.
3). Two main group IV elements, Si and Ge,each of which has a diamond cubic lattice with tetrahedral coordination (sp3 hybridisation) [35,36]).
4). Three main group V and VI metals, Sn, Sb and Pb, each of which contains an inert ns2 electron-pair [36].
5). La, the only rare earth element with zero 4f electrons. It has the largest volume in the 20 elements. Interestingly, La has a high binary value of heat of mixing with many other elements [33].
Table 1 shows the average VEC value is 4.8 (including the Zn 3d and Cd 4d electrons) and the average ΔHmix is approximately -10 KJ/mol. These values suggest that the stable phase favours a BCC structure according to the previous criteria [28,32]. Meanwhile, the large atomic size difference, δ = 14.6 % and large Δχ value (0.324) indicate that it is difficult for the 20e-system to form a single-phase solid solution [10,32]. Moreover, the 20 pure elements exhibit several different lattices, including FCC, BCC and hexagonal as shown in Table 1. This complexity enhances the difficulty for the liquid to crystallize [17]. Therefore, the large atomic size and electronegativity difference and the wide variety of different elemental lattices suggests a tendency for the 20e system to form an amorphous phase at ambient conditions, instead of a single crystalline phase according to the criteria established in the literature [10,11,32].
3. Details of ab initio molecular dynamics simulations
Periodic boundary conditions were employed for the ab initio molecular dynamics simulations. A cubic supercell and the equiatomic approach were utilized. The content is 5 at.% for each element. The length of the cubic supercell was determined by the volumes of the input atoms with consideration of thermal expansion at the simulation temperatures [34]. In this way a cubic cell with a = 16.49 Å was built for the 200-atom system.
We first produced a liquid using a single component, namely Al which has a moderate melting temperature (944.5 K [34]) by equilibrating at 5000 K for 2000 steps (1.5 fs(femosecond) per step). Then, we replaced randomly the Al atoms by the 20 elements similar to the method of preparing random O/N distributions in the BaTaO2N perovskite [37]. The liquid was then treated as shown in Figure 2. The samples were first equilibrated dynamically at 3000 K for 3 ps. This temperature is notably higher than the average melting temperature of the 20e system (1463 K, Table 1). Then, two different treatments were applied: (1) continued equilibration of selected samples at 3000 K for another 13.5 ps(picosecond); and (2) cooling other samples to 1000 K in 6 ps followed by equilibrating them at 1000 K for another 21 ps. Selected equilibrated samples were quenched to 0 K and relaxed to remove the internal forces produced at elevated temperature. In this way we can obtain results of statistical meaning [38,39]. The volumes of the 20e-HEAA systems at different temperatures were determined by the results of the NPT approach [40,41] which was implanted into the first-principles package VASP (Vienna Ab initio Simulation Package) [42,43] using experimental data at the different temperatures [34].
All ab initio molecular dynamics (AIMD) simulations were performed using the code VASP [42,43]. VASP is a pseudopotential plane-wave approach within the density functional theory [44]. This code utilizes the projector augmented wave method [45]. Moreover, it permits variable fractional occupation numbers and therefore, works well for metallic systems [43]. The exchange and correlation terms are described using the generalized gradient approximation (GGA) [46], because a previous study showed that the GGA results are better than the local density approximation, especially for transition metals [47].
For structural optimization and for the NPT calculations to determine the volumes of the 20e systems, high cut-off energies were used, of 400.0 eV for the wave functions and 550.0 eV for the augmentation functions respectively. These energies are higher than the corresponding default values of the metallic atoms for which the highest values are ENMAX/Eaug = 318.6 eV /535.3 eV for boron. For the AIMD simulations of the supercells, an Ecut = 300 eV was used, which is higher than the ENMIN (239.0 eV) and close to the ENMAX (318.6 eV) for boron. The Γ point was adopted in the Brillouin zones [48], because liquid or amorphous systems lack periodicity [37,42]. Test simulations for different cut-off energies ranging from 200.0 eV to 400.0 eV and different volumes of the supercells revealed no significant differences in the obtained results, demonstrating the present settings are reasonable.
4. Results and discussions
4.1. Structural properties of the 20e-HEAs
The AIMD simulations revealed that at 3000 K (R1 in Figure 2) the energy of the system decreases quickly with time in the first 2.5 ps, and then stays at an approximately constant value up to 16.5 ps. The energy decreases with the simulation time (temperature) in the cooling process (R2). During the equilibration at 1000 K (R3) the energy continues decreasing for about 1.5 ps before it reaches the equilibration value. Then, samples were obtained with interval of about 1.5 ps. The obtained samples were relaxed to remove the internal forces.
The simulations also showed that there is no quick decrease of the energy of the system after 16.5 ps at 1000 K, indicating no crystallization occurs. A snapshot of the structure for a relaxed sample is shown in Figure 3c, equilibrated at 1000 K in Figure 3b together with a liquid sample simulated at 3000 K (3a).
Figure 3 shows no significant differences in atomic ordering in the three snapshots. The sample equilibrated at 3000 K in Figure 3a is liquid as the averaged melting temperature is about 1463 K (Table 1). Meanwhile the sample in Figure 3b is equilibrated at 1000 K which is lower than the average melting temperature. A careful look reveals that there is no long-range topological ordering either in the sample equilibrated at 1000 K (Figure 3b) or the relaxed structure (Figure 3c). This indicates their amorphous nature. The major difference is the size of the cells. The length of the cube is a = 16.82 Å for the sample at 3000 K (Figure 3a), a = 16.32 Å for the sample at 1000 K (Figure 3b) and a = 16.21 Å for the relaxed sample (Figure 3c) based on the NPT calculations and the experimental values on the temperature [33].
In order to assess the degrees of amorphous/crystalline nature of the liquid at 3000 K and amorphous solids at 1000 K and in the relaxed samples, we use the partial pair distribution function (PPDF) gi(r) and pair distribution function (PDF) g(r) and corresponding partial pair density function ρi(r) and pair density function ρ(r), which are defined, respectively as [49]:
where ρ0 is the average density of atoms, N is the total number of atoms, rij is the distance between atom i and atom j, and ci is the atomic fraction of species i. δ(r – rij) is the Dirac delta function, which is equal to 1 when r = rij and 0 when r ≠ rij. When r → ∞, gi(r) = 1 and g(r) = 1.
We analyzed the pair distribution functions for ten liquid samples simulated at 3000 K, ten samples equilibrated at 1000 K and ten samples relaxed at 0 K using Equation 5b. The obtained results are shown in Figure 4.
The overall shapes of the three curves in Figure 4 are similar to each other. In all the samples there are weak densities around 1.8 Å, there is a high 1st peak at about 2.8 Å with a valley at 4.0 Å, then there is a broad plateau from 4.5 to 5.8 Å, followed by a shallow valley at about 6.5 Å. In the rest of the curves the density functions vary slightly. Structural analysis revealed the formation of B-B pairs and three-B triangles and even four-B squares in the samples. These B-B clusters correspond to the weak densities at 1.8 Å in Figure 4. The overall PDF curves indicate the topological amorphous nature of all the samples equilibrated at 3000 K and 1000 K before and after relaxation.
Careful analysis revealed subtle differences in the pair distribution functions of the three different types of samples. The height of the 1st peak decreases in a series from the relaxed samples to the samples equilibrated at 1000 K and then to those at 3000 K. Correspondingly, the width of the 1st peak increases in the same sequence. Figure 4 also shows that the PDF value at the valley at about 4 Å of the samples equilibrated at 3000 K is notably higher than those equilibrated at 1000 K and the relaxed samples. The latter two display high similarity, which indicates the solid nature of the samples at 1000 K. This agrees with the average melting temperature (1463 K, Table 1).
Overall, the present simulations reveal the topologically amorphous nature of the samples equilibrated at 1000 K for over 20 ps and those after relaxion at 0 K. This corresponds to the large number of atomic species of significantly different nature and corresponding high entropy contribution, which makes it difficult for the liquid to crystalize. The broadness of the PDF curves and the peak of B-B clusters also indicate the effect of compositional ordering in the 20e-HEAA.
Chemical compositional ordering in amorphous materials can be described by element-resolved partial pair distribution functions (PPDFs) [11,49]. The PPDF curves for each elemental species were obtained via Equation 5a and are shown in Figure 5.
The PPDFs provide information about the chemical compositional contributions to the short-range atomic ordering. The PPDF curve for B starts at 1.7 Å with a peak at 1.8 Å, which corresponds to the B-B clusters. Then there is a sharp peak with high density at 2.2 Å (the first peak), corresponding to B coordination by the larger metallic atoms. For the rest of the elements, there are apparent first peaks which are positioned differently and have a variety of widths. The same is also true for the second peaks.
To further distinguish between topological and compositional ordering, we performed AIMD simulations for three pure typical elemental liquids, B with the smallest radius, Al with an intermediate radius and La with the largest radius. The samples were first simulated at 3000 K for 6 ps to obtain corresponding liquid samples. Then the liquid samples were equilibrated for 6 ps at 1000 K for B and La and 500 K for Al. The obtained PDF curves of the pure elemental amorphous samples are compared with the corresponding PPDFs in the 20e-HEAAs in Figure 6.
Both the PPDF of B in the 20e_HEAAs and the PDF of the pure B amorphous sample starts from 1.7 Å. For pure B amorphous samples, the first PDF peak is at 1.8 Å, followed by a broad valley at 2.4 Å. The second peak is at 3.2 Å and the weak third peak at 4.6 Å. Meanwhile, for the PPDF curve of B in the 20e-HEAAs, there is a weak peak is at 1.8 Å, corresponding to B-clusters and the first peak is at 2.2 Å and then a broad 2nd peak at 4.6 Å. Overall, except for the peak at 1.8 Å, the PPDF curve of the 20e-HEAAs has little similarity to that of the pure B sample, due to the variety of different neighboring atoms in the alloy.
The general structure of the PPDF curves of the Al and La in the 20e-HEAAs are similar to those in the corresponding pure elements, except for the positions of the peaks. This is due to the constant atomic radius of all the atoms in each pure element, compared with the variety of different atomic sizes in the 20e-HEAA.
Interestingly, we observed formation of B-clustering during the simulations at 1000 K (Figure S1). Figure 7b shows one B cluster in a square form found in a relaxed sample. Analysis showed no stable clustering for other atoms, e.g., Al during the simulations at both 3000 K and 1000 K (Figure S1). Moreover, formation of B-clusters in other metallic systems were reported in the literature [50]. This indicates the importance not only of topological ordering but also of chemical compositional ordering in the 20e-HEAAs.
Statistical analysis of local structures for the relaxed samples revealed a rich variety of local chemical bonds. Figure 8 shows distributions of coordination numbers of nearest neighbours for an amorphous sample. The bond-length of each M1-M2 pair is determined by the sum of the atomic radii of the two atoms (M1 and M2) with extra 20% as cut-off, that is, dcut = (ri + rj)×1.20 as shown in the chemical bonding theory [51,52].
The coordination numbers of the different atomic species vary in the ranges between 5 to 15 as shown in Figure 8. The transition metals of large atomic sizes, such as Hf, Mo and Ta have more neighbours. Meanwhile, some atoms, e.g., B (Figure 7a) and Si have relatively small range of coordination numbers. The averaged coordination number for each species also varies between 6.5 for Zn and 13.0 for Mo. The averaged CNN for all atoms in the sample is 9.4 which is in between the BCC structure (CNN = 8) and the simple FCC or HCP (CNN = 12). Such complexity of local coordination causes difficulty for the liquid to crystalize.
4.2. Electronic properties of the 20e-HEAAs
In order to obtain some insight into the chemical interactions in and electronic properties of the 20e-HEAAs, first-principles electronic structure calculations were performed using the relaxed configurations. The obtained total density of states (TDOS) for the ten configurations are shown in Figure S2 in the Supplementary Materials. Clearly, the frames of the TDOS curves are similar to each other. This means that in such a rich variety of chemical environments, the electronic properties of the 20e-HEAAs are similar. This agrees with solid state physics that the valence electrons of all elements belong to the whole crystal collectively and quantum mechanics requires that the atomic arrangements in the cell trends to its lowest potential at the conditions. Next, we discuss one of them in detail.
Figure 9a,b show the obtained total density of states (TDOS) and the partial density of states (pDOS) respectively for one particular configuration. It is noted that the number of configurations for the 20e-HEAA is huge. However, it is expected that the TDOS and pDOSs in Figure 9 provide some insight into the electronic properties of the alloy.
We analysed the variety of the elemental projected density of states curves in different chemical environments using La and W as examples. As shown in Figure S3, the frames of the density of states (DOS) curves for each atomic species in the extremely different chemical environment are similar to each other. Both the upper part of the valence and the lower part of the conduction band of Ta are dominated by 5d states. The lower part of the conduction band of La is dominated by La 4f states, and La 5d states are dominating the upper part of the valence band and the bottom of the conduction band. Thus, it is reasonable to address the general electronic properties using the normalized sum of the DOS curves in the same system for each atomic species.
Figure 9a shows only one band over the energy range. The valence band starts at about -11.0 eV to the Fermi level (0 eV). There are small DOS peaks at the low energy range. The lowest peak at about -11.0 eV consists of dominantly B 2s states coming from B-B clusters. The second small peak at about -10.5 eV is composed of contributions from the B 2s and tails from the neighbouring Ge and some W and Mo.
The TDOS is predominantly composed of s and p electrons in the range from -11.0 eV to -0.5 eV, except two high peaks at -8.5 eV and -7.5 eV (Figure 9a,b). These two peaks come from the Cd 4d (Figure 9b_s) and Zn 3d (Figure 9b_t) electrons respectively. The narrow peaks mean that there is a localized nature of the electrons which contribute little therefore to the chemical bonding in the system. The valence electron concentration (VEC) approach describes the valence electrons which contribute to the chemical interactions [28]. Thus, the localized Zn 3d and Cd 4d electrons should not be included into the VEC value of the system. In this way, the VEC value of the 20e-HEAA system is 3.8 e/atom when we exclude these localized Zn 3d and Cd 4d electrons from the valence band, instead of 4.8 e/atom when we include them (Table 1).
From -5.0 eV to +1.0 eV the d-electrons of the transition metals (except Cd and Zn) dominate the TDOS. From -5.0 eV to -1.0 the TDOS increases with the energy. Then it decreases and forms a valley at the Fermi level. From 1.0 eV TDOS increases again due to the TM d orbitals and La 4f states. The latter form a peak at 2.0 eV.
Figure 9 b shows the DOSs for the pure elements. Interestingly, there are densities in the DOS curves for B, Si and Ge at the Fermi level, indicating their metallic nature, in contrast to the semiconducting nature of the bulk crystals [53,54]. This phenomenon originates from the high coordination numbers of these atoms in the 20e-HEAA compared with the corresponding elemental crystals. As shown in Figure 8, Si and Ge have seven to ten and five to ten neighbours in the alloys, respectively. These numbers are significantly higher than four in pure Si and Ge crystals with tetrahedral coordination [53]. Crystalline B is semiconducting. However, amorphous boron exhibits metallic nature as shown in a previous study [54]. Moreover, the coordination number of boron in the 20e-HEAA ranges from six to eight, again being higher than that in crystalline boron [54,55].
Overall, at the Fermi level the s, p and d orbitals of all elemental atoms contribute to the DOS, corresponding to their contributions to the formation of the amorphous form. However, the localized Cd 4d and Zn 3d electrons contribute little to the chemical interaction, and thus, they should be excluded from the VEC number.
Charges at and charge transfer between atoms provide deep understanding about chemical interactions in materials [56,57] particularly for complex systems as the 20e-HEAA. Here we employed the Bader charge approach which was coded and implanted into VASP [58] for the amorphous system. The obtained results are shown in Figure 10 together with the Pauling electronegativity values [35] as comparison. Again, it is marked that the present results are just from one of the huge number of configurations in the 20e-HEAA.
The charges at the atomic sites for each species are scattered (Figure 10), which corresponds to their complex neighbourhood (Figure 8). The charges at the atomic sites are generally inverse to their electronegativity values. For example, La has the smallest electronegativity value and it correspondingly has the largest electron loss. However, there are exceptions. Tl has an electronegativity value in-between its neighbouring Ti and V, but it gets electrons from the neighbouring atoms in contrast to the electron losses for Ti and V. Si has a smaller electronegativity value than Sn, but it receives more electrons than the latter in the amorphous sample. The results indicate that care is needed when using electronegativity values and electronic charges to describe the interactions in such complex systems.
4.3. Discussions: Perspectives of MC-HEAAs
The AIMD simulations reveal aspects of the formation and stability of the 20e-HEAA. The results show that mixing elements with multiple crystal structure types and a broad variety of atomic sizes makes it difficult for the resulting supercooled liquid to crystallize.
Solidification theory suggests that foreign particles reduce barriers for a liquid to nucleate a solid [59,60]. The simulations presented here reveal the formation of B-B clusters. However, they may contribute little to nucleation, since B has been regarded as a glass-former in many traditional bulk metallic glasses [16,61,62].
During the liquid-treating and casting process of real alloys and materials, impure particles such as oxides and nitrides are unavoidably formed [63,64]. These native oxide and nitride particles may not only affect the properties of the products, but also act as potential nucleation sites for crystallization [65,66]. Thus, it is necessary to minimize foreign particles, such as oxides and nitrides in liquids if the objective is to avoid easy heterogeneous nucleation and either form an amorphous structure without any crystallisation or promote dense nucleation at low temperatures. Moreover, a range of high melting temperatures and heavy masses means that the liquid needs to be kept at a high preparation temperature for a reasonably long period of time if the objective is to obtain a homogeneous multicomponent liquid and thus manufacture a homogeneous solid. These are challenges for experimentalists in practice.
The electronic structure calculations presented here reveal the metallic nature of the 20e-HEAA. The d-orbitals of the transition metals contribute predominantly at the Fermi level. Moreover, the Fermi level falls in a deep valley of the density of states, indicating a high stability of this amorphous phase according to Stoner’s criteria [67].
The present AIMD simulations predict a 20e-HEAA of high stability at ambient conditions. The previous thermo-statistics analysis revealed that configurational entropy contribution increases dramatically with number of elemental types up to 13. Then, this contribution increases steadily with number of elemental species [10, 11]. This indicates the flexibility of the MC-HEAAs, and potential experimental practice for producing MC-HEAAs as a ‘universal’ structure tolerating various metallic impurities, which helps deal with the metallic wastes for a circular economy.
5. Conclusions
We investigated an equiatomic 20-element liquid and an equilibrated high-entropy amorphous alloy (20e-HEAA). The study revealed that the 20e-HEAA exhibits:
1). high stability and can be used as a universal amorphous material tolerating a wide range of metallic impurities.
2). B-B clusters at low temperature, which may stabilize the non-crystalline nature of the alloy.
3). a DOS valley at the Fermi level, indicating electronic stability of the alloy.
4). localized, core-like Zn 3d and Cd 4d electrons which should be excluded from the valence electron concentration (VEC).
Author Contributions
C. F. conducted designing of the systems, ab initio simulations, data analysis, visualization, original draft writing; B. C. contributed to review and editing of the manuscript.
Funding
This work has been funded by the EPSRC of the UKRI under the grant number EP/V011804/1.
Data Availability Statement
Supplementary Materials are provided.
Acknowledgments
The authors thank Prof. Z. Fan and Prof. I. Chang (BCAST) for beneficent discussions. Financial support from EPSRC (UK) under grant number EP/V011804/1 is gratefully acknowledged.
Conflicts of Interest
The authors declare no conflict of interest.
References
- Atherton, J. Declaration by the metals industry on recycling principles, Int. J. Life Cycle Assess. 2007, 12, 59–60. [Google Scholar] [CrossRef]
- Broadbent, C. Steel’s recyclability: demonstrating the benefits of recycling steel to achieve a circular economy, Int. J. Life Cycle Assess. 2016, 21, 1658–1665. [Google Scholar] [CrossRef]
- Geissdoerfer, M.; Savaget, P.; Bocken, N.; Hultink, E. The Circular Economy – A new sustainability paradigm? J. Cleaner Production, 2017, 143, 757-768.
- Geissdoerfer, M.; Pieroni, M. P. P.; Pigoss, D. C. A.; Soufani, K. Circular business model: A review, J. Cleaner Production, 2020, 277, 123741.
- Reuter, M. A.; van Schaik, A.; Gutzmer, J.; Bartie, N.; Abadías-Liamas, A. Challenges of the circular economy: A materials, Metallurgical, and Product design perspective, Ann. Rev. Mater. Res., 2019, 49, 253-274.
- L. F. Zhang, L. F.; J. W. Gao, J. W.; L. Nana, L.; W. Damoah, W.;and D. G. Robertson, D. G. Removal of iron aluminum: A review, Miner. Process. Extr. Metall. Rev. 2012, 33, 99–157.
- Raabe, D.; Ponge, D.; Uggowitzer, P. J.; Roscher, M.; Paolantonio, M.; Liu, C. L.; Antreckowitsch, H.; Kozenschnik, E.; Seidmann, D.; Gault, B.; De Geuser, F.; Deschamps, A.; Hutchinson, C.; Liu, C. H.; Li, Z. M.; Prangnell, P.; Robson, J.; Shanthraj, P.; Cakili, S.; Sinclair, C.; Pogatscher, S. Making sustainable aluminum by recycling scrap: The science of ’dirty alloys’, Prog. Mater. Sci. 2022, 128, 100947.
- Villalba, G.; Segarra, M.; Fernández, A. I.; Chimenos, J. M.; Espiell, F. A proposal for quantifying the recyclability of material, Resources, Conservation and Recycling, 2022, 37, 39-53.
- Yeh, J. W.; Chen, S. K.; Lin, S. J.; Gan, J. Y.; Chin, T. S.; Shun, T. T.; Tsau, C. H.; Chang, S. Y. Nanostructured high-entropy alloys with multiple principal elements: novel alloy design concepts and outcomes, Adv. Eng. Mater. 2004, 6, 299–303.
- Cantor, B.; Chang, I. T. H.; Knight, P.; Vincent, A. J. B. Microstructural development in equiatomic multicomponent alloys, Mater. Sci. Engin. A, 2004, 375-377, 213-281.
- Cantor, B. Multicomponent high-entropy cantor alloys, Prog. Mater. Sci. 2021, 120, 100754. [Google Scholar]
- George, E. P.; Raabe, D.; Ritchie, R. O. High-entropy alloys, Nat. Rev. Mater. 2019, 4, 515–534. [Google Scholar] [CrossRef]
- Miracle, D. B.; Senkov, O. N. A critical review of high entropy alloys and related concepts, Acta Mater. 2017, 122, 448-511.
- Chen, M. W. A brief overview of bulk metallic glasses, NPG Asia Mater. 2011, 3, 82-90.
- Sastry, S. The relationship between fragility, configurational entropy and the potential energy landscape of glass-forming liquids, Nature, 2001, 409, 164–167.
- Novák, L.; Potocký, L.; Kisdi-Kosozó, É.; Lovas, A.; Takács, J. Induced magnetic anisotropy of Fe-X-B glassy alloys, J. Magn. Magn. Mater. 1984, 46, 91–94. [Google Scholar] [CrossRef]
- Greer, A. L. Materials science—confusion by design, Nature, 1993, 366, 303–304.
- Fowler, R.; Guggenheim, E. A. Statistical Thermodynamics, Cambridge University Press, Cambridge, England, 1960.
- Henchman, R. H. Partition function for a simple liquid using cell theory parameterized by computer simulation, J. Chem. Phys. 2003, 119, 400–406. [Google Scholar]
- Ng, C.; Guo, S.; Luan, J. H.; Shi, S. Q.; Liu, C. T. Entropy-driven phase stability and slow diffusion kinetics in an Al0.5CoCrCuFeNi high entropy alloy, Intermetallics, 2012, 31, 165–172.
- Senkov, O. N.; Miracle, D. B.; Chaput, K. J.; Couzinie, J.-P. Development and exploration of refractory high entropy alloys—A review, J. Mater. Res., 2018, 33, 3092–3128.
- Zeng, Q. S.; Sheng, H. W.; Ding, Y.; Wang, L.; Yang, W. G.; Jiang, J.-Z.; Mao, W. L.; Mao, H.-K. Long-range topological order in metallic glass, Science, 2011, 332, 1404–1406.
- Wei, R.; Tao, J.; Sun, H.; Chen, C.; Sun, G. W.; Li, F. S. Soft magnetic Fe26.7Co26.7Ni26.6Si9B11 high entropy metallic glass with good bending ductility, Mater. Lett., 2017, 197, 87-89.
- Tong, Y.; Qiao, J. C.; Zhang, C.; Pelletier, J. M.; Yao, Y. Mechanical properties of Ti16.7Zr16.7Hf16.7Cu16.7Ni16.7Be16.7 high-entropy bulk metallic glass, J. Non-crystal. Solids, 2016, 452, 57-61.
- Luan, H. W.; Zhang, X.; Ding, H. Y.; Zhang, F.; Luan, J. H.; Jiao, Z. B.; Yang, Y.-C.; Bu, H. T.; Wang, R. B.; Gu, J. L.; Shao, C. L.; Yu, Q.; Shao, Y.; Zeng, Q. S.; Chen, N.; Liu, C. T.; Yao, K.-F. High-entropy induced a glass-to-glass transition in a metallic glass, Nature Commun., 2022, 13, 2183.
- Cao, P. Y.; Ni, X. D.; Tian, F. Y.;. Varga, L. K.; Vitos, L. Ab initio study of AlxMoNbTiV high-entropy alloys, J. Phys. Condes. Matter, 2015, 27, 075401.
- Li, Z. M.; Körmann, F.; Grabowski, B.; Neugebauer, J.; Raabe, D. Ab initio assisted design of quinary dual-phase high-entropy alloys with transformation-induced plasticity, Acta Mater., 2017, 136, 262-270.
- Yang, S.G.; Liu, G.C.; Zhong,Y. Revisit the VEC criterion in high entropy alloys (HEAs) with high-throughput ab initio calculations: A case study with Al-Co-Cr-Fe-Ni system, J. Alloys Compds., 2022, 916 ,165477.
- Parmar, A. D. S.; Ozawa, M.; Berthier, L. Ultrastable metallic glasses in Silico, Phys. Rev. Lett., 2020, 125, 085505.
- Callister, W. D.; Rethwisch, D. G. Materials Science and Engineering: An Introduction, (10th ed.), Wiley, 2018.
- Zhang, Y.; Zhou, Y. J.; Lin, J. P.; Liang, G.; Liaw, P. Solid-solution phase formation rules for multi-component alloys, Adv. Engin. Mater., 2008, 10, 534-538.
- Guo, S.; Liu, C. T. Phase stability in high entropy alloys: Formation of solid-solution phase or amorphous phase, Prog. Nat. Sci: Mater. Intern., 2011, 21, 433-446.
- Takeuchi, A.; Inoue, A. Classification of bulk metallic glasses by atomic size difference, heat of mixing and periodic of constituent elements and its application to characterization of the main alloying element, Mater. Trans., 2005, 46, 2817-2829.
- Arblaster, J. Selected values of the crystallographic properties of the elements, ASM International, Materials Park, Ohio, 2018.
- Pauling, L. The Nature of the Chemical Bond, Cornell University Press, Ithaca/New York, 1960.
- Timberlake, K. C. Chemistry: An introduction to general, Pearson, London, England, 2014.
- Fang, C. M.; de Wijs, G. A.; Orhan, E.; de With, G.; de Groot, R. A.; Hintzen, H. T.; Marchand, R. Local structure and electronic properties of BaTaO2N with perovskite-type structure, J. Phys. Chem. Solids, 2003, 64, 281-286.
- Brostow, W.; Hagg Lodbland, H. E. Materials: Introduction and Applications, John Wiley & Sons, Hoboken, New Jersey, 2017.
- Hintzsche, L. E.; Fang, C. M.; Watts, T.; Marsman, M.; Jordan, G.; Lamers, M. W. P. E.; Weeber, A. W.; Kresse, G. Density functional theory study of the structural and electronic properties of amorphous silicon nitrides: Si3N4-x:H, Phys. Rev. B, 2012, 86, 235204.
- Parrinello, M.; Rahman, A. Crystal structure and pair potentials: A molecular -dynamics study, Phys. Rev. Lett., 1980, 45, 1196-1999.
- Parrinello, M.; Rahman, A.; Polymorphic transitions in single crystals: A new molecular dynamics method, J. Applied Phys., 1981, 52, 7182-7190.
- Kresse, G.; Hafner, J. Ab initio molecular-dynamics simulation of the liquid-metal–amorphous-semiconductor transition in germanium. Phys. Rev. B, 1994, 49, 14251–269. [Google Scholar] [CrossRef] [PubMed]
- Kresse, G.; Furthmüller, J. Efficiency of ab-initio total energy calculations for metals and semiconductors using a plane-wave basis set, Comp. Mater. Sci., 1996, 6,15-50.
- Hohenberg, P.; Kohn, W. Inhomogeneous electron gas. Phys. Rev. 1964, 136, 864–871. [Google Scholar] [CrossRef]
- Blöchl, P. E. Projector augmented-wave method, Phys. Rev. B, 1994, 50, 17953-79.
- Perdew, J. P.; Burke, K.; Ernzerhof, M. Generalized gradient approximation made simple, Phys. Rev. Lett., 1996, 77, 3865-3868.
- Fang, C. M.; van Huis, M. A.; Sluiter, M. H. F.; Zandbergen, H. W., Stability, structure and electronic properties of γ-Fe23C6 from first-principles study, Acta Mater., 2010, 58, 2968-2977.
- Monkhorst, H. J.; Pack, J. D. Special points for Brillouin zone integrations, Phys. Rev. B, 1976, 13 , 5188-5192.
- Wang, X. L.; Tan, S.; Yang, X.-Q.; Hu, E. Y. Pair distribution function analysis: Fundamentals and application to battery materials. Chin. Phys. B, 2020, 29, 028802. [Google Scholar] [CrossRef]
- Halet, J.-F.; in Contemporary Boron Chemistry, M.G. Davidson, A.K. Hugues, T.B. Marder, K. Wade (Eds.), Royal Society of Chemistry, Cambridge, 2000.
- Brown, I. D.; Shannon, R. D. Empirical Bond-Strength-Bond-Length Curves for Oxides, Acta Crystallographica, A, 1973, 29, 266-282.
- Brown, I. D. The Chemical Bond in Inorganic Chemistry: The Bond Valence Model, Oxford University Press, 2002. ,.
- Kittel, C. Introduction to Solid State Physics, 8th ed. Wiley, 2004. ,.
- Fang, P. X. W.; Nihtianov, S.; Sberna, P.; Fang, C. M. Interfaces between crystalline Si and amorphous B: interfacial interactions and charge barriers, Phys. Rev. B, 2021, 103, 075301.
- Wyckoff, R. W. G. The structure of Crystals, 2nd Ed., Reinhold Publishing Corporation, New York, USA, 1935. ,.
- Bader, R. F. W. A. A quantum-theory of molecular-structure and its applications, Chem. Rev., 1991, 91, 893-928.
- Bader, R. F. W. A bonded path: A universal indicator of bonded interactions, J. Phys. Chem. A, 1998, 102 (1998) 7314-7323.
- Henkelman, G.; Arnaldsson, A.; Jónsson, H. A fast and robust algorithm for Bader decomposition of charge density, Comp. Mater. Sci., 2006, 36, 254-360.
- Kelton, K. F.; Greer, A. L. Nucleation in condensed matter: applications in materials and biology, Pergamon Materials Series, Elsevier Ltd. Oxford/Amsterdam, 2010. 2010.
- Turnbull, D. Kinetics of heterogeneous nucleation, J. Chem. Phys., 1950, 18, 198-203.
- Suryanarayana, C.; Inoue, A. Iro-based bulk metallic glasses, Intern. Mater. Rev., 2013, 58, 131-166.
- Descristofaro, N.; Freilich, A.; Fish, G. Formation and magnetic properties of Fe-B-Si metallic glasses, J. Mater. Sci., 1982, 17, 2365-70.
- Wang, Y.; Li, H.-T.; Fan, Z. Oxidation of aluminium alloy melt and inoculation by oxide particles, Trans. Indian Inst. Met., 2012, 65, 653-661.
- Fang, C. M.; Fan, Z. Atomic ordering at the interfaces between liquid aluminum and polar AlN{0 0 0 1} substrates, Metal. Mater. Trans. A, 2022, 53, 2040-2047.
- Fan, Z. Heterogeneous nucleation, grain initiation and grain refinement of Mg-alloys, Proc. The 11th international conference on magnesium alloys and their applications, 24-27 July 2018, Beaumont Estate, Old Windsor, UK. Ed. By Z. Fan and C. Mendis, 2018.
- Fang, C. M.; Fan, Z. Ab initio molecular dynamics investigation of prenucleation at liquid- Metal/Oxide Interfaces: An overview, Metals, 2022, 12, 1618.
- Stoner, E. C. Collective electron ferromagnetism, Proc. R. Soc. Lond. A, 1938, 165, 272-414.
Figure 1.
Atomic volumes (a), melting points [34] (b) and Pauling electronegativities (c) for the elements employed in the present 20-component system. The average values are shown in the horizontal dotted lines.
Figure 1.
Atomic volumes (a), melting points [34] (b) and Pauling electronegativities (c) for the elements employed in the present 20-component system. The average values are shown in the horizontal dotted lines.
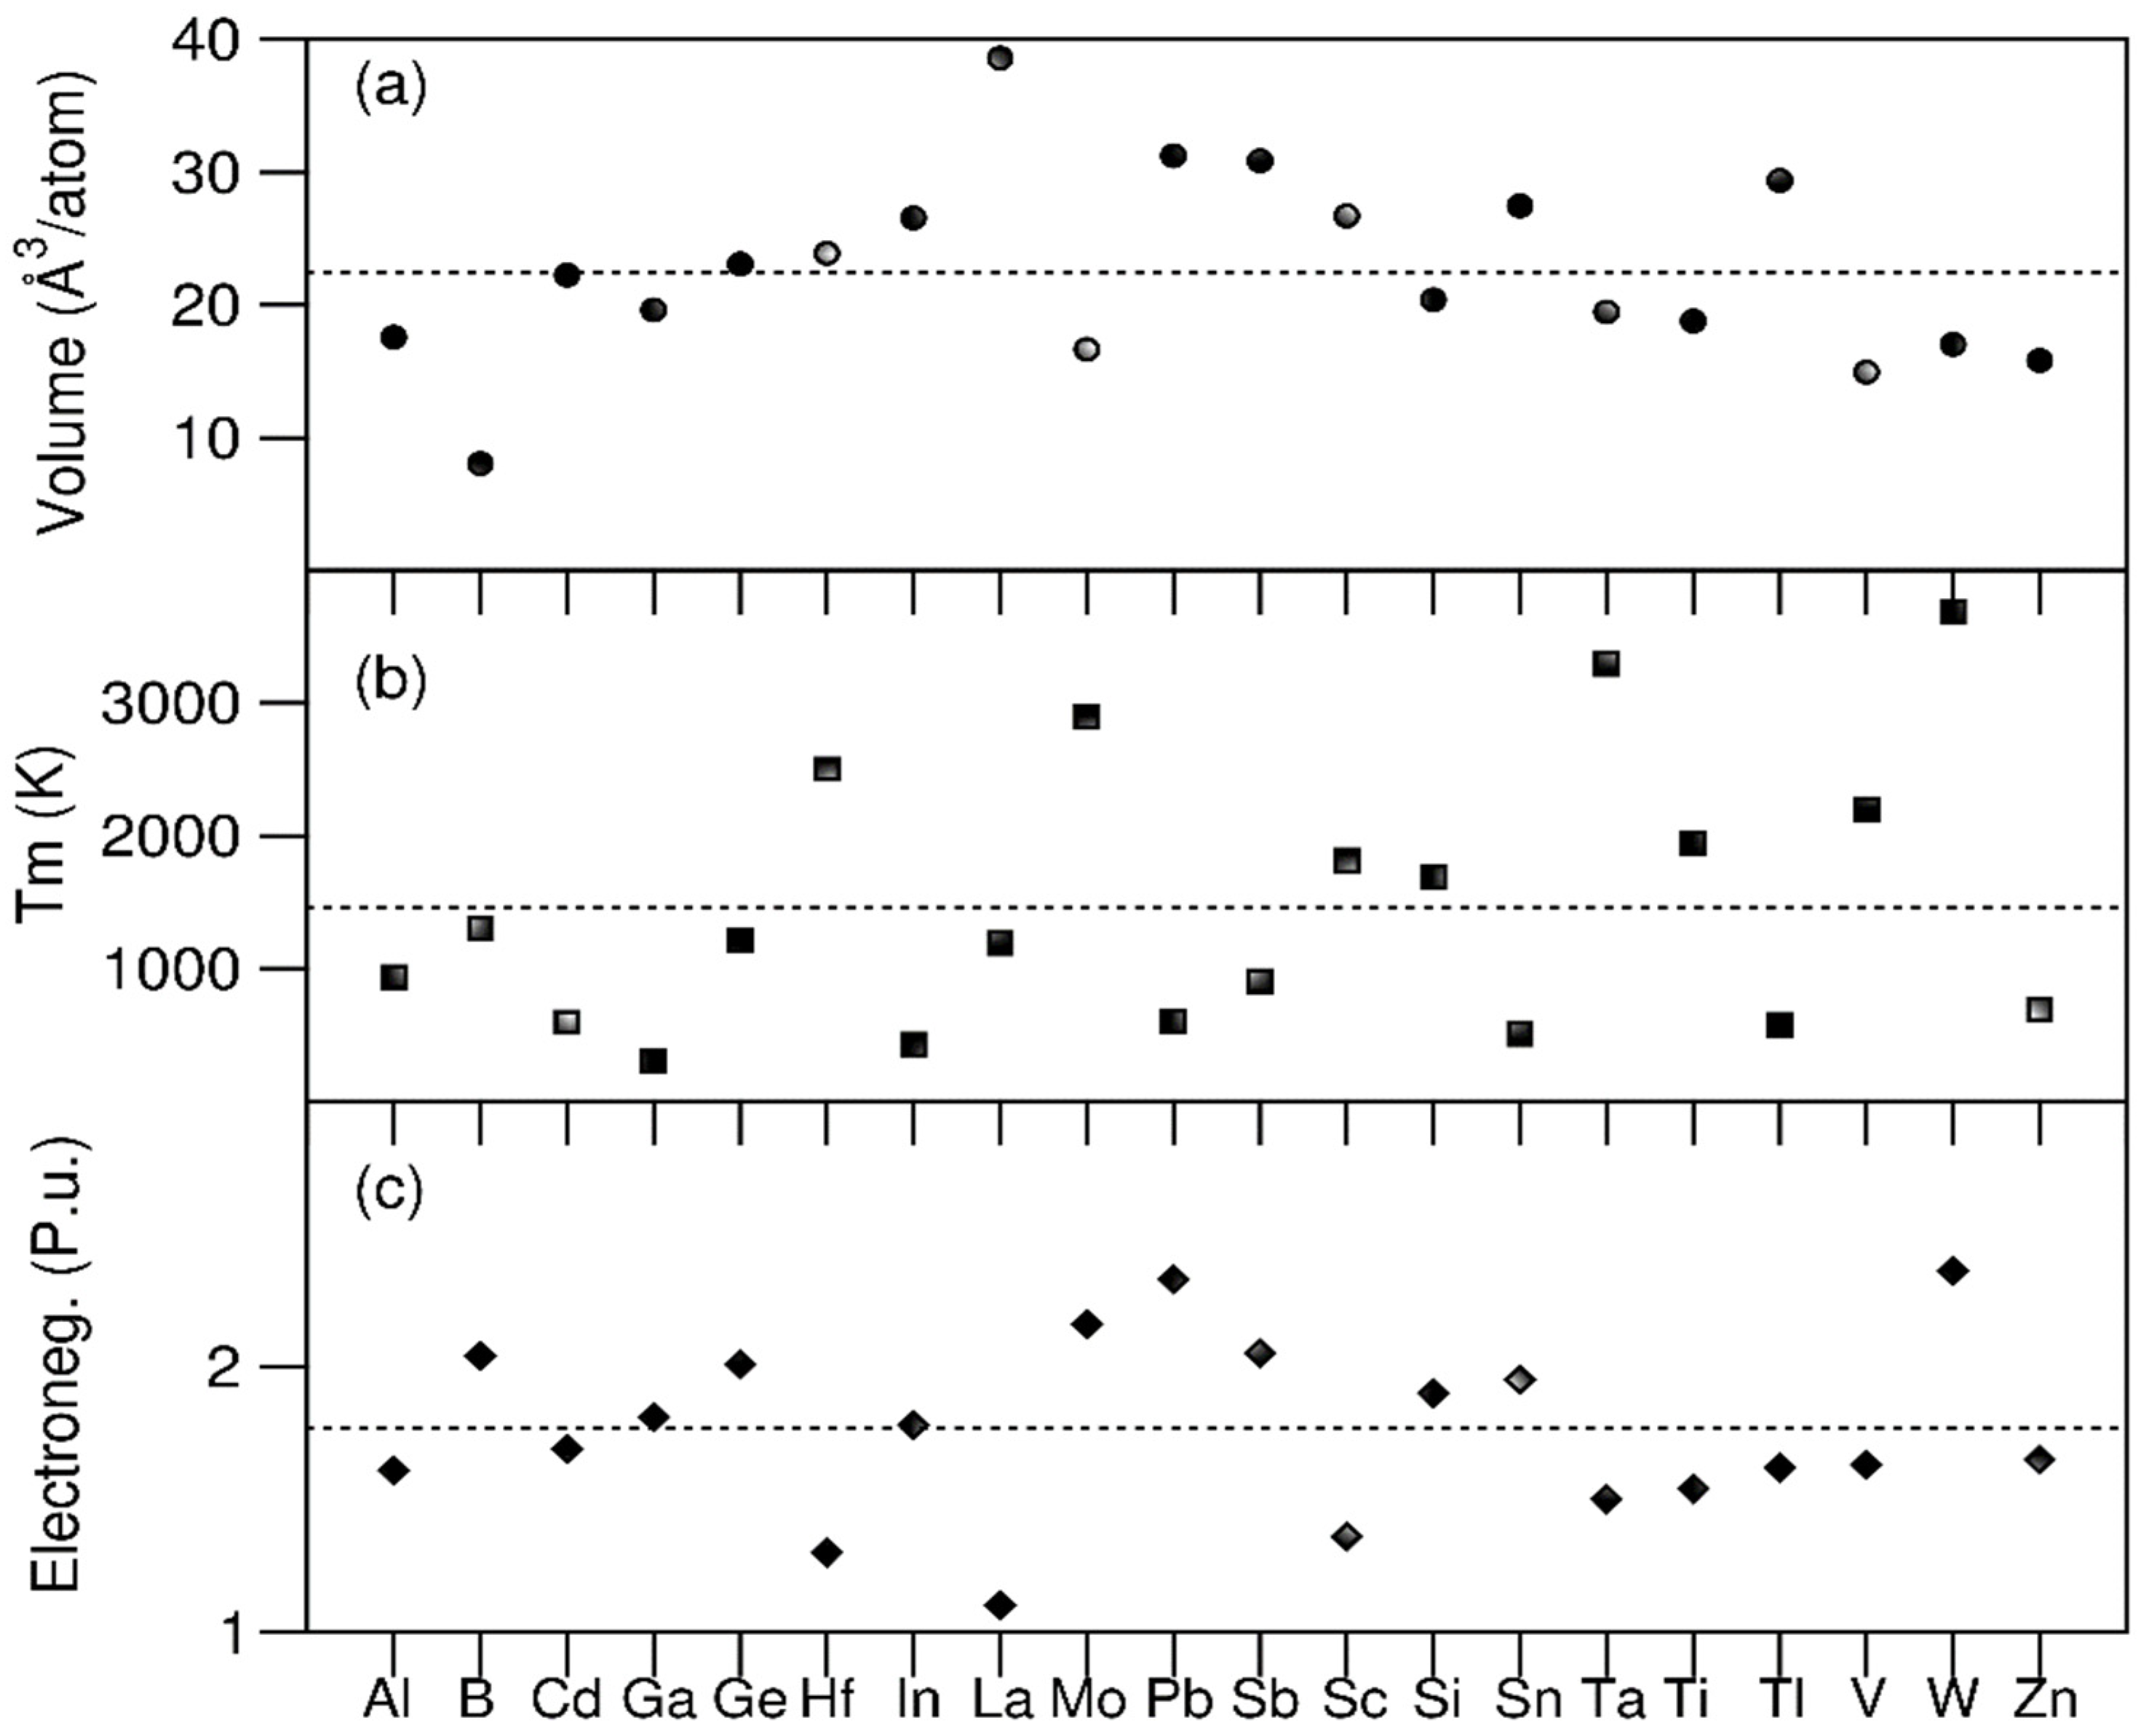
Figure 2.
Schematic for the thermal treatments for the 20e-HEAA system.
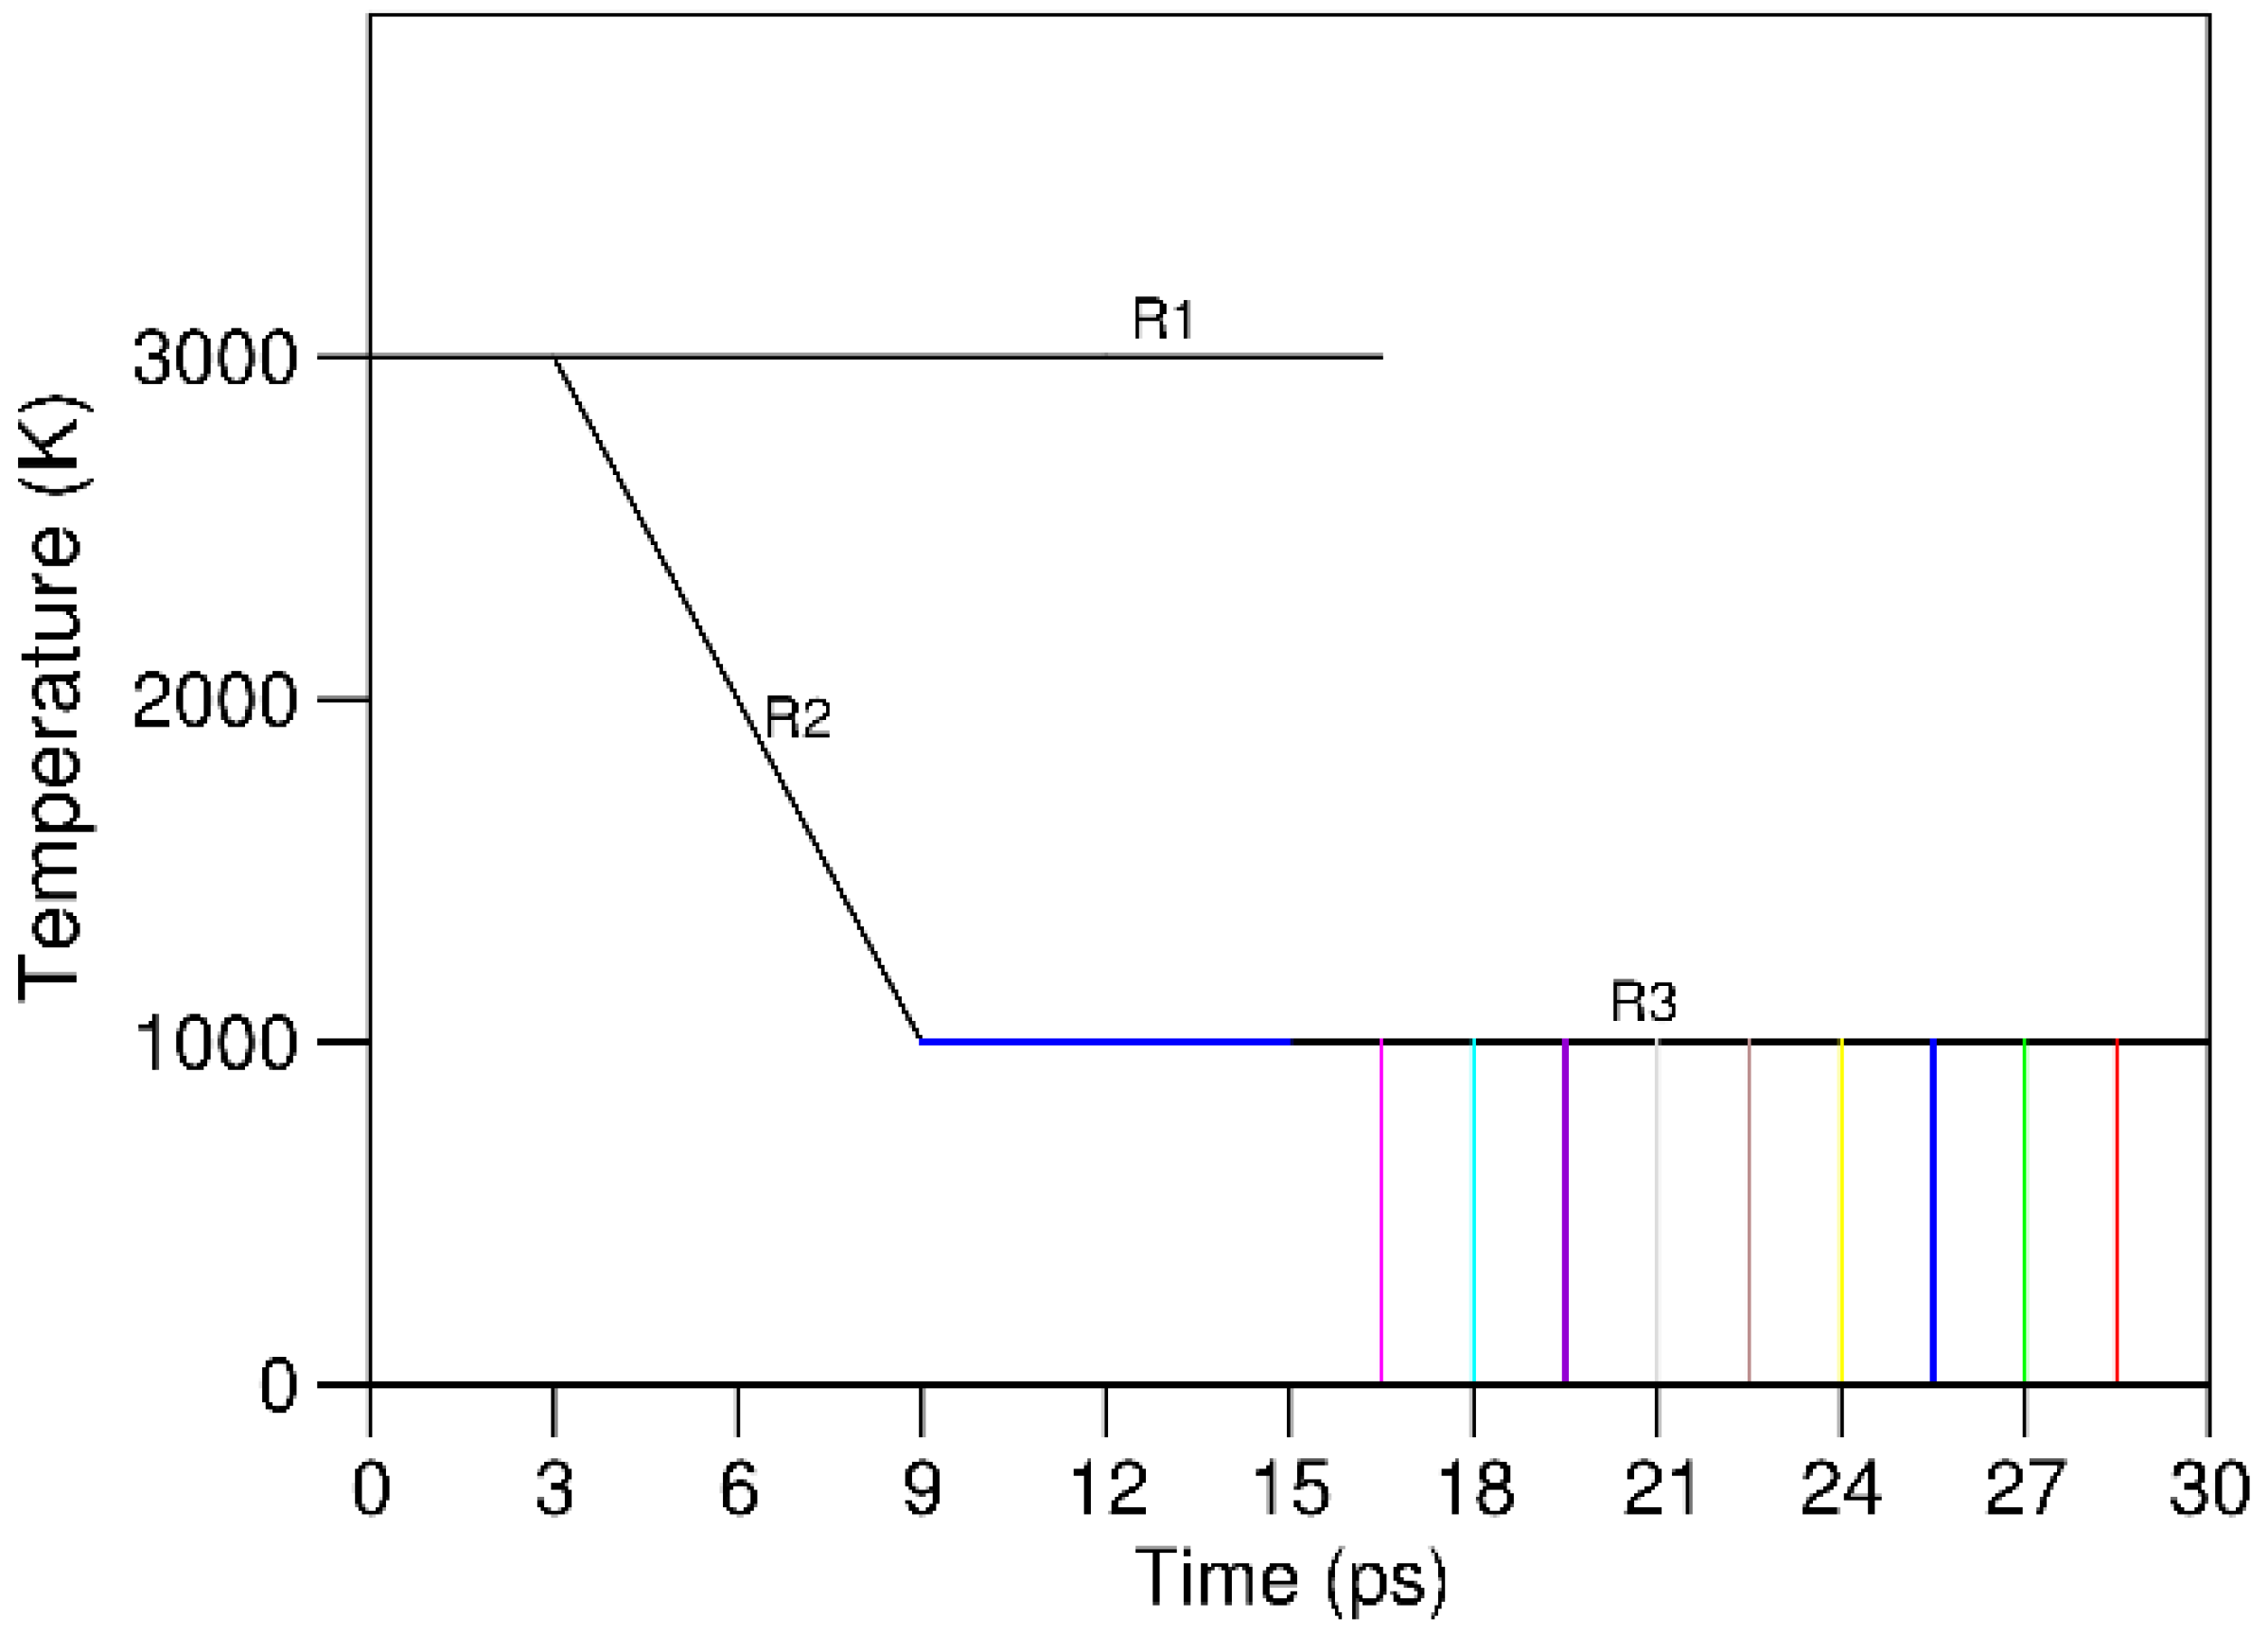
Figure 3.
Snapshots of atomic structure of the 20-element HEA sample simulated (a) at 3000 K and 1000 K (b) and relaxed at 0 K (c) along the [1 0 0] axis. The meaning of the colored spheres is shown on top. The red perpendicular and horizontal lines in each snapshot correspond to its b and c-axis, respectively.
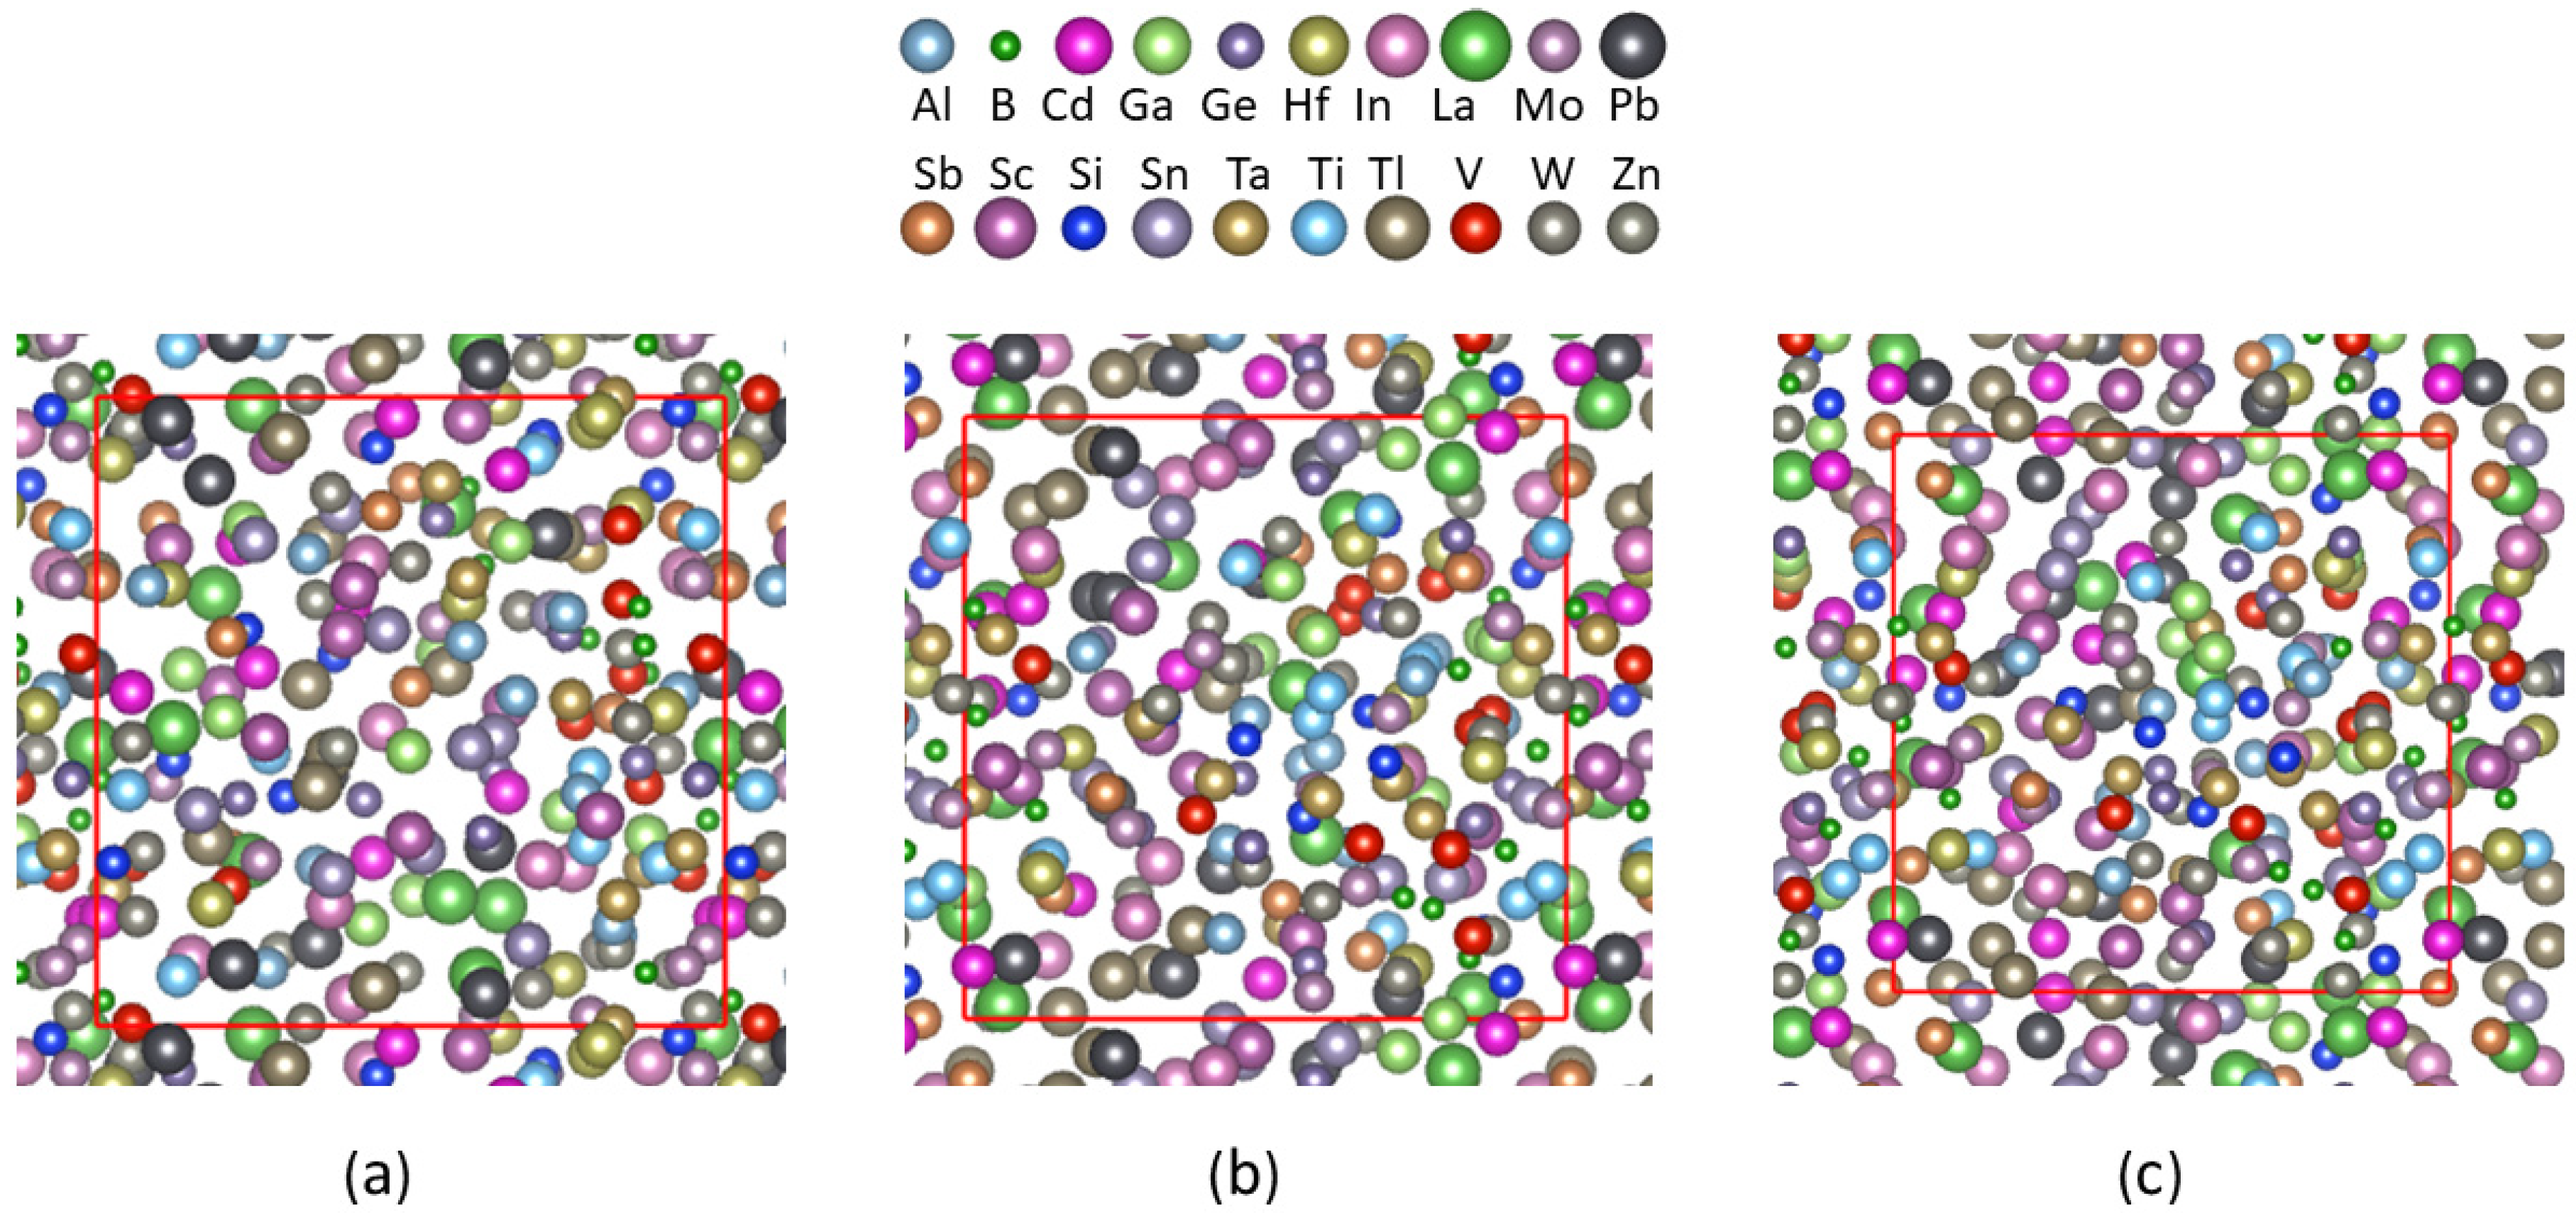
Figure 4.
Average pair distribution function (PDF) curves for the equiatomic 20-e systems simulated at different thermal conditions. The solution is 0.1 Å.
Figure 4.
Average pair distribution function (PDF) curves for the equiatomic 20-e systems simulated at different thermal conditions. The solution is 0.1 Å.
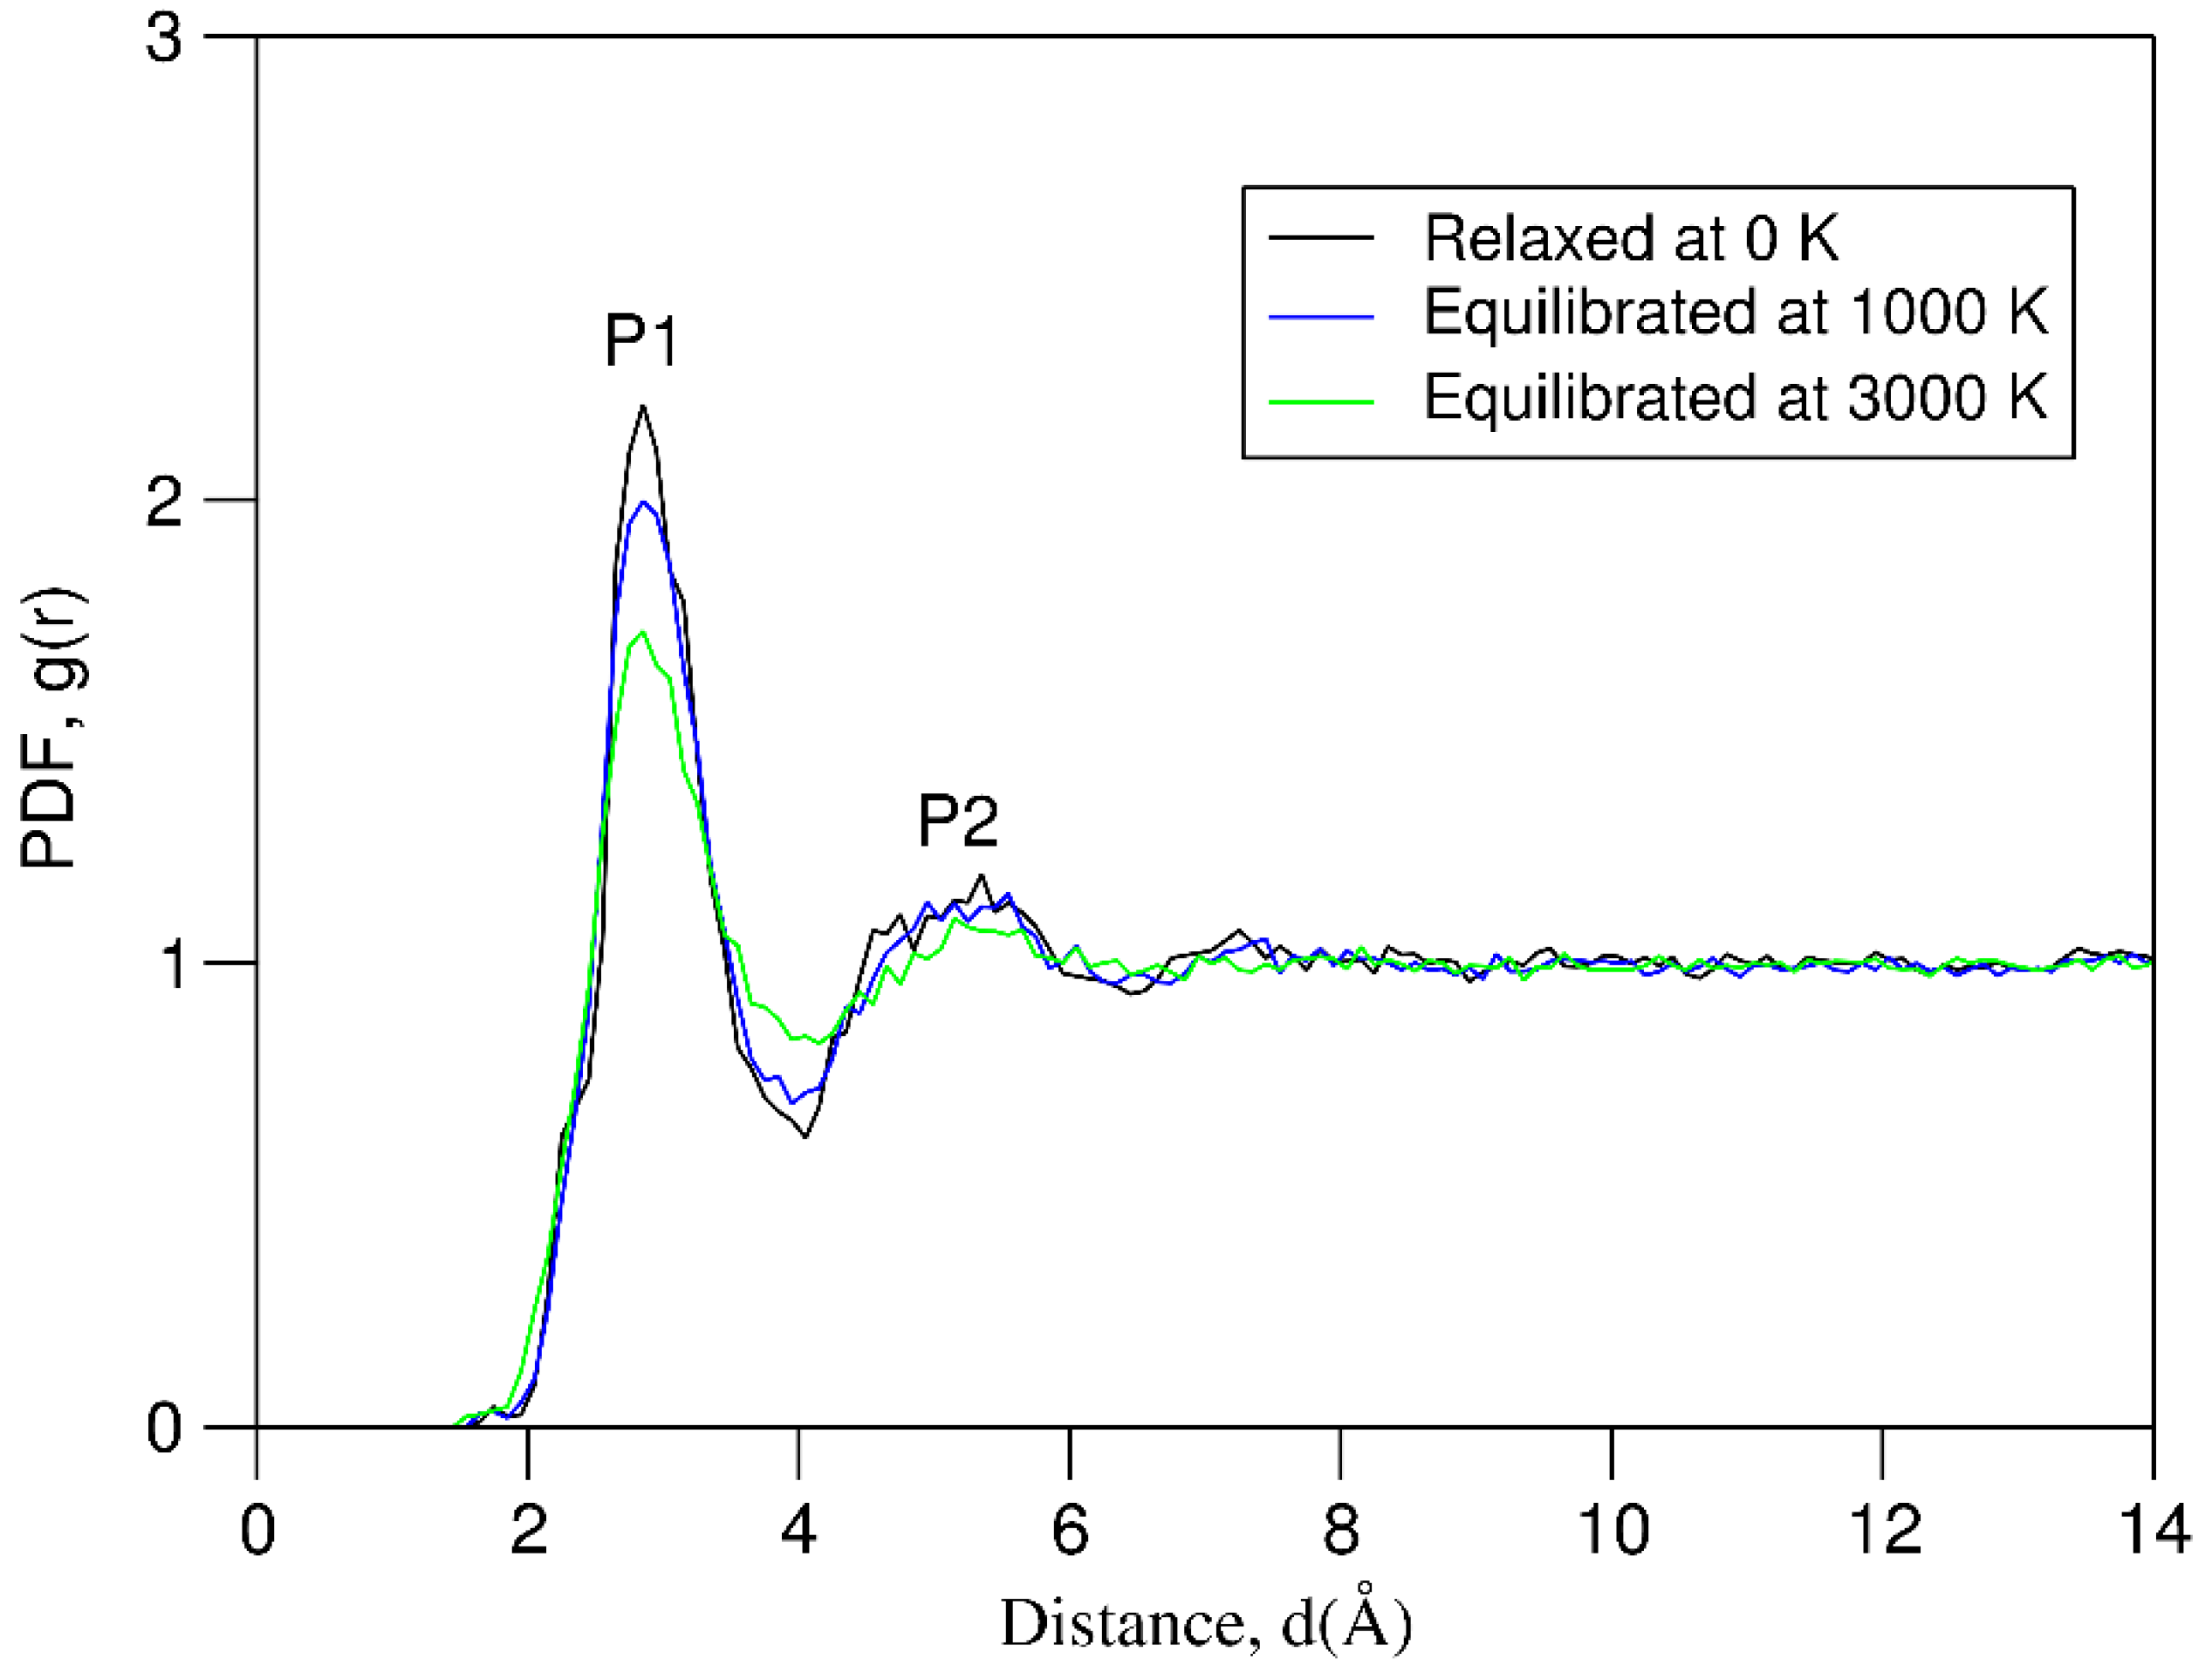
Figure 5.
Element-resolved partial pair distribution functions of the 20e-HEAA sample relaxed at 0 K.
Figure 5.
Element-resolved partial pair distribution functions of the 20e-HEAA sample relaxed at 0 K.
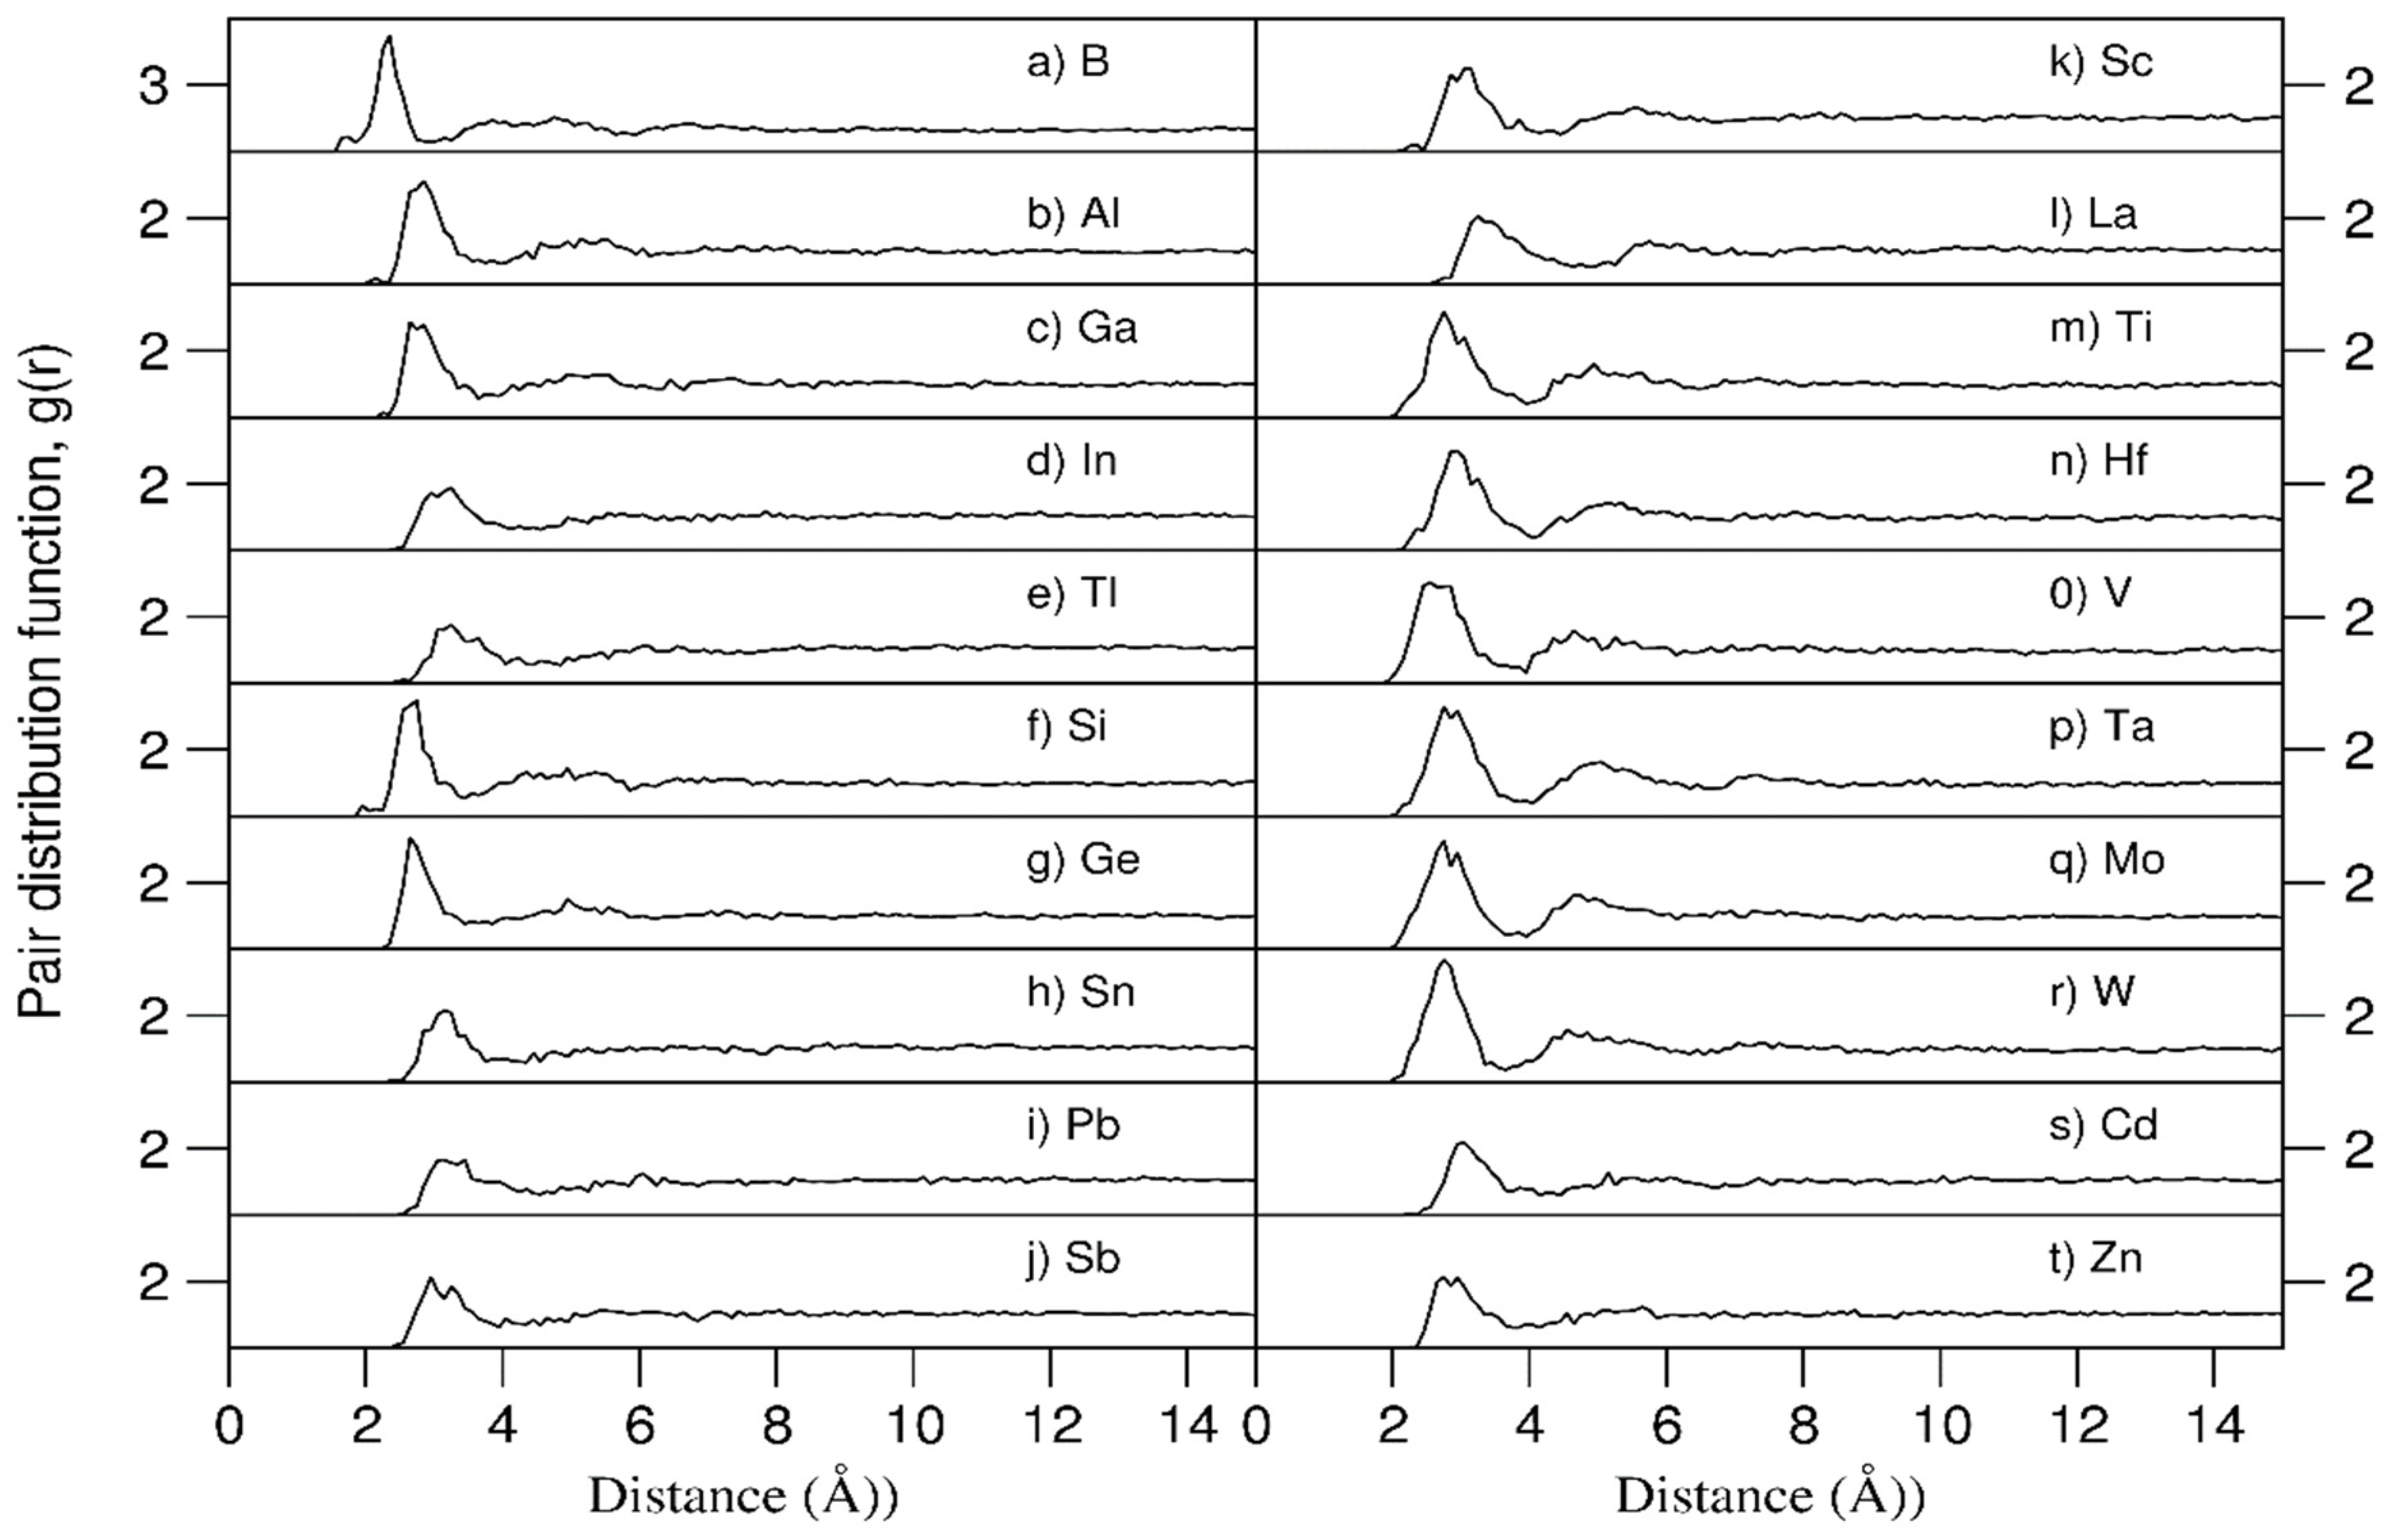
Figure 6.
The partial pair distribution functions in the 20e-HEAA and the pair distribution function of pure amorphous elemental solid for (a) B, (b) Al, (c) La, and (d) the sum of the pure Al, B and La amorphous samples. The black curves represent the partial and averaged PDF for the 20e-HEAA and the red for the pure amorphous samples. The solution is 0.1Å. * Pure a-B and a-Al samples were equilibrated at 1000 K (red curves in (a) and (c), and a-Al at 500 K (red curve in (b)).
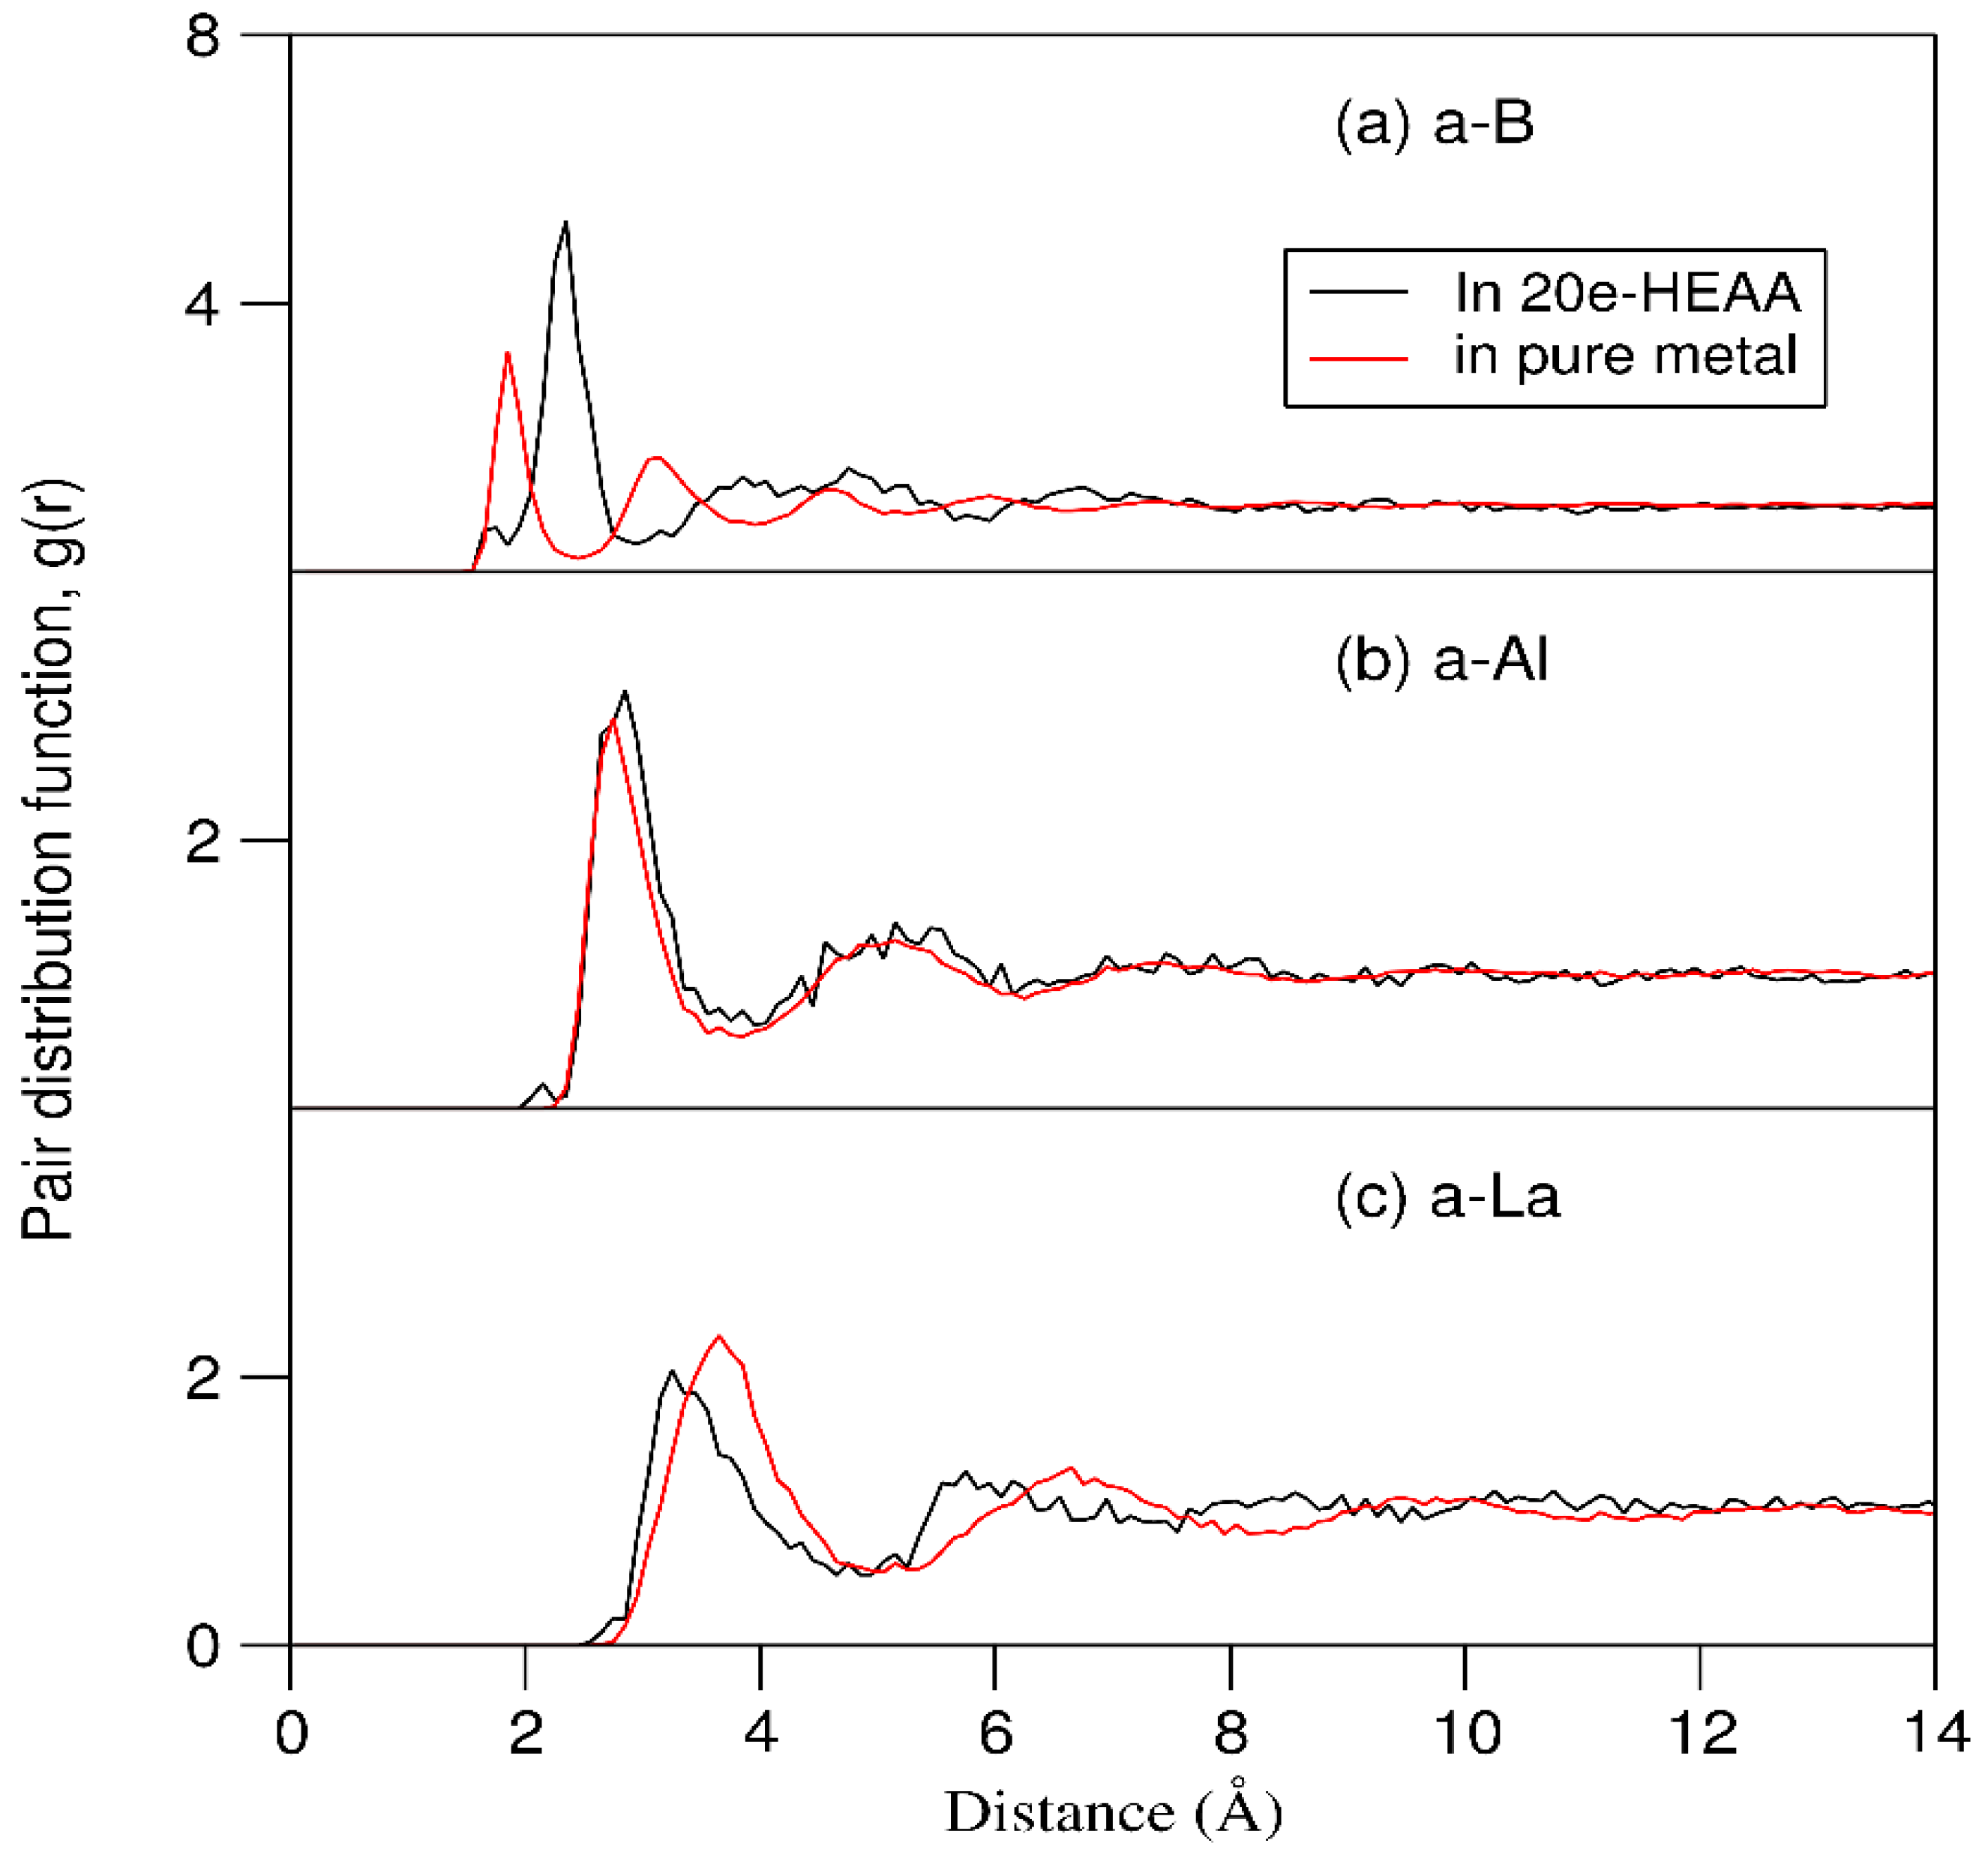
Figure 7.
Schematics of local coordination of (a) a single B atom and (b) a B cluster in the 20e-HEAA simulated at 1000 K.
Figure 7.
Schematics of local coordination of (a) a single B atom and (b) a B cluster in the 20e-HEAA simulated at 1000 K.
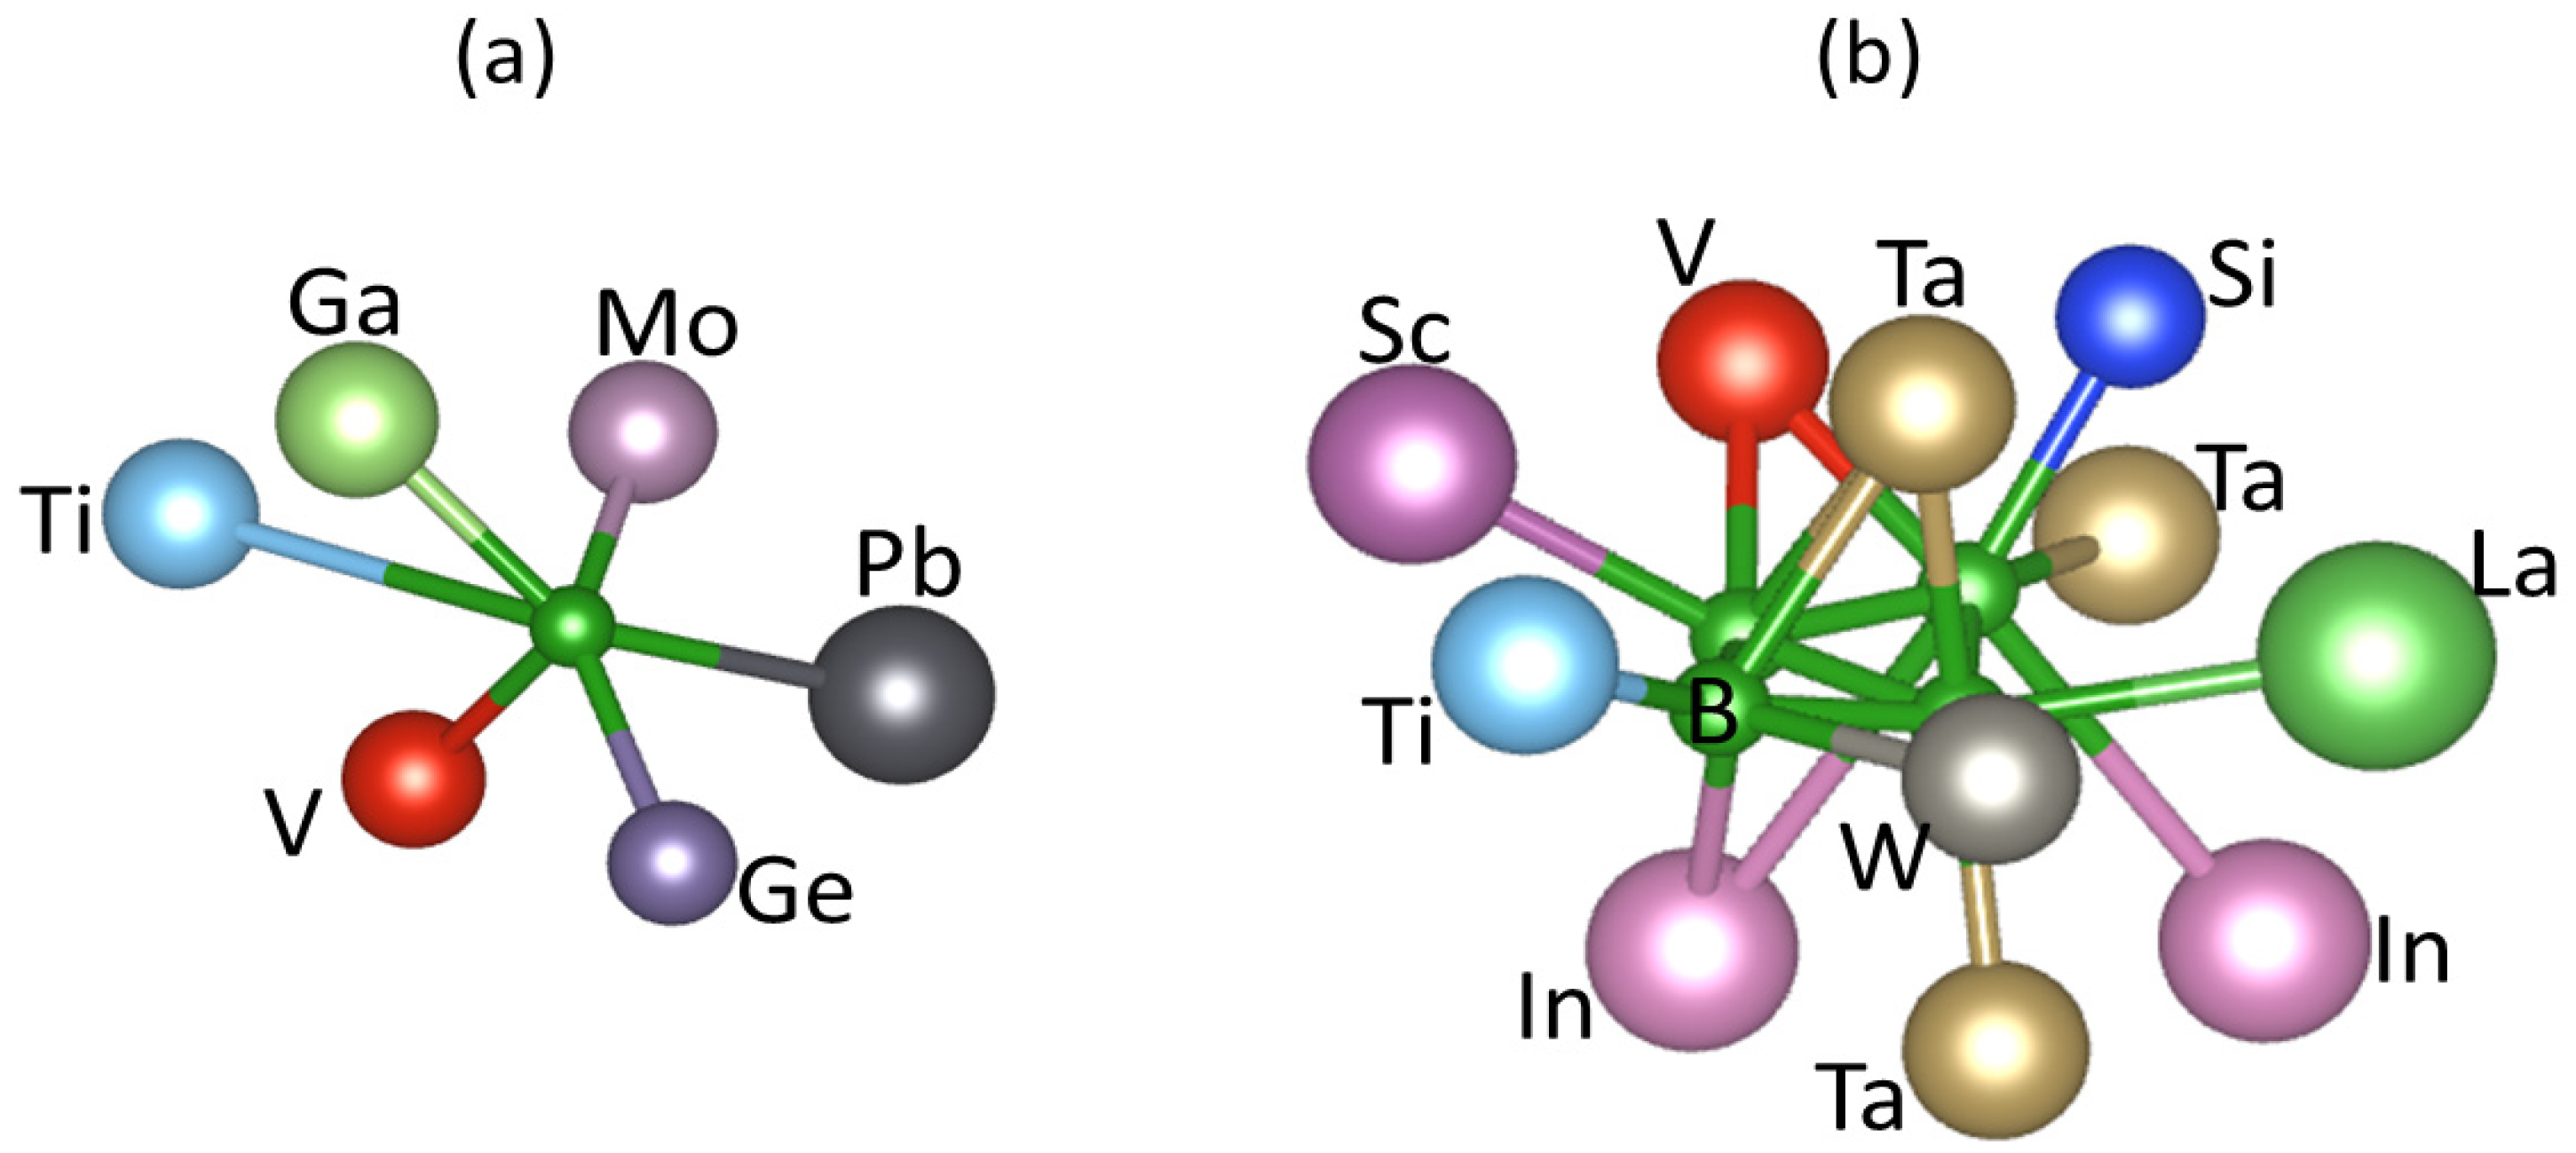
Figure 8.
Statistics of coordination number per atoms for a sample of the equiatomic 20-componet high entropy amorphous alloy system. The cut-off lengths of the bonds are described in the text.
Figure 8.
Statistics of coordination number per atoms for a sample of the equiatomic 20-componet high entropy amorphous alloy system. The cut-off lengths of the bonds are described in the text.
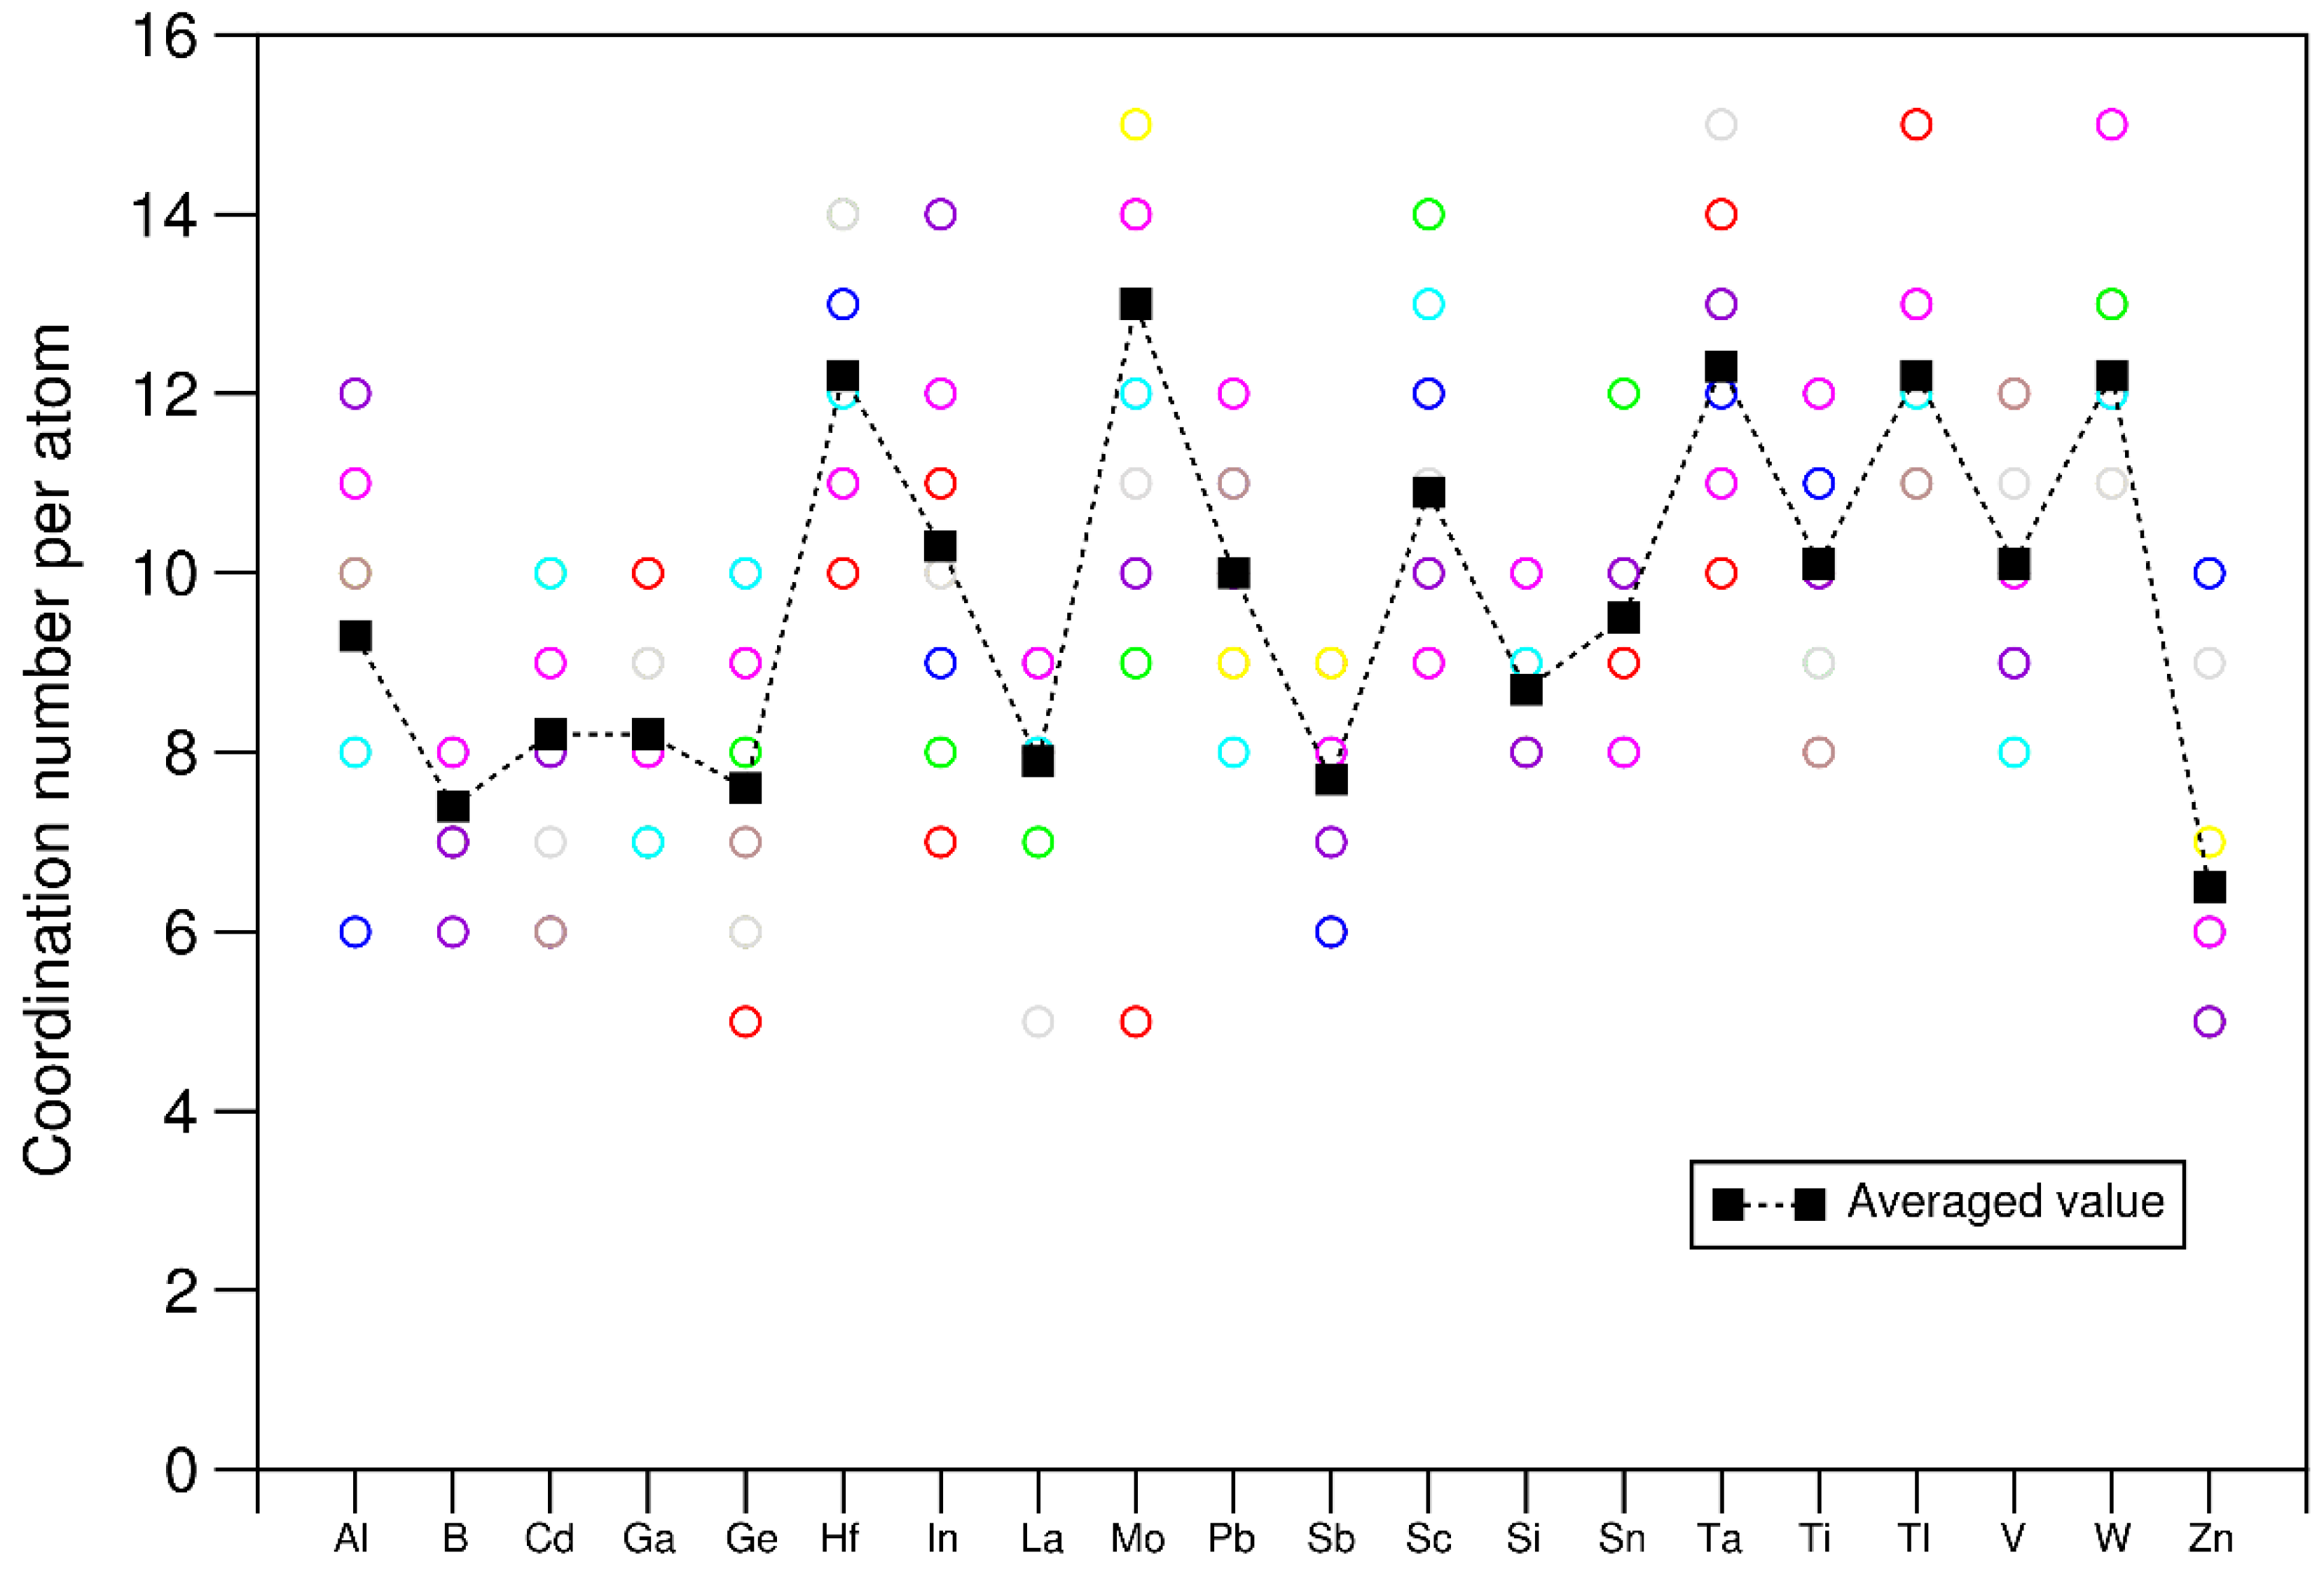
Figure 9.
(a) Total density of states of and normalized sum of the density of states for each atomic species in the 20e-HEAA sample relaxed at 0 K. The Fermi level is at zero eV.
Figure 9.
(a) Total density of states of and normalized sum of the density of states for each atomic species in the 20e-HEAA sample relaxed at 0 K. The Fermi level is at zero eV.
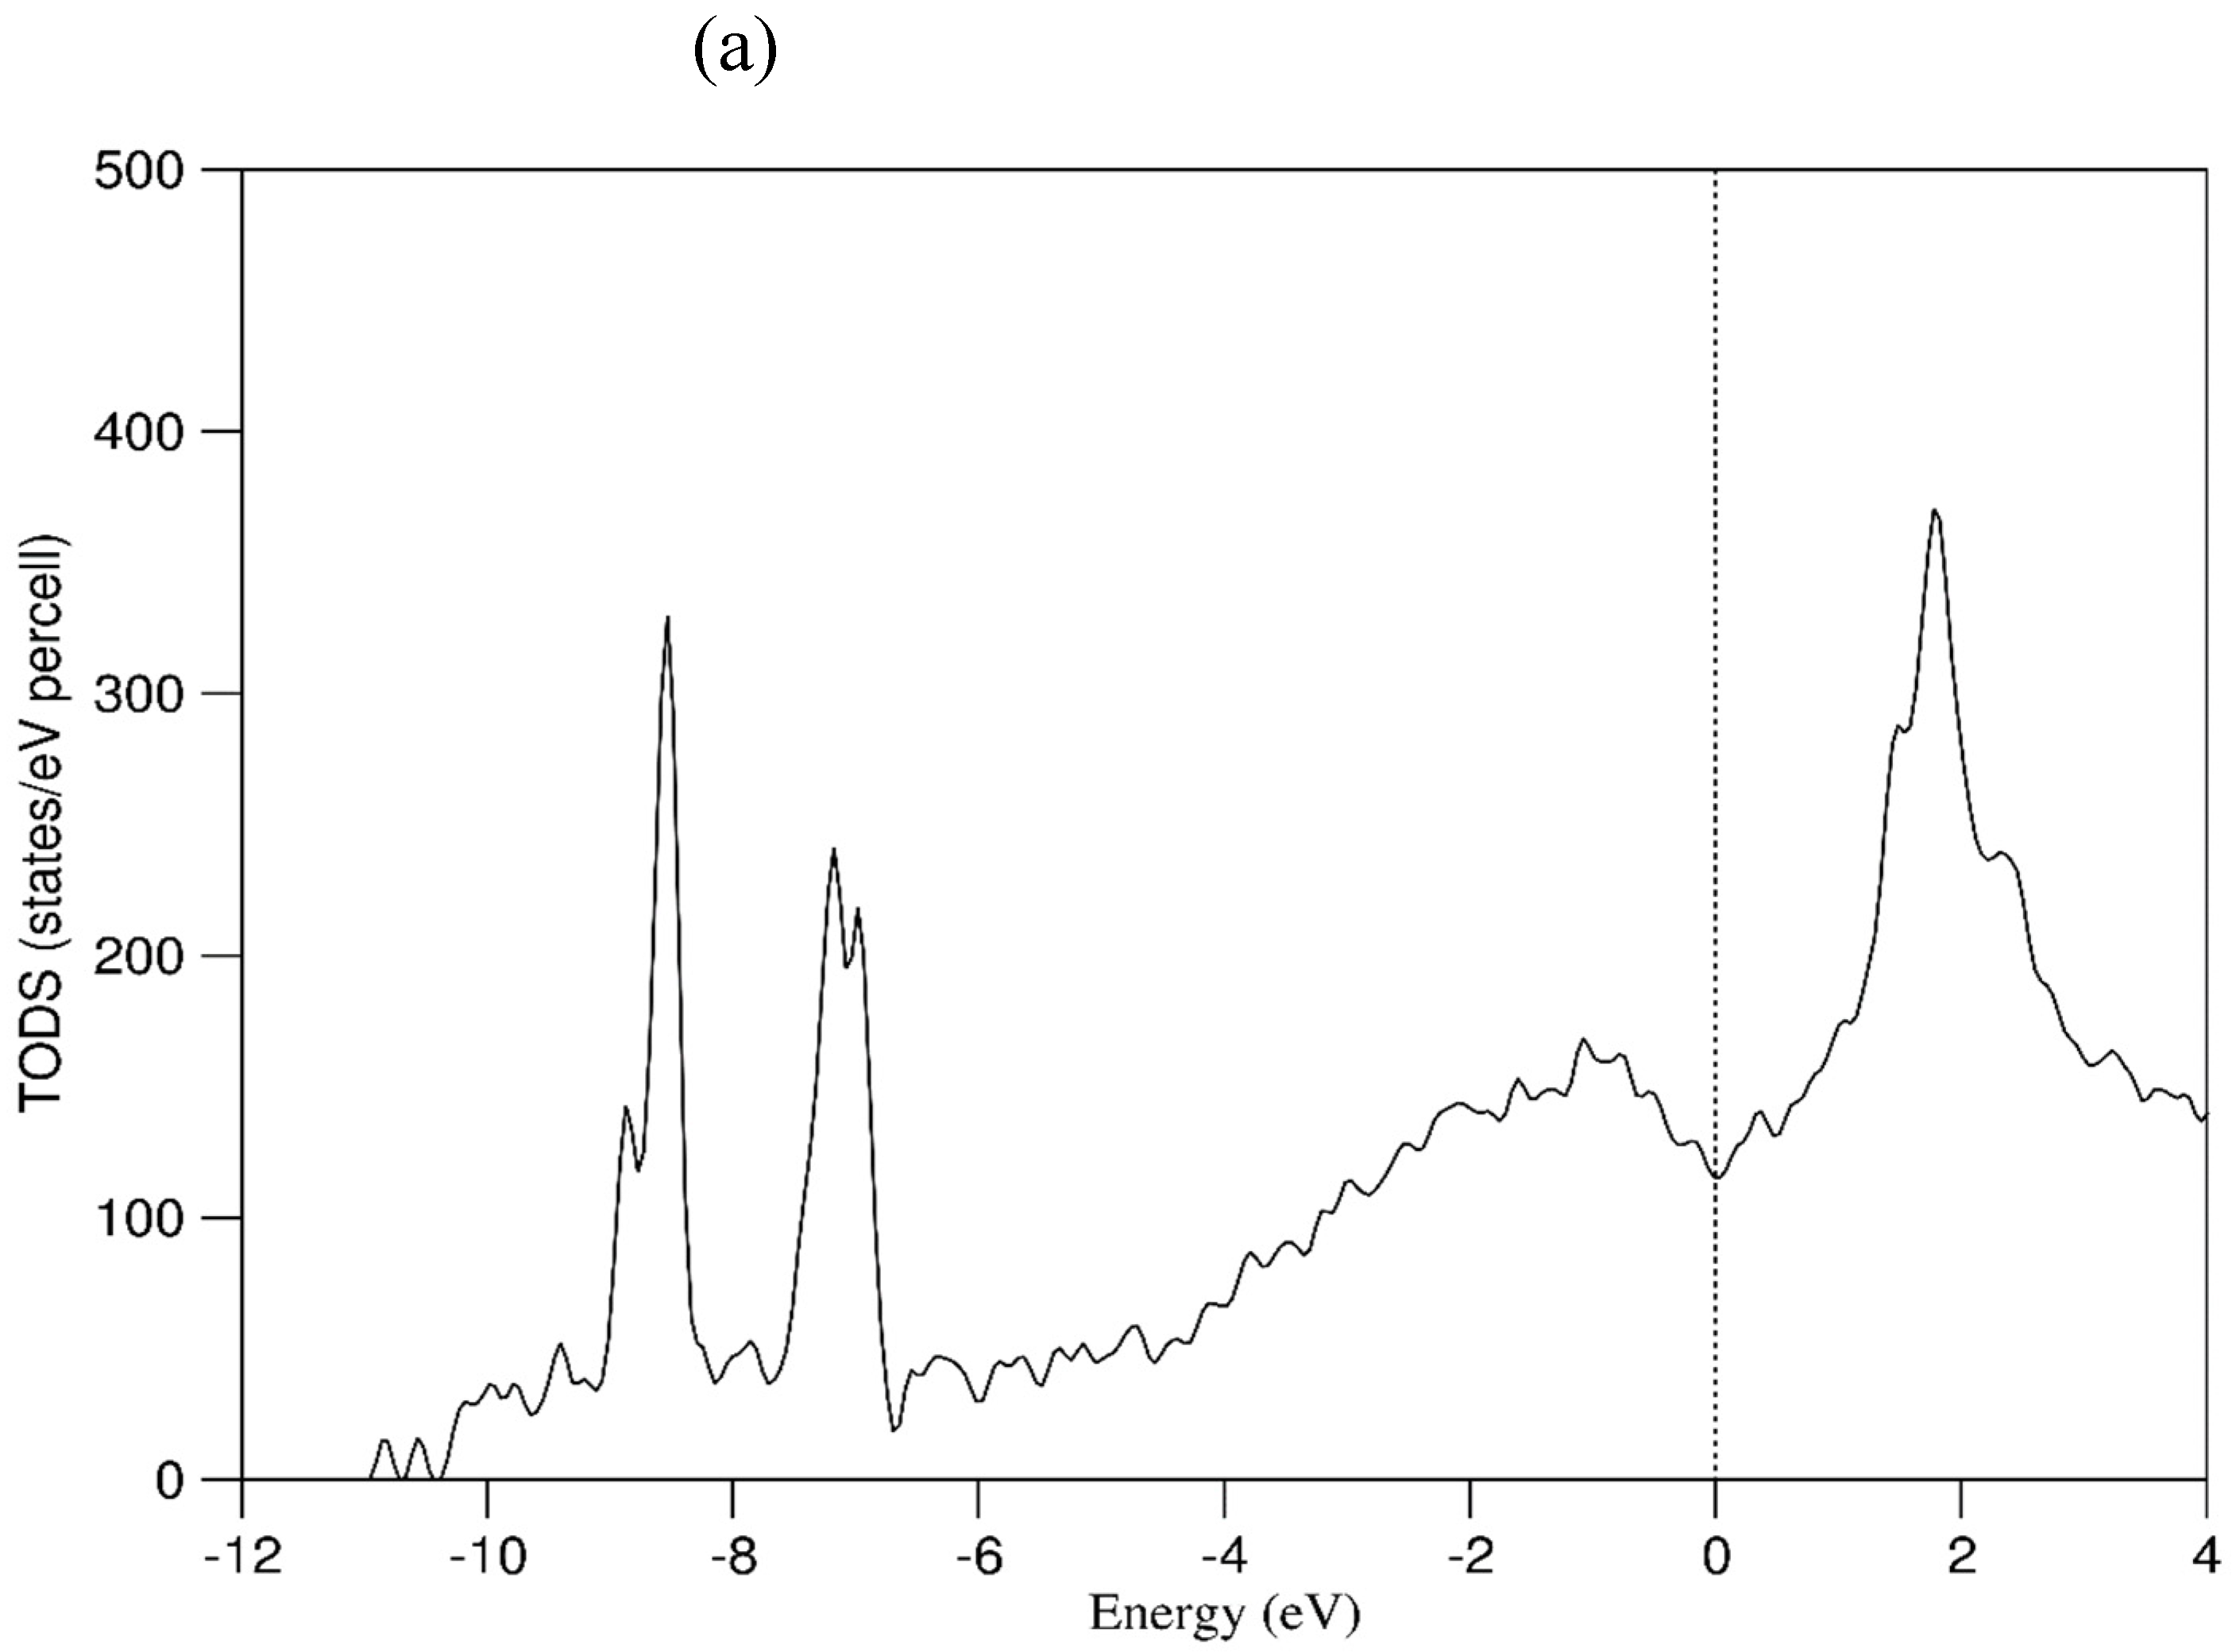
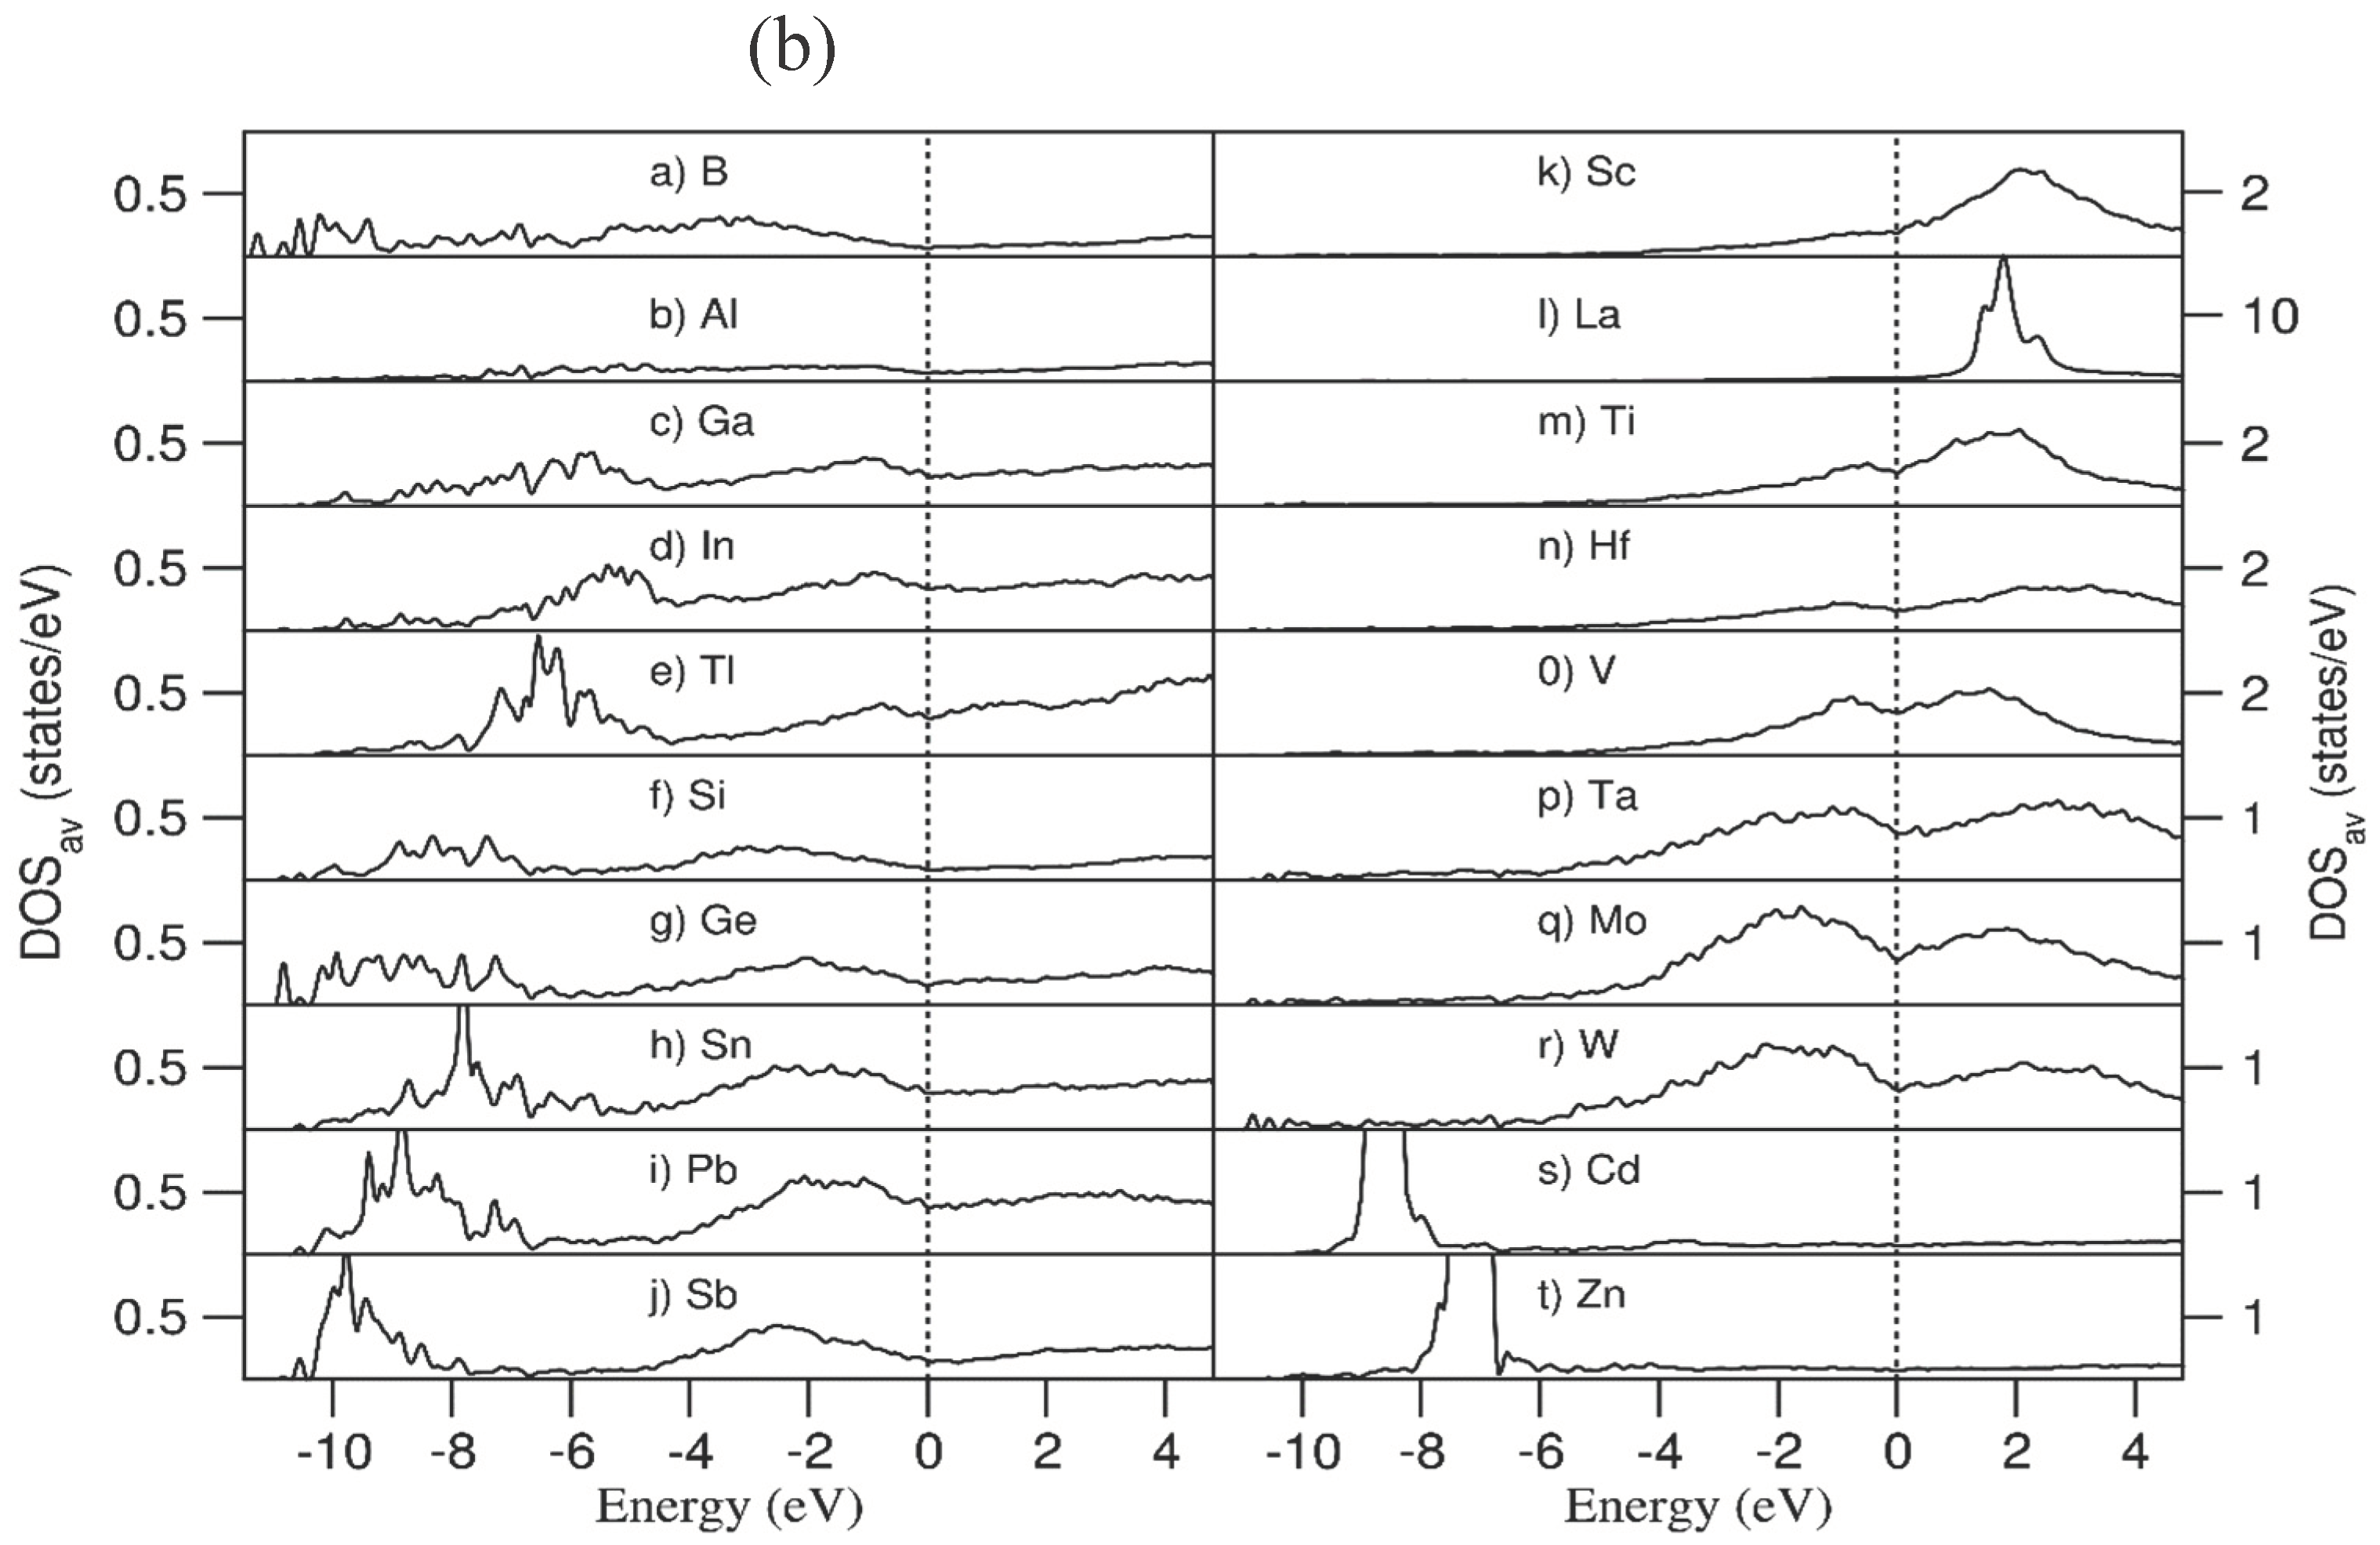
Figure 10.
Calculated charges at the atomic sites (black spheres) the averaged charges for each elements (green diamonds) and related electronegativity values of the elements (red squares) in the 20 equiatomic high entropy amorphous alloy system. The red dotted line represents the averaged value of electronegativity values of the elements.
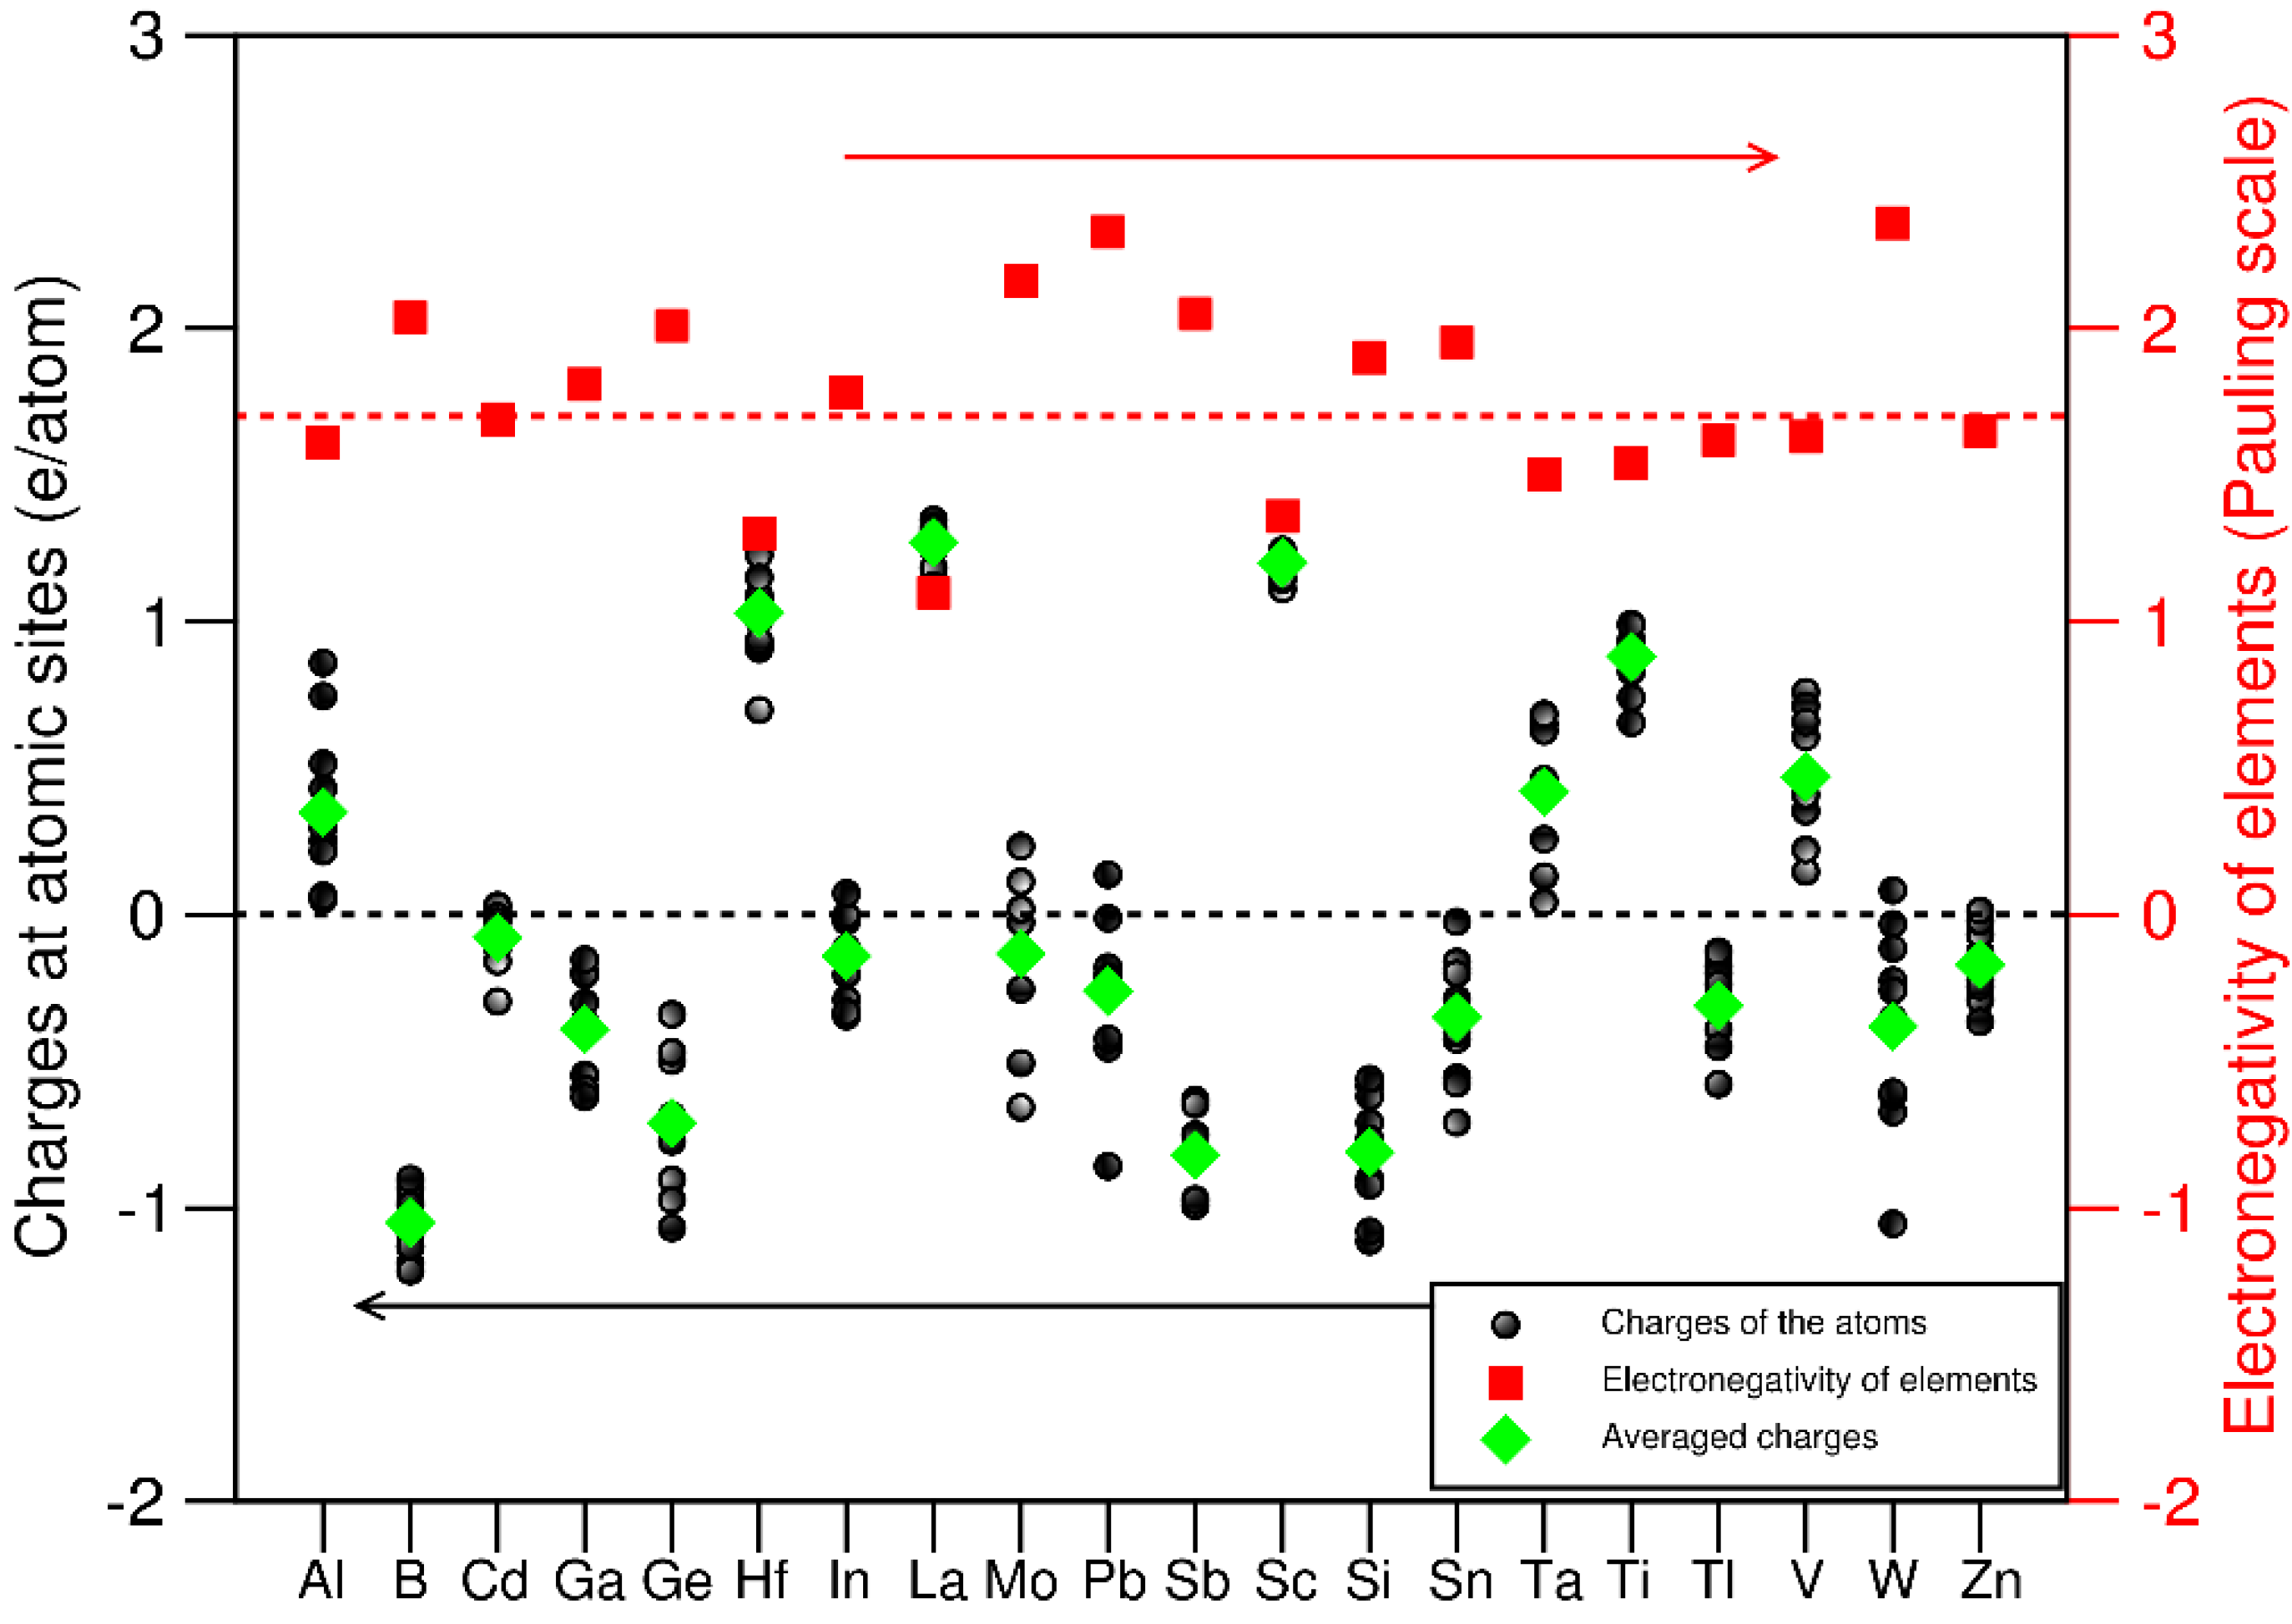

Table 1.
Basic properties of the elements in the equiatomic 20e system. P.u. represents Pauling unit for the electronegativity, χ. E.C. represents electronic configuration.
Table 1.
Basic properties of the elements in the equiatomic 20e system. P.u. represents Pauling unit for the electronegativity, χ. E.C. represents electronic configuration.
| M | Latt. [34] | Mass (Da) |
VEC(e/at.) E. C. [32] |
r0(Å) [32,34] |
χ(P.u.) [32] |
Tm [34] (K) |
ΔHmix(i) (kJ/mol) |
Selected Δmix(AB)[33] |
|---|---|---|---|---|---|---|---|---|
| B | Rho. | 10.811 | 3 2s2 2p1 |
0.820 | 2.04 | 1300 | -13.82 | B-: Hf(-66), Ti(-58), Sc(-55); B-: Tl(27), Pb(31), Sb(23), In(18). |
| Al | FCC | 26.981 | 3 3s2 3p1 |
1.432 | 1.61 | 933.5 | -11.24 | Al-: Hf(-39), Sc(-38), La(-38); Al-: Tl(11), Pb(10), In(7) |
| Ga | Orth. | 68.723 | 3 4s2 4p1 |
1.393 | 1.81 | 303 | -8.08 | Ga-: La(-41), Sc (-38), Hf(-34); Ga-: Mo(6), B(6), Tl(6), Pb(5). |
| In | Tetra. | 114.820 | 3 5s2 5p1 |
1.659 | 1.78 | 430 | +0.39 | In-: La(-39), Sc(-30), Hf(-18); In-: W(38), Mo(33), B(18). |
| Tl | Hex. | 204.380 | 3 6s2 6p1 |
1.716 | 1.62 | 577 | +5.66 | Tl-: La(-38), Sc(-28), Hf(-11); Tl-: W(52), Ta(24), Mo(46), B(27). |
| Si | FCC | 28.085 | 4 3s2 3p2 |
1.153 | 1.90 | 1690 | -31.08 | Si-: Hf(-77), Sc(-74), La(-73); Si-: Tl(-4), Pb(-2) |
| Ge | FCC | 72.610 | 4 4s2 4p2 |
1.240 | 2.01 | 1211 | -25.18 | Ge-: La(-73.5),Sc(-69.5),Hf(-65.5); Ge-: B(-0.5) |
| Sn | Tetra. | 118.710 | 4 5s2 5p2 |
1.620 | 1.96 | 505 | -5.66 | Sn-: La(-53), Sc(-45), Hf(-35); Sn-: W(27), B(18), Mo(20). |
| Pb | FCC | 207.200 | 4 6s2 6p2 |
1.750 | 2.33 | 600.6 | +2.24 | Pb-: La(-51), Sc(-40), Hf(-23); Pb-: W(49), B(30), Mo(42). |
| Sb | Trig. | 121.750 | 5 6s2 6p3 |
1.453[2] | 2.05 | 904 | -10.34 | Sb-: La(-71), Sc(-61), Hf(-50); Sb-: W(25), B(18), Mo(17). |
| Sc | Hex. | 44.956 | 3 3d1 4s2 4p0 |
1.641 | 1.36 | 1814 | -25.24 | Sc-: Si(-74), Ge(-69.5), Sb(-61); Sc-: Ta(16), Mo(11), W(9), Ti(8) |
| La | Hex. | 138.900 | 3 4f0 5d1 6s2 6p0 |
1.879 | 1.10 | 1191 | -22.97 | La-: Ge(-73.5), Si(-73), Sb(-71); La-: Ta(33), W(32), Mo(31), |
| Ti | HCP | 47.880 | 4 3d2 4s2 4p0 |
1.462 | 1.54 | 1943 | -15.45 | Ti-: Si(-66), B(-58), Ge(-51.5) Ti-: La(20), Sc(8), Tl(2). |
| Hf | Hex. | 178.490 | 4 5d2 6s2 6p0 |
1.578 | 1.30 | 2502 | -23.71 | Hf-: Si(-77), B(-66), Ge(-65.5); Hf-: La(15), Sc(5), Ta(3). |
| V | BCC | 50.941 | 5 3d3 4s2 4p0 |
1.316 | 1.63 | 2201 | -3.97 | V-: Si(-48), B(-42), Ge(-31.5); V-: Tl(22), La(22), Pb(15), In(12). |
| Ta | BCC | 180.948 | 5 5d3 6s2 6p0 |
1.430 | 1.50 | 3293 | -5.50 | Ta-: Si(-56), B(-54), Ge(-37.5); Ta-: La(33), Tl(24), Sc(16) |
| Mo | BCC | 95.940 | 6 5d4 6s2 6p0 |
1.363 | 2.16 | 2895 | +7.71 | Mo-: Si(-35), B(-34), Ge(-13.5) Mo-:Tl(46), Pb(42), In(33) |
| W | BCC | 183.850 | 6 6d1 7s2 7p0 |
1.367 | 2.36 | 3687 | +10.50 | W-: Si(-31), B(-31), Ge(-7.5); W-: Tl(52), Pb(49), In(38). |
| Zn | HCP | 65.390 | 12 3d10 4s2 4p0 |
1.395 | 1.65 | 693 | -4.82 | Zn-: Sc(-29), La(-31),Hf(-24) Zn-: W(15), Tl(6), Pb(5); |
| Cd | Hex. | 112.411 | 12 4d10 5s2 5p0 |
1.568 | 1.69 | 594 | -0.27 | Cd-: La(-36), Sc(-30), Hf(-19); Cd-: W(33), Mo(28), B(13). |
| Av. dev. |
- - |
103.739 |
4.8 - |
1.462 δ:14.6% |
1.77 Δχ:0.324 |
1463 - |
-9.52 - |
s, p elements prefer: La, Hf, Sc; d-elements prefer: Si, B, Ge; Zn and Cd prefer La, Sc and Hf. |
Disclaimer/Publisher’s Note: The statements, opinions and data contained in all publications are solely those of the individual author(s) and contributor(s) and not of MDPI and/or the editor(s). MDPI and/or the editor(s) disclaim responsibility for any injury to people or property resulting from any ideas, methods, instructions or products referred to in the content. |
© 2024 by the authors. Licensee MDPI, Basel, Switzerland. This article is an open access article distributed under the terms and conditions of the Creative Commons Attribution (CC BY) license (http://creativecommons.org/licenses/by/4.0/).
Copyright: This open access article is published under a Creative Commons CC BY 4.0 license, which permit the free download, distribution, and reuse, provided that the author and preprint are cited in any reuse.


