Submitted:
17 February 2024
Posted:
19 February 2024
You are already at the latest version
Abstract
Global warming may increase the potential evapotranspiration (Etp), thereby affecting the amount of clean water resources available in a region. In this study, the systematic biases in temperature outputs of 24 global climate models (GCMs) under 3 emission scenarios are corrected by using 8 bias correction methods. The trend of Etp in Yangzi River Delta in the 21st century is projected by using 4 Etp calculation formulas. The uncertainty of the projections is estimated and decomposed by using multi-way analysis of variance. The influence of uncertainty on the projected change signal is quantified by using the signal-to-noise ratio. The results show that, relative to the reference period (1971~2000), the annual mean daily Etp in Yangzi River Delta will increase by 0.14~0.17mm/d during the period 2021~2050 and by 0.21~0.41mm/d during the period 2061~2090, respectively. During 2021~2050, the uncertainty of Etp increase projections is dominantly contributed by the main effects of GCM (63%) and Etp calculation formula (24%). During 2061~2090, it is mainly contributed by the main effect of GCM (36%), followed by the main effects of emission scenario (34%) and Etp calculation formula (18%). The increase projections of Etp are generally reliable and robust during the two projection periods.
Keywords:
potential evapotranspiration
; temperature
; projection
; uncertainty
; robustness
1. Introduction
Evapotranspiration is a key physical process related to the water and energy balance in climate and hydrological systems, which plays a vital role in studying climate change, water resources development and utilization, crop water demand management, drought warning and monitoring, etc. The actual evapotranspiration is often invisible and difficult to monitor [1]. Therefore, it is usually estimated from the potential evapotranspiration (Etp) through methods based on hydrology, micrometeorology, and et al. Etp is the evaporation from an extended surface of the short green crop which fully shades the ground, exerts little or negligible resistance to the flow of water, and is always well supplied with water [2]. Etp is not only an important measure of atmospheric evapotranspiration capacity, but also an important research content of land surface water and energy balance. It is of great significance for regional farmland irrigation, drought evaluation, and watershed runoff simulation and estimation. Previous studies show that Etp is closely related to air temperature, solar radiation, and wind speed [3,4,5,6,7]. However, the Sixth Assessment Report of the Intergovernmental Panel on Climate Change (IPCC) points out that human activities caused global warming [8]. In comparison with the period 1850~1900, the global mean surface temperature increased by 0.99 (0.84~1.10) °C during the period 2001~2020 and by 1.09 (0.95~1.20) °C during the period 2011~2020 [8]. Global warming may increase the evapotranspiration capacity of the atmosphere, thereby affecting the availability of clean water resources in a region. Therefore, projecting the Etp trend under future climate change scenarios is beneficial for adaptation to the adverse effects of climate change.
Predicting the response of Etp to climate change usually takes a ‘top-down’ approach which combines the outputs of global climate models (GCMs) with Etp calculation formulas. To describe the physical processes in the ocean-atmosphere-land-biosphere-cryosphere system, GCMs are constructed according to the Navi-Stoker equation of the rotating sphere [8,9]. It simulates the global climate system according to the mass continuity equation, energy conservation equation, state equation, and other static approximate equations. Then the global climate change in the next hundred years can be projected through GCMs according to the future greenhouse gas and aerosol emission scenarios, which is constructed according to the future economic development, population growth, science and technology development, and et al. The calculation formulas of Etp usually take air temperature, solar radiation, and wind speed etc. as inputs, and calculate the corresponding Etp via mathematical models which abstract and generalize the processes in evapotranspiration, making it possible to project the Etp response to climate change. However, the projected results of different GCMs and Etp calculation formulas usually differ from one another. This means that the Etp projections provided by this framework include multi-source uncertainties, which will reduce the reliability and robustness of the Etp projections to a certain extent [10]. The estimation and decomposition of uncertainty and a further analysis on its main sources can point out the direction for reducing the uncertainty of response projection and improving the robustness of this projection. At the same time, the adverse influence of uncertainty on the response projection can be evaluated, and a reference on the scientific formulation of adaptation policy can be provided.
Yangzi River Delta (114°53’E, 27°03’N ~ 122°57’E, 35°08’N) is located in the east coast of China, covering a land area of 359 thousand km2. There are three provinces (Anhui, Jiangsu, Zhejiang) and a municipality (Shanghai) directly under the central government in this delta, formulating one of the ten largest city clusters in the word. It is one of the two economic deltas with the most active economic development, the highest degree of openness, and the strongest innovation capacity in China. It plays a pivotal strategic position in the overall situation of national modernization and all round opening-up. The developed economic of Yangzi River Delta is closely related to its pleasant climate (with the average annual temperature being 16 °C and the average annual precipitation being 1200 mm) and abundant water resources (with the first and third largest rivers in China flowing through it). However, global climate change has exerted some certain influence on the water resources in Yangzi River Delta. For instance, although the precipitation has increased slightly in the past 50 years, the total water resources in Zhejiang Province are obviously lower than the annual average since the 21st century due to the increasing evapotranspiration. Therefore, this study intends to evaluate the Etp trend in Yangzi River Delta under the background of global climate change through an impact modeling chain from 3 emission scenarios to 24 GCMs and then 8 bias correction methods and finally 4 Etp calculation formulas. Then the uncertainty of the Etp projections is estimated and decomposed to investigate its main source by using multi-way analysis of variance (ANOVA). Finally, the robustness of the projections is evaluated by using the signal-to-noise ratio (SNR).
2. Materials and Methods
2.1. Outputs of GCMs
In this study, the simulation and projection data of daily maximum temperature (TX) and daily minimum temperature (TN) of 24 GCMs (Table 1) under three emission scenarios in the Coupled Model Intercomparison Project phase 6 (CMIP6) [11] archive are used. These GCMs are forced by the historical forcing during the period 1950~2014 and by three shared socioeconomic pathways (SSPs) - representative concentration pathways (RCPs) matrix emission scenarios [12] during the period 2015~2100. The three emission scenarios include a low concentration scenario (SSP1-2.6), a medium stabilization concentration scenario (SSP2-4.5), and a high concentration scenario (SSP5-8.5).
2.2. Observed Meteorological Datasets
In this study, a 0.5°×0.5° grid dataset of daily surface temperature in China (V2.0) is used as observed meteorological dataset. This dataset is provided by the China Meteorological Data Service Center & National Meteorological Information Center (https://data.cma.cn/data/cdcindex/cid/00f8a0e6c590ac15.html). It is based on the basic meteorological elements data of China's high-density stations (2472 national meteorological stations), and interpolated into a common 0.5°×0.5° grid over the Chinese mainland via a thin plate spline method. This dataset covers the period 1961~2019, and there are 159 grid points in or around Yangzi River Delta, as shown in Figure 1.
To evaluate the accuracy of empirical Etp calculation formulas used in this study, the daily Etp calculated via Penman-Monteith formula based on the daily China surface climate dataset (V3.0) is compared with that calculated via the empirical formulas. The daily China surface climate dataset (V3.0) is provided by the China Meteorological Data Service Center & National Meteorological Information Center (http://data.cma.cn/data/cdcdetail/dataCode/SURF_CLI_CHN_MUL_DAY_V3.0.html) as well. In this study, the records of temperature, atmosphere pressure, relative humidity, wind speed and sunshine duration in 1961~2010 of 71 stations (as shown in Figure 1) are used, since they are relatively complete.
2.3. Bias Correction
As the outputs of GCMs are usually contaminated by large systematic biases, bias correction methods are widely used to correct the original climate outputs of GCMs. To include the uncertainty caused by different classes of bias correction methods, four single-site bias correction methods (Daily Bias Correction (DBC) [13], Quantile Delta Mapping (QDM) [14], Multivariate Bias Correction n-dimensional probability density function transform (MBCn) [15], Two-Stage multivariate Quantile Mapping (TSQM) [16]) and four multi-site bias correction methods (DBC-EC, QDM-EC, MBCN-EC, TSQM-EC) are used in this study. In DBC-EC, QDM-EC, MBCn-EC, and TSQM-EC, a post-processing approach named by Empirical Copular function [17,18,19,20] is used in resorting the outputs of DBC, QDM, MBCn, and TSQM to restore the correlation among sites and variables.
Before correcting the biases of GCM outputs, the performance of the eight bias correction methods is evaluated. Specifically, the periods 1961~1980 and 1981~2000 are selected as the calibration and validation periods, respectively. The outputs of each GCM in the calibration and validation periods under the historical forcing are taken as the simulation and projection data, respectively. Each bias correction method is applied to correct the bias of GCM outputs. Then the performance of the bias correction methods in the calibration and validation periods can be evaluated.
2.4. Etp Calculation
As the temperature projections of GCMs are generally much more reliable [21,22,23] than those of other climate variables (such as wind speed and humidity), using formulas based on temperature to project the response of Etp to climate change is relatively reasonable [24]. Therefore, four empirical formulas based on temperature variables are used in this study to calculate the daily Etp, including the Blaney-Criddle formula [25] (Eq. (1)), Hargreaves-Samani formula [6] (Eq. (2)), Makkink formula [7] (Eq. (3)), and Priestley and Taylor formula [3] (Eq. (4)).
where is the daily potential evapotranspiration, mm/d; is the percentage of total daytime hours for the used period, dimensionless; the angle of sunrise, rad; is the latitude, rad; is the magnetic declination of the sun, rad; is the day order, dimensionless; is the daily mean temperature, °C; is the daily maximum temperature, °C; is the daily minimum temperature, °C; and are undetermined coefficients [monthly consumptive use coefficient, depending on vegetation type, location and season and for the growing season, varying from 0.5 for orange tree to 1.2 for dense natural vegetation, respectively 0.85 and 0.45 for the growing season (April to September) and the non-growing season (October to March) by default].
where is the extraterrestrial radiation, MJ/(m2×d); is the relative distance between the earth and the sun, dimensionless; is the latent heat of vaporization, MJ/kg; and are undetermined coefficients (respectively 0.0023 and 17.8 by default).
where is the slope of the relationship between saturation vapor pressure and temperature, kPa/°C; is the solar radiation, MJ/(m2×d); is the empirical coefficient, dimensionless; is the psychometric constant, kPa/°C; is the altitude, m; and are undetermined coefficients (respectively 0.61 and -0.12 by default).
where is the net radiation, MJ/(m2×d); and are undetermined coefficients (respectively 30.1 and 0 by default).
Usually, empirical formulas using the default coefficients are employed in previous studies [10,26,27,28,29,30]. However, large errors resulted for most empirical formulas when using the original constant coefficients and local calibration of these coefficients (hereafter undetermined coefficients) could reduce these errors to a large extent [31,32,33]. Therefore, undetermined coefficients of the four empirical formulas are locally calibrated in this study. Specifically, the periods 1961~1990 and 1991~2010 are selected as the calibration and validation periods, respectively. The Etp in the calibration period calculated via the Penman-Monteith formula [4] (Eq. (5)) using the daily China surface climate dataset is selected as the actual Etp. The Penman-Monteith formula is based on energy balance and water vapor diffusion, and has been proved to have high accuracy [5]. In this study, a revised version of this formula recommended by the Food and Agriculture Organization of the United Nations in 1998 is used. The undetermined coefficients are adjusted station by station to make the Etp calculated via each empirical formula using the same dataset as close as possible to the actual Etp. Then the four empirical formulas (respectively using the default and calibrated coefficients) and the Penman-Monteith formula are applied to calculated the Etp during the calibration and validation periods by using the daily China surface climate dataset as well. The mean R2 [Eq. (6)] and mean absolute value of relative error [ARE, Eq. (7)] during the calibration and validation periods across all meteorological stations are calculated for the four empirical formulas. The performance of the four empirical formulas before and after locally calibration is evaluated in terms of R2, relative error, inter-annual trend, and intra-annual distribution.
where is the net radiation, MJ/m2/d; is the soil heat flux, MJ/m2/d; is the wind speed at 2m height, m/s; is the saturation vapor pressure, kPa; is the actual vapor pressure, kPa.
where is the ith observed value; is the ith simulated value; is the mean value of all observed values; is the coefficient of determination.
where is the mean value of all simulated values; is the absolute value of relative error.
After the evaluation, to take full advantage of the daily China surface climate dataset, the undetermined coefficients of the four empirical formulas are locally calibrated again with the Penman-Monteith formula being the benchmark while using this dataset during the period 1961~2010, then interpolated into the meteorological grids via the thiessen polygon method, and applied when simulating the historical and projecting the future Etp.
2.5. Uncertainty Estimation and Decomposition
In this study, the multi-way ANOVA is used to quantitatively estimate and decompose the uncertainty of response projections, so as to make it possible to calculate the relative contribution of each uncertainty component to the total uncertainty [34,35,36,37]. The basic idea of ANOVA is to decompose variation. Specifically, the explanatory variables are first set to several levels. Then the orthogonal combination of these variables is carried out and the corresponding dependent variable numerical matrix can be obtained. Finally, the total variance of the dependent variable is decomposed into the variance resulting from each explanatory variable individually and the variance resulting from two or more explanatory variables interactively. Taking the uncertainty of the increase projection of TX or TN after bias correction for instance, the uncertainty estimating and decomposing processes in the three-way ANOVA are illuminated as follows (those in other multi-way ANOVAs are similar).
Firstly, the increase of TX or TN in the projecting period relative to the reference period is calculated as follows:
where the subscript is serial number of emission scenario; is the amount of emission scenarios; is the serial number of GCM; is the amount of GCMs; is the serial number of bias correction method; is the amount of bias correction methods; and are respectively the annual mean TX or TN during the projection and reference periods for the sth emission scenario, gth GCM, and bth bias correction method; is the increase of TX or TN in the projection period relative to reference period under the sth emission scenario, gth GCM, and bth bias correction method.
Then the means of are calculated as:
Finally, the uncertainty components and total uncertainty are calculated as:
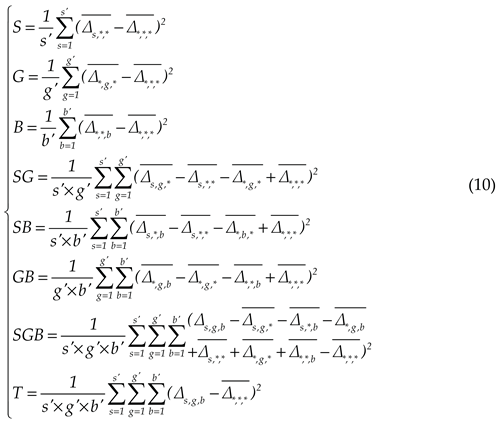
where is the uncertainty resulting from the main effect of emission scenario; is the uncertainty resulting from the main effect of GCM; is the uncertainty resulting from the main effect of bias correction method; is the uncertainty resulting from the interaction effect between emission scenario and GCM; is the uncertainty resulting from the interaction effect between emission scenario and bias correction method; is the uncertainty resulting from the interaction effect between GCM and bias correction method; is the uncertainty resulting from the interaction effect among emission scenario, GCM, and bias correction method; and is the total uncertainty.
2.6. SNR
The influence of uncertainty on the change projections of temperature or Etp is that it interferes with the projections greatly, which makes it difficult for decision-makers to eliminate the influence of change noise and further identify the change signal accurately. In this study, the SNR proposed by Hawkins and Sutton [38] is used to quantify the influence of uncertainty on change signal. In this index, the mean of all increase projections is defined as the change signal, and the 90% confidence interval of all increase projections (approximately equal to 1.65 times the square root of total uncertainty) is defined as the change noise. Then the SNR is calculated as:
where is the mean of all increase projections; is the total uncertainty.
2.7. Studying Route
In this study:
(1) The period 1971~2000 is selected as the reference period, and the periods 2021~2050 and 2061~2090 are selected to represent the near and far projecting periods. With the observed TX and TN as reference, the eight bias correction methods are used to correct the TX and TN outputs of the 24 GCMs under the historical forcing and three emission scenarios. Then the temperature trend in Yangzi River Delta under the background of global climate change is evaluated by using the corrected TX and TN. The uncertainty of temperature projections is estimated and decomposed by using three-way ANOVA, and its influence on temperature change signal is quantified by using SNR.
(2) The daily Etp at each grid point is estimated via the four empirical Etp calculation formulas by using the corrected TX and TN as inputs. Then the Etp trend during the two projection periods in Yangzi River Delta is evaluated. The uncertainty of Etp predictions is estimated and decomposed via four-way ANOVA, and the relative contribution of each uncertainty component to the total uncertainty is quantified. The influence of uncertainty on Etp increase signal is quantified by SNR.
3. Results
3.1. Performance of GCMs
Good simulation ability is a prerequisite for model projection. Therefore, the performance of GCMs is evaluated by comparing the simulated temperature to that in the 0.5°×0.5° grid dataset of daily surface temperature in China (V2.0) during the period 1961~2014. Since the systematic error in the outputs of GCMs is non-negligible and can be corrected by bias correction methods [8,13,14,15,16,17,18,19,20,21], the anomaly with the mean value in 1971~2000 as the reference is calculated for each meteorological grid and each climate variable. Then the across-grid mean inter-annual trend and intra-annual distribution is calculated for each GCM and the observation, and shown in Figure 2. The results reveal that the simulated inter-decadal trend and intra-annual distribution are generally consistent with those in the observation for both TX and TN. Specifically, for TX and TN, both the simulated and observed inter-decadal trends display a decline tendency in 1960s, a general stable tendency from the early 1970s to middle 1980s, a fast increasing tendency from the middle 1980s to 1990s, but a slowdown increasing tendency in the early 21st century. In addition, the simulated ensemble mean intra-annual distribution of the 24 GCMs is very close to the observed intra-annual distribution for both TX and TN. Therefore, the ensemble of GCMs used in this study is capable to reproduce the inter-decadal trend and intra-annual distribution, while it is still unable to reproduce the inter-annual trend of the observed TX and TN. Therefore, the inter-decadal rather than the inter-annual changes of temperature and Etp is analyzed in this study.
3.2. Performance of Bias Correction Methods
Prior to projecting TX, TN, and Etp, the performance of bias correction methods in the calibration and validation periods is evaluated, as shown in Figure 3, using six evaluation statistics from three perspectives: minimum value (5% quantile), mean value, and maximum value (95% quantile). The six statistics are: the errors in the minimum value of TX, the errors in the mean value of TX, the errors in the maximum value of TX, the errors in the minimum value of TN, the errors in the mean value of TN, and the errors in the maximum value of TN. For convenience of analysis, the mean absolute values of the six statistics across all meteorological grids are calculated. The probability distribution of the mean absolute values of the 24 GCMs is presented as a boxplot for each metric. The results show that the raw outputs of GCMs are considerably biased, with the mean absolute values ranging between 1.34°C and 2.52°C. However, the systematic bias of climate model simulations is largely reduced by the eight bias correction methods. Specifically, after bias correction, the mean absolute values generally range from 0.00°C to 0.01°C in the calibration period and from 0.22°C to 0.91°C in the validation period. For all bias correction methods, the absolute errors in the validation period are obviously larger than those in the calibration period, which is due to the inconsistency in the bias of GCM outputs [39,40]. In addition, for the two temperature variables, the performance of bias correction methods are generally comparable. Overall, the eight bias correction methods used in this study can effectively reduce the systematic bias of GCMs outputs.
3.3. Temperature Projections
Firstly, the mean increase of TX or TN across GCMs and bias correction methods in each projection period under each emission scenario is calculated for each grid, then the mean increase in each city is calculated via the thiessen polygon method and displayed in Figure 4. The results showed that, in relative to the reference period, both TX and TN obviously increase in the two projection periods, and the increase during the period 2061~2090 is visibly greater than that during the period 2021~2050. Both TX and TN exhibit the maximum increases in the SSP5-8.5 scenario during the two projection periods, and exhibit the minimum increases in the SSP2-4.5 scenario during the period 2021~2050 (but this increase is very close to that in the SSP1-2.6 scenario) and SSP1-2.6 scenario during the period 2061~2090. In addition, the maximum difference among temperature increases during the period 2061~2090 (2.11°C) is obviously larger than that during the period 2021~2050 (0.27°C), which means the uncertainty of temperature projections may increase with time. Moreover, the increase of TN is generally lower than that of TX, except for the SSP2-4.5 scenario during the 2021~2050 period. In addition, it seems almost impossible (extremely difficult) to limit the temperature rise over the Yangzi River Delta to 1.5°C (2.0°C) at the end of the 21st century, even in the low emission scenario (SSP1-2.6). Specifically, the increases of TX/TN under the emission scenarios of SSP1-2.6, SSP2-4.5, and SSP5-8.5 in Yangzi River Delta are respectively 1.74/1.67°C, 1.63/1.66°C, and 1.92/1.91°C during the period 2021~2050, and they are respectively 2.34/2.19°C, 2.98/2.88°C, and 4.41/4.32°C during the period 2061~2090. In terms of the spatial distribution, the mean increases of the two temperature variables are usually lower in southeastern coastal regions (e.g., Zhoushan City, Wenzhou City, and Taizhou City in Zhejiang Province) and higher in northwestern inland regions (e.g., Bozhou City, Fuyang City, Huaibei, and Suzhou in Anhui Province, and Xuzhou City in Jiangsu Province). This is expected, as the temperature increasing rate in oceans is much lower than that in lands [41].
3.4. Uncertainty of Temperature Projections
In this study, the total uncertainty of the increase projections in TX and TN is estimated via the three-way ANOVA for each grid point and each projection period and displayed in Figure 5. The results show that the total uncertainty observably increases with time for the two temperature variables. Specifically, the mean total uncertainties of TX and TN during the period 2021~2050 in Zhejiang Province are respectively 0.28°C2 and 0.24°C2, and they rise to 1.49°C2 and 1.44°C2 during the period 2061~2090. However, the rapid increase of total uncertainty over time does not alter its general spatial distribution patterns. Specifically, for the two temperature variables, the total uncertainties are lower in the southeastern coastal regions (e.g., Zhoushan City, Wenzhou City, and Taizhou City in Zhejiang Province) and higher in the northwestern inland regions (e.g., Fuyang City, Luan City, and Bozhou City in Anhui Province). In addition, the spatial distribution pattern of the total uncertainty is similar to that of the temperature increase. This is mainly because a large increase usually shows a large difference among increase projections, which means a large uncertainty.
Further, the total uncertainty is decomposed via the three-way ANOVA. Then the magnitudes and relative contributions of all uncertainty components are calculated, and their mean values in Yangzi River Delta are calculated via the thiessen polygon method and shown in Table 2. The results show that, for TX and TN, the uncertainty components resulting from the main effect of emission scenario, the main effect of GCM, and the interaction effect between emission scenario and GCM all increase visibly along with the projection lead times, and the increase of the uncertainty component resulting from the main effect of emission scenario is obviously larger than that resulting from the main effect of GCM. The increase of uncertainty component resulting from the interaction effect between emission scenario and GCM model is very small. Other uncertainty components are all close to 0 during the two projection periods. This indicates that the increase of total uncertainty is mainly due to the substantial increase of the uncertainty component resulting from the main effect of emission scenarios, followed by that resulting from the main effect of GCM, and lastly by the slight increase of uncertainty component resulting from the interaction effect between emission scenarios and GCM. The total uncertainty is dominantly contributed by the main effect of GCM (about 90%~91%) during the period 2021~2050, but by the main effects of emission scenario (about 51%~55%) and GCM (about 41%~44%) during the period 2061~2090. Therefore, further developing GCMs and optimizing emission scenarios are reasonable ways to reduce the uncertainty of temperature projections.
In order to evaluate the influence of uncertainty on temperature increase projections, the SNR values of TX and TN are calculated for each grid point and each projection period, then its mean value in each city is calculated by the thiessen polygon method and displayed in Figure 6. The results show that the SNR values for the two temperature variables all decrease visibly over time, indicating that the robustness of temperature increase projections decreases along with the projection lead times. In addition, the SNR of TN is slightly higher than that of TX during the period 2021~2050, and very close to that of TX during the period 2061~2090. To be more specific, the mean SNR values of TX and TN in Yangzi River Delta are respectively 2.03 and 2.19 during the period 2021~2050, while they decrease to 1.61 and 1.58 during the period 2061~2090. Even so, the SNR values are obviously higher than 1.0 for the two temperature variables during the two projection periods, indicating that the temperature increase projections in Yangzi River Delta are robust and reliable. In terms of spatial distribution, the SNR values of the two temperature variables show similar spatial distribution patterns in the two projection periods. To be more specific, the SNRs are generally higher in the eastern coastal regions (e.g., Yancheng City, Lianyungang City, and Nantong City in Jiangsu Province, Taizhou City and Zhoushan City in Zhejiang Province) and lower in the western inland regions (Anqing City, Chizhou City, Huangshan City, Luan City, and Tongling City in Anhui Province). This spatial distribution pattern is a result from the comprehensive effects of the temperature increase and uncertainty.
3.5. Performance of the Empirical Etp Calculation Formulas
To evaluate the performance of the locally calibration of undetermined coefficients in the four empirical Etp calculation formulas, the across-station mean R2 and ARE during the calibration and validation periods are calculated for the four formulas respectively using the default and calibrated coefficients and displayed in Figure 7. The results show that the locally calibration of undetermined coefficients can improve the performance of empirical Etp calculation formulas to a large extent. To be more specific, for the four empirical formulas during the calibration and validation periods, the mean R2 is all lower than 0.68 and the mean ARE is all higher than 7.0% when using the default coefficients. When using the locally calibrated coefficients, however, the mean R2 is all higher than 0.82 and the mean ARE is all lower than 5.0% during the two periods. In addition, the mean R2 and ARE during the validation period are generally close to those during the calibration period, indicating that the performance of the four formulas is steady.
Further, to evaluate the performance of Etp calculation formulas, the across-station mean inter-annual trends and intra-annual distributions of daily Etp during the period 1961~2010 are calculated for the four empirical formulas using the locally calibrated coefficients and the Penman-Monteith formula and presented in Figure 8. The results show that the inter-annual trends and intra-annual distributions of daily Etp calculated by the four formulas are generally consistent with those by the Penman-Monteith formula. Specifically, the across-station and across-year mean Etp values calculated by the Blaney-Criddle formula, Hargreaves-Samani formula, Makkink formula, and Priestley-Taylor formula are respectively 2.59mm/d, 2.53mm/d, 2.49mm/d, and 2.56mm/d, which are very close to that by the Penman-Monteith formula (2.54mm/d). In addition, the general increasing trend after the 1990s obtained by the Penman-Monteith formula is well captured by the four empirical formulas. Moreover, all the four empirical formulas show a general higher in summer while lower in winter intra-annual distribution pattern, which is consistent with that of the Penman-Monteith formula. However, it is worth mentioning that there is an obvious decreasing trend before the 1980s obtained by the Penman-Monteith formula, which is not completely captured by the Blancy-Criddle formula.
3.6. Etp Projections
The daily Etp is calculated via the four empirical formulas according to the corrected TX and TN. Then its mean increase in each projection period relative to the reference period is calculated for each grid point, each GCM, each bias correction method, and each Etp calculation formula. Finally, the mean increase of Etp in Yangzi River Delta under each emission scenario and each projection period across the 24 GCMs, 8 bias correction methods, and 4 empirical Etp calculation formulas is calculated via the thiessen polygon method and displayed in Figure 9. The results show that, in relative to the reference period, the annual mean daily Etp shows an obvious increasing trend for each projection period and each city in Yangzi River Delta, and the increase during the period 2061~2090 is obviously higher than that during the period 2021~2050. Similar to the two temperature variables, the increase in Etp is highest in the SSP5-8.5 scenario during the two projection periods, and lowest in the SSP2-4.5 scenario (but this increase is very close to that in the SSP1-2.6 scenario) during the period 2021~2050 but SSP1-2.6 scenario during the period 2061~2090. To be more specific, the mean increase of annual mean daily Etp in Yangzi River Delta during the period 2021~2050 is respectively 0.15mm/d, 0.14mm/d, and 0.17mm/d under the SSP1-2.6, SSP2-4.5, and SSP5-8.5 scenarios. During the period 2061~2090, they rise to 0.21mm/d, 0.27mm/d, and 0.41mm/d, respectively. In addition, the increase of Etp shows similar spatial distribution patterns under the three emission scenarios during the two projection periods. Specifically, the increase of Etp is usually lower in southeastern coastal regions (Zhoushan City, Wenzhou City, and Taizhou City in Zhejiang Province) and higher in northwestern inland regions (Bozhou City, Fuyang City, and Huaibei City in Anhui Province). In addition, the spatial distribution pattern of daily Etp increase is consistent with that of the two temperature variables in general. This is mainly because Etp and temperature usually show obvious positive correlation.
3.7. Uncertainty of Etp Projections
The total uncertainty of the mean increase projections in daily Etp is calculated via the four-way ANOVA and displayed in Figure 10. The results show that the total uncertainty increases with time as well. To be more specific, the mean value of total uncertainty in Yangzi River Delta is 0.004(mm/d)2 during the period 2021~2050, and rises to 0.022(mm/d)2 during the period 2061~2090. The total uncertainty is generally lower in the southeastern coastal regions (e.g., Zhoushan City, Wenzhou City, and Taizhou City in Zhejiang Province) and higher in the northwestern inland regions (e.g., Bozhou City and Fuyang City in Anhui Province) in the two projection periods. Moreover, the spatial distribution pattern of the total uncertainty for Etp is consistent with that of the two temperature variables in general.
After that, the total uncertainty is decomposed via the four-way ANOVA, and the magnitude and relative contribution of each uncertainty component are calculated for each grid point and each period. Then their mean values in Yangzi River Delta are calculated via the thiessen polygon method and displayed in Table 3. The results show that the uncertainty components resulting from the main effect of emission scenario, the main effect of GCM, and the main effect of Etp calculation formula all show obvious increasing trends along with the projection lead times. The increase in uncertainty component resulting from the main effect of GCM is lower than that resulting from the main effect of emission scenario and higher than that resulting from the main effect of Etp calculation formula. This indicates that the increase in the total uncertainty is mainly due to the increase in the uncertainty component resulting from the main effect of emission scenario, and then by that resulting from the main effects of GCM and Etp calculation formula. In addition, the total uncertainty is dominantly contributed by the uncertainty component resulting from the main effect of GCM (63%), followed by that resulting from the main effect of Etp calculation formula (24%) during the period 2021~2050. During the period 2061~2090, it is mainly contributed by the uncertainty component resulting from the main effect of GCM (36%) as well, followed by that resulting from the main effects of emission scenario (34%) and Etp calculation formula (18%). The magnitude and relative contribution of uncertainty component resulting from the main effect of bias correction method are almost negligible. Among the uncertainty components resulting from interaction effects, those resulting from the interaction effect between emission scenario and GCM and the interaction effect between GCM and Etp calculation formula are considerable, while those resulting from other interaction effects are quite small. Therefore, further developing GCMs and Etp calculation formulas and optimizing emission scenarios are reasonable ways to reduce the uncertainty of Etp projections.
In order to evaluate the influence of uncertainty on the Etp increase projections, the SNR is calculated for each grid point and each projection period, and then its mean value in each city is calculated via the thiessen polygon method and displayed in Figure 11. The results show that SNR during the period 2021~2050 is obviously higher than that during the period 2061~2090, indicating that the robustness of Etp projections decreases along with the projection lead times. To be more specific, the mean SNR in Yangzi River Delta is 1.48 during the period 2021~2050, and decreases to 1.22 during the period 2061~2090. However, the SNR values in the two projection periods are all higher than 1.0, indicating that the projections of Etp increase in Yangzi River Delta are relatively robust and reliable. In terms of spatial distribution, SNR is higher in the southeastern coastal regions (e.g., Taizhou City, Wenzhou City, Lishui City, and Ningbo City in Zhejiang Province) and lower in the northwestern inland regions (e.g., Fuyang City, Bozhou City, Huangshan City, and Chizhou City in Anhui Province) in the two projection periods.
3.8. Discussion
In this study, the Etp trend in Yangzi River Delta is projected by using an impact modeling chain from 3 emission scenarios to 24 GCMs and then 8 bias correction methods and finally 4 Etp calculation formulas. The results reveal that, in comparison with the reference period (1971~2000), the mean Etp will increase by 0.14~0.17mm/d during the period 2021~2050 and by 0.21~0.41mm/d during the period 2061~2090, respectively. The overall framework and conclusion are similar to those in most previous studies [10,24,42]. For instance, in the study by Shi, et al. [10], the Etp trend of eight meteorological stations in southeastern Australia is projected by using 2 emission scenarios (RCP4.5 and RCP8.5, which are respectively close to the SSP2-4.5 and SSP5-8.5 scenarios), 34 GCMs, and 7 Etp calculation models (four empirical formulas and three models based on random forest). And the results reveal that, the across-station mean Etp increases range from 0.09mm/d (2040s) to 0.35mm/d (2090s) under the RCP4.5 scenario and from 0.12mm/d (2040s) to 0.68mm/y (2090s) under the RCP8.5 scenarios, respectively. Therefore, the main conclusion that Etp will increase in the 21st century can be termed robust.
In addition, the uncertainty of Etp projections is estimated and decomposed via a framework based on ANOVA, which are widely used in previous studies [34,35,36,43,44,45], as well. However, many studies exhibit inconsistent conclusions on the main sources of uncertainty. For instance, this study reveals that the total uncertainty is mainly contributed by the main effects of GCM (63%) and Etp calculation formula (24%) during the period 2021~2050, and by the main effects of GCM (36%), emission scenario (34%), and Etp calculation formulas (18%) during the period 2061~2090. However, the study by Shi, et al. [10] shows that RCP-related uncertainty contributes the most to projected Etp uncertainty (around 40% for most stations) while GCM-related and Etp model-related uncertainties account for roughly equal amounts of projected Etp uncertainty (10%~30%). For the projection of future global Etp with various Etp models and GCMs, Kingston, et al. [46] claims that Etp model-related uncertainty is equal to or, in some circumstance, greater than GCM-related uncertainty. Therefore, much more efforts are still required to confirm the main sources of uncertainty in Etp projections.
4. Conclusion
In this study, the systematic biases in temperature outputs of 24 GCMs in CMIP6 under three emission scenarios are corrected via 8 bias correction methods, and then the Etp is projected via 4 empirical Etp calculation formulas by using the corrected temperature projections. After that, the temperature and Etp trends in Yangzi River Delta in the 21st century are illuminated. Subsequently, the uncertainty in the temperature and Etp increase projections is estimated and decomposed via the multi-way ANOVA frameworks, and then its main sources are explained. Finally, the influence of uncertainty on the change signal is quantified by SNR. The main conclusions are as follows:
(1) In comparison with the period 1971~2000, the increases in the annual mean TX in Yangzi River Delta are respectively 1.63~1.92°C and 2.34~4.41°C during the periods 2021~2050 and 2061~2090, and that for TN are respectively 1.66~1.91°C and 2.19~4.32°C. The total uncertainty of TX and TN increase projections is dominantly contributed by the main effect of GCM (about 90%~91%) during the period 2021~2050, and mainly by the main effect of emission scenario (about 51%~55%) and followed by the main effect of GCM (about 41%~44%) during the period 2061~2090. The increase projections of the two temperature variables in Yangzi River Delta is robust and reliable for the two projection periods.
(2) In comparison with the period 1971~2000, the annual mean daily Etp of Yangzi River Delta will increase by 0.14~0.17mm/d during the period 2021~2050 and by 0.21~0.41mm/d during the period 2061~2090, respectively. The total uncertainty of Etp increase projections is dominantly contributed by the main effect of GCM (63%) and followed by the main effect of Etp calculation formula (24%) during the period 2021~2050, and mainly contributed by the main effect of GCM (36%) and then by the main effects of emission scenario (34%) and Etp calculation formula (18%) during the period 2061~2090. The Etp increase projections are relatively robust and reliable in the two projection periods.
(3) The robustness of response projections usually decreases with the extension of the impact modeling chain (the SNR of Etp projections is obviously lower than those of TX and TN projections). Therefore, appropriate attention may be paid to the length of the impact modeling chain when making similar response projections to climate change.
Overall, when formulating the climate change adaptation policy in Yangzi River Delta, the influence of the rising Etp should be taken into consideration. In addition, the scientific community may further develop the GCMs and Etp calculation formulas and optimize emission scenarios to reduce the uncertainty of Etp projections.
Author Contributions
Calculation and writing: Lu Ding and Yi Yu; supervision: Shaobo Zhang.
Funding
This research was founded by Science and Technology Project of Zhejiang Water Resources Department (RB2021).
Acknowledgments
This work was partially supported by the Science and Technology Project of Zhejiang Water Resources Department (RB2016). The authors would like to acknowledge the contribution of the World Climate Research Program Working Group on Coupled Modeling and that of climate modeling groups for making available their respective climate model outputs.
Conflicts of Interest
The authors declare no conflicts of interest.
References
- Lu, G.; Wu, Z.; He, H. Hydrological cycle processes and quantitative forecasting; Science Press: Beijing, 2010. [Google Scholar]
- Kirkham, M.B. 26 - Potential Evapotranspiration. In Principles of Soil and Plant Water Relations, Kirkham, M.B., Ed.; Academic Press: Burlington, 2005; pp. 455–468. [Google Scholar]
- Makkink, G. Testing the Penman Formula by Means of Lysimeters. Journal of the Institution of Water Engineers 1957, 11, 277–288. [Google Scholar]
- Monteith, J.L. Evaporation and surface temperature. Quarterly Journal of the Royal Meteorological Society 1981, 107, 1–27. [Google Scholar] [CrossRef]
- Allen, R.G.; Pereira, L.S.; Raes, D.; Smith, M. Crop evapotranspiration-Guidelines for computing crop water requirements. FAO Irrigation and Drainage Paper No. 56; Food and Agriculture Organization of the UN: Rome, Italy, 1998; p. 301. [Google Scholar]
- Oudin, L.; Hervieu, F.; Michel, C.; Perrin, C.; Andréassian, V.; Anctil, F.; Loumagne, C. Which potential evapotranspiration input for a lumped rainfall–runoff model?: Part 2—Towards a simple and efficient potential evapotranspiration model for rainfall–runoff modelling. Journal of Hydrology 2005, 303, 290–306. [Google Scholar] [CrossRef]
- Trajkovic, S. Hargreaves versus Penman-Monteith under Humid Conditions. Journal of Irrigation and Drainage Engineering 2007, 133, 38–42. [Google Scholar] [CrossRef]
- IPCC. Summary for Policymakers. In Climate Change 2021: The Physical Science Basis. Contribution of Working Group I to the Sixth Assessment Report of the Intergovernmental Panel on Climate Change, Masson-Delmotte, V., P. Zhai, A. Pirani, S. L. Connors, C. Péan, S. Berger, N. Caud, Y. Chen, L. Goldfarb, M. I. Gomis, M. Huang, K. Leitzell, E. Lonnoy, J.B.R. Matthews, T. K. Maycock, T. Waterfield, O. Yelek?i, R. Yu and B. Zhou (eds.), Ed.; Cambridge University Press: Cambridge, 2021; pp. 4–5. [Google Scholar]
- Stocker, T. Climate change 2013: the physical science basis: Working Group I contribution to the Fifth assessment report of the Intergovernmental Panel on Climate Change; Cambridge University Press: 2013.
- Shi, L.; Feng, P.; Wang, B.; Li Liu, D.; Cleverly, J.; Fang, Q.; Yu, Q. Projecting potential evapotranspiration change and quantifying its uncertainty under future climate scenarios: A case study in southeastern Australia. Journal of Hydrology 2020, 584, 124756. [Google Scholar] [CrossRef]
- Eyring, V.; Bony, S.; Meehl, G.A.; Senior, C.A.; Stevens, B.; Stouffer, R.J.; Taylor, K.E. Overview of the Coupled Model Intercomparison Project Phase 6 (CMIP6) experimental design and organization. Geoscientific Model Development 2016, 9, 1937–1958. [Google Scholar] [CrossRef]
- O’Neill, B.; Kriegler, E.; Ebi, K.; Kemp-Benedict, E.; Riahi, K.; Rothman, D.; van Ruijven, B.; Vuuren, D.; Birkmann, J.; Kok, K.; et al. The roads ahead: Narratives for shared socioeconomic pathways describing world futures in the 21st century. Global Environmental Change 2015, 42, 169–180. [Google Scholar] [CrossRef]
- Chen, J.; Brissette, F.P.; Leconte, R. Uncertainty of downscaling method in quantifying the impact of climate change on hydrology. Journal of Hydrology 2011, 401, 190–202. [Google Scholar] [CrossRef]
- Cannon, A.; Sobie, S.; Murdock, T. Bias Correction of GCM Precipitation by Quantile Mapping: How Well Do Methods Preserve Changes in Quantiles and Extremes? Journal of Climate 2015, 28, 150722131126009. [Google Scholar] [CrossRef]
- Cannon, A.J. Multivariate quantile mapping bias correction: an N-dimensional probability density function transform for climate model simulations of multiple variables. Climate Dynamics 2018, 50, 31–49. [Google Scholar] [CrossRef]
- Guo, Q.; Chen, J.; Zhang, X.; Shen, M.; Chen, H.; Guo, S. A new two-stage multivariate quantile mapping method for bias correcting climate model outputs. Climate Dynamics 2019, 53, 3603–3623. [Google Scholar] [CrossRef]
- Bárdossy, A.; Pegram, G.G.S. Copula based multisite model for daily precipitation simulation. Hydrology and Earth System Sciences 2009, 13, 2299–2314. [Google Scholar] [CrossRef]
- Rüschendorf, L. On the distributional transform, Sklar's theorem, and the empirical copula process. Journal of Statistical Planning and Inference 2009, 139, 3921–3927. [Google Scholar] [CrossRef]
- Li, X.; Babovic, V. Multi-site multivariate downscaling of global climate model outputs: an integrated framework combining quantile mapping, stochastic weather generator and Empirical Copula approaches. Climate Dynamics 2019, 52, 5775–5799. [Google Scholar] [CrossRef]
- Li, X.; Babovic, V. A new scheme for multivariate, multisite weather generator with inter-variable, inter-site dependence and inter-annual variability based on empirical copula approach. Climate Dynamics 2019, 52, 2247–2267. [Google Scholar] [CrossRef]
- Fan, X.; Miao, C.; Duan, Q.; Shen, C.; Wu, Y. The Performance of CMIP6 Versus CMIP5 in Simulating Temperature Extremes Over the Global Land Surface. Journal of Geophysical Research: Atmospheres 2020, 125, e2020JD033031. [Google Scholar] [CrossRef]
- Tokarska, K.B.; Stolpe, M.B.; Sippel, S.; Fischer, E.M.; Smith, C.J.; Lehner, F.; Knutti, R. Past warming trend constrains future warming in CMIP6 models. Science advances 2020, 6, eaaz9549. [Google Scholar] [CrossRef] [PubMed]
- Zelinka, M.D.; Myers, T.A.; McCoy, D.T.; Po-Chedley, S.; Caldwell, P.M.; Ceppi, P.; Klein, S.A.; Taylor, K.E. Causes of Higher Climate Sensitivity in CMIP6 Models. Geophysical Research Letters 2020, 47, e2019GL085782. [Google Scholar] [CrossRef]
- Kay, A.L.; Davies, H.N. Calculating potential evaporation from climate model data: A source of uncertainty for hydrological climate change impacts. Journal of Hydrology 2008, 358, 221–239. [Google Scholar] [CrossRef]
- Hargreaves, G.H.; Samani, Z.H. Reference Crop Evapotranspiration from Temperature. Applied Engineering in Agriculture 1985, 1, 96–99. [Google Scholar] [CrossRef]
- DehghaniSanij, H.; Yamamoto, T.; Rasiah, V. Assessment of evapotranspiration estimation models for use in semi-arid environments. Agricultural Water Management 2004, 64, 91–106. [Google Scholar] [CrossRef]
- Lu, J.; Sun, G.; McNulty, S.G.; Amatya, D.M. A COMPARISON OF SIX POTENTIAL EVAPOTRANSPIRATION METHODS FOR REGIONAL USE IN THE SOUTHEASTERN UNITED STATES1. JAWRA Journal of the American Water Resources Association 2005, 41, 621–633. [Google Scholar] [CrossRef]
- Vicente-Serrano, S.M.; Beguería, S.; López-Moreno, J.I. A Multiscalar Drought Index Sensitive to Global Warming: The Standardized Precipitation Evapotranspiration Index. Journal of Climate 2010, 23, 1696–1718. [Google Scholar] [CrossRef]
- Beguería, S.; Vicente-Serrano, S.M.; Reig, F.; Latorre, B. Standardized precipitation evapotranspiration index (SPEI) revisited: parameter fitting, evapotranspiration models, tools, datasets and drought monitoring. International Journal of Climatology 2014, 34, 3001–3023. [Google Scholar] [CrossRef]
- Thompson, J.R.; Green, A.J.; Kingston, D.G. Potential evapotranspiration-related uncertainty in climate change impacts on river flow: An assessment for the Mekong River basin. Journal of Hydrology 2014, 510, 259–279. [Google Scholar] [CrossRef]
- Xu, C.Y.; Singh, V.P. Cross Comparison of Empirical Equations for Calculating Potential Evapotranspiration with Data from Switzerland. Water Resources Management 2002, 16, 197–219. [Google Scholar] [CrossRef]
- Xu, C.Y.; Singh, V.P. Evaluation and generalization of radiation-based methods for calculating evaporation. Hydrological Processes 2000, 14, 339–349. [Google Scholar] [CrossRef]
- Xu, C.Y.; Singh, V.P. Evaluation and generalization of temperature-based methods for calculating evaporation. Hydrological Processes 2001, 15, 305–319. [Google Scholar] [CrossRef]
- Roberts, J.; Snelgrove, K. Uncertainty in Regional Climate Model Mean Runoff Projections under Climate Change: Case Study of Labrador's Churchill River Basin. Atmosphere-Ocean 2015, 53, 1–13. [Google Scholar] [CrossRef]
- Troin, M.; Arsenault, R.; Martel, J.-L.; Brissette, F. Uncertainty of Hydrological Model Components in Climate Change Studies over Two Nordic Quebec Catchments. Journal of Hydrometeorology 2017, 19, 27–46. [Google Scholar] [CrossRef]
- Chegwidden, O.S.; Nijssen, B.; Rupp, D.E.; Arnold, J.R.; Clark, M.P.; Hamman, J.J.; Kao, S.-C.; Mao, Y.; Mizukami, N.; Mote, P.W.; et al. How Do Modeling Decisions Affect the Spread Among Hydrologic Climate Change Projections? Exploring a Large Ensemble of Simulations Across a Diversity of Hydroclimates. Earth's Future 2019, 7, 623–637. [Google Scholar] [CrossRef]
- Fisher, R.A. The correlation between relatives on the supposition of Mendelian inheritance. Earth and Environmental Science Transactions of the Royal Society of Edinburgh 1918, 52, 399–433. [Google Scholar] [CrossRef]
- Hawkins, E.; Sutton, R. The potential to narrow uncertainty in regional climate predictions. Bulletin of the American Meteorological Society 2009, 90, 1095–1108. [Google Scholar] [CrossRef]
- Chen, J.; Brissette, F.; Lucas-Picher, P. Assessing the limits of bias correcting climate model outputs for climate change impact studies. Journal of Geophysical Research: Atmospheres 2015, 120, 1123–1136. [Google Scholar] [CrossRef]
- Hui, Y.; Chen, J.; Xu, C.-Y.; Xiong, L.; Chen, H. Bias nonstationarity of global climate model outputs: The role of internal climate variability and climate model sensitivity. International Journal of Climatology 2019, 39, 2278–2294. [Google Scholar] [CrossRef]
- Matthews, J.B.R. ; V. Möller; R. van Diemen; J.S. Fuglestvedt; V. Masson-Delmotte; C. Méndez; S. Semenov; Reisinger, A.; (eds.). Annex VII: Glossary In Climate Change 2021: The Physical Science Basis. Contribution of Working Group I to the Sixth Assessment Report of the Intergovernmental Panel on Climate Change, 2021. [Google Scholar]
- Wang, W.; Xing, W.; Shao, Q. How large are uncertainties in future projection of reference evapotranspiration through different approaches? Journal of Hydrology 2015, 524, 696–700. [Google Scholar] [CrossRef]
- Bosshard, T.; Carambia, M.; Goergen, K.; Kotlarski, S.; Krahe, P.; Zappa, M.; Schär, C. Quantifying uncertainty sources in an ensemble of hydrological climate-impact projections. Water Resources Research 2013, 49, 1523–1536. [Google Scholar] [CrossRef]
- Wang, H.-M.; Chen, J.; Xu, C.-Y.; Zhang, J.; Chen, H. A Framework to Quantify the Uncertainty Contribution of GCMs Over Multiple Sources in Hydrological Impacts of Climate Change. Earth's Future 2020, 8, e2020EF001602. [Google Scholar] [CrossRef]
- Zhang, S.; Chen, J.; Gu, L. Overall uncertainty of climate change impacts on watershed hydrology in China. International Journal of Climatology 2021, 42, 1–14. [Google Scholar] [CrossRef]
- Kingston, D.G.; Todd, M.C.; Taylor, R.G.; Thompson, J.R.; Arnell, N.W. Uncertainty in the estimation of potential evapotranspiration under climate change. Geophysical Research Letters 2009, 36, 1–6. [Google Scholar] [CrossRef]
Figure 1.
Map of the study area, meteorological grids for the 0.5°×0.5° grid dataset of daily surface temperature in China (V2.0), and meteorological stations for the daily China surface climate dataset (V3.0).
Figure 1.
Map of the study area, meteorological grids for the 0.5°×0.5° grid dataset of daily surface temperature in China (V2.0), and meteorological stations for the daily China surface climate dataset (V3.0).
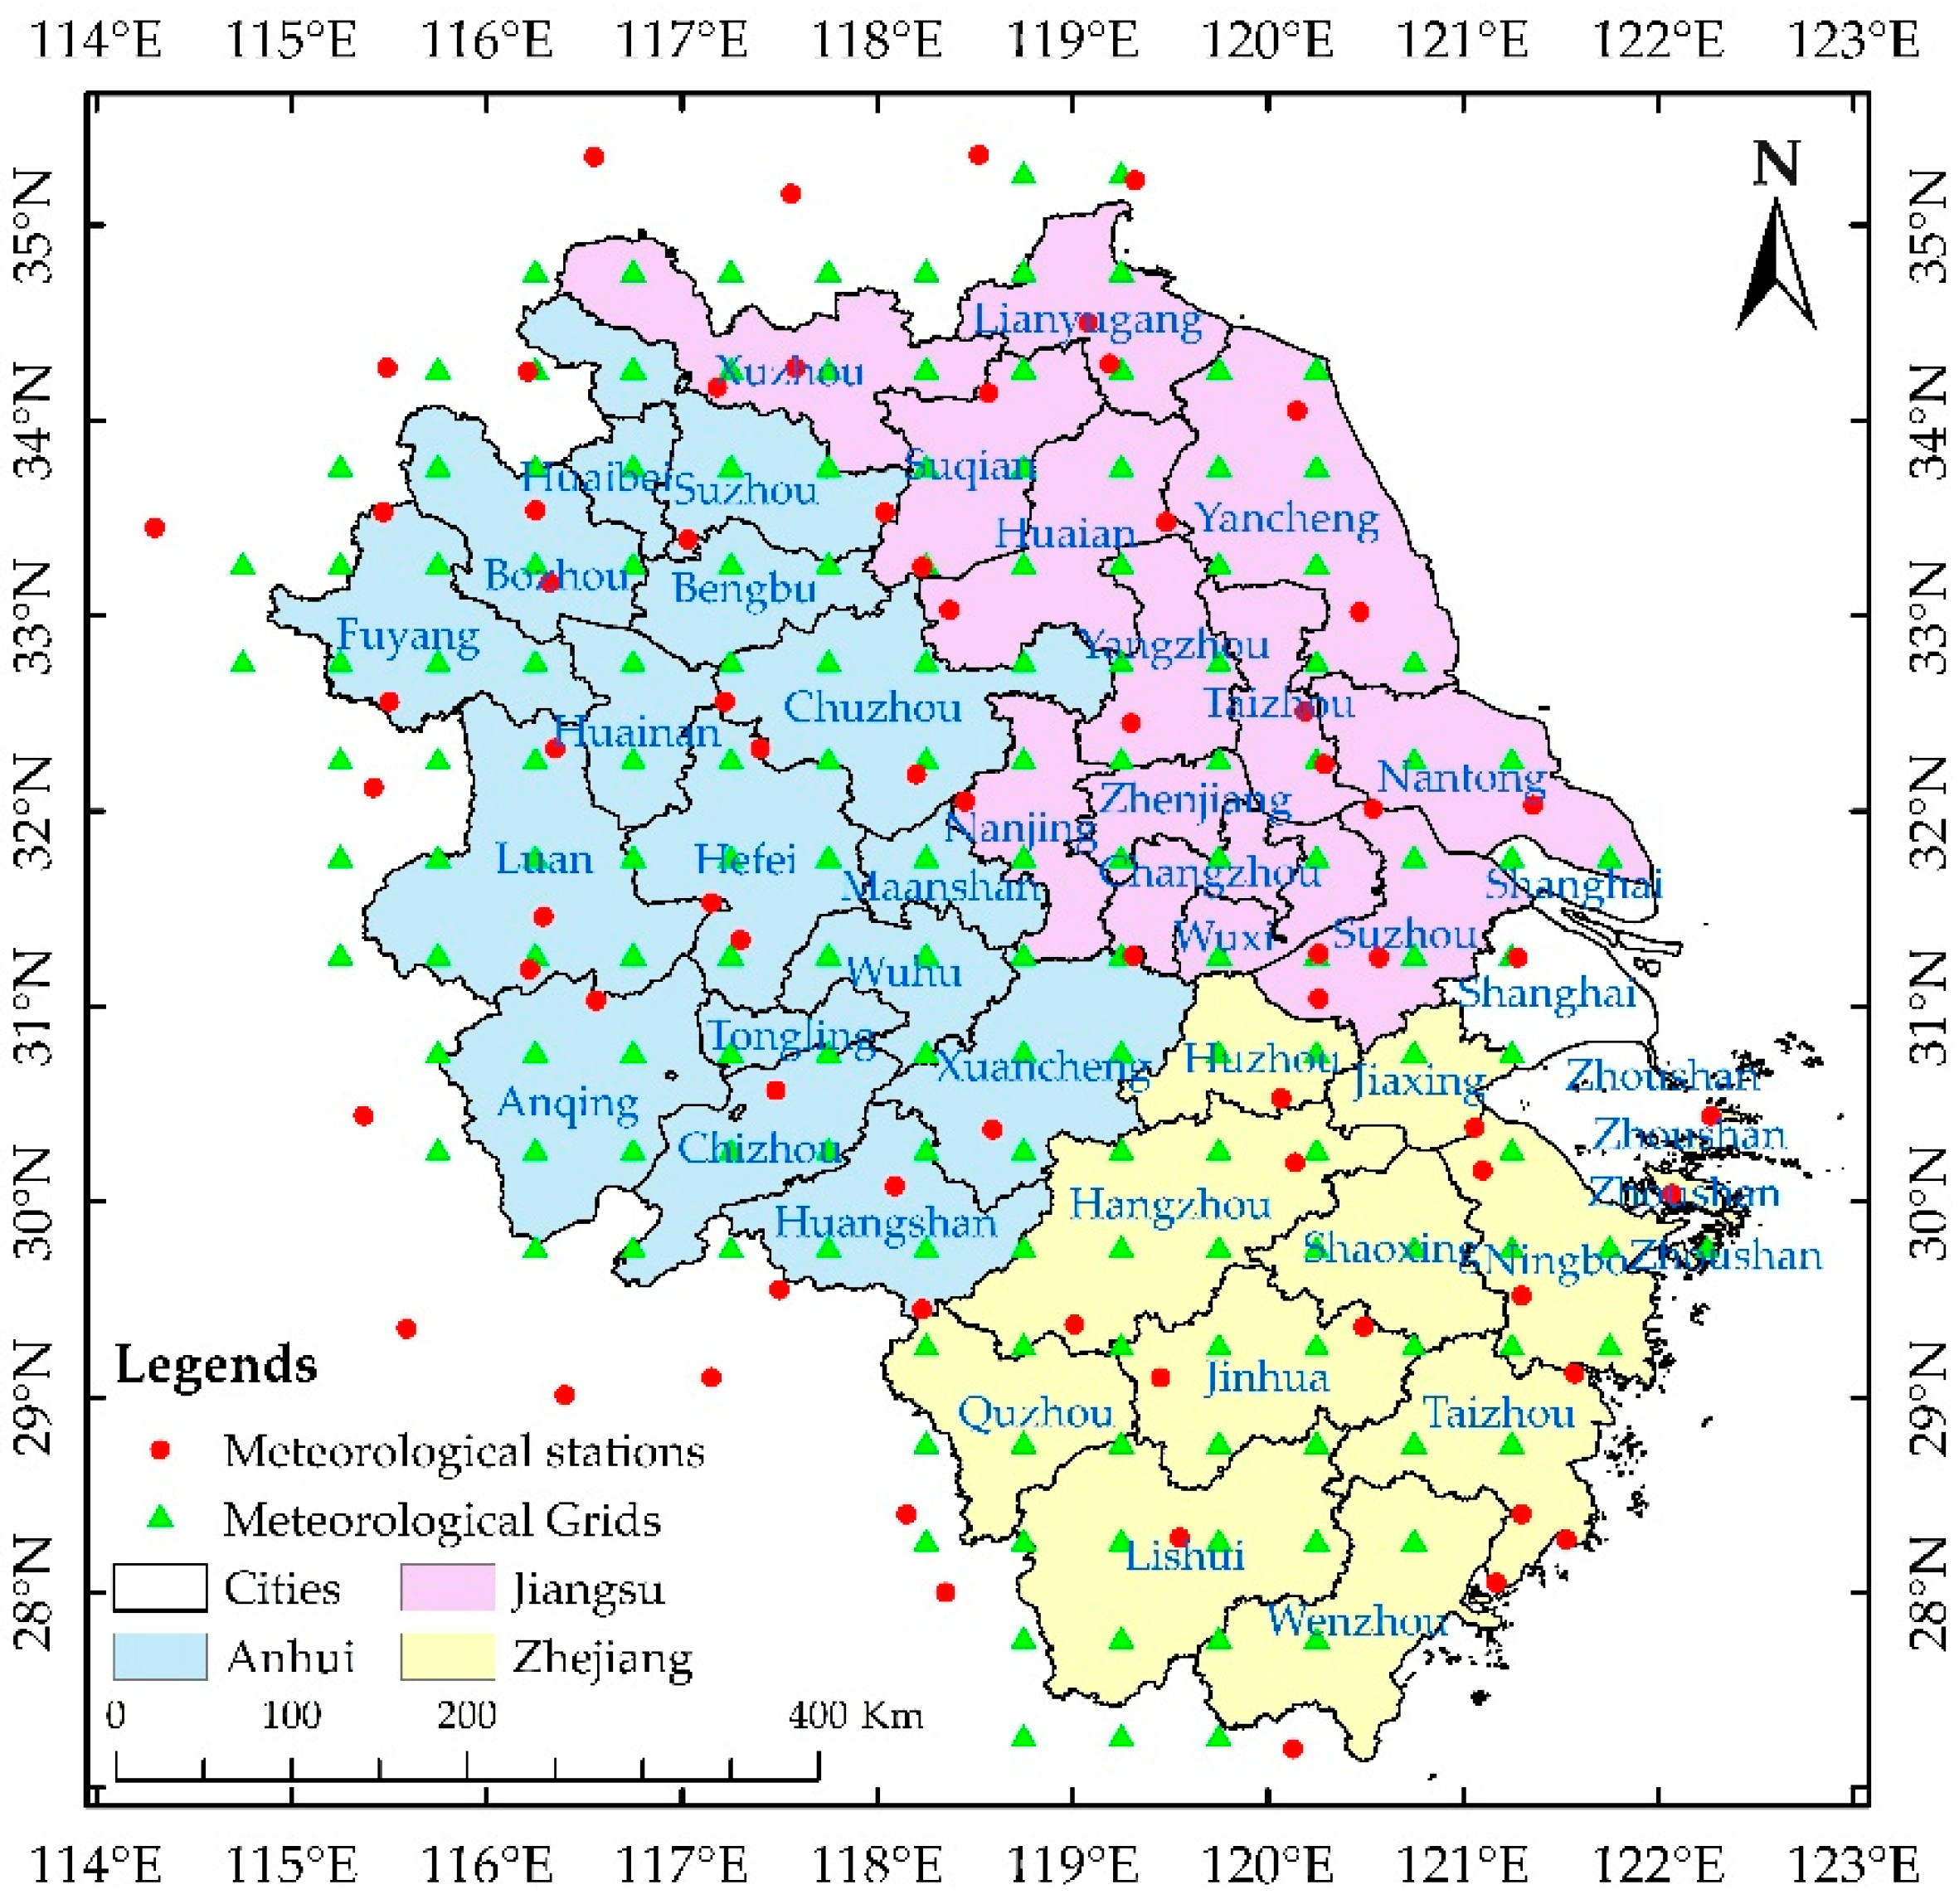
Figure 2.
The across-grid mean inter-annual trends (upper row) and intra-annual distributions (lower row) of the simulated and observed TX and TN anomaly with the mean value in 1971~2000 as the reference (in the two subplots in the lower row, each boxplot represents the probability distribution of the monthly mean values for the 24 GCMs).
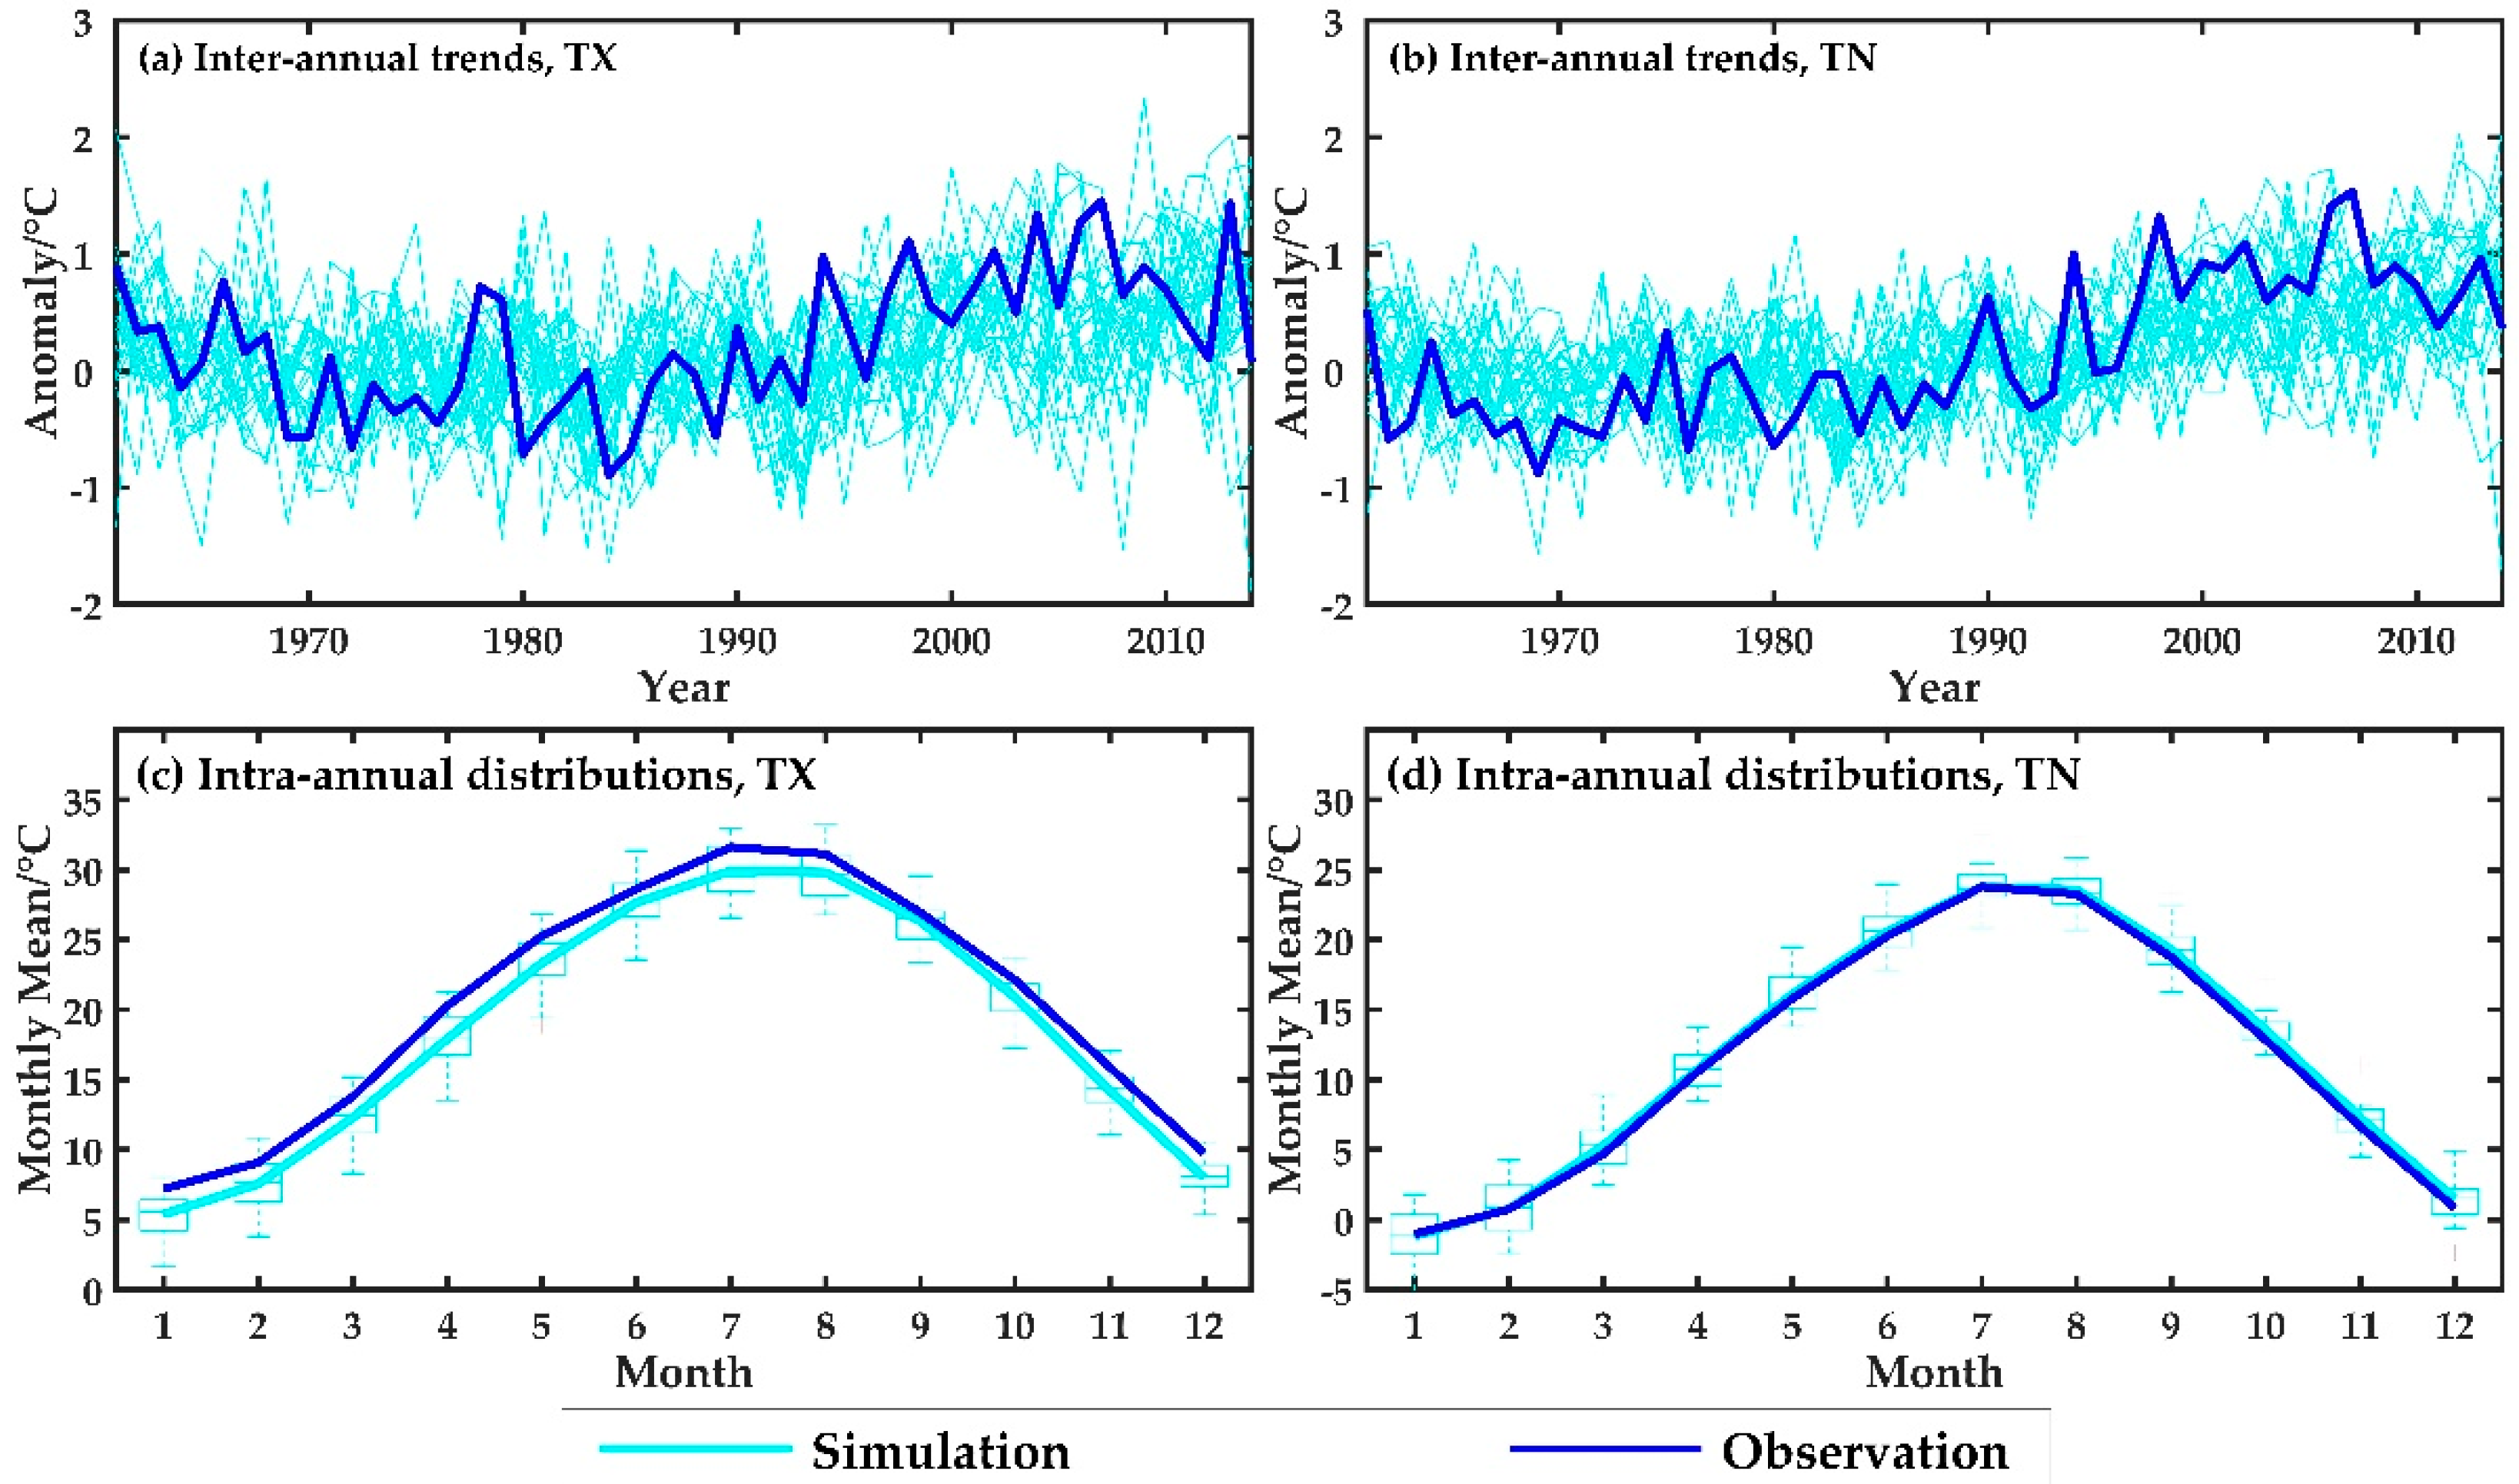
Figure 3.
Performance of the 8 bias correction methods in correcting the biases of GCMs temperature projections (each box chart in this figure represents the across-grid mean indicator of 24 GCMs in a certain period before or after biases correction).
Figure 3.
Performance of the 8 bias correction methods in correcting the biases of GCMs temperature projections (each box chart in this figure represents the across-grid mean indicator of 24 GCMs in a certain period before or after biases correction).
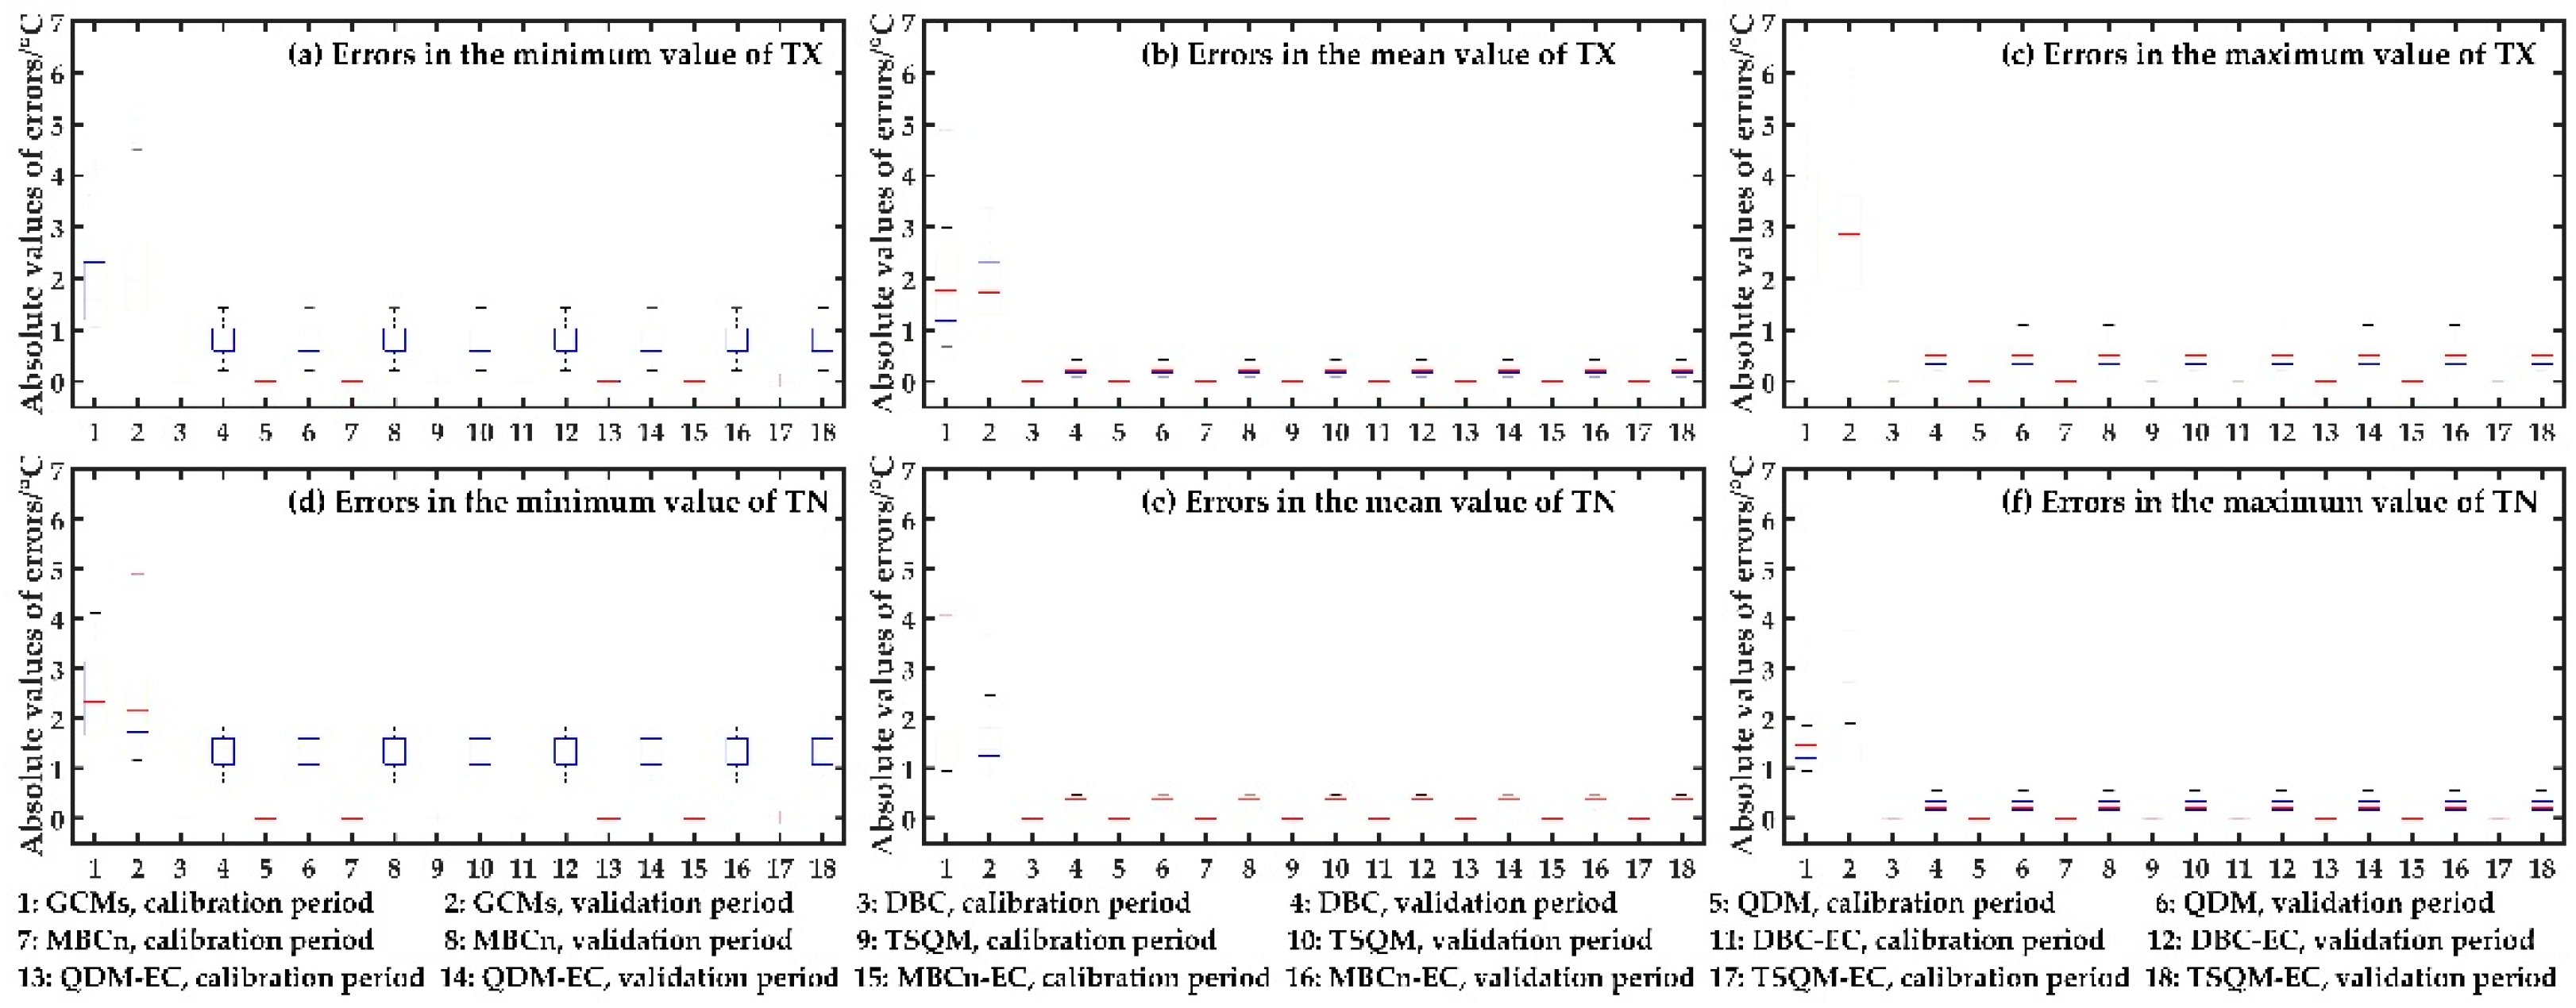
Figure 4.
Spatial distribution of annual mean increases of daily maximum temperature (TX) and daily minimum temperature (TN) during the periods 2021~2050 and 2061~2090 in relative to the period 1971~2000 under three emission scenarios.
Figure 4.
Spatial distribution of annual mean increases of daily maximum temperature (TX) and daily minimum temperature (TN) during the periods 2021~2050 and 2061~2090 in relative to the period 1971~2000 under three emission scenarios.
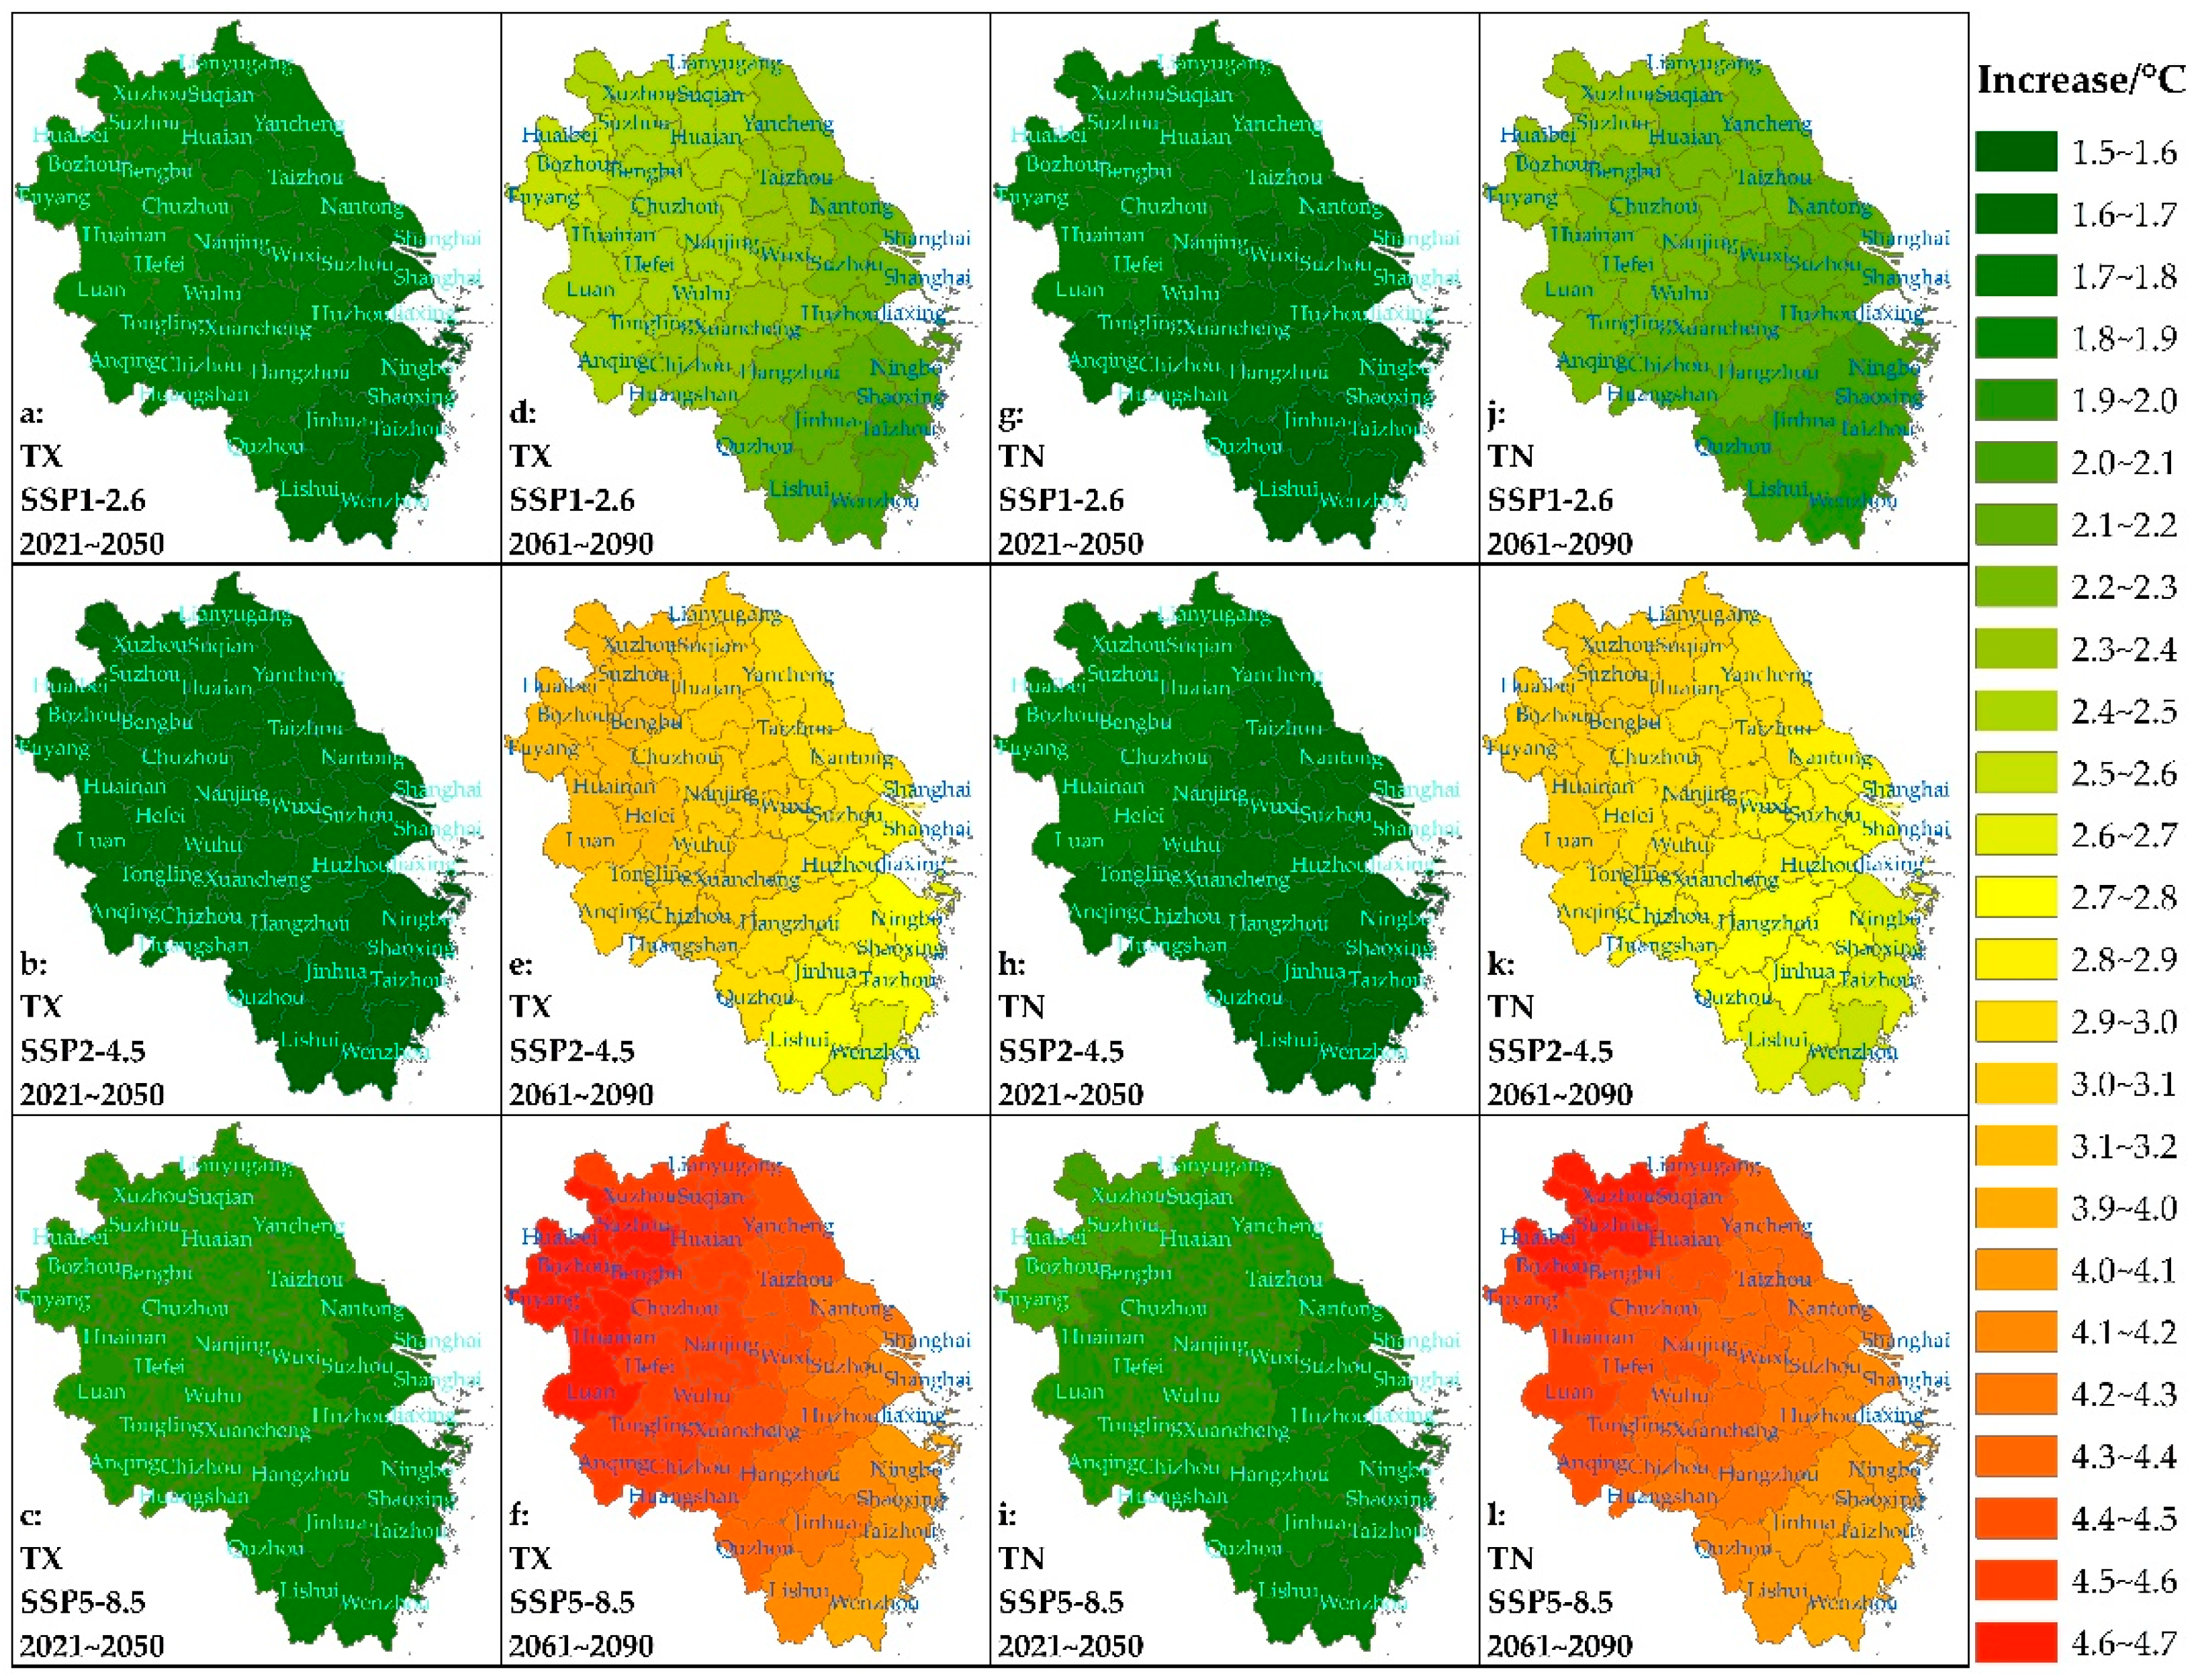
Figure 5.
Spatial distribution of the total uncertainty of annual mean daily maximum temperature (TX) and daily minimum temperature (TN) projections during the periods 2021~2050 and 2061~2090 in relative to the period 1971~2000.
Figure 5.
Spatial distribution of the total uncertainty of annual mean daily maximum temperature (TX) and daily minimum temperature (TN) projections during the periods 2021~2050 and 2061~2090 in relative to the period 1971~2000.
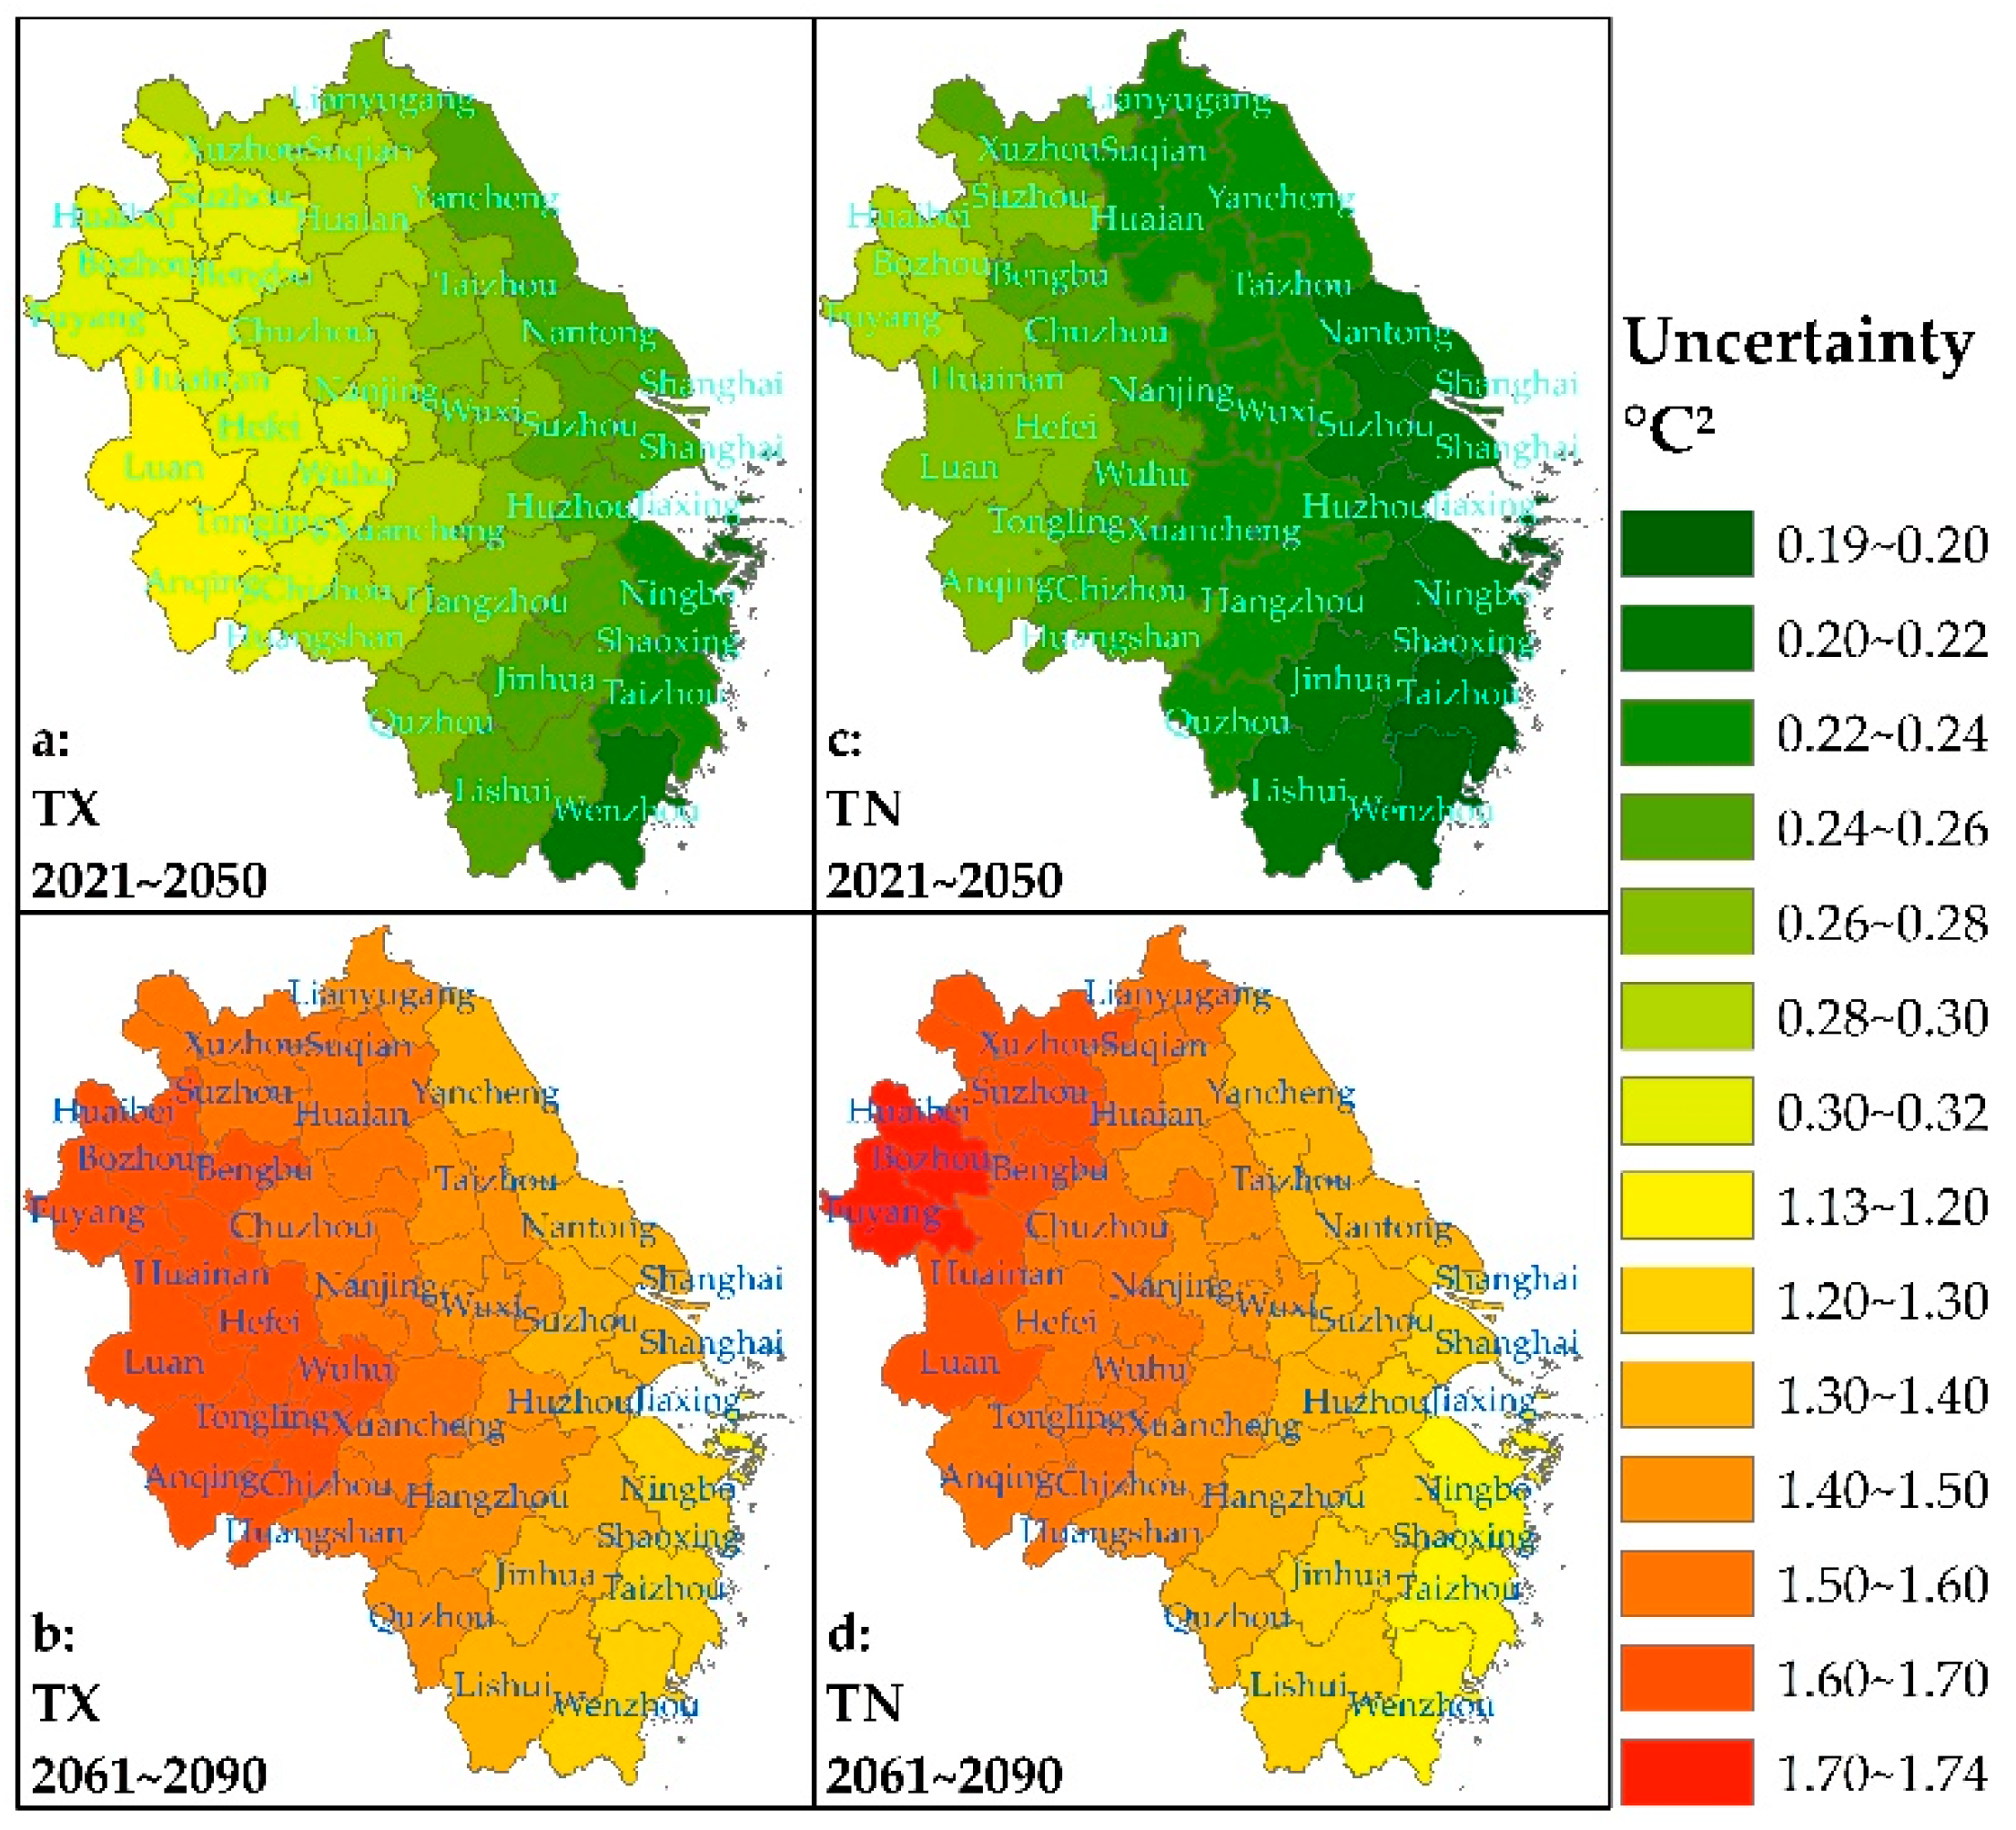
Figure 6.
The spatial distribution of the SNRs in the increase projections of daily maximum temperature (TX) and daily minimum temperature (TN) during the periods 2021~2050 and 2061~2090 in relative to the period 1971~2000.
Figure 6.
The spatial distribution of the SNRs in the increase projections of daily maximum temperature (TX) and daily minimum temperature (TN) during the periods 2021~2050 and 2061~2090 in relative to the period 1971~2000.
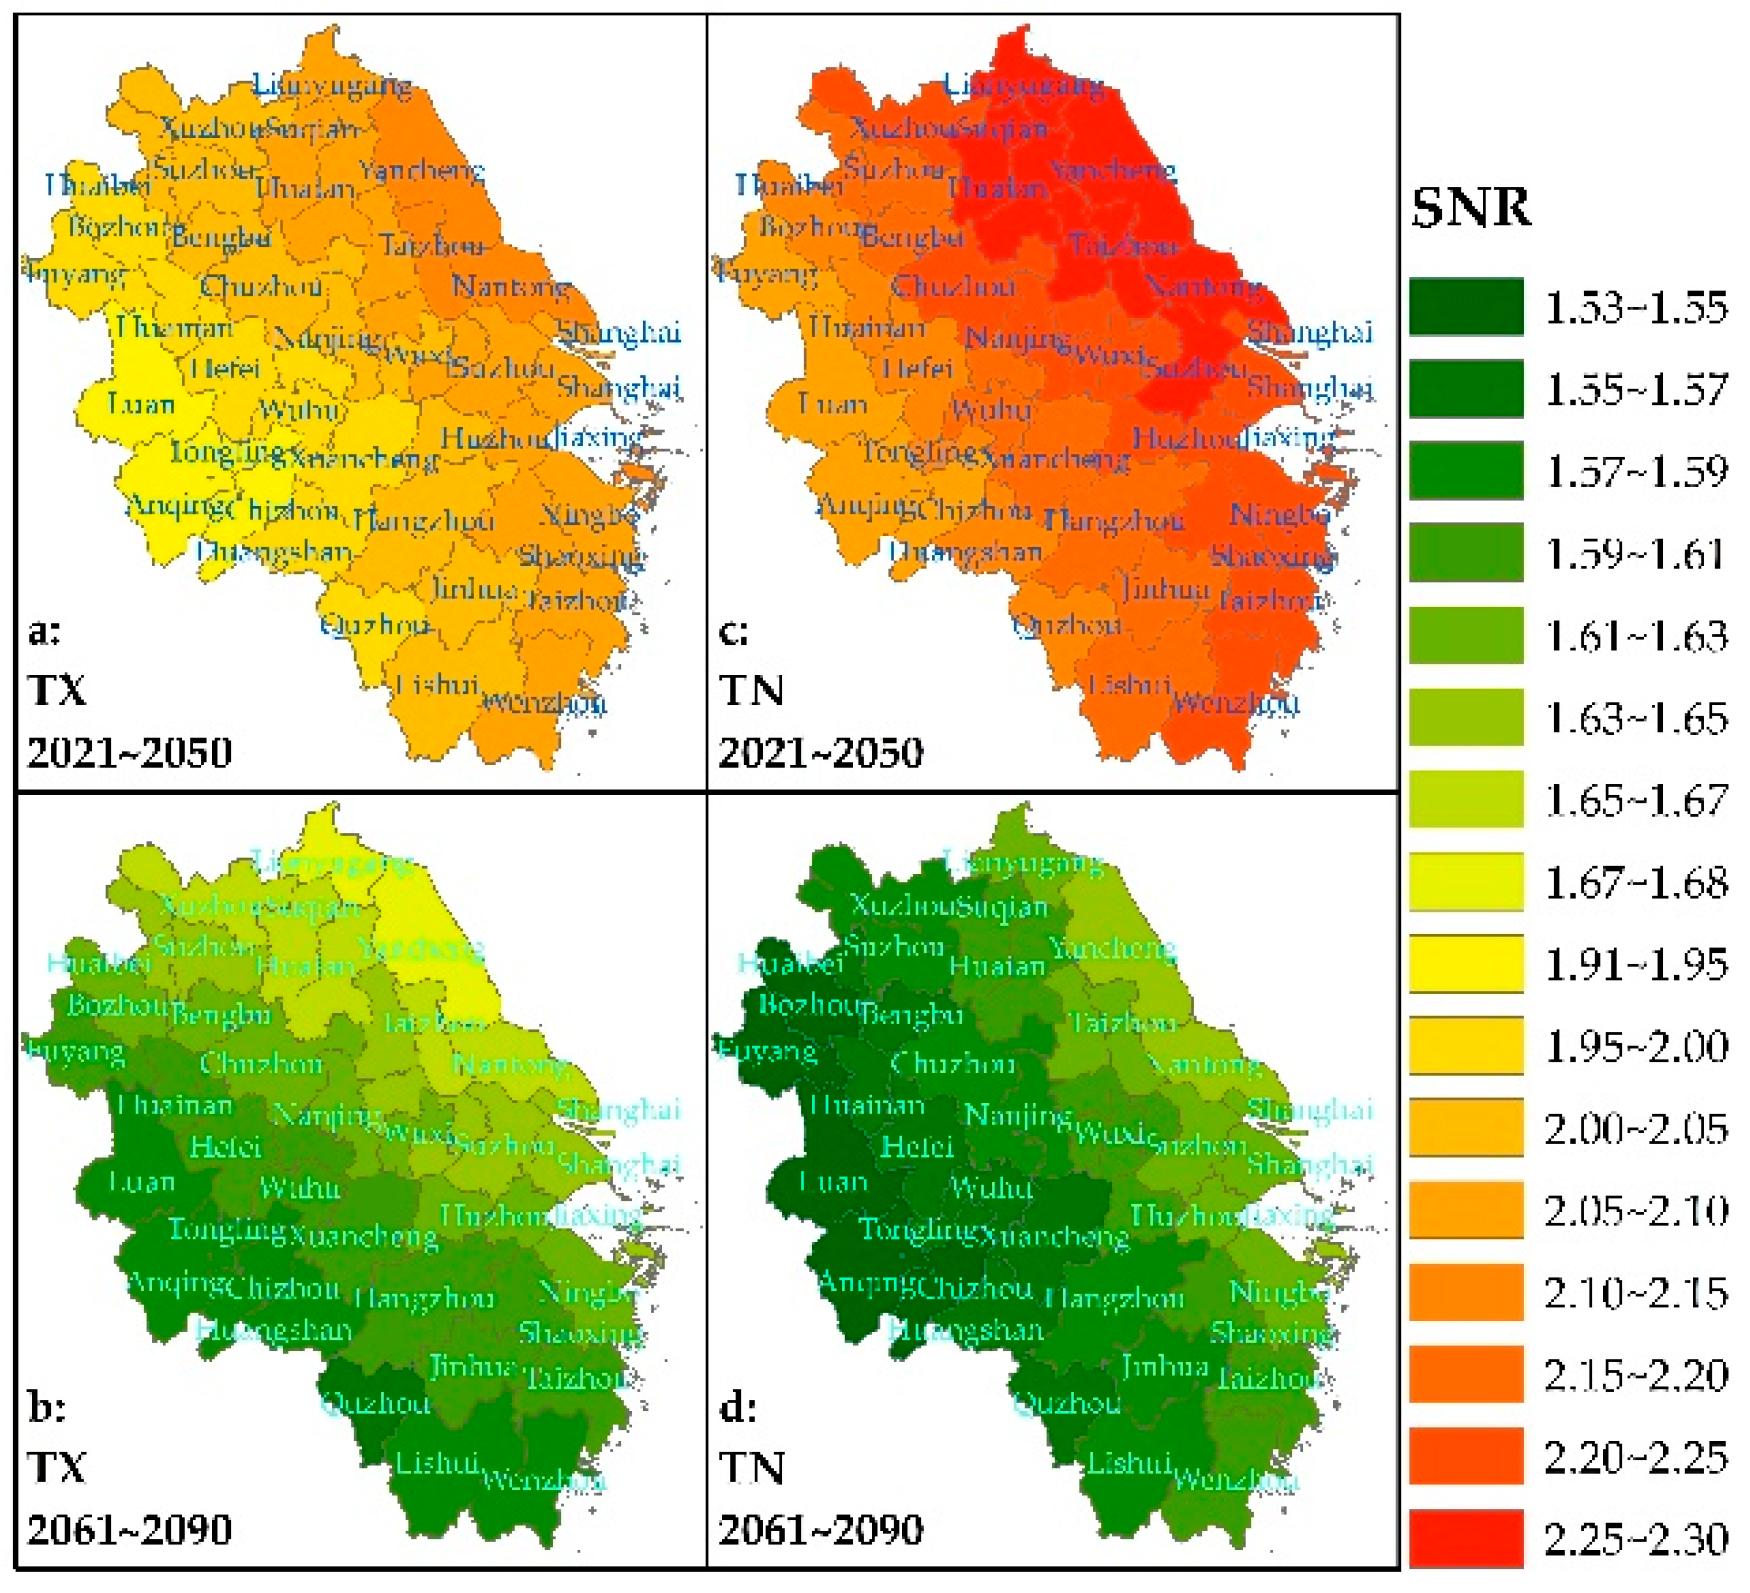
Figure 7.
The across-station mean R2 (a) and ARE (b) during the calibration and validation periods for the four empirical Etp calculation formulas using the default and locally calibrated coefficients.
Figure 7.
The across-station mean R2 (a) and ARE (b) during the calibration and validation periods for the four empirical Etp calculation formulas using the default and locally calibrated coefficients.
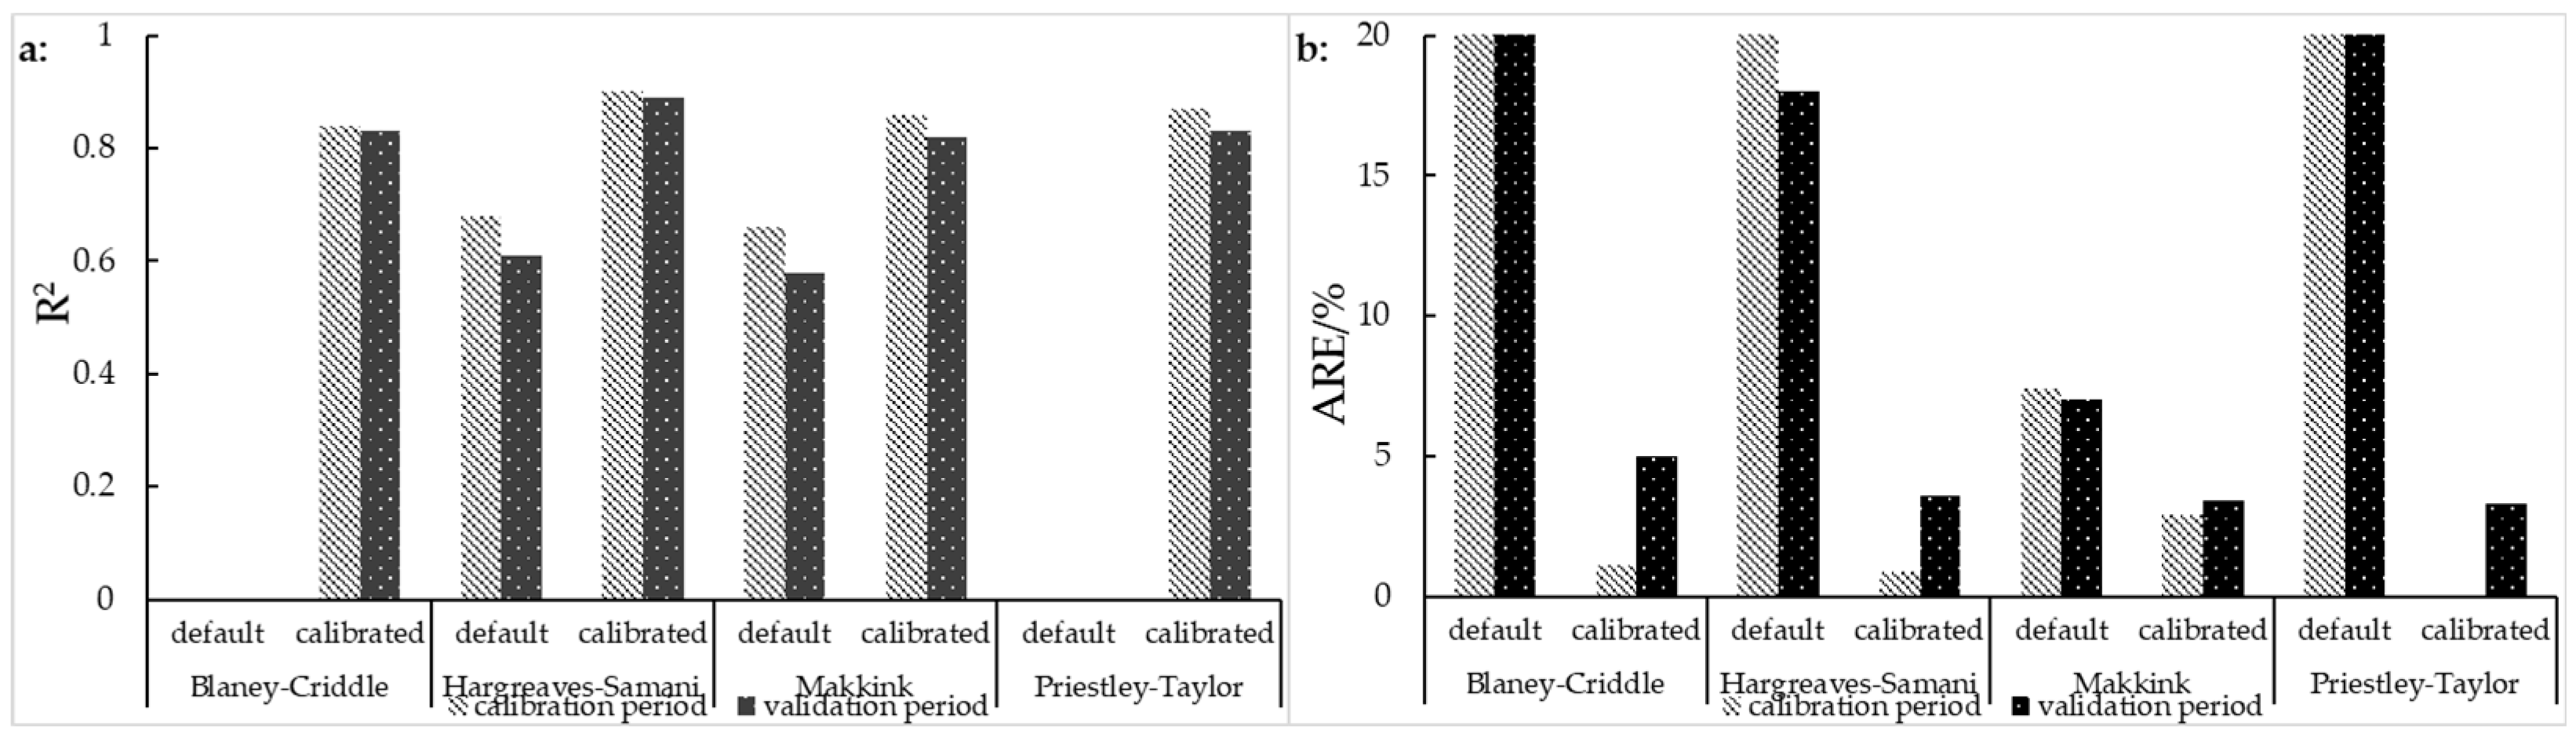
Figure 8.
The across-station mean inter-annual trends (a) and intra-annual distributions (b) of Etp calculated via the four empirical Etp calculation formulas using the locally calibrated coefficients and the Penman-Monteith formula.
Figure 8.
The across-station mean inter-annual trends (a) and intra-annual distributions (b) of Etp calculated via the four empirical Etp calculation formulas using the locally calibrated coefficients and the Penman-Monteith formula.
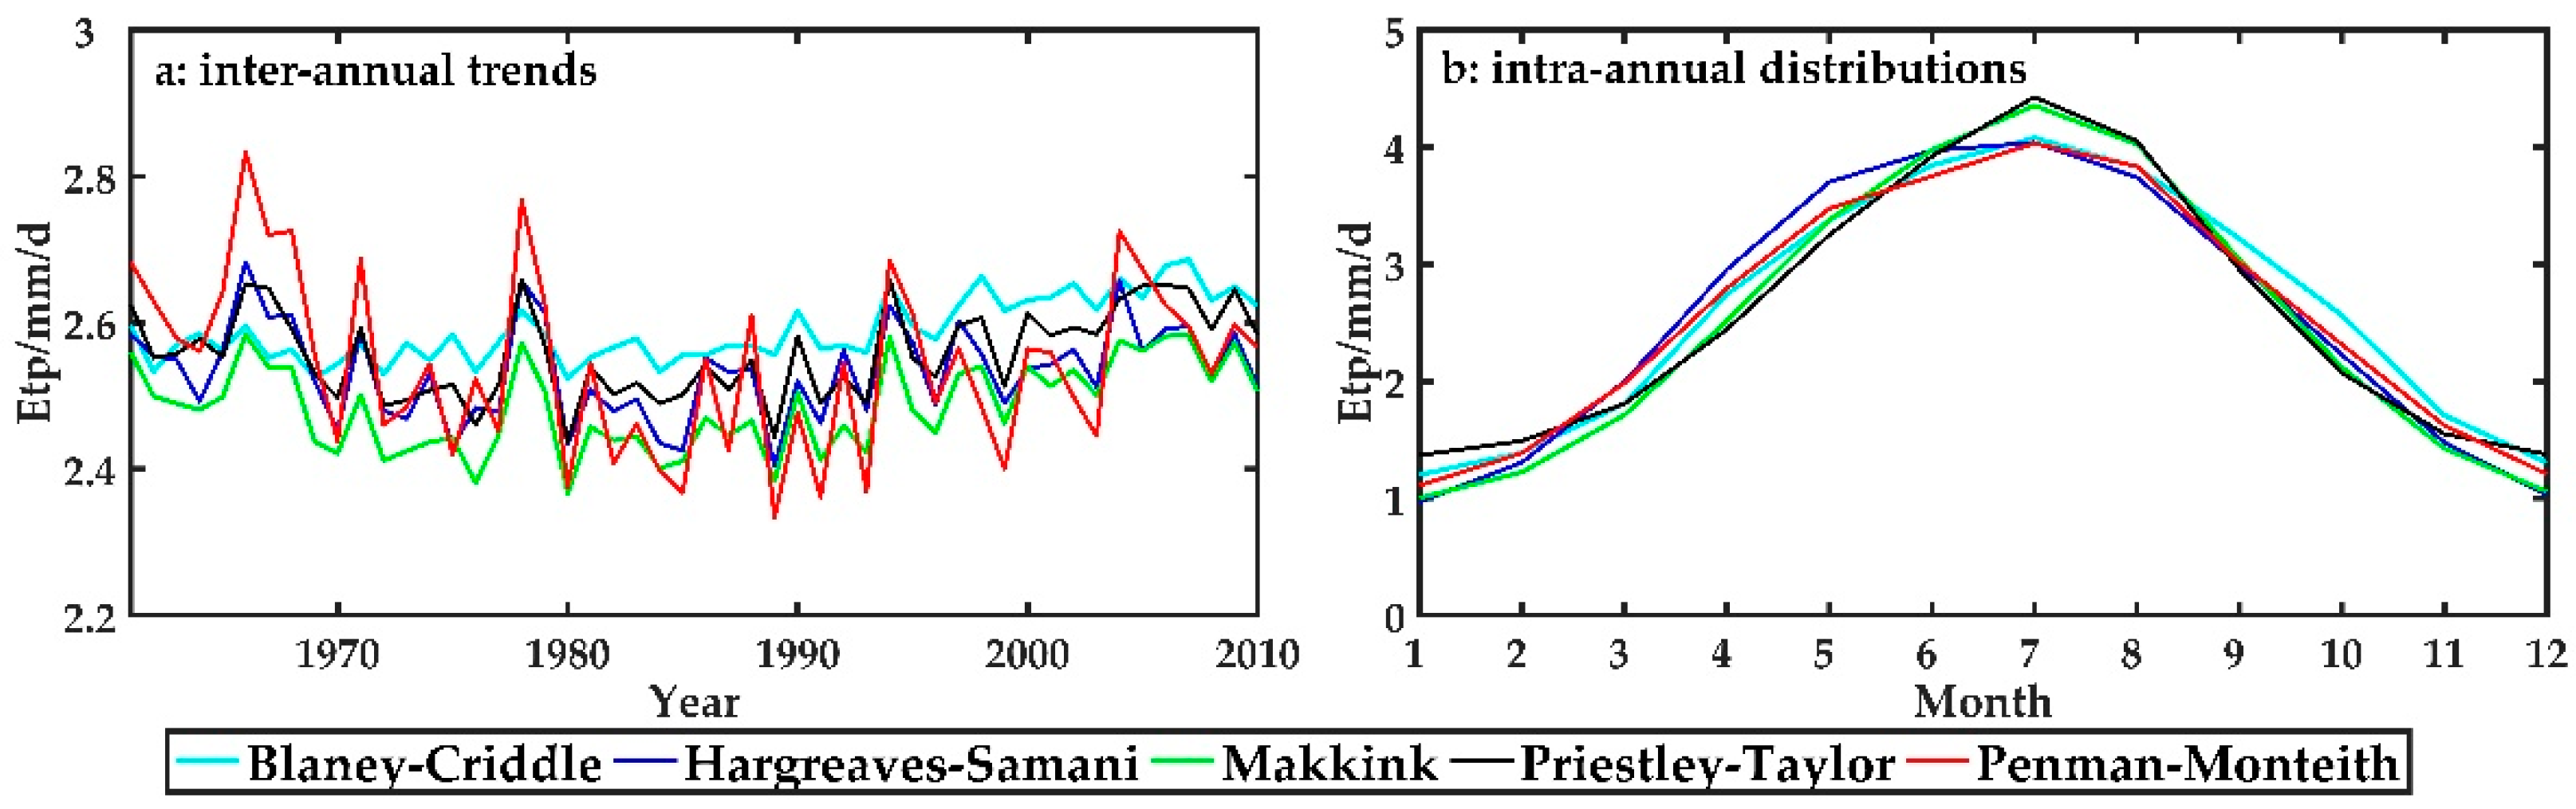
Figure 9.
The spatial distribution of mean increase of Etp across the 24 GCMs, 8 bias correction methods, and 4 Etp calculation formulas during the periods 2021~2050 and 2061~2090 in relative to the period 1971~2000 under three emission scenarios.
Figure 9.
The spatial distribution of mean increase of Etp across the 24 GCMs, 8 bias correction methods, and 4 Etp calculation formulas during the periods 2021~2050 and 2061~2090 in relative to the period 1971~2000 under three emission scenarios.
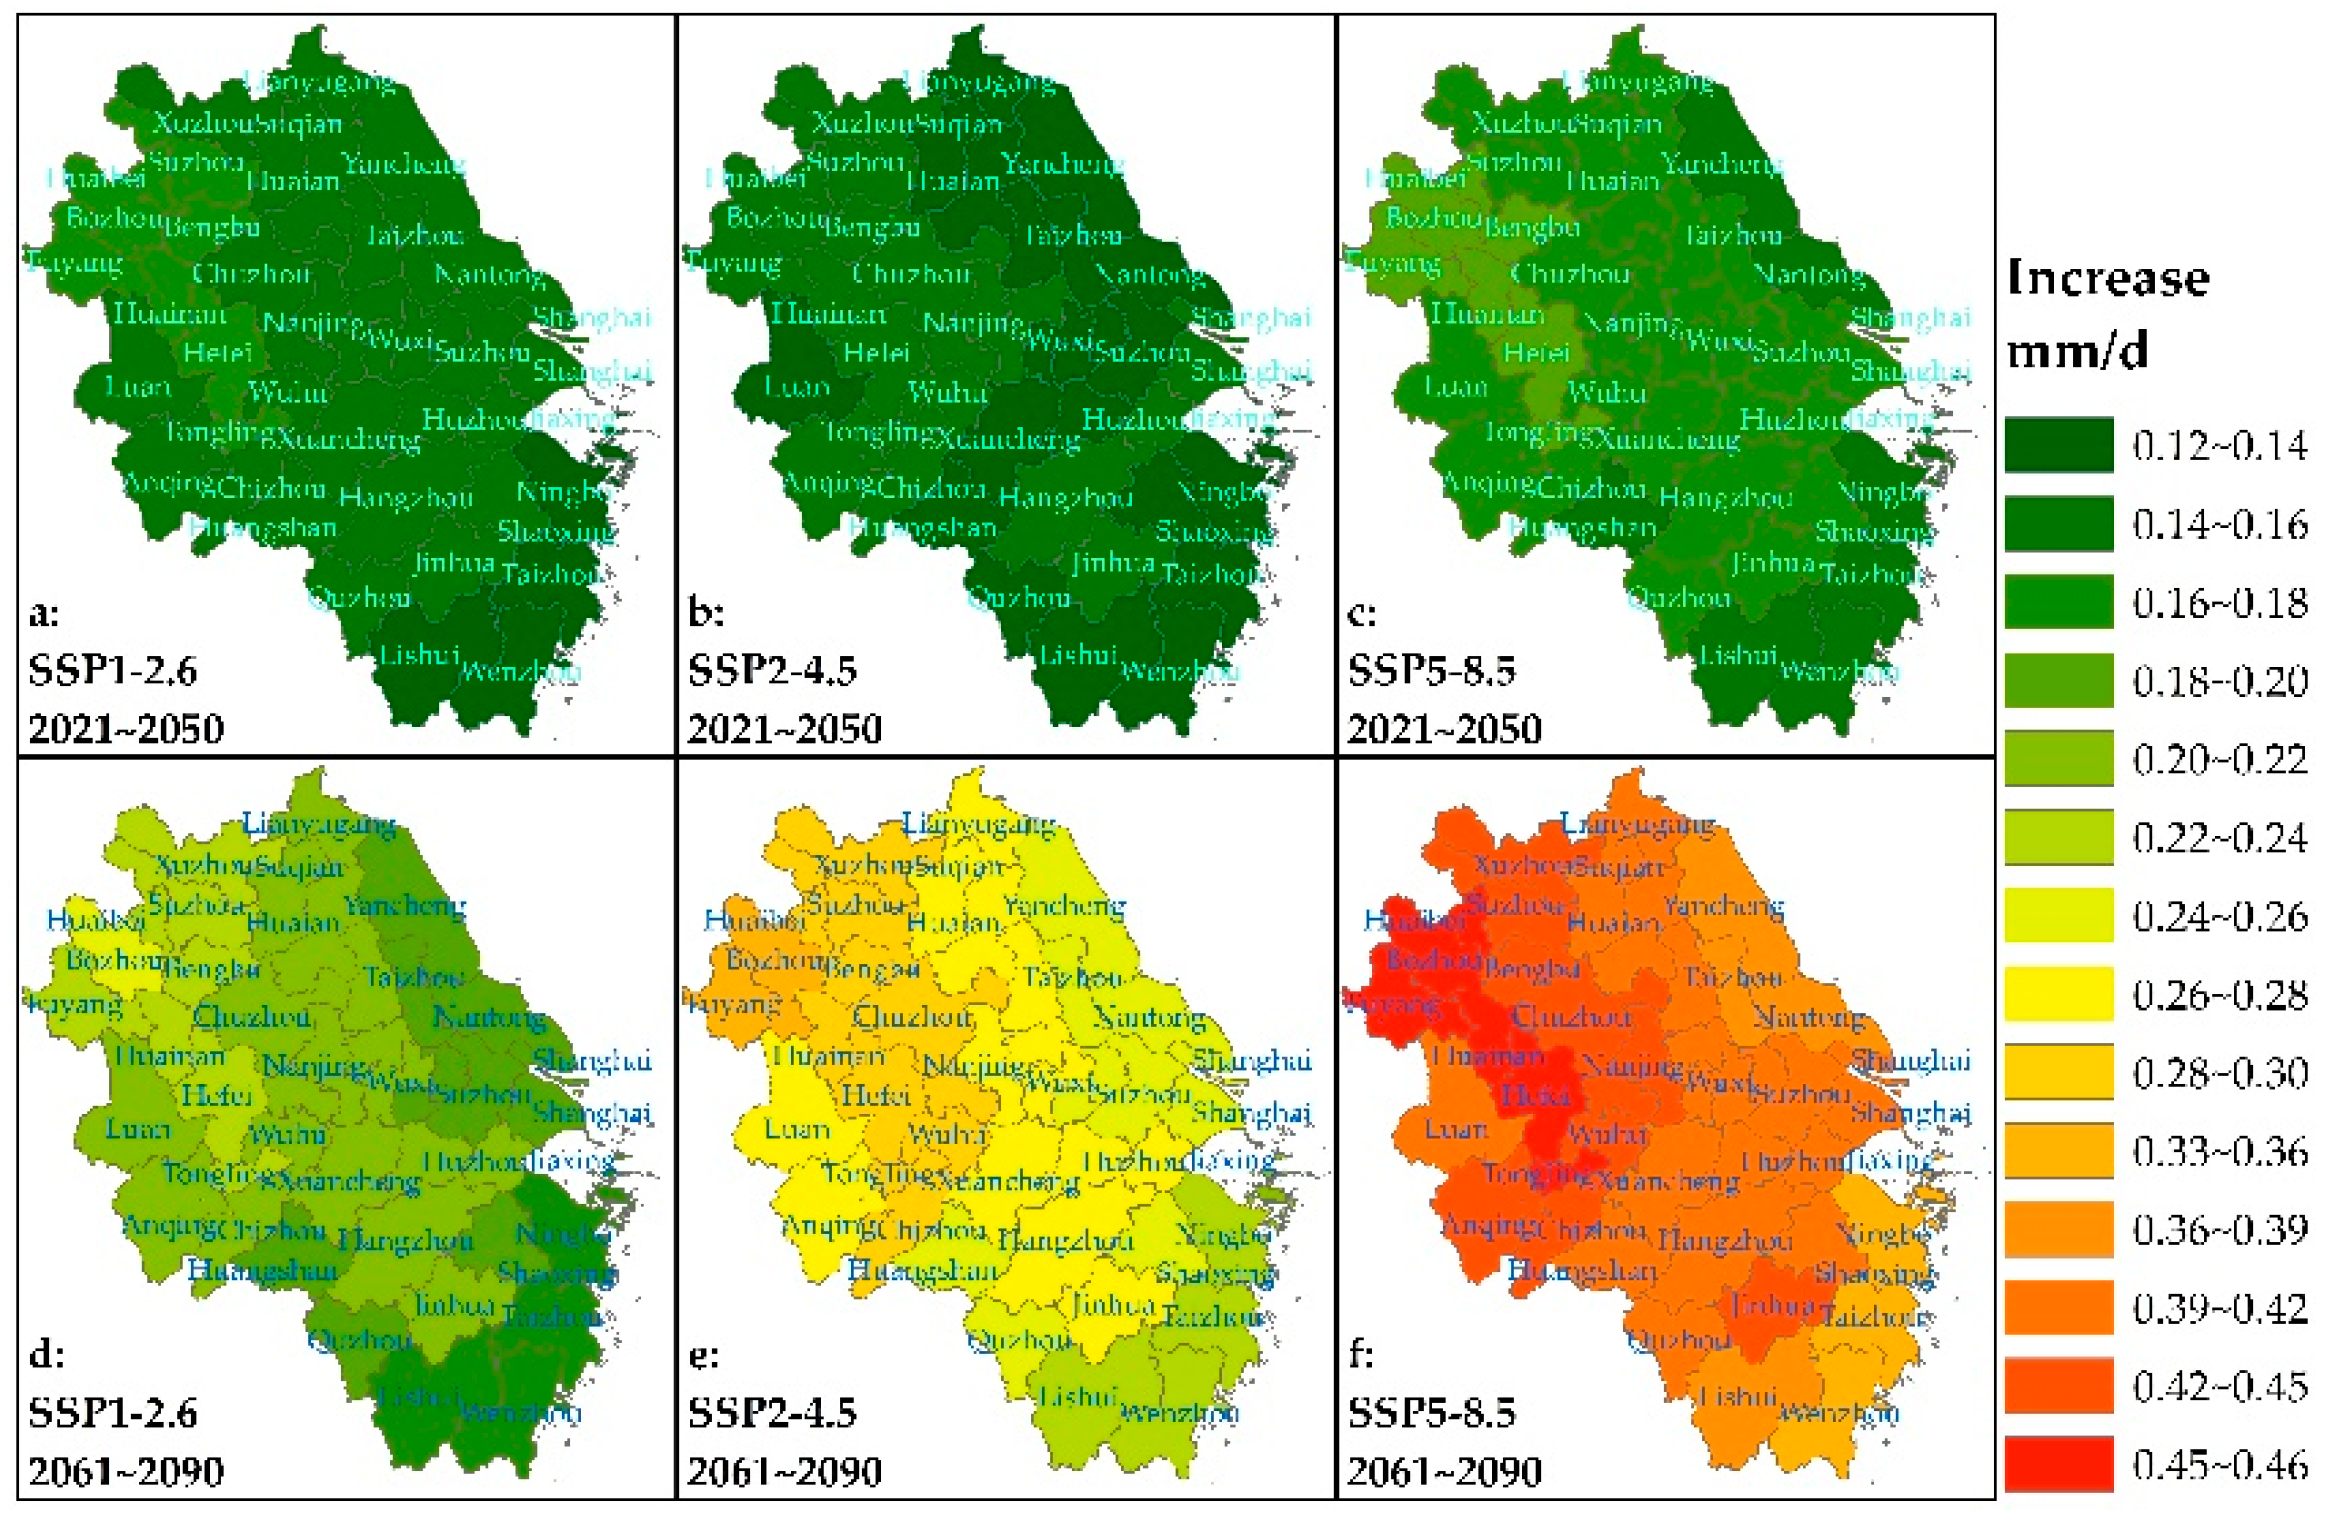
Figure 10.
Spatial distribution of the total uncertainty of daily Etp increase projections during the periods 2021~2050 and 2061~2090 in relative to the period 1971~2000.
Figure 10.
Spatial distribution of the total uncertainty of daily Etp increase projections during the periods 2021~2050 and 2061~2090 in relative to the period 1971~2000.
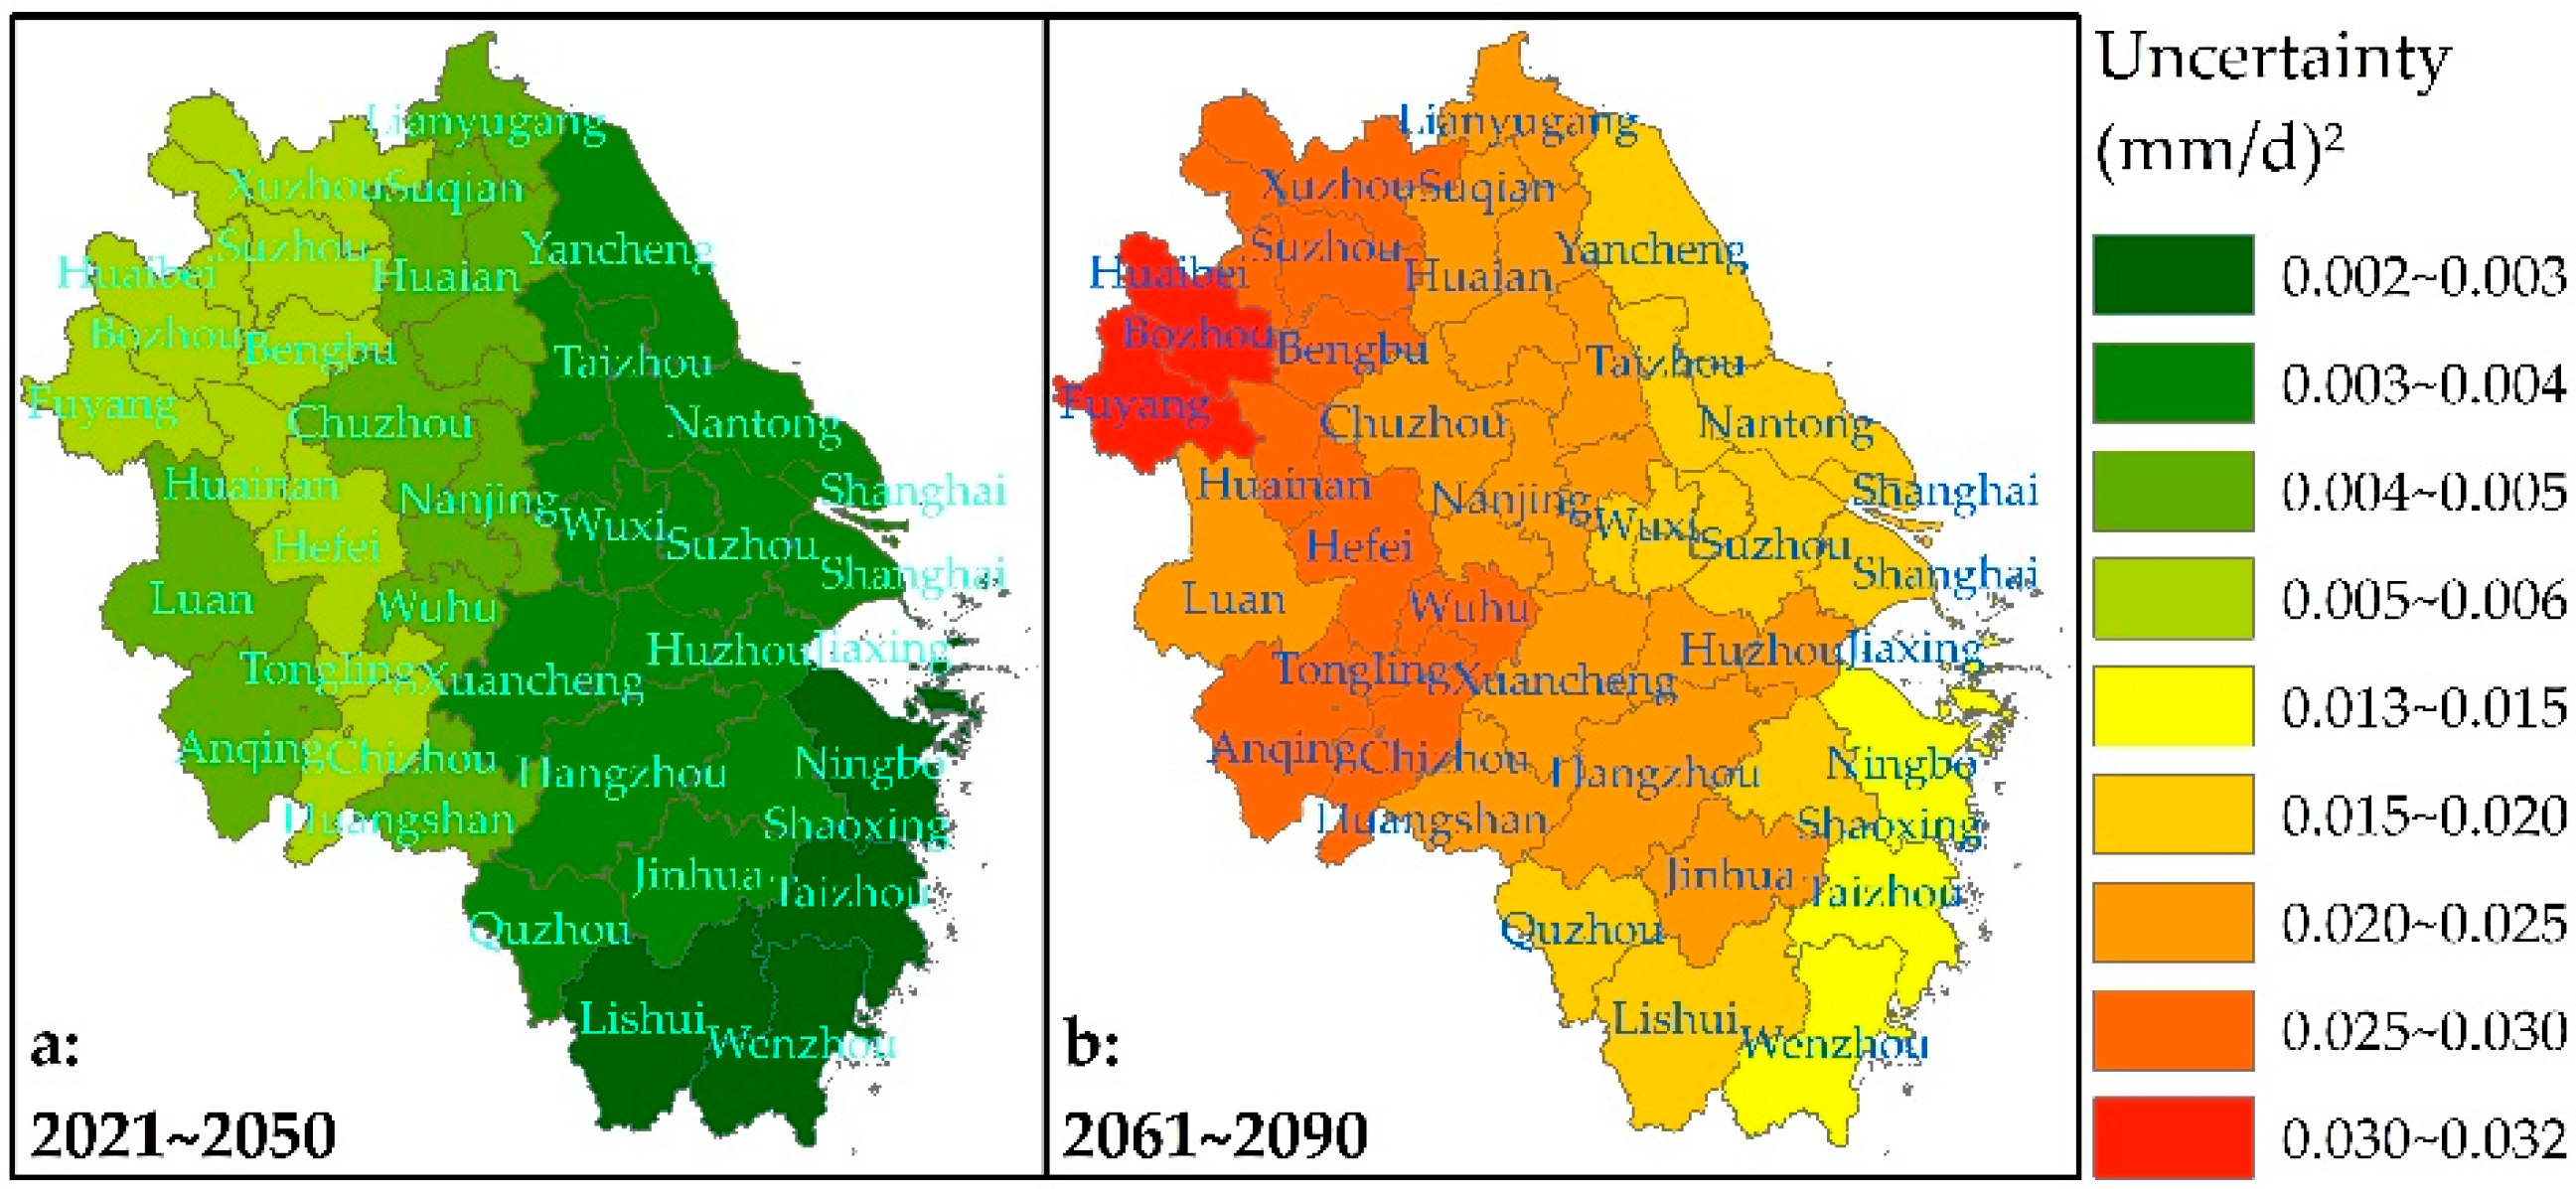
Figure 11.
The spatial distribution of the SNR in the Etp increase projections during the periods 2021~2050 and 2061~2090 in relative to the period 1971~2000.
Figure 11.
The spatial distribution of the SNR in the Etp increase projections during the periods 2021~2050 and 2061~2090 in relative to the period 1971~2000.
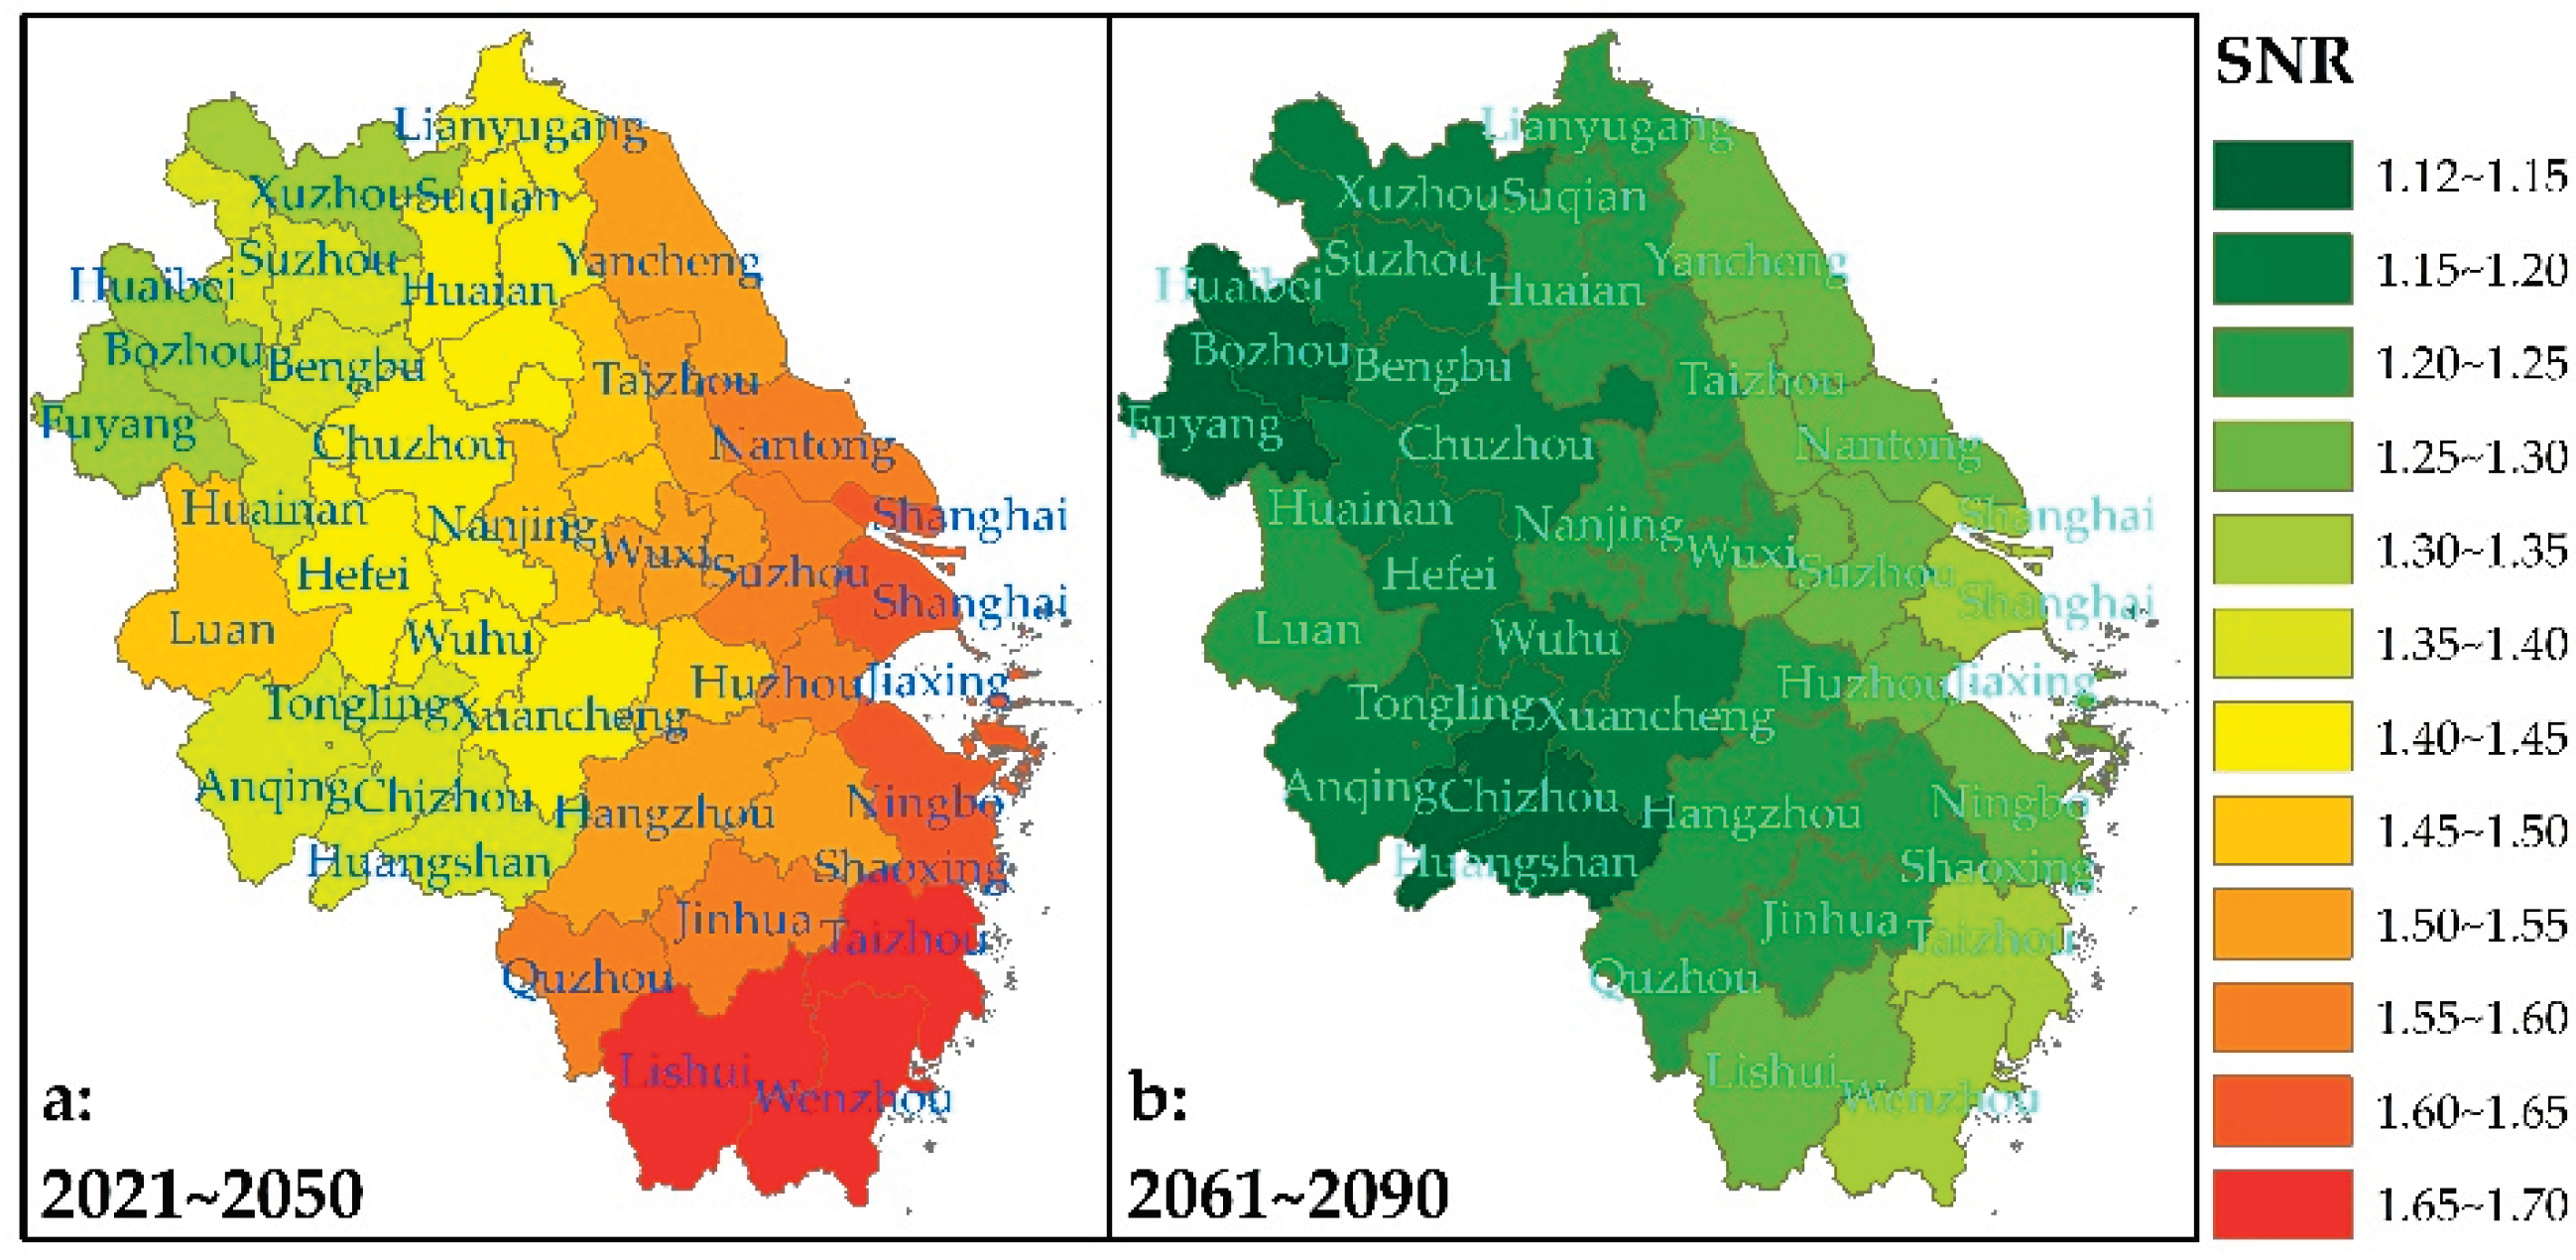

Table 1.
Information of the 24 GCMs in CMIP6 used in this study
| Number | Name | Horizontal resolution | Organization/country (region) |
|---|---|---|---|
| Longitude × Latitude | |||
| 1 | ACCESS-CM2 | 1.8750° × 1.25° | CSIRO-ARCCSS/ Australia |
| 2 | ACCESS-ESM1-5 | 1.8750° × 1.25° | CSIRO/ Australia |
| 3 | BCC-CSM2-MR | 1.125° × 1.1213° | BCC/China |
| 4 | CanESM5 | 2.8125° × 2.7893° | CCCma/Canada |
| 5 | CMCC-CM2-SR5 | 1.25° × 0.9424° | CMCC/ Italy |
| 6 | CNRM-CM6-1 | 1.4063° × 1.4004° | CNRM-CERFACS/ France |
| 7 | CNRM-ESM2-1 | 1.4063° × 1.4004° | CNRM-CERFACS/ France |
| 8 | EC-Earth3 | 0.7031° × 0.7017° | EC-Earth-Consortium/ European Union |
| 9 | EC-Earth3-Veg | 0.7031° × 0.7017° | EC-Earth-Consortium/ European Union |
| 10 | FGOALS-g3 | 2° × 2.2785° | CAS/China |
| 11 | GFDL-ESM4 | 1.25° × 1° | NOAA-GFDL/America |
| 12 | HadGEM3-GC31-LL | 1.8750° × 1.25° | MOHC/England |
| 13 | INM-CM4-8 | 2° × 1.5° | INM/Russia |
| 14 | INM-CM5-0 | 2° × 1.5° | INM/Russia |
| 15 | IPSL-CM6A-LR | 2.5° × 1.2676° | IPSL/France |
| 16 | MIROC6 | 1.4063° × 1.4004° | MIROC/Japan |
| 17 | MIROC-ES2L | 2.8125° × 2.7893° | MIROC/Japan |
| 18 | MPI-ESM1-2-HR | 0.9375° × 0.9349° | MPI-M/ Germany |
| 19 | MPI-ESM1-2-LR | 1.875° × 1.8647° | MPI-M/ Germany |
| 20 | MRI-ESM2-0 | 1.1250° × 1.1213° | MRI/Japan |
| 21 | NESM3 | 1.875° × 1.8647° | NUIST/China |
| 22 | NorESM2-LM | 2.5° × 1.8947° | NCC/ Norway |
| 23 | NorESM2-MM | 1.25° × 0.9424° | NCC/ Norway |
| 24 | UKESM1-0-LL | 1.875° × 1.25° | MOHC/England |
Table 2.
The mean magnitudes of uncertainty components and their relative contributions to the total uncertainty of the increase projections of daily maximum temperature (TX) and daily minimum temperature (TN) in Yangzi River Delta.
Table 2.
The mean magnitudes of uncertainty components and their relative contributions to the total uncertainty of the increase projections of daily maximum temperature (TX) and daily minimum temperature (TN) in Yangzi River Delta.
| Period | 2021~2050 | ||||||
|---|---|---|---|---|---|---|---|
| Effect | S | G | B | SG | SB | GB | SGB |
| TX/Magnitude/°C2 | 0.01 | 0.25 | 0.00 | 0.01 | 0.00 | 0.00 | 0.00 |
| TN/Magnitude/°C2 | 0.01 | 0.21 | 0.00 | 0.01 | 0.00 | 0.00 | 0.00 |
| TX/Relative contribution/% | 4.93 | 90.76 | 0.00 | 4.31 | 0.00 | 0.00 | 0.00 |
| TN/Relative contribution/% | 5.58 | 89.68 | 0.00 | 4.75 | 0.00 | 0.00 | 0.00 |
| Period | 2061~2090 | ||||||
| Effect | S | G | B | SG | SB | GB | SGB |
| TX/Magnitude/°C2 | 0.75 | 0.66 | 0.00 | 0.07 | 0.00 | 0.00 | 0.00 |
| TN/Magnitude/°C2 | 0.79 | 0.60 | 0.00 | 0.05 | 0.00 | 0.00 | 0.00 |
| TX/Relative contribution/% | 50.79 | 44.31 | 0.00 | 4.90 | 0.00 | 0.00 | 0.00 |
| TN/Relative contribution/% | 55.06 | 41.30 | 0.00 | 3.64 | 0.00 | 0.00 | 0.00 |
Note: The meanings of S, G, B, SG, SB, GB, and SGB are consistent with those in Eq. 3.
Table 3.
The mean magnitudes of uncertainty components and their relative contributions to the total uncertainty of the increase projections of the inter-annual mean daily Etp in Yangzi River Delta.
Table 3.
The mean magnitudes of uncertainty components and their relative contributions to the total uncertainty of the increase projections of the inter-annual mean daily Etp in Yangzi River Delta.
| Type | Period | S | G | B | E | SG | SB | SE | GB |
|---|---|---|---|---|---|---|---|---|---|
| Magnitude/(mm/d)2 | 2021~2050 | 0.0001 | 0.0025 | 0.0000 | 0.0010 | 0.0001 | 0.0000 | 0.0000 | 0.0000 |
| 2061~2090 | 0.0071 | 0.0077 | 0.0000 | 0.0042 | 0.0011 | 0.0000 | 0.0006 | 0.0000 | |
| Relative contribution/% | 2021~2050 | 3.24 | 62.54 | 0.05 | 24.24 | 2.86 | 0.00 | 0.37 | 0.08 |
| 2061~2090 | 33.76 | 35.59 | 0.04 | 18.26 | 4.76 | 0.01 | 2.81 | 0.03 | |
| Type | Period | GE | BE | SGB | SGE | SBE | GBE | SGBE | |
| Magnitude/(mm/d)2 | 2021~2050 | 0.0002 | 0.0000 | 0.0000 | 0.0000 | 0.0000 | 0.0000 | 0.0000 | |
| 2061~2090 | 0.0009 | 0.0000 | 0.0000 | 0.0002 | 0.0000 | 0.0000 | 0.0000 | ||
| Relative contribution/% | 2021~2050 | 5.93 | 0.05 | 0.02 | 0.51 | 0.00 | 0.09 | 0.02 | |
| 2061~2090 | 3.93 | 0.04 | 0.01 | 0.70 | 0.00 | 0.05 | 0.01 |
Note: The meanings of S, G, B, SG, SB, GB, and SGB are consistent with those in Eq. 3. E is the uncertainty component resulting from the main effect of Etp calculation formula. SE is the uncertainty component resulting from the interaction effect between emission scenario and Etp calculation formula. GE is the uncertainty component resulting from the interaction effect between GCM and Etp calculation formula. SGE is the uncertainty component resulting from the interaction effect among emission scenario, GCM, and Etp calculation formula. SBE is the uncertainty component resulting from the interaction effect among emission scenario, bias correction method, and Etp calculation formula. GBE is the uncertainty component resulting from the interaction effect among GCM, bias correction method, and Etp calculation formula. SGBE is the uncertainty component resulting from the interaction effect among emission scenario, GCM, bias correction method, and Etp calculation formula.
Disclaimer/Publisher’s Note: The statements, opinions and data contained in all publications are solely those of the individual author(s) and contributor(s) and not of MDPI and/or the editor(s). MDPI and/or the editor(s) disclaim responsibility for any injury to people or property resulting from any ideas, methods, instructions or products referred to in the content. |
© 2024 by the authors. Licensee MDPI, Basel, Switzerland. This article is an open access article distributed under the terms and conditions of the Creative Commons Attribution (CC BY) license (http://creativecommons.org/licenses/by/4.0/).
Copyright: This open access article is published under a Creative Commons CC BY 4.0 license, which permit the free download, distribution, and reuse, provided that the author and preprint are cited in any reuse.


