

Submitted:
06 March 2023
Posted:
06 March 2023
You are already at the latest version
Abstract
This paper presents an analysis of future precipitation patterns over the Lake Victoria Basin using bias-corrected CMIP6 model projections. A mean increase of about 5% in mean annual (ANN) and seasonal [March-May (MAM), June-August (JJA), and October-December (OND)] precipitation climatology is expected over the domain by mid-century (2040-2069). The changes intensify towards the end of the century (2070-2099) with an increase in mean precipitation of about 16% (ANN), 10% (MAM), and 18% (OND) expected, relative to the 1985-2014 baseline period. Additionally, the mean daily precipitation intensity (SDII), the maximum 5-day precipitation values (RX5Day), and the heavy precipitation events, represented by the width of the right tail distribution of precipitation (99p-90p) show an increase of 16%, 29%, and 47%, respectively, by the end of the century. The projected changes have a substantial implication for the region - which is already experiencing conflicts over water and water-related resources.
Keywords:
CMIP6
; ScenarioMIP
; Lake Victoria
; climate change
; SSP585
; extreme weather
1.Introduction
During late 2019 and early 2020, unprecedented high lake water-levels were observed in Lake Victoria, resulting in massive flooding in the lake-adjacent areas1. The high-water-levels re-ignited the scientific debate on the impacts of a changing climate on Lake Victoria’s water budget. Indeed, the impacts of a changing climate in East Africa2,3 on the biodiversity of the Lake Victoria Basin (LVB) are already being observed at multiple biological levels ranging from genes to biomes. Some of these impacts include enhanced spatio-temporal precipitation variability, a reduction in biodiversity (including fish), periodical lake water-level and quality fluctuations, and dwindling crop yields and emergence of crop diseases in the lake-adjacent farming areas4,5. Given that the lake’s fishes, and biodiversity in general, are significantly sensitive and vulnerable to climate change, adequate monitoring and appropriate conservation action are required to minimize the impacts of climate change on the lake’s biodiversity.
Some work has been done towards understanding precipitation patterns and associated water-level fluctuations over Lake Victoria and its basin. For instance, the lake is notorious with intense lightning and convective storms6 and its severe weather and water currents have been linked to boat accidents causing approximately 5000 deaths on the lake annually7,8. However, the understanding of weather and climate dynamics in the LVB remains limited due to, in part, the inability of current climate models to adequately resolve weather and climate dynamics over Lake Victoria9–11. This paper complements earlier works by using bias-corrected model data from the sixth phase of the Coupled Model Intercomparison Project (CMIP6)12 to generate the most realistic estimates of future precipitation patterns over the study domain.
2. Results
2.1. Validation of CMIP6 Historical Simulations over LVB
A plot of precipitation climatology over the study domain (Figure 1, top panel) shows MAM to be the wettest season followed by OND. Relatively more precipitation is recorded on Lake Victoria than the onshore areas, with the western part of the lake showing a wetter regime than the rest of the lake during MAM and OND seasons. A similar pattern is recorded for the OND season, except with lower precipitation values than those of the MAM season. The JJA season is relatively dry with most of the domain recording less than 50 mm/month of precipitation. During this season, the southern part of the domain is drier than the northern part, with precipitation values over parts of western Kenya (north-east of the study domain) exceeding 150 mm/month. Annually (ANN), most of the study domain records at least 100 mm/month with areas over the lake and western Kenya recording the highest values. The highest mean precipitation values (up to 300 mm/month) are recorded in the MAM season while the least values (less than 50 mm/month) are recorded in JJA.
A plot of the precipitation climatology over the study domain showed no discernible differences between the three reference datasets (Supplementary Information, Fig. S 1). MSWEP and CHIRPS data showed similar results with GPCC showing marginally wetter conditions. Hence, MSWEP was chosen as the reference dataset for the model validation part of the study. Here, models generally showed a dry bias relative to MSWEP data with biases ranging roughly between -50 and 50 mm/month for most of the models (Figure 1, mid panel; Supplementary Information, Fig. S 1 to Fig. S 5). The greatest biases (below-100 mm/month) were recorded over the western part of Lake Victoria (around 0.5o South and 32.3o East). However, the biases recorded for most models were insignificant (at 99% confidence level) over most of the domain. Further, an ensemble mean for the top-five models with the least biases showed a better performance than an ensemble mean of all the 17 models used in the study. The top five models (CMCC, CNRM, GFDL, MPI_LR, and NorESM2_LM) were selected for featuring among the top performers per category (Supplementary Information, Figures S 1 – S 5).
Apart from KACE, all other models reproduced the study domain’s annual cycles in concert with the reference datasets (Figure 1, bottom panel). Notably, our results show a departure from the traditional rainy seasons; extending the MAM season to include February and May (with a peak in April), and the OND season to begin in September with a peak in November. This observation points to a potential influence of Lake Victoria which tends to have a different climatology than its neighbouring areas13–15.
Generally, the bias-corrected CMIP6 model data used in the current study could reproduce the study domain’s climatology with good skill. The observed minimal biases were expected due to our study domain’s strong local climate systems and mesoscale convective systems9,16. Additionally, the skill of the current climate models is limited by the current understanding of the climate system coupled with limitations in computational technology10.
2.2. Analysis of Future Precipitation Patterns over the Lake Victoria Basin
An analysis of future precipitation patterns over the study domain shows a general increase in mean precipitation for all the seasons considered (Figure 2, top and mid panels). Most of the domain records significant changes in precipitation with more changes likely to occur over Lake Victoria and its surroundings than the rest of the study domain. More changes are shown for the end of the century compared to the mid-century period, for all the seasons. All the models agree on the change signal for ANN (Supplementary Information, Fig. S 6) while 88% of the models agree on the signal (wet) for OND (Supplementary Information, Fig. S 9). A lower model agreement (70%) is seen for the MAM season compared to ANN and OND while JJA records a 52% model agreement (Supplementary Information, Fig. S 8).
A look at the precipitation patterns averaged over the study domain (Figure 2, bottom panel) showed a general increase in precipitation for ANN, MAM, and OND. In the 2050s (MID), precipitation over the study domain would increase by about 5% for ANN, MAM, JJA, and OND, relative to the baseline period (CTL). More changes would be expected by the end of the century for ANN (16%), MAM (10%), and OND (18%), respectively. No discernible changes are recorded for JJA.
Figure 3.
As in Figure 2 but for SDII, Rx5day, and 99p-90p. SDII and 99p-90p are in mm/day while Rx5day is in mm.
Figure 3.
As in Figure 2 but for SDII, Rx5day, and 99p-90p. SDII and 99p-90p are in mm/day while Rx5day is in mm.
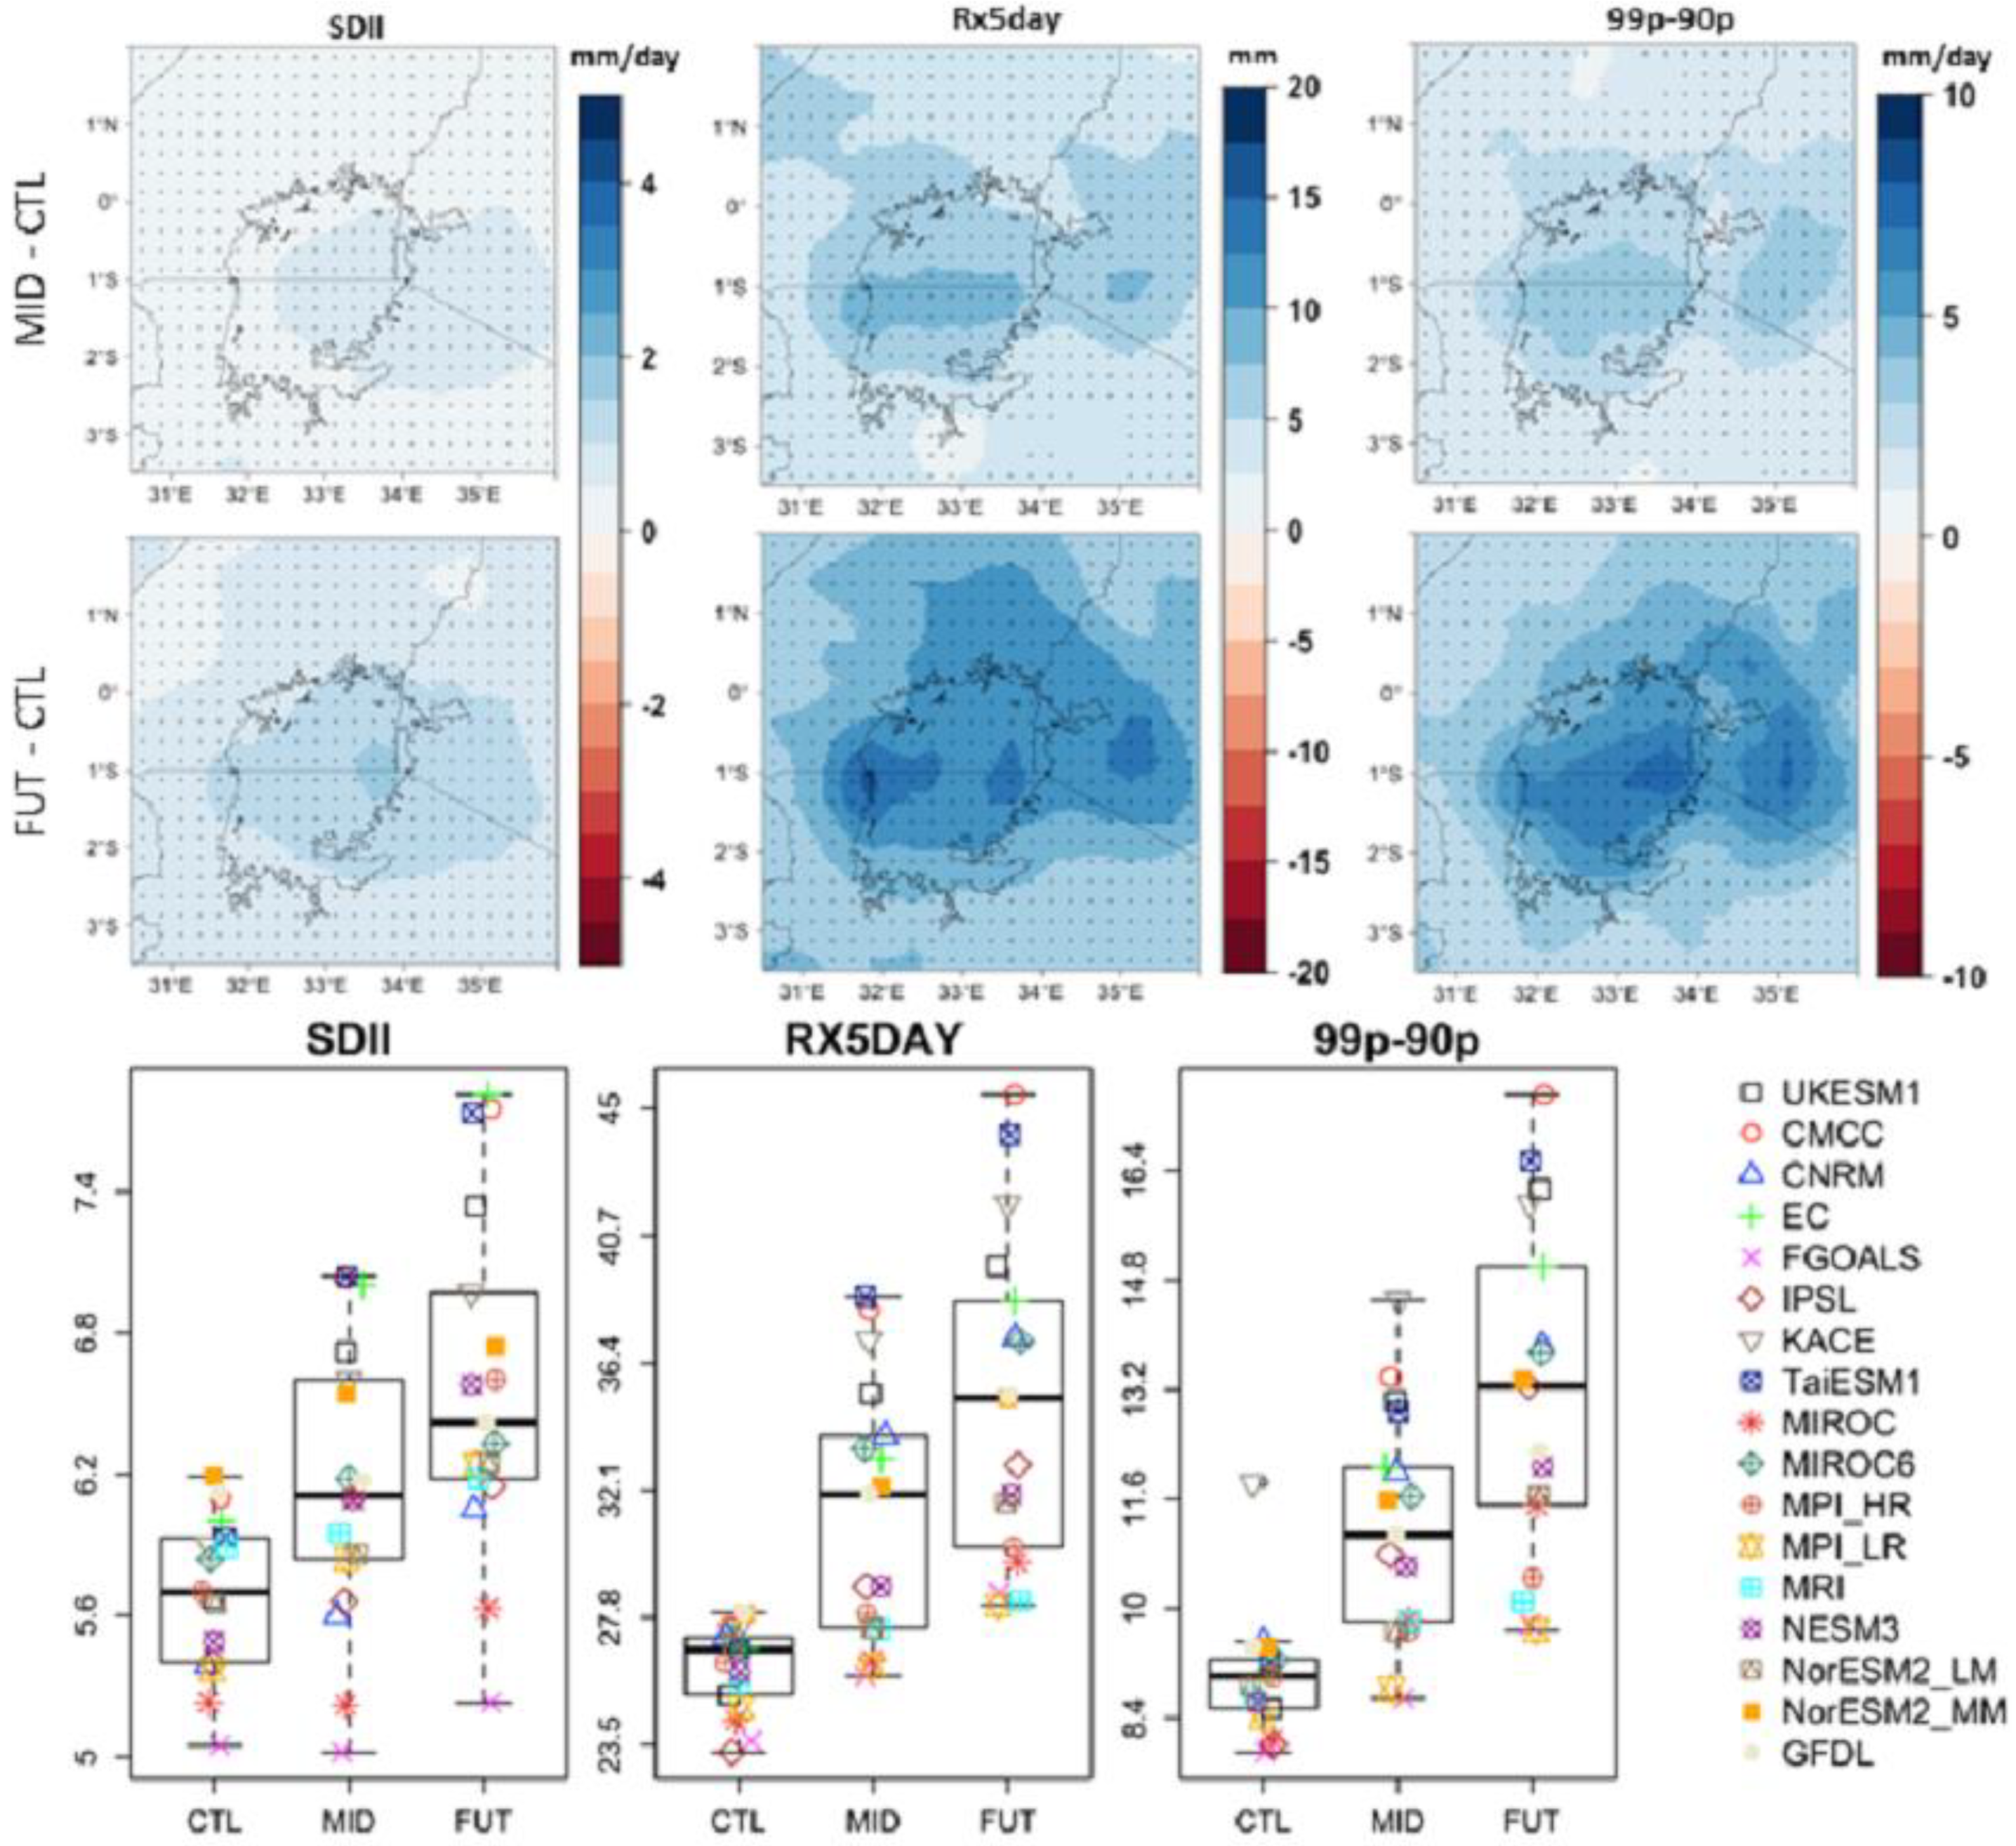
At the daily timescale, all the three statistics analysed in our study (SDII, Rx5day, and 99p-90p) showed a significant increase by both the mid and end of the century period (Figure 3, bottom panel). Here, precipitation intensity (SDII) showed a potential increase of 6% and 16% by mid and end of the century, respectively. The changes were more pronounced over the eastern part of Lake Victoria and western Kenya (around 1o South and 34o East). Greater changes (18% and 29% for mid and end century periods, respectively) were recorded for the maximum 5-day precipitation (Rx5day). Just like in the SDII case, changes were more pronounced over Lake Victoria and its environs (centre of study domain). The 99p-90p statistic showed the greatest changes with a mean increase of about 22% and 47% for mid and end century periods, respectively. Again, the changes were more pronounced over Lake Victoria and its environs than the rest of the study domain.
3. Discussion
Our findings indicate that more significant precipitation changes are likely to occur at the sub-seasonal level compared to the seasonal and annual scales. Given the high sensitivity of our study domain to weather and climate change and variability4,8,17, our findings contribute to the scientific evidence that can inform disaster risk reduction and climate change adaptation strategies for the study domain. Specifically, the projected increase in the width of the right tail precipitation distribution (99p-90p) and intensity (SDII) call for more robust measures to minimize disaster impact in a region where approximately 5,000 people (mostly fishermen) perish annually on Lake Victoria from extreme weather-related accidents8. The projected increase in precipitation intensity, coupled with an intensification of hazardous thunderstorms over Lake Victoria18,19, call for adaptive capacity strengthening for fishermen and lake-adjacent communities most of whom are vulnerable to disaster risk associated with extreme weather and climate events20.
Moreover, the projected changes are more pronounced over Lake Victoria and its environs than the rest of the study domain. In a region characterized by perennial weather-related disasters8 and extreme weather events1–3,21, the projected changes may cause further disruption to the wellbeing of the region’s communities and systems. Additionally, the projected changes have a substantial implication for the study domain, and the larger Nile Basin Region, which is currently experiencing a rapid population density increase22 coupled with conflicts over water resources23,24. Hence, enhanced production and use of climate services is recommended to minimize the risk posed by the projected changes and, ultimately, enhance the socio-economic wellbeing of communities in the LVB. Results from the current study provide a basis for further research to enhance the understanding of climate change and variability over the LVB and inform adaptive capacity strengthening measures for the region.
4. Methods
The study focussed on Lake Victoria and its immediate adjacent catchment area (Figure 4). The lake is located at an altitude of about 1,135 m above sea-level, spanning an area of about 68,000 square kilometres25. It is Africa’s largest freshwater body and the world’s largest inland fishery supporting at least 40 million inhabitants26. The lake and its resources fuel East Africa’s economy with the lake’s catchment providing about 90% of hydropower for Uganda, Burundi, and Rwanda. The lake’s basin (LVB) is renowned for its richness and endemism in species4,27,28. It has massive natural resources including forests, fisheries, rangelands, and wetlands from which communities in and around the basin draw their livelihoods. During the dry season over the Ethiopian highlands from whence the Nile’s main tributary (the Blue Nile) comes, the White Nile, the only outlet for Lake Victoria, contributes about 70% of all water reaching Egypt29.
5. Data and Methodology
Three gridded data products were used as reference datasets in the current study, including the Climate Hazards Group InfraRed Precipitation with Station data, version 2.0 (hereinafter CHIRPS). CHIRPS is a quasi-global precipitation dataset available from 1981 to near present, spanning 50 °S – 50 °N and all longitudes. It incorporates climatology, in-situ station data, and satellite imagery to form a gridded precipitation time series at horizontal resolutions31. The current study used the monthly 0.25o by 0.25o resolution dataset.
The second dataset used is the Multi-Source Weighted-Ensemble Precipitation version 2.8 (hereinafter MSWEP). MSWEP is a global 3-hour 0.1o resolution precipitation product that merges gauge, reanalysis, and satellite data to obtain high quality precipitation estimates across the globe32. Lastly, we used the Global Precipitation Climatology Centre (GPCC) full data monthly product version 2020 (v2020), obtained from the NOAA PSL, Boulder, Colorado, USA via https://psl.noaa.gov. The full data product is based on quality-controlled data from 67200 observation stations worldwide. The dataset contains monthly totals on a regular grid with precipitation anomalies at the stations interpolated before being superimposed on the GPCC climatology v2020 in the corresponding resolution33. These datasets have been validated and used widely over the study domain2,34,35.
To assess future precipitation patterns over the study domain, we used 17 bias-corrected general circulation model (GCM) datasets (Table S 1, Supplementary Information) from the NASA Earth Exchange Global Daily Downscaled Projections (NEX-GDDP-CMIP6). The NEX-GDDP-CMIP6 datasets are produced using a daily variant of monthly bias correction/spatial disaggregation method, resulting in a 0.25-degree horizontal product36. They are downscaled historical and future (spanning the period 1950-2100) climate projections based on output from Phase 6 of the Climate Model Intercomparison Project (CMIP6)12, including datasets from the ScenarioMIP model runs37,38 that are based on the Shared Socioeconomic Pathways (SSPs)39. Simulations from the ScenarioMIP provide the basis for investigating various science and policy questions particularly relevant to scenario-based analysis such as the role of specific forcings37.
First, we assessed the performance of the bias-corrected CMIP6 model simulations in reproducing precipitation patterns over the study domain, relative to observations. Here, we computed differences in mean spatial and temporal values between observations and model simulations. The performance assessment was done for the period 1985-2014, corresponding to reference data availability and the historical period of CMIP6 model simulations. Statistical computations were done on the native data grids before bilinearly interpolating the observational datasets (with relatively finer resolutions than CMIP6 model data) onto CMIP6 model data grids to facilitate comparison40,41.
Secondly, an assessment of future precipitation patterns over the study domain was done by calculating differences in mean values between the future period and the control period (1971-1999), using the annual precipitation indices and statistics presented in Table 1. Here, the periods 2020-2049 and 2070-2099 were used to represent the “near future (MID)” and “future (FUT)”, respectively.
Additionally, we computed mean annual (ANN) and seasonal (MAM, JJA, and OND) precipitation values over the study domain. We also used the 99p-90p statistic (Table 1) to represent the right tail of precipitation distribution over the study domain42. Here, 90p and 99p were calculated by accumulating daily precipitation values over each grid point with 99p and 90p, representing very intense and heavy precipitation events, respectively. The percentiles for 99p and 90p were calculated for all days in the data.
Supplementary Materials
The following supporting information can be downloaded at the website of this paper posted on Preprints.org.
Acknowledgment
The authors appreciate the contribution of various organizations whose climate datasets made the current study possible. Additionally, the authors thank James Mbugua, Hussen Endris, and Maurice Nyadawa for contributions to the initial discussions into the design of the current paper. The anonymous reviewers whose comments helped shape this article are highly appreciated. Errors, if any, are those of the authors and not the institutions to which they are affiliated.
References
- Mafaranga, H. Heavy Rains, Human Activity, and Rising Waters at Lake Victoria. Eos (Washington DC) 101, (2020). [CrossRef]
- Ogega, O. M. et al. Heavy precipitation events over East Africa in a changing climate: results from CORDEX RCMs. Clim Dyn 55, 993–1009 (2020). [CrossRef]
- Wainwright, C. M., Finney, D. L., Kilavi, M., Black, E. & Marsham, J. H. Extreme rainfall in East Africa, October 2019–January 2020 and context under future climate change. Weather 76, 26–31 (2021).
- Sayer, C. A., Máiz-Tomé, L. & Darwall, W. R. T. Freshwater biodiversity in the Lake Victoria Basin: Guidance for species conservation, site protection, climate resilience and sustainable livelihoods. (IUCN, International Union for Conservation of Nature, 2018). doi:10.2305/IUCN.CH.2018.RA.2.en.
- Scheffers, B. R. et al. The broad footprint of climate change from genes to biomes to people. Science (1979) 354, aaf7671 (2016). [CrossRef]
- Albrecht, R. I., Goodman, S. J., Buechler, D. E., Blakeslee, R. J. & Christian, H. J. Where Are the Lightning Hotspots on Earth? Bull Am Meteorol Soc 97, 2051–2068 (2016).
- Barnett, E. Lethal weather on ’world’s most dangerous lake. CNN (2013).
- Cannon, T., Schipper, L., Bankoff, G. & Krüger, F. World Disasters Report: Focus on culture and risk. (International Federation of Red Cross and Red Crescent Societies, 2014).
- Finney, D. L. et al. Effects of Explicit Convection on Future Projections of Mesoscale Circulations, Rainfall, and Rainfall Extremes over Eastern Africa. J Clim 33, 2701–2718 (2020). [CrossRef]
- Ridder, N. N., Pitman, A. J. & Ukkola, A. M. Do CMIP6 Climate Models Simulate Global or Regional Compound Events Skillfully? Geophys Res Lett 48, (2021). [CrossRef]
- Vanderkelen, I., van Lipzig, N. P. M. & Thiery, W. Modelling the water balance of Lake Victoria (East Africa) – Part 2: Future projections. Hydrol Earth Syst Sci 22, 5527–5549 (2018). [CrossRef]
- Eyring, V. et al. Overview of the Coupled Model Intercomparison Project Phase 6 (CMIP6) experimental design and organization. Geosci Model Dev 9, 1937–1958 (2016). [CrossRef]
- Sun, X., Xie, L., Semazzi, F. & Liu, B. Effect of Lake Surface Temperature on the Spatial Distribution and Intensity of the Precipitation over the Lake Victoria Basin. Mon Weather Rev 143, 1179–1192 (2015). [CrossRef]
- Nicholson, S. E. & Yin, X. Mesoscale Patterns of Rainfall, Cloudiness and Evaporation over the Great Lakes of East Africa. in 93–119 (2002). [CrossRef]
- Yin, X. & Nicholson, S. E. The water balance of Lake Victoria. Hydrological Sciences Journal 43, 789–811 (1998). [CrossRef]
- Vigaud, N., Lyon, B. & Giannini, A. Sub-seasonal teleconnections between convection over the Indian Ocean, the East African long rains and tropical Pacific surface temperatures. International Journal of Climatology 37, 1167–1180 (2017). [CrossRef]
- van Zwieten, P. A. M. et al. The Nile perch invasion in Lake Victoria: cause or consequence of the haplochromine decline? Canadian Journal of Fisheries and Aquatic Sciences 73, 622–643 (2016). [CrossRef]
- van de Walle, J. et al. Future intensification of precipitation and wind gust associated thunderstorms over Lake Victoria. Weather Clim Extrem 34, 100391 (2021). [CrossRef]
- Thiery, W. et al. Hazardous thunderstorm intensification over Lake Victoria. Nat Commun 7, 12786 (2016). [CrossRef]
- Cinner, J. E. et al. Changes in adaptive capacity of Kenyan fishing communities. Nat Clim Chang 5, 872–876 (2015). [CrossRef]
- Nicholson, S. E. A detailed look at the recent drought situation in the Greater Horn of Africa. J Arid Environ 103, 71–79 (2014). [CrossRef]
- World Bank. Lake Victoria Environmental Management Project: Project Information Document/Integrated Safeguards Data Sheet (PID /ISDS). The World Bank 21 (2018).
- Roussi, A. Gigantic Nile dam prompts clash between Egypt and Ethiopia. Nature 574, 159–160 (2019). [CrossRef]
- Stokstad, E. Power play on the Nile. Science (1979) 351, 904–907 (2016). [CrossRef]
- Rzóska, J. Lake Victoria, Physical Features, General Remarks on Chemistry and Biology. in 167–175 (1976). [CrossRef]
- UNEP. Lake Victoria Basin Environment Outlook: Environment and Development. https://bit.ly/3kXwiKV (2006).
- Darwall, W., Smith, K., Lowe, T. & Vié, J.-C. The Status and Distribution of Freshwater Biodiversity in Eastern Africa. in IUCN SSC Freshwater Biodiversity Assessment Programme viii + 36 (IUCN, Gland, Switzerland and Cambridge, UK, 2005).
- Seehausen, O. Patterns in fish radiation are compatible with Pleistocene desiccation of Lake Victoria and 14 600 year history for its cichlid species flock. Proc R Soc Lond B Biol Sci 269, 491–497 (2002). [CrossRef]
- UNESCO. Discharge of selected rivers in Africa. in Studies and reports in hydrology 166 (United Nations Educational, Scientific, and Cultural Organization (UNESCO), 1995).
- Farr, T. G. et al. The Shuttle Radar Topography Mission. Reviews of Geophysics 45, RG2004 (2007).
- Funk, C. et al. The climate hazards infrared precipitation with stations—a new environmental record for monitoring extremes. Sci Data 2, 150066 (2015). [CrossRef]
- Beck, H. E. et al. MSWEP V2 Global 3-Hourly 0.1° Precipitation: Methodology and Quantitative Assessment. Bull Am Meteorol Soc 100, 473–500 (2019). [CrossRef]
- Schneider, U., Hänsel, S., Finger, P., Rustemeier, E. & Ziese, M. GPCC Full Data Monthly Product Version 2022 at 0.25°: Monthly Land-Surface Precipitation from Rain-Gauges built on GTS-based and Historical Data. (2022). [CrossRef]
- Dinku, T. et al. Validation of the CHIRPS satellite rainfall estimates over eastern Africa. Quarterly Journal of the Royal Meteorological Society 144, 292–312 (2018). [CrossRef]
- Ayugi, B. et al. Comparison of CMIP6 and CMIP5 Models in Simulating Mean and Extreme Precipitation over East Africa. (2021). [CrossRef]
- Thrasher, B. et al. NASA Global Daily Downscaled Projections, CMIP6. Sci Data 9, 262 (2022). [CrossRef]
- O’Neill, B. C. et al. The Scenario Model Intercomparison Project (ScenarioMIP) for CMIP6. Geosci Model Dev 9, 3461–3482 (2016). [CrossRef]
- Tebaldi, C. et al. Climate model projections from the Scenario Model Intercomparison Project (ScenarioMIP) of CMIP6. Earth System Dynamics 12, 253–293 (2021). [CrossRef]
- Meinshausen, M. et al. The shared socio-economic pathway (SSP) greenhouse gas concentrations and their extensions to 2500. Geosci Model Dev 13, 3571–3605 (2020). [CrossRef]
- Diaconescu, E. P., Gachon, P. & Laprise, R. On the Remapping Procedure of Daily Precipitation Statistics and Indices Used in Regional Climate Model Evaluation. J Hydrometeorol 16, 2301–2310 (2015). [CrossRef]
- Zhou, R.-G., Hu, W., Fan, P. & Ian, H. Quantum realization of the bilinear interpolation method for NEQR. Sci Rep 7, 2511 (2017). [CrossRef]
- Scoccimarro, E., Gualdi, S., Bellucci, A., Zampieri, M. & Navarra, A. Heavy precipitation events over the Euro-Mediterranean region in a warmer climate: results from CMIP5 models. Reg Environ Change 16, 595–602 (2016). [CrossRef]
Figure 1.
Precipitation climatology over the study domain using MSWEP data (top panel), differences in mean precipitation between an ensemble mean of the top five performing models (mid panel), and annual cycles for all the three reference datasets and all the 17 model datasets (bottom panel). All units are in mm/month.
Figure 1.
Precipitation climatology over the study domain using MSWEP data (top panel), differences in mean precipitation between an ensemble mean of the top five performing models (mid panel), and annual cycles for all the three reference datasets and all the 17 model datasets (bottom panel). All units are in mm/month.
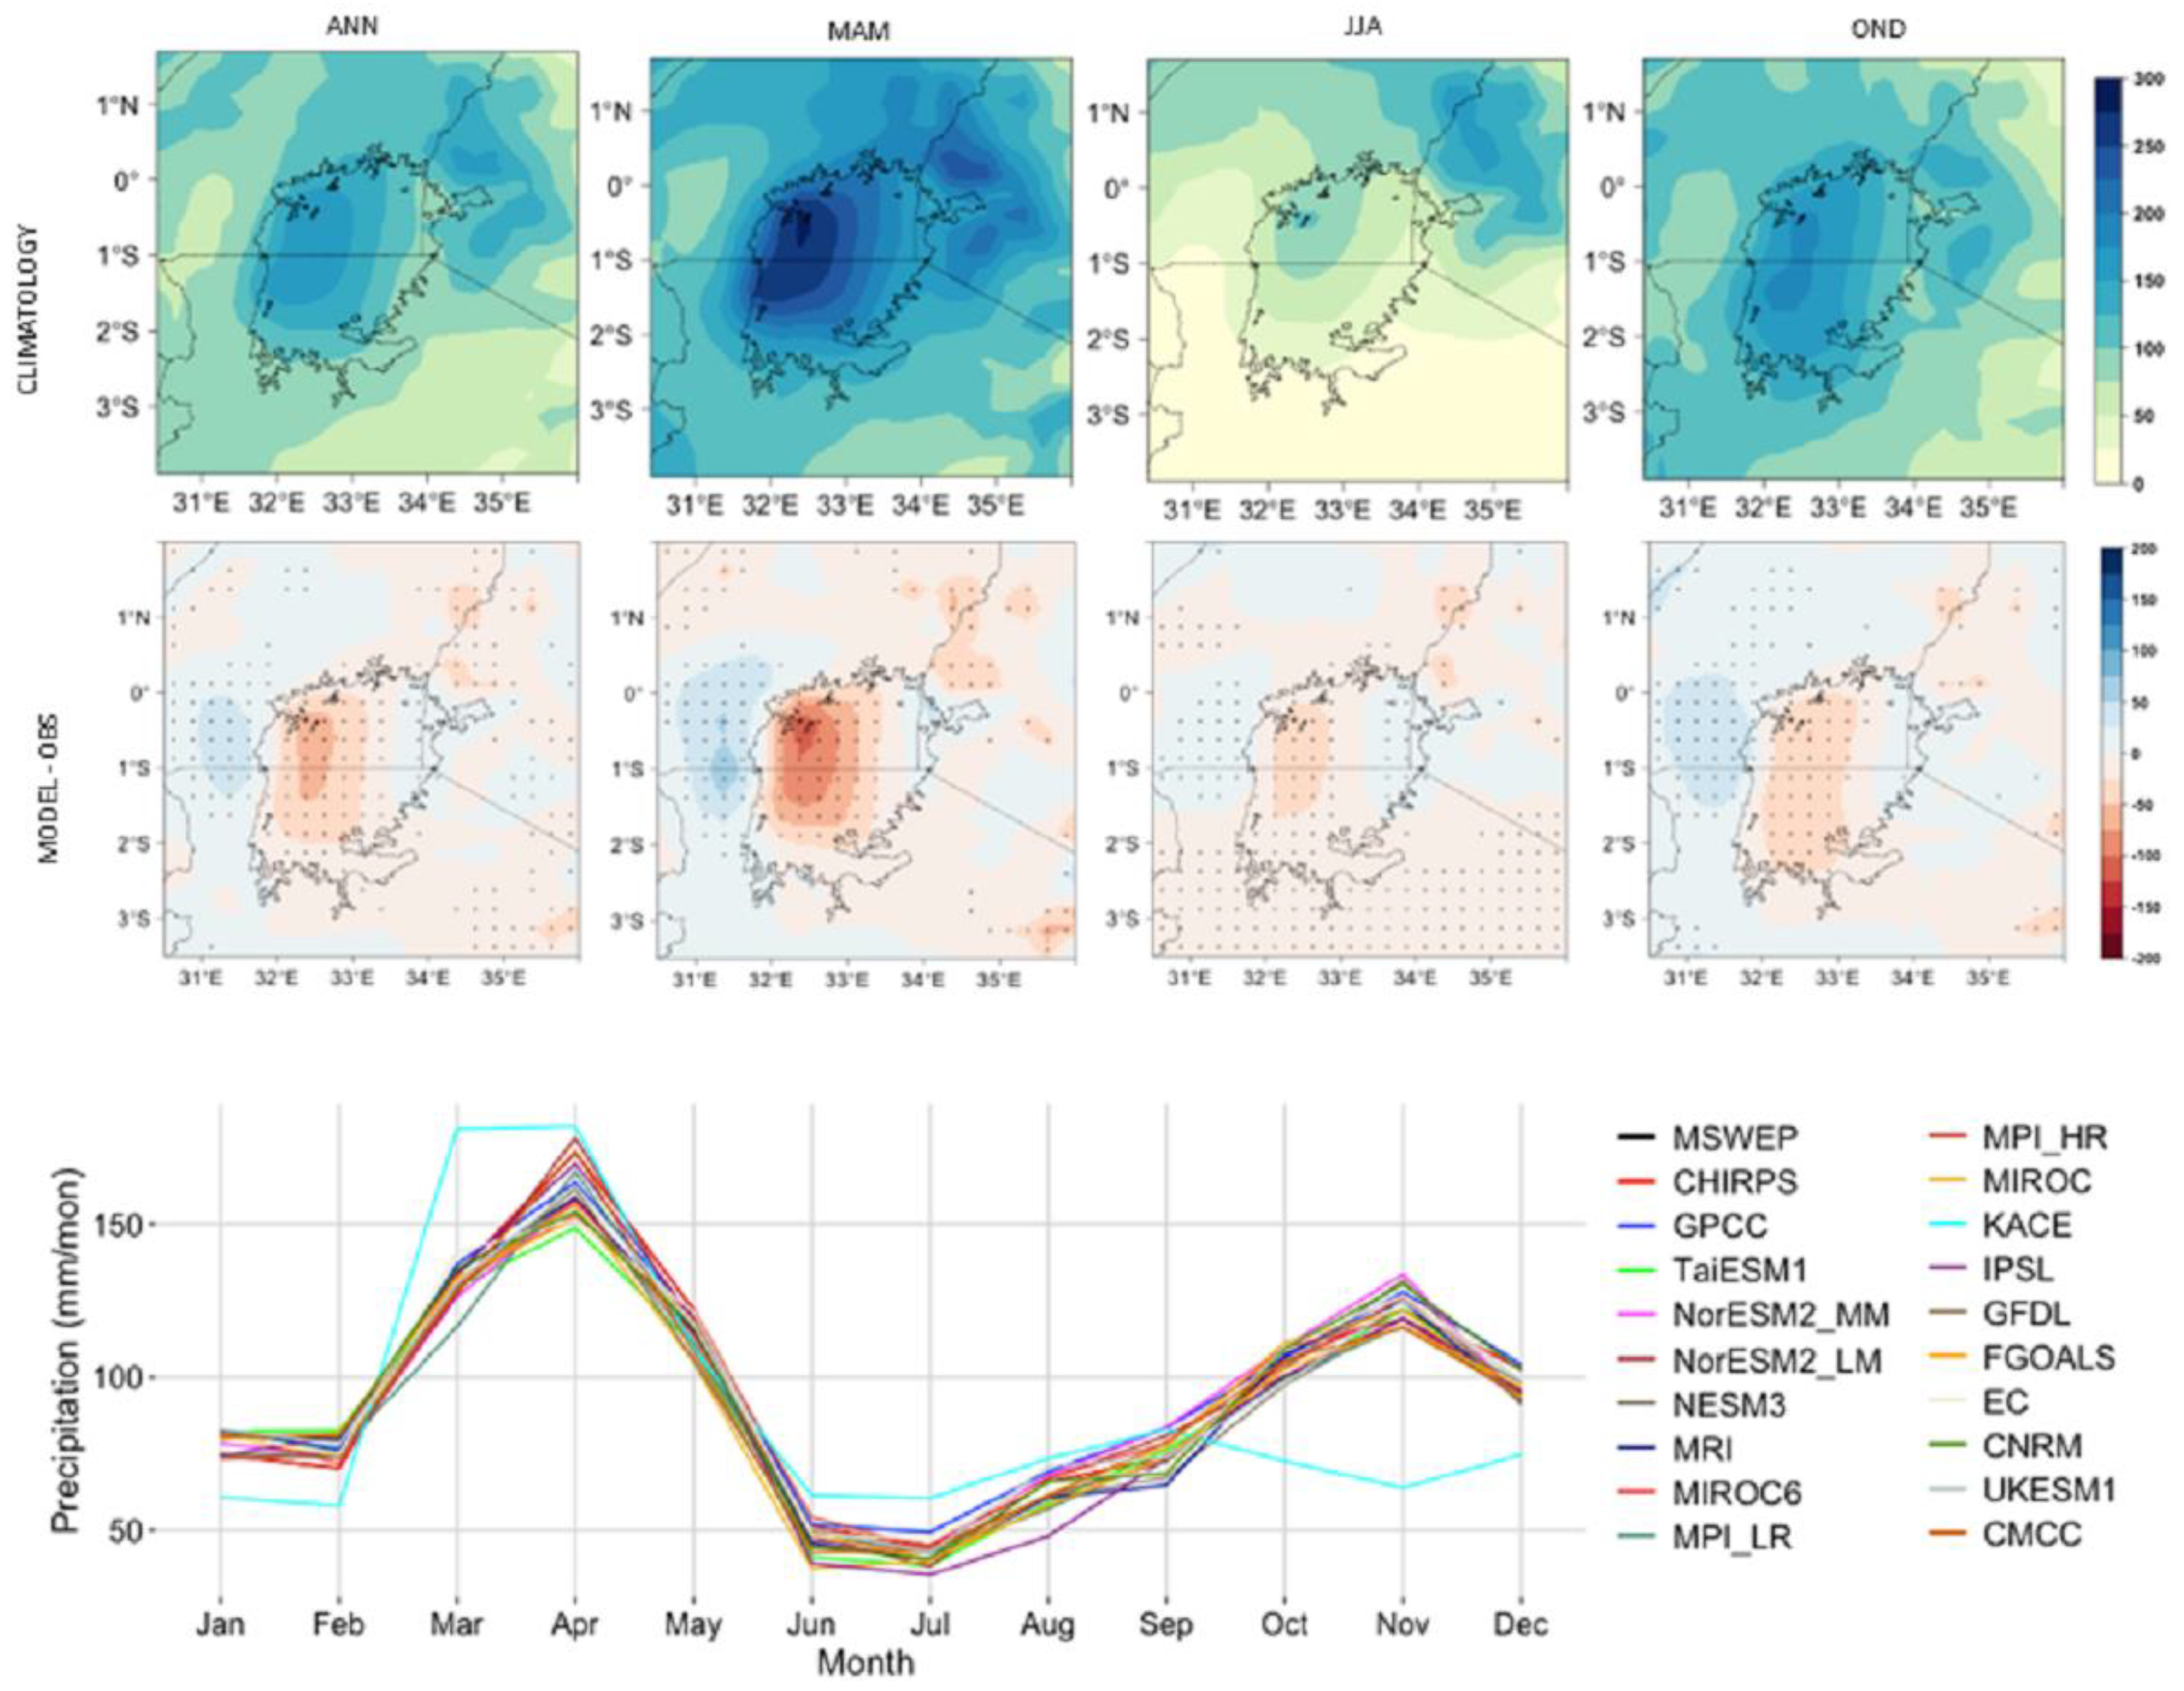
Figure 2.
Changes in mean annual (ANN) and seasonal (MAM, JJA, and OND) precipitation climatology for the period 2040-2069 (MID; top panel) and 2070-2099 (FUT; mid panel) relative to the 1985-2014 period (CTL), using an ensemble mean of the top-five models identified in subsection 3.1. Stippling shows significant values (at 99% confidence level). Bottom panel presents mean values for ANN, MAM, JJA, and OND averaged over the study domain for the CTL, MID, and FUT periods, for all the models. All units are in mm/month.
Figure 2.
Changes in mean annual (ANN) and seasonal (MAM, JJA, and OND) precipitation climatology for the period 2040-2069 (MID; top panel) and 2070-2099 (FUT; mid panel) relative to the 1985-2014 period (CTL), using an ensemble mean of the top-five models identified in subsection 3.1. Stippling shows significant values (at 99% confidence level). Bottom panel presents mean values for ANN, MAM, JJA, and OND averaged over the study domain for the CTL, MID, and FUT periods, for all the models. All units are in mm/month.
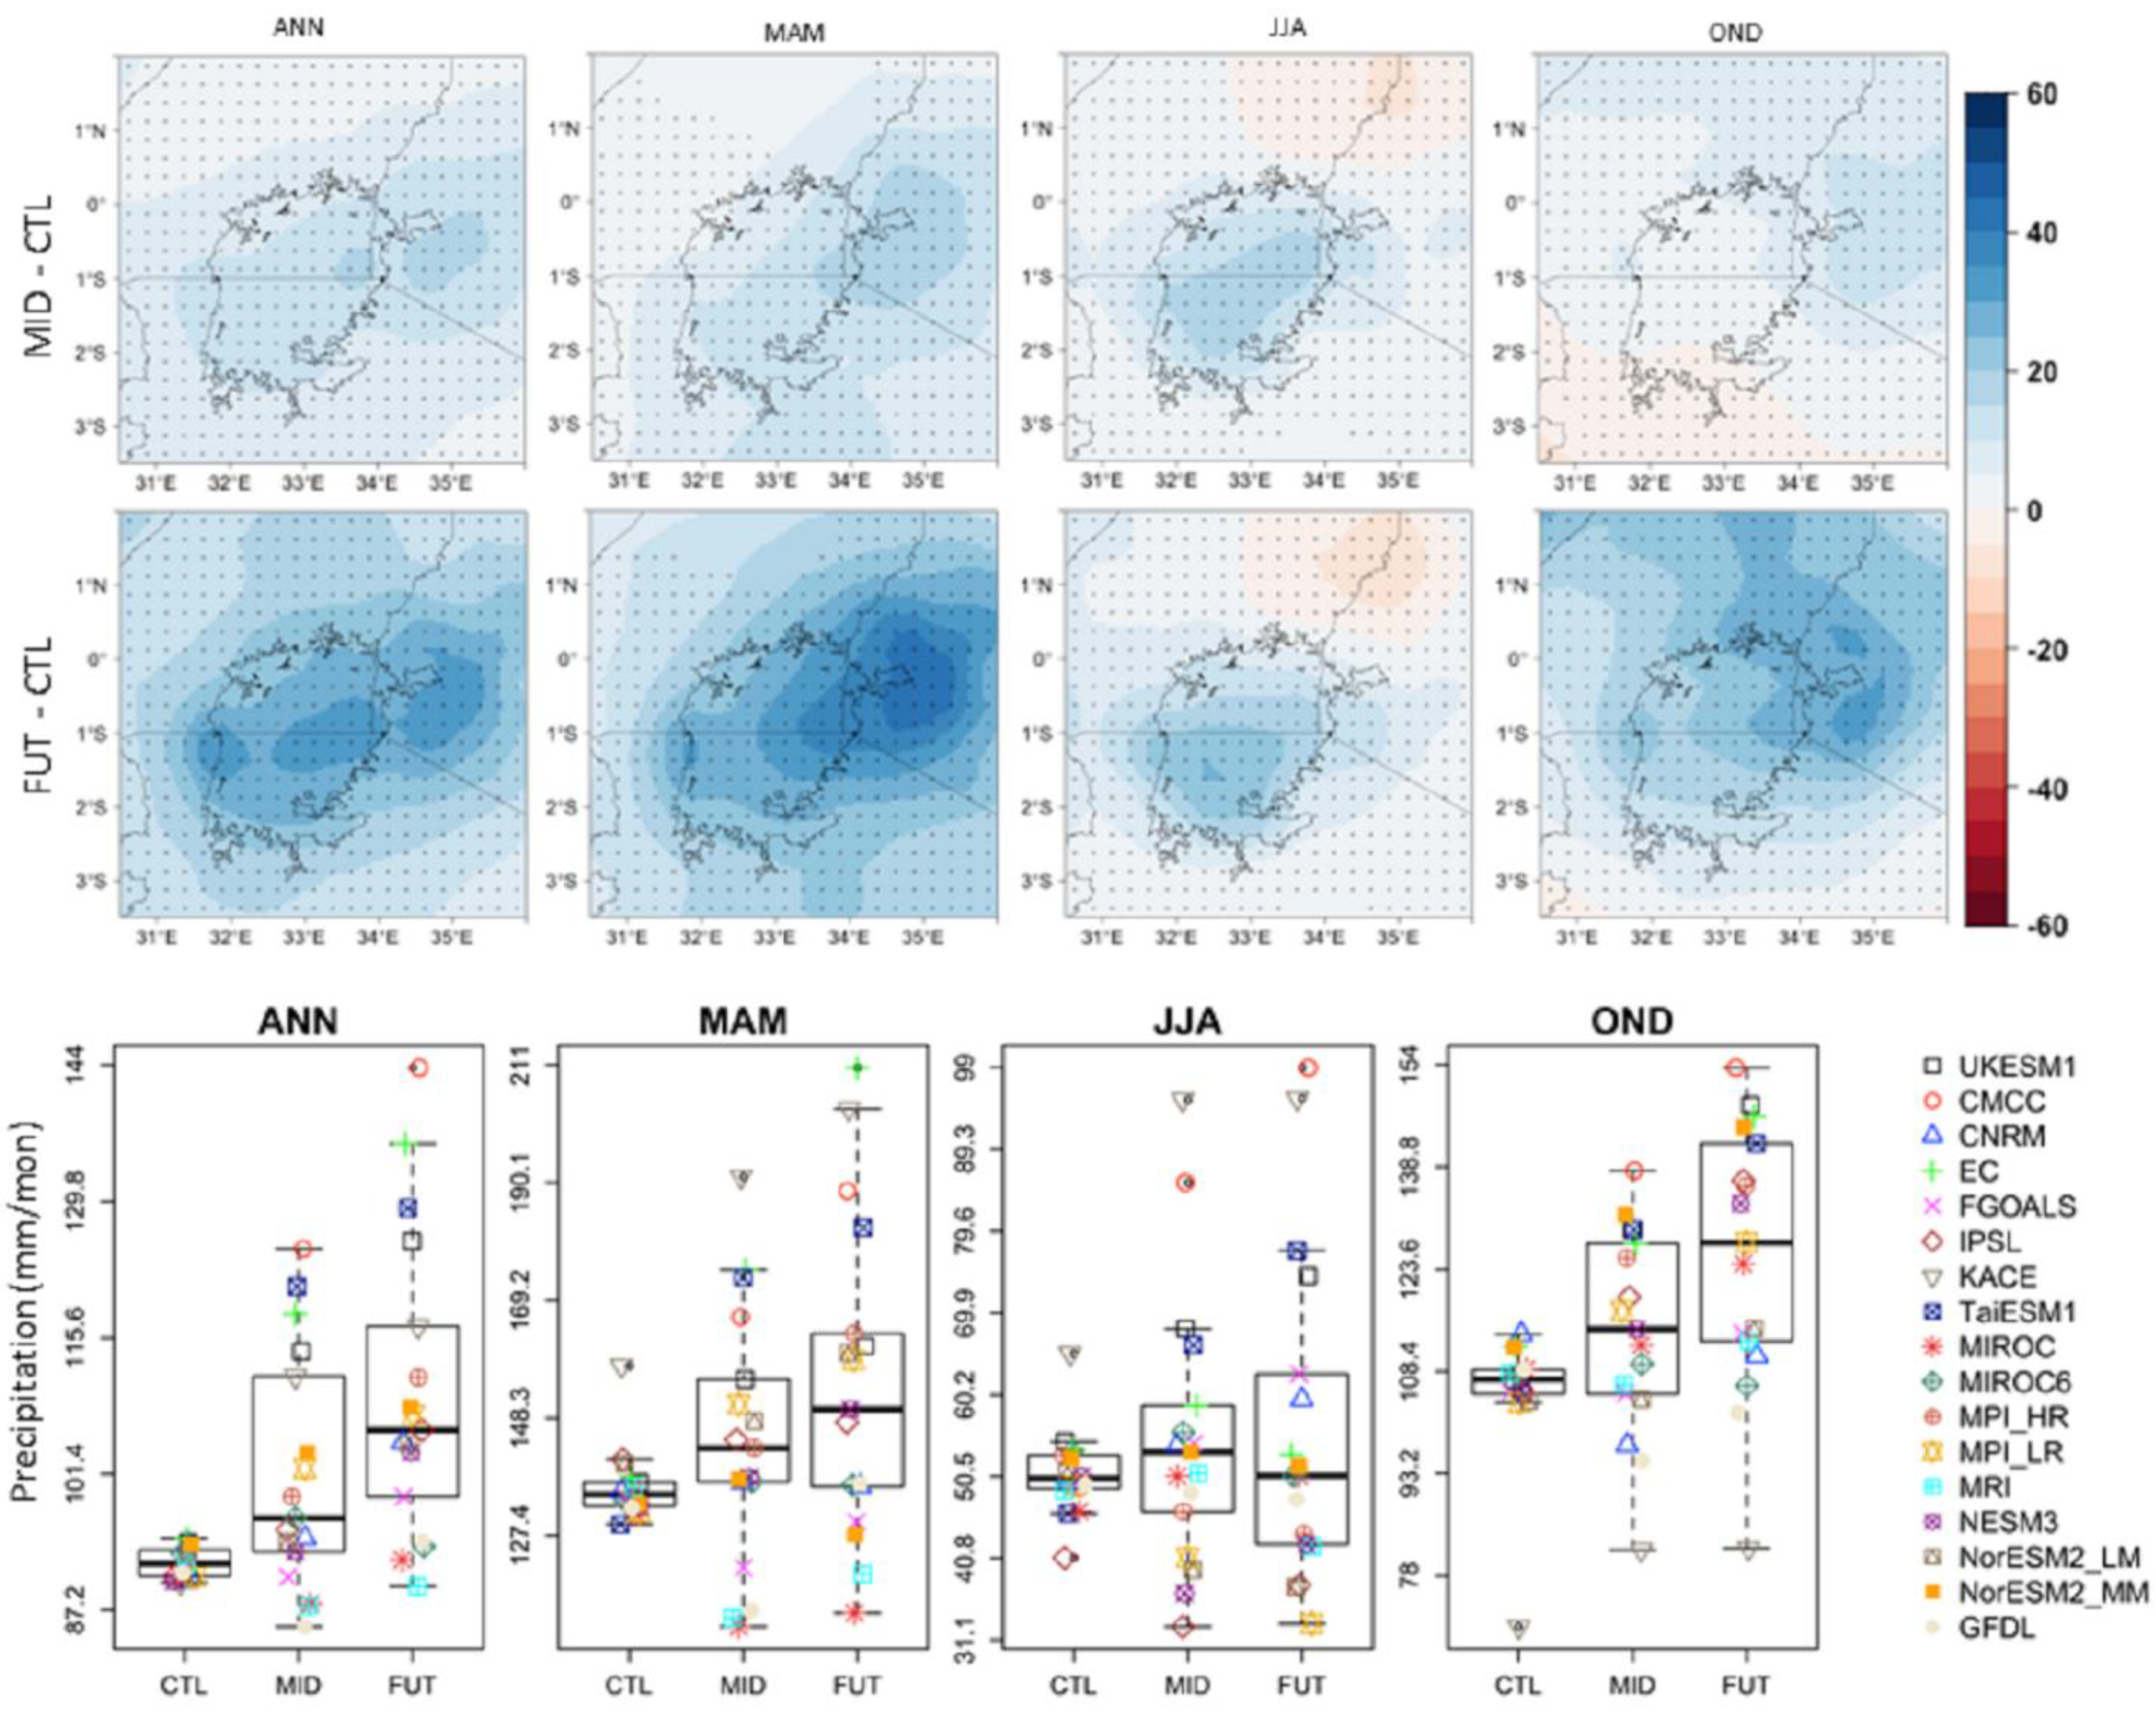
Figure 4.
A topographic map of the study domain produced using a 30-meter Digital Elevation Model the Shuttle Radar Topography Mission (SRTM, 30) sourced from Unites States Geological Survey archive (https://earthexplorer.usgs.gov/).
Figure 4.
A topographic map of the study domain produced using a 30-meter Digital Elevation Model the Shuttle Radar Topography Mission (SRTM, 30) sourced from Unites States Geological Survey archive (https://earthexplorer.usgs.gov/).
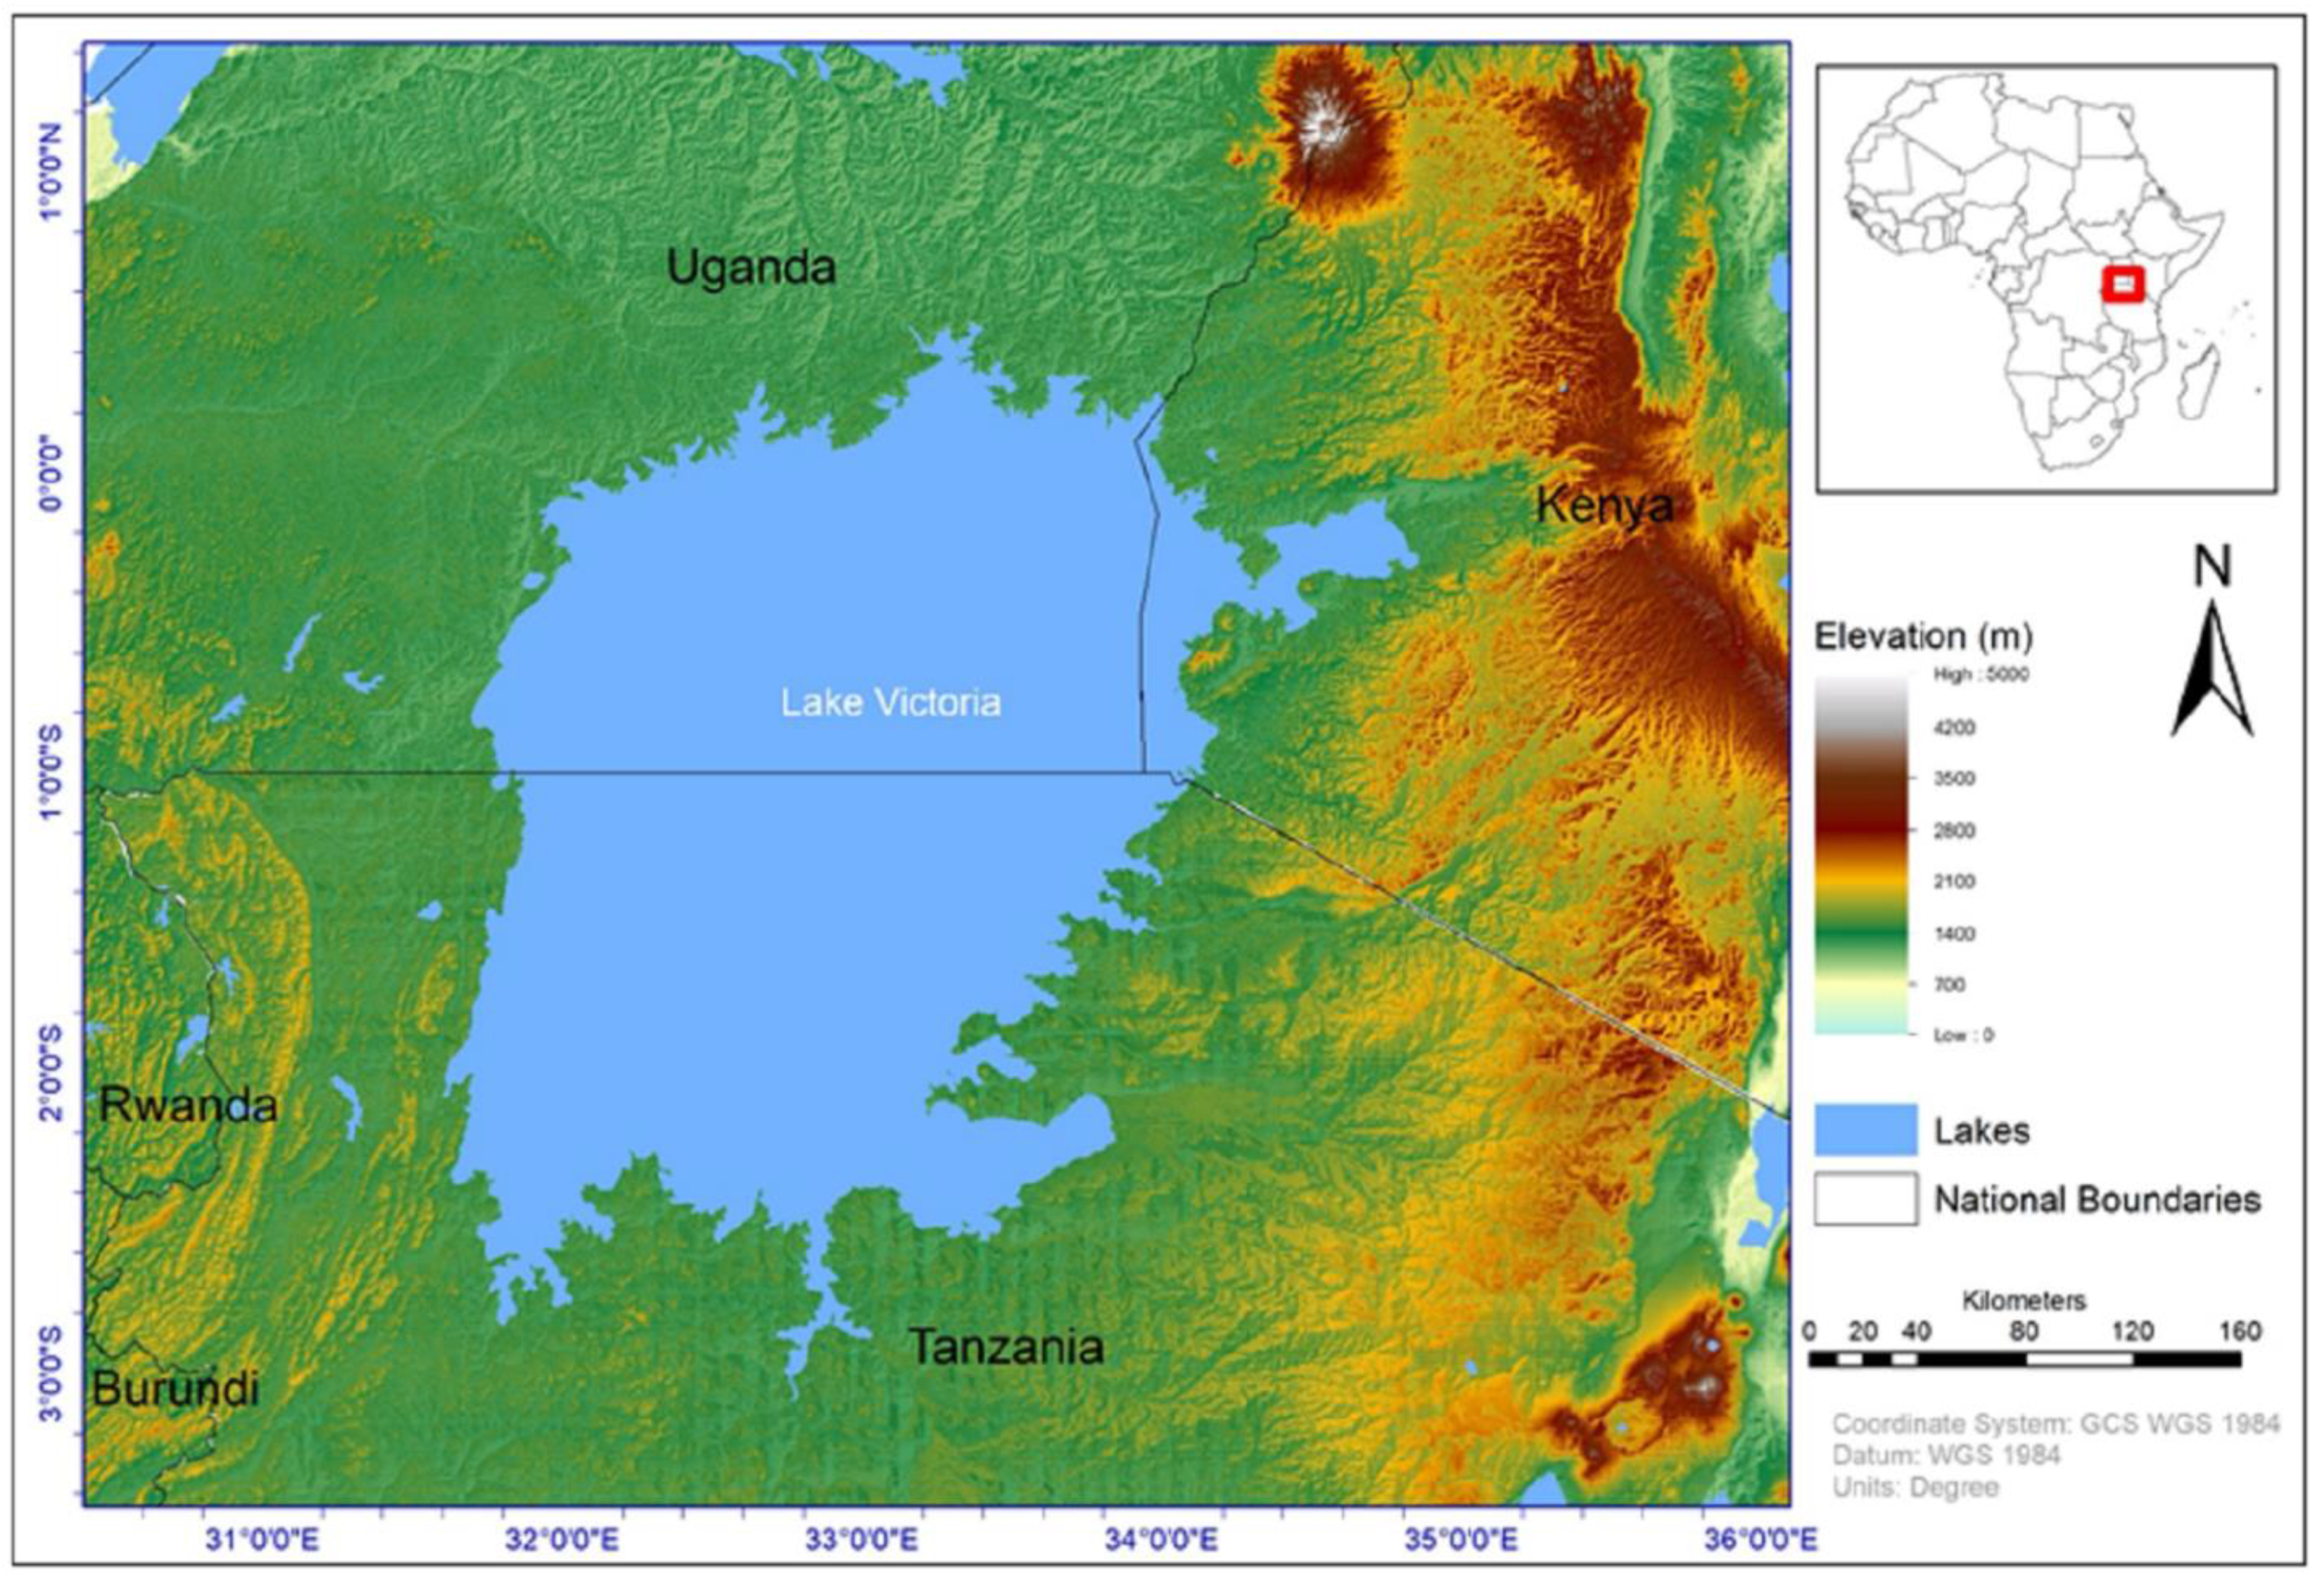

Table 1.
A list of annual precipitation indices and annual precipitation statistics used in the current study.
Table 1.
A list of annual precipitation indices and annual precipitation statistics used in the current study.
| Descriptor | Acronym | Description |
| Simple precipitation intensity index | SDII | Mean precipitation amount on a wet day. Let RRij be the daily precipitation amount on wet day w (RR ≥ 1 mm) in period j. If W represents the number of wet days in j then the simple precipitation intensity index SDIIj = sum (RRwj) / W |
| Max 5-day precipitation amount | Rx5day | Maximum consecutive 5-day precipitation |
| Width of the right tail distribution of precipitation | 99p-90p | Calculated as the difference between the 99th and the 90th percentiles (99p–90p), where 90p defined as follows; for every adjacent sequence t_1, ..., t_n of timesteps of the same year, 90p is given by o(t, x) = pth percentile{i(t’, x), t1 < t’ ≤ tn}; here computed for the 90th percentile. For this study, 90p represents the threshold for identifying heavy precipitation events. 99p represents very intense precipitation events and is defined as; for every adjacent sequence t_1, ..., t_n of timesteps of the same year, 99p is given by o(t, x) = pth percentile{i(t’, x), t1 < t’ ≤ tn}; here computed for the 99th percentile |
Disclaimer/Publisher’s Note: The statements, opinions and data contained in all publications are solely those of the individual author(s) and contributor(s) and not of MDPI and/or the editor(s). MDPI and/or the editor(s) disclaim responsibility for any injury to people or property resulting from any ideas, methods, instructions or products referred to in the content. |
© 2023 by the authors. Licensee MDPI, Basel, Switzerland. This article is an open access article distributed under the terms and conditions of the Creative Commons Attribution (CC BY) license (http://creativecommons.org/licenses/by/4.0/).
Copyright: This open access article is published under a Creative Commons CC BY 4.0 license, which permit the free download, distribution, and reuse, provided that the author and preprint are cited in any reuse.


