
Submitted:
17 February 2024
Posted:
19 February 2024
You are already at the latest version
Abstract
In a dynamic production processes, mechanical degradation poses a significant challenge, impacting product quality and process efficiency. This paper explores a novel approach for monitoring degradation in the context of viscose fiber production, a highly dynamic manufacturing process. Using causal discovery techniques, our method allows domain experts to incorporate background knowledge into the creation of causal graphs. Further, it enhances the interpretability and increases the ability to identify potential problems via changes in causal relations over time. The case study employs a comprehensive analysis of the viscose fiber production process within a prominent textile industry, emphasizing the advantages of causal discovery for monitoring degradation. The results are compared with state-of-the-art methods, which are not considered to be interpretable, specifically LSTM-based autoencoders, showcasing the alignment and validation of our approach. This paper provides valuable information on degradation monitoring strategies, demonstrating the efficacy of causal discovery in dynamic manufacturing environments. The findings contribute to the evolving landscape of process optimization and quality control.
Keywords:
degradation monitoring
; health monitoring
; causal discovery
; jaccard distance
; inter- 14 pretability
; causal interpretability
1. Introduction
Detecting degradation in industrial processes is a critical undertaking that requires quick and precise actions. Degradation, whether subtle or pronounced, serves as an early warning of potential issues within the system, indicating factors like equipment wear, material variations, or environmental changes. Timely detection and increased understanding is paramount to avoid larger problems, ensuring operational efficiency and mitigating unexpected failures. In response to identified degradation, a proactive strategy that integrates advanced monitoring technologies and data analytics allows precise interventions, including scheduled inspections, parameter adjustments, or component replacements as part of predictive maintenance initiatives. This strategic approach not only reduces the risk of unforeseen failures, but also optimizes maintenance practices by addressing issues precisely when necessary.
To ensure that the quality and quantity of the final product fulfills given criteria, industries frequently deploy preventive measures. These measures rely on distinct maintenance strategies, and are categorized into Breakdown maintenance, Planned maintenance, Condition-based maintenance or predictive maintenance as discussed in [1], to address equipment reliability and performance effectively. Despite the importance of degradation monitoring for maintaining product quality, many industries still rely on reactive maintenance, which can result in costly downtime and losses. Proactive strategies for early detection of degradation are crucial for preventing larger issues and enhancing customer satisfaction. Therefore, there is a very high need for innovative degradation monitoring methods to ensure continuous operation and success in industrial processes.
Our approach to monitor degradation utilizes causal discovery, leveraging the inherent cause-and-effect relationships in degradation. This means that degradation in one sensor or component can lead to degradation in others or in the output variable. Additionally, using causality analysis for degradation monitoring allows domain experts to incorporate their process knowledge, enriching the understanding of the system. We utilize the Fast Causal Inference (FCI) algorithm, initially crafted for independent and identically distributed (i.i.d.) data, but tailored by us to accommodate temporal dependencies inherent in time-series data. FCI is chosen because it can effectively conduct causal discovery even in scenarios with latent confounders [2], a common occurrence in real-world situations where not all parameters are directly measured.
An essential aspect of our approach involves selecting a reference causal graph that embodies the ideal or normal working condition. We then track degradation by comparing subsequent causal graphs over time against this reference, utilizing the Jaccard distance as a metric of dissimilarity. In our case study (refer to Section 4), where machine components are replaced every 6 months, the reference causal graph is chosen close to the timeframe when the components are new. Subsequent causal graphs are compared against it, and the Jaccard distance is calculated, followed by trend analysis. When the Jaccard distance exceeds a predefined threshold set by domain experts, they can investigate the cause-and-effect relationship of this deviation using the corresponding causal graphs.
After conducting degradation monitoring, it is crucial that the results are interpretable to domain experts, enabling them to take necessary actions. Our approach is based on causal discovery to address this challenge by providing interpretable causal graphs, allowing domain experts to discern changes in the process. Additionally, to interpret the results obtained from causal graphs, we have developed a visualization illustrating dynamic changes in features over time. This visualization depict the types of relationships between feature pairs over time and highlight the presence of new connections or confounders in the current causal graph compared to previous ones. These new relations indicate changes in the underlying process that may represent critical deviations in the manufacturing process itself. In summary, our contributions in the context of the viscose fiber production process include:
- Propose a novel approach making use of causal discovery, and adapting the FCI algorithm to time series data for tracking degradation processes together with proposed distance measures to quantify these changes
- Developing visualizations to illustrate dynamic changes as a tool for communication with domain experts achieving the goal of interpretable results
- Comparing our degradation monitoring results with those obtained using the state-of-the-art LSTM-based autoencoder method, which is not considered to be interpretable
Section 2 provides an overview of existing research on degradation monitoring in the manufacturing industry. Section 3 delves into the methodology employed for monitoring degradation in the production process, providing detailed insights into preliminaries such as data pre-processing and various algorithms used for this purpose. Subsequently, Section 4 presents the results of the methodology applied to the viscose fiber production process within a prominent textile industry. In Section 5, we conduct an evaluation by comparing our results with a state-of-the-art method, specifically Long Short-Term Memory (LSTM)-based Autoencoders (AE), for monitoring degradation in the process outlined in Section 4. This section not only presents the evaluation but also discusses the findings of the results in comparison to our approach. The paper concludes with Section 6, discussing the key findings and identifying potential avenues for future research.
2. Related Work
This section provides an in-depth overview of various approaches found in the literature to monitor degradation. It covers a wide range of methodologies, beginning with an exploration of well-established machine learning (ML) methods, with a particular focus on unsupervised learning methods. This decision is motivated by the fact that supervised learning methods are constrained to datasets containing labels, which is rarely a case for real-world industrial data. Also our case study uses real-world data without labels. Following this, the section further delves into an examination of causal discovery techniques specifically applied in the manufacturing industry. In addition, it discusses the importance of causal interpretability, emphasizing the necessity for transparent results that are understandable to users. It outlines existing methods employed in the literature to enhance interpretability and underscores ongoing research efforts aimed at further advancing causal interpretability.
2.1. Approaches to Unsupervised Degradation Monitoring
This section delves into various methodologies employed in the literature for unsupervised degradation monitoring, fault detection, predictive maintenance, condition monitoring, and machine and sensor health monitoring. These approaches aim to identify deterioration in processes without relying on predefined ground truth data, i.e., in an unsupervised manner.
One of the widely adopted method for unsupervised anomaly detection is the One-class Support Vector Machine (SVM), as discussed in [3]. It involves training on normal data and then identifying anomalies in test data. Modifications like Robust One-class SVM and eta One-class SVM aim to improve its robustness, especially against outliers, with promising results shown by the eta One-Class SVM. In [4], a kernel-based SVM monitors sensor data to assess the health status of a complex industrial asset—an auxiliary marine diesel engine. Additionally, [5] applies One-class SVM for fault detection in a closed-loop feedback controller system. Traditional One-class SVMs are designed for i.i.d. data, which does not encompass typical time-series data. To address this, [6] and [7] convert time-series data into vectors to enable One-class SVM application.
Autoencoders (AE) and Long Short-Term Memory (LSTM) networks are widely used for anomaly detection. Studies like [8,9,10] utilize AE for this purpose. In [11], deep AE is applied to monitor equipment health condition, using reconstruction error as a key health indicator. Their method was tested on public datasets FD001, FD003, and Mill, comparing favorably with state-of-the-art approaches. Another study by [12] focuses on degradation detection in machine bearings. They employ a sparse autoencoder to extract unsupervised features and calculate the autoencoder correlation-based (AEC) rate between initial and successive samples. This rate effectively identifies the onset of degradation in machine components.
The review in [13] explores ARIMA (Autoregressive Integrated Moving Average), ARIMAX (Autoregressive Integrated Moving Average Exogenous), and VAR (Vector Autoregression) as deep learning models for anomaly detection. It addresses ARIMA’s limitation in handling multivariate time series data by introducing the ARIMAX model, including an additional explanatory variable, or using VAR, which utilizes vectors to accommodate multivariate terms.
In [14], an LSTM-based autoencoder (AE) is employed for anomaly detection in time series data of customer demand in supply chain management. The method trains the model on normal data and utilizes it to predict future steps in the time series, quantifying discrepancies between predicted and observed values as prediction errors. A kernel estimator of the quantile function establishes a threshold for anomaly detection, achieving a lower false alarm rate compared to traditional One-class Support Vector Machine methods. A similar concept as that of [14] is applied in our evaluation, as detailed in Section 5. Online anomaly detection using LSTM-based AE on multivariate time series data is explored for Smart Manufacturing in [15]. Additionally, [16] addresses anomaly detection and prevention in modern manufacturing processes by leveraging sensor data. The study focuses on scenarios with distributed time series measurements, employing Vector Autoregressive (VAR) modeling for multivariate time series analysis.
In [17], the challenge of monitoring ongoing degradation in lithium-ion battery production lots is addressed by employing five data-driven methods: regression model with prediction bounds, one-class support vector machine, local outlier factor, Mahalanobis distance, and sequential probability ratio test. Since no single method consistently provides the earliest warning of degradation, the authors propose an ensemble approach. This methodology offers valuable insights for device companies, aiding in warranty, recall, and technical decision-making based on anomalous degradation behavior detected in ongoing reliability testing of battery samples from production lots. Similarly, [18] reviews various state-of-the-art unsupervised anomaly detection techniques for time-series data.
While classical algorithms like One-class SVM and eta One-class SVM are well-known for degradation/anomaly detection, they are not suitable for time-series data. Among traditional unsupervised learning methods, options like AE, LSTM-based AE, ARIMA, ARIMAX, and VAR exist for time-series analysis, but ARIMA is not applicable to multivariate time series like ours. Hence, we opt for the LSTM-based AE to evaluate our approach’s effectiveness in degradation monitoring for continuous processes. Our method offers an additional advantage over traditional approaches in the literature: interpretability for domain experts. This interpretability enables further diagnosis to pinpoint the root cause of degradation in the process, as illustrated by the visualization in Section 4.
2.2. Causal Discovery in Manufacturing Industry
This section explores the application of causal discovery within the manufacturing sector, focusing on fault diagnosis, root cause analysis, quality problem resolution, predictive maintenance, condition monitoring, and anomaly detection. It outlines the diverse range of applications where causal discovery techniques are utilized to improve operational efficiency and product quality.
In [19], a novel method called the Causality-Gated Time Series Transformer (CGTST) is introduced for diagnosing faults in chemical production processes. It tackles challenges like nonlinearity, nonstationarity, and various forms of noise commonly encountered in chemical process data. CGTST utilizes a Transformer-based model to predict time series variables, assessing causal relationships through a specialized causality gate structure. The method employs causal validation and noise reduction techniques to enhance robustness. Through case studies, CGTST demonstrates superior performance compared to traditional causal discovery approaches, showcasing its potential for industrial fault diagnosis in chemical processes. Validation is conducted on three public datasets: a continuous stirred-tank reactor, the Tennessee Eastman process, and a real-world continuous catalytic reforming process. To address the challenge of fault diagnosis in complex Cyber-Physical Production Systems (CPPS) [20] proposes a causality-driven hybrid model represented in a Causal Knowledge Graph (CKG). The CKG acts as a transparent system model for collaborative human-machine fault diagnosis in CPPS, offering a solution to unplanned downtimes. The paper introduces a concept for continuous hybrid learning of the CKG, a maturity model to assess fault diagnosis capabilities, and illustrates the industrial setting in the telescopic die production line motivating the approach.
The study in [21] presents a data-driven framework for root cause analysis in Quality Problem Solving (QPS). This framework utilizes extensive QPS data to uncover large-scale causal relationships between quality problems and production factors. A key component is the creation of a Causal Knowledge Graph for Quality Problems (QPCKG), which represents these causal relationships. The process involves classifying QPS data, extracting cause-and-effect slots using causal linguistic patterns, and employing BiLSTM-CRF (Bidirectional Long-Short-term Memory with Conditional Random Field) for core content extraction. A vertex fusion method integrates discrete causalities into the QPCKG. Validated in a real-world application at BBA, a luxury automotive manufacturer, the QPCKG facilitates quality diagnosis and prediction. It provides insights into the fundamental interaction mechanisms between product quality and production factors, aiding decision-making in root cause analysis (RCA). In discrete manufacturing quality problem solving, [22] proposes a two-stage approach to tackle the complexities of causal relationships. In the first stage, an improved Bayesian network is used to pinpoint likely root causes directly influencing quality indicators. The second stage involves causal inference to estimate the impact of these root causes on the quality indicator. This method enhances the accuracy of root cause identification and allows for quantitative tuning of solutions. The effectiveness of the approach is demonstrated through a case study in aerospace shell parts spinning, showcasing precise root cause identification and determination of intervention degree. To further delve into the field of causal discovery in manufacturing and condition monitoring, a comprehensive review can be found in [23] and [24].
The objectives of the aforementioned research revolve mainly around anomaly detection, fault diagnosis, condition monitoring, or predictive maintenance. Notably, none of them specifically targets the monitoring of degradation in the process using causal discovery. Although some of these studies share a common initial step of performing causal discovery, their ultimate goals diverge, leading to differences from our approach.
2.3. Causal Interpretability
With the advent of data availability, to achieve a higher level of efficiency and operation productivity, the industrial sector increased the adoption of data-driven modeling approaches such as ML [25]. A great amount of state-of-the-art research in ML deals with algorithmic development and increasing complexity to improve model performance. However, having more data and complexity helps to obtain more precise estimates, but cannot ensure correctness and unbiasedness [26]. In industrial settings, especially mission-critical scenarios, adoption challenges occur due to the lack of interpretability of such models. In order to provide insights into the decision-making process of complex ML methods, the field of explainable AI (xAI) attracted the research focus in recent years [27]. While several prominent approaches, such as SHAP, LIME, Anchors, etc., have been introduced, these approaches still deal with the intrinsic associational nature of ML models and do not necessarily provide insight into the actual underlying causal mechanisms. Causality goes beyond statistical dependency and focuses on cause-and-effect relationships. Approaches based on causality analysis have shown to be a promising approach for increasing the interpretability of data-driven methods in general [28].
A recent study [26] provides a good overview of the current state-of-the-art causal interpretability. It provides a classification of existing work in four main categories, i.e., causal inference and model-based interpretation, example-based interpretation, fairness, and guarantee of interoperability. The approaches [29,30,31,32] focus on explaining the causal role of different components of the deep neural network in establishing final predictions by calculating average causal effects or establishing a surrogate structural causal model.
Counterfactual explanations formulate the smallest set of changes to the input data, resulting in a model prediction change to a predefined output. As such, counterfactual explanations have been found to align well with the human reasoning process [28]. In order to generate counterfactual explanations multiple works [33,34] consider approaches based on distance measures and minimizing mean squared error or mean absolute deviations between model predictions and counterfactual outcomes. Several extensions, such as change constraints [35] or leveraging adversarial examples [36], have been proposed to improve the feasibility of proposed counterfactual explanations.
Recent surveys [23,37] highlighted the gaps for future research focusing on utilizing causal graphs as a tool for knowledge extraction, classification, and integration in continuous process improvement. In the following sections, an approach for addressing this gap is described, i.e., an approach that employs causality to establish interpretable causal graphs utilized for monitoring the degradation of a continuous industrial process.
3. Approach
This section describes the methodology used to monitor degradation in a dynamic production process, providing key foundations for a comprehensive understanding of the approach. The schematic overview of the approach used for degradation monitoring is illustrated in Figure 1. The schematic comprises seven stages denoted (Stages a-g).
In Stage (a), domain expertise is incorporated, leveraging knowledge for subsequent analyses such as preprocessing of sensor data, causal discovery, creation of causal graphs, and selection of the reference graph. Additionally, domain experts utilize the output of the approach in the interpretability stage (Stage g) for further analysis or visual inspection of the process. The Sensors Data Acquisition stage (Stage (b)) involves collecting raw data from sensors and other relevant sources to capture the operational dynamics of the production process. The acquired data, typically in the form of unstructured time series data, is then passed to the subsequent stage, Sensors Data Preprocessing (Stage (c)). In this preprocessing stage, guided by domain knowledge, the data undergoes segmentation and resampling.
Subsequently, the process advances to the Causal Discovery stage (Stage d), employing the FCI algorithm (Fast Causal Inference) for causal graph generation. Prior to causal discovery, domain knowledge is leveraged to gather information about the process state (old or new state). The analysis begins from the fresh state of the process, discarding older data.
The FCI algorithm is applied, generating causal graphs for each week (as shown in stage (Stage e)). The creation of these causal graphs incorporates domain knowledge, specifically the principle that present or future events cannot influence past events. Next, a reference graph is needed, either from a domain expert or selected from weekly causal graphs based on expert knowledge, which represents the ideal operating condition/state of the process. This reference graph is then compared to all other weekly causal graphs using Jaccard distance metrics, considering the types of edges between each feature pair. This comparison mechanism is depicted in the Graph Comparison metrics stage (Stage (f)) of the schematic description shown in Figure 1.
Following the computation of Jaccard distance to quantify the dissimilarity between the causal graphs and the reference graph, additional insights such as changes in the causal graph over time can be gleaned through visual examination of these graphs as shown in Figure 1 (Stage g).
3.1. Data Preprocessing
As illustrated in Figure 1 (b), this section outlines the method used to preprocess the raw time series data acquired from the sensors, as depicted in Figure 1 (b). Given that the production process typically comprises multiple phases, such as filtering of good particles and waste particle removal from the fiber, the data is segmented accordingly based on temporal information pertaining to each phase. Following segmentation, the data undergoes resampling and interpolation to ensure uniform sampling frequency. This preprocessing step enhances data consistency and enables smoother subsequent analyses and interpretation. Prior to this preprocessing step, the data may exhibit non-uniform sampling intervals due to factors like shutdowns and maintenance activities, affecting data frequency.
3.2. Preliminary: Causal discovery
Causal discovery (CD) refers to the process of identifying and understanding the causal relationships between variables in a system. The objective is to uncover the cause-and-effect relationships that exist between different factors or variables within a data set or a real-world system [38].
In causal discovery, the emphasis is on inferring causal structures rather than merely identifying associations or correlations. It aims to answer questions such as "What causes what?" or "How do changes in one variable influence another?" The ultimate goal is to reveal the underlying mechanisms that govern the observed phenomena [39].
Based on the type of the data, CD algorithms can be divided into two categories [40]
- CD algorithms for independent and and identically distributed (i.i.d.) data i.e. non-time series data
- CD algorithms for time series data
Causal Discovery algorithms for i.i.d. data: For a dataset to be i.i.d. the following rules must be met [41]:
- Independent: Each observation is not influenced by or dependent on any other observation. The occurrence or value of one data point does not affect the occurrence or value of another.
- Identically Distributed: All observations come from the same probability distribution. This implies that underlying statistical properties, such as mean, variance, and other distributional characteristics, do not change.
These are non-time series data, as time series data points are typically not independent because each observation in a time series is often influenced by and dependent on previous observations. The value of a data point at a given time is often related to its past values. Also time series data often exhibits temporal patterns, trends, and seasonality, making the observations not identically distributed across time. The statistical properties of data points may change over time due to external factors or underlying dynamics [40].
Causal discovery for i.i.d. data relies on statistical and computational methods to infer causal relationships among variables. Among the most popular algorithms in this category are the constraint-based causal discovery algorithms such as the PC algorithm (Peter and Clark) and the FCI (Fast Causal Inference) algorithm. These algorithms identify causal structures by systematically testing conditional independence relationships in the data [40]. However, FCI (Fast Causal Inference) is regarded an enhancement over the PC algorithm (Peter and Clark) in the context of causal discovery tasks. The primary advantage of FCI lies in its ability to effectively handle latent (unobserved) variables or confounders. A confounder is a variable that is correlated with both the cause and the effect, potentially introducing a misleading association between them and distorting the true relationship [42]. As latent variables or the confounders can introduce confounding in causal relationships, therefore FCI algorithm is used for causal discovery as it incorporates techniques to address these confounders, making it more robust in the presence of unobserved variables [2]. The functioning of both PC and FCI can be briefly explained as follows [40]:
- Skeleton Construction: PC algorithm begins by constructing an undirected graph, called the skeleton, based on conditional independence tests.
- Conditional Independence Tests: It tests for conditional independence between variables to identify potential causal relationships.
- V-Structure Identification: It identifies V-structures, indicative of potential causal relationships, in the undirected graph.
- Edge Orientation: PC algorithm orients edges in the graph to form a partially directed acyclic graph (PDAG) by exploiting the identified V-structures.
To address latent confounders, FCI requires a substantially higher number of conditional independence tests compared to PC. In the worst-case scenario, this requirement escalates exponentially with the number of features present in the data [40].
Causal Discovery algorithm for time series data: Among the most popular causal discovery algorithms for time series data are the tsFCI and PCMCI algorithm. The time series Fast Causal Inference (tsFCI) algorithm, adapted from the Fast Causal Inference (FCI) algorithm for non-temporal variables, is designed to infer causal relationships from time series data. It operates in two distinct phases: (i) an adjacency phase and (ii) an orientation phase. Leveraging temporal priority and consistency across time, it employs these phases to orient edges and constrain conditioning sets. The tsFCI algorithm yields a window causal graph, offering the advantage of detecting lagged hidden confounders. However, it comes with limitations, as it is unable to model cyclic contemporaneous causation and instantaneous relationships [40]. However, in the viscose fiber production process described in Section 4, the process consists of a cyclic behavior that involves two phases, namely the rejection and the filtration phases. Also, as described in Section 4.2, the data is a multivariate time series, thus having an instantaneous relationship between the features/ variables. Due to these limitations of the tsFCI algorithm, it was not employed in our analysis.
Next is the PCMCI algorithm which is designed for large-scale time series data, addressing challenges encountered when adding more variables. In such datasets, there’s a risk of reduced power in causal analysis, potentially resulting in overlooked original causal relationships. PCMCI addresses this issue by employing a two-stage approach. First, it selects relevant conditions using a variant of the PC algorithm, known as PC1, to remove irrelevant variables. Then, in the second stage, it utilizes the momentary conditional independence (MCI) test to mitigate false positive rates, even in highly correlated data. Whether two variables are independent given their parent sets is evaluated in the second stage i.e., by the MCI test. This is mathematically formulated as follows [40]:
where is variable at time instant , is variable at time instant t, and are their parents respectively [40]. PCMCI assumes stationarity, time-lagged dependencies, and causal sufficiency in the data. It typically outperforms the PC algorithm even when stationarity is violated. However, it is not suitable for highly predictable systems with minimal new information at each time step. In real-world datasets, variables often exhibit varying degrees of influence, with some exerting more impact than others. Given that degradation typically manifests as a gradual change rather than a sudden one, the differences between variables may not be substantial, resulting in minimal new information at each time step. Consequently, PCMCI may not be the optimal choice for our dataset. As a result, we did not employ PCMCI in our case study.
Adapting the Causal Discovery method (FCI): Recognizing the constraints of PC, FCI, tsFCI, and PCMCI, we made an adaptation to utilize the FCI algorithm for time series data in our analysis. Typically designed for i.i.d. data, FCI needed modification to accommodate the time-dependent characteristics of our dataset. This adaptation involved augmenting the features with lag values for each feature, enabling FCI to effectively handle the temporal nature of the data. In this context, a lag signifies the time delay between consecutive observations, providing insight into the temporal relationship between a variable and its past values. This approach allowed for the incorporation of additional temporal information, enhancing the applicability of the FCI algorithm to time series data in our analysis.
In summary, the adapted version of FCI follows the following steps:
- Initial Setup: Begin with a set of variables or characteristics. This is given as , where X, Y, Z, A, and B are the column vectors representing the variables or features in the data.
- Data Modification: Modify the data to include lagged versions of the features to capture temporal dependencies. This is given as , representing data with lagged versions of the original features up to 40 lags as additional features.
- Graph Formation: Create a complete undirected graph using the variables as vertices.
- Iterative Process: Test pairs of variables for conditional independence given subsets of other variables. Remove edges between variables that are conditionally independent.
- Graph Orientation: Orient edges based on certain criteria, such as the absence of direct causal influence between certain pairs of variables.
- Edge Removal: Further refine the graph by removing edges between pairs of variables that are d-separated given subsets of other variables.
3.3. Similarity measures
Similarity, in the context of causal graphs, refers to the degree of closeness or agreement between two compared entities [43]. In the field of causal discovery, similarity measures serve as quantitative metrics to evaluate the resemblance of structures between different causal graphs, indicating the level of agreement in identified causal relationships. Various similarity measures, such as the Jaccard similarity score, the Sorensen index [44], the Structural Hamming distance and the Structural Intervention distance [45], are discussed in the literature [43].
Given that the FCI algorithm produces various types of edges, as depicted in Figure 2, the Jaccard similarity score is chosen as metric. This score measures the similarity of the sets of edges or connections between two graphs by calculating their intersection in relation to the total number of edges [44]. Since the Jaccard similarity score quantifies the degree of similarity between two graphs, a score of 0 indicates complete dissimilarity, while a score of 1 signifies that the two graphs are identical. The Jaccard similarity score was used to determine the reference graph needed to represent the dynamics of the process during ideal/ normal operating conditions. However, in the context of degradation monitoring in the viscose fiber production process, described in Section 4, the Jaccard distance, a measure of dissimilarity, is used instead of the Jaccard similarity. This decision is motivated by the need to assess how much the dynamics of the production process has changed since the initial state when all components, including sensors and motors, were in fresh condition. Complementing the Jaccard similarity score, a Jaccard distance of 0 signifies identical graphs, while a value of 1 indicates significant dissimilarity between the graphs.
Algorithm Below depicts the pseudo-code for computing the Jaccard similarity score and the Jaccard distance, together with an explanation of how it is applied to evaluate the similarity and dissimilarity between two causal graphs generated by our modified FCI algorithm. Additionally, a graphical representation illustrating the computation of the Jaccard similarity score and Jaccard distance is shown in Figure 3. In Figure 3 (a) and (b), two causal graphs to be compared are shown. Upon examining these graphs, it can be observed that only two edges are common, by taking into account the direction or type of the edge. These common or intersecting edges are depicted in Figure 3 (c), while the union of the two causal graphs (a) and (b) is illustrated in Figure 3 (d). According to [47], the Jaccard similarity score is calculated as the ratio of the length of the intersection graph (i.e., 2) to the length of the union graph (i.e., 6). And Jaccard distance which measures the dissimilarity between the two graphs is just complement of Jaccard similarity score. Therefore, , and .
| Algorithm 1 Jaccard similarity and Jaccard distance Calculation [47] |
|
By tracking fluctuations in the Jaccard distance between causal graphs over preceding time periods compared to the reference graph, domain experts can detect deviations from the optimal operational state. They discern significant deviations using a predefined threshold value, established based on their process knowledge. When the Jaccard distance exceeds this threshold, experts investigate process dynamics changes using the causal graph. Analyzing the causal graph associated with notable Jaccard distance shifts enables experts to identify alterations and comprehend their consequences. This approach empowers domain experts to take informed corrective actions to restore the production process to normal conditions. By making process dynamics understandable, this method offers valuable insights, enabling proactive decision-making.
4. Case Study
4.1. Process Description
The objective of the study is to investigate the applicability of causal discovery methods to monitor and detect deterioration in viscose fiber production. While this procedure consists of multiple steps, we focus on the most crucial one in terms of quality outcomes, the removal of particles in fluid viscose by filtration. A dedicated machinery is used for the filtration, cf. Figure 4. Due to the natural base of the viscose fluid and the molecular chaining that goes with it the particles can apply on the sieve used for the filtration. Thus the filtration process outcome deteriorates and requires regular washing, i.e., by a process called rejection. Eventually the sieve needs to be replaced after continuous usage for several months to ensure high quality outcomes. Denote that, an individual filtration machines, is just a single part of a parallel operation, because even though individual machines may deteriorate or even malfunction, the overall operation needs to be working, so that the following production steps can operate continuously.
Filtration Machine: Filtration and Rejection Phase
In order to conduct filtration, the dedicated machinery (cf. Figure 4) operates on a mechanical principle, the fluid viscose is pushed by the pressure of the fluid through the sieve. Unwanted particles will not pass through the fine-grained sieve while fluid viscose will pass. As the filtered particles will over time block the sieve, the machine includes a back-washing operation mode, essentially reversing filtration direction and thus removing particles attached to the sieve and disposing them in a dedicated pipe system. Denote that most of the time the machine operates in filtration mode, i.e., the filtration phase, however based on reaching a dedicated differential pressure or the passing of time, the system triggers the reject mode, i.e., the rejection phase. The rejection unit (2) move from one side of the machine to the other. Along the crack within the rejection unit (3) the machine reverses the fluid direction sucking material in, which is opposed to the filtration direction which is pushing fluid inside-out. Denote that a dedicated seal (4) separates filtration and reject operation, in order to avoid high amounts of material being wasted. As seen in Figure 5 the two phases produce very different shapes of signals and are thus independently analyzed in our causal discovery approach.
4.2. Data description
The data we used for our analysis contains the multivariate time series, as depicted in Figure 5 and described in Table 1. In includes high frequent data (i.e. at 11.76 Hz) but also very low frequent data like the control signals for the process (i.e., at 0.0012 Hz). The data was thus resampled to 10 Hz either by interpolation (i.e., all values in Figure 5) or forward fill (command signals like start and stop of rejection process).
In Table 1 the range of sensor values along with the median value instead of the mean is presented, as sensor values are strongly affected by filtration and rejection processes. In general, the operation principle of the process is to keep the pressure values and the amount filtered rather stable, cf. Figure 5 and within the boundaries. For pressure, this is to avoid damage to the machine or any other component used. For the filtered amount, this is to keep downstream tasks continuously operating. Denote that during the reject phase, i.e., were either the machine moves the reject unit from left to right or right to left (as seen by in Figure 5), pronounced peeks in motor current draw () or reject amount () are visible and the filtered amount () drop slightly. Naturally, also the pressure values are slightly affected during and slightly after the reject phase, a small dent in , and pressure difference and a small rise in (reject pressure). The typical reject phase takes 40 seconds in length but can be delayed if the reject unit moves slower then anticipated, e.g., because of mechanical factors, e.g., condition of the motor. In Figure 5, during filtration due to more and more material blocking the sieve, the p1-pressure rises slightly, requiring a reject phase to been within optimal operating conditions. As already mentioned the sieve deteriorates due to the chemical and mechanical process, and thus impact of the rejection phase also deteriorates. That in turn requires that the sieve inside the machine is changed regularly after several months of continuous usage. Therefore, the analysis considers a whole sieve life-cycle, i.e., it starts right after the sieve changed until 5 months afterwards, i.e., where they are typically changed again.
4.3. Degradation Monitoring
This section provides an overview of the methodology and approach utilized to monitor degradation in the viscose fiber production process as described in Section 4.2. Figure 1 illustrates the approach employed for monitoring the degradation of the process over time.
As previously discussed in Section 4.1, the production process comprises two distinct phases: the filtration and the rejection phases. The duration of the rejection cycle remained constant at for each filter group which was used for further analysis. However, the duration of the filtration cycle exhibited variability based on factors such as the sieve’s condition (whether it was new or old), amount of material blocking the sieve, the differential pressure etc. as already discussed in Section 4.1. To accommodate this variability, the average duration of the filtration cycle over one month following a sieve change was computed. The calculated average duration was found to be and was used for further analysis. This information was needed for incorporating lags per feature as additional features within the dataset to obtain the causal graphs and is described below.
Sensors Data Preprocessing: The data obtained from the sensors, depicted in Figure 6, undergo pre-processing steps, as visualized in Figure 7. Firstly the dataset was divided into two phases based on the respective times of filtration and rejection, as shown in the Data Segmentation part of Figure 7.
To address the irregular sampling frequency inherent in the rejection and filtration phases, we used data resampling techniques, as depicted in Figure 7. Specifically, the rejection phase data underwent resampling at a rate of 1 second, while the filtration phase data was resampled at a rate of 7 seconds. These resampling rates were determined based on recommendations from domain experts, ensuring alignment with the desired precision level for the analysis, particularly concerning the dynamic behavior of the process. This selection reflects the understanding that the dynamics of the process in the rejection phase exhibit faster variations compared to those in the filtration phase. For the sake of readability, here we focus on the rejection phase and the results for the filtration phase can be found in Appendix.
Causal Discovery: At a frequency of , the rejection group data was obtained after completing the preprocessing step. Subsequently, this data was partitioned on a monthly basis, further dividing each month into four distinct weeks as shown in Figure 8. This segmentation strategy was implemented to facilitate the monitoring of degradation in the viscose fiber production process on a weekly basis. The decision to operate on a weekly frequency was motivated by the computational cost and time-consuming nature of causal graph computation. The computation complexity of the causal graphs using FCI is discussed below. Daily monitoring was deemed impractical, while monthly intervals were considered too infrequent, risking potential losses in the efficiency of the entire viscose fiber production system. As a result, the weekly basis provided a balanced and effective approach for a timely degradation assessment.
To monitor deterioration, the dataset described in Section 4.2 and Table 1, comprising 7 features, was utilized. Furthermore, 40 lags per feature were included as additional features, where a lag represents the time delay between consecutive observations, indicating the temporal relationship between a variable and its past values as described in Section 3.2. To adapt FCI for time series data, additional features in the form of lags were introduced as described in Section 3.2. These lags serve as supplementary variables, facilitating the integration of temporal information into the causal discovery process. This modification allows FCI to account for the temporal dependencies present in time series data and uncover causal relationships that extend across different time points. The choice of the number of lags was influenced by the total duration of the rejection phase (), along with its respective sampling frequencies (), to ensure coverage of the entire duration of the rejection phase in the construction of the corresponding causal graphs. To ensure comparability between results for the rejection and filtration phases, domain experts recommended using the same number of lags for both phases. Consequently, by considering a total lag of 40 and a sampling frequency of 7 seconds, we covered almost the entire duration of the filtration phase (approximately ) in constructing the corresponding causal graphs. This harmonization of lag features enables consistent analysis across both phases of the production process.
Therefore, the total number of features required to construct causal graphs for both the rejection and filtration phases amounted to features for each time point. With such a large number of features (287) per causal graph, and also considering the computational complexity of FCI, only two days of data were considered to represent the entire week. Each week, we used data from the first two successive complete days to create causal graphs for both the rejection and filtration phases. This resulted in around 19,000 samples with 287 features each. Constructing these graphs with FCI took approximately 6 hours. During the creation of causal graphs using the FCI causal discovery method, domain knowledge emphasizing the principle that future or present events cannot influence past events was incorporated. This integration ensured that the causal graphs accurately reflected the causal relationships inherent in the dynamic production process.
Causal Graphs and Reference Causal Graph: With the approach mentioned above, a total of 19 causal graphs were generated, each representing a specific week of each month from August (after the sieve was changed) to December 2022 as shown in the Causal Graphs Stage in Figure 9.
To effectively monitor the degradation of the process over time, a reference graph was pivotal. This reference graph would represent the normal operating scenario when the system functions as expected by the domain experts. The selection of such a reference graph is crucial for an accurate comparison of the graphs generated for consecutive weeks.
The criteria for choosing the reference graph involved selecting a graph that is close to the date when the sieve was changed and exhibits similarity to other causal graphs for the remaining weeks and months. The similarity between the graphs was quantified using the Jaccard similarity explained in Section 3.3, where a score of 0 indicates complete dissimilarity, and a score of 1 signifies identical graphs. The Jaccard similarity score was calculated while considering the direction of the edges between features, as FCI generates different types of edges as shown in Figure 2.
A heatmap depicting the Jaccard similarity score for different combinations of reference graphs during the rejection phase is presented on the left-hand side of Figure 10. This figure illustrates the computation of Jaccard similarity scores for various combinations of graphs used as reference graphs. The iterative process entails selecting one graph from all causal graphs as a reference and evaluating its similarity against all other graphs to identify the one exhibiting the highest resemblance to the others. In particular, this comparison excludes self-referencing (i.e., a graph is not compared against itself), and comparisons with graphs occurring before the reference, are excluded to focus solely on monitoring degradation from the optimal state. Consequently, the heatmap is configured with only entries, where , corresponding to the total number of causal graphs.
On the right side of Figure 10, boxplots depict the distribution of Jaccard similarity scores when individual graphs are considered as the reference and compared with others. The choice of the reference graph aims to find one close to the date of the sieve change with a higher median and lower variance in Jaccard similarity scores, as shown in the right-hand side of Figure 10. This selection process is crucial as the reference graph should represent the ideal operating condition and be highly similar to other graphs, given that degradation is a gradual process. A higher median ensures greater similarity between the reference graph and others, reflecting the desired operational state. Meanwhile, lower variance indicates less significant variation among graphs, aligning with the gradual nature of degradation.
Among the examined boxplots, the graph from 09-11th August 2022, highlighted in purple, demonstrates the highest median and proximity to the sieve change date. Although the graph from 14-16 August 2022 also aligns closely with the sieve change date and exhibits similar variance in Jaccard similarity scores, it possesses a lower median compared to the one from 09-11 August. Consequently, the graph from 09-11 August was selected as the reference for further analysis. This decision ensures that the chosen reference graph effectively captures the optimal operating condition while maintaining consistency with the observed data dynamics.
Graph comparison: Once the reference graph was chosen, a comparative analysis was conducted with graphs over preceding time intervals using Jaccard distance, as illustrated in Graph Comparison Stage in Figure 9. The selection of the Jaccard distance as the comparison measure, instead of the Jaccard similarity score, was driven by the need to quantify the differences in causal graphs over time, as detailed in Section 3.3. These differences in causal graphs stem from variations in the dynamics of the sieve due to its degradation or deterioration during its operational span. Figure 11 visually presents the comparison between causal graphs and the reference graph (chosen to be the one on 09-11th August) using Jaccard distance for the rejection phase. Given the dynamic nature of the process, susceptible to variations over time, a trend analysis was performed after computing the Jaccard difference score to monitor degradation in the production process. The observed positive trend indicates an increase in degradation over time following the change in the sieve.
Interpretability: Our approach not only facilitates the continuous monitoring of degradation in the viscose fiber production process but also empowers domain experts to integrate their knowledge into the creation and interpretation of causal graphs. As shown in Figure 12, this section focuses on interpreting the observed variations in the dynamics of the production process during degradation monitoring, employing two distinct methods.
Visual Inspection of Causal Graphs for Root Cause Analysis: The initial method involves visually examining causal graphs to discern changes at specific time points. By setting a degradation threshold for the Jaccard distance, as demonstrated in Figure 11, domain experts can scrutinize changes and analyze the causal graph of the ongoing production process.
For example, considering the maximum Jaccard distance on 01-03 October from Figure 11, a comparison between the causal graphs for the reference graph (09-11 August) and this date (01-03 October) is performed. Figure 13 (a) and (c) showcase the aggregate causal graphs for the reference graph (09-11 August) and 01-03 October, respectively. The complete causal graph is inherently dense, featuring 40 lags per feature. Due to the repetition of edges between feature pairs over time, the simplified causal graph is presented to emphasize connections between features over a single lag. The edge connectivity between feature pairs or nodes repeats as the graph unfolds in time, and thus, only the unique patterns are illustrated in Figure 13 (a) and (c).
Upon thorough analysis, several notable changes emerge, particularly evident in the causal graph on 01-03 October depicted in Figure 13(c) compared to the reference graph on 09-11 August shown in Figure 13(a). One significant observation is the introduction of latent confounders in the causal graph on 01-03 October, absent in the reference graph. An in-depth examination of the subset graph for both dates, focusing on features p1 and pdiff in Figure 13(b) and (d), reveals the emergence of a latent confounder influencing their relationship in the causal graph on 01-03 October, whereas it was absent in the reference causal graph on 09-11 August. This relationship holds crucial significance as it triggers the initiation of the rejection and filtration phases, making the introduction of a latent confounder a critical observation.
The differential pressure (pdiff) signifies the disparity between the input pressure (p1) and the constant output pressure (p2). Thus, variations in p1 directly impact pdiff, given the constant nature of p2. When pdiff exceeds a certain threshold, rejection initiates; otherwise, filtration continues. However, the introduction of a latent confounder enables false switching between the rejection and filtration phases, impacting output quality in multiple ways. Firstly, an increased number of filtrations and fewer rejections may indicate insufficient space within the sieve for new waste particles, leading to clogging and reducing the lifespan of the sieve and degradaing the output quality. Alternatively, excessive rejections may result in more frequent motor contact with the sieve during cleaning or backwashing, accelerating mechanical degradation and shortening the sieve’s lifespan, subsequently diminishing output quality. This observation underscores the importance of identifying and addressing latent confounders to maintain process integrity and ensure optimal output quality.
Further examination shows a delayed connection between p1 and pdiff in the reference graph (Figure 13 (b)) that is absent in the causal graph for 01-03 October (Figure 13 (d)). Visual inspection thus provides domain experts with valuable insights into changes in feature relationships, thereby providing a basis or an initial point for the future analysis.
The latent confounders not only exist between features p1 and pdiff but also extend to include the features p1 and p2. Additionally, new connections emerge in the causal graph for 01-03 October, as depicted in Figure 13 (c), which are not present in the reference causal graph shown in Figure 13 (a). This comprehensive analysis provides domain experts with a more profound insight into the evolving dynamics of the process.
Monitoring Changes in Feature Relations Over Time: The second approach involves monitoring changes in the relationship between specific pairs of desired features over time. As previously mentioned, the connections between features p1 and pdiff play a crucial role in initiating the rejection and filtration phases. Therefore, observing the dynamics of these features over time can provide valuable insights before a significant event occurs.
The proposed visualization in Figure 14 provides an insightful depiction of the monitoring process over time. Notably, between 09-11 August and 07-09 September, no confounders or latent variables are observed between features p1 and pdiff, as indicated in the corresponding heatmaps. However, a crucial development occurs from 14-16 September, highlighted in orange on the heatmaps, signaling the appearance of latent confounders in the causal graph. This identification empowers domain experts with the knowledge of when these confounders emerged, enabling focused root cause analysis during this timeframe to discern the underlying causes of such occurrences. Armed with this information, experts can strategize how to maintain process dynamics to meet required specifications.
Moreover, the visualization serves to highlight any new connections or confounders compared to previous causal graphs. This functionality allows domain experts to swiftly detect irregularities in process dynamics while considering the ideal operating scenario derived from the reference causal graph. By leveraging this visualization, experts can proactively address deviations from optimal process conditions, ensuring consistent performance and quality output.
Upon examination of Figure 14, a noticeable trend emerges wherein potential confounders appear to proliferate over time. This trend underscores the significance of ongoing monitoring, enabling domain experts to discern abnormal behavior and initiate deeper investigations. By dynamically tracking these changes, valuable insights into the evolving relationships between features are gleaned, facilitating the early detection of anomalies or shifts in the production process dynamics. The inherent advantage of leveraging causal graphs lies in providing domain experts with targeted insights: from these heatmaps, experts discern which causal graph to scrutinize, subsequently gaining clarity on the underlying reasons for observed changes and informing their investigative focus to uphold output quality standards.
5. Evaluation
We conducted an offline evaluation to assess the effectiveness of our degradation monitoring method. In this evaluation, we utilized an LSTM-based Autoencoder, employing it to monitor degradation in the process. The idea behind using an LSTM-based Autoencoder (AE) for anomaly detection is to take advantage of the capability of LSTMs to capture temporal dependencies (as we are dealing with time series data). LSTMs, or long-short-term memory networks, are a type of recurrent neural network (RNN) that is well suited for modeling sequences. In contrast to our method, LSTM-based algorithm cannot be considered to be interpretable. The method follows the same principles as outlined by [14] and described in Section 2.1. However, a distinctive feature of our evaluation is the setting of the threshold to the 99 percentile of the mean absolute error of the training error, as elucidated in Section 5.1. The determination of this threshold was guided by insights from domain experts.
5.1. Procedure and Results
During the training phase, the LSTM-based Autoencoder is exposed to sequences of data collected during normal operating conditions. The model learns to reconstruct or predict the input sequences. The autoencoder consists of an encoder with 2 LSTM layers that compresses the input data into a latent/ hidden space representation and a decoder that reconstructs the input data from this representation.
The LSTM-based autoencoder was trained on normal data, specifically the same dataset used to construct the reference graph described in Section 4.3, which corresponds to the data from 09-11 August. This training was designed to teach the model the typical patterns, structures, and dependencies present during regular operation, allowing it to capture the inherent regularities and variations in normal sequences. During training, of the data was reserved for validation and the model underwent 100 training epochs. The data set used for training consisted of approximately data samples, with 950 samples reserved for validation. The remaining samples were used for training.
The evaluation utilized test data comprising consecutive weeks from August 2022 to December 2022, excluding the data utilized for constructing the reference graph (09-11 August). This test data set consisted of complete data for consecutive weeks, amounting to approximately data samples.Using the identical dataset for both training and testing with the LSTM-based autoencoder, just as with our approach, ensured a fair comparison between the two methods for monitoring degradation.
After training the model, anomalies are typically detected by setting a threshold on a reconstruction error metric. The reconstruction error is calculated by comparing the input sequence with its reconstructed version. In this case, the loss function used was the mean absolute error and the threshold was set to 99 percentile of the mean absolute error of the training error. This threshold was set based on the knowledge from the domain expert. Figure 15 shows the distribution of the reconstruction loss of the model over the training data set with 99 percentile set as a threshold for anomalies in the test data. When the reconstruction error on the test data surpassed this threshold, it indicates an anomaly.
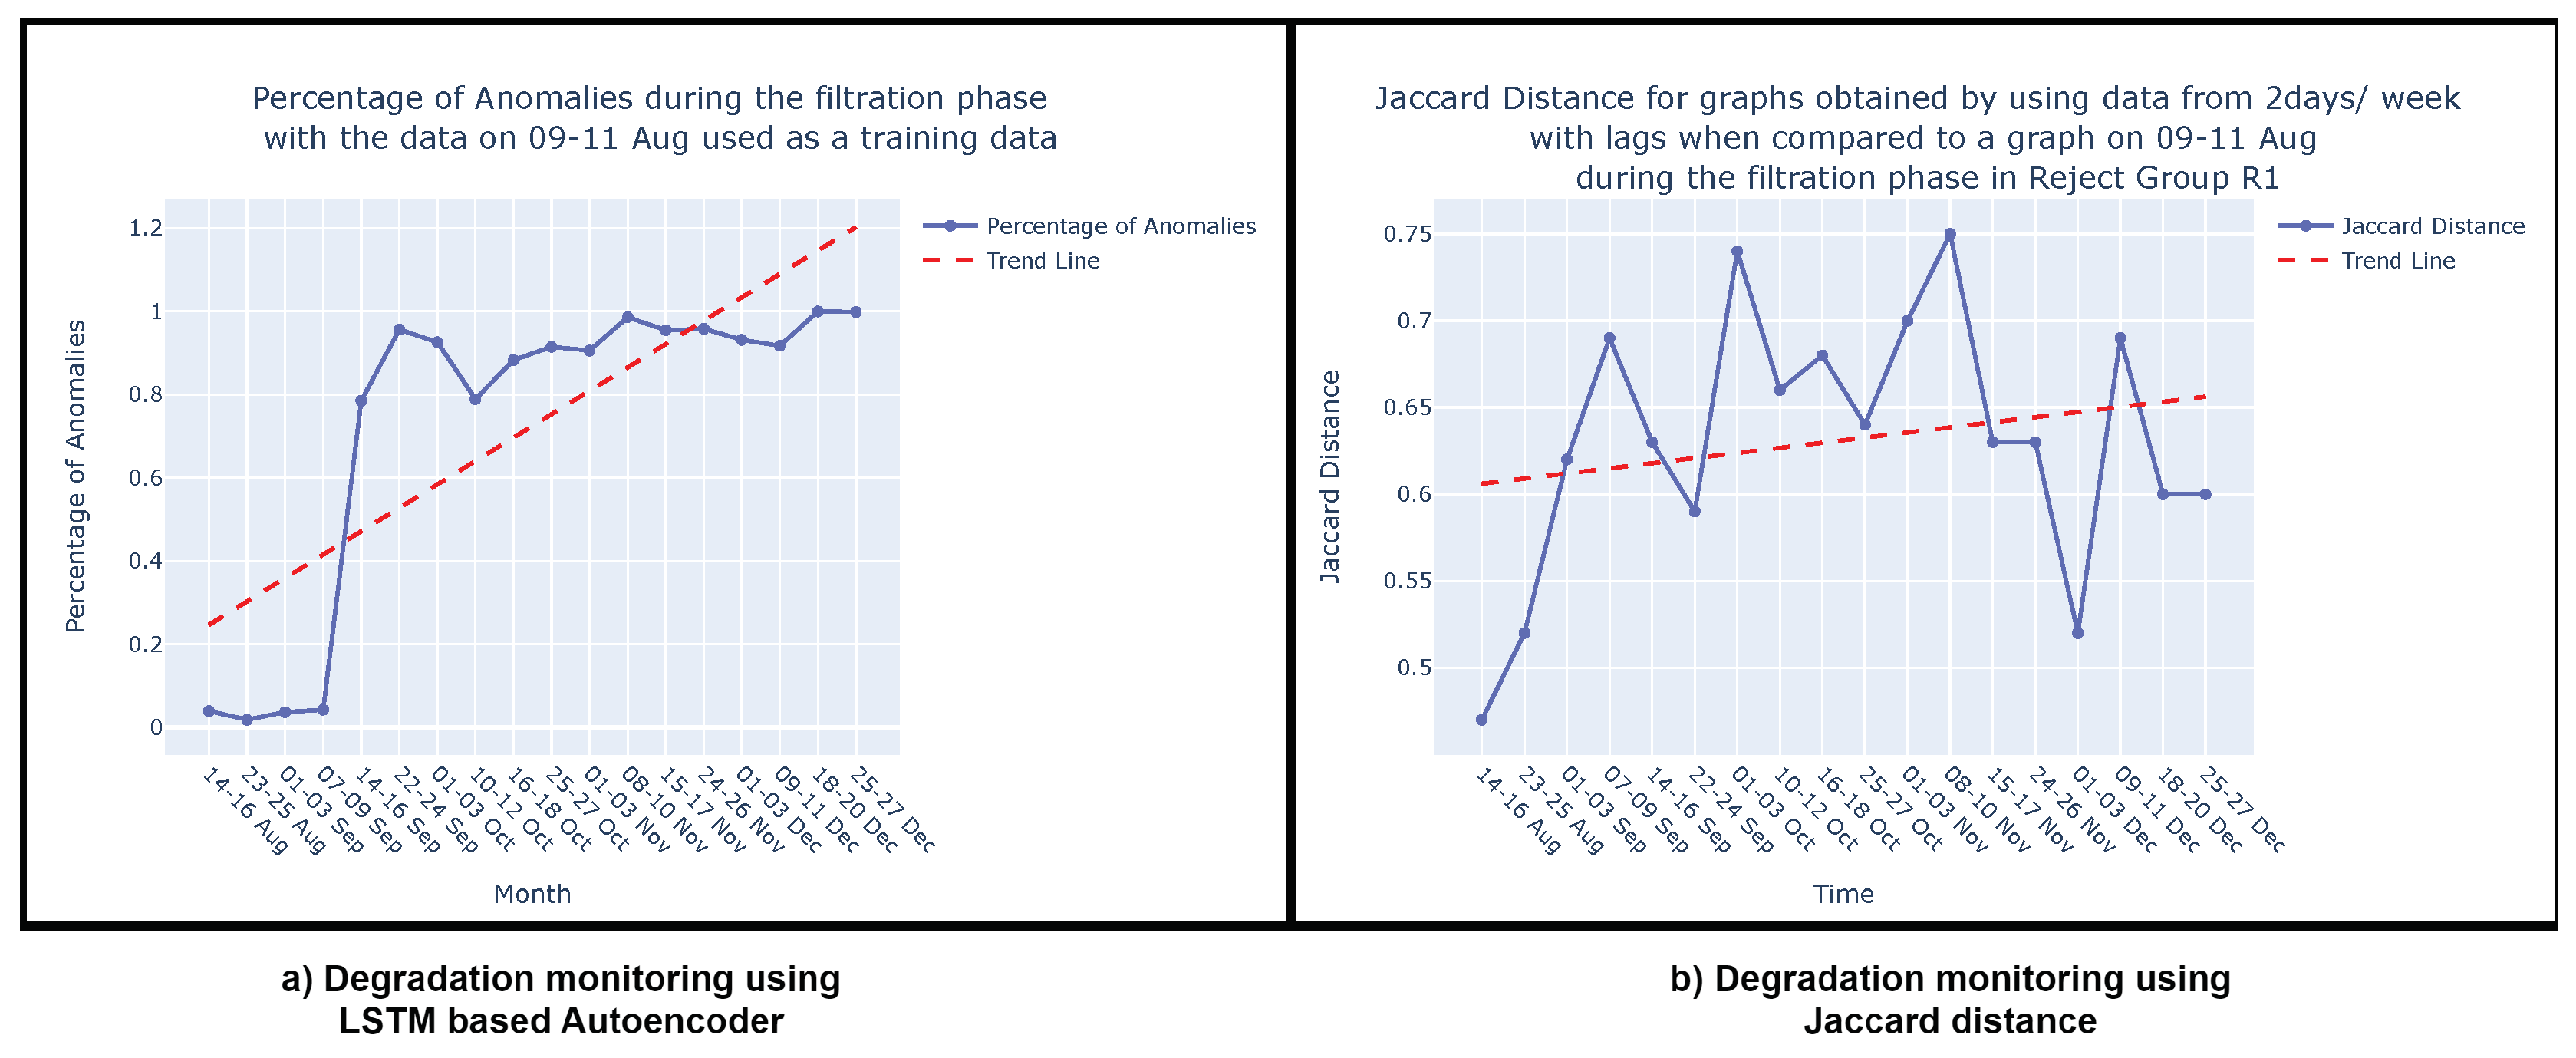
Once the model is trained, it can be applied during the testing or deployment phase to predict or reconstruct new sequences. Anomalies or deviations from normal patterns are identified when the model struggles to accurately reconstruct or predict the input sequence. In Figure 17 (a), the percentage of anomalies in the total test data during the rejection phase is depicted, along with a trend analysis. As discussed in Section 4.3, the dynamic nature of the process, susceptible to variations over time, leads to fluctuations in the percentage of anomalies, similar to the variability observed in the Jaccard distance (Section 4.3, Figure 17 (b)). Consequently, a trend analysis for the LSTM-based AE approach was also conducted to discern the percentage of anomalies over time. The trend line reveals an increasing percentage of anomalies from August to December, indicating degradation in the sieve. These findings corroborate the results discussed in Section 4.3 and are visually depicted in Figure 17 (b). It’s important to note that this comparison focuses solely on the shape of the trend lines—whether they vary positively or negatively—and does not involve comparing the slope of the trends. Both methods demonstrate the ability to monitor degradation in the viscose fiber production process, as is evident in Figure 17 (a) and Figure 17 (b).
When comparing our method with LSTM-based AE, we prioritize assessing the overall shape of the trend rather than directly comparing specific degradation rates or anomaly percentages. While the LSTM-based AE focuses on detecting percentage of anomalies over time, we analyze deviations in process behavior by comparing causal graphs using the Jaccard distance. This difference in approach makes direct comparison challenging. However, both methods exhibit a positive trend, indicating increased degradation over time in the viscose fiber production process.
Figure 18.
Percentage of anomalies over the period of time in the filtration phase.
5.2. Discussion
Our study demonstrates the effectiveness of the described methodology. When comparing our approach with state-of-the-art techniques like LSTM-based autoencoders, we confirm the reliability and accuracy of our method. Notably, our analysis does not aim to directly compare the precise degradation rates measured by the Jaccard distance with the percentage of anomalies detected by the LSTM-based AE. Instead, we focus on the overall trend shape, whether it shows a positive or negative trajectory. This alignment of results with established methods serves as robust validation of our proposed methodology, affirming its relevance and efficacy in handling the complexities of dynamic production processes.
It’s important to note that while training the LSTM-based AE with only data samples and validating with about 950 samples may seem limited, maintaining consistency with the dataset used for our approach ensures a fair comparison. This also clarifies why we refrain from directly comparing the slope of the trend analysis between the LSTM-based AE and our approach using the Jaccard distance.
Furthermore, in monitoring degradation using the LSTM-based AE, we focus on detecting the percentage of anomalies in the data over time, under the assumption that this percentage would increase as degradation progresses. In contrast, our approach determines deviations in process behavior over time from the ideal operating behavior by comparing causal graphs using the Jaccard distance. Here, we anticipate that the Jaccard distance would increase on average due to degradation, indicating a degradation in the process.
Therefore, while both approaches monitor degradation in the viscose fiber production process, the underlying methodologies used to monitor degradation differ. Thus, direct comparison of the results of both approaches is challenging. However, the positive trend observed in both methods suggests an increasing degradation over time.
6. Conclusion and Future Scope
In conclusion, the application of degradation monitoring in the context of a highly dynamic production process, exemplified by viscose fiber production in our case study, has demonstrated to be a valuable strategy to maintain operational efficiency and ensure product quality. The use of causal discovery methods has added a layer of interpretability to the monitoring process, allowing domain experts to incorporate background knowledge and investigate changes in causal relationships over time. The two-fold advantage of causal discovery, enabling the integration of expert knowledge and facilitating interpretable changes in causal relationships, has enabled domain experts to not only monitor degradation, but also delve into the root causes of variations. This, in turn, forms the basis for further investigations, including root cause analysis and counterfactual reasoning.
As manufacturing industries continue to evolve, the need for robust and interpretable degradation monitoring becomes increasingly critical. This study contributes to the growing body of knowledge in this area, offering insights and methodologies that can be adapted to diverse manufacturing scenarios. Future research can explore the extension of these methods to other production environments and the refinement of causal discovery techniques for even more nuanced insights. In summary, the integration of causal discovery with Jaccard distance in degradation monitoring provides a pathway towards proactive maintenance, improved process stability, and a deeper understanding of the dynamic interplay of factors influencing production quality and efficiency. In a dynamic production process, degradation can stem from various sources. The wear and tear of motors during contact with the sieve while rejecting or backwashing the filtered material, material clogging in the aging sieve, and the mechanical degradation of components collectively contribute to overall degradation and impact fiber quality.
In future work, understanding the specific causes of degradation becomes crucial, necessitating root cause analysis to pinpoint and replace defective components. Integrating this with conditional monitoring, where predefined criteria (e.g., Jaccard distance in our approach) exceeding a threshold trigger root cause analysis, ensures timely intervention to enhance fiber quality. Mechanical degradation, inherent in the aging of components such as sensors and sieves, underscores the importance of counterfactual reasoning. This approach provides insights into how alterations in specific variables might influence outcomes under varying conditions. This understanding facilitates proactive decision making and risk mitigation, ultimately improving fiber quality.
Author Contributions
Conceptualization, A.C. M.V., B.M., and R.K.; methodology, A.C. M.V., B.M., and R.K.; validation, A.C. M.V., B.M., and M.H.; investigation, A.C. M.V., B.M., and M.H.; writing—original draft preparation, A.C. M.V., B.M., R.K; writing—review and editing, A.C. M.V., B.M., M.H. and R.K.; visualization, A.C.; supervision, B.M, and R.K. All authors have read and agreed to the published version of the manuscript.
Funding
This work has been supported by Project REWAI - Reducing Energy and Waste using AI (FFG, Contract No. 892233) and Pro²Future (FFG, Contract No. 881844): "Pro²Future is funded within the Austrian COMET Program Competence Centers for Excellent Technologies under the auspices of the Austrian Federal Ministry for Climate Action, Environment, Energy, Mobility, Innovation and Technology, the Austrian Federal Ministry for Digital and Economic Affairs and of the Provinces of Upper Austria and Styria. COMET is managed by the Austrian Research Promotion Agency FFG."
Acknowledgments
The authors acknowledge the financial support to the REWAI project, FFG and Pro2Future GmbH.
Conflicts of Interest
The authors declare no conflict of interest. The funders had no role in the design of the study; in the collection, analyses, or interpretation of data; in the writing of the manuscript, or in the decision to publish the results.
Appendix A. Degradation Monitoring- Filtration phase
This appendix presents the outcomes of monitoring the degradation in the filtration phase. It’s important to note that the data utilized for the rejection and filtration phases corresponds to the same dates, as outlined in Section 4.3. However, the data for the filtration and rejection phases has been segregated based on the respective times when filtration and rejection were active, as detailed in Section 4.3.
Appendix A.1. Causal Graphs and Reference Causal Graph for filtration phase
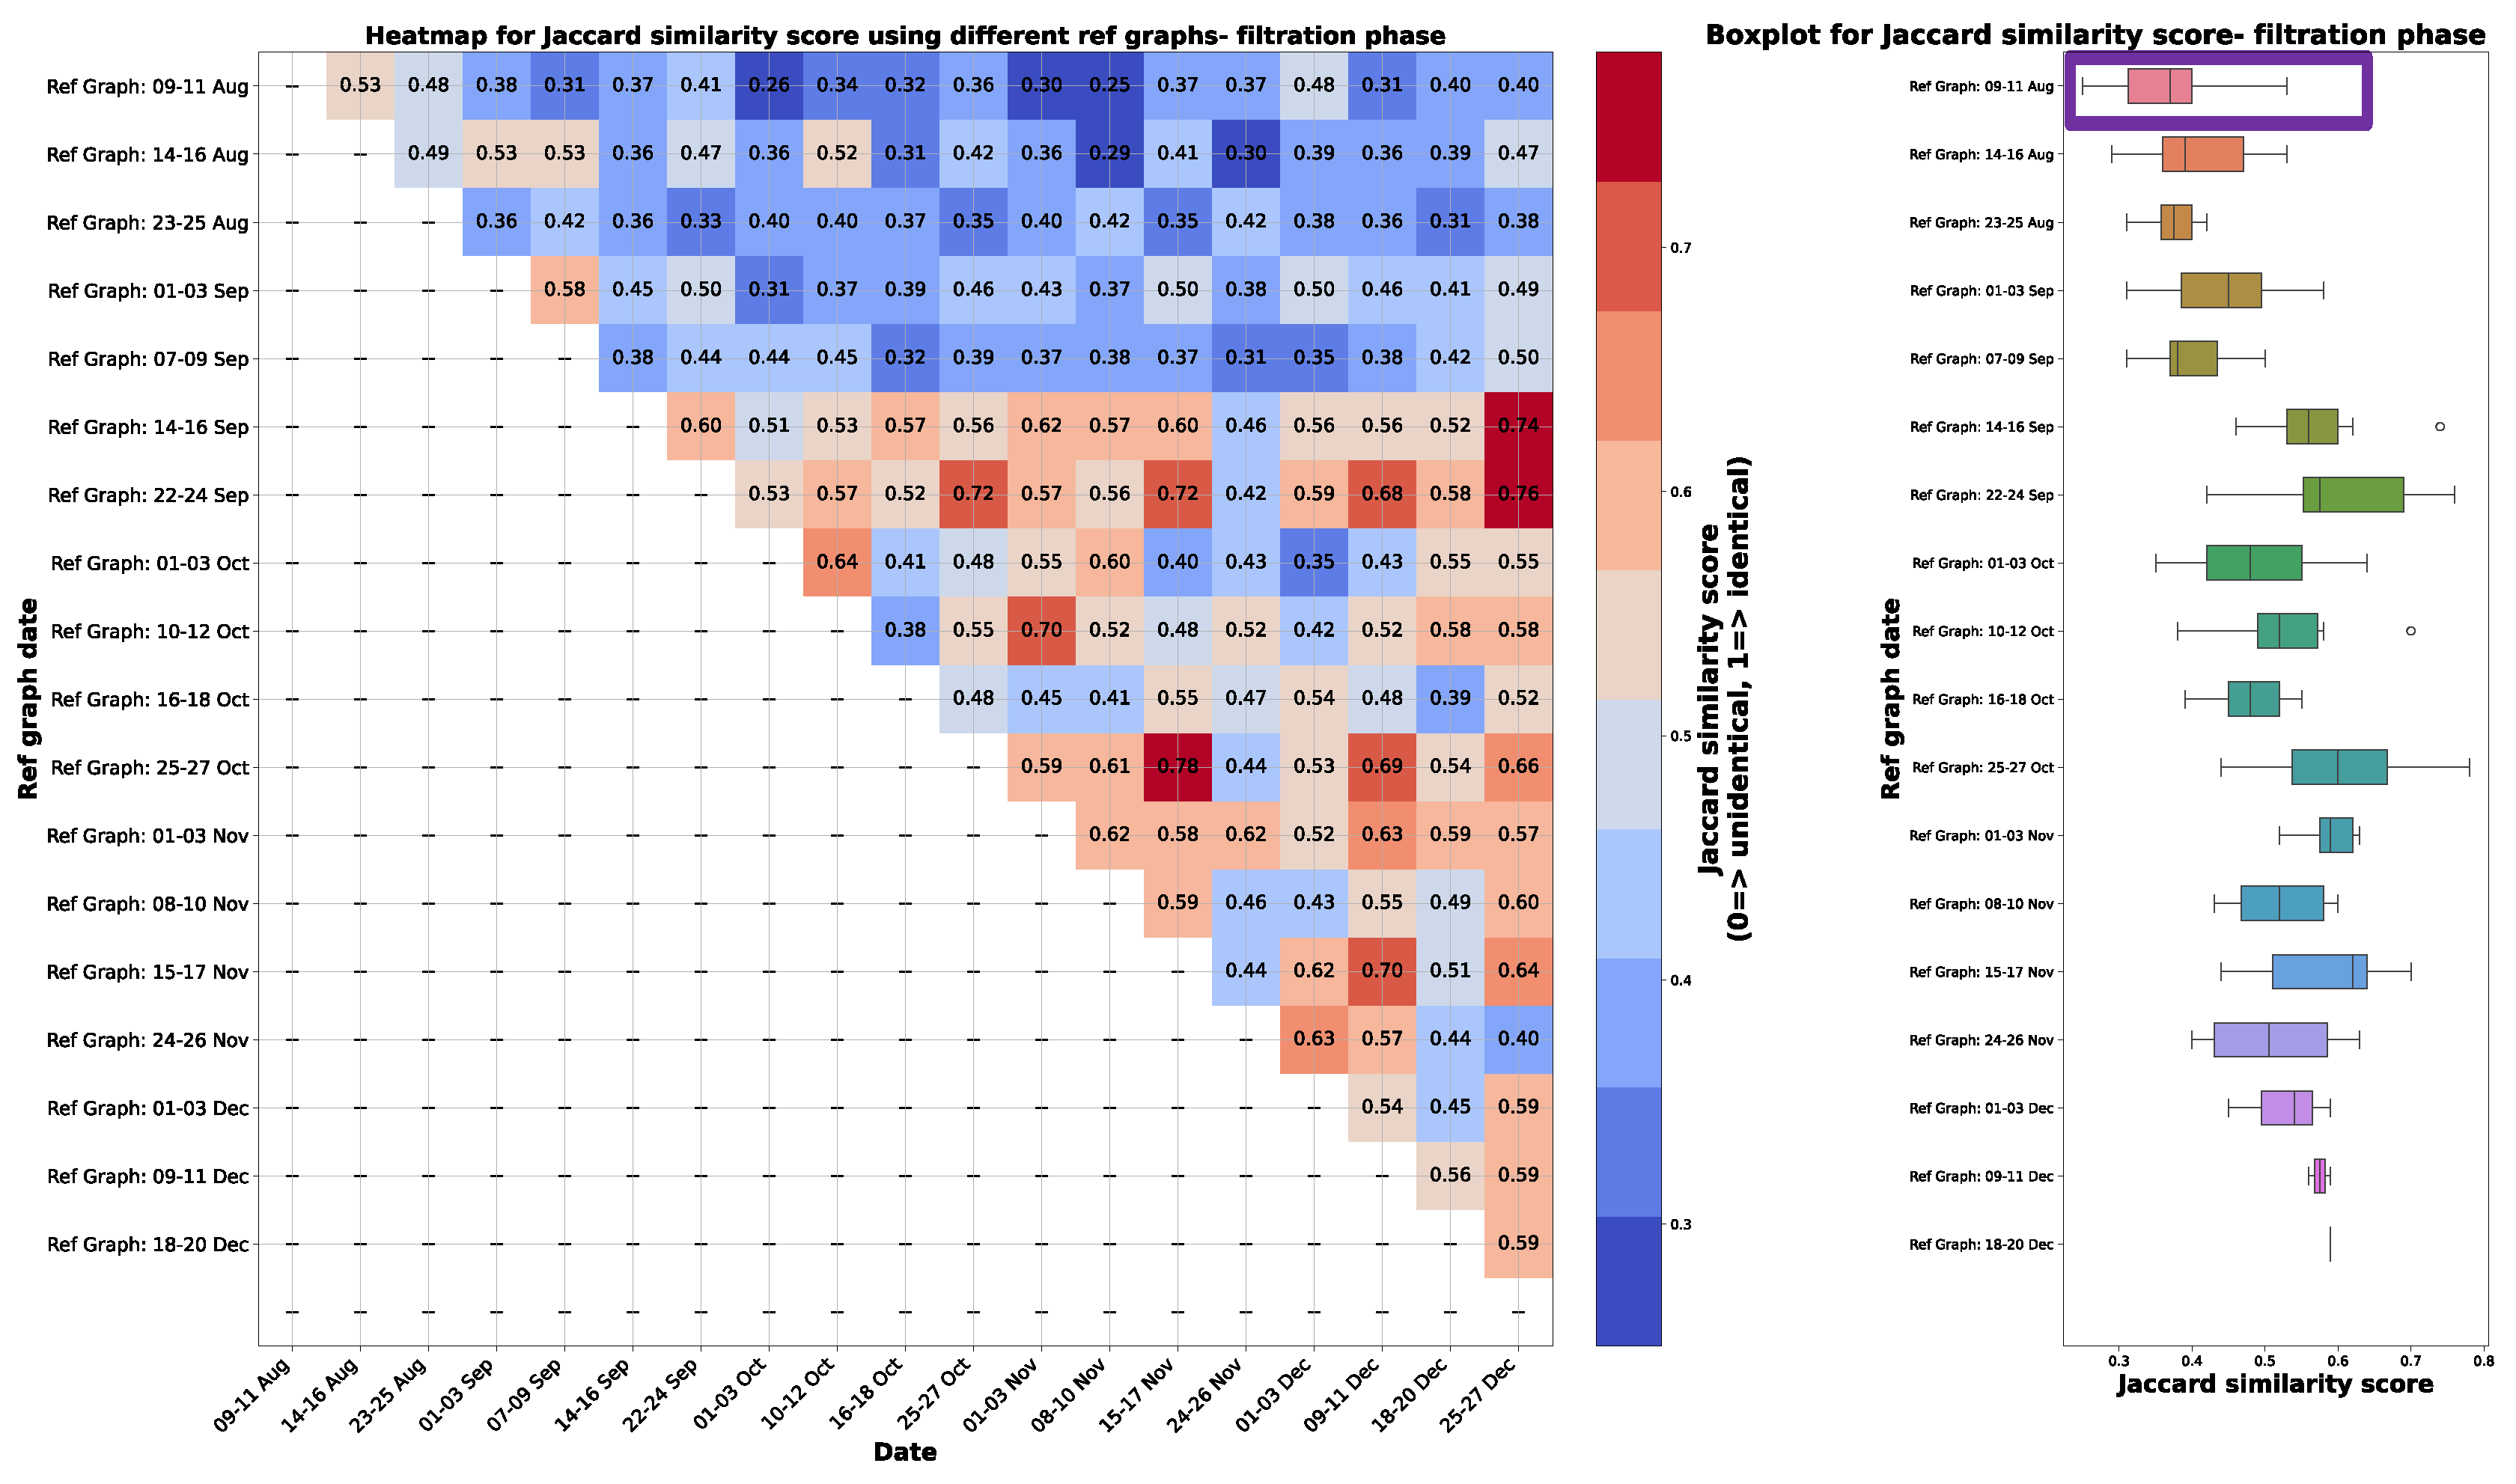
As mentioned in Section 4.3, the criteria for selecting the reference graph involved identifying a graph close to the date when the sieve was changed and demonstrating similarity to other causal graphs in the subsequent weeks and months. The reference graph selection process focused on finding a graph near the date of the sieve change with a higher median and lower variance in the distribution of Jaccard similarity scores. The heatmap, displaying the Jaccard Similarity Scores for various combinations of reference graphs during the filtration phase, is presented on the left-hand side of Figure A1. Upon analyzing the boxplots right-hand side of Figure A1, which shows the distribution of the Jaccard similarity scores when a specific graph is considered as the reference graph and compared with others. The graph on 09-11th Aug 2022, highlighted in purple, stands out with a high median, low variance, and proximity to the date of the sieve change. It’s worth noting that the graph on 14-16 August 2022 could also be considered a reference, being close to the sieve change date with a high median, but it exhibits a higher variance in the Jaccard similarity score compared to the graph on 09-11 August. Therefore, the graph on 09-11 August was selected as the reference graph for further analysis.
Figure A1.
The heatmap on the left illustrates Jaccard similarity scores for various combinations of causal graphs used as reference graphs during the filtration phase. On the right, accompanying boxplots display the distribution of Jaccard similarity scores when a specific graph is selected as the reference and compared to other causal graphs. The highlighted purple boxplot represents the chosen causal graph used as the ultimate reference, situated on 09-11th Aug 2022. This boxplot exhibits the high median, low variance in the Jaccard similarity score and is closest to the date of the sieve change, making it the selected reference graph for further analysis.
Appendix A.2. Graph comparison
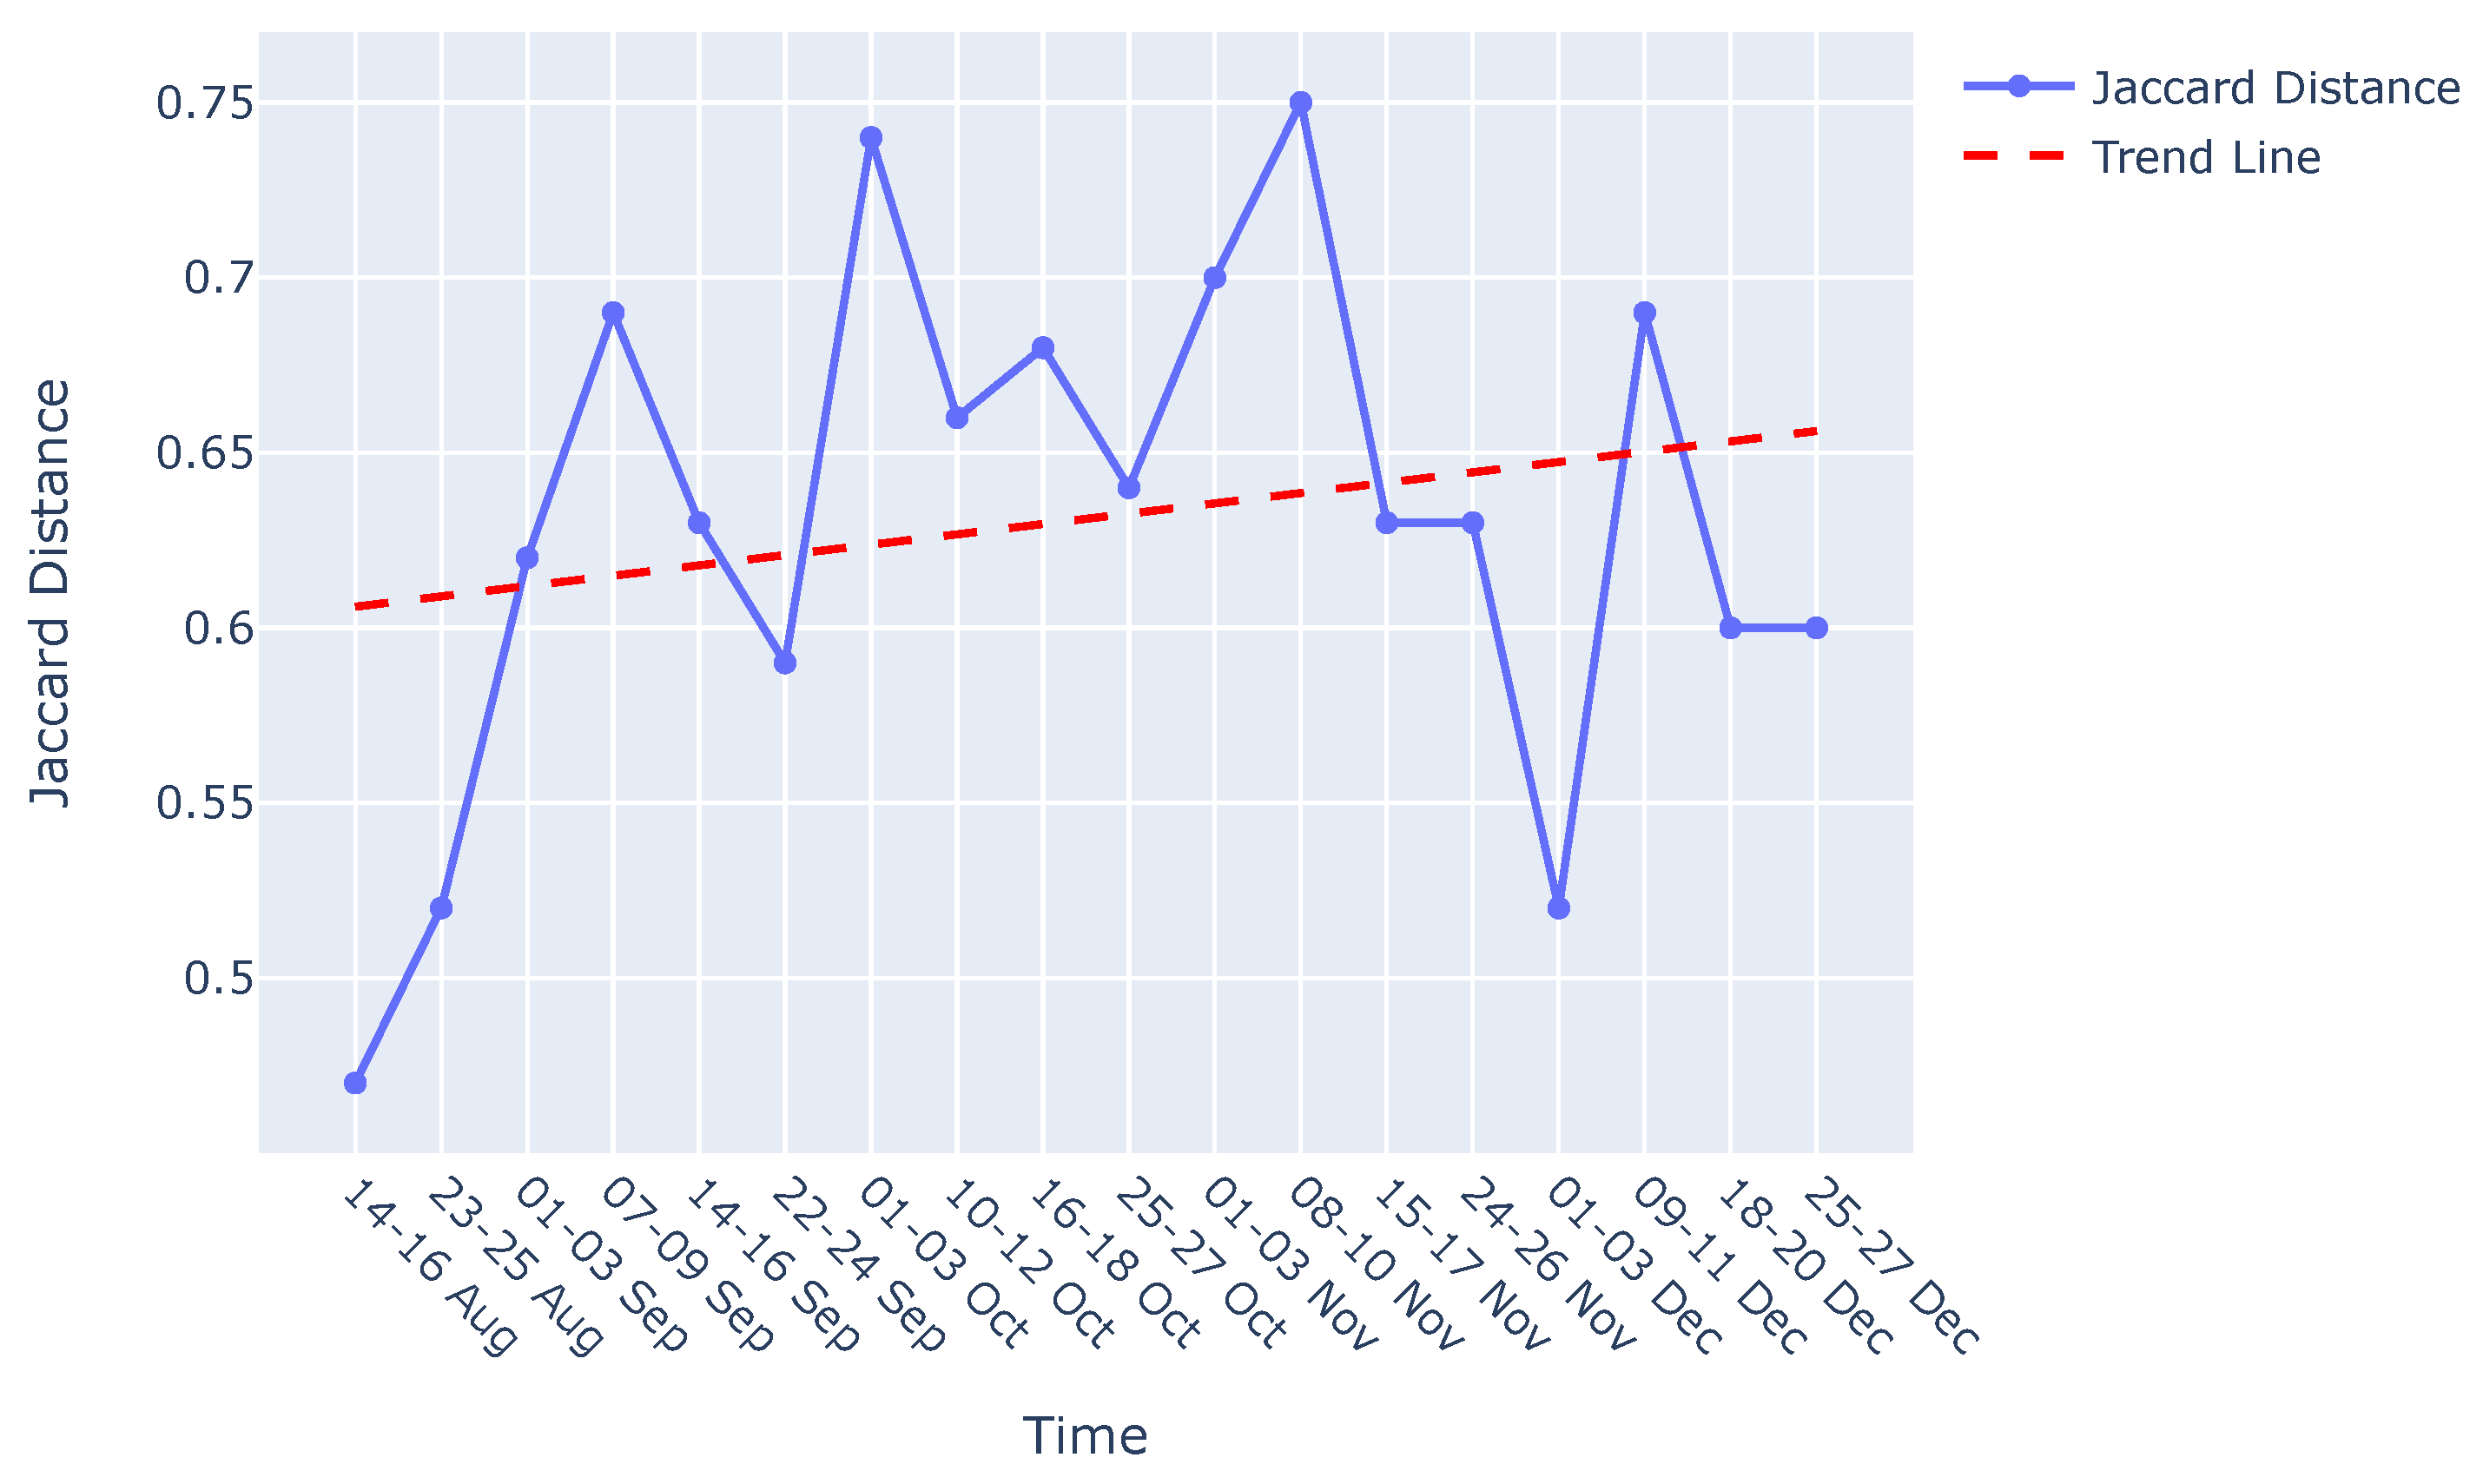
The visual representation in Figure A2 illustrates the comparison of causal graphs with the reference graph using Jaccard distance, incorporating a trend analysis for the filtration phase. The observed positive trend signifies a progressive increase in degradation over time subsequent to the sieve change.
Figure A2.
Jaccard distance for graphs obtained by using data from 2days/ week when compared to a graph on 09-11 August during the filtration phase.
Figure A2.
Jaccard distance for graphs obtained by using data from 2days/ week when compared to a graph on 09-11 August during the filtration phase.
Appendix B. Evaluation- Filtration phase
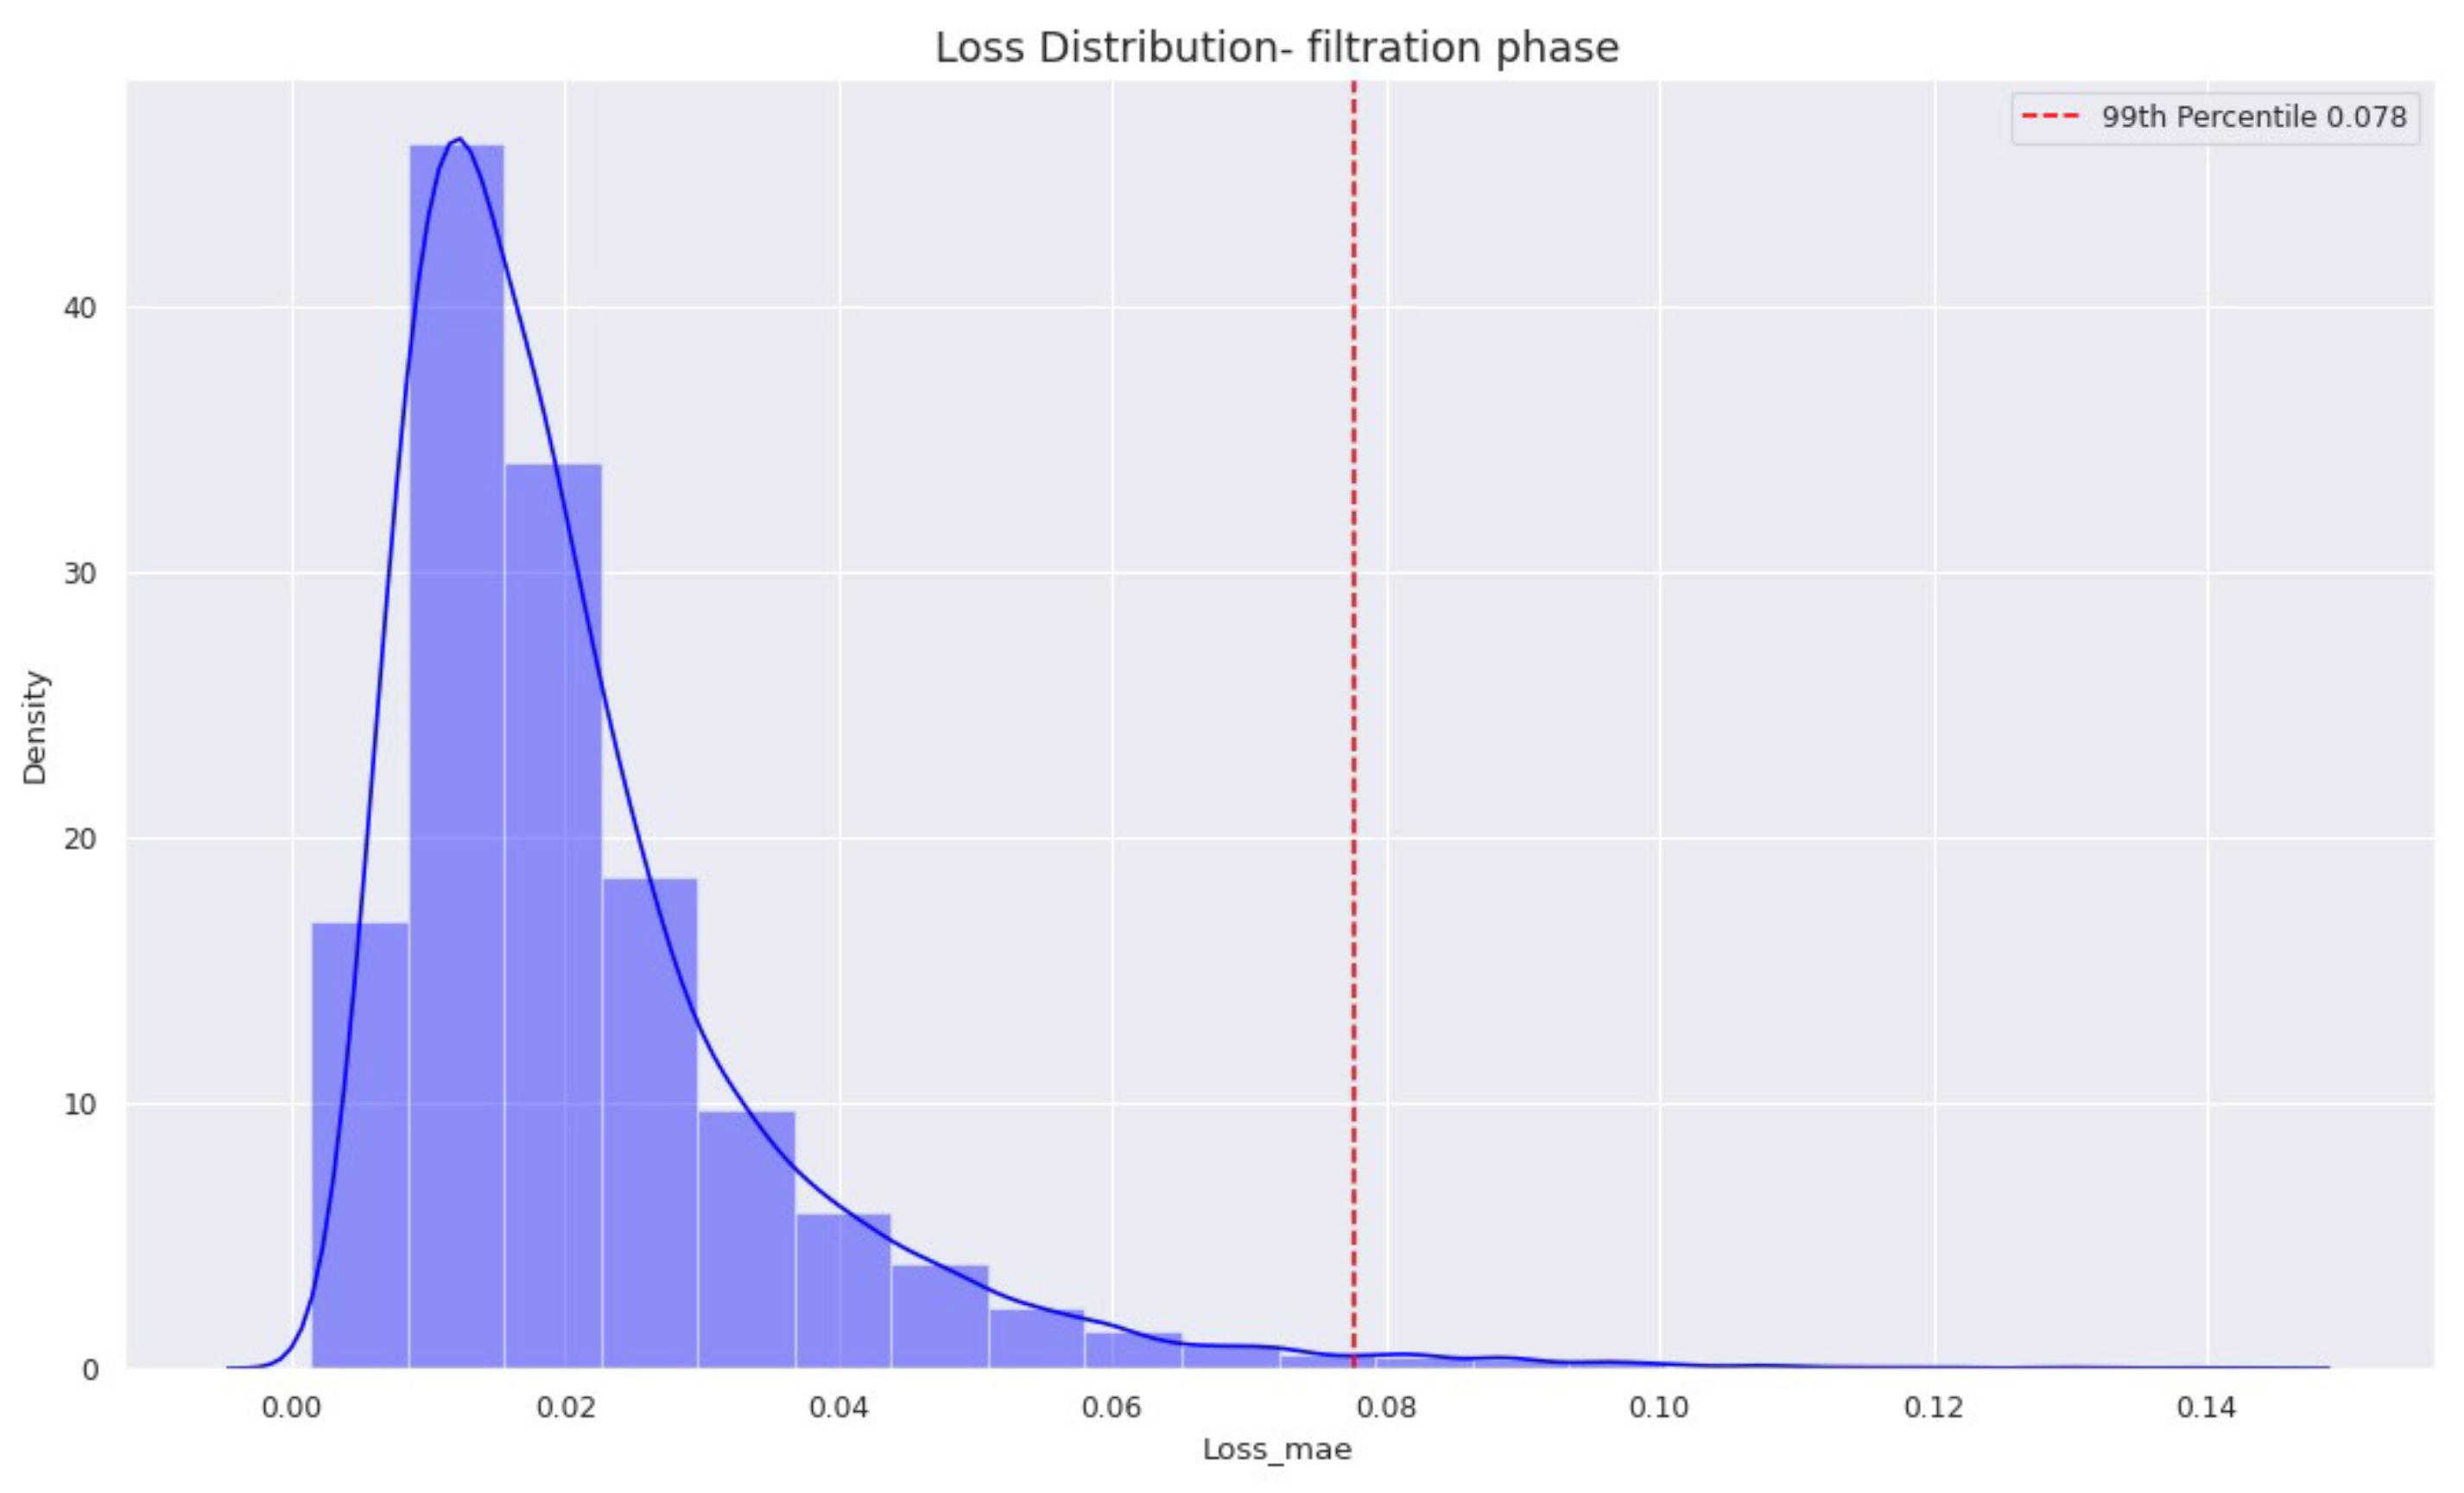
In this section, we showcase the outcomes of the offline evaluation conducted to assess our approach for monitoring degradation in the filtration phase. Figure A3 displays the distribution of the training loss, where the threshold is established at the 99 percentile (i.e., ) of the reconstruction loss, denoted as the Mean Absolute Error.
Figure A3.
Distribution of the reconstruction loss (Mean absolute error) on the training dataset with a threshold set at which is 99 percentile of the mean absolute error for the filtration phase.
Figure A3.
Distribution of the reconstruction loss (Mean absolute error) on the training dataset with a threshold set at which is 99 percentile of the mean absolute error for the filtration phase.
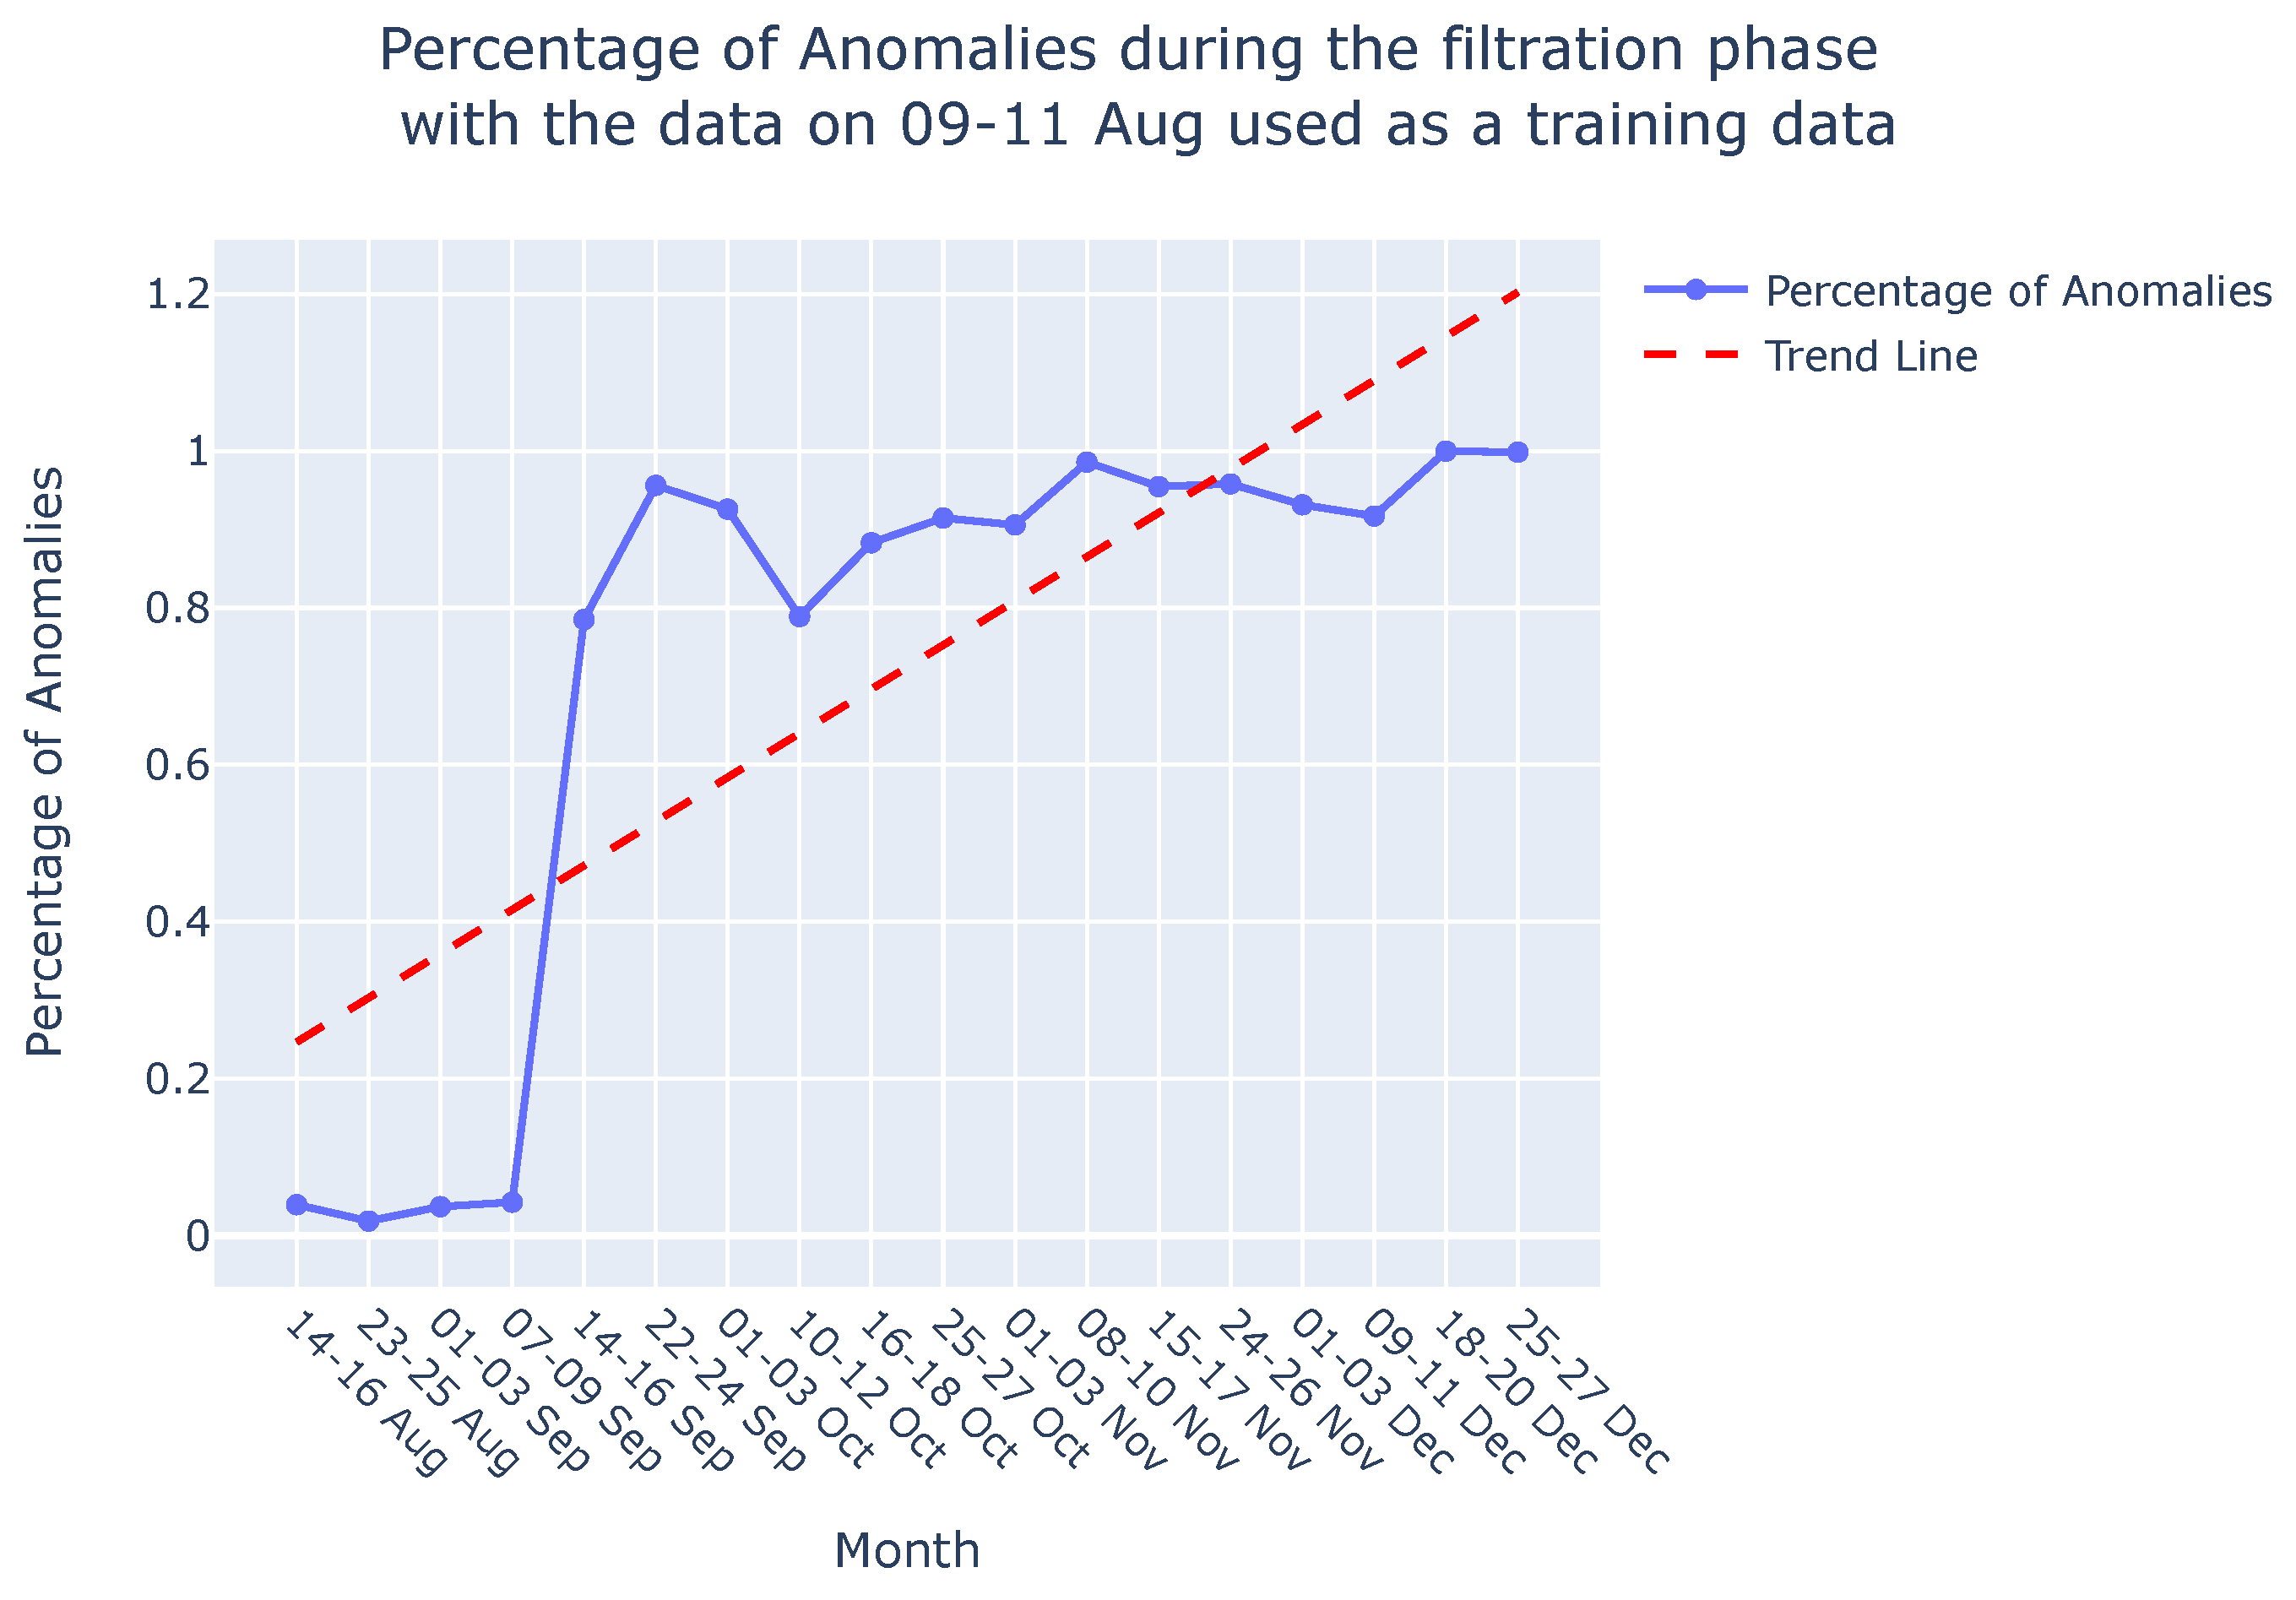
In Figure A4 (a), the percentage of anomalies over the total test data in the filtration phase is depicted, along with a trend analysis. The analysis utilized the LSTM-based Autoencoder model trained on the reference data i.e., on 09-11 August. The Mean Absolute Error, representing the reconstruction error, was calculated on data from consecutive weeks spanning August 2022 to December 2022, as outlined in Section 5.1. The trend line illustrates a progressively increasing percentage of anomalies from August to December, indicating degradation in the sieve. These findings align with the results discussed in Appendix A.2 and are visually represented in Figure A4 (b).
Figure A4.
Degradation monitoring for filtration phase using (a) LSTM based Autoencoder (b) Jaccard distance .
Figure A4.
Degradation monitoring for filtration phase using (a) LSTM based Autoencoder (b) Jaccard distance .
References
- Surucu, O.; Gadsden, S.A.; Yawney, J. Condition Monitoring using Machine Learning: A Review of Theory, Applications, and Recent Advances. Expert Systems with Applications 2023, 221, 119738. [Google Scholar] [CrossRef]
- Glymour, C.; Zhang, K.; Spirtes, P. Review of Causal Discovery Methods Based on Graphical Models. Frontiers in Genetics 2019, 10. [Google Scholar] [CrossRef] [PubMed]
- Amer, M.; Goldstein, M.; Abdennadher, S. Enhancing one-class Support Vector Machines for unsupervised anomaly detection. 2013, pp. 8–15. [CrossRef]
- Diez-Olivan, A.; Pagan Rubio, J.; Nguyen, K.; Sanz, R.; Sierra, B. Kernel-based support vector machines for automated health status assessment in monitoring sensor data. The International Journal of Advanced Manufacturing Technology 2018, 95. [Google Scholar] [CrossRef]
- Li, Z.; Li, X. Fault Detection in the Closed-loop System Using One-Class Support Vector Machine. 2018 IEEE 7th Data Driven Control and Learning Systems Conference (DDCLS) 2018, pp. 251–255.
- Ma, J.; Perkins, S. Time-series novelty detection using one-class support vector machines. Proceedings of the International Joint Conference on Neural Networks, 2003., 2003, Vol. 3, pp. 1741–1745 vol.3. [CrossRef]
- Shawe-Taylor, J.; Žličar, B. Novelty Detection with One-Class Support Vector Machines; 2015; pp. 231–257. [CrossRef]
- Chevrot, A.; Vernotte, A.; Legeard, B. CAE : Contextual Auto-Encoder for multivariate time-series anomaly detection in air transportation. Computers & Security 2022, 116, 102652. [Google Scholar] [CrossRef]
- Tziolas, T.; Papageorgiou, K.; Theodosiou, T.; Papageorgiou, E.; Mastos, T.; Papadopoulos, A. Autoencoders for Anomaly Detection in an Industrial Multivariate Time Series Dataset. Engineering Proceedings 2022, 18. [Google Scholar] [CrossRef]
- Li, G.; Jung, J.J. Deep learning for anomaly detection in multivariate time series: Approaches, applications, and challenges. Inf. Fusion 2023, 91, 93–102. [Google Scholar] [CrossRef]
- González-Muñiz, A.; Díaz, I.; Cuadrado, A.A.; García-Pérez, D. Health indicator for machine condition monitoring built in the latent space of a deep autoencoder. Reliability Engineering & System Safety 2022, 224, 108482. [Google Scholar] [CrossRef]
- Hasani, R.; Wang, G.; Grosu, R. A Machine Learning Suite for Machine Components’ Health-Monitoring. Proceedings of the AAAI Conference on Artificial Intelligence 2019, 33, 9472–9477. [Google Scholar] [CrossRef]
- Choi, K.; Yi, J.; Park, C.; Yoon, S. Deep Learning for Anomaly Detection in Time-Series Data: Review, Analysis, and Guidelines. IEEE Access 2021, PP, 1–1. [Google Scholar] [CrossRef]
- Tran, K.P.; Nguyen, H.D.; Thomassey, S. Anomaly detection using Long Short Term Memory Networks and its applications in Supply Chain Management. IFAC-PapersOnLine 2019, 52, 2408–2412, 9th IFAC Conference on Manufacturing Modelling, Management and Control MIM 2019. [Google Scholar] [CrossRef]
- Hsieh, R.J.; Chou, J.; Ho, C.H. Unsupervised Online Anomaly Detection on Multivariate Sensing Time Series Data for Smart Manufacturing. 2019 IEEE 12th Conference on Service-Oriented Computing and Applications (SOCA), 2019, pp. 90–97. [CrossRef]
- Abbracciavento, F.; Formentin, S.; Balocco, J.; Rota, A.; Manzoni, V.; Savaresi, S.M. Anomaly detection via distributed sensing: a VAR modeling approach. IFAC-PapersOnLine 2021, 54, 85–90, 19th IFAC Symposium on System Identification SYSID 2021. [Google Scholar] [CrossRef]
- Diao, W.; Naqvi, I.H.; Pecht, M. Early detection of anomalous degradation behavior in lithium-ion batteries. Journal of Energy Storage 2020, 32, 101710. [Google Scholar] [CrossRef]
- Mejri, N.; Lopez-Fuentes, L.; Roy, K.; Chernakov, P.; Ghorbel, E.; Aouada, D. Unsupervised Anomaly Detection in Time-series: An Extensive Evaluation and Analysis of State-of-the-art Methods, 2023, [arXiv:cs.LG/2212.03637].
- Bi, X.; Wu, D.; Xie, D.; Ye, H.; Zhao, J. Large-scale chemical process causal discovery from big data with transformer-based deep learning. Process Safety and Environmental Protection 2023, 173, 163–177. [Google Scholar] [CrossRef]
- Mehling, C.W.; Pieper, S.; Ihlenfeldt, S. Concept of a causality-driven fault diagnosis system for cyber-physical production systems. 2023 IEEE 21st International Conference on Industrial Informatics (INDIN), 2023, pp. 1–8. [CrossRef]
- Xu, Z.; Dang, Y. Data-driven causal knowledge graph construction for root cause analysis in quality problem solving. International Journal of Production Research 2023, 61, 3227–3245. [Google Scholar] [CrossRef]
- Wang, H.; Xu, Y.; Peng, T.; Agbozo, R.S.K.; Xu, K.; Liu, W.; Tang, R. Two-stage approach to causality analysis-based quality problem solving for discrete manufacturing systems. Journal of Engineering Design 2023, 0, 1–25. [Google Scholar] [CrossRef]
- Vuković, M.; Thalmann, S. Causal discovery in manufacturing: A structured literature review. Journal of Manufacturing and Materials Processing 2022, 6, 10. [Google Scholar] [CrossRef]
- Ahang, M.; Charter, T.; Ogunfowora, O.; Khadivi, M.; Abbasi, M.; Najjaran, H. Intelligent Condition Monitoring of Industrial Plants: An Overview of Methodologies and Uncertainty Management Strategies. arXiv preprint arXiv:2401.10266 2024. [Google Scholar]
- Wuest, T.; Weimer, D.; Irgens, C.; Thoben, K.D. Machine learning in manufacturing: advantages, challenges, and applications. Production & Manufacturing Research 2016, 4, 23–45. [Google Scholar]
- Moraffah, R.; Karami, M.; Guo, R.; Raglin, A.; Liu, H. Causal interpretability for machine learning-problems, methods and evaluation. ACM SIGKDD Explorations Newsletter 2020, 22, 18–33. [Google Scholar] [CrossRef]
- Saeed, W.; Omlin, C. Explainable AI (XAI): A systematic meta-survey of current challenges and future opportunities. Knowledge-Based Systems 2023, 263, 110273. [Google Scholar] [CrossRef]
- Galhotra, S.; Pradhan, R.; Salimi, B. Explaining black-box algorithms using probabilistic contrastive counterfactuals. Proceedings of the 2021 International Conference on Management of Data, 2021, pp. 577–590.
- Chattopadhyay, A.; Manupriya, P.; Sarkar, A.; Balasubramanian, V.N. Neural Network Attributions: A Causal Perspective. Proceedings of the 36th International Conference on Machine Learning; Chaudhuri, K.; Salakhutdinov, R., Eds. PMLR, 2019, Vol. 97, Proceedings of Machine Learning Research, pp. 981–990.
- Harradon, M.; Druce, J.; Ruttenberg, B.E. Causal Learning and Explanation of Deep Neural Networks via Autoencoded Activations. CoRR 2018, abs/1802.00541, [1802.00541].
- Parafita, Á.; Vitrià, J. Explaining visual models by causal attribution. 2019 IEEE/CVF International Conference on Computer Vision Workshop (ICCVW). IEEE, 2019, pp. 4167–4175.
- Narendra, T.; Sankaran, A.; Vijaykeerthy, D.; Mani, S. Explaining Deep Learning Models using Causal Inference. CoRR 2018, abs/1811.04376, [1811.04376].
- Wachter, S.; Mittelstadt, B.; Russell, C. Counterfactual explanations without opening the black box: Automated decisions and the GDPR. Harv. JL & Tech. 2017, 31, 841. [Google Scholar]
- Grath, R.M.; Costabello, L.; Van, C.L.; Sweeney, P.; Kamiab, F.; Shen, Z.; Lecue, F. Interpretable Credit Application Predictions With Counterfactual Explanations, 2018, [arXiv:cs.AI/1811.05245].
- Mothilal, R.K.; Sharma, A.; Tan, C. Explaining machine learning classifiers through diverse counterfactual explanations. Proceedings of the 2020 Conference on Fairness, Accountability, and Transparency. ACM, 2020, FAT* ’20. [CrossRef]
- Moore, J.; Hammerla, N.; Watkins, C. Explaining Deep Learning Models with Constrained Adversarial Examples, 2019, [arXiv:cs.LG/1906.10671].
- Xu, G.; Duong, T.D.; Li, Q.; Liu, S.; Wang, X. Causality learning: A new perspective for interpretable machine learning. arXiv preprint arXiv:2006.16789 2020. [Google Scholar]
- Zanga, A.; Stella, F. A Survey on Causal Discovery: Theory and Practice, 2023, [arXiv:cs.AI/2305.10032].
- Assaad, C.K.; Devijver, E.; Gaussier, E. Survey and Evaluation of Causal Discovery Methods for Time Series. J. Artif. Int. Res. 2022, 73. [Google Scholar] [CrossRef]
- Hasan, U.; Hossain, E.; Gani, M.O. A Survey on Causal Discovery Methods for I.I.D. and Time Series Data, 2023, [arXiv:cs.AI/2303.15027].
- Arafeh, M.; Hammoud, A.; Otrok, H.; Mourad, A.; Talhi, C.; Dziong, Z. Independent and Identically Distributed (IID) Data Assessment in Federated Learning. GLOBECOM 2022 - 2022 IEEE Global Communications Conference, 2022, pp. 293–298. [CrossRef]
- Dafoe, A.; Zhang, B.; Caughey, D. Confounding in survey experiments. Annual Meeting of The Society for Political Methodology, University of Rochester, Rochester, NY, July, 2015, Vol. 23.
- Wang, J.; Dong, Y. Measurement of Text Similarity: A Survey. Information 2020, 11. [Google Scholar] [CrossRef]
- Varma, S.; Shivam, S.; Thumu, A.; Bhushanam, A.; Sarkar, D. Jaccard Based Similarity Index in Graphs: A Multi-Hop Approach. 2022 IEEE Delhi Section Conference (DELCON), 2022, pp. 1–4. [CrossRef]
- Cheng, L.; Guo, R.; Moraffah, R.; Sheth, P.; Candan, K.S.; Liu, H. Evaluation Methods and Measures for Causal Learning Algorithms, 2022, [arXiv:cs.LG/2202.02896].
- Shen, X.; Ma, S.; Vemuri, P.; Simon, G.; Alzheimer’s Disease Neuroimaging Initiative. Challenges and opportunities with causal discovery algorithms: Application to Alzheimer’s pathophysiology. Sci. Rep. 2020, 10, 2975. [Google Scholar] [CrossRef]
- Niwattanakul, S.; Singthongchai, J.; Naenudorn, E.; Wanapu, S. Using of Jaccard Coefficient for Keywords Similarity. 2013.
Figure 1.
Schematic Description of the complete approach.
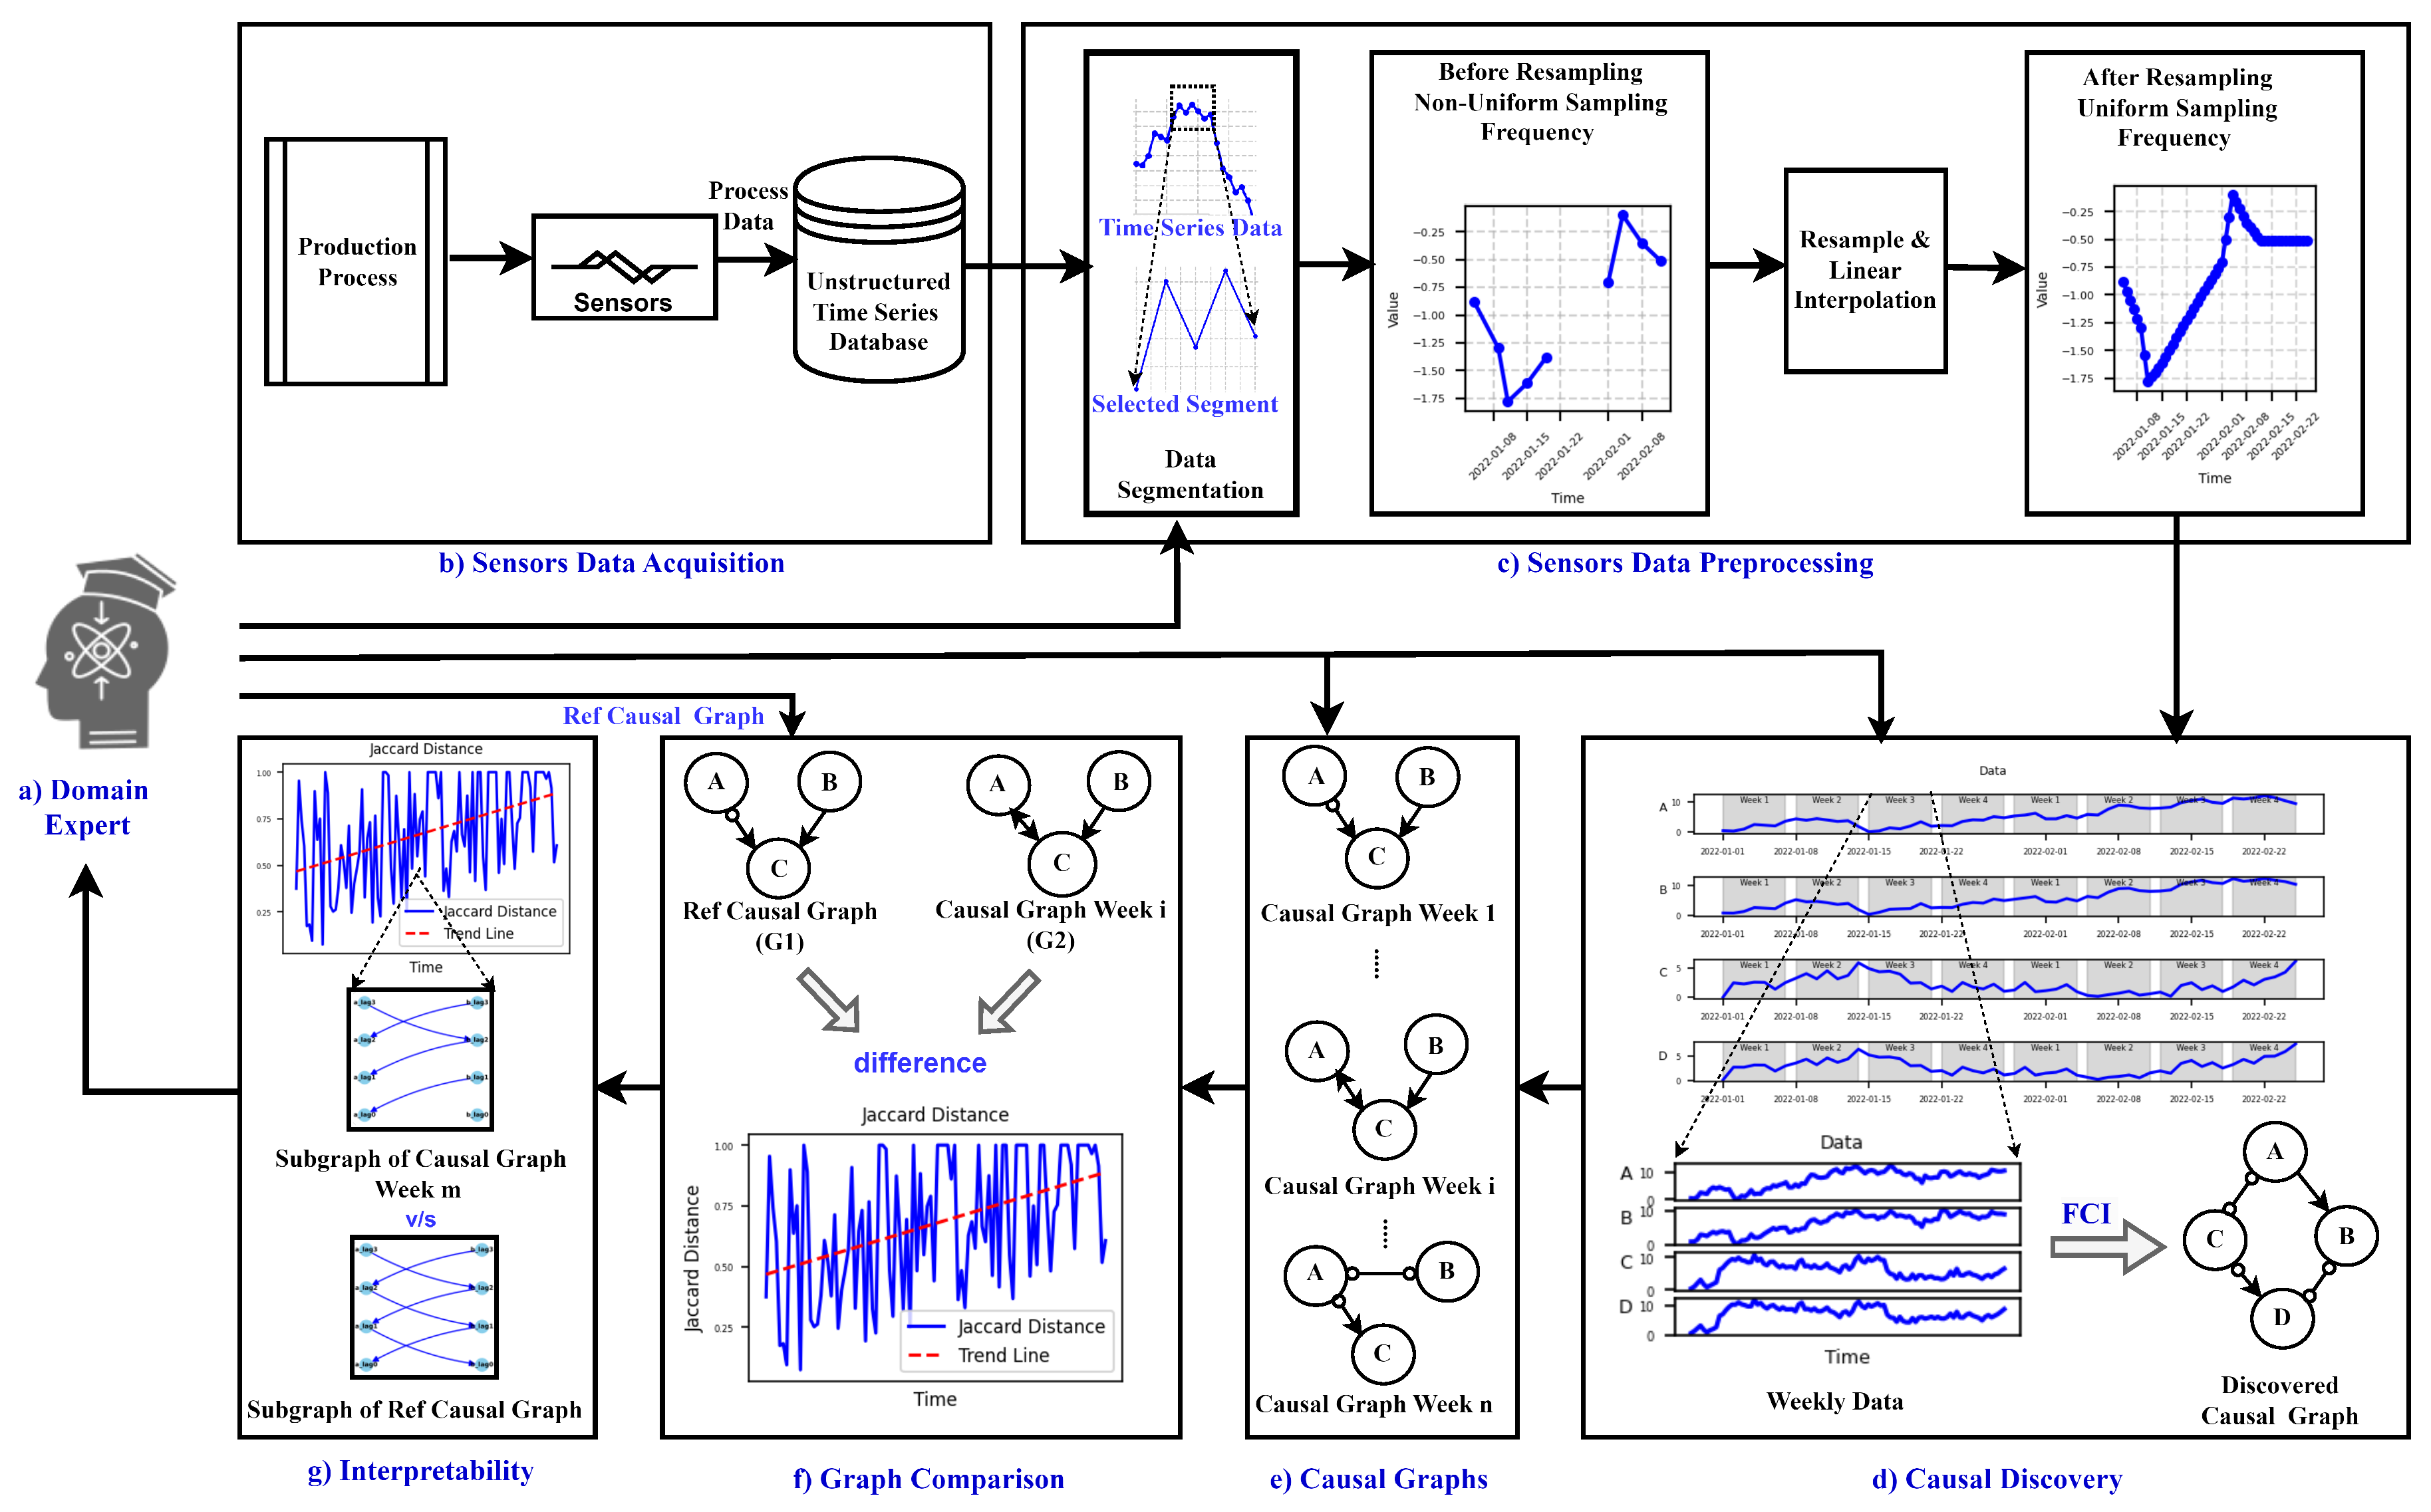
Figure 2.
Overview of edge types of FCI based on [46].
Figure 2.
Overview of edge types of FCI based on [46].
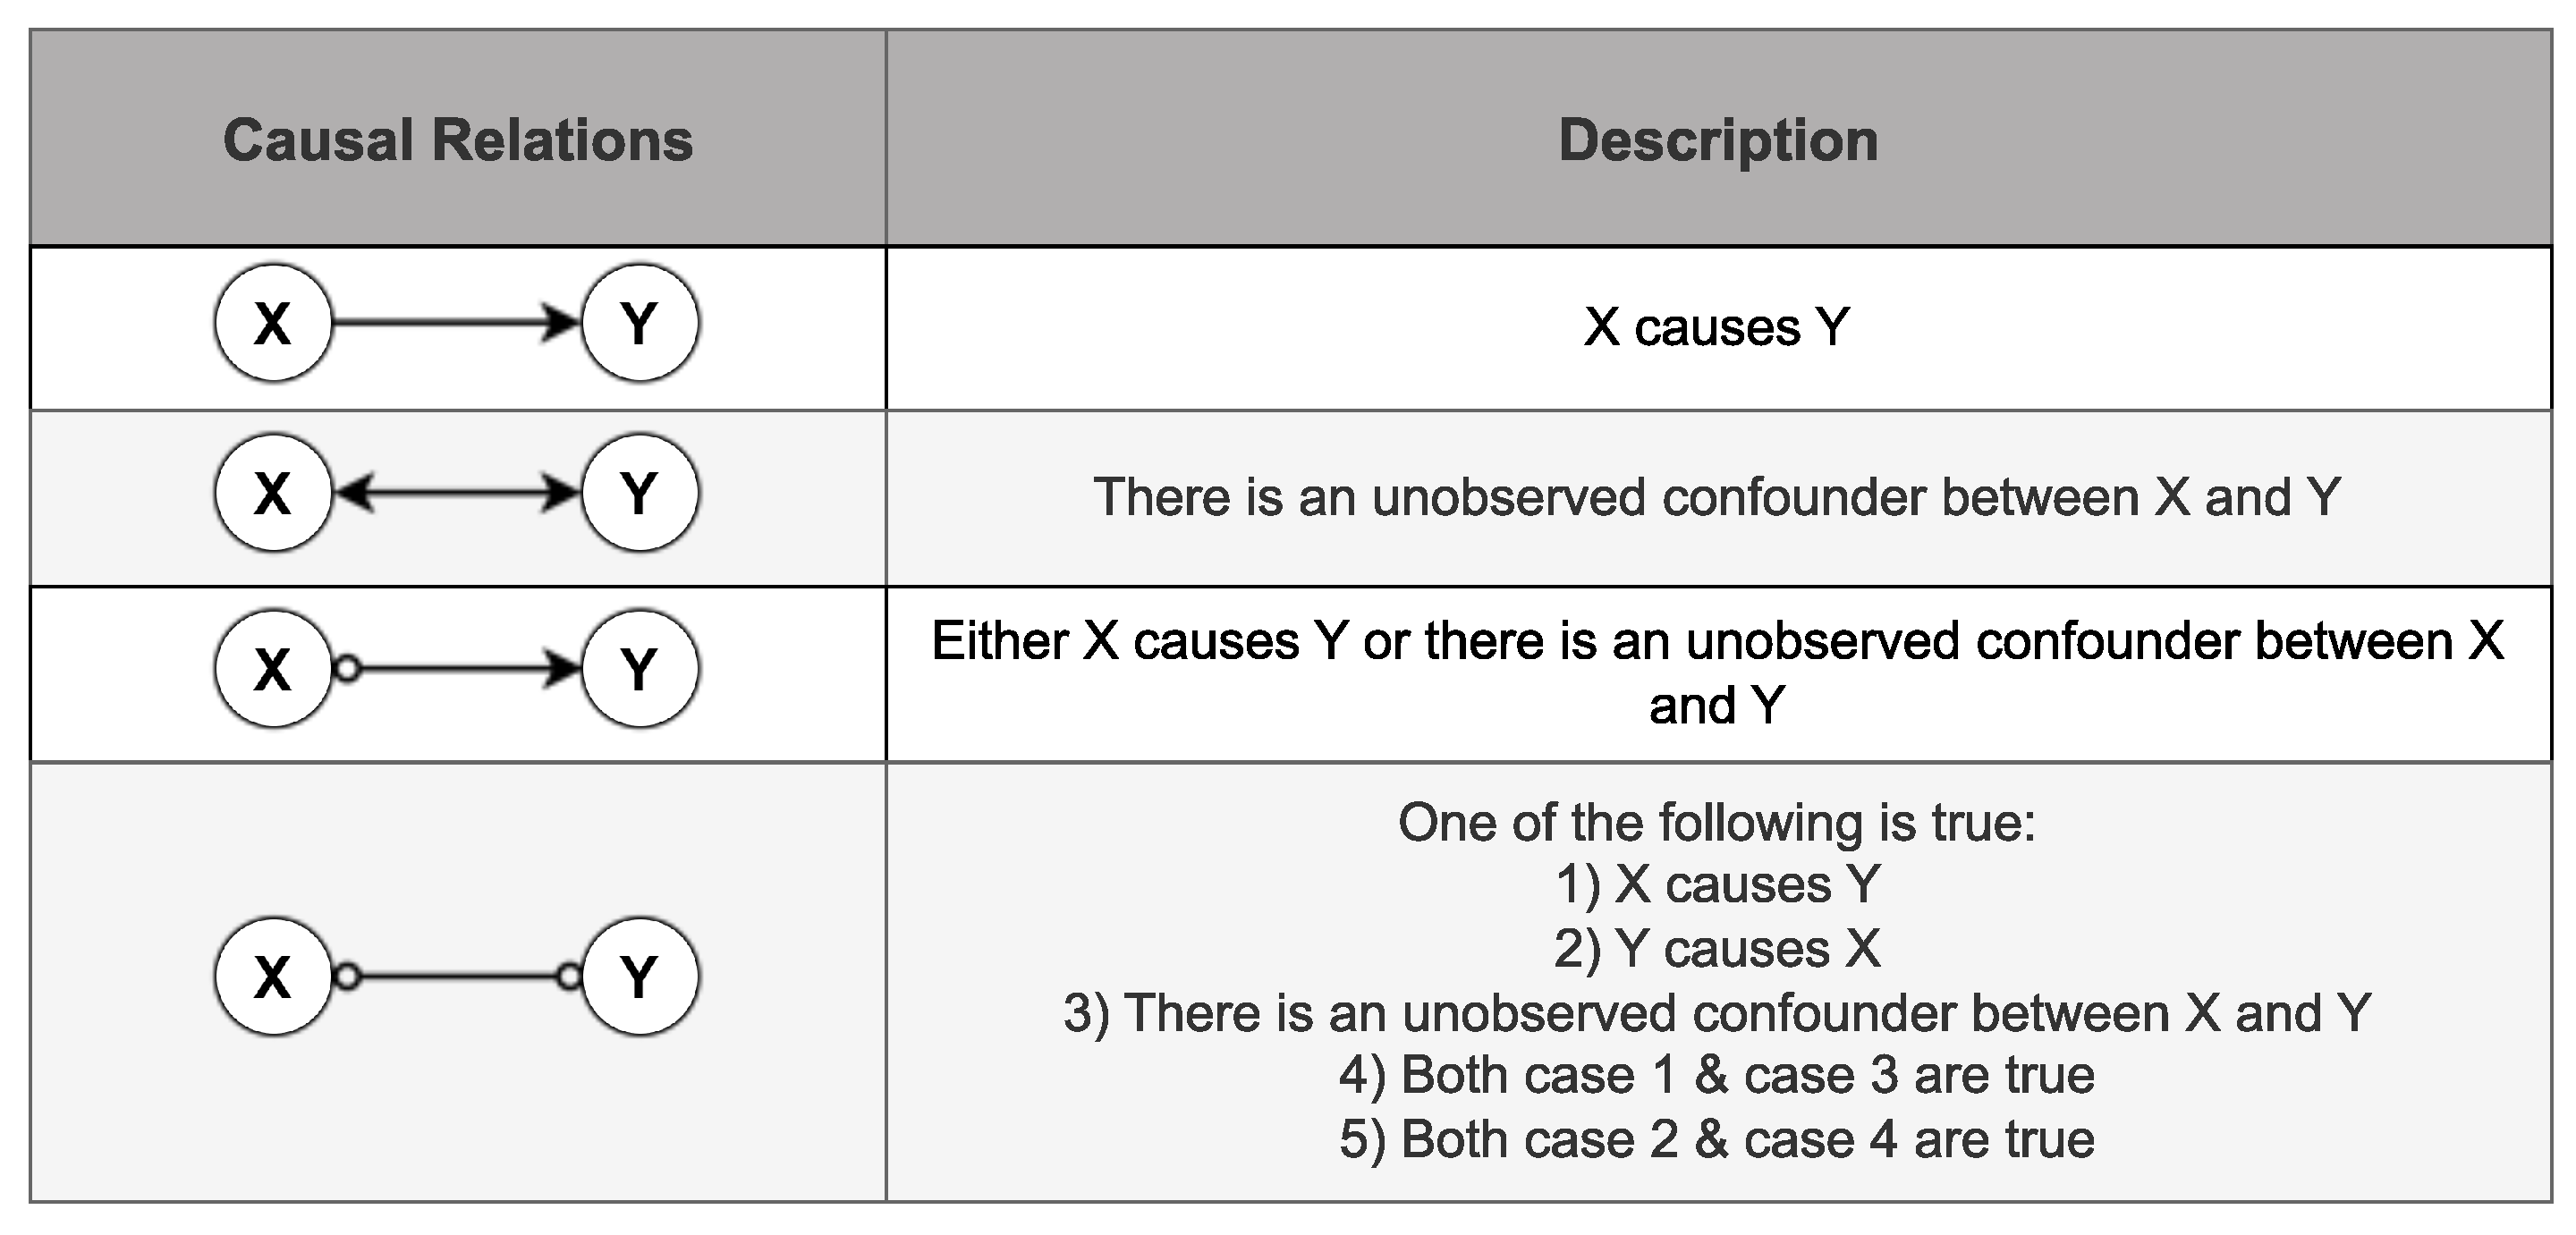
Figure 3.
Working of Jaccard similarity score and Jaccard distance. (a) and (b) are the two causal graphs to be compared, (c) and (d) are the intersection and union of the two graphs (a) and (b) [47].
Figure 3.
Working of Jaccard similarity score and Jaccard distance. (a) and (b) are the two causal graphs to be compared, (c) and (d) are the intersection and union of the two graphs (a) and (b) [47].
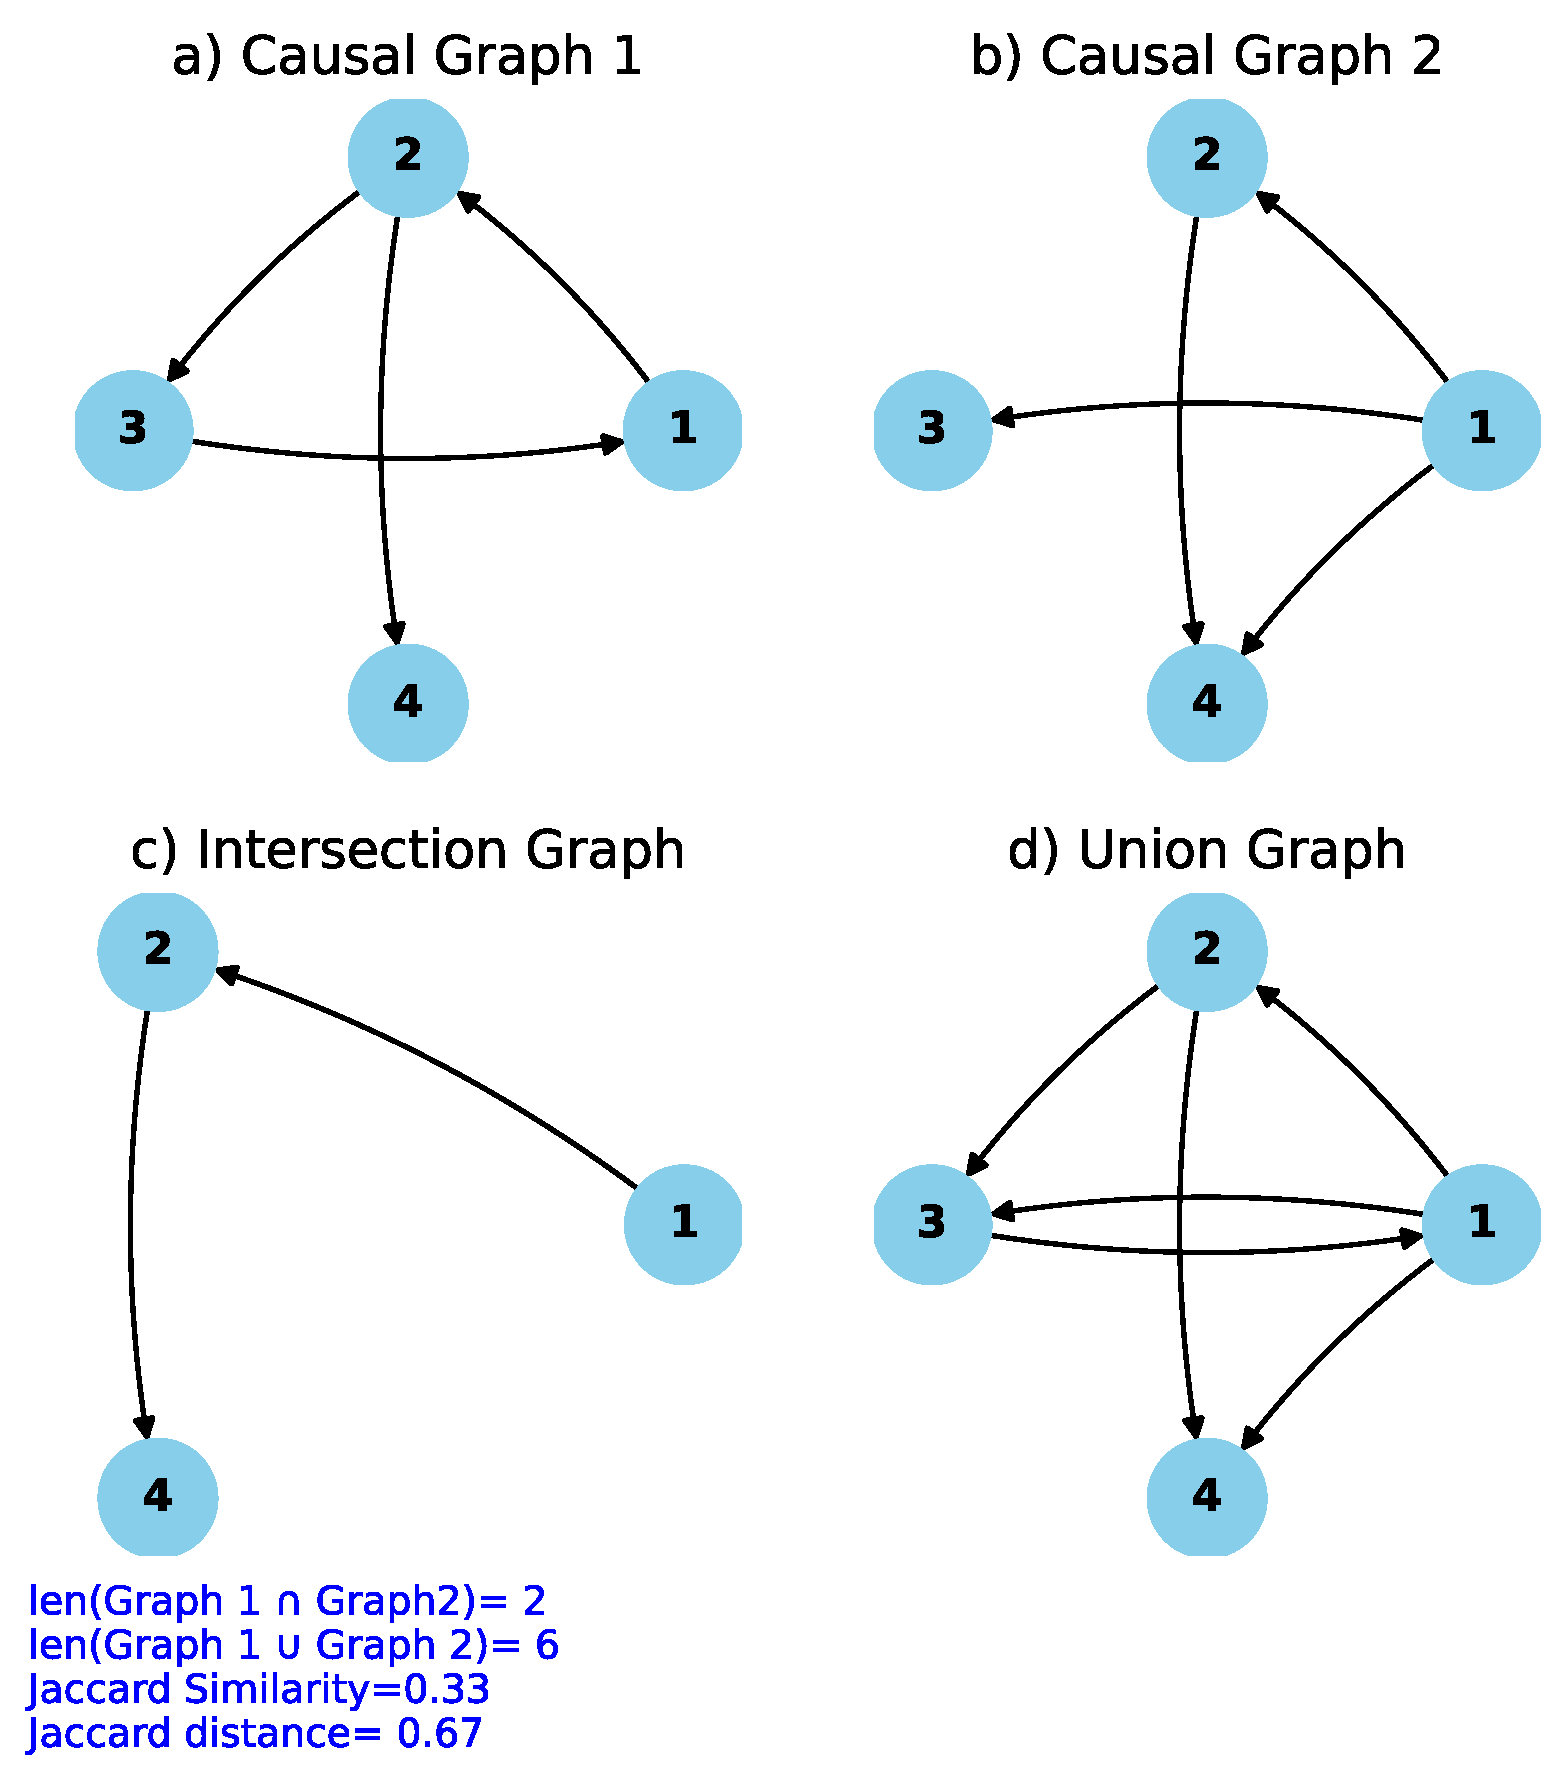
Figure 4.
The Filtration Machine (left) uses dedicated metal sieves (right) to filter particles out of fluid viscose. Source: Lenzing ViscoFil
Figure 4.
The Filtration Machine (left) uses dedicated metal sieves (right) to filter particles out of fluid viscose. Source: Lenzing ViscoFil
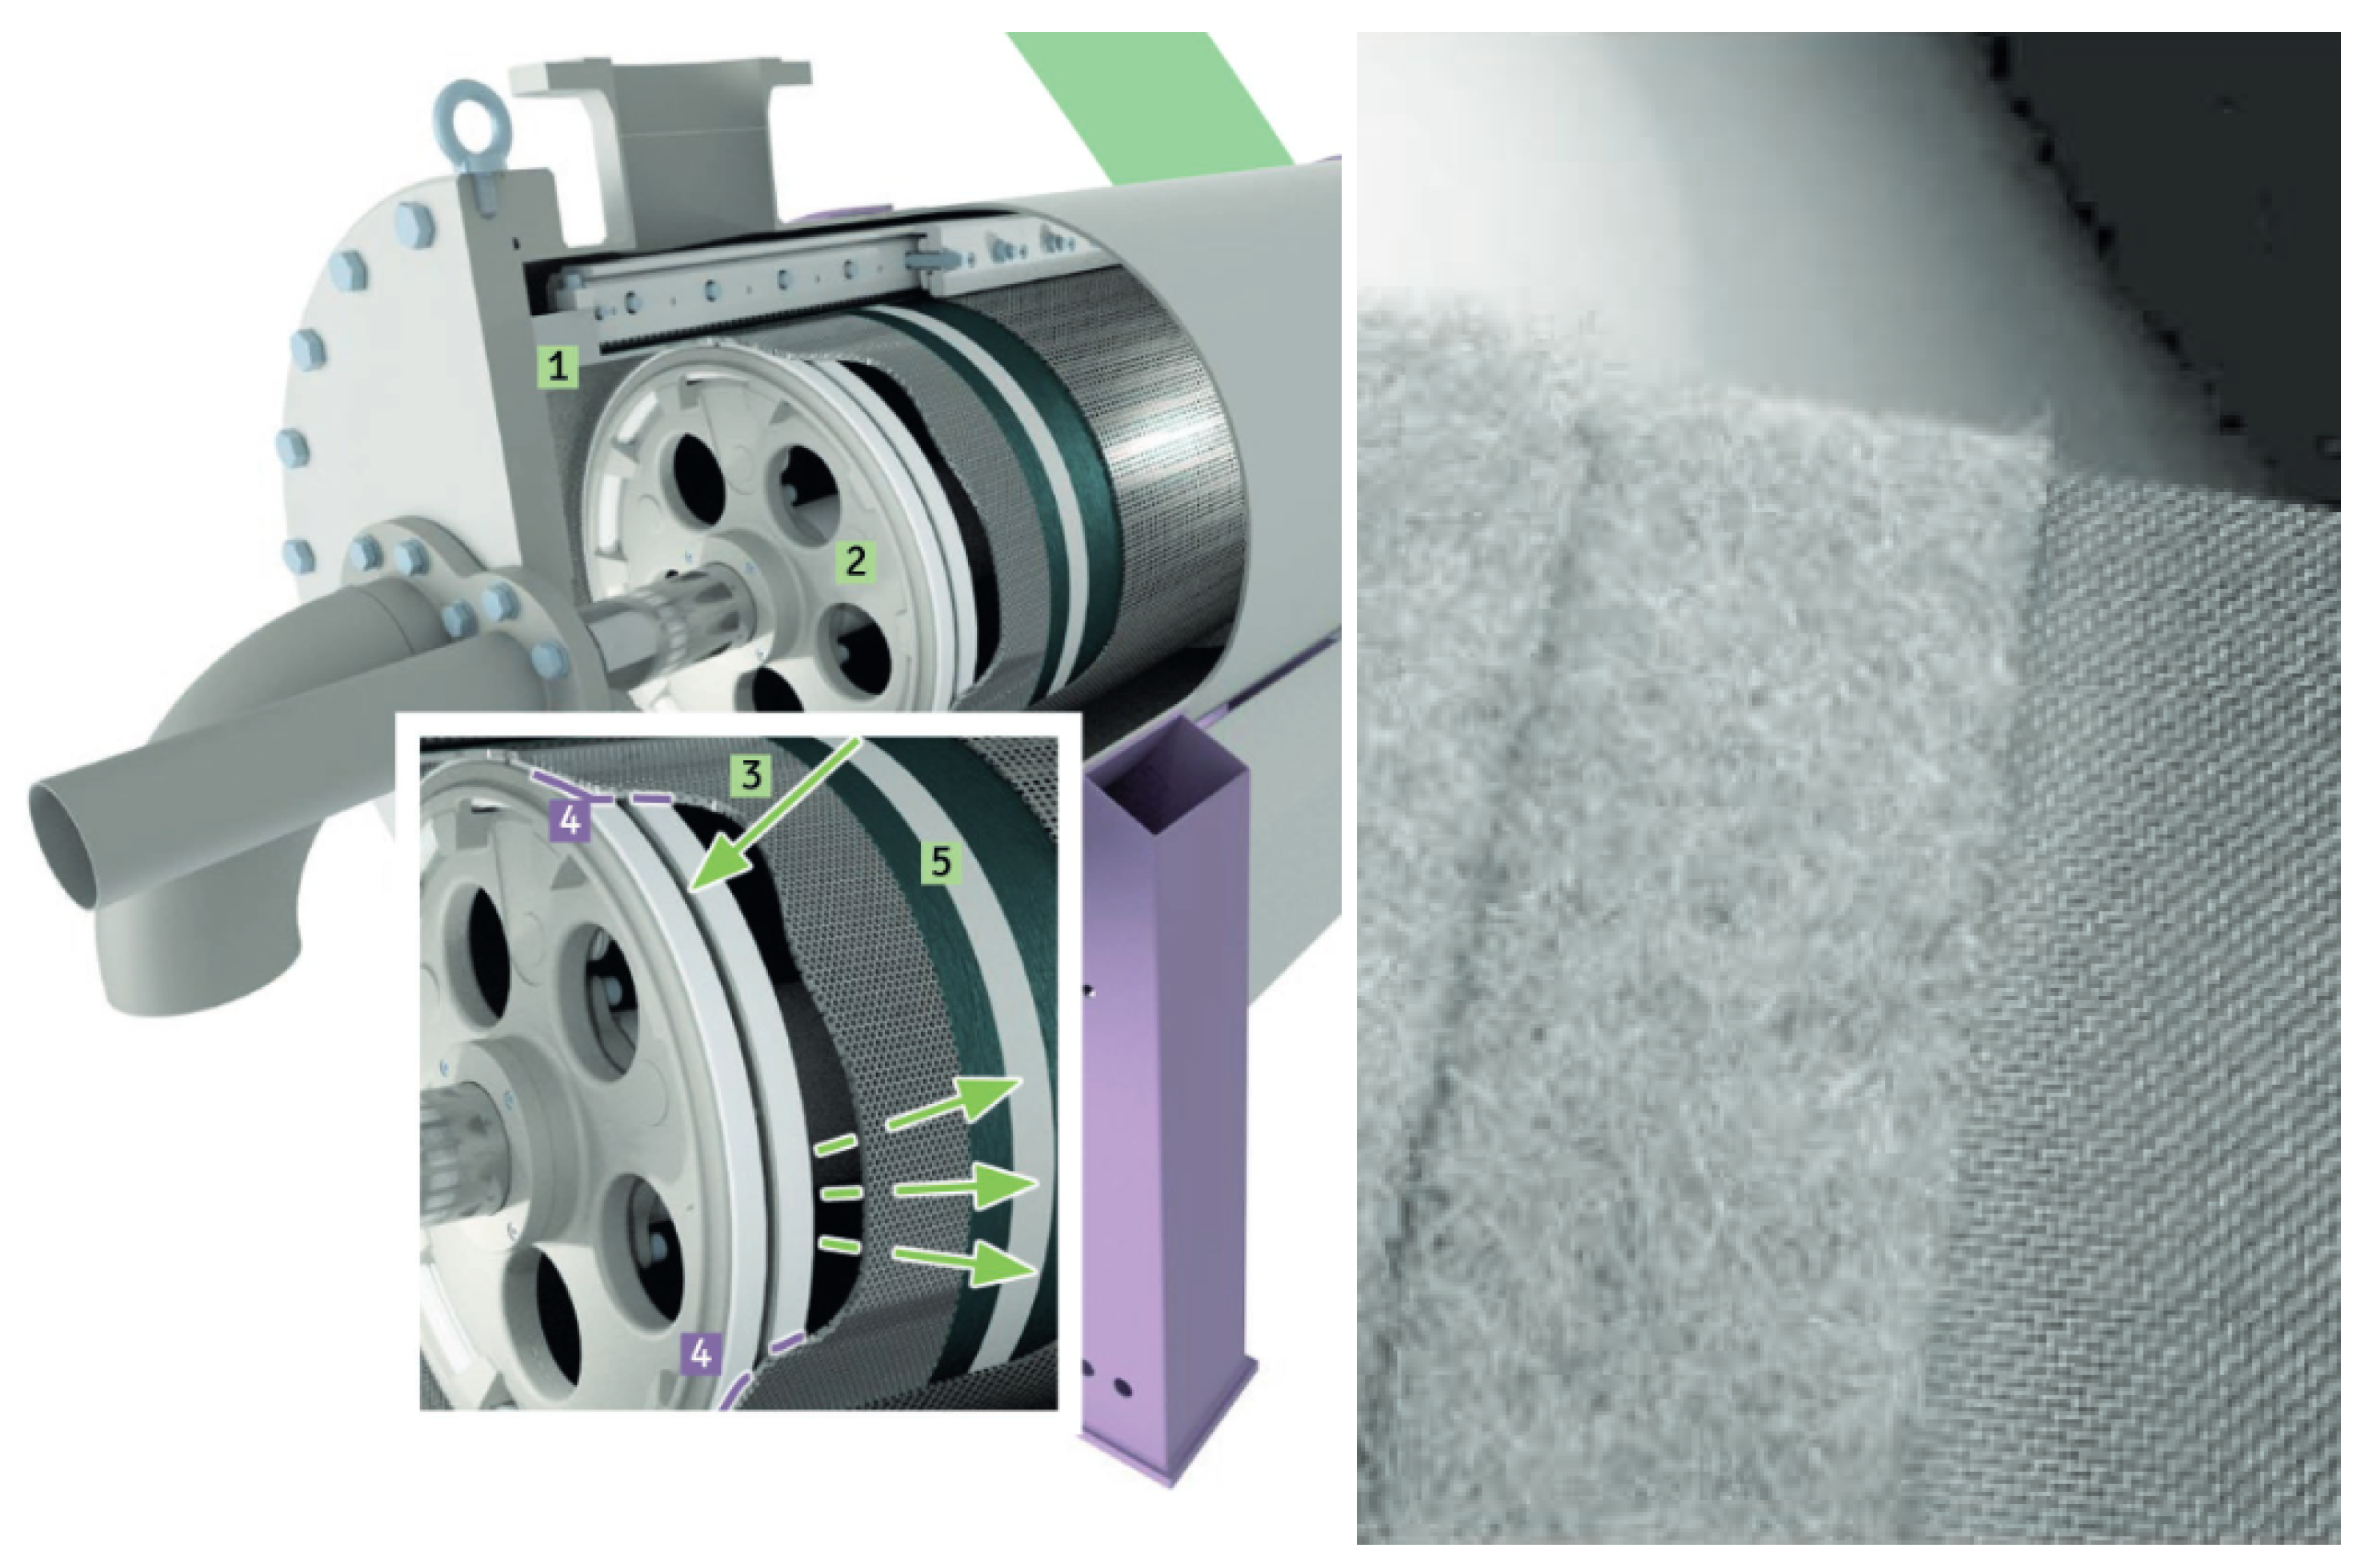
Figure 5.
Exemplified data produced by the filtration machine. Pronounced peaks belong to the rejection phase (yellow highlight), rest is part of the filtration phase
Figure 5.
Exemplified data produced by the filtration machine. Pronounced peaks belong to the rejection phase (yellow highlight), rest is part of the filtration phase
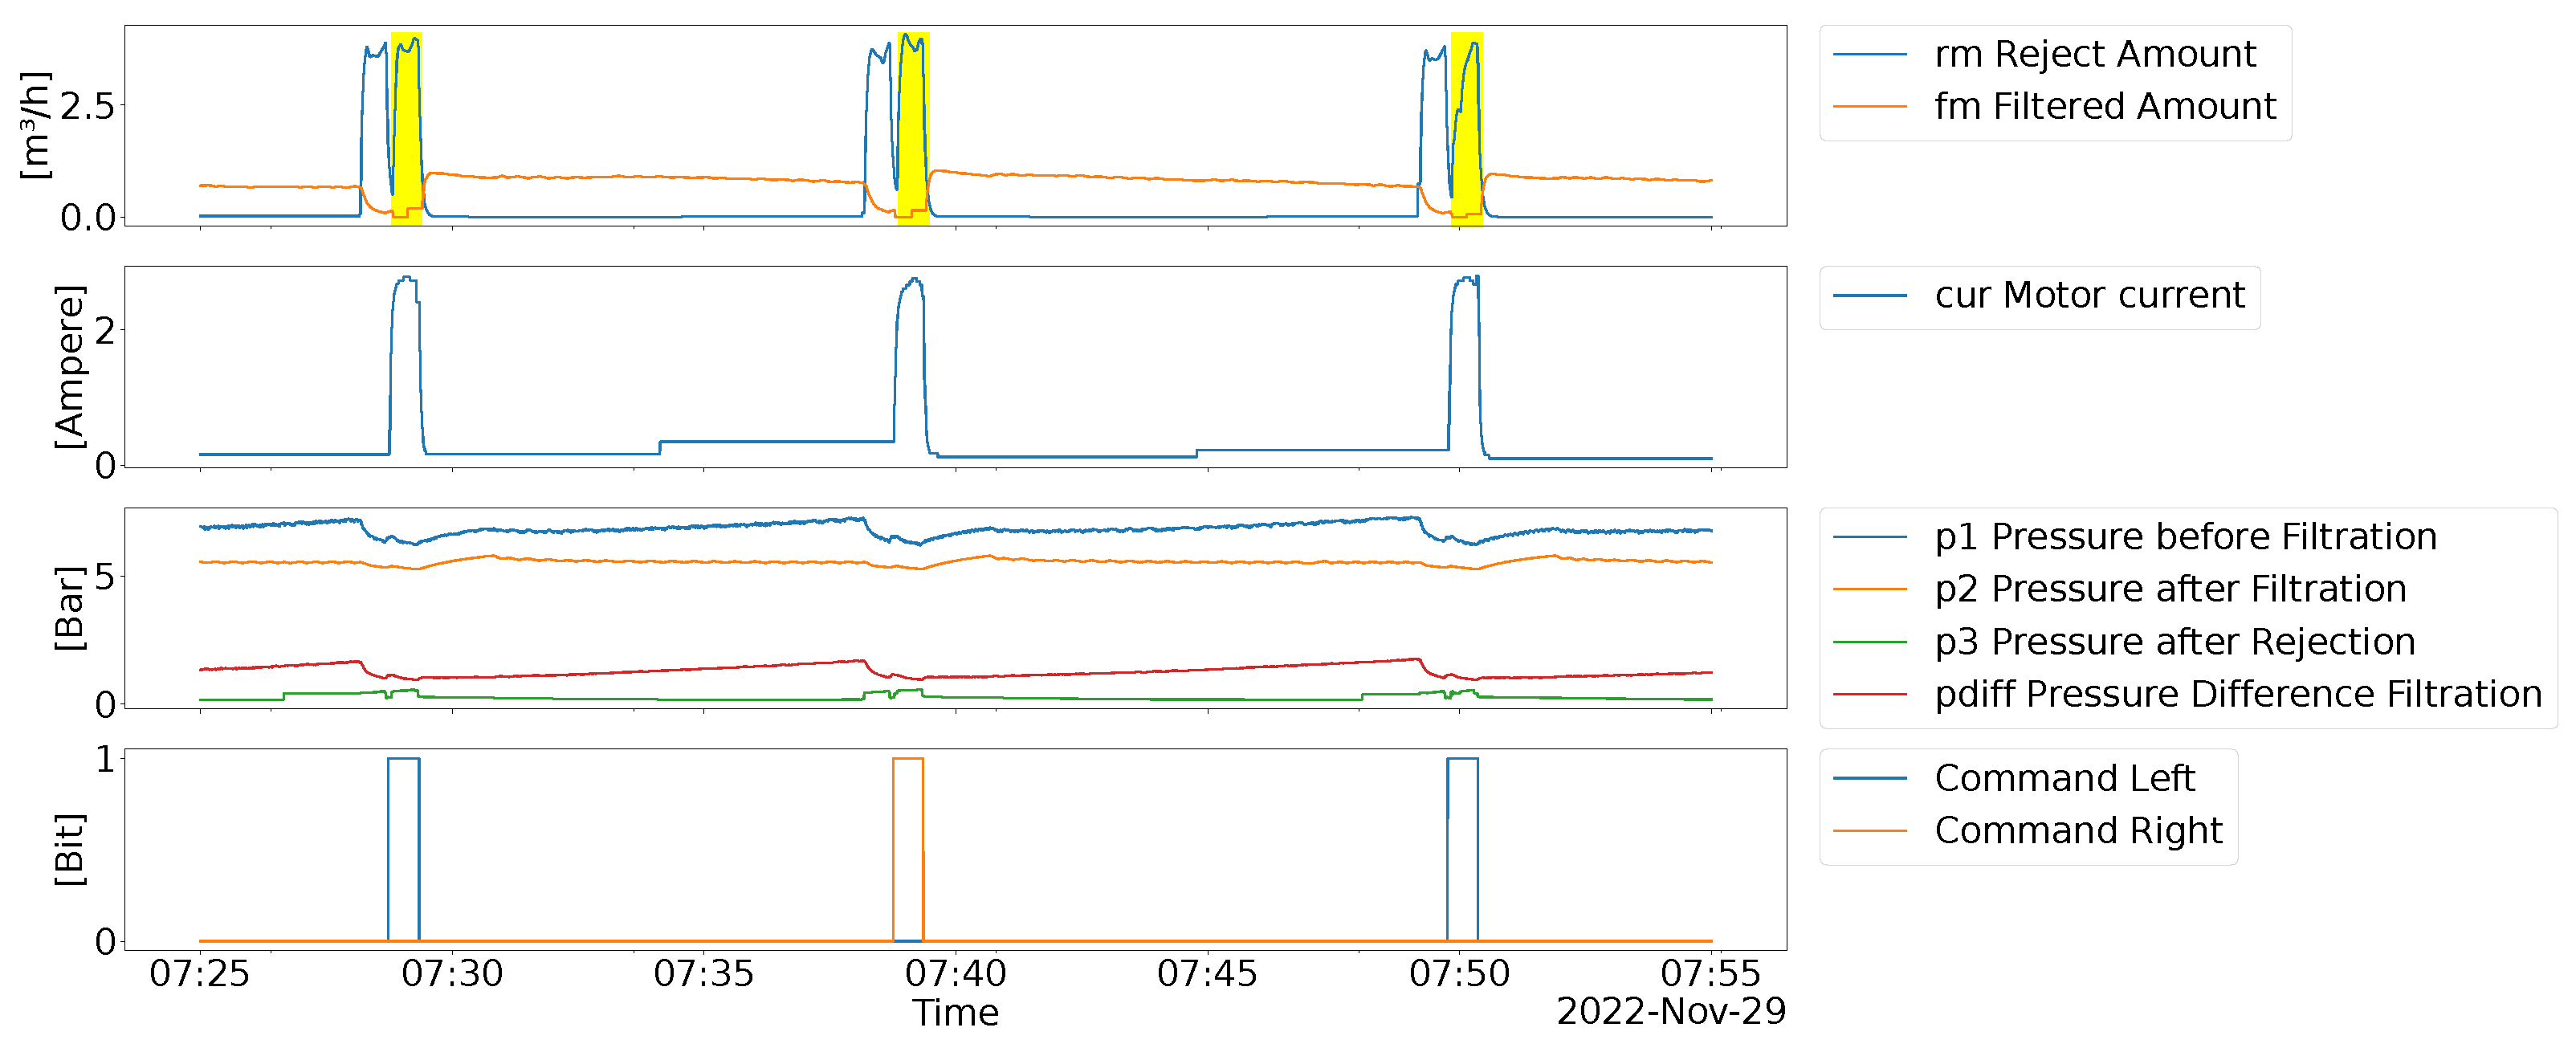
Figure 6.
Sensors Data Acquisition Stage.
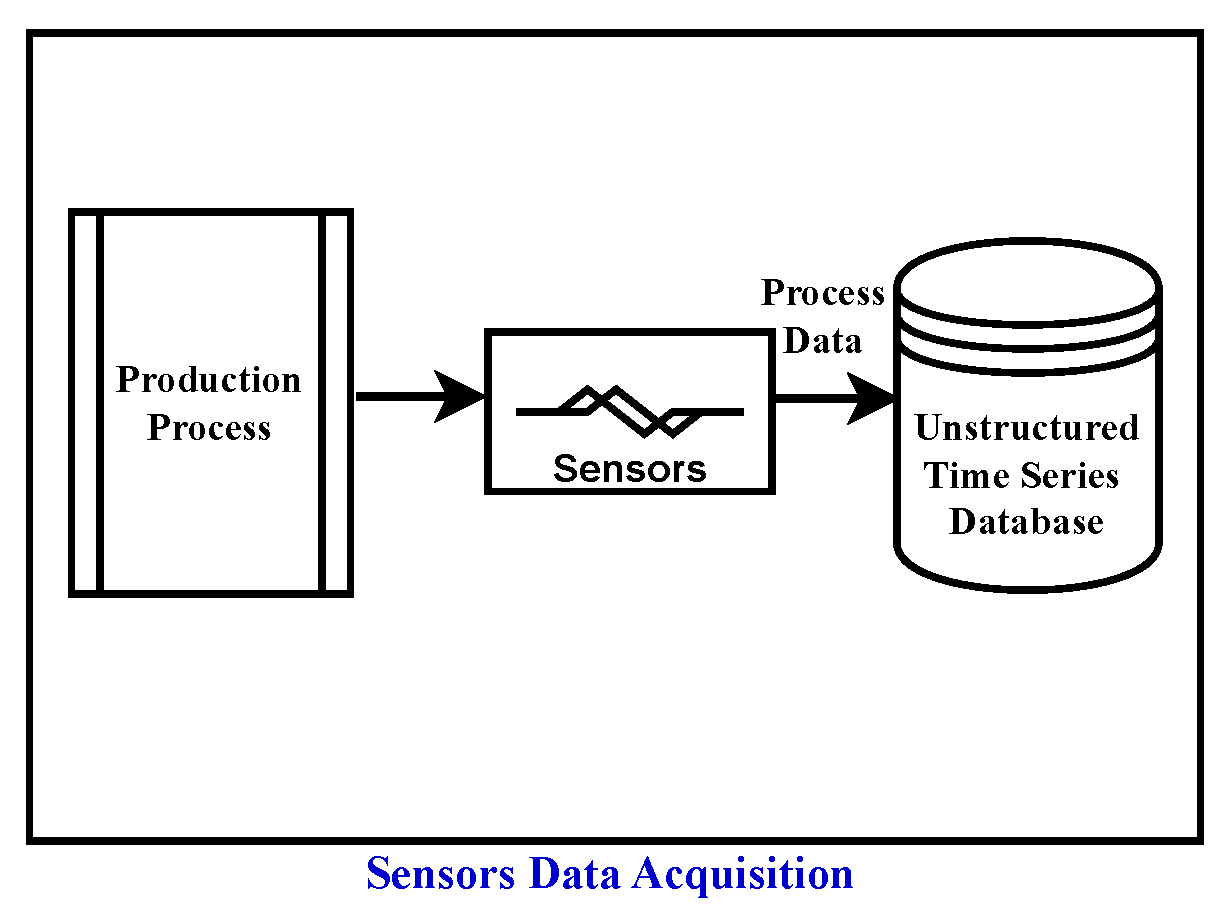
Figure 7.
Sensors Data Preprocessing Stage.
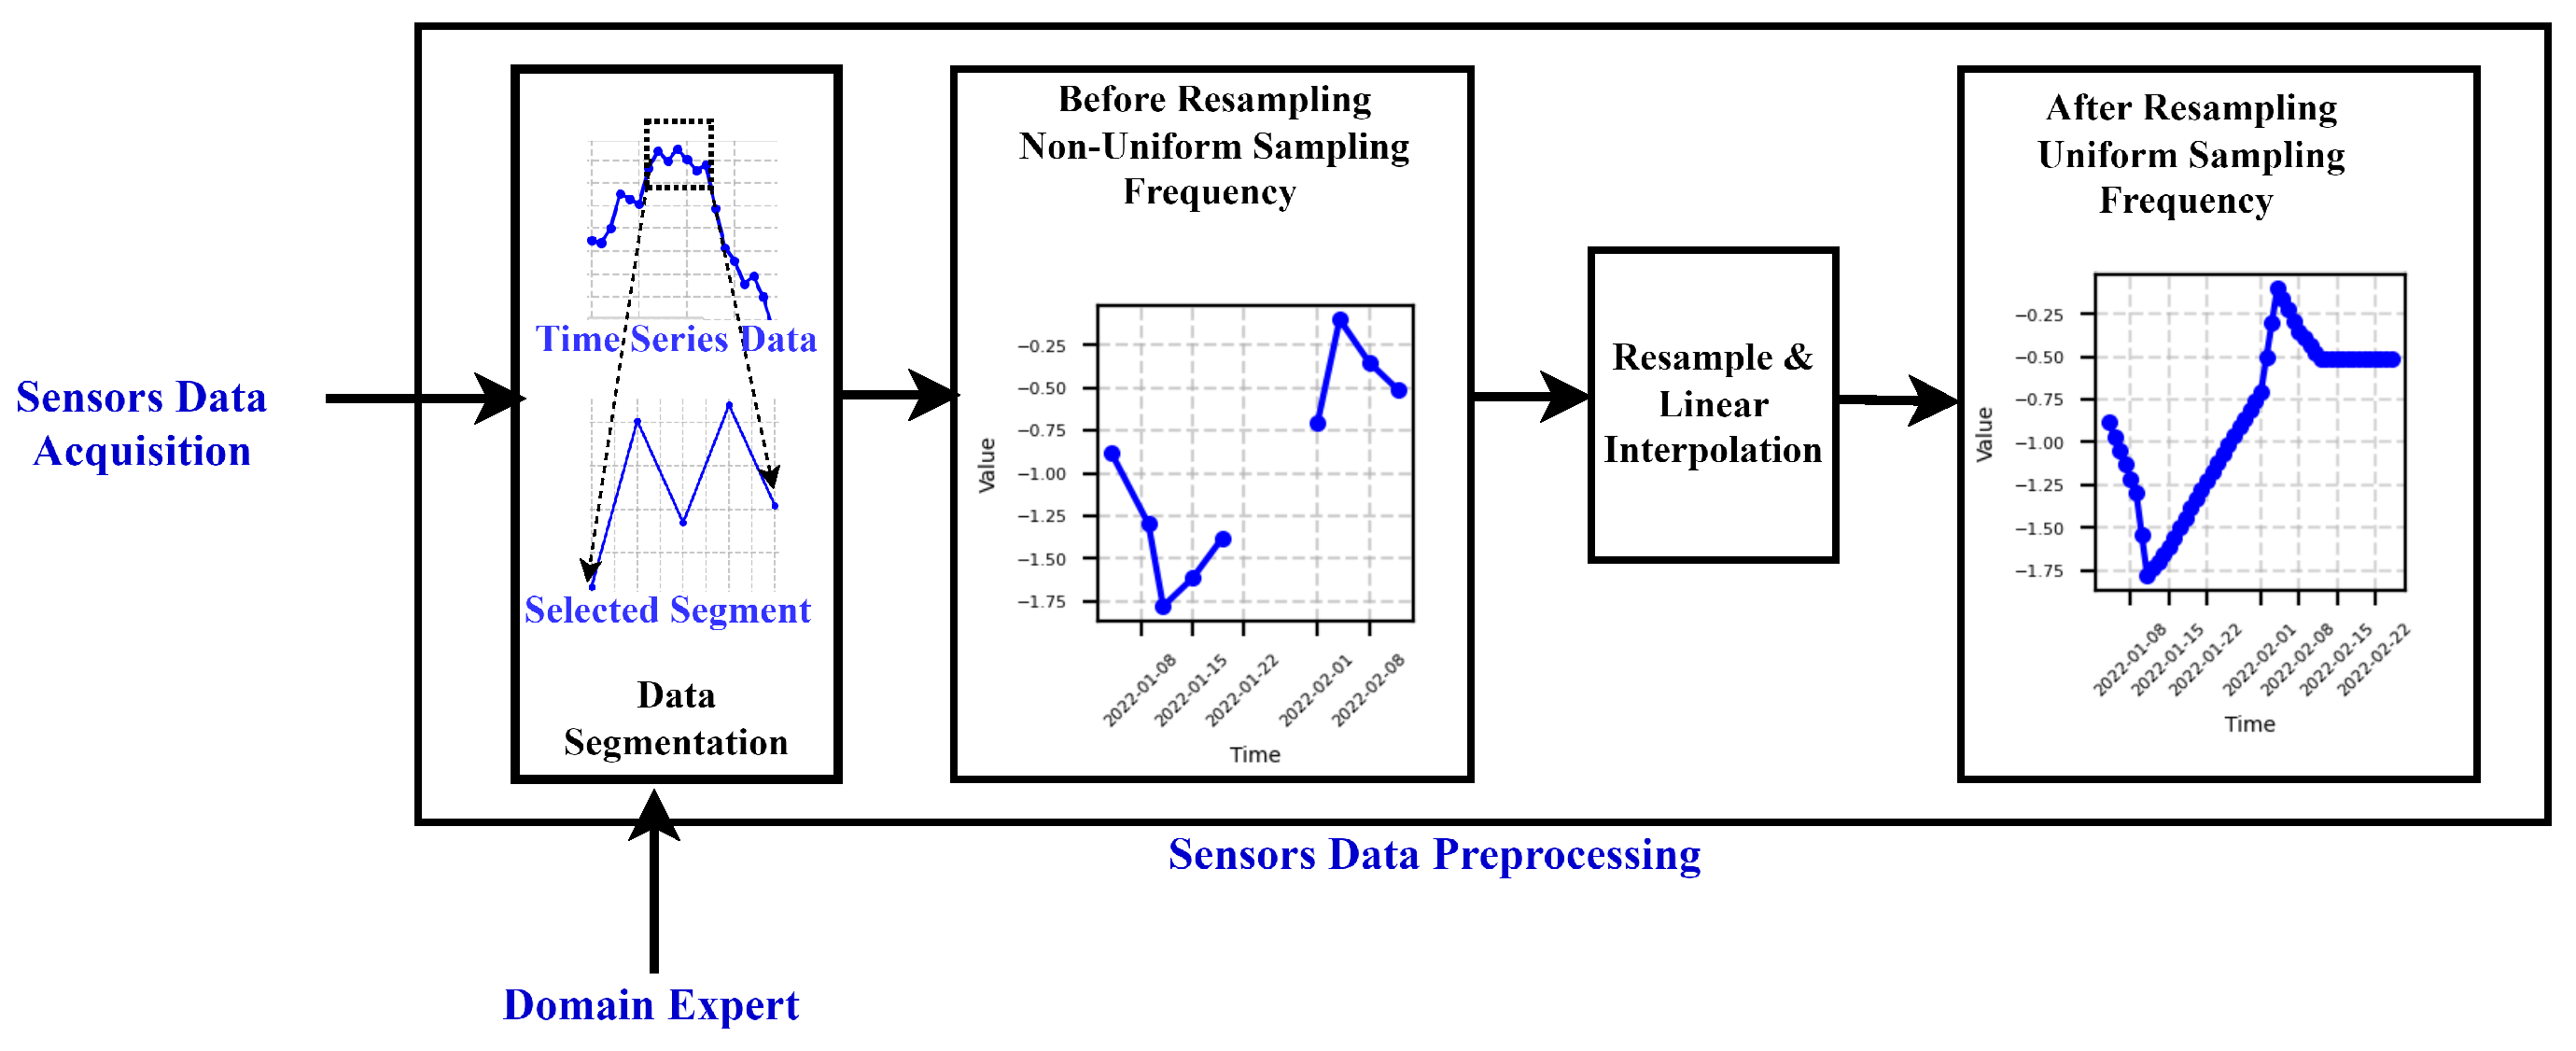
Figure 8.
Causal Discovery Stage.
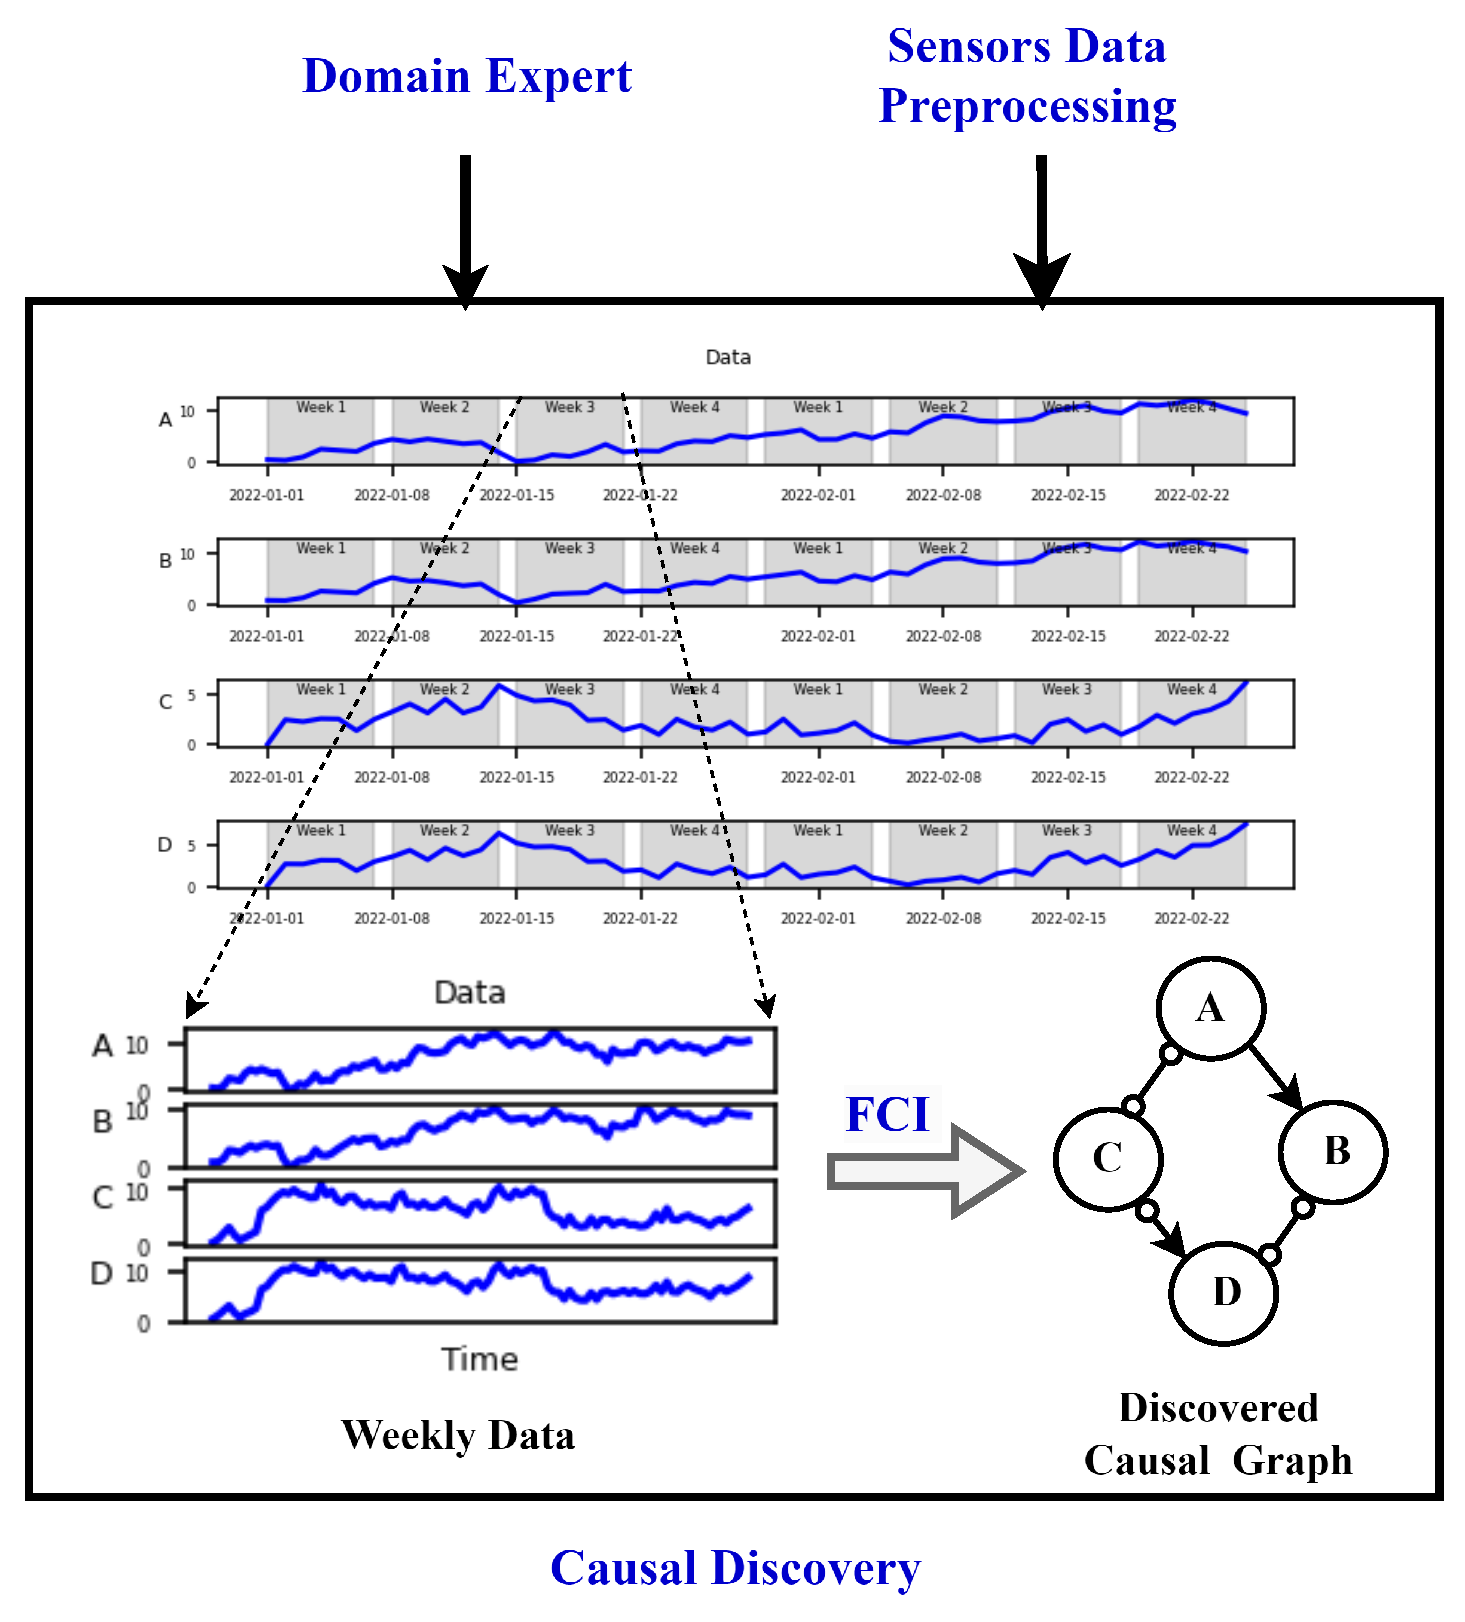
Figure 9.
Causal Graphs and Graph Comparison Stages.
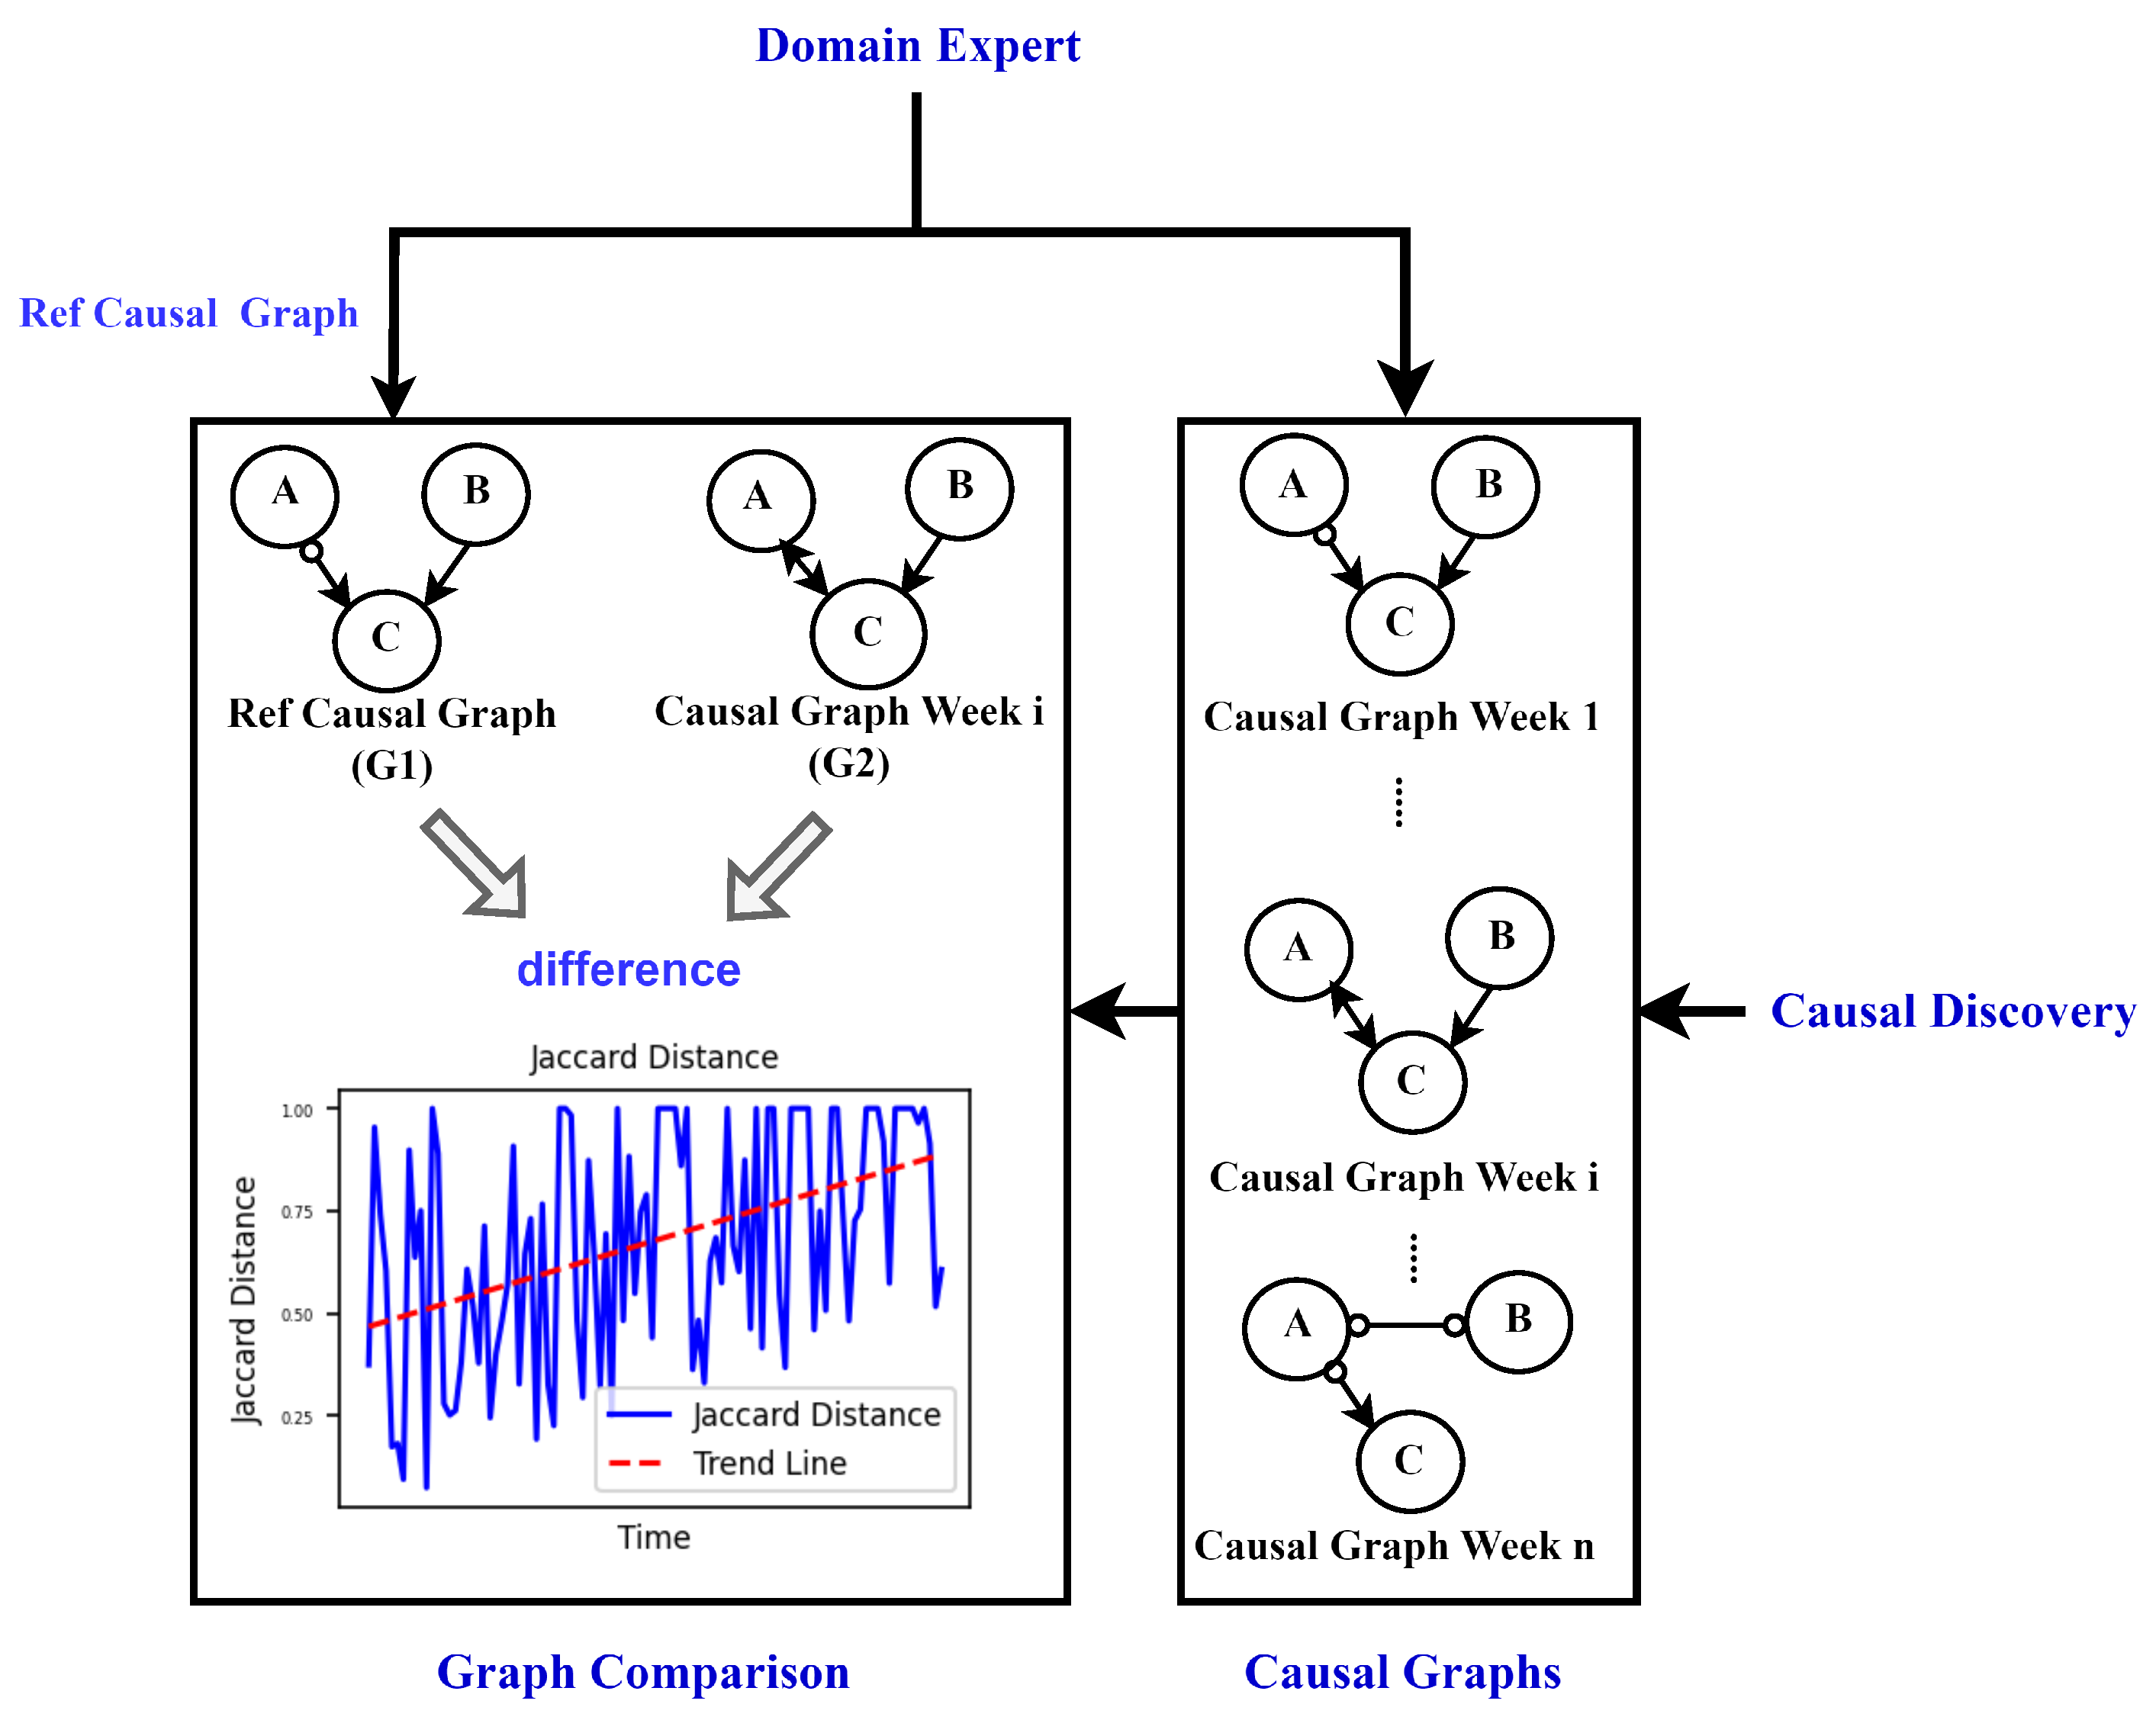
Figure 10.
The heatmap on the left illustrates Jaccard similarity scores for various combinations of causal graphs used as reference graphs during the rejection phase. On the right, accompanying boxplots display the distribution of Jaccard similarity scores when a specific graph is selected as the reference and compared to the other causal graphs. The highlighted purple boxplot represents the chosen causal graph used as the ultimate reference, situated on 09-11th Aug 2022. This boxplot exhibits the highest median and is closest to the date of the sieve change, making it the selected reference graph for further analysis.
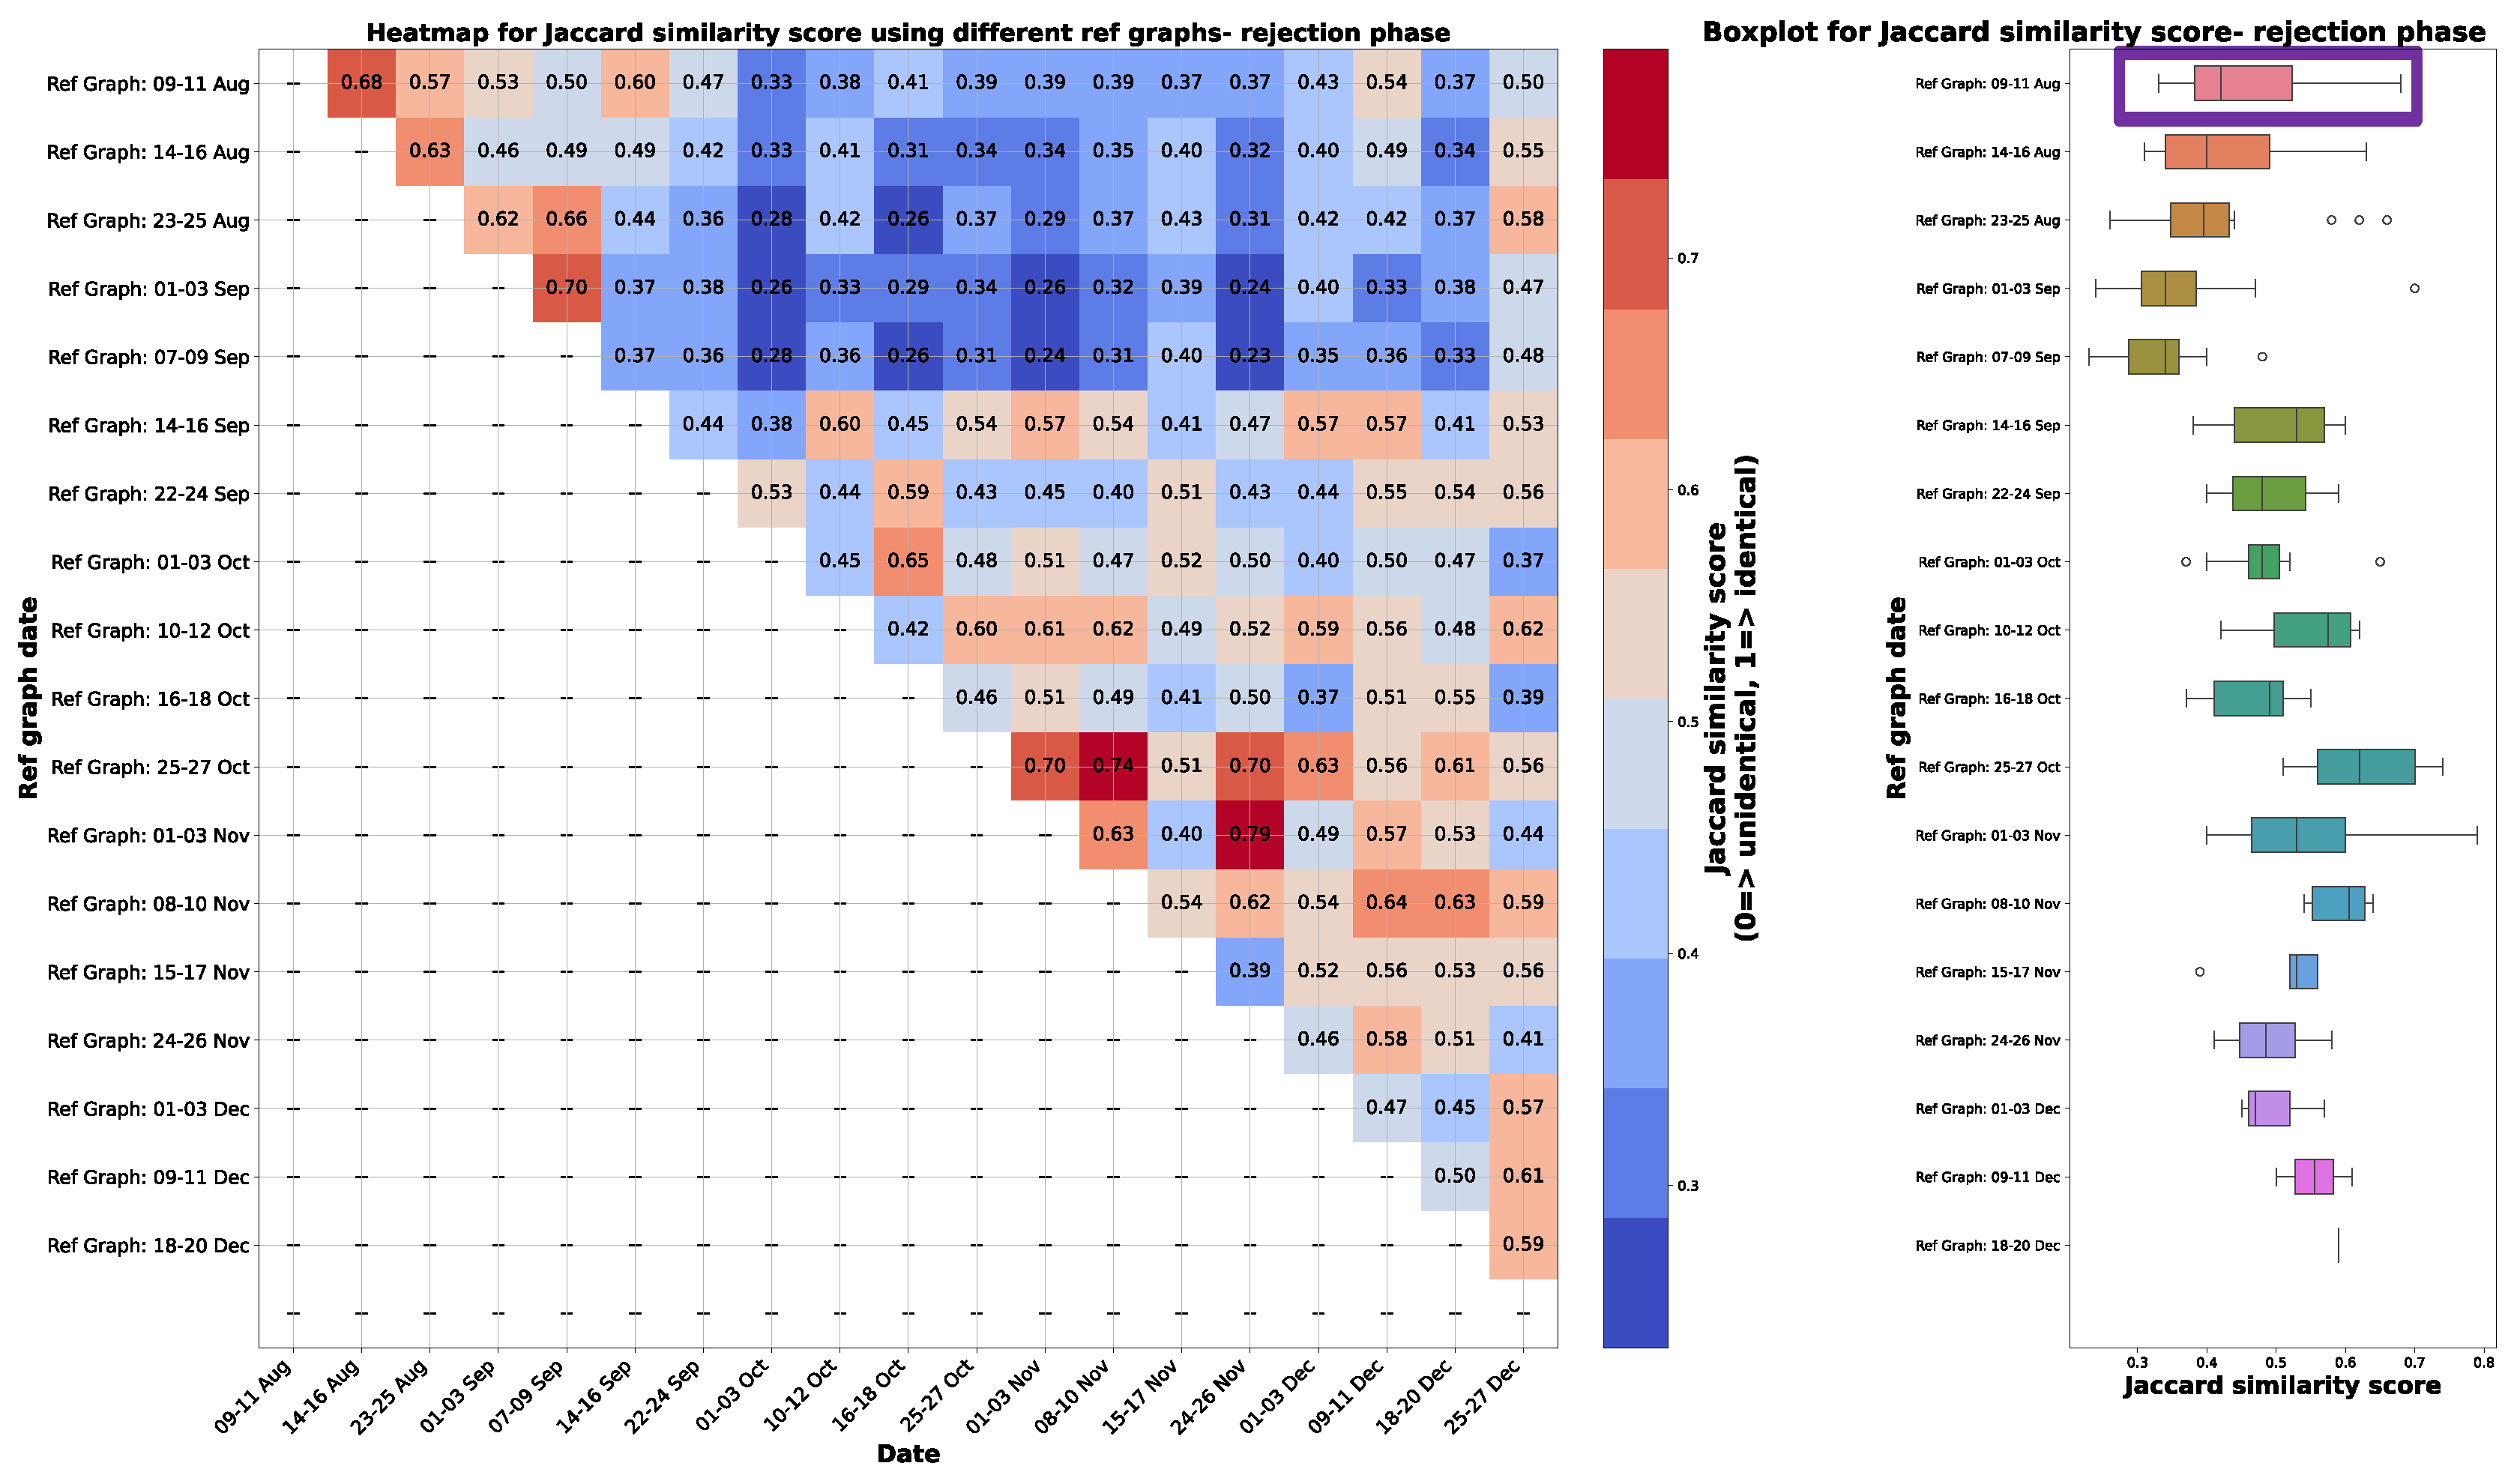
Figure 11.
Jaccard distance for graphs obtained by using data from 2days/ week when compared to a graph on 09-11 August during the rejection phase.
Figure 11.
Jaccard distance for graphs obtained by using data from 2days/ week when compared to a graph on 09-11 August during the rejection phase.
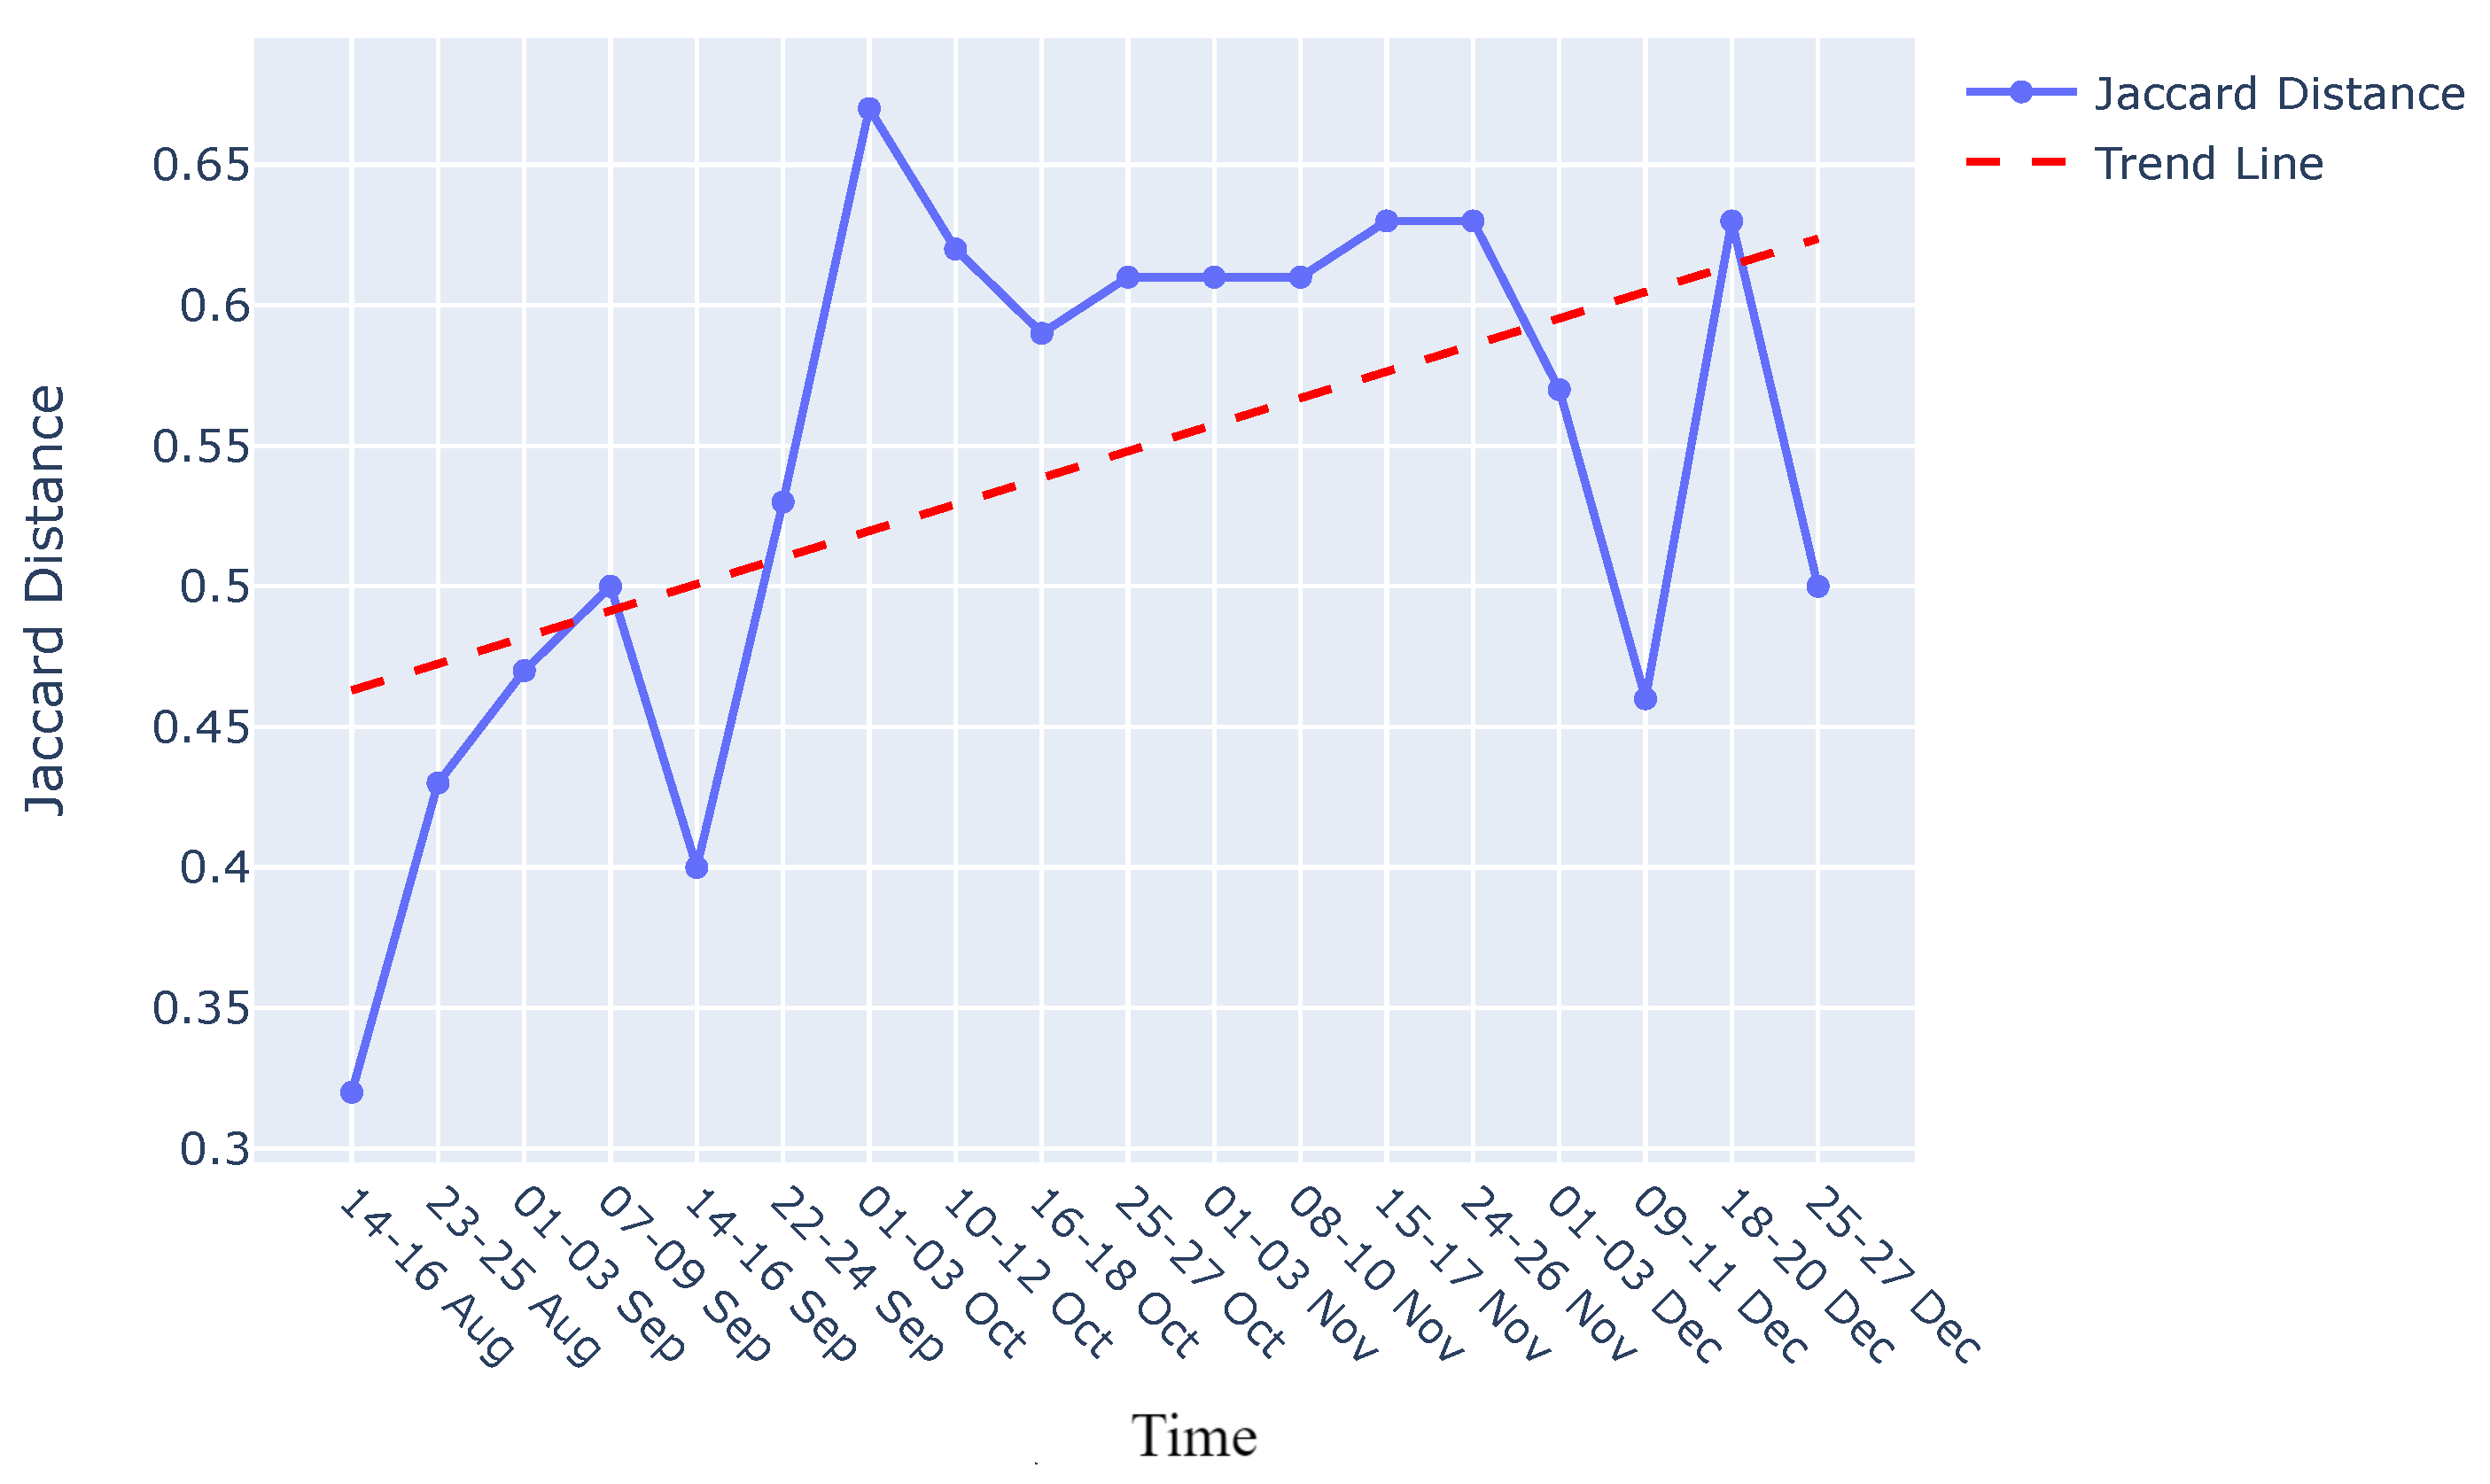
Figure 12.
Interpretability Stage.
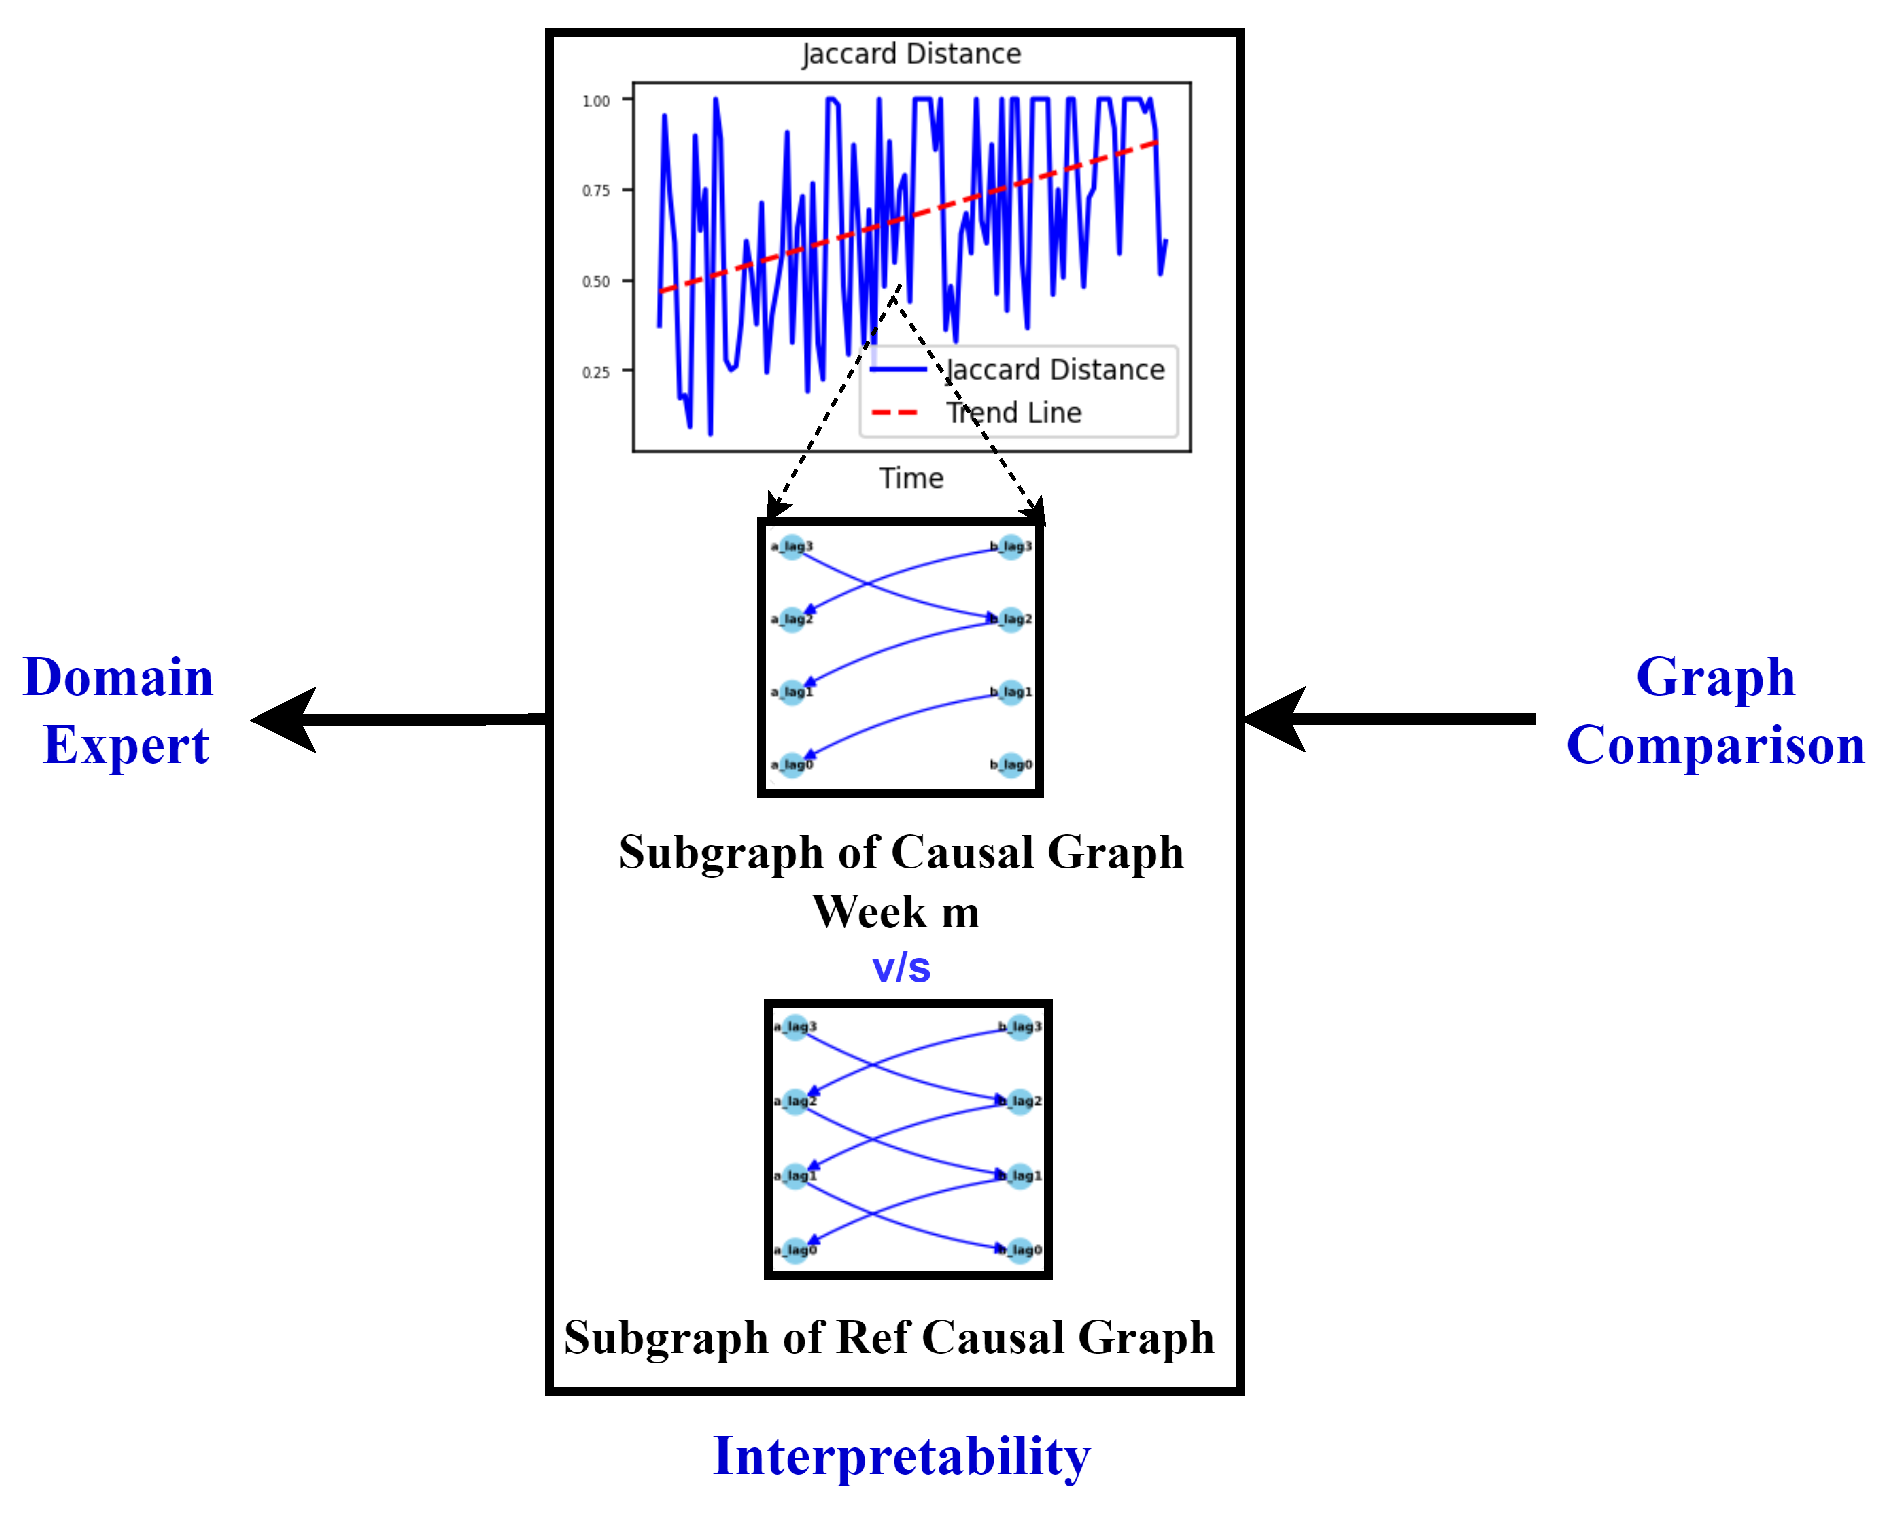
Figure 13.
Extraction of causal graphs for 09-11 August and 01-03 October. (a) Simplified reference causal graph (09-11 August), (b) Subgraph of the reference graph with features p1 and pdiff, (c) Simplified causal graph for 01-03 October, (d) Subgraph of causal graph for 01-03 October.
Figure 13.
Extraction of causal graphs for 09-11 August and 01-03 October. (a) Simplified reference causal graph (09-11 August), (b) Subgraph of the reference graph with features p1 and pdiff, (c) Simplified causal graph for 01-03 October, (d) Subgraph of causal graph for 01-03 October.
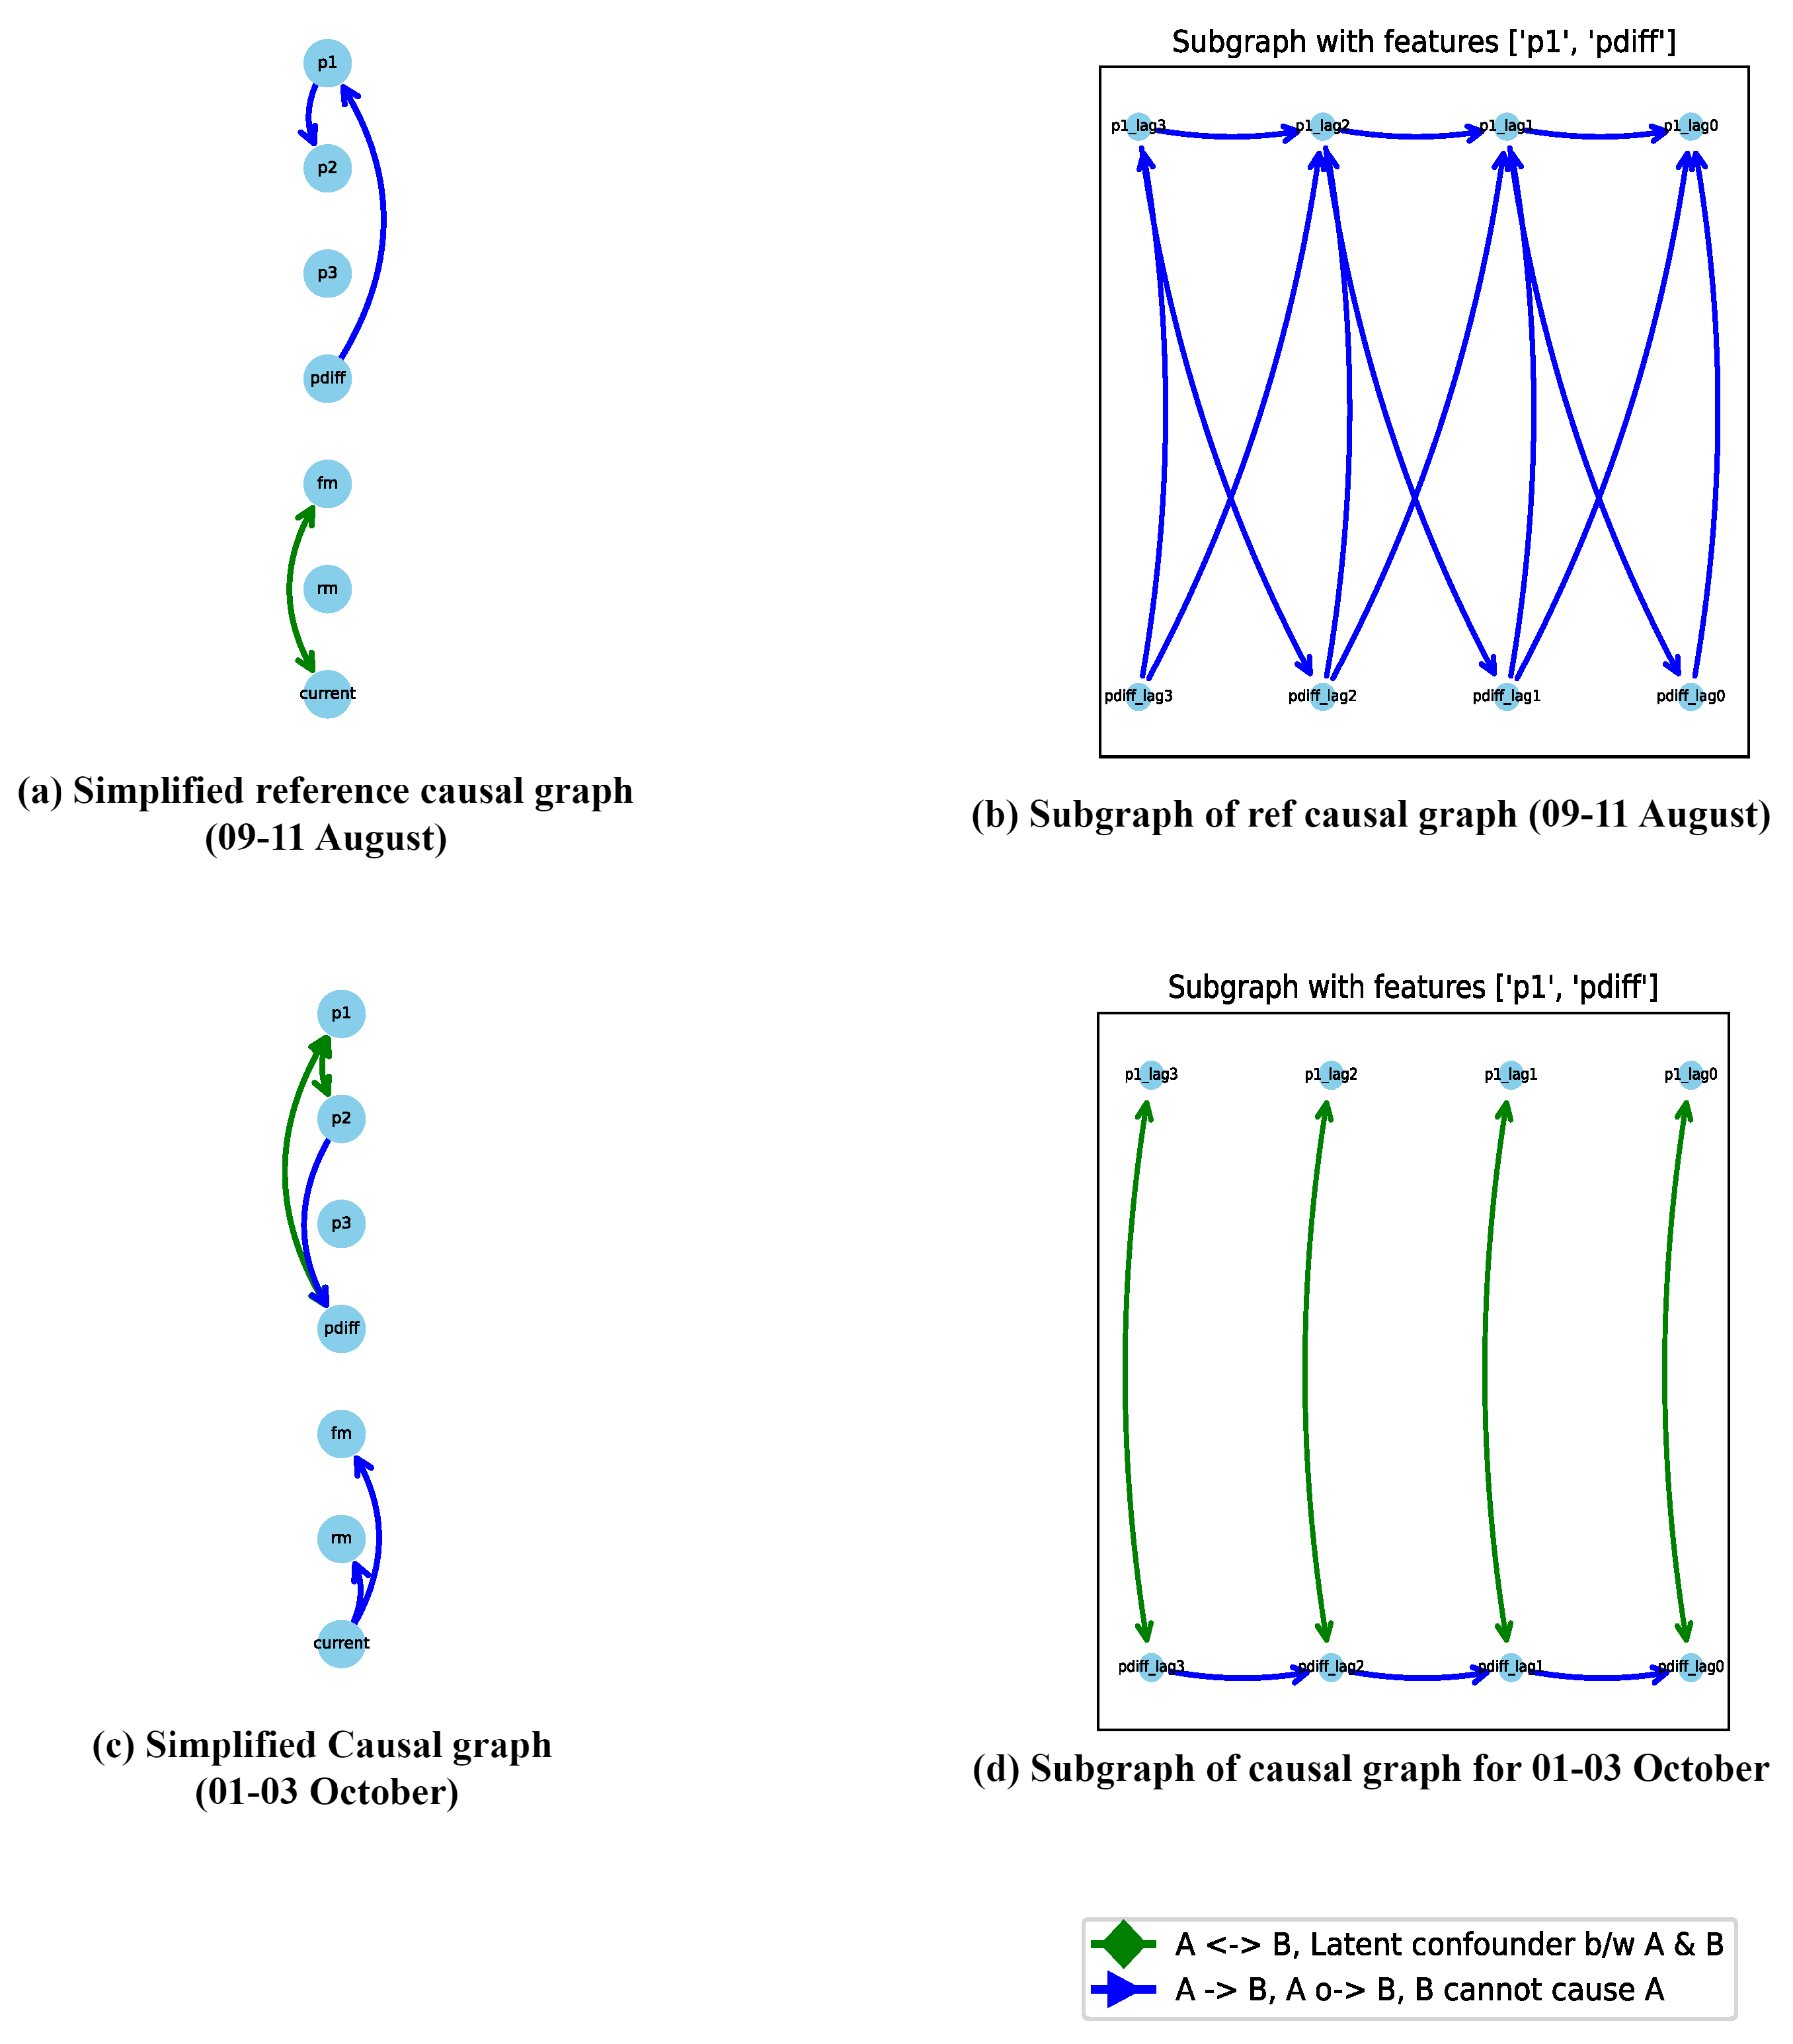
Figure 14.
Visualisation of the changes in the relation between the features p1 and pdiff over time. Starting with week 11-16 September we see the introduction of additional confounders hinting to changes in the underlying process.
Figure 14.
Visualisation of the changes in the relation between the features p1 and pdiff over time. Starting with week 11-16 September we see the introduction of additional confounders hinting to changes in the underlying process.
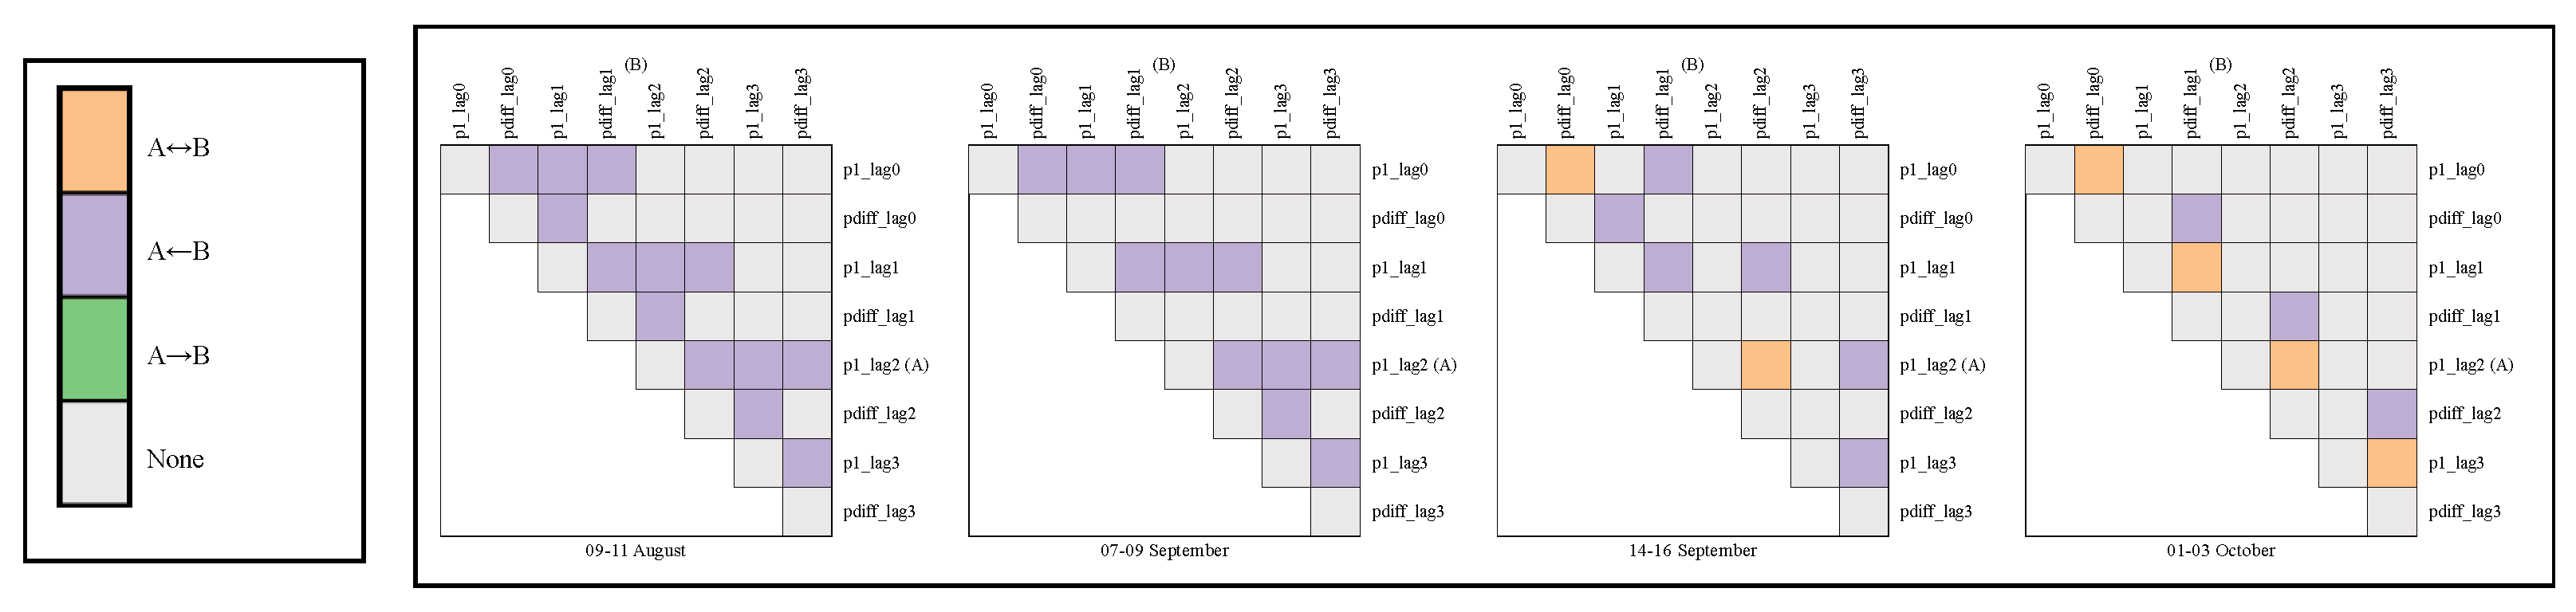
Figure 15.
Distribution of the reconstruction loss (Mean absolute error) on the training dataset with a threshold set at which is 99 percentile of the mean absolute error for the rejection phase.
Figure 15.
Distribution of the reconstruction loss (Mean absolute error) on the training dataset with a threshold set at which is 99 percentile of the mean absolute error for the rejection phase.
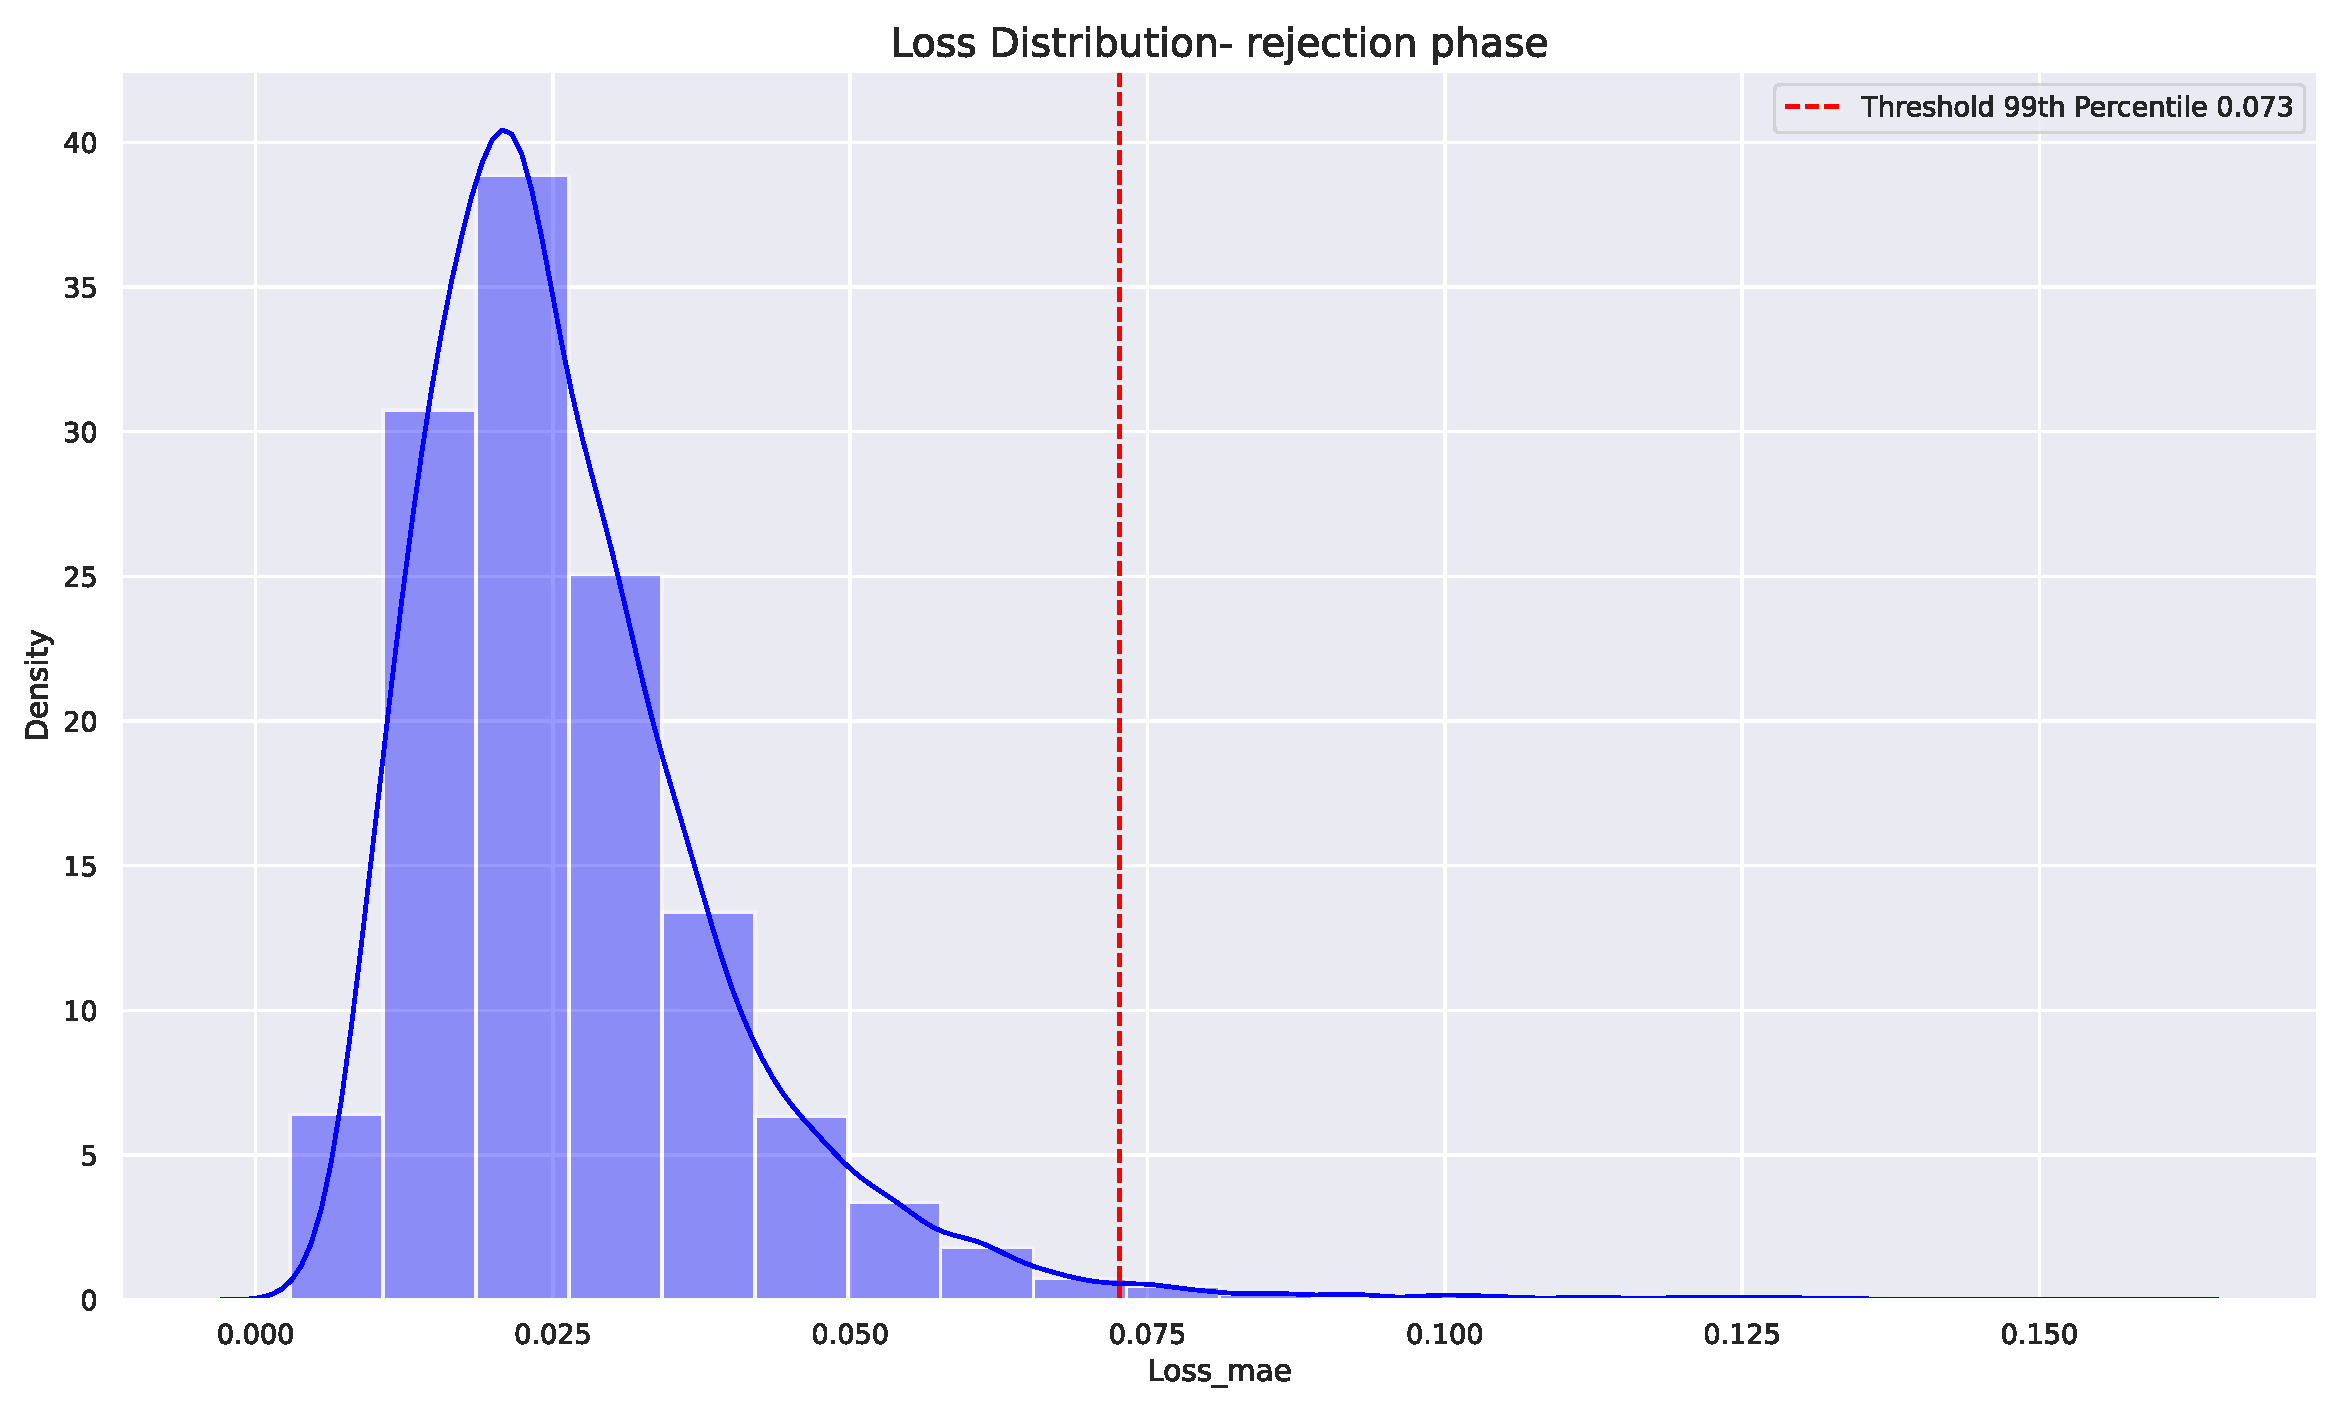
Figure 16.
Degradation monitoring for rejection phase using (a) LSTM based Autoencoder (b) Jaccard distance.
Figure 16.
Degradation monitoring for rejection phase using (a) LSTM based Autoencoder (b) Jaccard distance.
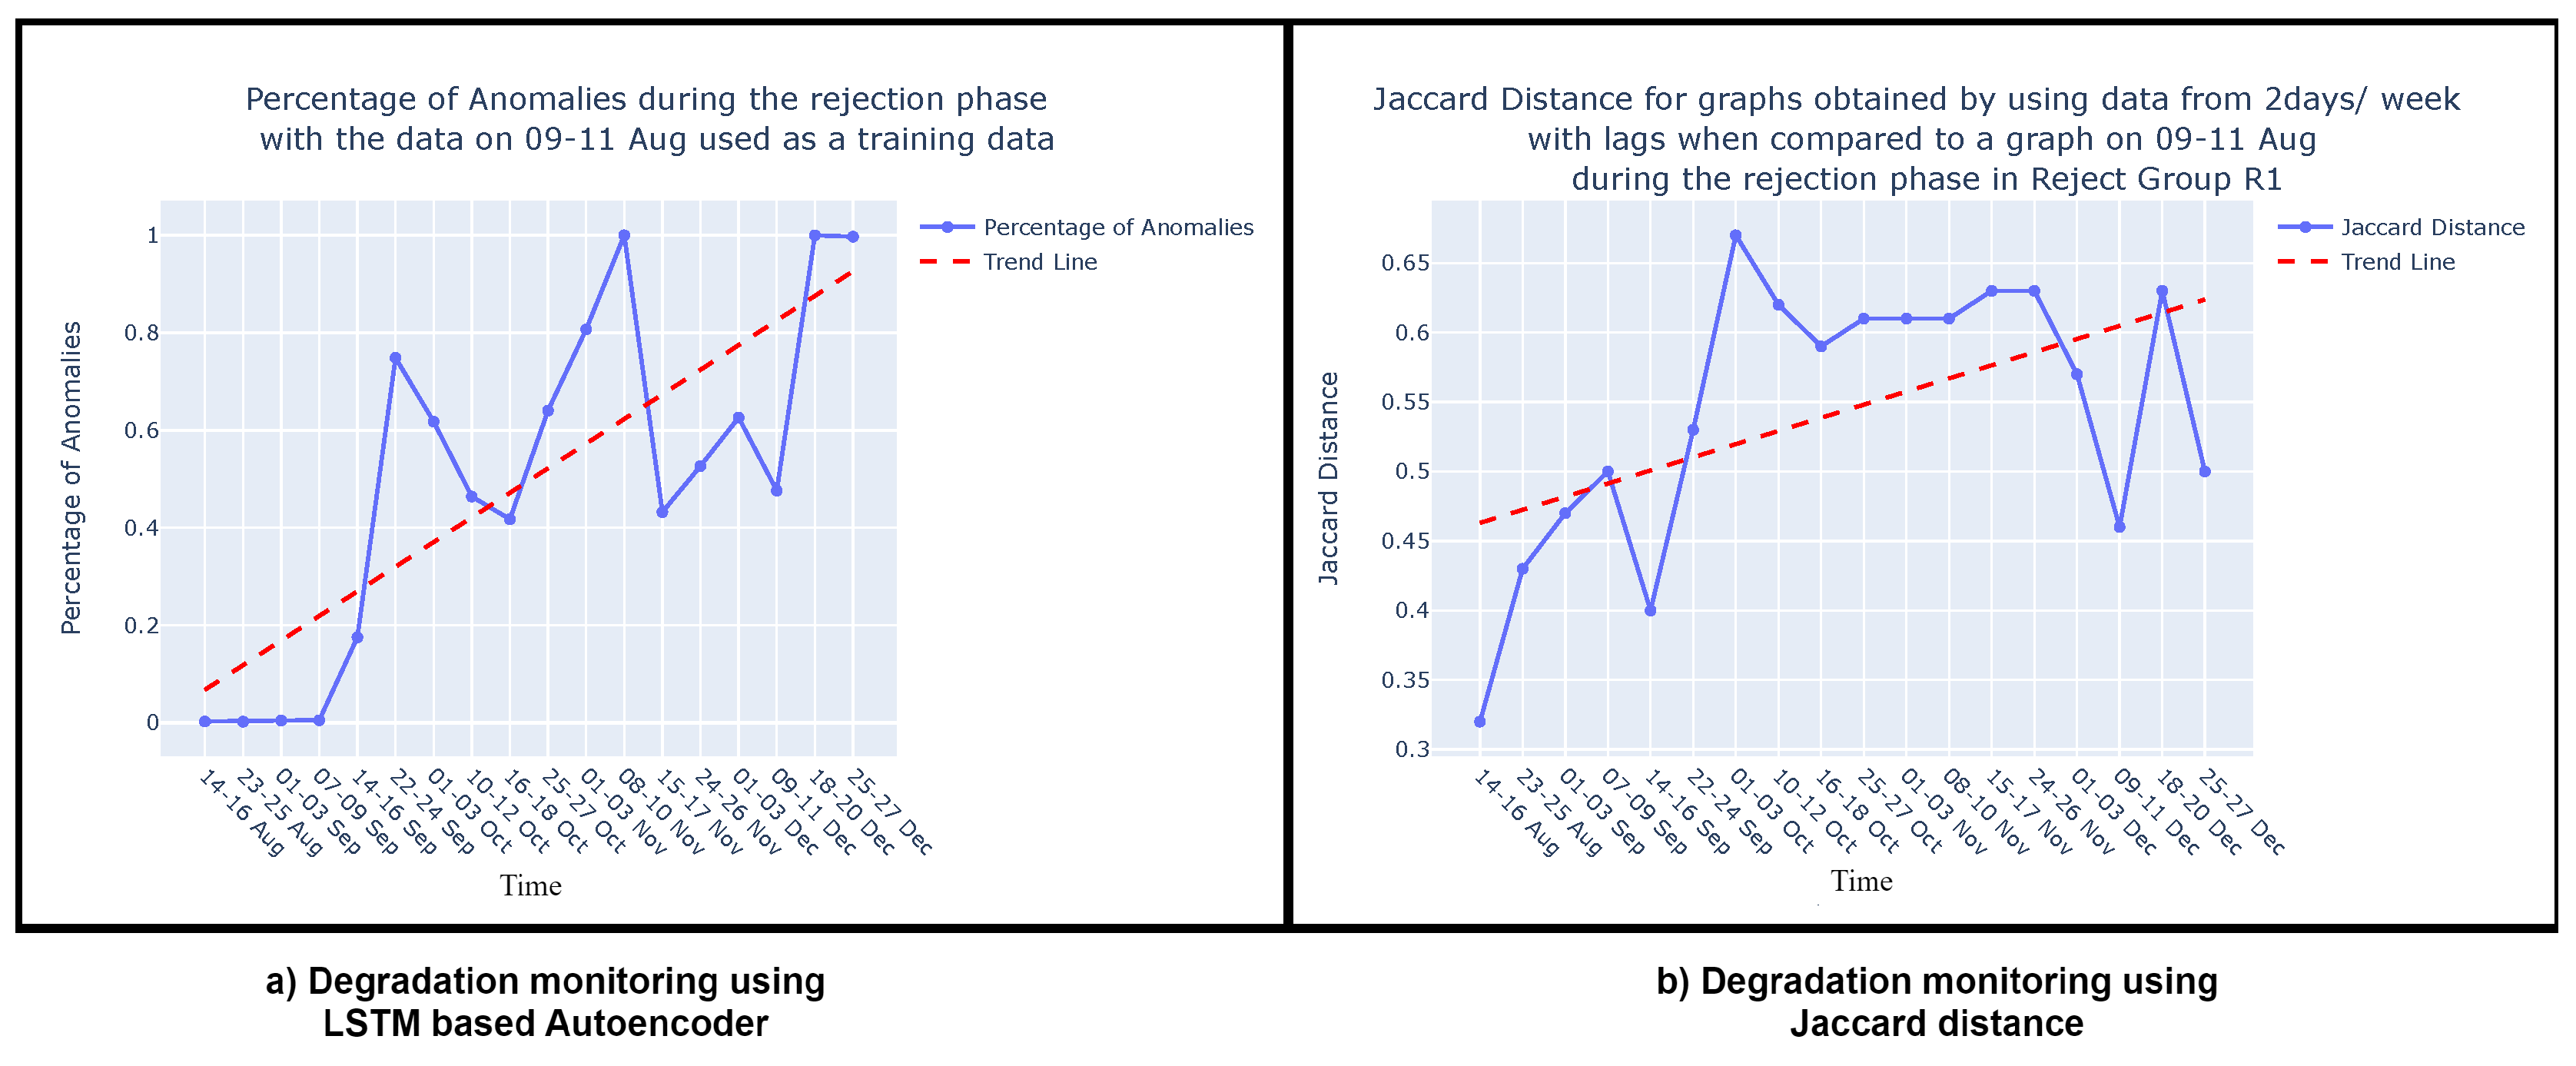
Figure 17.
Percentage of anomalies over the period of time in the rejection phase.
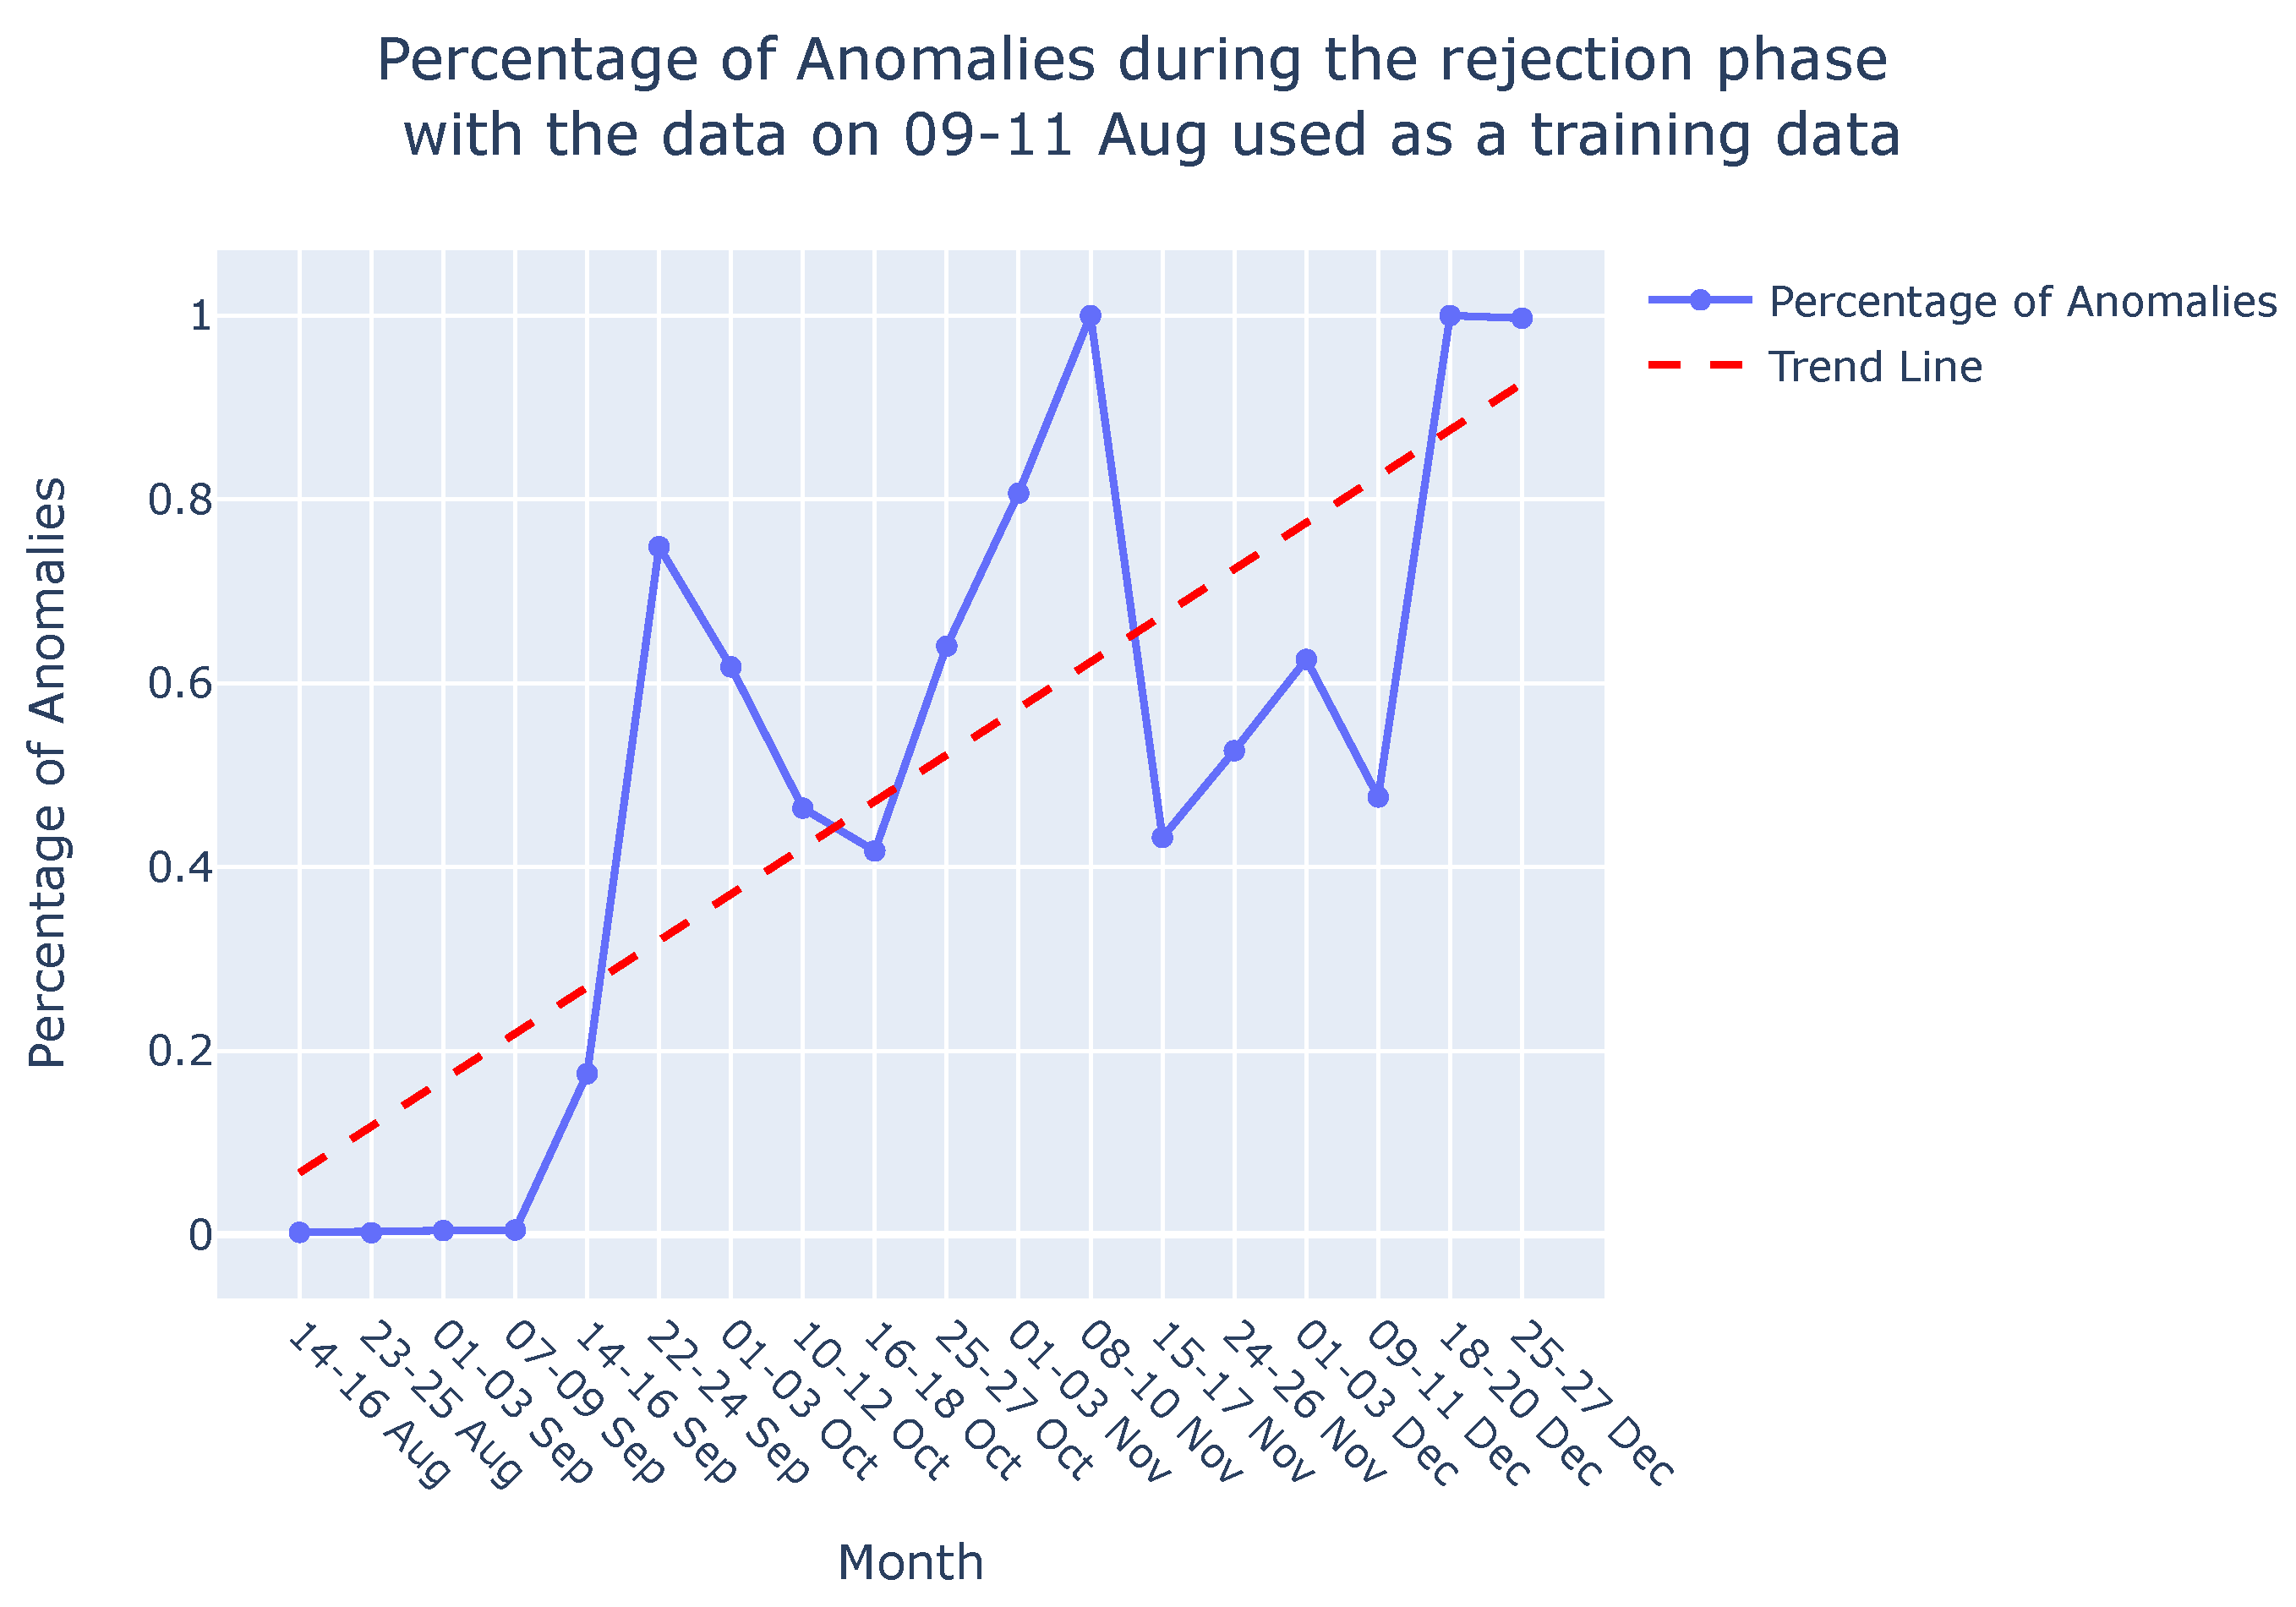

Table 1.
Information about the sensors used.
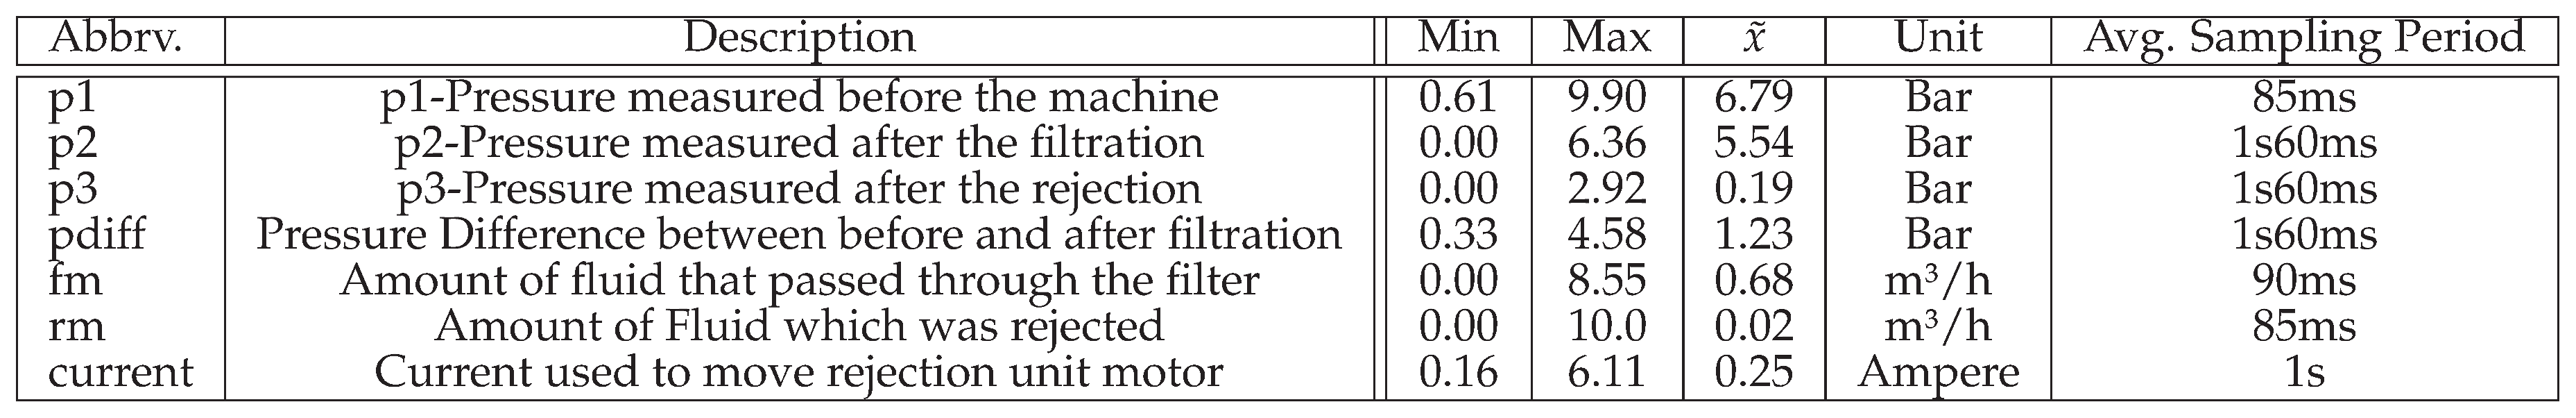
Disclaimer/Publisher’s Note: The statements, opinions and data contained in all publications are solely those of the individual author(s) and contributor(s) and not of MDPI and/or the editor(s). MDPI and/or the editor(s) disclaim responsibility for any injury to people or property resulting from any ideas, methods, instructions or products referred to in the content. |
© 2024 by the authors. Licensee MDPI, Basel, Switzerland. This article is an open access article distributed under the terms and conditions of the Creative Commons Attribution (CC BY) license (http://creativecommons.org/licenses/by/4.0/).
Copyright: This open access article is published under a Creative Commons CC BY 4.0 license, which permit the free download, distribution, and reuse, provided that the author and preprint are cited in any reuse.


