Submitted:
15 February 2024
Posted:
16 February 2024
You are already at the latest version
Abstract
Combined radiation with hemorrhage (combined injury, CI), exacerbates hematopoietic acute radiation syndrome and mortality compared to radiation alone (RI). We evaluated the effects of RI or CI on blood cell depletion as a biomarker to differentiate the two. Male CD2F1 mice were exposed to 8.75 Gy γ- radiation (60Co). Within 2 h of RI, animals were bled under anesthesia 0% (RI) or 20% (CI) of total blood volume. Blood samples were collected at 4-5 h and days 1, 2, 3, 7, and 15 after RI. CI decreased WBC at 4-5 h and continued to decrease them until day 3; counts then stayed at the nadir up to day 15. CI decreased neutrophils, lymphocytes, monocytes, eosinophils and basophils more than RI on day 1 or day 2. CI decreased RBCs, hemoglobin and hematocrit on days 7 and 15 compared to RI, whereas Hemorrhage alone returned to the baseline on days 7 and 15. RBCs depleted after CI faster than post RI. Hemorrhage alone increased platelet counts on days 2, 3, and 7, which returned to the baseline on day 15. Our data suggest that WBC depletion may be a biomarker within 2 days post-CI and RBC depletion after 3 days post-CI.
Keywords:
mouse
; radiation
; hemorrhage
; white blood cell
; red blood cell
; platelet
1. Introduction
Victims that are exposed to radiation are frequently exposed to other trauma, for instance, wounds, brain injuries, bone fractures, burns, or hemorrhage (Hemo). After the bombings at Hiroshima and Nagasaki, appreciable cases of these combined injuries were detected [1,2]. Furthermore, many victims at the Chernobyl reactor meltdown were exposed to radiation combined with another trauma [3]. In rodent models, combined radiation and trauma injury (CI) increased organ damage and fatality after otherwise nonlethal irradiation [4,5,6,7]. Secondary consequences to survivors of these combined injuries are known to show exacerbated acute radiation syndrome (ARS), including enteropathy (GI-ARS) associated with hematopoietic syndrome (H-ARS) [8,9]. Most importantly, the bone and bone marrow damage caused by CI is more than that caused by either single trauma alone [10,11]. The acute loss of bone mass after CI occurs because of a rapid rise in activation and activity of osteoclasts [10] in conjunction with attenuated activity of osteoblasts [12], resulting in decreases in formation and volume of bone [13]. Therefore, under a nuclear attack, nuclear accident, or exposure to a radioactive dispersal device (RDD), the unfavorable decline in bone formation and volume can cause a long-term health impact in first responders and survivors [14,15].
Either Hemo or radiation injury (RI) can result in similar outcomes depending on the % of blood loss or the radiation dose. Hemo at 40% of total blood volume, which was classified as level 4 damage [16] increases the concentration IL-10 and TNF-α in blood, activates NF-κB and iNOS expression in murine small intestine, and increases cell apoptosis in various murine tissues [17,18,19,20]. Likewise, sub-lethal ionizing radiation also increases these parameters [4] in addition to initiating deleterious hematopoietic changes [8]. Even though Hemo at 20% of total blood volume was classified as damage level 2 and causing no harm, [16], when it occurred following radiation exposure it resulted in a 25% increase in mortality above that of radiation alone (50% mortality) or Hemo alone (0% mortality) [6]. When the Hemo is internal, a combined radiation + Hemo condition may be difficult to diagnose. If blood cell depletion could be used as an indicator of the synergistic effects of these two traumas it would allow the diagnosis of combined radiation-Hemo injury leading to more aggressive treatment strategies than a single injury would require and thus better survival under scenarios of nuclear accidents possibly involving Hemo.
Thus, the aim of this study was to evaluate the effects of radiation injury (RI) followed by non-lethal Hemo (i.e., CI) on blood cell depletion to develop indicators to identify Hemo occurrence concurrently with irradiation. We hypothesize that the combined trauma of Hemo following radiation would be more detrimental to CBC depletion than either assault alone. Mice were used to test the hypothesis because studies with a whole animal include interaction among organs and molecular components of transcription factors, cytokines and microRNA that are relevant to human biology. Our data support the contention that changes in CBC depletion derived from CI mice compared to single injury mice can act as the needed indicators.
2. Results
2.1. CI Reduces White Blood Cells (WBCs) More Than RI Alone on Day 1 and Day 2
Whole-body irradiation at a high radiation dose reduced white blood cell counts (WBCs) immediately, a hallmark of RI [8]. Figure 1a depicts that 20% hemorrhage alone did not alter the total WBCs at 4-5 h post the initial bleed, but WBCs declined on day 1 in comparison to the sham groups. However, WBCs returned to the baseline quickly on days 2, 3, 7, and 15. RI and CI decreased WBCs at 4-5 h. CI appeared to further decrease WBCs on day 1 and day 2 (Figure 1a,b), but both CI and RI groups stayed at nadir on days 3, 7, and 15 with similar values (Figure 1a). To understand which subgroups of blood cells to lead to these further decreases, WBC differentiation was conducted.
2.2. CI-Induced Neutrophil Depletion is Greater Than That of RI Alone on Day 2
The whole-body irradiation-induced WBC reduction is evidently due to neutropenia and lymphocytopenia [8]. Figure 1c shows that neutrophils were increased at 4-5 h post-Hemo alone and then returned to the basal levels on days 1, 2, 3, 7, and 15. On day 1 neutrophil counts in RI and CI groups remained like the sham and the Hemo groups. However, on day 2, RI and CI reduced neutrophil counts and the CI-induced reduction was more than the RI-induced one (Figure 1c,d). Afterwards RI and CI neutrophil counts remain at their nadir on days 3, 7, and 15 with similar values (Figure 1c).
2.3. CI-Induced Lymphocyte Depletion is More Than RI Alone on Day 2
Unlike neutrophils, Figure 2a and b shows that Hemo significantly reduced lymphocyte counts at 4-5 h post the initial bleed and at day 1 after Hemo, but lymphocyte counts returned to the basal level starting day 2 through day 15. RI and CI vastly decreased lymphocyte counts. At day 2 post-RI and -CI, CI briefly decreased lymphocytes counts further. Then, RI and CI lymphocyte counts remained at their nadir on days 3, 7, and 15 with similar counts (Figure 2a).
2.4. CI-Induced Monocyte Depletion is More Than RI Alone on Day 1
Figure 2c and d shows that Hemo alone monocyte counts were slightly higher than those of the sham group at 4-5 h post the initial bleed followed by a slower increase on day 1, and then a full recovery. RI and CI monocyte counts were significantly reduced beginning at 4-5 h post-RI and CI, continued to drop on day 1 and day 2, and stayed at nadir from day 3 to day 15. CI reduced monocyte counts more than RI only on day 1.
2.5. CI-Induced Eosinophil Depletion is Greater Than That of RI Alone on Day 2
Eosinophils are known to be related to allergy and the suppression of RI-induced small intestinal fibrosis [21]. The counts for the sham and Hemo groups were indistinguishable except on day 7 when the eosinophil counts were lower in the Hemo group than in the sham group (Figure 3a and b). The counts recovered on day 15 (Figure 3a). Eosinophil counts were decreased by RI and CI beginning at 4-5 h and through days 1-15 (Figure 3a). On day 2, CI reduced eosinophil counts more than RI (Figure 3b).
2.6. CI-Induced Basophil Depletion is Greater Than That of RI Alone on Day 2
Basophils have emerged as a small but potent subpopulation of leukocytes capable of bridging innate and adaptive immunity [22]. Basophil counts were decreased at 4-5 h after Hemo alone, but recovered back to baseline on days 1, 2, 3, 7, and 15 (Figure 3c). RI and CI reduced basophil counts at 4-5 h, even lower than the Hemo group, and thereafter to day 15 (Figure 3c). However, on day 2, CI depleted basophil counts more than RI (Figure 3d).
2.7. CI Reduces Red Blood Cell Counts (RBCs) More Than RI Alone on Days 3, 7 and 15
Unlike WBCs, RBCs were reduced at 4-5 h and thereafter on days 1 and 2 post-Hemo. On day 3, RBCs were recovering and back to normal on day 15. The RI-induced RBC depletion began to show on day 3 and continued decreasing on day 15. In contrast to RI, The CI-induced decrease in RBCs appeared at 4-5 h, sustained at this low level to day 3, and then decreased further on days 7 and 15 (Figure 4a,b). Figure 4c shows that CI induced a greater RBC depletion than RI through every time point as evident by the slope of CI (4.7266) versus the slope of RI (3.4373, p<0.05).
2.8. CI Reduces Hemoglobin More Than RI Alone on Days 3, 7 and 15
Similar to RBCs, hemoglobin levels were reduced at 4-5 h and thereafter on days 1 to 3 post-Hemo. On day 7, hemoglobin levels were fully recovered and remained normal on day 15. The RI-induced hemoglobin began to show on day 2 and continued decreasing to day 15. In contrast to RI, The CI-induced decrease in hemoglobin appeared at 4-5 h, was sustained at this low level to day 3, and then further decreased on days 7 and 15 (Figure 5a,b). Figure 5c shows that CI induced greater reductions in hemoglobin than RI through every time point as evident by the slope of CI (4.6786) versus the slope of RI (3.7274, p<0.05).
2.9. CI Reduces Hematocrit More Than RI Alone on Days 3, 7 and 15
Similar to RBCs and hemoglobin, hematocrit readings were reduced at 4-5 h and thereafter on days 1 to 2 post-Hemo alone. On day 3, hematocrit readings were partially recovered and fully normal on days 7 and 15. The RI-induced hemoglobin drop began to show on day 3 and continued decreasing to day 15. In contrast to RI, The CI-induced decrease in hematocrit readings appeared at 4-5 h, sustained at this low reading to day 3, and then decreased on days 7 and 15 (Figure 6a,b). Figure 6c shows that CI induced a sharper decline in hematocrit readings than RI through every time point as evident by the slope of CI (4.6737) versus the slope of RI (3.6985, p<0.05).
2.10. Hemo Drives Increases in Platelet Counts on Days 2, 3, and 7, but CI Does Not Reduce Platelet Counts More Than RI Alone on Days 3, 7 and 15
Unlike WBCs and RBCs, platelets were not reduced at 4-5 h and thereafter on day 1 post-Hemo. Hemo increased platelets on days 2, 3, and 7 and returned platelets to the sham level on day 15. RI and CI did not decrease platelet counts until day 7 and these continued to decline on day 15. The decreases driven by either RI or CI were similar (Figure 7a,b) and confirmed by Figure 7c.
3. Discussion
High dose radiation exposure accompanied with Hemo is one of the common CI expected after radiological exposure [23]. Herein, we report that WBCs are early indicators (within 3 days) and RBCs are later indicators (later than 3 days up to 15 days) for radiation victims with Hemo. In contrast to WBCs and RBCs, no differential platelet depletion was found between RI and CI. This platelet result is inconsistent with that was found in combined radiation injury with wound trauma [8], suggesting that hemorrhage trauma is less impactful to platelets compared with wounding.
Hemo at 20% of total blood volume was classified as not requiring fluid resuscitation [16]. Hemo significantly increased neutrophils (Figure 1c) and platelets (Figure 7a,b); the phenomenon was similar to that after wounding because of the need of wound healing and protection against bacterial infection [4].
RI is known to result in endothelium injury [24,25] that is exacerbated by CI due to upregulation of both EPO and HIF-1α [6]. The important issue is to differentiate between the RI victims and CI victims, particularly those with internal bleedings. Our data suggest differential blood counts can be used to determine this depending on the time increments after the incident. As shown on Table 1, if the blood samples were collected with 4-5 hours after the incident, Hemo victims showed increases in neutrophils and monocytes and decreases in other WBCs, RBCs and platelets; RI victims showed decreases in WBCs but not in RBCs and platelets; CI victims showed increases in neutrophils and decreases in RBCs and platelets. On day 1, Hemo victims show normal neutrophils, decreased RBCs, and normal platelets; RI victims showed decreased WBCs and normal RBCs and normal platelets; CI victims showed further decreased monocytes, and normal RBCs and platelets. On day 2, Hemo victims fully recovered WBCs but RBCs remained low and platelets were increased above the baseline; RI victims showed decreased WBCs, normal RBCs, and decreased platelets. CI victims showed further decreases in WBCs and RBCs but normal platelets. On day 3, Hemo victims showed normal WBCs, RBCs but increased platelets above the baseline; RI victims showed decreased WBCs and RBCs and normal platelets; CI showed same decreases in WBCs, and further decreased in RBCs but normal platelets. Like on day 3, on day 7, Hemo victims showed normal WBCs and RBCs but increased platelets; RI showed decreased WBCs and RBCs but increases in platelets above the basal level; CI victims appeared decreased WBCs, further declined RBCs and platelets. On day 15, Hemo victims displayed normal CBCs; RI victims appeared low in WBCs and platelets but further lower in RBCs. Collectively the data suggest that on day 1 monocyte counts can distinguish RI from CI, whereas on day 2 all WBC subgroups can separate RI from CI. From day 3 and on, RI and CI victims could be separated by severity of RBC depletion.
Due to operation and management aspects for triage during day 1 and day 2, collection of blood samples and CBC data from victims/patients will not be available in reality. Nevertheless, these samples and their data should be present during day 3, and changes in RBCs will be Could be used to distinguish the victims/patients having been exposed to nothing, Hemo, RI, or CI. The question of whether the severity of CBC depletion caused by RI or CI can be prorated to estimate the radiation dose requires further exploration. In the case of radiation combined with skin-wound trauma, the impact of CI on severity of mortality was proportional to the size of the skin-wound [26]. However, longitudinal analysis of leukocyte total and differential count of nonhuman primates after total body irradiation [27] indicates that this long-term effect probably presents a benefit for a triage such scenarios post-CI.
Members of the scientific community interested in responses to irradiation combined with hemorrhage should be aware that this report provides preliminary data obtained from a mouse model that may be helpful in an emergency to evaluate human victims suffering radiological accidents or nuclear detonation. This data must next be validated in minipigs or nonhuman primates to investigate if a similar change can be found and confirmed.
4. Conclusions
In a mass casualty event, Sham, Hemo alone, RI alone, or CI with both RI+Hemo can happen simultaneously or sequentially. Dynamic changes in differential CBC can be a potential tool to distinguish these single injuries from CI using WBCs for the early time points and RBCs for the later time points post-RI and -CI. For hemorrhage alone, neutrophil counts at 4-5 h and platelets for day 2 through day7 can be used as a tool or confirmation.
5. Materials and Methods
5.1. Ethics Statement
A facility accredited by the Association for Assessment and Accreditation of Laboratory Animal Care-International (AAALACI) was used to perform the research project. Animals and their proposed procedures were under review and approval by the Institutional Animal Care and Use Committee (IACUC) of Armed Forces Radiobiology Research Institute.
5.2. Animals and Experimental Design
Male CD2F1 mice (10 weeks old) were purchased from Harlan Labs (Indianapolis, IN). They were acclimated to their surroundings for 14 days before beginning the study. They were randomly placed in cages with 8 mice per cage at a temperature of 68-75ºF in a light-controlled room with a 12-hr light-dark cycle. They were randomly divided to four experimental groups with N=6/group: Sham (0 Gy), Hemorrhage (Hemo, 20% total blood volume), Radiation Injury (RI), or RI+Hemo. After Hemo, RI, or RI+Hemo, mice were placed into clean cages with 2-4 mice per cage. Proper food (standard rodent chow, Harlan Teklad 8604) and acidified water were provided to mice ad libitum. The health status of each animal was monitored and recorded daily according to the approved IACUC protocol.
5.3. Gamma Irradiation
Mice were placed in well-ventilated acrylic restrainers and exposed to a single whole-body 8.75 Gy 60Co γ-photon radiation at a dose rate of approximately 0.6 Gy/min in a 60Co facility (Nordion Inc., Otawa, Canada) at AFRRI. Dosimetry was performed using the alanine/electron paramagnetic resonance system. Calibration of the dose rate with alanine was traceable to the National Institute of Standards and Technology and the National Physics Laboratory of the United Kingdom. Sham-irradiated mice were placed in the same acrylic restrainers, taken to the radiation facility, and restrained for the time required for irradiation. We selected 8.75 Gy for the biomarker elucidation, because this dose has previously been studied with this mouse strain in the literature [6,28].
5.4. Hemorrhage (Hemo)
Within 2 hours post-RI, mice were anesthetized under isoflurane (~3%) plus 97% oxygen and bled 0% (Sham, RI) or 20% (Hemo, CI) of total blood volume via the submandibular vein as previously described [29]. Briefly, the jaw of the anesthetized mouse was cleaned with a 70% EtOH wipe, and glycerol was applied to the surface of the jaw to allow for ease of collection and measurement of blood loss. A 5 mm Goldenrod animal lancet (MEDIpoint, Inc; Mineola, NY) for facial vein blood samples was used to puncture the submandibular vein of the mouse and heparinized hematocrit collection tubes (75 mm; Drummond Scientific Co.; Broomall, PA) were marked and used to collect the appropriate amount of blood to ensure 20% of total blood volume was extracted during the hemorrhage process. The volume of blood collected was based upon each individual mouse’s body mass [30]. Euthanasia was conducted according to the recommendations and guidelines of the American Veterinary Medical Association at the end of each specific time-point.
5.5. Assessment of Blood Cell Profile in Peripheral Blood
For counts of blood cells (CBC) studies, mice at specific endpoints were placed under anesthesia by isoflurane inhalation (~3%) plus 97% oxygen for the entire period of blood collection. After blood collection, animals were immediately euthanized by a confirmatory cervical dislocation.
Blood samples were collected in EDTA tubes 30d after RI or CI and assessed with the ADVIA 2120 Hematology System (Siemens, Deerfield, IL). Differential analysis was conducted using the peroxidase method and the light scattering techniques recommended by the manufacturer.
5.6. Statistical Analysis
Data are expressed as means ± SEM (N=6 per group per time-point). ANOVA, Bonferroni’s inequality test, and Student’s t- test were used for comparison of groups. For all data, statistical significance was accepted at p<0.05.
Author Contributions
Conceptualization: J.G.K.; data curation: J.G.K. and A.K.W.; formal analysis: J.G.K. and A.K.W.; manuscript preparation: J.G.K. and G.C. All authors have read and agreed to the published version of the manuscript.
Funding
This study was supported by Armed Forces Radiobiology Research Institute (AFRRI) intramural grants RAB33336 and AFR-B2-12812 to J.G.K.
Institutional Review Board Statement
This study was conducted under the AFRRI Institutional Animal Care and Use Committee (IACUC) protocol number 2011-03-001
Informed Consent Statement
Not applicable.
Data Availability Statement
The data presented in this study are available from the authors on reasonable request.
Acknowledgments
The authors wish to thank Dr. William F. Blakely for his discussion. The views expressed herein do not necessarily represent those of the Armed Forces Radiobiology Research Institute, the Uniformed Services University of the Health Sciences, and the US Department of Defense.
Conflicts of Interest
The authors declare no conflict of interest. The funders had no role in the design of the study; in the collection, analysis, or interpretation of the data; in the writing of the manuscript; or in the decision to publish the results.
References
- Iijima, S. Pathology of Atomic Bomb Casualties. Acta Pathol Jpn 32 Suppl 2 (1982): 237-70.
- Kishi, H.S. Effects of the “Special Bomb”: Recollections of a Neurosurgeon in Hiroshima, August 8-15, 1945. Neurosurgery 47, no. 2 (2000): 441-5; discussion 45-6.
- Barabanova, A.V. Significance of beta-radiation skin burns in Chernobyl patients for the theory and practice of radiopathology. Vojnosanit Pregl 2006, 63, 477–480. [Google Scholar] [CrossRef] [PubMed]
- Kiang, J.G.; Jiao, W.; Cary, L.H.; Mog, S.R.; Elliott, T.B.; Pellmar, T.C.; Ledney, G.D. Wound trauma increases radiation-induced mortality by activation of iNOS pathway and elevation of cytokine concentrations and bacterial infection. Radiation research 2010, 173, 319–332. [Google Scholar] [CrossRef] [PubMed]
- DiCarlo, A.L.; Hatchett, R.J.; Kaminski, J.M.; Ledney, G.D.; Pellmar, T.C.; Okunieff, P.; Ramakrishnan, N. Medical countermeasures for radiation combined injury: radiation with burn, blast, trauma and/or sepsis. report of an NIAID Workshop, March 26-27, 2007. Radiation research 2008, 169, 712–721. [Google Scholar] [CrossRef] [PubMed]
- Kiang, J.G.; Smith, J.T.; Anderson, M.N.; Swift, J.M.; Christensen, C.L.; Gupta, P.; Balakathiresan, N.; Maheshwari, R.K. Hemorrhage Exacerbates Radiation Effects on Survival, Leukocytopenia, Thrombopenia, Erythropenia, Bone Marrow Cell Depletion and Hematopoiesis, and Inflammation-Associated microRNAs Expression in Kidney. PLoS One 2015, 10, e0139271. [Google Scholar] [CrossRef]
- Ledney, G.D.; Elliott, T.B. Combined injury: factors with potential to impact radiation dose assessments. Health physics 2010, 98, 145–152. [Google Scholar] [CrossRef]
- Kiang, J.G.; Garrison, B.R.; Burns, T.M.; Zhai, M.; Dews, I.C.; Ney, P.H.; Cary, L.H.; Fukumoto, R.; Elliott, T.B.; Ledney, G.D. Wound trauma alters ionizing radiation dose assessment. Cell Biosci 2012, 2, 20. [Google Scholar] [CrossRef]
- Kiang, J.G.; Blakely, W.F. Combined radiation injury and its impacts on radiation countermeasures and biodosimetry. International journal of radiation biology 2023, 99, 1055–1065. [Google Scholar] [CrossRef]
- Willey, J.S.; Lloyd, S.A.; Robbins, M.E.; Bourland, J.D.; Smith-Sielicki, H.; Bowman, L.C.; Norrdin, R.W.; Bateman, T.A. Early increase in osteoclast number in mice after whole-body irradiation with 2 Gy X rays. Radiation research 2008, 170, 388–392. [Google Scholar] [CrossRef] [PubMed]
- Zhang, Y.N.; Shi, W.G.; Li, H.; Hua, J.R.; Feng, X.; Wei, W.J.; Wang, J.F.; He, J.P.; Lei, S.W. Bone Loss Induced by Simulated Microgravity, Ionizing Radiation and/or Ultradian Rhythms in the Hindlimbs of Rats. Biomed Environ Sci 2018, 31, 126–135. [Google Scholar] [CrossRef]
- Sakurai, T.; Sawada, Y.; Yoshimoto, M.; Kawai, M.; Miyakoshi, J. Radiation-induced reduction of osteoblast differentiation in C2C12 cells. J Radiat Res 2007, 48, 515–521. [Google Scholar] [CrossRef]
- Lee, J.H.; Lee, H.J.; Yang, M.; Moon, C.; Kim, J.C.; Jo, S.K.; Jang, J.S.; Kim, S.H. Establishment of a murine model for radiation-induced bone loss using micro-computed tomography in adult C3H/HeN mice. Lab Anim Res 2013, 29, 55–62. [Google Scholar] [CrossRef]
- Ledney, G.D.; Elliott, T.B.; Moore, M.M. Modulations of mortality by tissue trauma and sepsis in mice after radiation injury. In Biological basis of radiation protection practice; Mossman, K.I., Mills, W.A., Eds.; Williams and Wilkins: Baltimore, MD, 1992; pp. 202–217. [Google Scholar]
- Valeriote, F.A.; Baker, D.G. The Combined Effects of Thermal Trauma and X-Irradiation on Early Mortality. Radiation research 1964, 22, 693–702. [Google Scholar] [CrossRef] [PubMed]
- Manning, J.E. Fluid and blood resuscitation. Emergency medicine: A comprehensive study guide 2004, 225-230.
- Li, Q.; Lan, X.; Han, X.; Durham, F.; Wan, J.; Weiland, A.; Koehler, R.C.; Wang, J. Microglia-derived interleukin-10 accelerates post-intracerebral hemorrhage hematoma clearance by regulating CD36. Brain, behavior, and immunity 2021, 94, 437–457. [Google Scholar] [CrossRef] [PubMed]
- Rendevski, V.; Aleksovski, B.; Stojanov, D.; Aleksovski, V.; Rendevska, A.M.; Kolevska, M.; Stojanoski, K.; Gjorgoski, I. Peripheral glutamate and TNF-alpha levels in patients with intracerebral hemorrhage: Their prognostic values and interactions toward the formation of the edemal volume. Neurol Neurochir Pol 2018, 52, 207–214. [Google Scholar] [CrossRef]
- Zhang, Z.; Liu, Y.; Huang, Q.; Su, Y.; Zhang, Y.; Wang, G.; Li, F. NF-kappaB activation and cell death after intracerebral hemorrhage in patients. Neurol Sci 2014, 35, 1097–1102. [Google Scholar] [CrossRef]
- Zhao, X.; Zhang, Y.; Strong, R.; Zhang, J.; Grotta, J.C.; Aronowski, J. Distinct patterns of intracerebral hemorrhage-induced alterations in NF-kappaB subunit, iNOS, and COX-2 expression. J Neurochem 2007, 101, 652–663. [Google Scholar] [CrossRef] [PubMed]
- Takemura, N.; Kurashima, Y.; Mori, Y.; Okada, K.; Ogino, T.; Osawa, H.; Matsuno, H.; Aayam, L.; Kaneto, S.; Park, E.J.; et al. Eosinophil depletion suppresses radiation-induced small intestinal fibrosis. Sci Transl Med 2018, 10. [Google Scholar] [CrossRef] [PubMed]
- Cromheecke, J.L.; Nguyen, K.T.; Huston, D.P. Emerging role of human basophil biology in health and disease. Curr Allergy Asthma Rep 2014, 14, 408. [Google Scholar] [CrossRef]
- Hasegawa, T.; Kato, T.; Naito, T.; Tanei, T.; Okada, K.; Ito, R.; Koketsu, Y.; Hirayama, K. Long-Term Risks of Hemorrhage and Adverse Radiation Effects of Stereotactic Radiosurgery for Brain Arteriovenous Malformations. Neurosurgery 2022, 90, 784–792. [Google Scholar] [CrossRef]
- Baselet, B.; Sonveaux, P.; Baatout, S.; Aerts, A. Pathological effects of ionizing radiation: endothelial activation and dysfunction. Cell Mol Life Sci 2019, 76, 699–728. [Google Scholar] [CrossRef]
- Wijerathne, H.; Langston, J.C.; Yang, Q.; Sun, S.; Miyamoto, C.; Kilpatrick, L.E.; Kiani, M.F. Mechanisms of radiation-induced endothelium damage: Emerging models and technologies. Radiotherapy and oncology : journal of the European Society for Therapeutic Radiology and Oncology 2021, 158, 21–32. [Google Scholar] [CrossRef] [PubMed]
- Zawaski, J.A.; Yates, C.R.; Miller, D.D.; Kaffes, C.C.; Sabek, O.M.; Afshar, S.F.; Young, D.A.; Yang, Y.; Gaber, M.W. Radiation combined injury models to study the effects of interventions and wound biomechanics. Radiation research 2014, 182, 640–652. [Google Scholar] [CrossRef] [PubMed]
- Chino, Y.; Olson, J.D.; Schaaf, G.W.; Cline, J.M.; Johnson, T.E. Longitudinal Analysis of Leukocyte Total and Differential Count of Rhesus Macaques (Macaca mulatta) after Total-Body Irradiation. Radiation research 2023, 200, 349–356. [Google Scholar] [CrossRef] [PubMed]
- Li, X.H.; Fu, D.; Latif, N.H.; Mullaney, C.P.; Ney, P.H.; Mog, S.R.; Whitnall, M.H.; Srinivasan, V.; Xiao, M. Delta-tocotrienol protects mouse and human hematopoietic progenitors from gamma-irradiation through extracellular signal-regulated kinase/mammalian target of rapamycin signaling. Haematologica 2010, 95, 1996–2004. [Google Scholar] [CrossRef]
- Golde, W.T.; Gollobin, P.; Rodriguez, L.L. A rapid, simple, and humane method for submandibular bleeding of mice using a lancet. Lab Anim (NY) 2005, 34, 39–43. [Google Scholar] [CrossRef]
- Diehl, K.H.; Hull, R.; Morton, D.; Pfister, R.; Rabemampianina, Y.; Smith, D.; Vidal, J.M.; van de Vorstenbosch, C.; European Federation of Pharmaceutical Industries, A.; European Centre for the Validation of Alternative, M. A good practice guide to the administration of substances and removal of blood, including routes and volumes. J Appl Toxicol 2001, 21, 15–23. [Google Scholar] [CrossRef]
Figure 1.
Effects of radiation alone or combined radiation injury with hemorrhage on white blood cells and neutrophils. Animals were exposed to 8.75 Gy alone or followed by 20% hemorrhage. Complete blood cells were counted in blood collected in sham mice, Hemo alone mice, radiation alone mice, or radiation+Hemo mice at 4-5 hr, and on days 1, 2, 3, 7, and 15. Data are mean±sem with N=6 per group per time point. (a) WBC throughout 15 days; (b) WBCs on day 1 and day 2; (c) neutrophils throughout 15 days; (d) neutrophils on day 1 and day 2. *p<0.05 vs. Sham group; ^p<0.05 vs. Sham, Hemo, and RI at the specific time point. Hemo: 20% hemorrhage; RI: 8.75 Gy; CI: 8.75 Gy+20% hemorrhage; WBC: white blood cells; NEU: neutrophils; D: day.
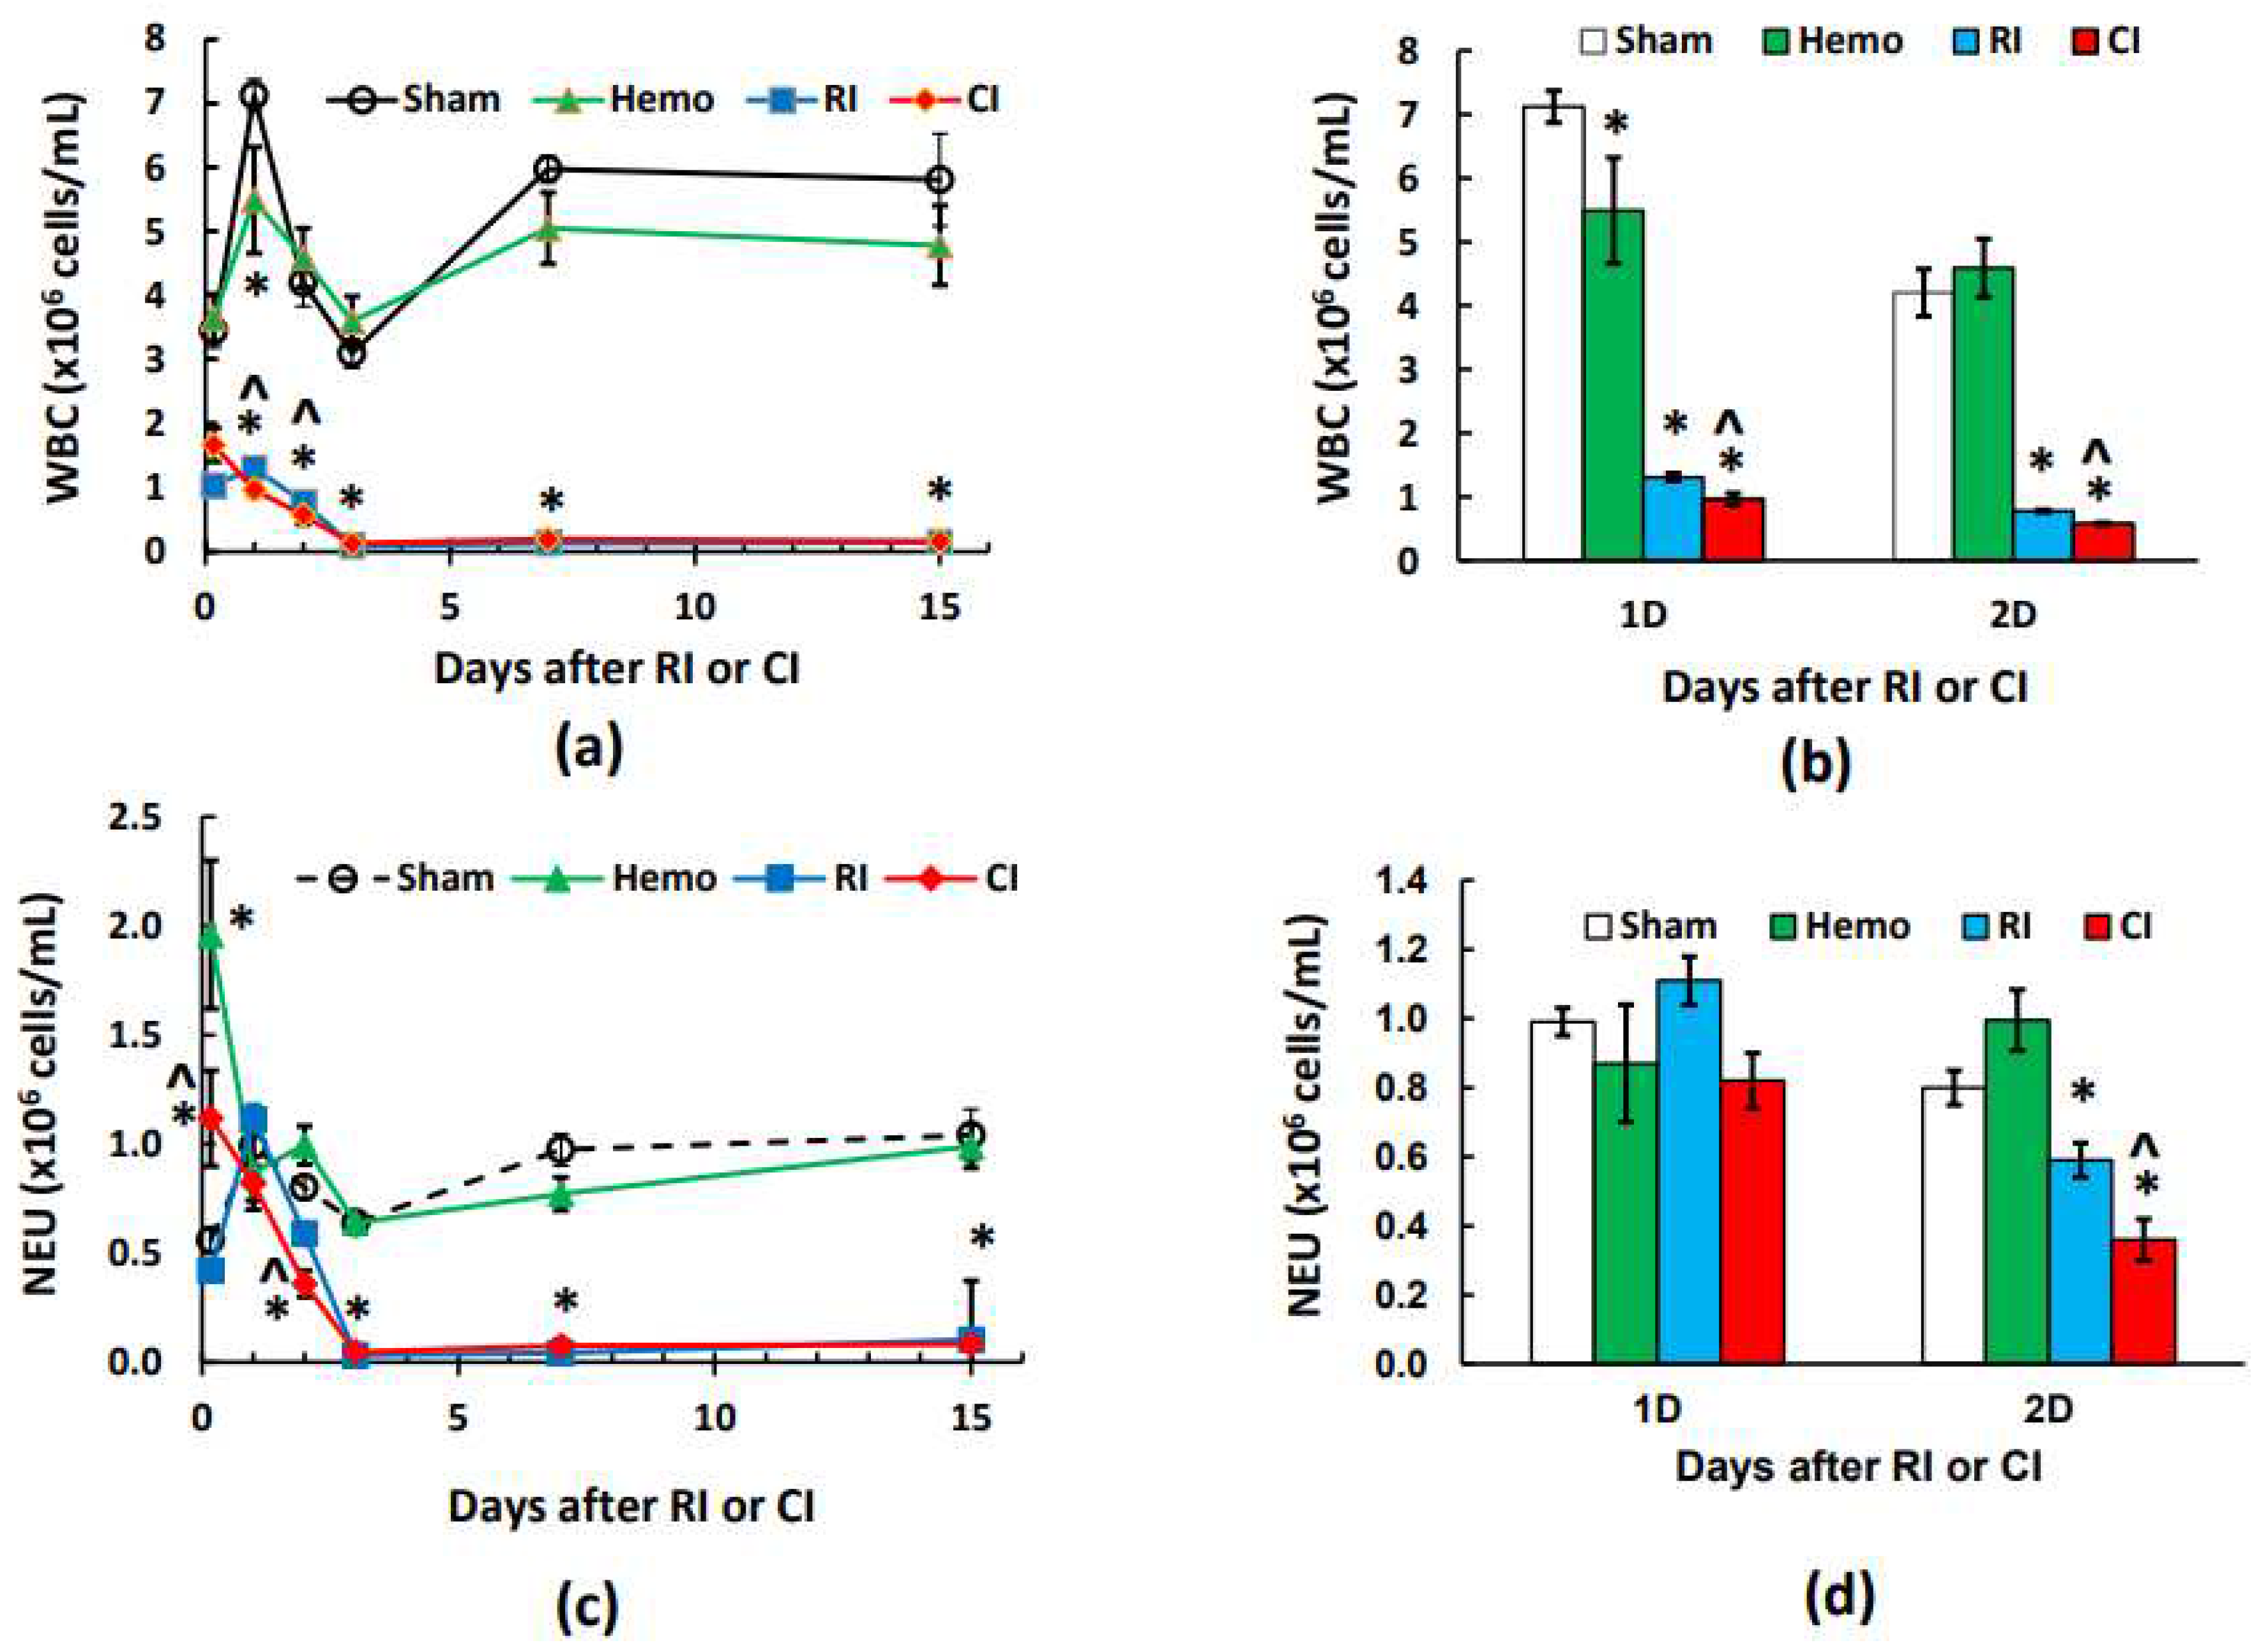
Figure 2.
Effects of radiation alone or combined radiation injury with hemorrhage on lymphocytes and monocytes. Animals were exposed to 8.75 Gy alone or followed by 20% hemorrhage. Complete blood cells were counted in blood collected in sham mice, Hemo alone mice, radiation alone mice, or radiation+Hemo mice at 4-5 hr, and on days 1, 2, 3, 7, and 15. Data are mean±sem with N=6 per group per time point. (a) Lymphocytes throughout 15 days; (b) Lymphocytes on day 1 and day 2; (c) Monocytes throughout 15 days; (d) Monocytes on day 1 and day 2. *p<0.05 vs. Sham group; ^p<0.05 vs. Sham, Hemo, and RI at the specific time point. Hemo: 20% hemorrhage; RI: 8.75 Gy; CI: 8.75 Gy+20% hemorrhage; LYM: lymphocytes; MONO: monocytes; D: day.
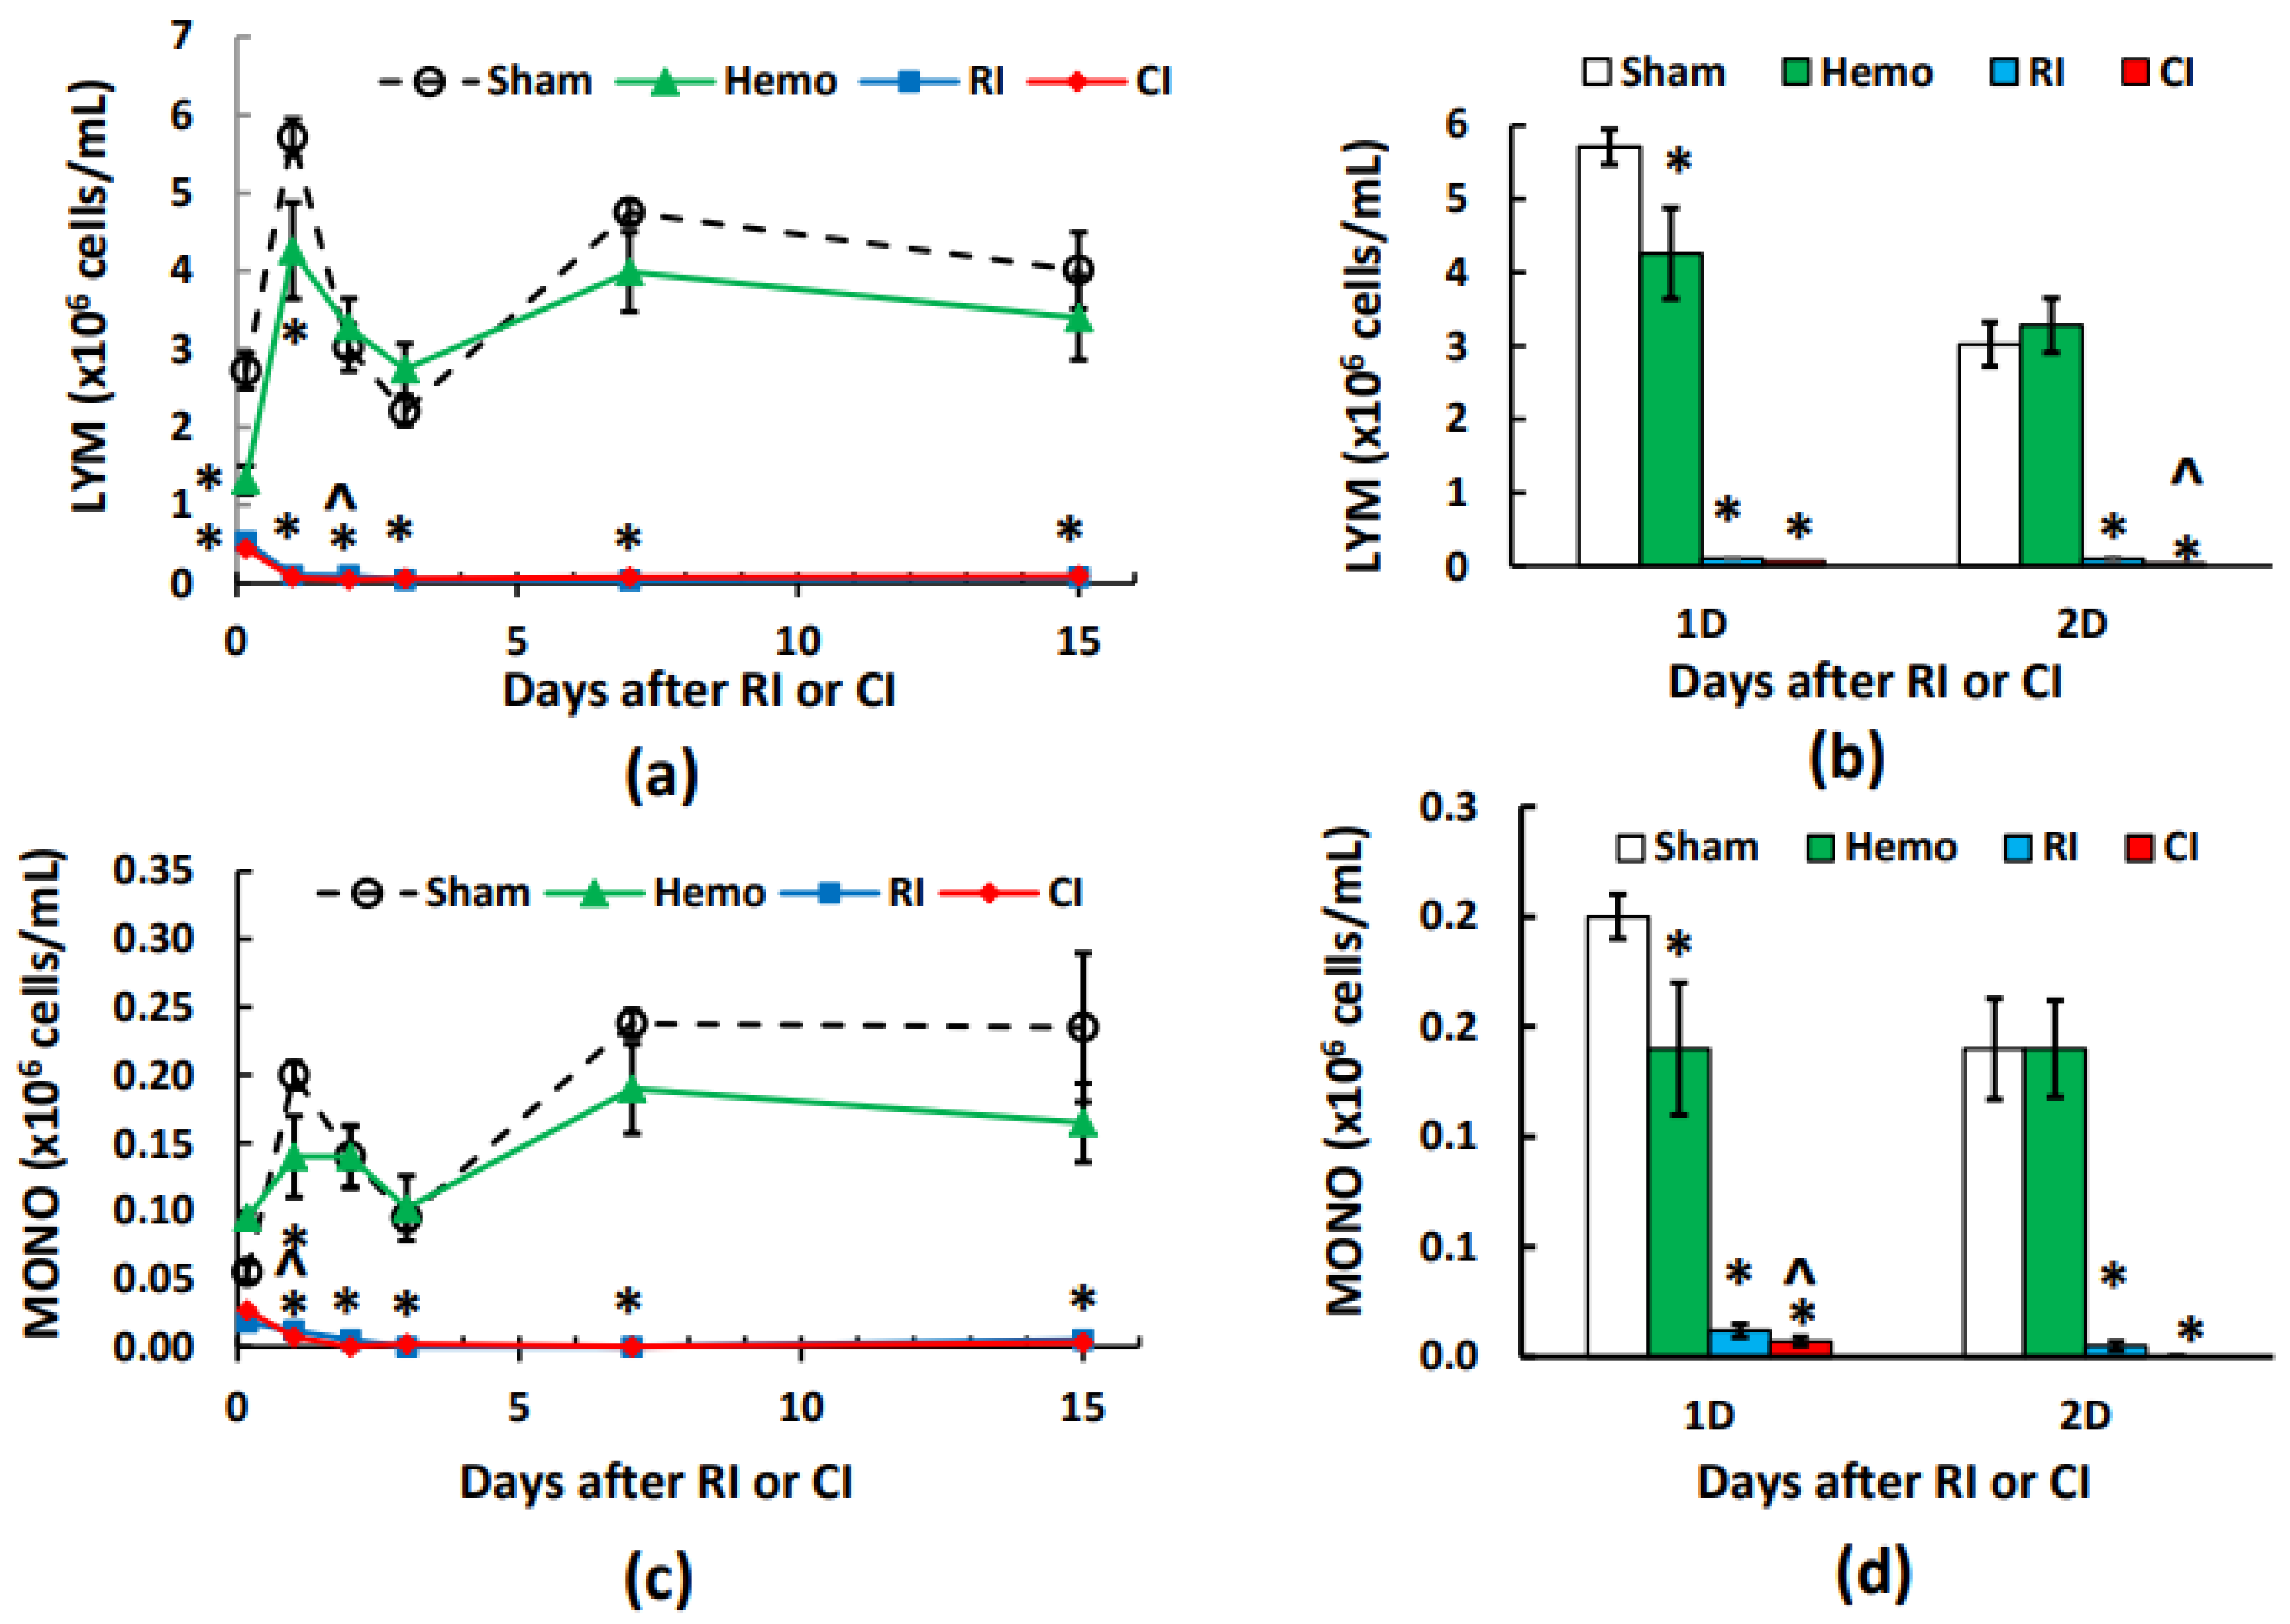
Figure 3.
Effects of radiation alone or combined radiation injury with hemorrhage on eosinophils and basophils. Animals were exposed to 8.75 Gy alone or followed by 20% hemorrhage. Complete blood cells were counted in blood collected in sham mice, Hemo alone mice, radiation alone mice, or radiation+Hemo mice at 4-5 h, and on days 1, 2, 3, 7, and 15. Data are mean±sem with N=6 per group per time point. (a) Eosinophils throughout 15 days; (b) Eosinophils on day 1 and day 2; (c) Basophils throughout 15 days; (d) Basophils on day 1 and day 2. *p<0.05 vs. Sham group; ^p<0.05 vs. Sham, Hemo, and RI at the specific time point. Hemo: 20% hemorrhage; RI: 8.75 Gy; CI: 8.75 Gy+20% hemorrhage; EOS: eosinophils; BASO: basophils; D: day.
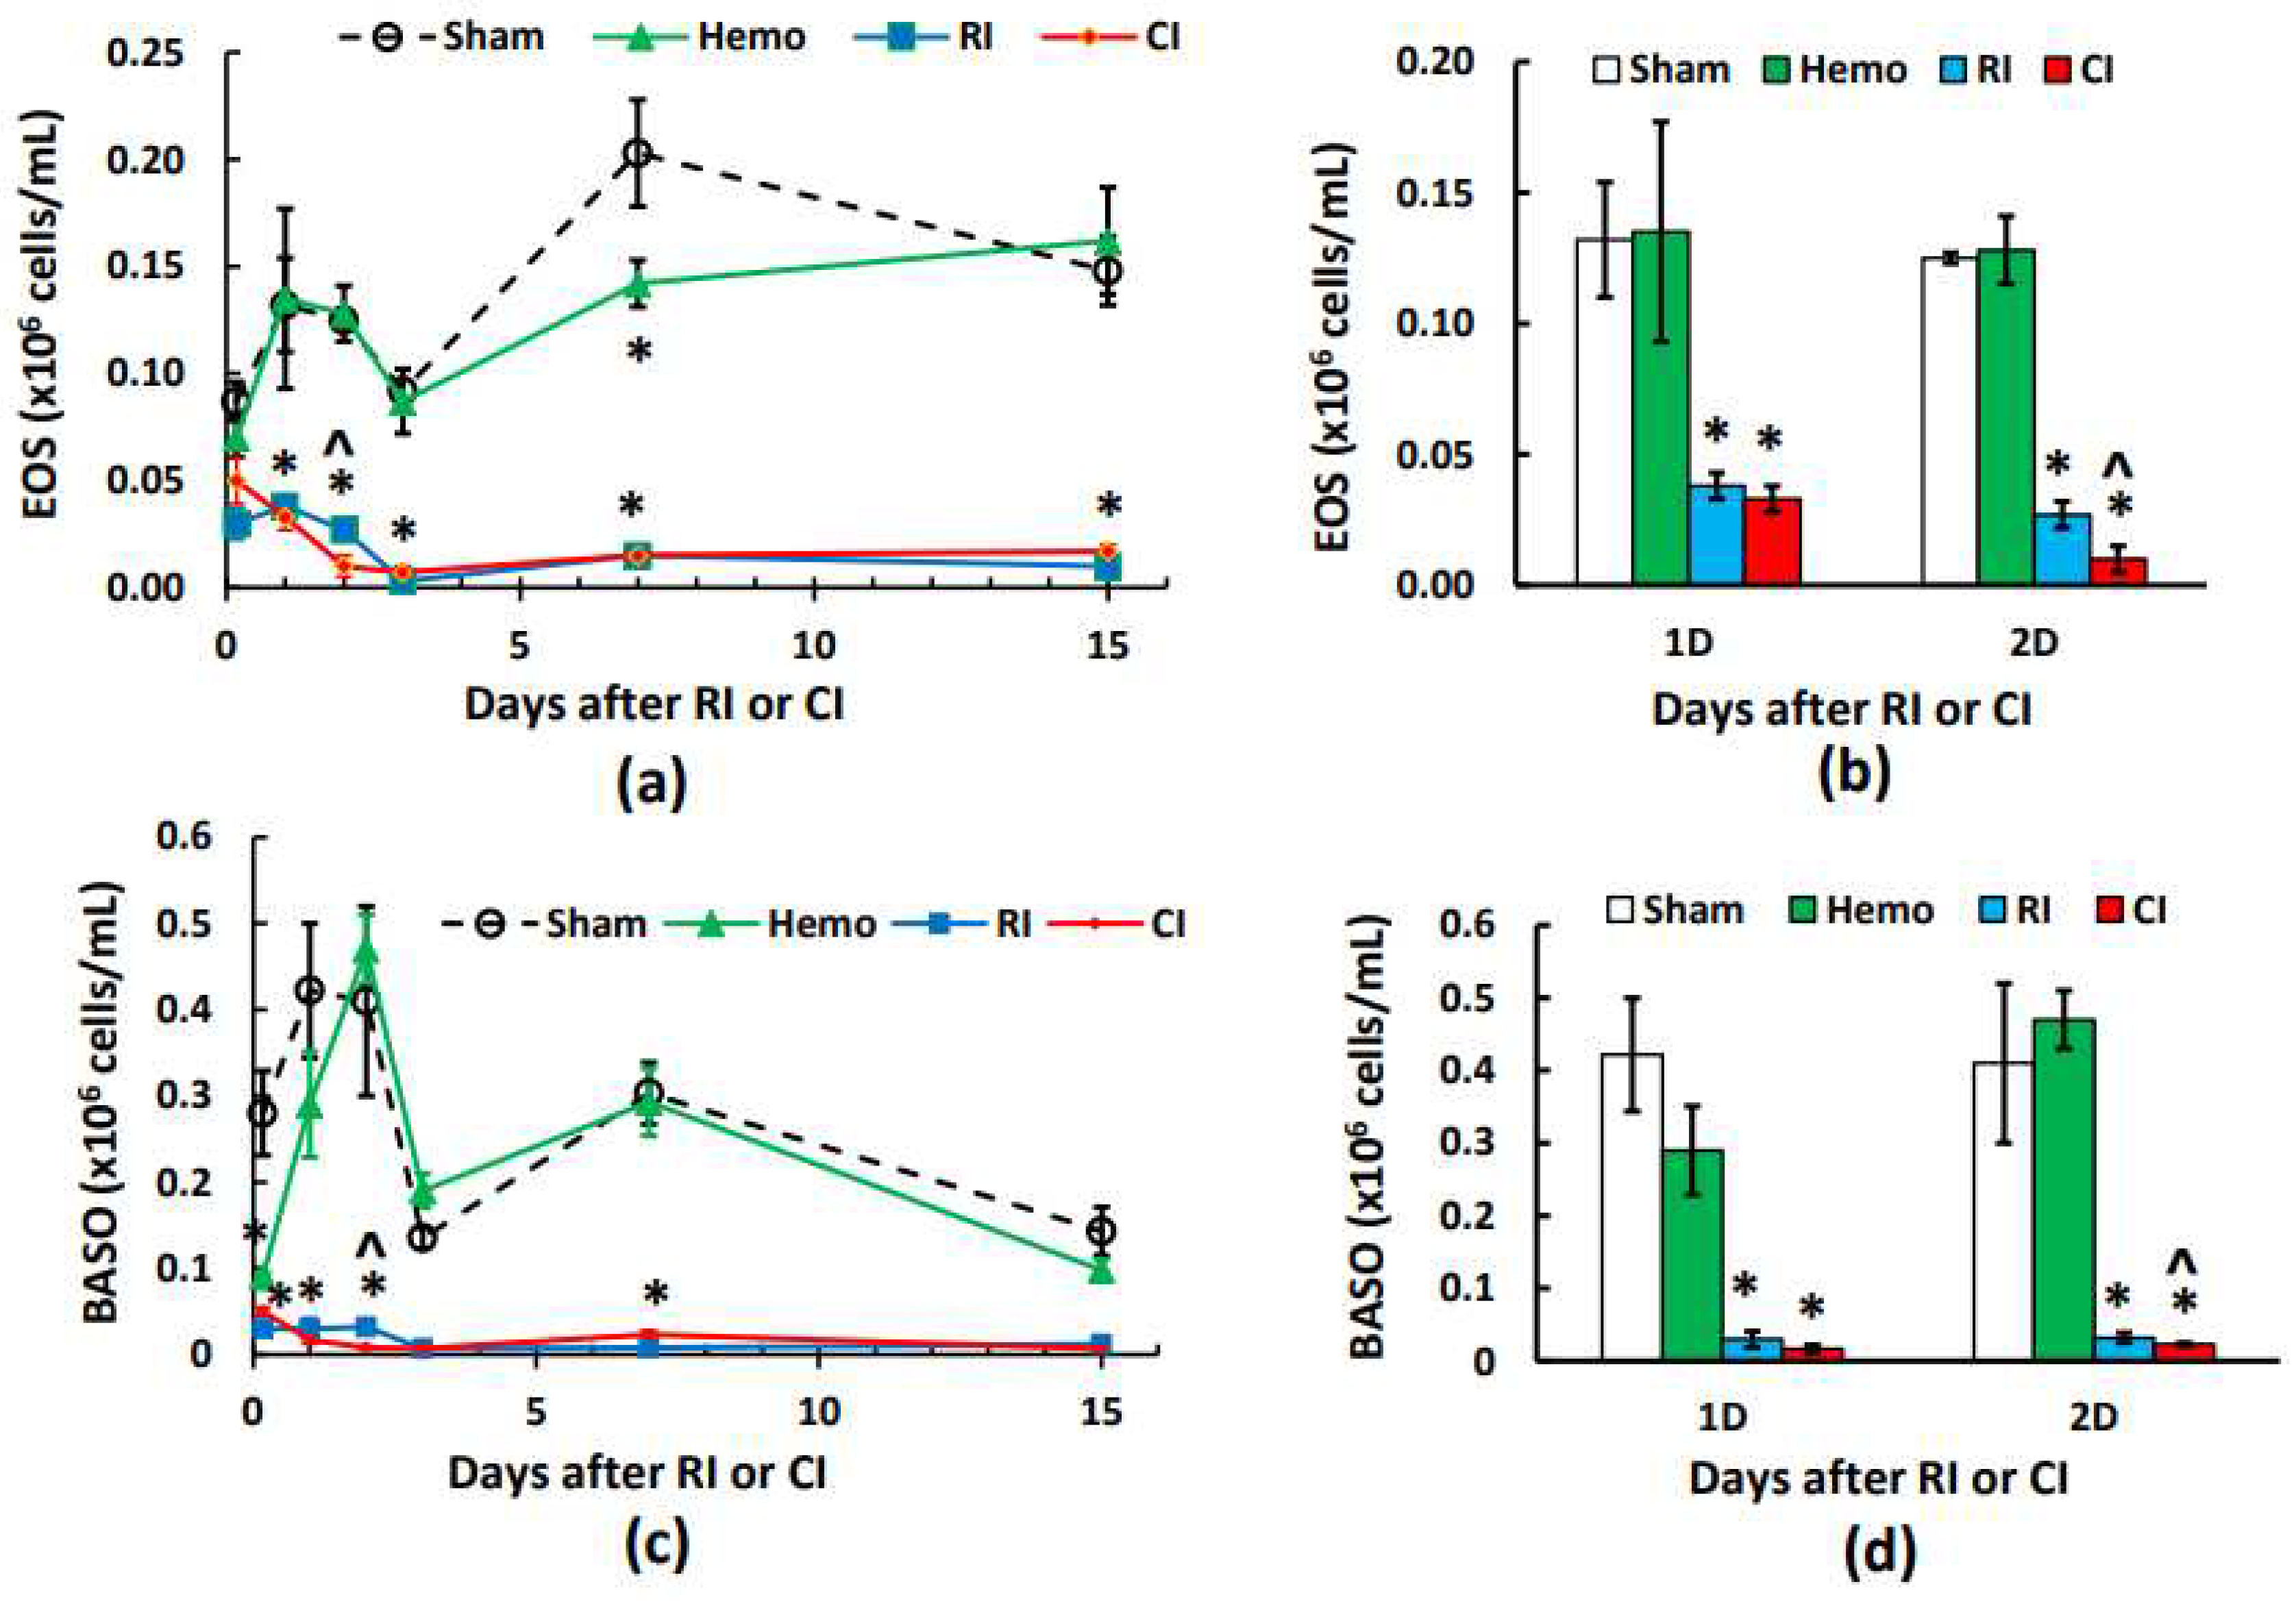
Figure 4.
Effects of radiation alone or combined radiation injury with hemorrhage on red blood cells. Animals were exposed to 8.75 Gy alone or followed by 20% hemorrhage. Complete blood cells were counted in blood collected in sham mice, Hemo alone mice, radiation alone mice, or radiation+Hemo mice at 4-5 h, and on days 1, 2, 3, 7, and 15. Data are mean±sem with N=6 per group per time point. (a) Red blood cells throughout 15 days; (b) Red blood cells on days 1, 2, and day 3; (c) Red blood cells on days 3, 7, and 15 with slops for RI and CI, respectively. *p<0.05 vs. Sham group; &p<0.05 vs. the rest 3 groups at the specific time point. Hemo: 20% hemorrhage; RI: 8.75 Gy; CI: 8.75 Gy+20% hemorrhage; RBC: red blood cells; D: day; R2: correlation coefficient.
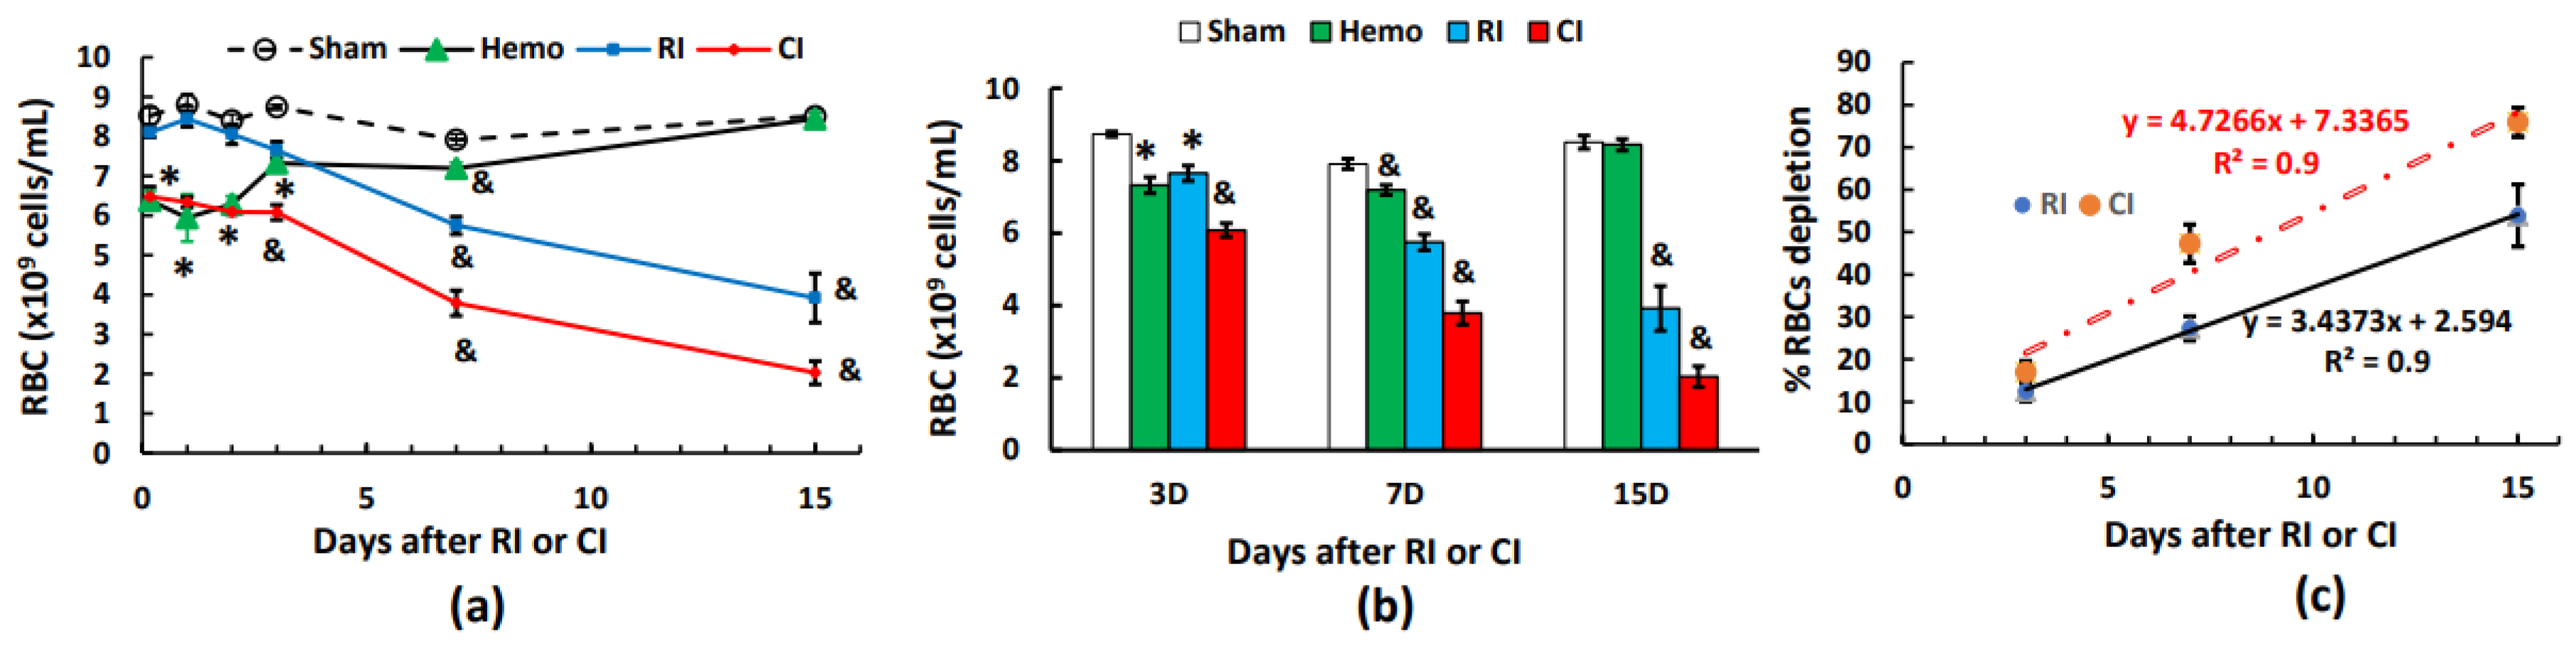
Figure 5.
Effects of radiation alone or combined radiation injury with hemorrhage on hemoglobin levels. Animals were exposed to 8.75 Gy alone or followed by 20% hemorrhage. Complete blood cells were counted in blood collected in sham mice, Hemo alone mice, radiation alone mice, or radiation+Hemo mice at 4-5 h and on days 1, 2, 3, 7, and 15. Data are mean±sem with N=6 per group per time point. (a) Hemoglobin levels throughout 15 days; (b) Hemoglobin levels on days 1, 2, and day 3; (c) Hemoglobin levels on days 3, 7, and 15 with slops for RI and CI, respectively. *p<0.05 vs. Sham group; &p<0.05 vs. the rest 3 groups at the specific time point. Hemo: 20% hemorrhage; RI: 8.75 Gy; CI: 8.75 Gy+20% hemorrhage; RBC: red blood cells; D: day; R2: correlation coefficient.
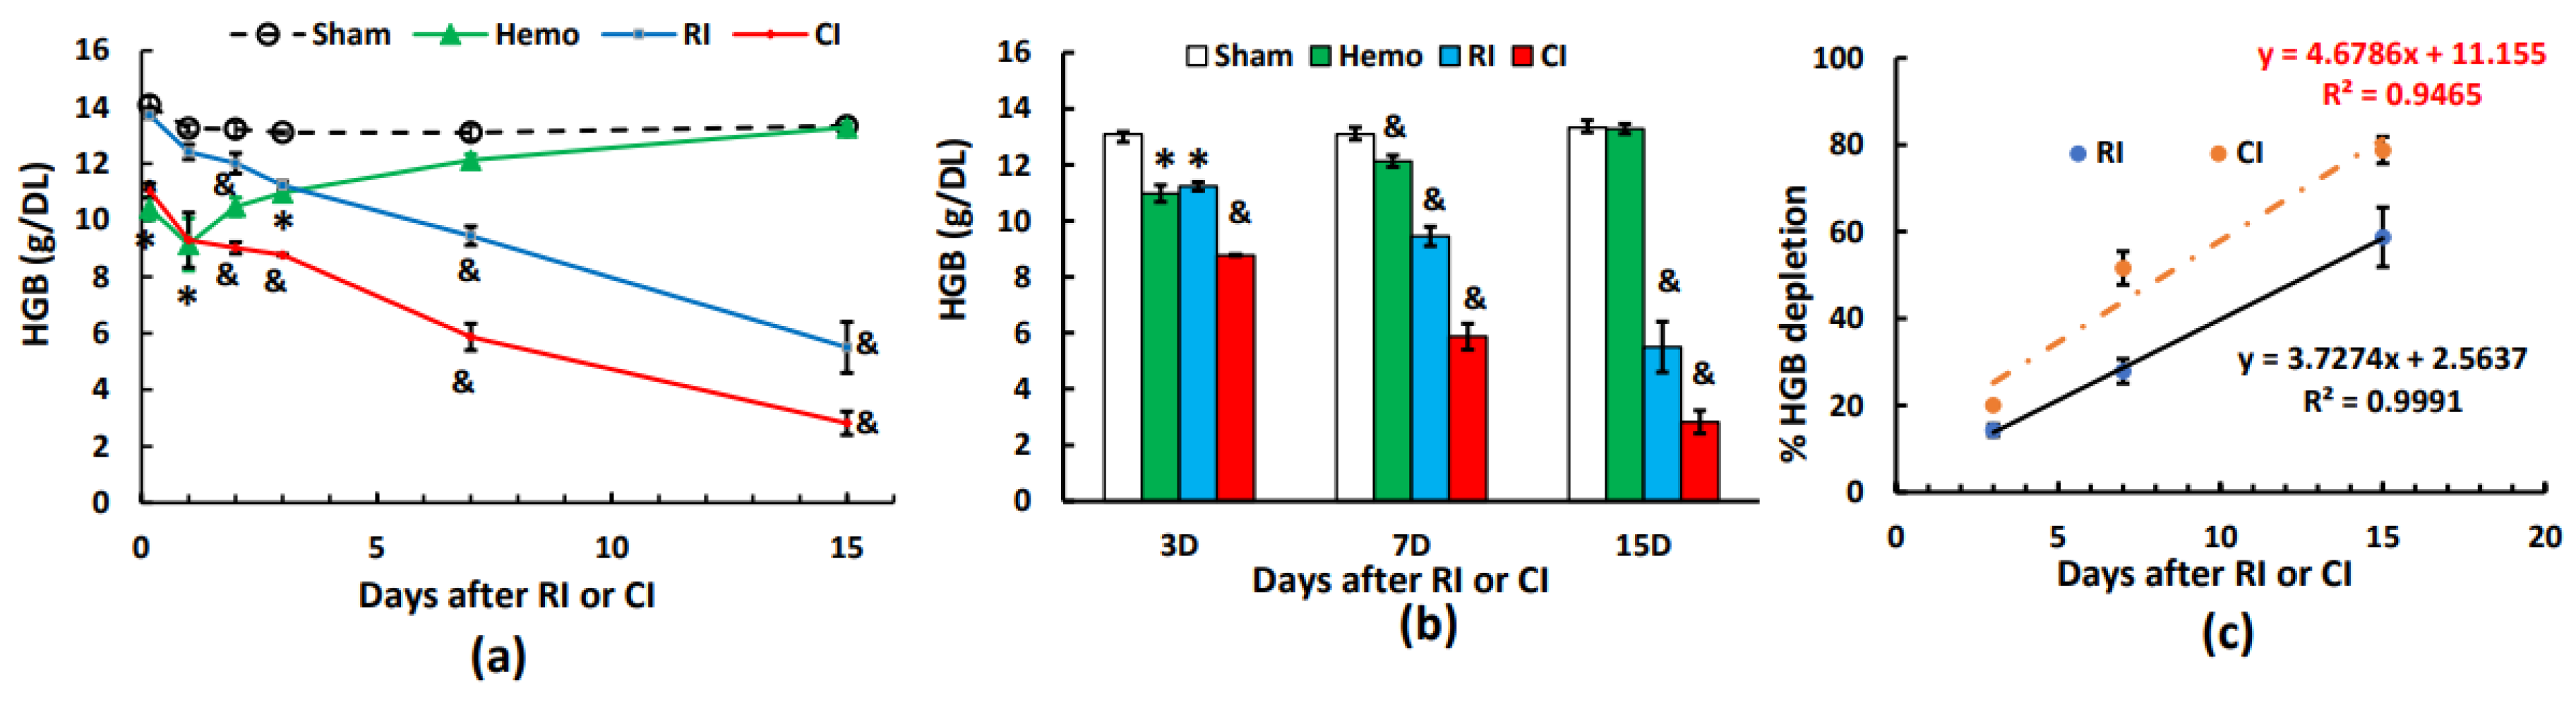
Figure 6.
Effects of radiation alone or combined radiation injury with hemorrhage on hematocrit readings. Animals were exposed to 8.75 Gy alone or followed by 20% hemorrhage. Complete blood cells were counted in blood collected in sham mice, Hemo alone mice, radiation alone mice, or radiation+Hemo mice at 4-5 h, and on days 1, 2, 3, 7, and 15. Data are mean±sem with N=6 per group per time point. (a) Hematocrit readings throughout 15 days; (b) Hematocrit readings on days 1, 2, and day 3; (c) Hematocrit readings on days 3, 7, and 15 with slops for RI and CI, respectively. *p<0.05 vs. Sham group; &p<0.05 vs. the rest 3 groups at the specific time point. Hemo: 20% hemorrhage; RI: 8.75 Gy; CI: 8.75 Gy+20%; HCT: hematocrits; D: day; R2: correlation coefficient.
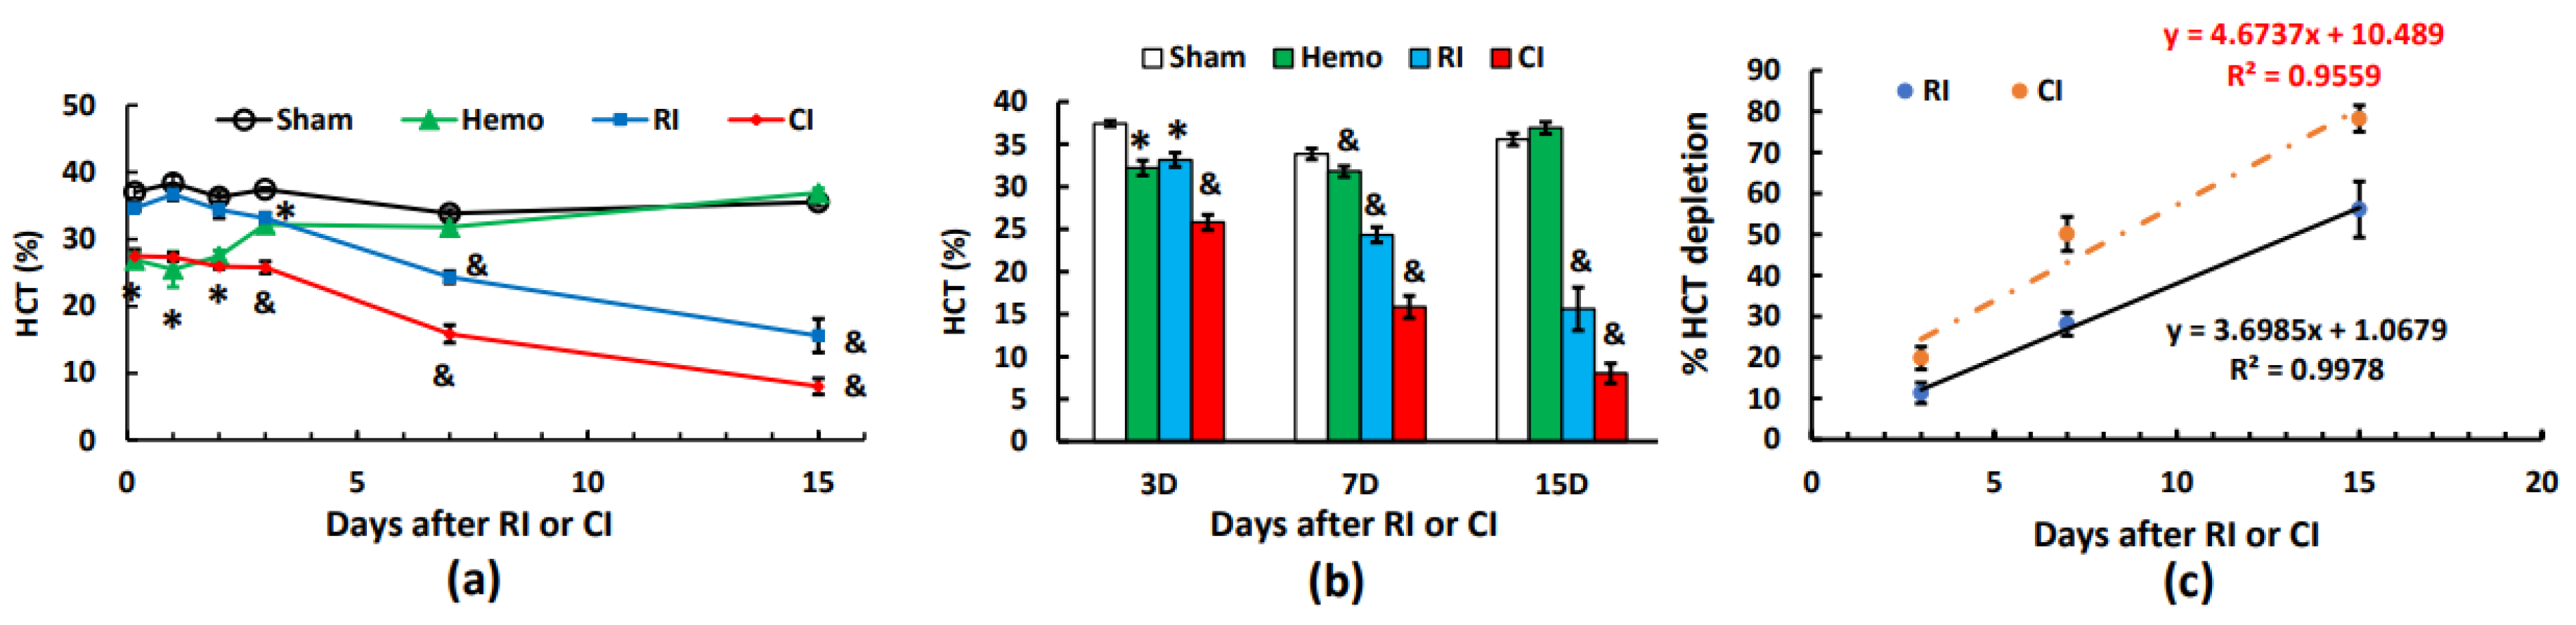
Figure 7.
Effects of radiation alone or combined radiation injury with hemorrhage on platelets. Animals were exposed to 8.75 Gy alone or followed by 20% hemorrhage. Complete blood cells were counted in blood collected in sham mice, Hemo alone mice, radiation alone mice, or radiation+Hemo mice at 4-5 h, and on days 1, 2, 3, 7, and 15. Data are mean±sem with N=6 per group per time point. (a) Platelets throughout 15 days; (b) Platelets on days 1, 2, and day 3; (c) Platelets on days 3, 7, and 15 with a non-linear relationship for RI and CI, respectively. *p<0.05 vs. Sham group; &p<0.05 vs. the rest 3 groups at the specific time point. Hemo: 20% hemorrhage; RI: 8.75 Gy; CI: 8.75 Gy+20% hemorrhage; RBC: red blood cells; D: day; R2: correlation coefficient.
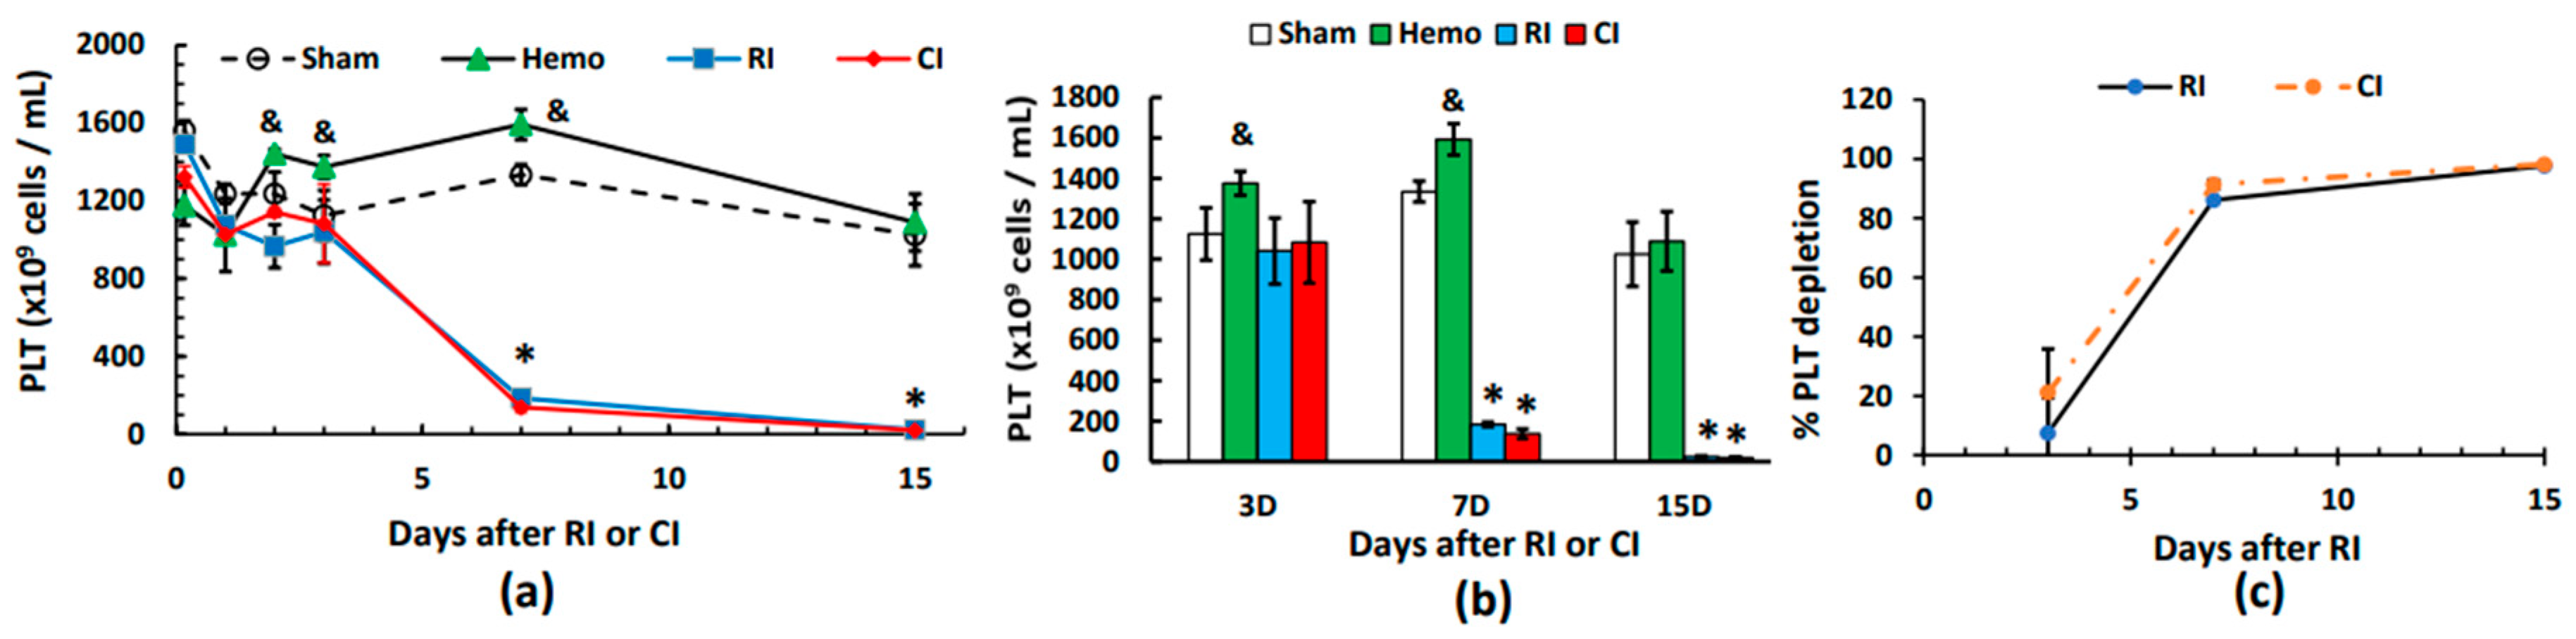

Table 1.
Relative CBC changes to respective sham groups on different time points.
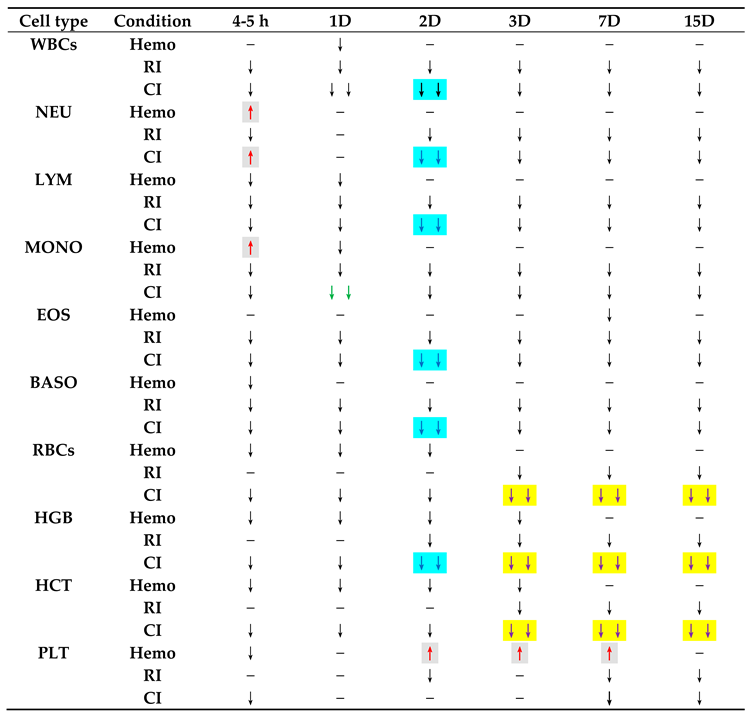 |
Hemo: 20% hemorrhage; RI: radiation at 8.75 Gy; CI: 8.75 Gy+20% hemorrhage; h: hour; D: day; −: no change; ↑: increase; ↓: decrease; ↓↓: further decrease.
Disclaimer/Publisher’s Note: The statements, opinions and data contained in all publications are solely those of the individual author(s) and contributor(s) and not of MDPI and/or the editor(s). MDPI and/or the editor(s) disclaim responsibility for any injury to people or property resulting from any ideas, methods, instructions or products referred to in the content. |
© 2024 by the authors. Licensee MDPI, Basel, Switzerland. This article is an open access article distributed under the terms and conditions of the Creative Commons Attribution (CC BY) license (http://creativecommons.org/licenses/by/4.0/).
Copyright: This open access article is published under a Creative Commons CC BY 4.0 license, which permit the free download, distribution, and reuse, provided that the author and preprint are cited in any reuse.


