
Submitted:
12 February 2024
Posted:
14 February 2024
You are already at the latest version
Abstract
Keywords: pelvic ultrasound, follicle number per ovary, FNPO, ovarian volume, PCOM, upper normal limits, referral population
Keywords:
pelvic ultrasound
; follicle number per ovary
; FNPO
; ovarian volume
; PCOM
; upper normal limits
; referral population
1. Introduction
One of the most important criteria in the majority of cases of polycystic ovarian syndrome (PCOS) is the polycystic structure of the ovaries [1]. The Guideline for the Assessment and Management of PCOS patients, published in 2018 [1] and updated in 2023 [2,3] proposed to consider Rotterdam 2003 criteria for PCOM as basic during PCOS diagnosis, and, simultaneously, it stressed on taking into account racial and age characteristics.
Previously, ethnic differences in follicle number and/or ovarian volume have been demonstrated by some authors. Thus, in Chinese women, the smaller ovarian volumes and the lower number of follicles were proposed as the sufficient criteria for diagnosing PCOМ, as compared to women of the European population: ≥6.3 cm3 and ≥10 follicles [3,4]. In Turkish women, the lower ovarian estimates compared to the Western female population were found with the following threshold criteria for PCOM: ovarian volume of 6.43 cm3 and the number of follicles≥ 8 [5]. According to current Guideline for the Assessment and Management of PCOS patients, for PCOM diagnosis, the ovarian volume is a much more reliable than the number of follicles [1,2]. Nevertheless, in the population of Korean women, the number of follicles was considered to be more significant criterion of polycystic disease than the volume of the ovary, due to the smaller volume of the ovaries characteristic of the Asian race [6,7].
Evidently, age-related processes in women suggest a reduction in the number of growing antral follicles. The volume of the ovaries and the number of follicles depend on reproductive period of lifespan, reaching a maximum value in adolescence with a gradual decrease in adulthood and a fast decrease at the age of menopause [8,9,10,11]. At the same time, the decrease in the number of follicles happens faster than the decrease in volume. Regarding PCOM, in women aged ≥35 yrs., the prevalence of polycystic ovaries is 7.8% vs 21% in younger women [7,8].
According to the international guidelines on the diagnosis and management of patients with PCOS, transvaginal ultrasonography should be performed in the early follicular phase of the natural cycle or after withdrawal bleeding caused by pharmaceuticals. Currently, the criteria for “PCOM” in women aged 18-35 years are as follows: ≥20 follicles in at least one ovary, and/or ovarian volume ≥10 ml, without the presence of dominant follicles, cysts or corpus luteum [1,2,12], but this approach of follicle number estimation is applicable if a transducer above 8 MHz is used. At the same time, in clinical practice, as well as in epidemiologic studies, equipment with a sensor frequency of 4-8 MHz is still widely used [1,2,12].
As previously shown in epidemiological studies, diagnostic criteria for PCOM based on ovarian volume and follicle number per ovary (FNPO) could be determined using the different approaches: a. by receiver operator characteristic (ROC) curve analyses (which report the diagnostic power of a parameter to distinguish between the diseased and non-diseased conditions and propose thresholds that balance test sensitivity and test specificity) [13] or b. cluster analysis in a large population-based unselected cohort. Some authors also utilized the upper (95th-98th) percentiles in a well-characterized cohort of women with regular predictable menstrual cycles of 21-35 days in length, and no clinical and/or biochemical evidence of hyperandrogenism (HA), recruited from the same population and examined in a similar manner as study subjects [13] to establish diagnostic criteria for polycystic ovarian morphology.
As mentioned above, the age and ethnic aspects should be taken into account, nevertheless, in general, the data on age- and ethnicity dependent diagnostic criteria for PCOM remains insufficient and may vary in the different geographic zones. In this study, we aimed to estimate the upper percentiles for ovarian volume and FNPO in unselected sub-population of non-hirsute, normo-androgenic, eumenorrheic premenopausal Eastern Siberian women to justify the need of determining the ethnicity and age dependent diagnostic criteria for PCOM.
2. Materials and Methods
Study design and population. A cross-sectional institution-based prospective study.
Study subjects were recruited during the institution-based study prospective Eastern Siberia PCOS Epidemiology & Phenotype (ESPEP) Study (СlinicalTrials.gov ID: NCT05194384) [14], conducted in two major areas of Eastern Siberia (Irkutsk Region and the Buryat Republic, Russian Federation) from March 2016 to December 2019. A total study population included 1490 premenopausal women who underwent an annual mandatory employment related medical assessment (Figure 1) All centers represented major regional employers.
Inclusion criteria for ESPEP Study [14]: female subjects, aged ≥ 18 and < 45 years, who provided written informed consent, were willing to comply with all study procedures, and would be available for the duration of the study. Non-inclusion criteria were: current pregnancy or lactation, history of hysterectomy and/or bilateral oophorectomy, endometrial ablation and/or uterine artery embolization, anything that would place the individual at increased risk or preclude the individual’s full compliance with or completion of the study, unwillingness to participate or difficulty understanding the consent processes or the study objectives and requirements, and the use of significant medications at the time of the study or within the previous three months, including: oral contraceptive pills (OCP), vaginal rings, transdermal patches, levonorgestrel-releasing intrauterine device (LNG-IUD), transdermal implants, injectable contraceptives, and hormone replacement therapy (HRT); mineralocorticoids; glucocorticoids; and insulin sensitizers, including metformin and thiazolidinediones.
The definitions of reference group included the following: a history of regular predictable menstrual cycles of 21-35 days in length, and no clinical signs of HA and/or elevated testosterone and/or DHAS levels and/or FAI [15]. Women with BMI <18 or ≥30 kg/m2, premature ovarian failure (by history or elevated FSH), treated and untreated hyperprolactinemia (based on history or increased prolactin level >727 mIU/ml), untreated thyroid disorder (based on history or TSH level >4 mIU/ml), and 21-hydroxylase deficient non-classic adrenal hyperplasia (based on increased 17-OHP >7.0 nmol/l), were excluded from the reference group. After these exclusions, 444 women (285 Caucasians, 123 Asians and 36 of mixed ethnicity) were eligible to be included to the reference group. Taking into account insufficient number of Mixed sub-population, we did not include them into final analysis (Figure 1).
Study Protocol. As previously described, subjects were evaluated consecutively by trained personnel, by questionnaire, anthropometry, vital signs, and gynecological exam. Anthropometry measurements included height, weight, waist circumference (WC). A body mass index (BMI) was calculated as: weight (kg)/height (m2). Hirsutism was defined by the modified Ferriman-Gallwey (mFG) visual hirsutism score scale [14,16].
Hormonal analyses. Blood samples were obtained in the morning, and analyzed for serum total testosterone (TT), DHEAS, sex hormone-binding globulin (SHBG), prolactin, TSH, LH, FSH and 17-hydroxyprogesterone (17-OHP), and the Free Androgen Index (FAI) was calculated (i.e., [TT/SHBG] x 100).
We used a validated, highly efficient liquid chromatography-tandem mass spectrometry (LC-MS/MS) assay (Shimadzu, Japan) in positive polarity mode using a dual ionization source (DUIS) to determine TT. The chromatography was performed with a Kromasil 100-2.5-C18 column (2.1 mm × 100 mm, AkzoNobel), and an isocratic elution mode using a mobile phase consisting of acetonitrile and 0.1% aqueous solution of formic acid. [2H3] - Testosterone (ALSAchim, France) was used as internal standard for the assay. The lower limit of TT quantification was 5 ng/dl with an average accuracy of 100.23%. Serum levels of SHBG, prolactin, FSH, LH, TSH, and 17-OHP were assessed by enzyme linked immunosorbent assay (ELISA) (ELx808, Bio-Tek Instruments, USA), using kits manufactured by AlcorBio (Russia). Serum DHEAS was detected using a competitive chemiluminescent enzyme immunoassay (Immulite 1000, Siemens, USA). AMH was assessed by ELISA using kits, produced by Xema Co, Ltd. (Russia).
Pelvic ultrasound (U/S) was performed by experienced specialists who were trained to conduct the U/S scans uniformly, with the intra/inter-observer coefficients of variation less than 6%. We used Mindray М7 (MINDRAY, China), a transvaginal probe (5.0-8.0 MHz) for sexually active subjects; and a transabdominal probe (2.5-5.0 MHz) for women who had never been sexually active. Ovarian volume was determined by the formula for a prolate ellipsoid (length x width x height x 0.523) [17].
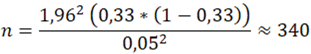
Statistical analysis. Sample size calculations for the total population were based on the following formula 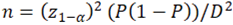 , n = individual sample size, z_(1-α) = 1,96 (when α = 0,05), P – assumed PCOM prevalence for unselected population according to previously published data, D – absolute error. If we take it as prevalence 33% [8,9] (or 0,33) and absolute error as 5%, then the minimum sample size:
, n = individual sample size, z_(1-α) = 1,96 (when α = 0,05), P – assumed PCOM prevalence for unselected population according to previously published data, D – absolute error. If we take it as prevalence 33% [8,9] (or 0,33) and absolute error as 5%, then the minimum sample size:
Data were collected using Research Electronic Data Capture (REDCap) [18].
Managing missing data: in our research dataset, there were two types of missing data: missing completely at random (MCAR) and missing at random (MAR). We recorded all missing values with labels of “N/A” to make them consistent throughout our dataset. When analyzing the dataset, we used the pairwise deletion way.
The results of the Kolmogorov-Smirnov’s test for normality have shown that the analyzed continuous variables were non-normally distributed. Therefore, for continuous variables, we used Mann-Whitney non-parametric tests. Kruskal-Wallis ANOVA an z-criteria were used to compare proportions and categorical variables. A p-value of 0.05 was considered statistically significant. To compare the 95th, 97.5th and 98th percentiles we analyzed 95% confidential intervals (95% CI). For constructing 95%CI we utilized the bootstrap percentile method. Overlapping 95% CIs can explain statistical significance when comparing two measured results. If the two 95% CIs do not overlap, we considered 95th-98th percentiles significantly different [13].
3. Results
Among 1398 premenopausal participants included in the ESPEP Study, we enrolled 408 women, aged 34.32±5.96 years, with regular predictable menstrual cycles, and no clinical or biochemical evidence of hyperandrogenism (reference group). By ethnicity, 285 women of them were Caucasians, and 123 of Asian ethnicity. The main characteristics of the reference group, including their socio-demography, menstrual and reproductive history, anthropometry, vital signs, and hormone profiles, in total and by ethnicity, are presented in Table 1.
As presented in this table, women of Caucasians and Asian ethnicity were comparable by age, anthropometric characteristics and marital status although these groups have some difference by education and occupation. Participants of Asian origin demonstrated lower, within a normal range, mFG score. Regarding serum FSH, LH, TSH, 17ОНP and AMH levels, no statistically significant differences were detected. At the same time, prolactin levels are significantly higher (within normative ranges) in Asians as compared to Caucasians women. When studying the impact of ethnicity on androgens, we have found that TT, DHAS and FAI values in the referral population were significantly lower (but in the normative intervals for multiethnic Siberian population) in Asians vs Caucasian women. At the same time, Asians showed lower levels of SHBG [15].
In all the study participants we analyzed ovarian volume and follicle number per ovary (FNPO) for ovaries, satisfied the following criteria: a) absence of follicles and/or cysts greater than 9 mm in diameter, b) absence of corpus luteum, and c) absence of ovarian masses. Initially, as each person had two ovaries, we analyzed data on 816 ovaries of 408 women included to the reference group, in total and by ethnicity (in subgroups 1 and 2). Finally, of the total number of premenopausal women from unselected population, included into the reference group (n= 408), the data for 563 ovaries were eligible for further investigation. For these ovaries we performed the descriptive statistical analysis and determined the upper (95th, 97.5th, and 98th) percentiles for OV and FNPO. All estimates of OV and FNPO were shown in Table 2, in total and by ethnicity.
As presented in the Table 2, the upper (95-98th) percentiles of both OV and FNPO were calculated for the total referral group and for subgroups of Caucasian and Asian ethnicity. Based on the calculation of 95%CI for the 95th, 97.5th and 98th percentiles and on the analysis of their overlapping, OV was considered comparable in subgroups 1 and 2, whereas the FNPO was significantly higher in Caucasians as compared to Asians.
The 95-98th percentiles of OV determined in the total referral group did not depend on age (Table 3). In Caucasians, the 97.5 and 98th percentiles of OV in women <35 yrs. and ≥35 yrs. were also comparable, whereas the 95th percentile for ovarian volume was significantly higher in younger Caucasians vs elder ones. In the groups of the same age, we have not found significant differences of these percentiles for ovarian volume in Caucasians vs Asians.
Regarding FNPO in the total referral population, the increase of the 95th as well as 98th percentiles was demonstrated in women <35 vs ≥35 yrs. old. In Caucasians, we have found the higher 98th percentile in women younger than 35 yrs., whereas the upper percentiles, calculated for FNPO in women of Asian ethnicity, did not depend on age (Table 3).
When comparing FNPO in Caucasians and Asians, who were younger than 35 yrs., we demonstrated the lower 95th and 98th percentiles in Asians vs Caucasians. In women of different ethnicity ≥35 yrs. old, significant difference was found for all the upper (95th, 97.5th, 98th percentiles with higher estimates in Caucasians as compared to Asians (Table 3).
4. Discussion
Ovarian morphology, specifically, ovarian volume and FPNO, is a key feature of polycystic ovaries, however, PCOM according to pelvic ultrasound is a common condition that can occur among healthy women with regular menstrual cycle. In general, the incidence of PСOM in the unselected populations is 33-22% [8-10]. At the same time, ultrasound features of PCOM are not rare and occur in up to 16-25% [8] of healthy women with regular menstrual cycles.
As previously reported, there are ethnic differences in the diagnostic criteria for PCOS regarding the number of follicles and/or ovarian volume, therefore, it seems reasonable that the prevalence of PCOM may differ among distinct populations. Some community-based assessments showed that different ethnic groups had specific results (Table 4). The use of various criteria for polycystic ovarian transformation may explain the inconsistency of data regarding the prevalence of PCOS. Therefore, establishing the diagnostic criteria of polycystic ovarian morphology is still challenging.
In our study, we based on determining the upper (95-98th) percentiles of both OV and FNPO in the referral group of non-hirsute, normo-androgenic, eumenorrheic premenopausal women from a multi-ethnic unselected Siberian population. Our data demonstrated, that, by Means, OV was increased in women of Caucasians as compared to Asians (6.58±2.36 vs. 5.69±2.09), however, for upper percentiles, the difference was not statistically significant due to the overlap of 95% CI.
For OV, the 95th percentile, determined for Caucasians in our study, was comparable to the same estimate in the population-based study conducted by Lujan et al. 2013 [29], in the United States and Canada. At the same time, according the previously reported data based on ROC analysis, UNL for OV in French Caucasians [24]. Indian women [25], women from United States and Iceland [26], Turkish and Vietnamese women [5,27] (Table 4) are lower than our estimates. However, most of these studies were performed in the relatively small hospital-based samples.
Regarding FNPO, we demonstrated a substantially higher threshold of FNPO - 12 vs 10 follicles (by 95th percentiles); 14 vs 10 follicles (by 97.5th percentiles) and 15 vs 10.52 follicles (by 98th percentiles) in women of Caucasian origin as compared to Asians. Our estimate for FNPO, based on 95th percentile with 95% CI approach, for referral group of Caucasians is consistent with previously demonstrated [13,24,25,28,31], although Köşüş et al. (2011) [5] reported lower values of FNPO for the control group of Caucasians.
Our estimates of FNPO for the Asian reference group are consistent with data previously published by Chen et al. (2008) [21], who used ultrasound equipment of a similar class as in our study. At the same time, our data, as well as findings from Chinese study mentioned above, differ from those reported for Thai Asian population by Wongwananuruk et al. (2018) [30].
The changes in the follicle number and OV with age were previously observed in the general populations [19,32,33,34]. Moreover, development of age-specific diagnostic criteria for PCOM in women of reproductive age has been recommended by the International Guidelines [1,2]. Nevertheless, the data regarding age dependent thresholds for ovarian morphology is insufficient [19,26,28]. In our study, 95th percentiles for FNPO in women aged <35 yrs. and ≥35 yrs. differ significantly in the total referral group (13 vs. 10.35), as well as in Caucasian subgroup. At the same time, we have not found age dependent differences in FNPO in the Asian subgroup.
Study strengths. Importantly, our study benefited by the fact that we identified the study subjects with regular predictable menstrual cycles, and no clinical or biochemical evidence of hyperandrogenism (reference group) in a representative unselected, medically unbiased, multiracial population of women, living in the same geographical conditions. We consider the Eastern Siberian population as the appropriate model for the purpose of studying the ethnicity-dependent aspects of ovarian morphology in Caucasians and Asians. All study participants were well phenotyped with the exclusion of any factors that could influence their PCOM characteristics. In addition, all measurements (FNPO, OV) were accomplished by only three specialists who were trained to conduct the U/S scans uniformly (with the intra/inter-observer coefficients of variation less than 6%) with the same machines in Caucasians and Asians, helping to protect potential bias between the two populations. Besides, we proposed age- and ethnicity-based OV and FNPO estimates simultaneously, therefore, these criteria are useful and convenient for PCOM diagnosing. Study limitations. The use of the US equipment with probes of ≤8 mHz is one of our study limitations. At the same time, mid-range equipment is most commonly utilized in standard clinical practice, and we suggest our data on OV and FNPO thresholds to be still valid, although the use of the probes of > 8 mHz is highly recommended [2]). We also were not able to estimate ultrasound characteristics in women of Mixed, Caucasian/Asian ethnicity due to insufficient number of participants.
5. Conclusions
In this study, we have found that the 95-98th percentiles of OV determined in the total referral group did not depend on age, nevertheless, in Caucasians, the 95th percentile for ovarian volume was significantly higher in younger subjects vs elder ones (12.05 vs. 9.85). In the groups of the same age, we have not found significant differences of these percentiles for ovarian volume in Caucasians vs Asians. Regarding FNPO in the total population, the higher estimates of the 95th as well as 98th percentiles were demonstrated in women <35 vs ≥35 yrs. old. In women of different ethnicity the significant difference was found for all the upper percentiles for FNPO with higher estimates in Caucasians as compared to Asians. The data suggest that, in multiethnic, Caucasian/Asian population, the age- and ethnicity issues regarding FNPO should be taken into account when determining the diagnostic PCOM criteria. The age-dependent difference is also important for estimation of OV in Caucasians.
Author Contributions
Conceptualization, Lazareva L. and Suturina L.; methodology, Lazareva L., Atalyan A., Legro R, Suturina L. and Azziz R.; software, REDCap administration, statistical analysis, Atalyan A.; pelvic U/S, Lazareva L, Danusevich I., Nadelyaeva Ya.; investigation, Lazareva L., Belenkaya L, Egorova I.., Ievleva K. and Babaeva N.; writing—original draft preparation, Lazareva L. and Suturina L.; writing—review and editing, Lizneva D., Legro R., Azziz R.; supervision, Legro R., Azziz R.; project administration, Suturina L.; funding acquisition, Suturina L. All authors have read and agreed to the published version of the manuscript.
Funding
The project was supported by the state scientific programs “The main determinants and mechanisms of the formation of reproductive disorders of the family’s reproductive health in various gender and age groups” (#АААА-А19-119101590007-8), “Early detection and correction of neuro-endocrine, metabolic and psycho-emotional manifestations of reproductive disorders associated with hyperandrogenism” (#АААА-А18-118011990043-5) and “Pathophysiological mechanisms, genetic and metabolic predictors of reproductive health and longevity in various age, gender and ethnic groups” (#121022500180-6). The research was performed using the equipment of the Center for the development of progressive personalized health technologies at the Scientific Center for Family Health and Human Reproduction.
Institutional Review Board Statement
The study was conducted in accordance with the Declaration of Helsinki 1964, with subsequent changes, and approved by the Local Ethics Committee of Scientific Center for Family Health and Human Reproduction Problems (protocol number 2.1, date of approval 24 February 2016).
Informed Consent Statement
Informed consent was obtained from all subjects involved in the study.
Data Availability Statement
Data from the study may be available to other researchers who have developed important research questions that can be answered by these valuable data. This data access policy applies to all individuals or organizations who would like to utilize data from the study. Data may be requested by researchers from various institutions for research purposes only, by submitting an expression of interest (EoI), which should include brief information about a Project leader’s name, institution, a title of the potential project, and ethical approval from the Ethics Committee, and a summary of the proposed project. Individual participant data to be shared may include de-identified socio-demographic, clinical data, as well as lab tests results.
Acknowledgments
Frank Z. Stanczyk, a member of ESPEP Study Steering Committee, Keck School of Medicine, University of Southern California, Los Angeles, CA, USA ; Bulent O. Yildiz, a member of ESPEP Study Steering Committee, Hacettepe University School of Medicine, Hacettepe, Ankara, Turkey.
Conflicts of Interest
RA serves as a consultant for Spruce Biosciences, May Health, Core Access Surgical Technologies, Acacia Bio, Fortress Biotech, and Rani Therapeutics, and has equity in Martin Imaging; RSL has consulted for Organon, Covis, Novo Nordisk and Insudd Pharmaceuticals. All other authors have nothing to disclose. All other authors have nothing to disclose.
References
- Teede, H.J.; Misso, M.L.; Costello, M.F.; Dokras, A.; Laven, J.; Moran, L.; Piltonen, T.; Norman, R.J.; Network, I.P. Recommendations from the international evidence-based guideline for the assessment and management of polycystic ovary syndrome. Clin Endocrinol (Oxf) 2018, 89, 251–268. [Google Scholar] [CrossRef]
- Teede, H.J.; Tay, C.T.; Laven, J.; Dokras, A.; Moran, L.J.; Piltonen, T.T.; Costello, M.F.; Boivin, J.; M Redman, L.; A Boyle, J.; et al. Recommendations from the 2023 International Evidence-based Guideline for the Assessment and Management of Polycystic Ovary Syndrome. Fertil Steril 2023, 120, 767–793. [Google Scholar] [CrossRef]
- Huang, Z.; Yong, E.L. Ethnic differences: Is there an Asian phenotype for polycystic ovarian syndrome? Best Pract Res Clin Obstet Gynaecol 2016, 37, 46–55. [Google Scholar] [CrossRef] [PubMed]
- Zhao, Y.; Qiao, J. Ethnic differences in the phenotypic expression of polycystic ovary syndrome. Steroids 2013, 78, 755–760. [Google Scholar] [CrossRef] [PubMed]
- Köşüş, N.; Köşüş, A.; Turhan, N.; Kamalak, Z. Do threshold values of ovarian volume and follicle number for diagnosing polycystic ovarian syndrome in Turkish women differ from western countries? Eur J Obstet Gynecol Reprod Biol 2011, 154, 177–181. [Google Scholar] [CrossRef]
- Han, Y.S.; Lee, A.R.; Song, H.K.; Choi, J.I.; Kim, J.H.; Kim, M.R.; Kim, M.J. Ovarian Volume in Korean Women with Polycystic Ovary Syndrome and Its Related Factors. J Menopausal Med 2017, 23, 25–31. [Google Scholar] [CrossRef]
- Lazareva, L.; Suturina, L. International Journal of Biomedicine 2022;12(1):100-103. In: 2022 SLIJoB, 10.21103/Article12(1)_RA6 -D, editors. [CrossRef]
- Azziz, R.; Carmina, E.; Dewailly, D.; Diamanti-Kandarakis, E.; Escobar-Morreale, H.F.; Futterweit, W.; Janssen, O.E.; Legro, R.S.; Norman, R.J.; Taylor, A.E.; et al. The Androgen Excess and PCOS Society criteria for the polycystic ovary syndrome: the complete task force report. Fertil Steril 2009, 91, 456–488. [Google Scholar] [CrossRef] [PubMed]
- Hart, R.; Doherty, D.A. The potential implications of a PCOS diagnosis on a woman's long-term health using data linkage. J Clin Endocrinol Metab 2015, 100, 911–919. [Google Scholar] [CrossRef]
- Hsu, M.I. Changes in the PCOS phenotype with age. Steroids 2013, 78, 761–766. [Google Scholar] [CrossRef]
- Belenkaia, L.V.; Lazareva, L.M.; Walker, W.; Lizneva, D.V.; Suturina, L.V. Criteria, phenotypes and prevalence of polycystic ovary syndrome. Minerva Ginecol 2019, 71, 211–223. [Google Scholar] [CrossRef]
- Rao, P.; Bhide, P. Controversies in the diagnosis of polycystic ovary syndrome. Ther Adv Reprod Health 2020, 14, 2633494120913032. [Google Scholar] [CrossRef]
- Dewailly, D.; Lujan, M.E.; Carmina, E.; Cedars, M.I.; Laven, J.; Norman, R.J.; Escobar-Morreale, H.F. Definition and significance of polycystic ovarian morphology: a task force report from the Androgen Excess and Polycystic Ovary Syndrome Society. Hum Reprod Update 2014, 20, 334–352. [Google Scholar] [CrossRef]
- Suturina, L.; Lizneva, D.; Danusevich, I.; Lazareva, L.; Belenkaya, L.; Nadeliaeva, I.a.; Kovalenko, I.; Bazarova, T.; Khomyakova, A.; Natyaganova, L.; et al. The design, methodology, and recruitment rate for the Eastern Siberia PCOS epidemiology&phenotype (ES-PEP) Study. In Proceedings of the 41st Annual Meeting of the Androgen Excess & PCOS Society, Lorne, Victoria, Australia, 10–12 November 2016; p. 76. [Google Scholar]
- Suturina, L.; Lizneva, D.; Atalyan, A.; Lazareva, L.; Belskikh, A.; Bairova, T.; Sholokhov, L.; Rashidova, M.; Danusevich, I.; Nadeliaeva, I.; et al. Establishing Normative Values to Determine the Prevalence of Biochemical Hyperandrogenism in Premenopausal Women of Different Ethnicities from Eastern Siberia. Diagnostics (Basel) 2022, 13. [Google Scholar] [CrossRef]
- Yildiz, B.O.; Bolour, S.; Woods, K.; Moore, A.; Azziz, R. Visually scoring hirsutism. Hum Reprod Update 2010, 16, 51–64. [Google Scholar] [CrossRef] [PubMed]
- Balen, A.H.; Laven, J.S.; Tan, S.L.; Dewailly, D. Ultrasound assessment of the polycystic ovary: international consensus definitions. Hum Reprod Update 2003, 9, 505–514. [Google Scholar] [CrossRef] [PubMed]
- Atalyan, A.V. Atalyan A.V., Kolesnikova L.I., Kolesnikov S. I., Grjibovski A. M., Suturina L. V. Research Electronic Data Capture (REDCap) for Building and Managing Databases for Population-based Biomedical Studies. Ekologiya cheloveka [Human Ecology]. 2019, 2, 52–59. [CrossRef]
- Ahmad, A.K.; Quinn, M.; Kao, C.N.; Greenwood, E.; Cedars, M.I.; Huddleston, H.G. Improved diagnostic performance for the diagnosis of polycystic ovary syndrome using age-stratified criteria. Fertil Steril 2019, 111, 787–793. [Google Scholar] [CrossRef] [PubMed]
- Carmina, E.; Campagna, A.M.; Fruzzetti, F.; Lobo, R.A. AMH measurement versus ovarian ultrasound in the diagnosis of polycystic ovary syndrome in different phenotypes. Endocr Pract 2016, 22, 287–293. [Google Scholar] [CrossRef]
- Chen, Y.; Li, L.; Chen, X.; Zhang, Q.; Wang, W.; Li, Y.; Yang, D. Ovarian volume and follicle number in the diagnosis of polycystic ovary syndrome in Chinese women. Ultrasound Obstet Gynecol 2008, 32, 700–703. [Google Scholar] [CrossRef]
- Dewailly, D.; Alebić, M.; Duhamel, A.; Stojanović, N. Using cluster analysis to identify a homogeneous subpopulation of women with polycystic ovarian morphology in a population of non-hyperandrogenic women with regular menstrual cycles. Hum Reprod 2014, 29, 2536–2543. [Google Scholar] [CrossRef]
- Fulghesu, A.M.; Ciampelli, M.; Belosi, C.; Apa, R.; Pavone, V.; Lanzone, A. A new ultrasound criterion for the diagnosis of polycystic ovary syndrome: the ovarian stroma/total area ratio. Fertil Steril 2001, 76, 326–331. [Google Scholar] [CrossRef]
- Jonard, S.; Robert, Y.; Dewailly, D. Revisiting the ovarian volume as a diagnostic criterion for polycystic ovaries. Hum Reprod 2005, 20, 2893–2898. [Google Scholar] [CrossRef]
- Sujata, K.; Swoyam, S. 2D and 3D Trans-vaginal Sonography to Determine Cut-offs for Ovarian Volume and Follicle Number per Ovary for Diagnosis of Polycystic Ovary Syndrome in Indian Women. J Reprod Infertil 2018, 19, 146–151. [Google Scholar]
- Kim, H.J.; Adams, J.M.; Gudmundsson, J.A.; Arason, G.; Pau, C.T.; Welt, C.K. Polycystic ovary morphology: age-based ultrasound criteria. Fertil Steril 2017, 108, 548–553. [Google Scholar] [CrossRef]
- Le, N.S.V.; Le, M.T.; Nguyen, N.D.; Tran, N.Q.T.; Nguyen, Q.H.V.; Cao, T.N. A Cross-Sectional Study on Potential Ovarian Volume and Related Factors in Women with Polycystic Ovary Syndrome from Infertile Couples. Int J Womens Health 2021, 13, 793–801. [Google Scholar] [CrossRef] [PubMed]
- Lie Fong, S.; Laven, J.S.E.; Duhamel, A.; Dewailly, D. Polycystic ovarian morphology and the diagnosis of polycystic ovary syndrome: redefining threshold levels for follicle count and serum anti-Müllerian hormone using cluster analysis. Hum Reprod 2017, 32, 1723–1731. [Google Scholar] [CrossRef]
- Lujan, M.E.; Jarrett, B.Y.; Brooks, E.D.; Reines, J.K.; Peppin, A.K.; Muhn, N.; Haider, E.; Pierson, R.A.; Chizen, D.R. Updated ultrasound criteria for polycystic ovary syndrome: reliable thresholds for elevated follicle population and ovarian volume. Hum Reprod 2013, 28, 1361–1368. [Google Scholar] [CrossRef] [PubMed]
- Wongwananuruk, T.; Panichyawat, N.; Indhavivadhana, S.; Rattanachaiyanont, M.; Angsuwathana, S.; Techatraisak, K.; Pratumvinit, B.; Sa-Nga-Areekul, N. Accuracy of anti-Müllerian hormone and total follicles count to diagnose polycystic ovary syndrome in reproductive women. Taiwan J Obstet Gynecol 2018, 57, 499–506. [Google Scholar] [CrossRef]
- Jonard, S.; Dewailly, D. The follicular excess in polycystic ovaries, due to intra-ovarian hyperandrogenism, may be the main culprit for the follicular arrest. Hum Reprod Update 2004, 10, 107–117. [Google Scholar] [CrossRef] [PubMed]
- Hudecova, M.; Holte, J.; Olovsson, M.; Sundström Poromaa, I. Long-term follow-up of patients with polycystic ovary syndrome: reproductive outcome and ovarian reserve. Hum Reprod 2009, 24, 1176–1183. [Google Scholar] [CrossRef]
- Glintborg, D.; Mumm, H.; Ravn, P.; Andersen, M. Age associated differences in prevalence of individual rotterdam criteria and metabolic risk factors during reproductive age in 446 caucasian women with polycystic ovary syndrome. Horm Metab Res 2012, 44, 694–698. [Google Scholar] [CrossRef]
- Wiser, A.; Shalom-Paz, E.; Hyman, J.H.; Sokal-Arnon, T.; Bantan, N.; Holzer, H.; Tulandi, T. Age-related normogram for antral follicle count in women with polycystic ovary syndrome. Reprod Biomed Online 2013, 27, 414–418. [Google Scholar] [CrossRef] [PubMed]
Figure 1.
Flow diagram of the ESPEP Study participants.
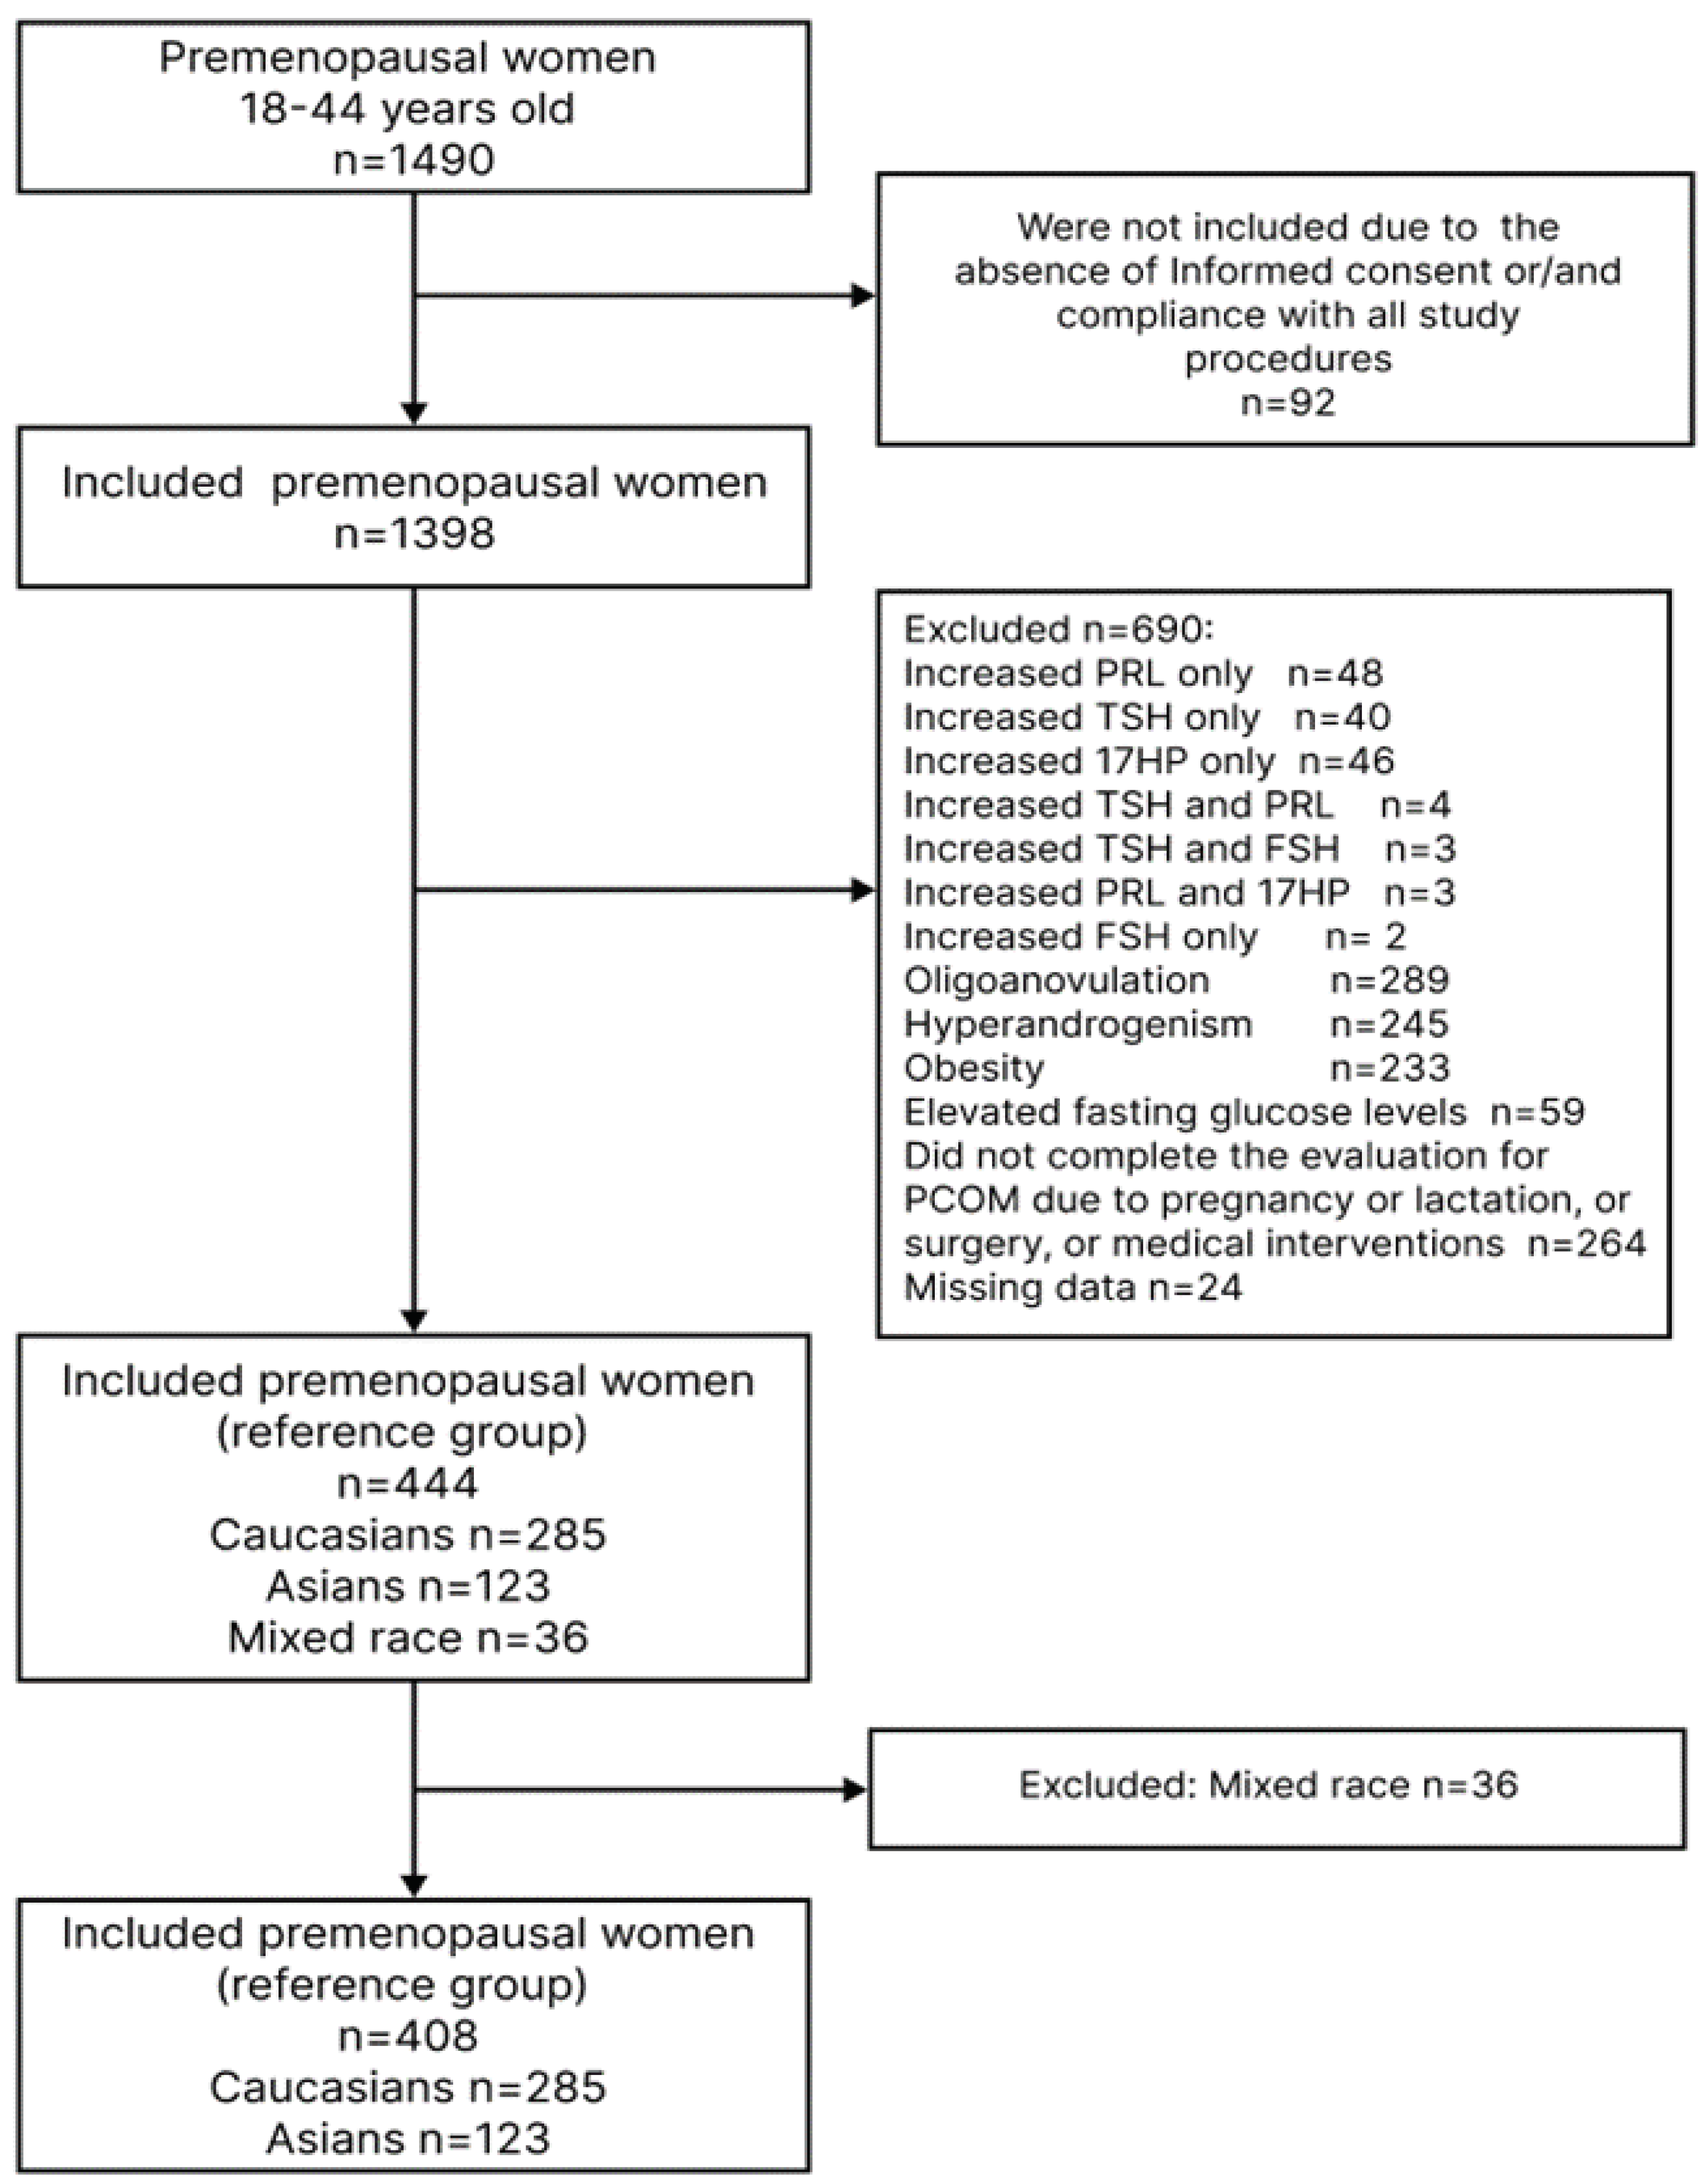

Table 1.
Characteristics of women included to the reference group.
| Parameter | Total n= 408 |
Caucasians(1) n=285 |
Asians(2) n=123 |
p- value |
|---|---|---|---|---|
| Mean ± SD. Median (Lower Q; Upper Q) | ||||
| Age, years |
34.32±5.96 35.00 (30.00;39.00) |
34.04±6.01 34.00 (30.00;39.00) |
34.98±5.81 35.00 (31.00;40.00) |
p1-2=0.680* |
| Anthropometry and vital signs Mean ± SD. Median (Lower Q; Upper Q) | ||||
| WC, cm | 74.14±8.85 73.00 (67.00;80.00) |
73.86±8.95 73.00 (67.00;80.00) |
74.80±8.63 74.00 (68.00;81.00) |
p1-2=0.649* |
| BMI, kg/m2 | 23.79±3.30 23.70 (21.15;26.60) |
23.90±3.29 23.90 (21.20;26.70) |
23.54±3.31 23.70 (20.90;26.30) |
p1-2=0.916* |
| Systolic blood pressure, mm Hg | 119.51±11.52 119.00 (112.00;126.00) |
119.40±11.02 120.00 (112.00;125.00) |
119.75±12.64 117.00 (111.00;126.00) |
p1-2=0.066* |
| Diastolic blood pressure, mm Hg | 76.51±8.61 76.00 (70.00;81.500) |
76.00±8.39 76.00 (70.00;81.00) |
77.71±9.05 77.00 (71.00;83.00) |
p1-2=0.307* |
| Education n/N (%) | p=0.000# | |||
| Doctoral degree | 27/408 (6.62%) | 15/285 (5.26%) | 12/123 (9.76%) | p1-2=0.093** |
| Master’s degree | 286/408 (70.10%) | 185/285 (64.91%) | 101/123 (82.11%) |
p1-2=0.001** |
| Incomplete high school | 16/408 (3.92%) | 13/285 (4.56%) | 3/123 (2.44%) | p1-2=0.311** |
| Bachelor’s degree | 58/408 (14.22%) | 52/285 (18.25%) | 6/123 (4.88%) | p1-2=0.000** |
| Some college | 1/408 (0.25%) | 1/285 (0.35%) | 0/123 (0.00%) | p1-2=0.511** |
| High school or equivalent | 14/408 (3.43%) | 13/285 (4.56%) | 1/123 (0.81%) | p1-2=0.056** |
| Middle school only | 5/408 (1.23%) | 5/285 (1.75%) | 0/123 (0.00%) | p1-2=0.140** |
| Elementary school | 0/408 (0.00%) | 0/285 (0.00%) | 0/123 (0.00%) | NS |
| No degree | 1/408 (0.25%) | 1/285 (0.35%) | 0/123 (0.00%) | p1-2=0.511** |
| Occupation, n/N (%) | p=0.000# | |||
| Legislators. senior officials and managers | 9/408 (2.22%) | 8/285 (2.83%) | 1/123 (0.82%) | p1-2=0.511** |
| Professionals | 179/408 (44.20%) | 108/285 (38.16%) | 71/123 (58.20%) | p1-2=0.206** |
| Technicians and associate professionals | 78/408 (19.26%) | 62/285 (21.91%) | 16/123 (13.11%) | p1-2=0.000** |
| Office clerks | 55/408 (13.58%) | 33/285 (11.66%) | 22/123 (18.03%) | p1-2=0.039** |
| Service workers. and shop and market sales | 21/408 (5.19%) | 13/285 (4.59%) | 8/123 (6.56%) | p1-2=0.084** |
| Skilled agricultural and fishery workers | 1/408 (0.25%) | 1/285 (0.35%) | 0/123 (0.00%) | p1-2=0.511** |
| Craft and related trades workers | 41/408 (10.12%) | 38/285 (13.43%) | 3/123 (2.46%) | p1-2=0.001** |
| Plant and machine operators and assemblers | 8/408 (1.98%) | 8/285 (2.83%) | 0/123 (0.00%) | p1-2=0.059** |
| Elementary occupations | 13/408 (3.21%) | 12/285 (4.24%) | 1/123 (0.82%) | p1-2=0.072** |
| Marital status n/N (%) | р=0.890# | |||
| Single | 97/408 (23.89%) | 68/285 (23.86%) | 29/123 (23.97%) | |
| Married | 220/408 (54.19%) | 152/285 (53.33%) | 68/123 (56.20%) | |
| Living with another | 38/408 (9.36%) | 30/285 (10.53%) | 8/123 (6.61%) | |
| Separated | 5/408 (1.23%) | 4/285 (1.40%) | 1/123 (0.83%) | |
| Divorced | 35/408 (8.62%) | 23/285 (8.07%) | 12/123 (9.92%) | |
| Widowed | 8/408 (1.97%) | 6/285 (2.11%) | 2/123 (1.65%) | |
| Would rather not say | 3/408 (0.74%) | 2/285 (0.70%) | 1/123 (0.83%) | |
| Menstrual and reproductive history Mean ± SD. Median (Lower Q; Upper Q) |
||||
| Age at menarche, years | 13.28±1.35 13.00 (12.00;14.00) |
13.22±1.31 13.00 (12.00;14.0) |
13.41±1.43 13.00 (12.00;14.00) |
p1-2=0.223* |
| Average menstrual cycle length, days | 27.71±2.11 28.00 (27.99;29.00) |
27.61±2.16 28.00 (27.00;28.00) |
27.93±1.97 28.00 (27.00;30.00) |
p1-2=0.251* |
| Parity of pregnancies | 2.36±2.15 2.00 (1.00;3.00) |
2.37±2.19 2.00 (1.00;4.00) |
2.33±2.04 2.00 (1.00;3.00) |
p1-2=0.375* |
| mFG score | 0.54±0.96 0.00 (0.00;1.00) |
0.62±1.02 0.00 (0.00;1.00) |
0.37±0.78 0.00 (0.00;0.00) |
p1-2=0.001* |
| Hormones Mean ± SD. Median (Lower Q; Upper Q) | ||||
| Prolactin, mIU/ml | 333.91±153.57 307.00 (218.00;438.50) |
303.38±134.08 277.00 (202.00;382.00) |
404.64±172.07 399.00 (269.00;509.00) |
p1-2=0.001* |
| TSH, mIU/ml | 1.56±0.73 1.50 (1.00;2.00) |
1.52±0.73 1.40 (1.00;1.90) |
1.66±0.72 1.60 (1.20;2.10) |
p1-2=0.996* |
| LH, mIU/ml | 7.23±10.02 5.30 (3.20;7.50) |
7.52±10.16 5.60 (3.30;7.90) |
6.57±9.67 4.80 (3.20;7.00) |
p1-2=0.533* |
| FSH. mIU/ml | 5.86±3.22 5.40 (3.8;7.0) |
5.96±3.22 5.50 (4.00;7.00) |
5.67±3.22 5.10 (3.60;6.90) |
p1-2=1.00* |
| TT, ng/dl | 25.02±13.74 24.69 (14.93;33.61) |
26.22±14.68 25.70 (16.05;34.83) |
21.78±10.65 22.09 (13.64;29.99) |
p1-2=0.000* |
| SHBG, nmol/l | 86,23±56.21 70.35 (47.00;105.70) |
90.48±59.98 71.00 (51.40;115.00) |
76.38±45.00 65.60 (43.50;96.80) |
p1-2=0.000* |
| FAI | 1.35±1.05 1.15 (0.59;1.83) |
1.42±1.17 1.19 (0.59;1.88) |
1.19±0.70 1.07 (0.57;1.62) |
p1-2=0.000* |
| DHEAS, μg/dl | 160.52±65.36 155.00 (113.00;202.00) |
164.65±68.89 158.00 (118.00;210.00) |
150.87±55.32 145.00 (106.00;187.00) |
p1-2=0.006* |
| 17ОНP, nmol/l | 5.50±3.37 5.15 (2.50;7.00) |
5.63±3.35 5.40 (2.80;7.00) |
5.21±3.41 5.00 (2.10;7.00) |
p1-2=0.810* |
| АМН, ng/ml | 2.85± 2.21 2.20 (1.10;4.40) |
2.91±2.20 2.30 (1.10;4.50) |
2.71±2.22 1.90 (0.57;1.62) |
p1-2=0.900* |
* U-test; **-Z test; # - Kruskal-Wallis ANOVA test.
Table 2.
Ovarian volume (OV) and follicle number (FNPO) in the reference group of women from unselected population.
Table 2.
Ovarian volume (OV) and follicle number (FNPO) in the reference group of women from unselected population.
| Total N=408 |
Caucasians N=285 (subgroup 1) |
Asians N=123 (subgroup 2) |
p- value” | |
| n=563* | n=388* | n=175* | ||
| OV | ||||
| Mean±SD (Min-Max) |
6.30±2.31 (0.54;16.98) |
6.58±2.36 (0.54;16.98) |
5.69±2.09 (1.57;14.63) |
p1-2=0.000 |
| Median (Lower Q; Upper Q) |
6.01(4.77;7.37) | 6.305 (5.04;7.78) | 6.00 (4.34;6.63) | |
| 95 Percentile (95%CI) | 10.31(9.86; 11.22) | 10.63(10.01; 11.88) | 9.32(8.57; 10.65) | |
| 97.5 Percentile (95%CI) | 12.3 (10.68; 13.16) | 12.45 (11.09;13.30) | 10.62 (9.34; 13.92) | |
| 98 Percentile (95%CI) | 12.56 (11.28; 13.56) | 12.58 (11.39; 13.76) | 10.66(9.51; 14.29) | |
| FNPO | ||||
| Mean±SD (Min-Max) |
6.85±2.78 (1.00;30.00) |
7.19±3.00 (1.00;30.00) |
6.11±2.03 (1.00;14.00) |
p1-2=0.000 |
| Median (Lower Q; Upper Q) |
6,00 (5.00;8.00) | 7,00 (5.00;8.00) | 6,00 (5.00;6.00) | |
| 95 Percentile (95%CI) | 12 (10,00; 10,72) | 12# (10; 12) | 10# (9; 10) | |
| 97,5 Percentile (95%CI) | 14 (12,00; 14,95) | 14# (12; 14) | 10# (9; 10) | |
| 98 Percentile (95%CI) | 14 (12,00; 14,00) | 15# (13,25; 15,26) | 10.52#(10; 12) | |
Abbreviations: U/S is ultrasound, and FNPO - Follicle number per ovary.* n-number of ovaries, available for evaluation #-significant difference between groups 1 and 2, based on the estimation of overlapping of 95% CIs, “- U-test.
Table 3.
Ovarian volume in the reference group from unselected population, by age.
|
Total N=408 |
Caucasians N=285 |
Asians N=123 |
p- value (U-test) | ||||
|
<35 yrs, n=269& (1) |
≥35 yrs, n=294& (2) |
<35 yrs., n=194& (1a) |
≥35 yrs, n=194& (2a) |
<35 yrs, n=75& (1b) |
≥35 yrs, n=100& (2b) |
||
| Mean±SD. (Min-Max) |
6.72±2.37 (0.54;16.98) |
5.91±2.2 (0.94;14.63) |
7.09±2.38 (0.54;16.98) |
6.07±2.22 (0.94;13.56) |
5.78±2.07 (1.57;12.72) |
5.62±2.12 (2.2;14.63) |
p1-2=0.000 p1а-1b=0.000 p1а-2a=0.000 p1b-2b=0.596 p1а-1b=0.000 p2а-2b=0.040 |
| Median (Lower Q; Upper Q) |
6.28 (5.08;7.85) | 5.62 (4.39;7.11) | 6.7 (5.5;8.09) | 5.93 (4.6;7.27) | 5.22 (4.44;6.96) | 5.4 (4.17;6.46) | |
| 95 Percentile (95%CI) | 11.32 (10.13. 12.65) |
9.83 (9.32. 10.32) |
12.05## (10.53. 12.89) |
9.85## (9.49. 10.26) |
9.55 (8.43. 11.26) |
9.18 (7.96. 10.88) |
|
| 97,5 Percentile (95%CI) | 12.67 (11.38. 13.81) |
10.47 (9.85. 12.56) |
12.81 (11.6. 14.18) |
10.24 (9.85. 12.56) |
10.2 (9.11. 12.72) |
10.64 (8.59. 14.63) |
|
| 98 Percentile (95%CI) | 12.73 (11.91. 15.15) |
10.6 (9.94. 13.56) |
13.26 (12.33. 15.9) |
10.35 (9.87. 12.56) |
10.39 (9.22. 12.72) |
10.74 (9.02. 14.63) |
|
| Follicle number per ovary (FNPO) in the reference group from unselected population, by age | |||||||
| Mean±SD. (Min-Max) |
7.88±2.9 (3;30) | 5.91±2.29 (1;15) | 8.22±3.14 (3;30) | 6.15±2.47 (1;15) | 7.03±1.94 (3;14) | 5,43±1.83 (1;12) | p1-2=0.000 p1а-1b=0.000 p1а-2a=0.000 p1b-2b=0.000 p1а-1b=0.006 p2а-2b=0.009 |
| Median (Lower Q; Upper Q) |
7 (6;9) | 6 (5;7) | 7 (6;9) | 6 (5;7) | 7 (6;8) | 5 (4;6) | |
| 95 Percentile (95%CI) | 13 (12.0. 14.6)* | 10.35 (9.0, 12.0)* | 14 (13.0, 16.0)## | 12” (11.65, 14.65) | 10 (8.0, 11.0)## | 8.05” (8.0, 10.05) | |
| 97,5 Percentile (95%CI) | 15 (13.0, 16.0) | 12 (11.0, 13.32) | 15 (12.83, 16.0) | 12.17” (12.0, 14.0) |
10.3 (10.0, 14.0) | 9.52” (8.0, 11.52) | |
| 98 Percentile (95%CI) | 15 (13.0, 16.0)* |
12 (10.0, 12.0)* |
15.4**,## (14.0, 18.0) |
13**,” (12.0, 14.0) |
11.04”,## (10.0, 14.0) |
10.02” (8.02, 12.0) |
|
&-number of ovaries, available for evaluation. *,**, #, ##, “-significant difference between groups 1 and 2, based on the esti-mation of overlapping of 95% CIs.
Table 4.
Proposed thresholds for follicle number and ovarian volume by different authors.
| Author, Year Country, | Setting Study Design # | Total Population, | Ethnicity Controls | Age range | OV, Mean±StD. (Min-Max) For Controls |
OV, UNLs Controls |
FNPO Mean±SD. (Min-Max) For Controls |
FPNO, UNLs Controls |
Transducer Frequency |
|---|---|---|---|---|---|---|---|---|---|
| Ahmad et al. 2019, USA [19]. | Cross-sectional study | Control: 756 (FNPO, OV) PCOS: 245 (FNPO), 297 (OV) |
Caucasians | Overall (20-40) | 6.49±4.98 | 6.75 | 10.01 ± 5.29 | 13 | 4-8 MHz, 4-10 MHz |
| 25 to <30 | 7.31±6.33 | 8.5 | 12.38±5.52 | 15 | |||||
| 30 to <35 | 6.49±4.97 | 7.00 | 10.14±4.8 | 14 | |||||
| 35 to <40 | 5.82±3.39 | 6.25 | 7.96±4.66 | 12 | |||||
| Carmina et al. 2016, Italy [20]. | Retrospective matched controlled study | PCOS: 113 Control: 47 | Caucasians | 19 to 35 years | N/A | 4.4 ± 1.8 | N/A | 10 ± 4 | 8-10 MHz |
| Chen et al. 2008, Сhina [21]. | Age-matched women | PCOS: 432 Control: 153 | Chinese population | N/A | N/A | 6.4 | N/A | 10 | 6 MHz |
| Dewailly et al. 2014; France [22]. | Retrospective study | Control: 521 PCOS: 272 OA+HA (Full-blown): 95 OA+PCOM: 110 HA+PCOM: 67 |
Caucasians | 18 to 40 years | N/A | N/A | N/A | 12.0 | 5-7 MHz |
| Fulghesu et al. 2001, Italy [23]. | Retrospective data analysis. | Control: 30 Multi-Follicular Ovaries (MFO): 27 PCOS: 53 | Caucasians | 18-38 | N/A | 13.21 | N/A | N/A | 6.5 MHz |
| Jonard et al. 2005, France [24]. | Observational cohort study |
Control: 57 PCOS: 98 | Caucasians | Control: 29.0 (24.5– 35.0) PCOS: 27.2 (19.5– 33.0) | 4.75 (3.11–6.86) | 7 | 6.5 (4.5–10.5) | 12.0 | 7 MHz |
| Kar and Swoyam 2018, India [25]]. | PCOS: 86 Control: 45 | Caucasians | 18–45 years | 5.06±2.44 | 6.15 | 7.13±3.51 | 12.0 | 6-12 MHz | |
| Kim et al. 2017, United States / Iceland [26]. | Cross-sectional, case-control design | Control: 666 (Boston) and 32 (Iceland) PCOS: 544 (Boston) and 105 (Iceland) 18 to >44 years. |
Caucasians | ≤24 years | N/A | 12 | N/A | 13 | 4-8 MHz |
| 25–29 years | N/A | 10 | N/A | 14 | |||||
| 30–34 years | N/A | 9 | N/A | 10 | |||||
| 35–39 years | N/A | 8 | N/A | 10 | |||||
| 40–44 years | N/A | 10 | N/A | 9 | |||||
| Köşüş et al. 2011a, Turkey [5]. | Prospective study | Control: 65 PCOS: 251 | Caucasians | N/A | 6.43 | N/A | 8 | 6.5 MHz | |
| Le et al. 2021, Vietnam [27]. |
Cross-sectional study | Control: 273 PCOS: 119 | Asiane | 33.99±4.78 years | 6.08±3.67 | 6.0 | N/A | N/A | 7 MHz |
| Lie Fong et al. 2017, Netherlands / United States [28]. | Retrospective observational cohort study | Control: 297 - Young non-PCOM (Cluster 1): 118 Young PCOM (Cluster 2): 28 Old non-PCOM (Cluster 3): 100 Old PCOM (Cluster 4): 51 PCOS: 700 | Caucasians | Young women | N/A | N/A | 9 (5–24) | 12.25 |
6.5–8 mHz |
| Old women | N/A | N/A | 10.75 | ||||||
| Lujan et al. 2013, United States / Canada [29]. | A diagnostic test study was performed using cross-sectional data | Control: 70 PCOS: 98 | Caucasians | 18–44 years | N/A | 10 | N/A | 26 | 5-9 MHz 6-12 MHz |
| Wongwananuruk et al. 2018, Thailand [30]. | Cross-sectional study | Control: 63 PCOS: 55 | Asiane | 18e45 years of age | 4.66 ± 1.83 | 6.5 | 9.97 ± 3.86 | 15 | 8 MHz |
Disclaimer/Publisher’s Note: The statements, opinions and data contained in all publications are solely those of the individual author(s) and contributor(s) and not of MDPI and/or the editor(s). MDPI and/or the editor(s) disclaim responsibility for any injury to people or property resulting from any ideas, methods, instructions or products referred to in the content. |
© 2024 by the authors. Licensee MDPI, Basel, Switzerland. This article is an open access article distributed under the terms and conditions of the Creative Commons Attribution (CC BY) license (https://creativecommons.org/licenses/by/4.0/).
Copyright: This open access article is published under a Creative Commons CC BY 4.0 license, which permit the free download, distribution, and reuse, provided that the author and preprint are cited in any reuse.


