

Submitted:
09 February 2024
Posted:
12 February 2024
You are already at the latest version
Abstract
Assessing dietary inadequacies can contribute to understanding the nutritional vulnerabilities of a country. This study aimed to investigate nutrient intakes and micronutrient inadequacies in the Brazilian adult population, with an interest in different age subgroups. Cross-sectional study with 1812 individuals aged 19 to 65 years from a population-based study with a representative sample of Brazilian adults. Dietary intake was assessed by two 24-hour food recalls, and the probabilities of inadequate intake were estimated using the Dietary Reference Intake targets. Adequate macronutrient intake was over 99% for proteins, 84.7% for carbohydrates, and 80.7% for total fats. There was a high probability of inadequacy (above 90%) for vitamins D and E, but vitamin D inadequacy was very similar between sexes. In contrast, vitamin E was more likely to be inadequately consumed among women. A high probability of inadequacy (above 85%) of calcium and magnesium was found in the population, regardless of age group. Except for iron, the probability of inadequacy of other minerals increased with age. The results showed a relevant proportion of nutrient inadequacies, with those most at risk being women and older individuals, helping with better targeting and monitoring of public health policies that address nutritional problems in the population.
Keywords:
Dietary Intake
; Micronutrients
; Nutrition Surveys
; Public Health.
1. Introduction
Diet is an important aspect of human health, providing essential nutrients for growth, development, and lifelong health [1]. Suboptimal dietary patterns and inadequate nutrient intakes are associated with several non-communicable diseases (NCDs), such as high blood pressure, obesity, micronutrient deficiencies, and type 2 diabetes, contributing to morbidity and mortality worldwide [2]. In 2017, dietary risk factors accounted for 22% of total adult mortality, highlighting its relevant role as a modifiable risk behavior to promote health [3].
Diet-related health consequences result from a nutritional imbalance in the intake of macronutrients, vitamins, and minerals. High energy, sodium, saturated fat, and refined carbohydrates intakes are usually risk factors for many NCDs [4]. Additionally, deficiencies in calcium, iron, dietary fiber, vitamin D, and other micronutrients are a public health concern based on their demonstrated role in the maintenance of body function [5].
Studies evaluating nutrient deficiencies usually focus on children, adolescents, and pregnant or lactating women because these deficiencies are most common among these groups [6,7]. However, to promote health and prevent inadequacies, it is essential to meet the individuals’ nutrient requirements for all age groups [8]. Inadequate diet in adults can have negative consequences for individuals and society, contributing to the development of diseases, decreased quality of life, human development deficits, economic productivity loss, and increased health costs [8,9]. In addition, the burden of diseases tends to be higher in the elderly than in other age groups [10]. Therefore, from a public health point of view, preventing nutritional inadequacies in stages before the onset of the disease is a strategy that can contribute to overcoming this problem.
In Brazil, like in other low- and middle-income countries, obesity and diet-related chronic diseases co-exist with undernutrition, indicating the double burden of malnutrition [11,12]. There is a high prevalence of overweight and obesity but also critical micronutrient deficiencies affecting many individuals in the country. More than half of the population is overweight [2], while dietary surveys have shown a high prevalence of inadequate intake of calcium, sodium, magnesium, vitamins A, E, D, and pyridoxine [13].
Furthermore, access to robust dietary intake data is central to nutrition epidemiology and policy applications, but it has been a persistent limitation in nutrition research [14,15]. Major obstacles include the considerable efforts and expenses required in dietary data assessment, especially at a population level, which may lead to data scarcity. Thus, providing information to estimate the burden of disease risk and dietary inadequacies or excesses among sexes and age subgroups can contribute to understanding the nutritional vulnerabilities of a country and its population [16]. Noteworthily, investigations of the dietary intake and inadequacies at the population level provide an assessment of the country’s diet, which may contribute to public policies aimed at improving the nutritional status and preventing chronic diseases. Therefore, this study aimed to investigate energy and nutrient intakes and the prevalence of micronutrient inadequacies in the Brazilian adult population, particularly interested in differences in age and subgroups.
2. Materials and Methods
2.1. Study design and settings
This is a descriptive, cross-sectional study with data from the Brazilian Study of Nutrition and Health (EBANS), a population-based study with a representative sample of individuals aged 15 to 65 years [17] and residents of the urban area of the five macro-regions of Brazil. The EBANS provides data from the Brazilian population to the Latin American Nutrition and Health Study (ELANS) [18], a multicenter study aimed at assessing individuals’ nutritional status, physical activity, and food intake in eight Latin American countries. Data collection occurred between October 2014 and July 2015 in two home visits at least eight days apart.
2.2. Subjects and Sample Size
The cities included in the study were selected by systematic random sampling. The urban conglomerates were chosen systematically, and smaller cities were randomly selected based on population density. Within the conglomerates, the Primary Sampling Units (PSU), represented by municipalities, districts, and residential areas, and the Secondary Sampling Units (SSU), defined as the census sectors, were randomly selected. In each SSU, the households were selected systematically, and the interviewer went through each residential block in a clockwise direction, with a sampling interval of three homes. Within the households, the selection of individuals was controlled by quotas, respecting the selection criteria of half individuals with the closest birthday and the other half with the most distant birthday from the interview date. If selected, participants from the same house could be included in the study sample only if they were from different age strata (e.g., adolescents vs. adults). Because we did not include adolescents in this study, the sample only contained individuals from different households. The overall rationale, design, and study sampling were previously described by Fisberg et al. [17], and the final sample of the EBANS included 2000 participants. The present study focused only on the adult life stage, including data of individuals aged 19 to 65 years, both sexes, with a final sample size of 1812 respondents. Pregnant, lactating, and people with inborn errors of metabolism were not included. Figure 1 illustrates the sampling flowchart for the study (Figure 1).
2.3. Dietary intake assessment
Dietary food intake was assessed by two 24-hour food recalls (24HR) (one at each home visit), representing both weekdays and weekends. The 24HR were applied following the standardized procedures by the Multiple Pass Method (MPM) to minimize data collection errors and with the support of a photo album of portion sizes and utensils to improve the accuracy of the data [19]. Nutritional values were obtained using the Nutrition Data System for Research (NDSR software, 2014 version, NCC, University of Minnesota, Minneapolis), and the agreement was compared with the values of Brazilian food composition tables [20]. Nutritional values in the database were corrected if the concordance rate was not between 80 % and 120 % with corresponding foods in the Brazilian food composition tables. To do so, the researchers (nutritionists) developed statistical routines to replace the original value with the correct one. Mixed dishes and/or Brazilian preparations not in the NDSR software database were added as recipes, matching the nutrient composition for the Brazilian context. Total daily intake values below 800 kcal/day or above 4000 kcal/day suggested errors in collection or data entry, so the 24HRs were revised and the nutritionists made the necessary corrections [21]. The Multiple Source Method (MSM) statistical modeling software [22] was used to estimate the usual intake of nutrients at both population and individual levels.
Macronutrient adequacy was compared to the Acceptable Macronutrient Distribution Range (AMDR), which includes the lower and upper limits of the recommendation for each macronutrient. The AMDR ranges, applicable for both sexes, are between 45-65% of total energy intake from carbohydrates, 20-35% of total energy intake of total fat, and 10-35% of total energy intake of protein [23]. Total fiber and saturated fats intake were evaluated considering the cutoffs proposed by the World Health Organization (WHO) [24,25], which recommends a minimum amount of 25 grams per day of total fiber for both men and women and less than 10% of the individual’s total energy intake from saturated fats. For added sugar, we used the Dietary Guidelines for Americans 2020-2025 [26] because WHO guidelines consider recommendations for free sugar, but not added sugar [27]. It recommends an intake below 10% of total energy intake from added sugar. To estimate the probability of inadequate intake of vitamins and minerals, we used the Dietary Reference Intake (DRI) intake targets proposed by the Institute of Medicine (IOM) [23]. The distribution of the usual nutrient intake was compared to the estimated average requirement (EAR), which considers the specific needs of each sex and age group, to obtain the probability of inadequacy for each age range. The EAR represents the average value of the estimated daily intake to meet the needs of half (50%) of the individuals in the population. It is noteworthy that there is no established EAR value for choline. Therefore, we used adequate intake (AI) to evaluate its ingestion. If the individual’s intake is higher than AI, it is most likely that the intake is adequate. We calculated the proportion of individuals with an intake greater than the AI values in the population to determine the probability of adequacy for this nutrient [28].
The participants also reported the use of any type of nutritional supplement, providing the name of the product (when possible) or its main components (e.g., omega 3, vitamin D, iron, etc.).
2.4. Sociodemographic and anthropometric measurements
A trained team obtained anthropometric measurements in duplicate during the first home visit following standardized protocols. Body weight and height were measured using a Sanny® portable scale with a precision of 0.1 kg and a portable Sanny® stadiometer with a precision of 0.1 cm, respectively. The nutritional status was classified based on the body mass index (BMI), according to the cutoff points established by the WHO for individuals above 19 years [29]. Excess weight included those in the overweight or obesity category (people with BMI ≥25 kg/m2). The participants self-reported sociodemographic data: age, sex, and educational and socioeconomic levels. The interviewer filled in region information. Socioeconomic status was classified into three levels, according to the Brazilian Economic Classification Criteria: high (classes A1, A2, B1), medium (classes B2, C1), and low (classes C2, D, and E) [30].
We applied the long version of the International Physical Activity Questionnaire (IPAQ) [31] on the second home visit to determine the individual’s physical activity level, using the last seven days as a reference. The long-form IPAQ has been validated internationally to assess total physical activity in individuals from 12 countries with Spearman’s correlation coefficients ranging from 0.46 to 0.96 [32]. Participants were categorized as active (≥150 minutes/week) or insufficiently active (<150 minutes/week) moderate-to-vigorous physical activity guidelines as defined by the WHO [33]. Details on IPAQ data have been published elsewhere [34,35].
2.5. Statistical analysis
Participants’ characteristics were summarized for the general population and stratified by sex and age strata, presented as absolute and relative frequencies. The age range categories were chosen based on the different life stages of the DRI recommendations [23]. Thus, for comparison among age groups, this study considered younger adults as individuals between 19 and 30 years old; middle-aged adults, between 31 and 50; and older adults, aged 51 to 65. The chi-square test was used to investigate the association between the categorical variables of interest among the different age groups and between sexes. We applied the Kruskal Wallis test with Dunn post hoc pairwise multiple comparisons to investigate differences in the distribution of continuous variables. Nutrient intakes and distribution were described by means, medians, standard deviation (SD), and interquartile ranges (IQR). The prevalence of adequate intake for each nutrient of interest (e.g., macronutrients, fiber, added sugar, and saturated fats) was calculated considering the proportion of individuals within, below, or above recommendations. The probability of inadequacy in micronutrient intakes was calculated by the z-score (using the Z-standard curve) of the mean intake of the population and the EAR of each nutrient, using the equation [36]: Z=(EAR-mean)/SD. All statistical analyses were performed in SPPS software (version 16 for Windows, SPSS Inc., Chicago, IL, USA) with a significance level of 5% (p-value<0.05).
3. Results
The study included 1812 adults aged 19-65 (54.3% female). Participants’ characteristics are shown in Table 1. Most of the population was in the middle or low-income strata and had at least secondary education (high school). There was also a high frequency of people who studied only up to middle school (complete or incomplete), especially among older adults (aged between 51 and 65 years old). In the three age groups, the proportion of women with a low socioeconomic level was higher than men. However, the association among age groups and socioeconomic status was only significant in women (p=0.033), but not in men (p=0.099). Only 8.3% of the general population had a high socioeconomic level, compared to 45.1% and 46.6% in the medium and low levels, respectively (considering all age groups).
The results suggested an association between excess weight (BMI ≥ 25 kg/m²) and the different age groups in the general population and between sexes (p<0.001). The population had a high prevalence of excess weight, which was even higher with aging. In younger adults (19-30 years), excess weight affected 48% of the population, while in older adults (51-65 years), this prevalence reached 74.5%. This relation between excess weight with age occurred in both sexes, but the excess weight was higher among men than women only for older adults (75.5% vs. 73.9%).
Considering IPAQ, only 41.3% of the population (considering all age groups together) reported sufficient physical activity, and the proportion of active men was higher than women (46.7% vs. 36.8%). In both sexes, the age group of older adults (51 to 65 years) had the highest percentages of insufficiently active individuals. Still, the association between physical activity and age groups was only significant in women (p=0.010). Only 93 respondents reported using some nutritional supplement, representing just over 5% of the population, with women representing almost twice as many men among those who reported it. However, no association was found between the use of supplements with different age groups.
Table 2 presents the energy and macronutrient intake distributions across age groups. As expected, men reported a higher energy intake than women in all age groups, but in both sexes, the energy report was lower as the individuals got older (p<0.001). Compared to the AMDR, the mean contribution to the total energy intake (%EI) of all three macronutrients (carbohydrates, proteins, and total fats) was within the recommended range for all age groups. In the present study, a higher proportion of participants met the recommendations for proteins, with over 99% consuming it within the AMDR. For carbohydrates and total fats, the percentage was 84.7% and 80.7%, respectively. However, there is a pattern of more people consuming carbohydrates below AMDR (13.6%) than above (1.7%), which is inverse for total fats, with more people consuming them above than below the AMDR (17.6% vs. 1.7%) (S1 Table).
Women presented a higher carbohydrate intake than men in all age groups (p<0.001), and a higher total fat (p=0.006) and saturated fat (p=0.003) intake for those in the middle-aged group (31-50 years old). Across age stages, the absolute value of protein consumption decreased with age, with data showing a daily mean intake of 84.3 g, 78.9 g, and 69.9 g respectively for young (19-30 years old), middle-aged (31-50 years old) and older adults (51-65 years old). However, older individuals tended to present a higher contribution to %EI from protein than younger and middle-aged adults (p<0.001). Eicosapentaenoic fatty acid (EPA) intake was also higher in older adults compared to younger adults (p<0.001), but DHA intake did not differ among age groups.
Table 3 shows the prevalence of inadequacy in total fiber, added sugar, and saturated fat intake. More than 80% of Brazilian adults had a fiber intake below the recommendation, regardless of age group. This scenario was even worse in women, with the prevalence of inadequacy exceeding 90%. While for women, the prevalence of inadequacy was higher in younger adults, decreasing in the older age group, this relationship was inverse for men, with an increase in inadequacy over age groups. However, these differences were not significant.
There was also a high prevalence of individuals consuming added sugar above the recommended value, and overconsumption was even greater in women compared to men. In both sexes, people aged 19 to 30 years had the highest frequencies of excessive intake of added sugar, while the lowest values were observed among adults aged 51 to 65 (p<0.001). On the other hand, saturated fat intake above the recommendations decreased with age for men (p=0.014), but there were no significant differences among age groups for women (p=0.940). In terms of proportion, women presented a higher prevalence of excess saturated fat intake than men in middle-aged and older adult age groups.
Table 4 and Table 5 present the distribution and the probabilities of inadequate intake of vitamins and minerals in the population. The results showed a high probability of inadequacy (above 90%) for vitamins D and E. Vitamin D inadequacy was very similar between the sexes, but vitamin E was more likely to be inadequately consumed among women. Vitamin A also exceeds 53% of inadequacy among men (in all age groups) and 46% among women. Furthermore, the probability of adequacy of choline in the population was very low, reaching 10% only among men in the age group of 19 to 30 years. For the remaining age groups, choline adequacy is around 6%, with the worst-case scenario among older adults.
Thiamine (vitamin B1) showed the best results, with the lowest probabilities of inadequacy in the population. However, some important differences between age groups were noted, such as the significant increase in the inadequacy of thiamine and pyridoxine, especially in men, between young and older adults. While in the first age group, the inadequacy of thiamine did not reach 6%, in older adults, this value was close to 20%. In women, pyridoxine goes from an inadequacy of 22.1% (among young adults) to 48.4% in older adults.
Regarding the minerals, a high probability of inadequacy of calcium and magnesium was found in the population. Except for iron, the probability of inadequacy of the other minerals increased with age. In addition, iron inadequacy in women was higher than in men in all age groups.
4. Discussion
This study evaluated energy and nutrient intakes in the Brazilian adult population, investigating differences between sexes and age subgroups. We have also estimated the probability of inadequate intake of vitamins and minerals in the population. In summary, results showed many nutrient inadequacies relevant to public health, with a worse scenario among women and older people. There was a high consumption of saturated fat and added sugar and a low adequacy in fiber intake. Besides, many vitamins and minerals were consumed below the recommendations, resulting in a high probability of inadequacy in the population.
In previous studies, men consumed slightly more calories from protein than women, while women reported more energy from carbohydrates [37]. However, Araujo et al. [38] found a mean energy contribution lower from total fats (about 27%) and higher from carbohydrates (about 55%) than in our research. Our results also showed a decrease in energy intake and calories from total and saturated fats with the advance of age. A possible explanation for this reduction in fat intake with age may be associated with the occurrence and diagnosis of chronic non-communicable diseases, especially cardiovascular diseases, which are more frequent in older people [10]. Usually, with the diagnosis, there are recommendations for changes in lifestyle or the restriction of some food groups, especially fats. This can lead to modifications in the dietary pattern of these individuals, with a reduction in fats, which may also impact energy intake. It may also be related to the decrease in added sugar consumption across age groups because of the diagnosis of type 2 diabetes, which recommends reducing or substituting sugar intake with sweeteners [39]. One factor that might also contribute to these differences in energy intake across ages and between sex is misreporting of energy intake. Older people and women tend to underreport their energy intake more than others [40].
Although the mean percentages of macronutrient contribution to total energy intake were within the AMDR, it is important to mention some limitations since AMDR considers the distribution of macronutrients within the total caloric intake. Therefore, the distribution may be within the adequate range even when energy intake is inadequate (both above and below). In addition, the AMDR for proteins is quite broad, considering values between 10-35% of energy intake as adequate [23]. However, the health effects of a diet with 10% of proteins compared to one with 35% may differ, but still, both would be considered adequate protein intake by AMDR.
Most of the population was in the lower categories of education and socioeconomic level, which are relevant in studies that assess nutritional inadequacies and health [41]. These measures are directly associated with the individual’s purchasing power and household food availability, contributing to nutrient intake and adequacy. Especially in lower-income countries, studies show a positive association between the level of education and healthy food choices [42,43].
Most of the population does not meet the requirements for fiber, with worse results for women. Fruits and vegetables, which are important sources of fiber, contribute to a low percentage of the total fiber intake in the population (S2 Table), which might justify its low intake. Like in other studies in the Brazilian population, the top three foods that contribute to fiber intake are beans, rice, and bread. [44]
EPA and DHA intake varies a lot among studies, and there needs to be a consensus on the recommended dosage for the general population or healthy individuals. However, in our sample, the intake of these two fatty acids was below previous studies. Lu et al. [45] investigated omega-3 fatty acids in the body composition of women with polycystic ovary syndrome founding a mean intake of EPA and DHA of 19.8mg/day and 18.1mg/day, respectively. On the other hand, Carballo-Casla et al. [46] investigating fish consumption by Spanish people over 60 years of age found a much higher mean intake for both fatty acids (EPA - 260mg and DHA - 500mg). Previous studies suggest that doses of 2 to 4 g of EPA/DHA daily can lower triglyceride levels by 25 to 30% [47]. Thus, the Brazilian Cardiology Society suggests that this dose (2-4 g per day) or even higher doses may be recommended only for severe hypertriglyceridemia. However, the actual EPA and DHA intake in the population represents less than 10% of these values. These differences, especially compared to the Spanish context, may be partially attributed to the population’s dietary habits and patterns. Mediterranean countries usually present higher eating frequencies of healthy fats, fish, and omega-3 food sources than Western countries [48]. In Brazil, on the other hand, the dietary intake of polyunsaturated fatty acids is below the recommendations [49]. Major food groups that contribute to its intake, such as fish, the primary food source of EPA and DHA, represent less than 1% of the total energy intake [50]. Evidence that evaluates EPA and DHA intakes is still scarce in Brazil.
We observed a high probability of inadequate intake of vitamins E, D, calcium, and magnesium with most inadequacies increasing with age. Also, choline adequacy was low in both sexes and even worse in older adults. The most significant difference between the sexes was observed in their iron intake, the micronutrient with the lowest probability of inadequacy in the population. The results are in accordance with previous studies in Brazil and may be related to dietary aspects and public policies in the country. Araujo et. al. [38] and Verly Junior et al. [13] also found an inadequate prevalence of over 90% for vitamin D, E, and calcium evaluating micronutrient intakes in Brazilian adults. The authors also found less than 5% of inadequacy in iron intake in men.
Important calcium food sources, such as milk, yogurt, cheese, fish, and seafood are scarcely consumed by the population [50]. Additionally, the high inadequacy of vitamin D may be explained by the established recommended reference values, considering mainly the US population, assuming little or no sun exposure [51]. This scenario may not be applicable in countries with a predominantly tropical climate, like Brazil, where most of the vitamin D requirement can be met by synthesis from sun exposure. A previous study with a representative sample of São Paulo, the city with the largest population in Brazil, found an inadequate vitamin D intake in nearly 100% of the population. However, serum levels were adequate in almost half of the population [52]. Thus, the EAR for vitamin D in Brazil may be overestimated.
Whole grains are more commonly consumed by women, which may explain the differences between the sexes in inadequacies of B vitamins [53]. In a recent investigation that simulated the effect of replacing refined cereals with whole grains, one of the adverse effects would be the reduction of niacin, riboflavin, pyridoxine, and folate, which could be associated with grain processing [54]. It may also be related to the differences in iron inadequacy between the sexes, notably higher in women (in all age groups) than in men. Due to the specific needs associated with the menstrual period, the EAR for iron for adult women is higher than for men, which may increase the magnitude of this difference in the inadequacy of this mineral. After mandatory wheat and corn flour enrichment with iron and folic acid, bread, pasta, and biscuits are the main food sources contributing to these two micronutrients. These are foods commonly restricted in women’s diets due to the perception of their association with weight gain [55].
Nevertheless, this study is not without limitations. Dietary data collection is subject to bias and errors. Although this study assessed food intake using two 24HR and adjusted it to estimate the usual intake, especially evaluating micronutrients, this number of collections may not be sufficient to reflect its actual intake. Besides, only the nutrient intake from food sources was considered in the analysis. However, a robust data collection and analysis methodology was applied to minimize these errors, and the reported supplement use was very low in the population. Furthermore, we had to adopt international cut-off values because the Dietary Guidelines for the Brazilian Population [56] only present qualitative but not quantitative recommendations for evaluating nutrient adequacies. However, even though the cut-offs were not developed specifically for the Brazilian population, these recommendations are based on robust scientific reviews of the current body of evidence commonly related to health and disease risk. Additionally, this study only collected data in the urban areas of the country. However, in 2015 only 14% of the Brazilian population lived in rural areas, according to the World Bank [57]. Thus, a strength of the study is the dietary assessment at the populational level, with a representative sample of Brazilian adults living in urban areas, which can provide information about the nutritional diagnosis for most of the country.
5. Conclusions
The present study comprehensively provides information on macro and micronutrient inadequacies and excessive intakes in Brazilian adults. Substantial inadequate nutrient intakes were verified among the population, with those most at risk being women and older individuals. The results showed a relevant scenario of nutrient inadequacies with public health concerns, such as fiber, added sugar, vitamin D and E, choline, calcium, and magnesium, which should be addressed through governmental policies and programs, and interventions in the clinical practice of health care professionals. Promoting the consumption of adequate and micronutrient-rich foods, strengthening food fortification, and nutritional supplementation, particularly for groups at risk, are valuable strategies that might help to alleviate these inadequacies, which can improve the population’s nutritional status and, ultimately, the individuals’ quality of life. These findings may contribute to identifying subgroups in the population that are vulnerable to inadequate nutrient intake, to target better and monitor public health policies, and to assist in reducing nutritional problems in the population.
Supplementary Materials
The following supporting information can be downloaded at the website of this paper posted on Preprints.org. Table S1: Macronutrient intake in adults in the urban areas of Brazil, 2015.; Table S2: Top 10 food sources contributing to nutrient total intake in adults in the urban areas of Brazil, 2015.
Author Contributions
Conceptualization, M.F and R.M.F; methodology, M.F and R.M.F.; validation, G.F., L.D.B., and A.N.P.; formal analysis, A.N.P.; resources, M.F., G.F, and R.M.F.; writing—original draft preparation, L.D.B.; writing—review and editing, L.D.B.; project administration, M.F.; funding acquisition, M.F. All authors have read and agreed to the published version of the manuscript.
Funding
The ELANS study was partially supported by a scientific grant from the Coca-Cola Company and by different grants and support from the Instituto Pensi/Hospital Infantil Sabara, International Life Science Institute of Argentina, Universidad de Costa Rica, Pontificia Universidad Católica de Chile, Pontificia Universidad Javeriana, Universidad Central de Venezuela (CENDESUCV)/Fundación Bengoa, Universidad San Francisco de Quito, and Instituto de Investigación Nutricional de Peru. We appreciate the support of Reckitt Brasil for granting the possibility of publishing this paper.
Institutional Review Board Statement
“The study was conducted in accordance with the Declaration of Helsinki and approved by the Research Ethics Committee of Hospital Infantil Sabará - Jose Luiz Egydio Setúbal Foundation (protocol code 31670314.8.0000.5567 on June 17, 2014). The Western Institutional Review Board, Inc. also approved the ELANS protocol on June 22, 2015 (Study number: 1145835)”.
Informed Consent Statement
Written informed consent was obtained from all subjects involved in the study.
Data Availability Statement
Data is available upon reasonable request. It is not publicly available due to confidentiality/ethical restrictions. Data can be available through the EBANS institutional board for researchers who meet the criteria for access to confidential data. For data requests, please contact: Instituto PENSI (PENSI Institute) Ave. Angelica 2071, 2nd floor. Sao Paulo, Brazil. 01221-200. Phone: +55 11 2526-2525. Email: pesqeasy@pensi.org.br.
Acknowledgments
We want to highlight the support of Prof. Irina Kovalskys, co-chair of the ELANS project, for her support in all protocol phases. We want to thank Reckitt Brazil, through Medical Affairs Nutrition, for their support in the publication of this paper. To the whole group of the ELANS project our deepest gratitude.
Conflicts of Interest
The authors declare no conflicts of interest. The funders had no role in the design of the study; in the collection, analyses, or interpretation of data; in the writing of the manuscript; or in the decision to publish the results.
References
- WHO. World Health Organization. Bulletin of the World Health Organization. v 90, n 2. 2012.
- Felisbino-Mendes, M.S.; Cousin, E.; Malta, D.C.; et al. The burden of non-communicable diseases attributable to high BMI in Brazil, 1990–2017: findings from the Global Burden of Disease Study. Popul Health Metr. 2020 Sep 30;18(S1):18. [CrossRef]
- Afshin, A.; Sur, P.J.; Fay, K.A.; et al. Health effects of dietary risks in 195 countries, 1990–2017: a systematic analysis for the Global Burden of Disease Study 2017. The Lancet. 2019 May;393(10184):1958–72. [CrossRef]
- Oikonomou, E.; Psaltopoulou, T.; Georgiopoulos, G.; et al. Western Dietary Pattern Is Associated With Severe Coronary Artery Disease. Angiology. 2018 Apr 21;69(4):339–46. [CrossRef]
- Mujica-Coopman, M.F.; Brito, A.; López de Romaña, D.; et al. Prevalence of Anemia in Latin America and the Caribbean. Food Nutr Bull. 2015 Jun 1;36(2_suppl):S119–28. [CrossRef]
- Black, R.E.; Allen, L.H.; Bhutta, Z.A.; et al. Maternal and child undernutrition: global and regional exposures and health consequences. The Lancet. 2008 Jan;371(9608):243–60. [CrossRef]
- Bailey, R.L.; Pac, S.G.; Fulgoni, V.L.; et al. Estimation of Total Usual Dietary Intakes of Pregnant Women in the United States. JAMA Netw Open. 2019 Jun 21;2(6):e195967. [CrossRef]
- Bai, Y.; Herforth, A.; Masters, W.A. Global variation in the cost of a nutrient-adequate diet by population group: an observational study. Lancet Planet Health. 2022 Jan;6(1):e19–28. [CrossRef]
- Perez-Escamilla, R.; Bermudez, O.; Buccini, G.S.; et al. Nutrition disparities and the global burden of malnutrition. BMJ. 2018 Jun 13;k2252. [CrossRef]
- Jura, M.; Kozak, L.P. Obesity and related consequences to ageing. Age (Omaha). 2016 Feb 4;38(1):23. [CrossRef]
- Wegmüller, R.; Bentil, H.; Wirth, J.P.; et al. Anemia, micronutrient deficiencies, malaria, hemoglobinopathies and malnutrition in young children and non-pregnant women in Ghana: Findings from a national survey. PLoS One. 2020 Jan 30;15(1):e0228258. [CrossRef]
- Jones, A.D.; Acharya, Y.; Galway, L.P. Urbanicity Gradients Are Associated with the Household- and Individual-Level Double Burden of Malnutrition in Sub-Saharan Africa. J Nutr. 2016 Jun 1;146(6):1257–67. [CrossRef]
- Verly-Junior, E.; Marchioni, D.M.; Araujo, M.C.; et al. Evolução da ingestão de energia e nutrientes no Brasil entre 2008–2009 e 2017–2018. Rev Saude Publica. 2021 Dec 8;55(Supl.1):1–22. [CrossRef]
- Micha, R.; Coates, J.; Leclercq, C.; et al. Global Dietary Surveillance: Data Gaps and Challenges. Food Nutr Bull. 2018 Jun 25;39(2):175–205. [CrossRef]
- Miller, V.; Singh, G.M.; Onopa, J.; et al. Global Dietary Database 2017: data availability and gaps on 54 major foods, beverages, and nutrients among 5.6 million children and adults from 1220 surveys worldwide. BMJ Glob Health. 2021 Feb 5;6(2):e003585. [CrossRef]
- Passarelli, S.; Free, C.M.; Allen, L.H.; et al. Estimating national and subnational nutrient intake distributions of global diets. Am J Clin Nutr. 2022 Aug 4;116(2):551–60. [CrossRef]
- Fisberg, M.; Kovalskys, I.; Previdelli, A.N.; et al. Brazilian Study of Nutrition and Health (EBANS) - Brazilian data of ELANS: methodological opportunities and challenges. Rev Assoc Med Bras. 2019 May;65(5):669–77. [CrossRef]
- Fisberg, M.; Kovalskys, I.; Gómez, G.; et al. Latin American Study of Nutrition and Health (ELANS): rationale and study design. BMC Public Health. 2015 Dec 30;16(1):93. [CrossRef]
- Moshfegh, A.J.; Rhodes, D.G.; Baer, D.J.; et al. The US Department of Agriculture Automated Multiple-Pass Method reduces bias in the collection of energy intakes. Am J Clin Nutr. 2008 Aug 1;88(2):324–32. [CrossRef]
- Universidade de São Paulo (USP). Food Research Center (FoRC). Versão 6.0. 2017. Tabela Brasileira de Composição de Alimentos (TBCA).
- Kovalskys, I.; Fisberg, M.; Gómez, G.; et al. Standardization of the Food Composition Database Used in the Latin American Nutrition and Health Study (ELANS). Nutrients. 2015 Sep 16;7(9):7914–24. [CrossRef]
- Harttig, U.; Haubrock, J.; Knüppel, S.; et al. The MSM program: web-based statistics package for estimating usual dietary intake using the Multiple Source Method. Eur J Clin Nutr. 2011 Jul 6;65(S1):S87–91. [CrossRef]
- IOM/ Food and Nutrition Board. Dietary Reference Intakes for Energy, Carbohydrate, Fiber, Fat Fatty Acids, Cholesterol, Protein, and Amino Acids (Macronutrients). 2005.
- World Health Organization. Saturated fatty acid and trans-fatty acid intake for adults and children WHO guideline. Geneva; 2023.
- World Health Organization. Carbohydrate intake for adults and children WHO guideline. Geneva; 2023.
- U.S. Department of Agriculture and U.S. Department of Health and Human Services. Dietary Guidelines for Americans, 2020-2025. 9th edition. 2020.
- WHO. World Health Organization. Guideline: Sugars intake for adults and children. Geneva; 2015.
- Marchioni, D.M.L.; Slater, B.; Fisberg, R.M. Aplicação das Dietary Reference Intakes na avaliação da ingestão de nutrientes para indivíduos. Revista de Nutrição. 2004 Jun;17(2):207–16. [CrossRef]
- WHO – World Health Organization. WHO Consultation on Obesity: preventing and managing the global epidemic. Geneva; 1998.
- Associação Brasileira de Empresas de Pesquisa (ABEP). Critério padrão de classificação econômica Brasil. 2013.
- Matsudo, S.; Araújo, T.; Matsudo, V.; et al. Questionário Internacional de Atividade Física (IPAQ): Estudo de validade e reprodutibilidade no Brasil. Rev Bras Ativ Fís Saúde. 2012 Oct;6(2):5–18. [CrossRef]
- Craig, C.L.; Marshall, A.L.; Sjöström, M.; et al. International Physical Activity Questionnaire: 12-Country Reliability and Validity. Med Sci Sports Exerc. 2003 Aug;35(8):1381–95. [CrossRef]
- Bull, F.C.; Al-Ansari, S.S.; Biddle, S.; et al. World Health Organization 2020 guidelines on physical activity and sedentary behaviour. Br J Sports Med. 2020 Dec;54(24):1451–62. [CrossRef]
- Ferrari, G.L.M.; Kovalskys, I.; Fisberg, M.; et al. Socio-demographic patterning of objectively measured physical activity and sedentary behaviours in eight Latin American countries: Findings from the ELANS study. Eur J Sport Sci. 2020 May 27;20(5):670–81. [CrossRef]
- Ferrari, G.L.M.; Kovalskys, I.; Fisberg, M.; et al. Methodological design for the assessment of physical activity and sedentary time in eight Latin American countries - The ELANS study. MethodsX. 2020;7:100843. [CrossRef]
- Slater, B.; Marchioni, D.L.; Fisberg, R.M. Estimando a prevalência da ingestão inadequada de nutrientes. Rev Saúde Pública. 2004;38(4). [CrossRef]
- Mendes, A.; Gavioli, L.; Previdelli, A.N.; et al. The diet quality index evaluates the adequacy of energy provided by dietary macronutrients. Revista de Nutrição. 2015 Aug;28(4):341–8. [CrossRef]
- Araujo, M.C.; Bezerra, I.N.; Barbosa, F.S.; et al. Consumo de macronutrientes e ingestão inadequada de micronutrientes em adultos. Rev Saude Publica. 2013 Feb;47(suppl 1):177s–89s. [CrossRef]
- Ley, S.H.; Hamdy, O.; Mohan, V.; et al. Prevention and management of type 2 diabetes: dietary components and nutritional strategies. The Lancet. 2014 Jun;383(9933):1999–2007. [CrossRef]
- Lutomski, J.E.; Van den Broeck, J.; Harrington, J.; et al. Sociodemographic, lifestyle, mental health and dietary factors associated with direction of misreporting of energy intake. Public Health Nutr. 2011 Mar 16;14(03):532–41. [CrossRef]
- Rippin, H.L.; Hutchinson, J.; Greenwood, D.C.; et al. Inequalities in education and national income are associated with poorer diet: Pooled analysis of individual participant data across 12 European countries. PLoS One. 2020 May 7;15(5):e0232447. [CrossRef]
- Gómez, G.; Kovalskys, I.; Leme, A.C.B.; et al. Socioeconomic Status Impact on Diet Quality and Body Mass Index in Eight Latin American Countries: ELANS Study Results. Nutrients. 2021 Jul 14;13(7):2404. [CrossRef]
- Shlisky, J.; Bloom, D.E.; Beaudreault, A.R.; et al. Nutritional Considerations for Healthy Aging and Reduction in Age-Related Chronic Disease. Advances in Nutrition. 2017 Jan 20;8(1):17.2-26. [CrossRef]
- Santos, P.V.F.; Sales, C.H.; Vieira, D.A.S.; et al. Family income per capita, age, and smoking status are predictors of low fiber intake in residents of São Paulo, Brazil. Nutrition Research. 2016 May;36(5):478–87. [CrossRef]
- Lu, L.; Li, X.; Lv, L.; et al. Associations between omega-3 fatty acids and insulin resistance and body composition in women with polycystic ovary syndrome. Front Nutr. 2022 Oct 5;9. [CrossRef]
- Carballo-Casla, A.; García-Esquinas, E.; Banegas, J.R.; et al. Fish consumption, omega-3 fatty acid intake, and risk of pain: the Seniors-ENRICA-1 cohort. Clinical Nutrition. 2022 Nov;41(11):2587–95. [CrossRef]
- Bhatt, D.L.; Steg, P.G.; Miller, M.; et al. Cardiovascular Risk Reduction with Icosapent Ethyl for Hypertriglyceridemia. New England Journal of Medicine. 2019 Jan 3;380(1):11–22. [CrossRef]
- Castelló, A.; Rodríguez-Barranco, M.; Fernández de Larrea, N.; et al. Adherence to the Western, Prudent and Mediterranean Dietary Patterns and Colorectal Cancer Risk: Findings from the Spanish Cohort of the European Prospective Investigation into Cancer and Nutrition (EPIC-Spain). Nutrients. 2022 Jul 27;14(15):3085. [CrossRef]
- Sisa, I.; Abeyá-Gilardon, E.; Fisberg, R.M.; et al. Impact of diet on CVD and diabetes mortality in Latin America and the Caribbean: a comparative risk assessment analysis. Public Health Nutr. 2021 Jun 3;24(9):2577–91. [CrossRef]
- IBGE. Instituto Brasileiro de Geografia e Estatística. Pesquisa de orçamentos familiares 2017-2018: avaliação nutricional da disponibilidade domiciliar de alimentos no Brasil. Rio de Janeiro; 2020.
- Institute of Medicine (US) Committee to Review Dietary Reference Intakes for Vitamin D and Calcium; Ross AC TCYA et al. Dietary Reference Intakes for Calcium and Vitamin D. Washington; 2011.
- Martini, L.A.; Verly, E.; Marchioni, D.M.L.; et al. Prevalence and correlates of calcium and vitamin D status adequacy in adolescents, adults, and elderly from the Health Survey—São Paulo. Nutrition. 2013 Jun;29(6):845–50. [CrossRef]
- Fontanelli, M.M.; Sales, C.H.; Castro, M.A.; et al. Healthful grain foods consumption by São Paulo residents: a 12-year analysis and future trends. Public Health Nutr. 2021 Jul 1;24(10):2987–97. [CrossRef]
- Fontanelli, M.M.; Martinez-Arroyo, A.; Sales, C.H.; et al. Opportunities for diet quality improvement: the potential role of staple grain foods. Public Health Nutr. 2021 Dec 12;24(18):6145–56. [CrossRef]
- Steluti, J.; Selhub, J.; Paul, L.; et al. An overview of folate status in a population-based study from São Paulo, Brazil and the potential impact of 10 years of national folic acid fortification policy. Eur J Clin Nutr. 2017 Oct 10;71(10):1173–8. [CrossRef]
- Brazil. Ministry of Health of Brazil. Secretariat of Health Care. Primary Health Care Department. Dietary Guidelines for the Brazilian population. Brasília; 2015.
- The World Bank. https://data.worldbank.org/indicator/SP.RUR.TOTL.ZS?locations=BR. 2018. Rural population (% of total population) - Brazil.
Figure 1.
Study Flowchart. Adapted from Fisberg et al., 2019. [17].
Figure 1.
Study Flowchart. Adapted from Fisberg et al., 2019. [17].
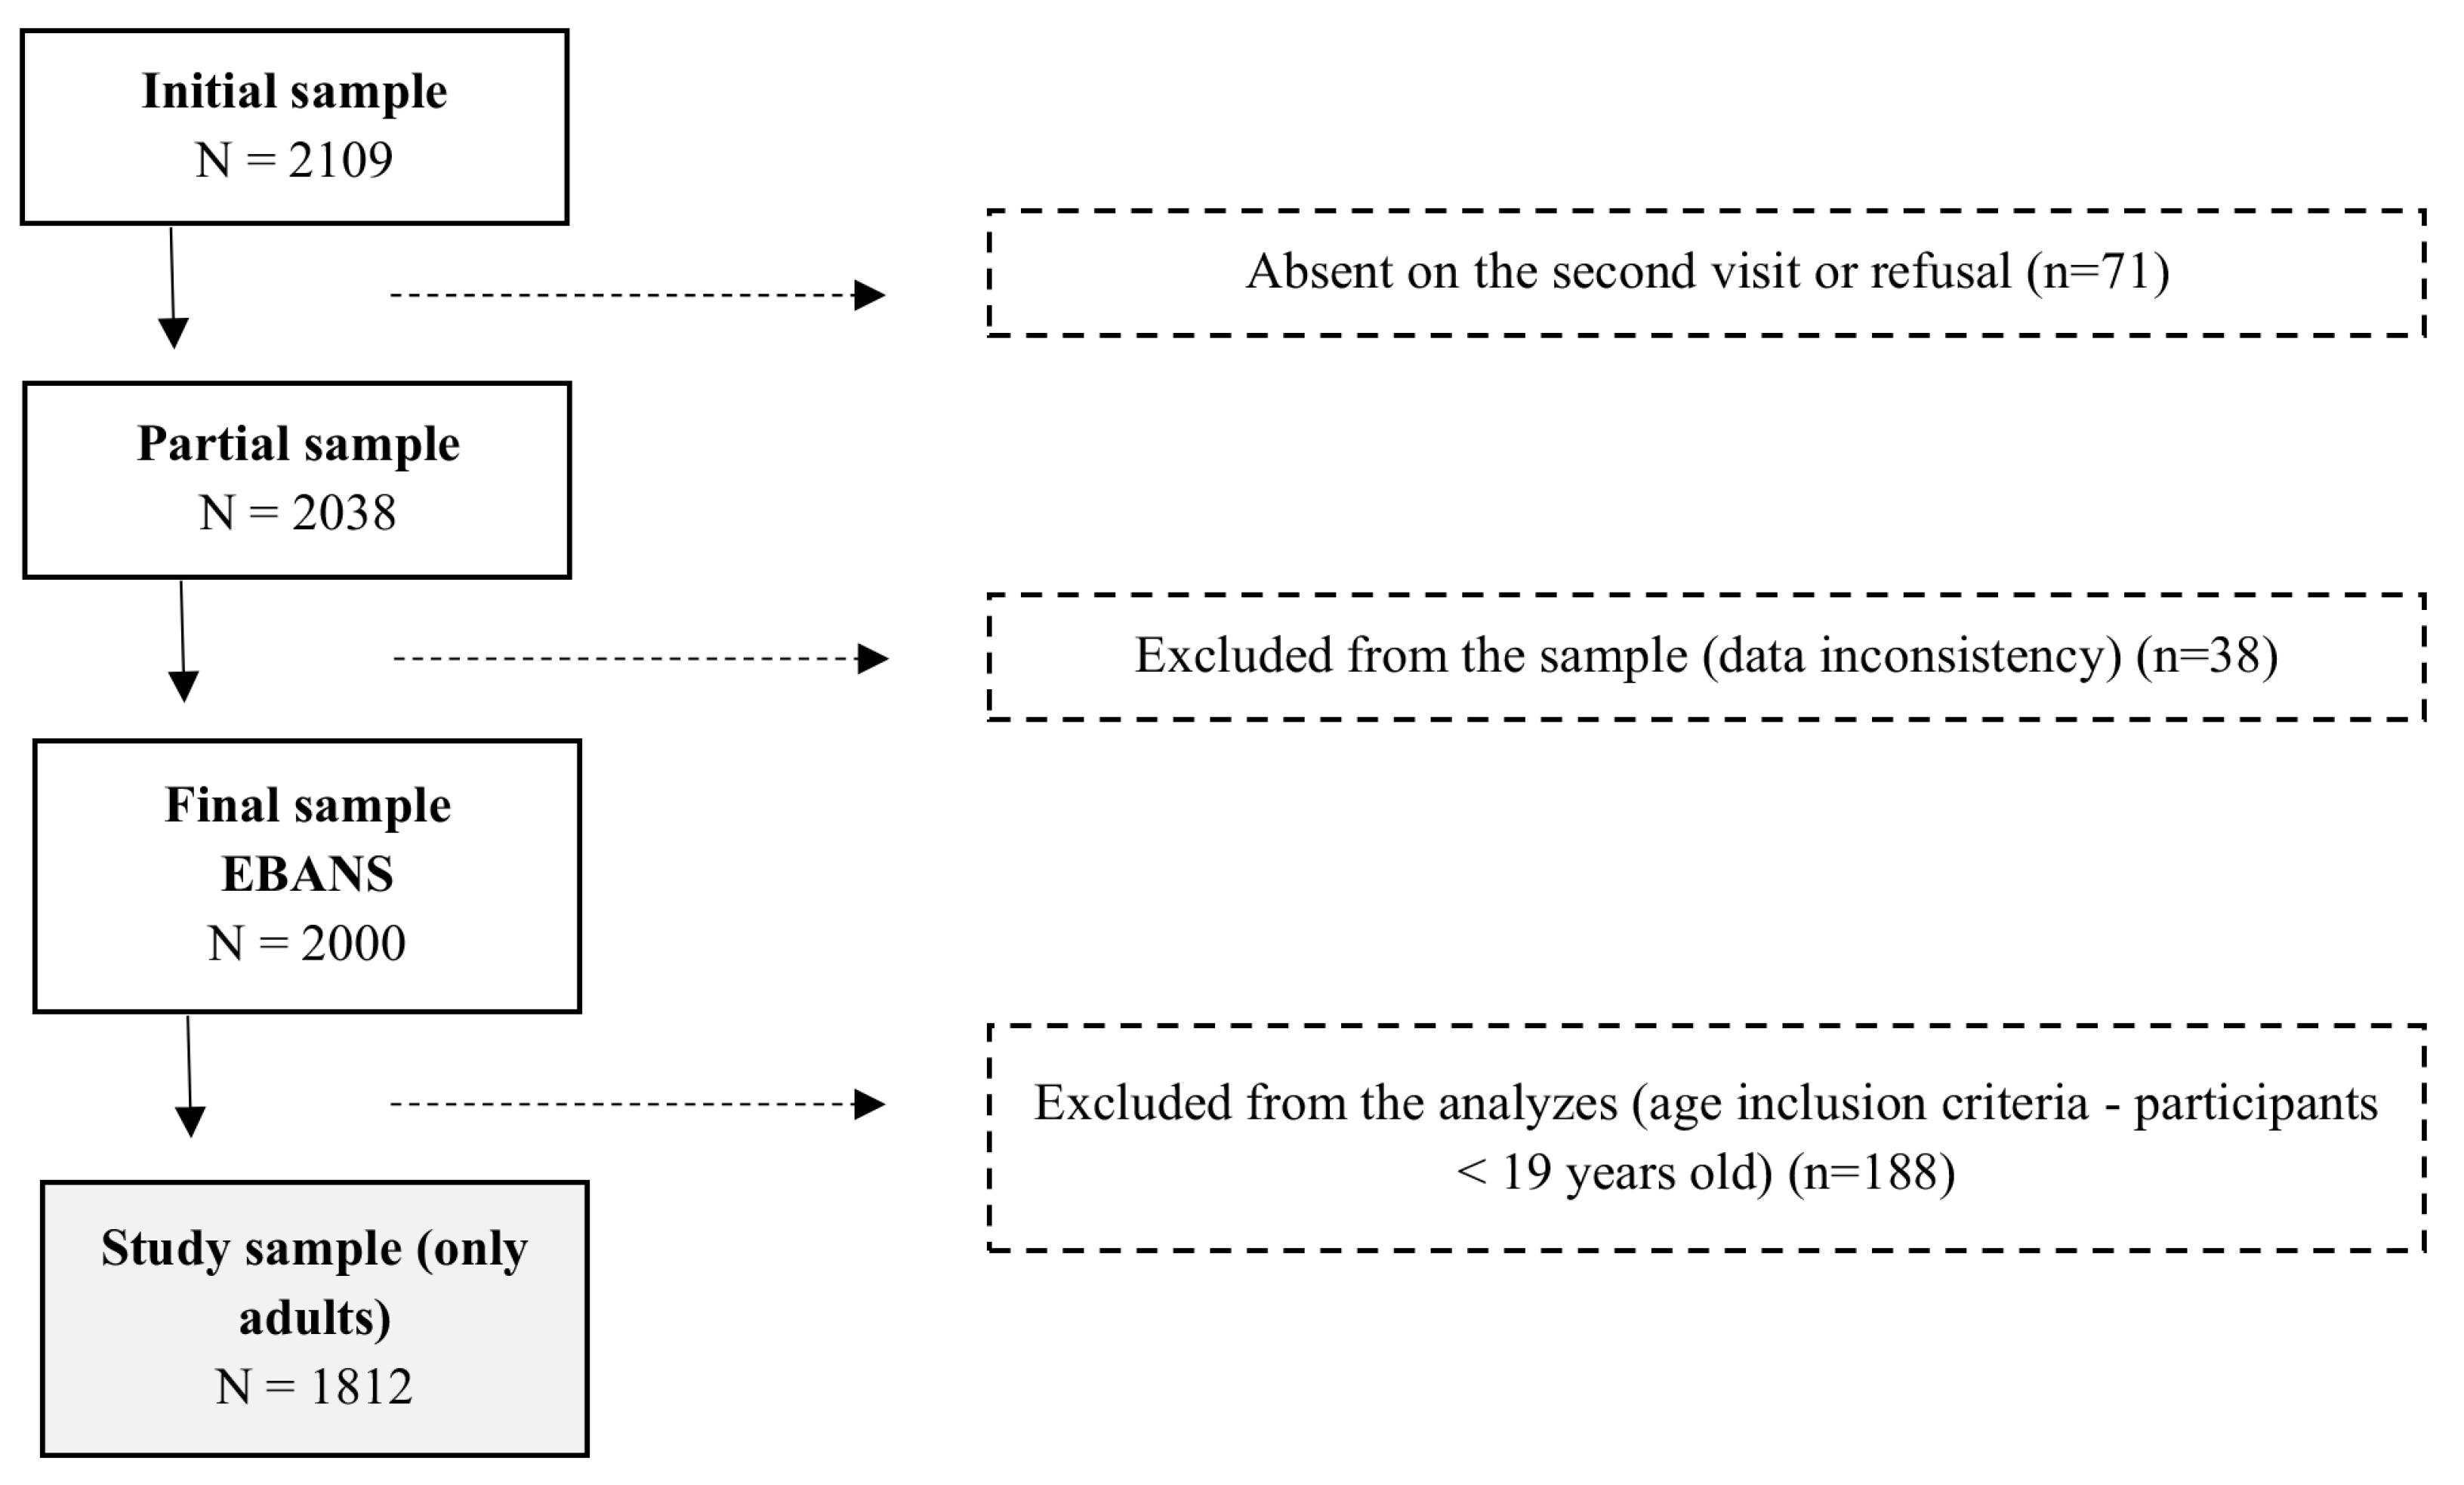

Table 1.
Sociodemographic, nutritional status, physical activity level, and supplement use of Brazilian adults in the EBANS study, stratified by sex and age group. Brazil, 2015.
Table 1.
Sociodemographic, nutritional status, physical activity level, and supplement use of Brazilian adults in the EBANS study, stratified by sex and age group. Brazil, 2015.
| Total population (n=1812) | Male (n=828) | Female (n=984) | |||||||||||||||||||
|---|---|---|---|---|---|---|---|---|---|---|---|---|---|---|---|---|---|---|---|---|---|
| Age strata (years) | Age strata (years) | Age strata (years) | |||||||||||||||||||
| 19 - 30 | 31 - 50 | 51 - 65 | 19 - 30 | 31 - 50 | 51 - 65 | 19 - 30 | 31 - 50 | 51 - 65 | |||||||||||||
| N | % | N | % | N | % | p-value | N | % | N | % | N | % | p-value | N | % | N | % | N | % | p-value | |
| 573 | 32.0 | 851 | 47.0 | 388 | 21.0 | 295 | 16.0 | 394 | 22.0 | 139 | 8.0 | 278 | 15.0 | 457 | 25.0 | 249 | 14.0 | ||||
| Education level | |||||||||||||||||||||
| None to middle school | 196 | 23.8 | 380 | 46.2 | 247 | 30.0 | <0.001 | 95 | 32.2 | 178 | 45.2 | 86 | 61.9 | <0.001 | 101 | 36.3 | 202 | 44.2 | 161 | 64.7 | <0.001 |
| High school | 345 | 60.2 | 372 | 43.7 | 104 | 26.8 | 185 | 62.7 | 172 | 43.7 | 38 | 27.3 | 160 | 57.6 | 200 | 43.8 | 66 | 26.5 | |||
| College/university degree | 32 | 5.6 | 99 | 11.6 | 37 | 9.5 | 15 | 5.1 | 44 | 11.2 | 15 | 10.8 | 17 | 6.1 | 55 | 12.0 | 22 | 8.8 | |||
| Socioeconomic status | |||||||||||||||||||||
| High | 44 | 7.7 | 78 | 9.2 | 31 | 8.0 | 0.003 | 26 | 8.8 | 33 | 8.4 | 13 | 9.4 | 0.099 | 18 | 6.5 | 45 | 9.9 | 18 | 7.2 | 0.033 |
| Middle | 269 | 47.0 | 402 | 47.2 | 143 | 36.9 | 157 | 53.2 | 200 | 50.8 | 55 | 39.6 | 112 | 40.3 | 202 | 44.2 | 88 | 35.3 | |||
| Low | 260 | 45.4 | 371 | 43.6 | 214 | 55.2 | 112 | 38.0 | 161 | 40.9 | 71 | 51.1 | 148 | 53.2 | 210 | 46.0 | 143 | 57.4 | |||
| Excess weight | |||||||||||||||||||||
| BMI <25 kg/m2 | 298 | 52.0 | 303 | 35.6 | 99 | 25.5 | <0.001 | 156 | 52.9 | 148 | 37.6 | 34 | 24.5 | <0.001 | 142 | 51.1 | 155 | 33.9 | 65 | 26.1 | <0.001 |
| BMI>=25 kg/m2 | 275 | 48.0 | 548 | 64.4 | 289 | 74.5 | 139 | 47.1 | 246 | 62.4 | 105 | 75.5 | 136 | 48.9 | 302 | 66.1 | 184 | 73.9 | |||
| PAL (IPAQ) | |||||||||||||||||||||
| Insufficiently active | 300 | 54.4 | 462 | 56.6 | 233 | 62.1 | 0.058 | 131 | 46.1 | 210 | 54.8 | 75 | 55.2 | 0.058 | 169 | 63.1 | 252 | 58.1 | 158 | 66.1 | 0.010 |
| Active | 252 | 45.7 | 355 | 43.5 | 142 | 37.9 | 153 | 53.9 | 173 | 45.2 | 61 | 44.9 | 99 | 36.9 | 182 | 41.9 | 81 | 33.9 | |||
| Supplement use | |||||||||||||||||||||
| No | 488 | 85.2 | 722 | 84.8 | 318 | 82.0 | 0.624 | 257 | 87.1 | 345 | 87.6 | 115 | 82.7 | 0.558 | 231 | 83.1 | 377 | 82.5 | 203 | 81.5 | 0.986 |
| Yes | 26 | 4.5 | 42 | 4.9 | 25 | 6.4 | 11 | 3.7 | 14 | 3.6 | 9 | 6.5 | 15 | 5.4 | 28 | 6.1 | 16 | 6.4 | |||
| Not informed | 59 | 10.3 | 87 | 10.2 | 45 | 11.6 | 27 | 9.2 | 35 | 8.9 | 15 | 10.8 | 32 | 11.5 | 52 | 11.4 | 30 | 12.1 | |||
p-value: Chi-square test. BMI: Body Mass Index. PAL: Physical Activity Level. IPAQ: International Physical Activity Questionnaire.
Table 2.
Energy intake and macronutrient distributions reported by Brazilian adults in the EBANS study, stratified by sex and age group. Brazil, 2015.
Table 2.
Energy intake and macronutrient distributions reported by Brazilian adults in the EBANS study, stratified by sex and age group. Brazil, 2015.
| Nutrient intake | Total population (n=1812) | K-Wallis | Male (n=828) | Female (n=984) | K-Wallis | ||||||||||||
| Mean | SD | P25 | P50 | P75 | p-value* | Mean | SD | P25 | P50 | P75 | Mean | SD | P25 | P50 | P75 | p value** | |
| Energy (kcal) | |||||||||||||||||
| 19 - 30 years | 1978 | 623 | 1564 | 1888 | 2275 | <0.001 a,b,c | 2252 | 651 | 1824 | 2162 | 2523 | 1687 | 430 | 1366 | 1691 | 1921 | <0.001 e,f,h,i,j,k,l |
| 31 - 50 years | 1830 | 576 | 1417 | 1753 | 2151 | 2088 | 594 | 1690 | 2034 | 2416 | 1609 | 458 | 1278 | 1564 | 1866 | ||
| 51 - 65 years | 1566 | 464 | 1230 | 1511 | 1844 | 1827 | 474 | 1493 | 1810 | 2077 | 1420 | 389 | 1147 | 1341 | 1648 | ||
| Carbohydrates (% EI) | |||||||||||||||||
| 19 - 30 years | 50.78 | 6.65 | 46.76 | 51.16 | 55.05 | 0.103 | 49.89 | 6.71 | 45.19 | 49.94 | 54.54 | 51.72 | 6.46 | 47.98 | 52.01 | 55.91 | <0.001j,k,l |
| 31 - 50 years | 50.13 | 6.61 | 45.76 | 50.29 | 54.71 | 49.30 | 6.76 | 44.81 | 49.62 | 53.67 | 50.84 | 6.4 | 46.59 | 50.67 | 55.33 | ||
| 51 - 65 years | 50.35 | 7.25 | 46.06 | 50.81 | 54.79 | 48.64 | 6.82 | 44.27 | 48.96 | 53.21 | 51.30 | 7.31 | 46.98 | 51.64 | 56.14 | ||
| Proteins (% EI) | |||||||||||||||||
| 19 - 30 years | 17.26 | 3.31 | 15.09 | 16.97 | 19.15 | 0.001 b,c | 17.58 | 3.42 | 15.38 | 17.11 | 19.6 | 16.92 | 3.15 | 14.9 | 16.77 | 18.7 | <0.001 e,f |
| 31 - 50 years | 17.53 | 3.37 | 15.18 | 17.21 | 19.46 | 17.51 | 3.33 | 15.35 | 17.21 | 19.58 | 17.54 | 3.41 | 15.11 | 17.21 | 19.32 | ||
| 51 - 65 years | 18.11 | 3.54 | 15.72 | 17.81 | 19.92 | 18.64 | 3.57 | 16.37 | 18.61 | 20.28 | 17.82 | 3.5 | 15.45 | 17.31 | 19.69 | ||
| Total fats (% EI) | |||||||||||||||||
| 19 - 30 years | 30.18 | 4.91 | 27.32 | 30.08 | 33.37 | 0.383 | 29.89 | 4.78 | 27.22 | 30.02 | 33.22 | 30.48 | 5.03 | 27.37 | 30.38 | 33.6 | 0.006 k |
| 31 - 50 years | 29.8 | 5.25 | 26.74 | 30.05 | 33.12 | 28.99 | 5.46 | 25.92 | 29.47 | 32.68 | 30.5 | 4.96 | 27.46 | 30.45 | 33.81 | ||
| 51 - 65 years | 29.7 | 5.38 | 26.43 | 29.83 | 33.31 | 29.3 | 5.25 | 25.94 | 29.71 | 32.88 | 29.93 | 5.46 | 26.7 | 30.25 | 33.54 | ||
| Saturated fats (% EI) | |||||||||||||||||
| 19 - 30 years | 9.95 | 1.99 | 8.69 | 9.9 | 11.33 | 0.274 | 9.85 | 1.9 | 8.62 | 9.93 | 11.25 | 10.06 | 2.07 | 8.75 | 9.87 | 11.55 | 0.003 k |
| 31 - 50 years | 9.84 | 2.13 | 8.47 | 9.7 | 11.23 | 9.57 | 2.22 | 8.16 | 9.47 | 10.91 | 10.08 | 2.03 | 8.73 | 9.9 | 11.39 | ||
| 51 - 65 years | 9.81 | 2.17 | 8.35 | 9.8 | 11.1 | 9.58 | 2.05 | 8.25 | 9.58 | 10.93 | 9.93 | 2.23 | 8.53 | 9.94 | 11.27 | ||
| Unsaturated fats (% EI) | |||||||||||||||||
| 19 - 30 years | 7.61 | 1.87 | 6.27 | 7.52 | 8.76 | 0.319 | 7.46 | 1.82 | 6.19 | 7.5 | 8.51 | 7.77 | 1.92 | 6.47 | 7.57 | 8.94 | 0.093 |
| 31 - 50 years | 7.45 | 1.86 | 6.31 | 7.39 | 8.47 | 7.26 | 1.82 | 6.13 | 7.33 | 8.36 | 7.61 | 1.87 | 6.47 | 7.4 | 8.68 | ||
| 51 - 65 years | 7.41 | 1.79 | 6.26 | 7.31 | 8.43 | 7.31 | 1.65 | 6.19 | 7.39 | 8.26 | 7.47 | 1.86 | 6.27 | 7.31 | 8.62 | ||
| EPA (mg) | |||||||||||||||||
| 19 - 30 years | 11.81 | 8.42 | 7.51 | 10.5 | 13.32 | <0.001 a,b | 10.98 | 7.19 | 7.18 | 9.56 | 13.02 | 12.68 | 9.49 | 8.58 | 11.27 | 13.64 | <0.001 e,j,k |
| 31 - 50 years | 12.8 | 8.22 | 8.34 | 11.08 | 14.57 | 12.19 | 8.51 | 7.9 | 10.31 | 13.75 | 13.32 | 7.94 | 9.21 | 11.74 | 15.27 | ||
| 51 - 65 years | 13.49 | 10.73 | 8.55 | 11.58 | 14.67 | 12.93 | 8.31 | 8.47 | 11.06 | 14.7 | 13.8 | 11.87 | 8.96 | 11.92 | 14.67 | ||
| DHA (mg) | |||||||||||||||||
| 19 - 30 years | 48.16 | 33.58 | 29.41 | 40.23 | 54.51 | 0.187 | 49.46 | 37.06 | 29.41 | 40.69 | 55.86 | 46.79 | 29.43 | 29.28 | 39.19 | 54.1 | 0.550 |
| 31 - 50 years | 51.05 | 36.38 | 29.81 | 40.93 | 58.58 | 51.72 | 36.33 | 30.02 | 41.1 | 58.63 | 50.48 | 36.46 | 29.71 | 40.62 | 57.73 | ||
| 51 - 65 years | 50.4 | 39.84 | 28.28 | 39.26 | 57.41 | 52.03 | 35.75 | 26.2 | 38.68 | 64.18 | 49.49 | 42 | 29.25 | 39.31 | 53.35 | ||
SD: Standard deviation. % EI: Nutrient intake as a percentage of total energy intake. EPA: Eicosapentaenoic fatty acid. DHA: Docosahexaenoic fatty acid. * Kruskal Wallis test with post hoc pairwise comparisons: analysis to evaluate the differences among age groups in the overall population: (a) Significant differences between age groups 19 - 30 years and 31 - 50 years; (b) Significant differences between age groups 19 - 30 years and 51 - 65 years; (c) Significant differences between age groups 31 - 50 years and 51 - 65 years.** Kruskal Wallis test with post hoc pairwise comparisons: analysis to evaluate the differences between sexes and the three age groups: (d) Significant differences between age groups 19 - 30 years and 31 - 50 years among men; (e) Significant differences between age groups 19 - 30 years and 51 - 65 years among men; (f) Significant differences between age groups 31 - 50 years and 51 - 65 years among men; (g) Significant differences between age groups 19 - 30 years and 31 - 50 years among women; (h) Significant differences between age groups 19 - 30 years and 51 - 65 years among women; (i) Significant differences between age groups 31 - 50 years and 51 - 65 years among women; (j) Significant differences between 19 to 30 years (male) vs. 19 to 30 years (female); (k) Significant differences between 31 to 50 years (male) vs. 31 to 50 years (female); (l) Significant differences between 51 to 65 years (male) vs. 51 to 65 years (female).
Table 3.
Prevalence of inadequacy in total fiber, added sugar, and saturated fat intake in Brazilian adults, stratified by sex and age group. Brazil, 2015.
Table 3.
Prevalence of inadequacy in total fiber, added sugar, and saturated fat intake in Brazilian adults, stratified by sex and age group. Brazil, 2015.
| Nutrient | Total population (n=1812) | Male (n=828) | Female (n=984) | ||||||
|---|---|---|---|---|---|---|---|---|---|
| n | % | p-value | n | % | p-value | n | % | p-value | |
| Total fiber (g) | < 25g/day | < 25g/day | < 25g/day | ||||||
| Total - 19 - 65 years | 1,508 | 83.22 | 580 | 70.05 | 928 | 94.31 | |||
| 19 - 30 years | 463 | 80.8 | 0.062 | 197 | 66.78 | 0.170 | 266 | 95.68 | 0.354 |
| 31 - 50 years | 709 | 83.31 | 278 | 70.56 | 431 | 94.31 | |||
| 51 - 65 years | 336 | 86.6 | 105 | 75.54 | 231 | 92.77 | |||
| Added sugar (% EI) | > 10% of EI | > 10% of EI | > 10% of EI | ||||||
| Total - 19 - 65 years | 1,121 | 61.87 | 453 | 54.71 | 668 | 67.89 | |||
| 19 - 30 years | 404 | 70.51 | p<0.001 | 184 | 62.37 | p<0.001 | 220 | 79.14 | p<0.001 |
| 31 - 50 years | 523 | 61.46 | 212 | 53.81 | 311 | 68.05 | |||
| 51 - 65 years | 194 | 50 | 57 | 41.01 | 137 | 55.02 | |||
| Saturated fat (%EI) | > 10% of EI | > 10% of EI | > 10% of EI | ||||||
| Total - 19 - 65 years | 814 | 44.92 | 346 | 41.79 | 468 | 47.56 | |||
| 19 - 30 years | 273 | 47.64 | 0.225 | 143 | 48.47 | 0.014 | 130 | 46.76 | 0.940 |
| 31 - 50 years | 366 | 43.01 | 148 | 37.56 | 218 | 47.7 | |||
| 51 - 65 years | 175 | 45.1 | 55 | 39.57 | 120 | 48.19 | |||
p-value: Chi-square test. % EI: Nutrient intake as a percentage of total energy intake.
Table 4.
Distribution and probabilities of inadequate vitamin intakes in Brazilian adults, stratified by sex and age group. Brazil, 2015.
Table 4.
Distribution and probabilities of inadequate vitamin intakes in Brazilian adults, stratified by sex and age group. Brazil, 2015.
| Micronutrient | Brazil (n=1812) | Male (n=828) | Female (n=984) | |||||||
|---|---|---|---|---|---|---|---|---|---|---|
| Mean | SD | Mean | SD | EAR | Inadequacy (%) | Mean | SD | EAR | Inadequacy (%) | |
| Vitamin A (mcg) | ||||||||||
| 19 - 30 years | 554.51 | 590.02 | 567.77 | 706.99 | 625 | 53.19% | 540.43 | 433.56 | 500 | 46.41% |
| 31 - 50 years | 547.55 | 459.15 | 557.57 | 497.32 | 625 | 55.57% | 538.91 | 423.85 | 500 | 46.41% |
| 51 - 65 years | 527.48 | 461.74 | 560.79 | 503.24 | 625 | 55.17% | 508.88 | 436.81 | 500 | 49.20% |
| Vitamin C (mg) | ||||||||||
| 19 - 30 years | 90.52 | 84.76 | 90.04 | 90.16 | 75 | 43.25% | 91.03 | 78.80 | 60 | 34.83% |
| 31 - 50 years | 91.56 | 79.72 | 90.19 | 84.13 | 75 | 42.86% | 92.74 | 75.78 | 60 | 33.36% |
| 51 - 65 years | 98.00 | 83.26 | 94.88 | 82.79 | 75 | 40.52% | 99.74 | 83.63 | 60 | 31.56% |
| Vitamin D (mcg) | ||||||||||
| 19 - 30 years | 3.54 | 2.16 | 3.79 | 2.27 | 10 | 99.69% | 3.28 | 2.00 | 10 | 99.88% |
| 31 - 50 years | 3.32 | 1.85 | 3.52 | 1.96 | 10 | 99.95% | 3.16 | 1.73 | 10 | 99.87% |
| 51 - 65 years | 3.12 | 1.73 | 3.24 | 1.72 | 10 | 99.99% | 3.05 | 1.73 | 10 | 99.46% |
| Vitamin E (mg) | ||||||||||
| 19 - 30 years | 7.40 | 2.73 | 8.03 | 2.86 | 12 | 91.77% | 6.72 | 2.43 | 12 | 98.50% |
| 31 - 50 years | 7.06 | 2.91 | 7.74 | 3.22 | 12 | 90.66% | 6.47 | 2.48 | 12 | 98.71% |
| 51 - 65 years | 6.55 | 2.61 | 7.41 | 3.09 | 12 | 93.06% | 6.07 | 2.15 | 12 | 99.70% |
| Thiamin (mg) | ||||||||||
| 19 - 30 years | 1.62 | 0.51 | 1.82 | 0.52 | 1.0 | 5.82% | 1.42 | 0.42 | 0.9 | 10.93% |
| 31 - 50 years | 1.60 | 0.57 | 1.78 | 0.58 | 1.0 | 9.01% | 1.45 | 0.52 | 0.9 | 14.23% |
| 51 - 65 years | 1.50 | 0.66 | 1.76 | 0.90 | 1.0 | 19.77% | 1.36 | 0.41 | 0.9 | 13.14% |
| Riboflavin (mg) | ||||||||||
| 19 - 30 years | 1.38 | 0.47 | 1.52 | 0.50 | 1.1 | 19.77% | 1.23 | 0.39 | 0.9 | 20.05% |
| 31 - 50 years | 1.30 | 0.45 | 1.43 | 0.47 | 1.1 | 24.20% | 1.18 | 0.39 | 0.9 | 23.27% |
| 51 - 65 years | 1.17 | 0.37 | 1.33 | 0.41 | 1.1 | 28.77% | 1.08 | 0.32 | 0.9 | 28.43% |
| Pyridoxine (mg) | ||||||||||
| 19 - 30 years | 1.74 | 0.72 | 2.01 | 0.80 | 1.1 | 12.17% | 1.46 | 0.47 | 1.1 | 22.06% |
| 31 - 50 years | 1.67 | 0.70 | 1.95 | 0.78 | 1.1 | 13.79% | 1.43 | 0.50 | 1.1 | 25.14% |
| 51 - 65 years | 1.49 | 0.65 | 1.80 | 0.82 | 1.4 | 31.21% | 1.32 | 0.45 | 1.3 | 48.40% |
| Vitamin B12 (mcg) | ||||||||||
| 19 - 30 years | 4.41 | 2.38 | 4.97 | 2.57 | 2.0 | 12.30% | 3.82 | 2.01 | 2.0 | 18.14% |
| 31 - 50 years | 4.26 | 2.34 | 4.76 | 2.58 | 2.0 | 14.23% | 3.83 | 2.01 | 2.0 | 18.14% |
| 51 - 65 years | 3.87 | 1.63 | 4.71 | 1.95 | 2.0 | 8.23% | 3.41 | 1.19 | 2.0 | 11.70% |
| Choline* | Prob. Adeq. (%) | Prob. Adeq. (%) | ||||||||
| 19 - 30 years | 337.85 | 123.23 | 387.9 | 132.47 | 550* | 10.51% | 284.74 | 85.042 | 425* | 6.12% |
| 31 - 50 years | 325.45 | 113.15 | 370.34 | 118.32 | 550* | 6.60% | 286.75 | 92.497 | 425* | 6.78% |
| 51 - 65 years | 295.85 | 98.167 | 351.12 | 107.99 | 550* | 2.28% | 265 | 76.691 | 425* | 4.02% |
SD: Standard deviation. EAR: Estimated Average Requirement. Inadequacy (%) expresses the probability of inadequacy based on EAR values for each micronutrient. * AI – Adequate intake. For choline, the probability of adequacy is estimated based on AI values (EAR is not available).
Table 5.
Distribution and probabilities of inadequate mineral intakes in Brazilian adults, stratified by sex and age group. Brazil, 2015.
Table 5.
Distribution and probabilities of inadequate mineral intakes in Brazilian adults, stratified by sex and age group. Brazil, 2015.
| Micronutrient | Brazil (n=1812) | Male (n=828) | Female (n=984) | |||||||
|---|---|---|---|---|---|---|---|---|---|---|
| Mean | SD | Mean | SD | EAR | Inadequacy (%) | Mean | SD | EAR | Inadequacy (%) | |
| Calcium (mg) | ||||||||||
| 19 - 30 years | 470.80 | 244.02 | 509.13 | 265.31 | 800 | 86.42% | 430.12 | 212.21 | 800 | 95.91% |
| 31 - 50 years | 451.66 | 239.22 | 463.56 | 219.30 | 800 | 93.70% | 441.40 | 254.94 | 800 | 92.07% |
| 51 - 65 years | 424.57 | 204.40 | 454.31 | 213.32 | 800 | 95.73% | 407.98 | 197.75 | 1000 | 99.86% |
| Iron (mg) | ||||||||||
| 19 - 30 years | 12.36 | 4.18 | 14.20 | 4.18 | 6.0 | 2.50% | 10.40 | 3.17 | 8.10 | 23.27% |
| 31 - 50 years | 11.36 | 4.11 | 13.22 | 4.38 | 6.0 | 4.95% | 9.75 | 3.05 | 8.10 | 29.46% |
| 51 - 65 years | 9.98 | 3.27 | 11.77 | 3.02 | 6.0 | 2.81% | 8.98 | 2.97 | 5.00 | 9.01% |
| Magnesium (mg) | ||||||||||
| 19 - 30 years | 216.45 | 71.79 | 246.95 | 77.02 | 330 | 85.99% | 184.09 | 48.01 | 255 | 93.06% |
| 31 - 50 years | 211.69 | 69.51 | 240.75 | 73.45 | 350 | 93.19% | 186.64 | 54.77 | 265 | 92.36% |
| 51 - 65 years | 199.76 | 62.56 | 228.55 | 65.74 | 350 | 96.78% | 183.69 | 54.58 | 265 | 93.19% |
| Zinc (mg) | ||||||||||
| 19 - 30 years | 12.40 | 5.33 | 14.53 | 6.04 | 9.4 | 19.77% | 10.13 | 3.15 | 6.8 | 14.46% |
| 31 - 50 years | 11.51 | 4.48 | 13.29 | 4.87 | 9.4 | 21.19% | 9.97 | 3.43 | 6.8 | 17.88% |
| 51 - 65 years | 10.41 | 4.05 | 12.29 | 3.95 | 9.4 | 23.27% | 9.36 | 3.71 | 6.8 | 24.51% |
SD: Standard deviation. EAR: Estimated Average Requirement. Inadequacy (%) expresses the probability of inadequacy based on EAR values for each micronutrient.
Disclaimer/Publisher’s Note: The statements, opinions and data contained in all publications are solely those of the individual author(s) and contributor(s) and not of MDPI and/or the editor(s). MDPI and/or the editor(s) disclaim responsibility for any injury to people or property resulting from any ideas, methods, instructions or products referred to in the content. |
© 2024 by the authors. Licensee MDPI, Basel, Switzerland. This article is an open access article distributed under the terms and conditions of the Creative Commons Attribution (CC BY) license (http://creativecommons.org/licenses/by/4.0/).
Copyright: This open access article is published under a Creative Commons CC BY 4.0 license, which permit the free download, distribution, and reuse, provided that the author and preprint are cited in any reuse.


