
Submitted:
30 September 2023
Posted:
01 October 2023
You are already at the latest version
Abstract
Suboptimal micronutrient intake in children remains a public health concern around the world. This study examined the relationship between a previously defined dietary carbohydrate quality index (CQI) and the risk of micronutrient intake inadequacy in a pediatric cohort of Spanish preschoolers. Children aged 4-5 years old were recruited at their medical center or at school, and information on sociodemographic, dietary, and life-style variables were collected through a self-administered online questionnaire. Dietary information was obtained from a validated 147-item semi-quantitative food frequency questionnaire. We calculated the CQI and categorized participants in quartiles according to their score. We assessed the intakes of 20 micronutrients and evaluated the probability of intake inadequacy using the Estimated Average Requirement cut-off point. Generalized estimating equations were used to adjust for potential confounders and account for the intra-cluster correlations between siblings. The adjusted proportions of children with inadequate intake of ≥3 micronutrients were 23%, 12%, 11% and 9% in the first, second, third and fourth quartiles of the CQI, respectively. Children in the highest quartile of CQI had 0.22-fold lower odds (95%CI 0.10-0.48) of having ≥3 inadequate micronutrient intakes than their peers in the lowest quartile. These findings reinforce the relevance of carbohydrate quality in children’s diets.
Keywords:
Carbohydrate quality index
; CQI
; Micronutrient Inadequacy
; SENDO cohort
1. Introduction
Micronutrients, also known as vitamins and minerals, are an essential part of a healthy diet and contribute to an optimal health. They are involved in numerous physiological processes, playing a key role in the production and proper functioning of enzymes, hormones and other molecules required for the body’s normal growth and development [1]. Even though micronutrients are needed in small quantities, an inadequate intake can seriously compromise health [2,3,4,5].
Micronutrients are especially important in the most vulnerable stages of life, such as childhood, due to the higher demands required by children’s rapid growth and development. Despite numerous advances and improvements in child health, malnutrition and concomitant micronutrient deficiencies continue to be a major concern around the world, especially in developing nations [2,6]. They also remain a public health challenge in more affluent countries. Several studies across Europe and America showed that there is still a high prevalence of suboptimal micronutrients intake among children and adolescents [7,8,9,10].
On the other hand, food-based approaches are considered a long-term strategy for improving nutrition in order to meet nutritional requirements. In that sense, a growing number of voices are calling for dietary guidelines and policies to put emphasis on the quality of macronutrients in the diet rather than on the quantity, including improving the quality rather than modifying the quantity of carbohydrates [11,12,13].
Different criteria have been used to measure carbohydrate quality, including measures of whole grain consumption, dietary fiber, fiber from cereal, glycemic index, and ratios such as total carbohydrate-to-total fiber and total carbohydrate-to-cereal fiber. A growing body of evidence shows it is a more important determinant of health than carbohydrate quantity alone [11,12,13,14,15,16].
Another emerging method is the use of a multi-component carbohydrate quality index (CQI), which was first proposed in 2014 by Zazpe et al [17]. This CQI combines four aspects of carbohydrate quality: low glycemic index (GI), high amount of dietary fiber, high ratio of whole grain to total grain (whole plus refined grain), and high ratio of solid to total carbohydrate (solid plus liquid) (Table S1).
In previous observational studies in adults, diets with higher CQI have been associated with rapid improvements in cardiovascular risk factors including body weight and waist circumference [18] and with lower risk of obesity [19], cardiovascular disease (CVD) [20] and breast cancer [21]. Regarding micronutrient adequacy, two previous studies in adults reported a strong association of the CQI with nutritional adequacy [17,22].
To our knowledge, no study has been conducted in children to determine if the quality of dietary carbohydrate is associated with nutritional adequacy. Therefore, we investigated the association between carbohydrate quality, measured with the CQI, and overall nutritional adequacy considering 20 micronutrients, in a pediatric population of Spanish children.
2. Materials and Methods
Study Population
The Seguimiento del Niño para un Desarrollo Óptimo (SENDO) project (https://www.proyectosendo.es/) is an open, multidisciplinary, multiple outcome, prospective cohort study of Spanish children, designed to analyze the effect of diet and lifestyles on the health of children and adolescents. The ongoing recruitment began in 2015 and participants are invited to join by their pediatrician at their primary care health center or by the SENDO team of researchers through schools. The inclusion criteria include being a child aged between 4 and 5 years old and being a Spanish resident. The only exclusion criterion is the impossibility to access a device connected to the internet to fulfill the online questionnaires.
Information is collected at baseline and updated every year through online self-administered questionnaires which are completed by the child’s parents. For the present study, we used the baseline information of participants recruited between January 2015 and June 2022.
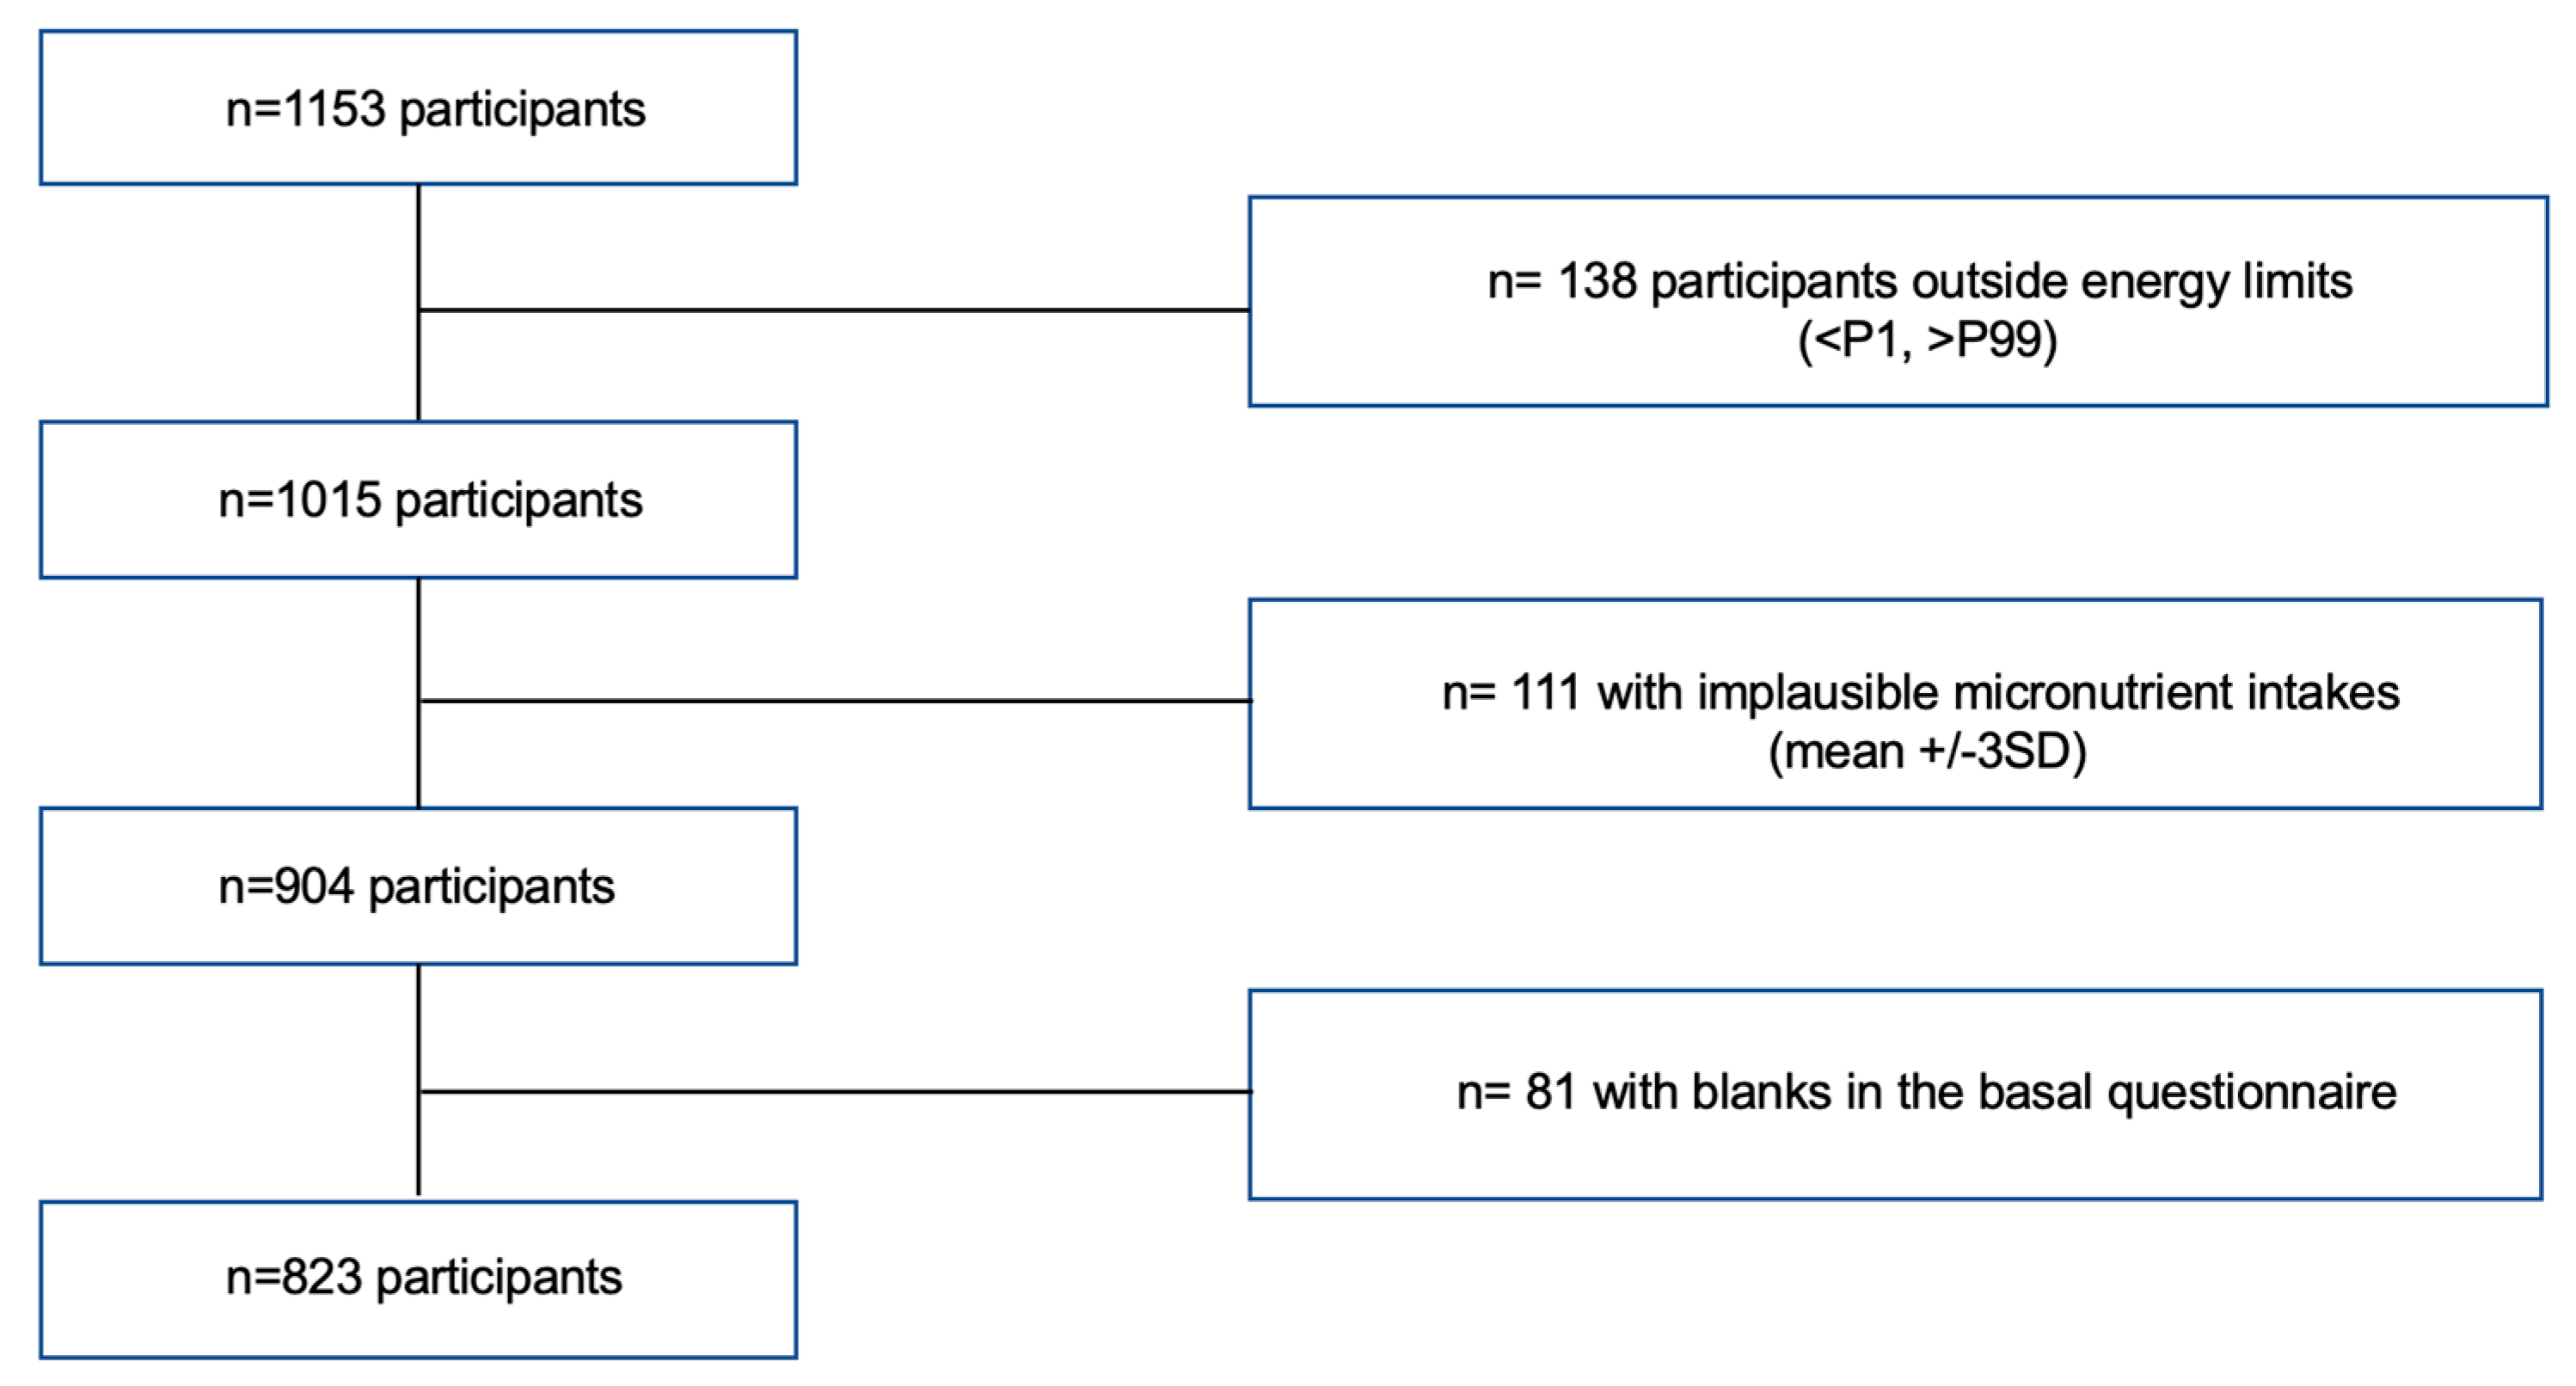
Of the 1157 participants recruited before June 2022, we excluded participants who reported a total energy intake outside the defined limits (<P1 or >P99) (n=138) and those with micronutrients intakes ≥3 standard deviations (SD) apart from the mean (n=111). Of those remaining, 24 participants had an incomplete baseline questionnaire and were consequently excluded (see Figure 1). Thus, the final sample consisted of 823 participants.
The SENDO project follows the rules of the Declaration of Helsinki on the ethical principles for medical research in human beings. This study was approved by the Ethics Committee for Clinical Research of Navarra (Pyto 2016/122). An informed consent was obtained from all participants’ parents at recruitment.
Figure 1.
Flow-chart of participants recruited in the SENDO project, 2014–2022.
Dietary Assessment
Dietary information was collected through a previously validated 147-item semi-quantitative food frequency questionnaire (FFQ) [23]. A portion size was specified for each food item. Parents reported how often their child had consumed each of the food items over the previous year by choosing one out of 9 frequencies of consumption ranging from “never or almost never” to “≥6 times per day”. The nutrient content of the food items was calculated by trained dieticians, by multiplying the edible portion by the frequency of consumption and the nutrient composition of the specified portion size. Updated Spanish food composition tables and online databases were used for this purpose [24].
The CQI of each participant was defined based on the following four criteria: the glycemic index (GI); the dietary fiber intake; the ratio whole grains: total grains and finally the ratio solid carbohydrate: total carbohydrate (Table S1).
The dietary fiber intake was measured in grams per day. GI values were taken from the updated tables published by Atkinson et al in 2021 [25] and a mean glycemic index was calculated for each participant. This was done by adding the glycemic load contribution of each food consumed on average daily and dividing it by the total amount of carbohydrate consumed on average daily. For the third criteria, the intake of total grains was calculated by summing the intakes of whole grains (calculated based on the consumption of whole bread), refined grains and their respective products. Finally, solid carbohydrate content was calculated by resting liquid carbohydrate to the total carbohydrate content in the diet. Sources of liquid carbohydrate included sugar-sweetened beverages and fruit juices.
For each of these 4 components, participants were categorized into quintiles and were given a value (ranging from 1 to 5) according to each quintile. All were positively weighted except for the GI. The CQI was constructed by adding up all these values, with the final score ranging from 4 to 20, with higher values corresponding to better quality of carbohydrates (Table S1). Lastly, the participants were divided into quartiles according to their CQI values.
We also assessed the consumption of food from 15 different food groups: vegetables, fruits, legumes, dairy, cereals, potatoes, meat, fish, nuts, bakery and sweets, beverages, fast-food, eggs, olive oil and other types of oils and fats (sunflower oil, butter and mayonnaise).
Lastly, we calculated the KIDMED score of each participant to assess adherence to the Mediterranean diet. This score has been described previously [26].
Assessment of Covariates
The baseline questionnaire collected information on family and personal medical history, dietary habits, as well as sociodemographic and lifestyle variables.
The child’s and mother’s age were calculated as the difference between the date on which the questionnaire was received and their respective birth date. Body mass index (BMI) was calculated as the ratio between reported weight (kg) and height-squared (m2). Information on the standard procedures to collect these data was indicated in the questionnaire. Nutritional status was defined using sex and age-specific cut-off points for the BMI based on the International Obesity Task Force standards of reference [27]. Age- and sex-specific z-score of the BMI was calculated using the LMS method [27].
Physical activity was assessed with a questionnaire that included 14 activities and 10 answer options, from never to 11 or more hours/week. Of these, 4 activities were considered as moderate (≤ 5 METs/hour), and 10 as intense (>5 METs/hour). Participants indicated the average time dedicated to each activity during the previous year and we calculated the annual mean hours per day spent in moderate-vigorous activities.
Screen time was calculated as the mean of hours per day spent watching television, using a computer, or playing video games. Time spent on weekdays and weekends was assessed separately.
Parental attitudes towards their child’s dietary habits were evaluated through 8 yes/no questions. Affirmative answers (i.e., healthy attitudes) were assigned 1 point and negative answer, 0 points. Hence, the final score ranged from 0 to 8 points, with a higher score suggesting healthier attitudes. Participants’ parents were classified as having unhealthy (0-3 points), average (4-6 points) or healthy attitudes (7-8 points) towards their child’s dietary habits.
Parental knowledge on nutritional recommendations for children was evaluated with questions on the recommended intake frequency of 18 different food groups and with 9 categories of response ranging from “never” to “≥6 times per day”. Each question was assigned 1 point if the answer met the dietary recommendations and 0 points if it did not. The final score was expressed as a percentage, with higher value meaning higher knowledge on nutritional recommendations for children. Participants’ parents were categorized as having high (>70%), average (40-70%) or low (<40%) nutritional knowledge. The Parental attitudes and parental knowledge scores have been used in previous studies of the SENDO project (35,36).
Outcome assessment
We aimed to determine micronutrient intake adequacy for the following 20 micronutrients with known public health relevance: vitamin A, vitamin C, vitamin D, vitamin E, vitamin B1, vitamin B2; vitamin B3; vitamin B6; folic acid; vitamin B12; Ca; I; Fe; P; Mg; Se; Zn; Cr; K; Na. The prevalence of intake adequacy was calculated by comparing the intakes of these nutrients with the estimated average requirements (EAR) when these were available or adequate intake levels (AI) if not, as proposed by the Institute of Medicine [30,31,32,33,34,35,36].
We also performed a sensitivity analysis adding the participants’ intake of supplements over the previous year to the total micronutrient intake.
Statistical Analysis
We described participants’ characteristics by quartiles of CQI. For descriptive purposes, we used percentages for categorical variables and means (SD) for continuous variables. Linear trend tests across quartiles of CQI were calculated by assigning the median of CQI to each quartile and treating this variable as continuous in regression models. Linear trend Chi squared tests were used for categorical variables.
In the main analyses we calculated 1) the difference and 95% Confidence Interval (CI) in the number of inadequate intakes of micronutrients across values of CQI and 2) the Odds Ratio (OR) and 95% CI for the inadequate intake of ≥3 micronutrients associated with CQI. Crude and multivariable adjusted estimates were calculated. Multivariate analyses were progressively adjusted for 1) sex (female vs male), age (continuous), nutritional status (low weight, normal weight or overweight/obese) and energy intake (continuous), 2) maternal age (continuous), number of children (1, 2, 3-4, 5 or more), breastfeeding duration (none, <6 months, 6-12 months, >12 months)), birth weight (<2500g, 2500-3000g, 3000-3500g, 3500-4000g, >4000g), parental knowledge about nutritional recommendations for children (low, average or high score), parental attitudes towards their child’s dietary habits (low, medium or high score); and 3) moderate-vigorous physical activity (continuous) and screen time (continuous).
In further analyses we calculated the marginal effect of CQI on the risk of having ≥3 inadequate intakes of micronutrients, this is, the adjusted proportion of children with an inadequate intake of ≥3 micronutrients in each quartile of CQI [37].
To assess the magnitude of potential residual confounding we calculated the E-value as proposed by VanderWeele et al [38].
We fitted generalized estimating equations to account for intra-cluster correlation between siblings. Analyses were carried out using Stata version 15.0 (Stata Corporation). All p values are two-tailed. Statistical significance was settled at the conventional cut-off point of p<0.05.
3. Results
This cross-sectional study included 823 participants (49% girls) aged 5.00 (sd: 0.84) years on average. The median CQI was 11 (Interquartile range [IQR]: 9-14). The main characteristics of study participants and their parents by quartiles of CQI are presented in Table 1.
In relation to family factors, we found that children with lower scores of the CQI were more likely to belong to more numerous families (p<0.001) and to have parents with lower knowledge on children’s nutritional requirements (p<0.001) and less healthy attitudes towards their child’s dietary habits (p<0.001). Regarding children’s characteristics, we observed that those with higher CQI scores were more physically active (p<0.001) and were more likely to have been breastfed (p<0.001). Regarding nutritional status, a marginally significant inverse association was observed between nutritional status and CQI, with a smaller proportion of overweight and obese children in the quartile with higher CQI score.
Regarding diet composition, as shown in Table 2, participants with higher scores of CQI (fourth quartile) presented a higher consumption of fruits, vegetables, legumes and nuts (p for trend <0.001), and a lower consumption of sugar-sweetened beverages (p for trend <0.001).
As shown in Table 2, the percentages of total energy intake from carbohydrates, across the different quartiles of CQI, were fairly constant and they ranged from 42.47 to 44.60% (p for trend <0.001); Percentage of total energy represented by protein ranged from 16.84 to 17.20% (p for trend =0.40; Percentage of total energy represented by fat ranged from 38.56 to 40.44% (p for trend <0.001).
Table S2 shows the mean values of different parameters of carbohydrate quality intake according to quartiles of overall CQI. Participants with a higher score of CQI had a higher intake of fiber, solid carbohydrate and whole grains, a lower intake of liquid carbohydrate and refined grains, and a lower GI.
We calculated energy-adjusted mean intake of each micronutrient by quartiles of CQI. The results are displayed in Table 3. We found significant positive linear trends between the CQI and the intake of 15 out of the 20 micronutrients evaluated, including vitamin A, vitamin C, vitamin D, vitamin E, vitamin B1, vitamin B3, vitamin B6, folate, Fe, P, Mg, Se, Zn, Cr, and K. The nutrients which had a higher prevalence of inadequacy were K, vitamin E, folate, Ca, and vitamin D (Table S3). The prevalence of inadequate micronutrient intake according to quartiles of CQI is summarized in Table S3.
After adjusting for potential confounders, we observed that the number of inadequate intakes of micronutrients decreased as the CQI score improved, displaying an inverse linear association (p<0.001), although the reduction in the number of micronutrient inadequacies for each unit of CQI was small. This reduction became significant for values of CQI above 11 as compared to CQI values of 4 (Figure 2). The spline in Figure 2 illustrates the change in micronutrient inadequacy (solid line) and 95% CI (dashed line) associated with one unit increase in CQI. The histogram in Figure 2 describes the distribution of children in our study according to their CQI. 52% of the study’s participants had a CQI lower or equal to 11; 31% were included in the first quartile, with CQI ranging from 4 to 9, 21% were included in the second quartile, with CQI ranging from 10 to 11, 27% in the third quartile with CQI ranging from 12 to 14 and 21% were included in the fourth quartile, with CQI ranging from 15 to 20.
The OR and 95 % CI for unmet EAR for ≥3 micronutrients across quartiles of CQI are shown in Table 4. We found a significant linear trend in the odds of having ≥3 micronutrient inadequacies across quartiles of CQI. Compared with children in the first quartile, those in the fourth quartile of CQI had 0.27-fold lower odds (95%CI 0.15-0.48) of having ≥3 inadequate intakes of micronutrients in the crude model. Similar numbers were observed in the adjusted model: after accounting for personal (sex, age, nutritional status, energy intake, physical activity and screen time) and family confounders (maternal age, parental knowledge about child’s nutritional recommendations and parental attitudes towards child’s dietary habits), we found that children in the fourth quartile of CQI had 0.22-fold lower odds (95%CI 0.10-0.48) of having ≥3 micronutrient inadequacies compared with children in the first quartile.
We also calculated the marginal effect of CQI on the risk of having an inadequate intake in ≥3 micronutrients, in other words the adjusted proportion of children with inadequate intake of ≥3 micronutrients in each quartile of CQI (Figure 3). After accounting for all the potential confounders, the adjusted portions of micronutrient inadequacy were 23% (95% CI: 19%-27%), 12% (95% CI; 7%-17%), 11% (95% CI: 7%-15%) and 9% (95% CI: 5%- 13%) in Q1, Q2, Q3 and Q4 respectively (p for trend <0.001). Moreover, the prevalence of children with inadequate intake of ≥3 micronutrients was significantly lower in the second, third and fourth quartiles of CQI than in the first quartile (p=0.002 for Q2 vs. Q1, p<0.001 for Q3 vs. Q1 and p<0.001 for Q4 vs. Q1). In additional analyses we calculated the OR and 95 % CI of not meeting the EAR for ≥3 micronutrients across quartiles of the different components of the CQI (Figure S1).
Finally, we performed a sensitivity analysis that took into account the supplement intake of the participants in their total micronutrient intake, and we found our results to be consistent.
4. Discussion
The present cross-sectional study examined the relationship between the quality of dietary carbohydrate and the risk of micronutrient intake inadequacy in Spanish children. In order to do so, we used the CQI, which reflects global dietary carbohydrate quality by merging into its score the following components: GI, total daily intake of fiber, whole grains to total grain ratio, and solid to total carbohydrates ratio. After adjusting for potential confounders, we found an inverse association between the CQI scores and the risk of micronutrient intake inadequacy. To the best of our knowledge, this is the first study to analyze the association between the CQI and micronutrient inadequacy in a pediatric population.
These findings are relevant in the context of public health, as they add to the previous knowledge on the relevance of carbohydrate quality in children’s diets and support the current shift in nutritional policies and guidelines.
This improvement in global nutritional adequacy associated with an improvement of dietary carbohydrate quality, is consistent with previous studies in adults [17,22]. Similar unmet micronutrient inadequacies were detected in those studies, including potassium, vitamin E, vitamin D, folate, and Ca. We found a significant dose–response relationship between CQI and nutritional adequacy, suggesting that this association is not due to residual confounding and could well be explained instead by a biological mechanism. In fact, for our results to lose their significance to an unmeasured confounder, or to a sum of them, the strength of the association between the hypothetical unmeasured confounder(s) with the outcome and the exposure ought to be of 6.6. (E-value for point estimate: 6.6; confidence interval: 3.18).
In line with our expectations, participants with better scores of CQI presented a higher consumption of fruits, vegetables, legumes, nuts and whole grains, and a lower consumption of sugar-sweetened beverages and refined grains. These differential consumption patterns are a plausible explanation for the association observed between CQI and nutritional adequacy. As we know, whole grains, fruits, vegetables, legumes and nuts are rich in micronutrients and sugar-sweetened beverages provide many calories but few nutrients. A study on German children and adolescents showed that sugar sweetened beverages had in fact a negative effect on micronutrient intake [39]. Additionally, regarding GI, a previous study showed that a higher GI was associated with a low compliance with Dietary Reference Intakes in children and adolescents [40]. Regarding whole grain consumption, a study done in an Italian sample of children, adolescents and adults showed that whole grain consumption in adults was associated with significantly higher daily intakes and adequacy of several vitamins (thiamine, riboflavin, vitamin B6) and minerals (Fe, Ca, K, P, Zn and Mg) compared to non-consumption. Among children, whole grain intake was associated with significantly higher intakes of Fe and Mg [41].
It is worth noting that participants across quartiles of CQI showed similar intakes of carbohydrates, protein, and fat, supporting the idea that quality and not quantity is responsible for these variations in nutritional adequacy.
Regarding the strength of the association, the 78% relative reduction (95% CI 52%-90%) in the risk of ≥3 micronutrient inadequacies observed for participants in the fourth quartile compared to those in the first quartile of CQI, represents a considerable size effect, adding epidemiological evidence in favor of a potential causal association between the CQI and nutritional adequacy.
Lastly, even though the aim of the cohort does not lie in the representativeness of its sample, the fact that our participants display relatively normal nutritional characteristics, compared to other population-based studies in Spain, supports the external validity of our results [8,42]. However, it should be noted that our participants presented rather healthy diets in general, as their intake of fruits and vegetables, and total fiber, even of those from the first quartile of CQI, was higher than those of the average Spanish child, as reported in other population-based studies [8]. This high quality of the diet of the SENDO participants could be attributed to different reasons, among them the fact that most of the children in our cohort come from families with highly educated parents. Moreover, participants enrolled in long-term prospective studies related to nutrition tend to be more health conscious and motivated people [43]. In any case, the fact that the children in our study consumed healthy diets may have hampered our findings, by producing smaller differences among their CQI and micronutrient inadequacies than we would have found in a population with more heterogeneous diets. The fact that the children in our study already had quite a high quality of carbohydrate in their diet, does not in itself rest validity to our results, quite the contrary. It is likely that our differences would have been greater had we had more participants with poorer diets.
We acknowledge that our results may not an exact reflection of the actual magnitude of the association, which probably range within the confidence interval, but what should draw our attention is the potential causality between CQI and nutritional adequacy. We acknowledge that our study has some limitations. First, given that the information collected from the participants is self-reported, a misclassification bias and measurement errors cannot be entirely discarded. However, the FFQ has been previously validated [23], making measurement errors less likely. Additionally, since our data comes from FFQ, which usually slightly overestimate food intakes, the overestimation extends itself to nutrient intake. This suggests that a more precise assessment of food intake would most likely reveal a greater number of nutrient inadequacies, that do not show here in our study. Regarding misclassification bias, it is greatly reduced with the use of quartiles in the design of our study. Moreover, since the participants were unaware of the objective of the study, in the event of a misclassification bias, the latter would be of the non-differential type, which bias the results towards the null value and makes it difficult to obtain statistically significant differences. Nevertheless, we consider that FFQs remain the most practical and feasible tool to measure usual dietary intake in epidemiological studies, since other alternative tools also come with measurement errors and present other major limitations [44].
Second, due to the observational design of our study, we cannot completely rule out the possibility of residual confounding by unknown factors. Nonetheless, the large sample size and the substantial amount of baseline information collected enabled us to adjust for a wide array of potential confounders. Moreover, we found an E-value of 6.6, which suggests that it is unlikely that our results can be explained simply by residual confounding. In line with this, the participants of the SENDO project are children living in a developed European country, whose parents are mostly highly educated. This carries some advantages, as it better controls for potential confounding factors, such as socio-economic variables, and as it most likely improves the validity of the self-reported information. Even though our sample is consequently not representative of the general Spanish population, limiting the external validity of our results, our results should be generalized on the basis of biological mechanisms and not on the representativeness of our sample [45].
Third, our results show the probability of nutritional adequacy as they are based on data from FFQ. The best way to assess actual nutrient deficiency would be through the determination of biomarkers of nutrient intake.
Lastly, although the questionnaires about parental knowledge on children’s nutritional requirements and that about parental attitudes towards child’s dietary habits have not yet been validated, previous studies have shown that they are associated with diet quality in both pediatric and adult populations [36].
On the other hand, our study has several strengths, including a relatively large sample size, its previously validated FFQ [23], its extensive questionnaire which enabled us to adjust the data for numerous potential confounders, the number of micronutrients assessed, and the importance of the issue it tackles. Lastly, we accounted for intra-cluster correlation between siblings in all the analyses, which is a common limitation of studies in pediatric populations.
In conclusion, we found that a high CQI score, which reflects a higher carbohydrate quality intake of the diet, was associated with a lower risk of nutritional inadequacy. For certain micronutrients, the prevalence of nutritional inadequacy in the population still reaches significant numbers, showing the need to include carbohydrate quality in the strategies of public health policies that focus on improving nutritional status of the pediatric population.
Supplementary Materials
The following supporting information can be downloaded at the website of this paper posted on Preprints.org. Figure S1: Odds Ratio and 95% CI of inadequate intake of ≥3 micronutrients associated with quartiles of each component of the CQI; Table S1: Criteria used to calculate the carbohydrate quality index (CQI); Table S2: Parameters of carbohydrate quality intake across quartiles of CQI. Mean (sd); Table S3: Prevalence of inadequate micronutrient intake according to quartiles of CQI (percentages)
Author Contributions
NMC, VO: Conceptualization, Methodology and Software. EFD: Data curation, writing of the original draft. NMC: Supervision. All the authors critically reviewed the manuscript.
Funding
This research received no external funding. It was funded by the internal resources of the Department of Preventive Medicine and Public Health of the University of Navarra
Institutional Review Board Statement
The study was conducted in accordance with the Declaration of Helsinki and approved by the Ethics Committee for Clinical Research of Navarra (Pyto 2016/122).
Informed Consent Statement
Informed consent was obtained from all subjects involved in the study.
Data Availability Statement
Data is available on request.
Acknowledgments
We would like to thank all participants of the SENDO project for their collaboration and generous contribution.
Conflicts of Interest
The authors declare no conflict of interest.
References
- Gil Hernández Ángel, Sanchez de Medína Contreras Fermín. Tratado de Nutrición. 3rd ed. Gil Hernández Ángel, editor. Vol. 1. España: Editorial Médica Panamericana; 2017. 4 p.
- World Health Organization. Micronutrients [Internet]. 2022 [cited 2022 Jun 25]. Available from: https://www.who.int/health-topics/micronutrients#tab=tab_1.
- Centers for Disease Control and Prevention. Micronutrients Facts [Internet]. U.S. Department of Health & Human Services. 2022 [cited 2022 Jun 25]. Available from: https://www.cdc.gov/nutrition/micronutrient-malnutrition/micronutrients/index.html.
- Kim K, Melough MM, Kim D, Sakaki JR, Lee J, Choi K, et al. Nutritional Adequacy and Diet Quality Are Associated with Standardized Height-for-Age among U.S. Children. Nutrients. 2021 May 16;13(5):1689. [CrossRef]
- Reider CA, Chung RY, Devarshi PP, Grant RW, Hazels Mitmesser S. Inadequacy of Immune Health Nutrients: Intakes in US Adults, the 2005–2016 NHANES. Nutrients. 2020 Jun 10;12(6):1735. [CrossRef]
- UNICEF. The State of the World’s Children 2019. Children, Food and Nutrition: Growing well in a changing world. New York; 2019.
- Kaganov B, Caroli M, Mazur A, Singhal A, Vania A. Suboptimal Micronutrient Intake among Children in Europe. Nutrients. 2015 May 13;7(5):3524–35. [CrossRef]
- Agencia Española de Consumo SA y N. Estudio ENALIA 2012-2014: Encuesta Nacional de consumo de Alimentos en población Infantil y Adolescente. Madrid; 2017.
- USDA ARS. Usual Nutrient Intake from Food and Beverages, by Gender and Age, What We Eat in America, NHANES 2013-2016 [Internet]. 2019 [cited 2022 Jun 16]. Available from: https://www.ars.usda.gov/ARSUserFiles/80400530/pdf/usual/Usual_Intake_gender_WWEIA_2013_2016.pdf.
- Hilger J, Goerig T, Weber P, Hoeft B, Eggersdorfer M, Carvalho N, et al. Micronutrient Intake in Healthy Toddlers: A Multinational Perspective. Nutrients. 2015 Aug 18;7(8):6938–55. [CrossRef]
- Sievenpiper JL. Low-carbohydrate diets and cardiometabolic health: the importance of carbohydrate quality over quantity. Nutr Rev. 2020 Aug 1;78(Supplement_1):69–77. [CrossRef]
- Hardy DS, Garvin JT, Xu H. Carbohydrate quality, glycemic index, glycemic load and cardiometabolic risks in the US, Europe and Asia: A dose–response meta-analysis. Nutrition, Metabolism and Cardiovascular Diseases. 2020 Jun;30(6):853–71. [CrossRef]
- Reynolds A, Mann J, Cummings J, Winter N, Mete E, te Morenga L. Carbohydrate quality and human health: a series of systematic reviews and meta-analyses. The Lancet. 2019 Feb;393(10170):434–45. [CrossRef]
- Willett WC, Liu S. Carbohydrate quality and health: distilling simple truths from complexity. Am J Clin Nutr. 2019 Oct 1;110(4):803–4. [CrossRef]
- AlEssa HB, Cohen R, Malik VS, Adebamowo SN, Rimm EB, Manson JE, et al. Carbohydrate quality and quantity and risk of coronary heart disease among US women and men. Am J Clin Nutr. 2018 Feb 1;107(2):257–67. [CrossRef]
- Hashimoto Y, Tanaka M, Miki A, Kobayashi Y, Wada S, Kuwahata M, et al. Intake of Carbohydrate to Fiber Ratio Is a Useful Marker for Metabolic Syndrome in Patients with Type 2 Diabetes: A Cross-Sectional Study. Ann Nutr Metab. 2018;72(4):329–35. [CrossRef]
- Zazpe I, Sánchez-Taínta A, Santiago S, de la Fuente-Arrillaga C, Bes-Rastrollo M, Martínez JA, et al. Association between dietary carbohydrate intake quality and micronutrient intake adequacy in a Mediterranean cohort: the SUN (Seguimiento Universidad de Navarra) Project. British Journal of Nutrition. 2014 Jun 14;111(11):2000–9. [CrossRef]
- Martínez-González MA, Fernandez-Lazaro CI, Toledo E, Díaz-López A, Corella D, Goday A, et al. Carbohydrate quality changes and concurrent changes in cardiovascular risk factors: a longitudinal analysis in the PREDIMED-Plus randomized trial. Am J Clin Nutr. 2020 Feb 1;111(2):291–306. [CrossRef]
- Santiago S, Zazpe I, Bes-Rastrollo M, Sánchez-Tainta A, Sayón-Orea C, de la Fuente-Arrillaga C, et al. Carbohydrate quality, weight change and incident obesity in a Mediterranean cohort: the SUN Project. Eur J Clin Nutr. 2015 Mar 17;69(3):297–302. [CrossRef]
- Zazpe I, Santiago S, Gea A, Ruiz-Canela M, Carlos S, Bes-Rastrollo M, et al. Association between a dietary carbohydrate index and cardiovascular disease in the SUN (Seguimiento Universidad de Navarra) Project. Nutrition, Metabolism and Cardiovascular Diseases. 2016 Nov;26(11):1048–56. [CrossRef]
- Romanos-Nanclares A, Gea A, Martínez-González MÁ, Zazpe I, Gardeazabal I, Fernandez-Lazaro CI, et al. Carbohydrate quality index and breast cancer risk in a Mediterranean cohort: The SUN project. Clinical Nutrition. 2021 Jan;40(1):137–45.. [CrossRef]
- Sánchez-Tainta A, Zazpe I, Bes-Rastrollo M, Salas-Salvadó J, Bullo M, Sorlí JV, et al. Nutritional adequacy according to carbohydrates and fat quality. Eur J Nutr. 2016 Feb 24;55(1):93–106. [CrossRef]
- Zazpe I, Santiago S, de la O V, Romanos-Nanclares A, Rico-Campà A, Álvarez-zallo N, et al. Validity and reproducibility of a semi-quantitative food frequency questionnaire in Spanish preschoolers — The SENDO project. Nutr Hosp. 2020. [CrossRef]
- Moreiras Tuni Olga, Carbajal Angel. Tablas de composición de alimentos. Madrid: Pirámide; 2019.
- Atkinson FS, Brand-Miller JC, Foster-Powell K, Buyken AE, Goletzke J. International tables of glycemic index and glycemic load values 2021: a systematic review. Am J Clin Nutr. 2021 Nov 8;114(5):1625–32. [CrossRef]
- Serra-Majem L, Ribas L, Ngo J, Ortega RM, García A, Pérez-Rodrigo C, Aranceta J. Food, youth and the Mediterranean diet in Spain. Development of KIDMED, Mediterranean Diet Quality Index in children and adolescents. Public Health Nutr. 2004 Oct;7(7):931-5. PMID: 15482620. [CrossRef]
- Cole TJ, Lobstein T. Extended international (IOTF) body mass index cut-offs for thinness, overweight and obesity. Pediatr Obes. 2012 Aug;7(4):284–94. [CrossRef]
- Santiago S, Benítez-Borja A, Martín Calvo N, Romanos-Nanclares A, Moreno-Galarraga L, Zazpe I. Association between parental attitudes towards their offspring's diet and children's actual dietary habits - The SENDO project. Nutr Hosp. 2021 Oct 13;38(5):961-970. English. PMID: 34304576. [CrossRef]
- Romanos-Nanclares A, Zazpe I, Santiago S, Marín L, Rico-Campà A, Martín-Calvo N. Influence of Parental Healthy-Eating Attitudes and Nutritional Knowledge on Nutritional Adequacy and Diet Quality among Preschoolers: The SENDO Project. Nutrients. 2018 Dec 3;10(12):1875. PMID: 30513857; PMCID: PMC6316633. [CrossRef]
- Institute of Medicine Food Nutrition. Dietary reference intakes: applications in dietary assessment [Internet]. Washington DC: National Academy Press; 2000 [cited 2022 Jul 10]. Available from: https://www.ncbi.nlm.nih.gov/books/NBK222890/pdf/Bookshelf_NBK222890.pdf.
- Institute of Medicine (US) Standing Committee on the Scientific Evaluation of Dietary Reference Intakes and its Panel on Folate OBV and C. Dietary Reference Intakes for Thiamin, Riboflavin, Niacin, Vitamin B6, Folate, Vitamin B12, Pantothenic Acid, Biotin, and Choline. National Academies Press (US); 1998.
- Institute of Medicine (US) Committee to Review Dietary Reference Intakes for Vitamin D and Calcium. Dietary Reference Intakes for Calcium and Vitamin D. Ross AC TCYA et al., editor. Washington, D.C.: National Academies Press; 2011.
- Institute of Medicine (US) Panel on Dietary Antioxidants and Related Compounds. Dietary Reference Intakes for Vitamin C, Vitamin E, Selenium, and Carotenoids. National Academies Press (US); 2000.
- National Academies of Sciences E and MH and MDF and NBC to R the DRI for S and P. Reference Intakes for Sodium and Potassium. Oria M HMSV, editor. Washington (DC): National Academies Press (US); 2019.
- Institute of Medicine (US) Standing Committee on the Scientific Evaluation of Dietary Reference Intakes. Dietary Reference Intakes for Calcium, Phosphorus, Magnesium, Vitamin D, and Fluoride. Washington, D.C.: National Academies Press; 1997.
- Institute of Medicine (US) Panel on Micronutrients. Dietary Reference Intakes for Vitamin A, Vitamin K, Arsenic, Boron, Chromium, Copper, Iodine, Iron, Manganese, Molybdenum, Nickel, Silicon, Vanadium, and Zinc. Washington (DC): National Academies Press (US); 2001.
- Norton EC, Dowd BE, Maciejewski ML. Marginal Effects-Quantifying the Effect of Changes in Risk Factors in Logistic Regression Models. JAMA. 2019 Apr 2;321(13):1304-1305. PMID: 30848814. [CrossRef]
- VanderWeele TJ, Ding P. Sensitivity Analysis in Observational Research: Introducing the E-Value. Ann Intern Med. 2017 Aug 15;167(4):268. [CrossRef]
- Libuda L, Alexy U, Buyken AE, Sichert-Hellert W, Stehle P, Kersting M. Consumption of sugar-sweetened beverages and its association with nutrient intakes and diet quality in German children and adolescents. British Journal of Nutrition. 2009 May 16;101(10):1549. [CrossRef]
- Louie JCY, Buyken AE, Brand-Miller JC, Flood VM. The link between dietary glycemic index and nutrient adequacy. Am J Clin Nutr. 2012 Mar 1;95(3):694–702. [CrossRef]
- Sette S, D’Addezio L, Piccinelli R, Hopkins S, le Donne C, Ferrari M, et al. Intakes of whole grain in an Italian sample of children, adolescents and adults. Eur J Nutr. 2017 Mar 20;56(2):521–33. [CrossRef]
- Madrigal C, Soto-Méndez MJ, Hernández-Ruiz Á, Ruiz-López MD, Samaniego-Vaesken ML, Partearroyo T, Varela-Moreiras G, Gil Á. Dietary Intake, Nutritional Adequacy, and Food Sources of Selected Antioxidant Minerals and Vitamins; and Their Relationship with Personal and Family Factors in Spanish Children Aged 1 to <10 Years: Results from the EsNuPI Study. Nutrients. 2022 Oct 5;14(19):4132. PMID: 36235784; PMCID: PMC9573671. [CrossRef]
- Willett W. Nutritional Epidemiology. New York: Oxford University Press; 2012. p.9.
- Willett W. Nutritional Epidemiology. New York: Oxford University Press; 2012. P.86.
- Rothman KJ, Gallacher JE, Hatch EE. Why representativeness should be avoided. Int J Epidemiol. 2013 Aug 1;42(4):1012–4. [CrossRef]
Figure 2.
The spline above shows the change (95% CI) in the number of micronutrient inadequacy associated with carbohydrate quality index (CQI). The histogram below shows the frequency of participants by CQI.
Figure 2.
The spline above shows the change (95% CI) in the number of micronutrient inadequacy associated with carbohydrate quality index (CQI). The histogram below shows the frequency of participants by CQI.
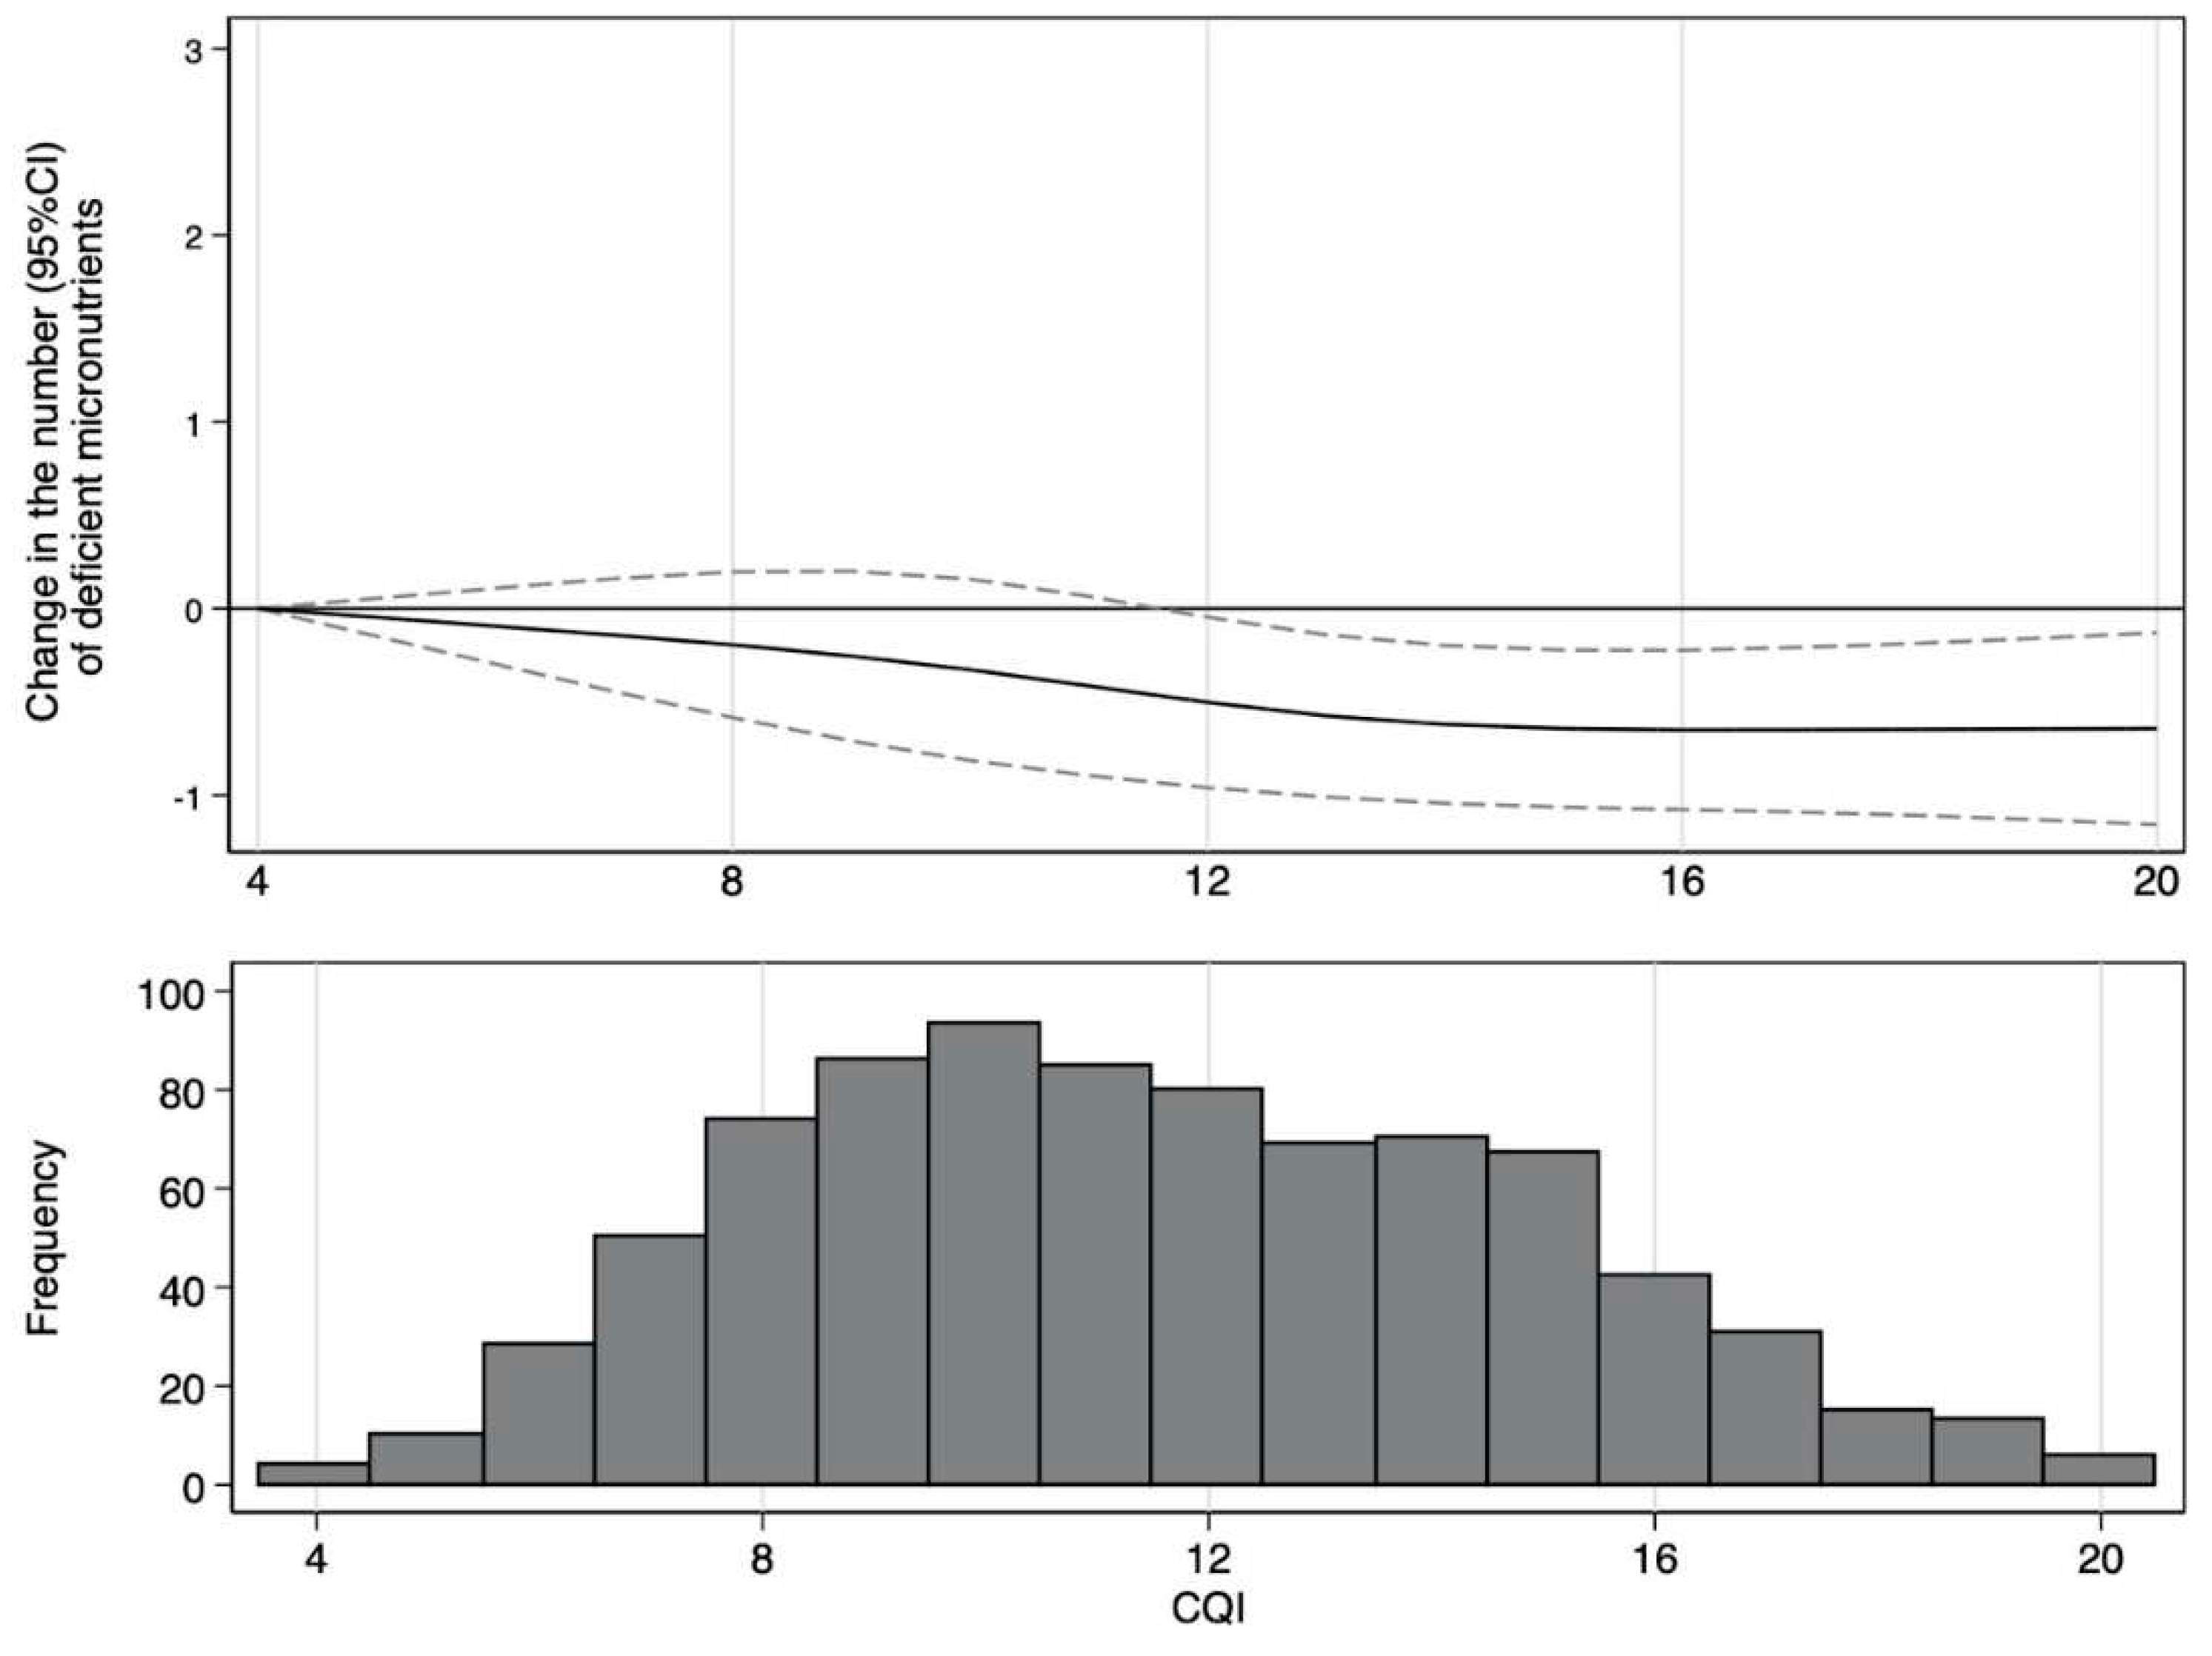
Figure 3.
Adjusted proportions (95% CI) of children with ≥ 3 micronutrient inadequacies by quartiles of CQI.
Figure 3.
Adjusted proportions (95% CI) of children with ≥ 3 micronutrient inadequacies by quartiles of CQI.
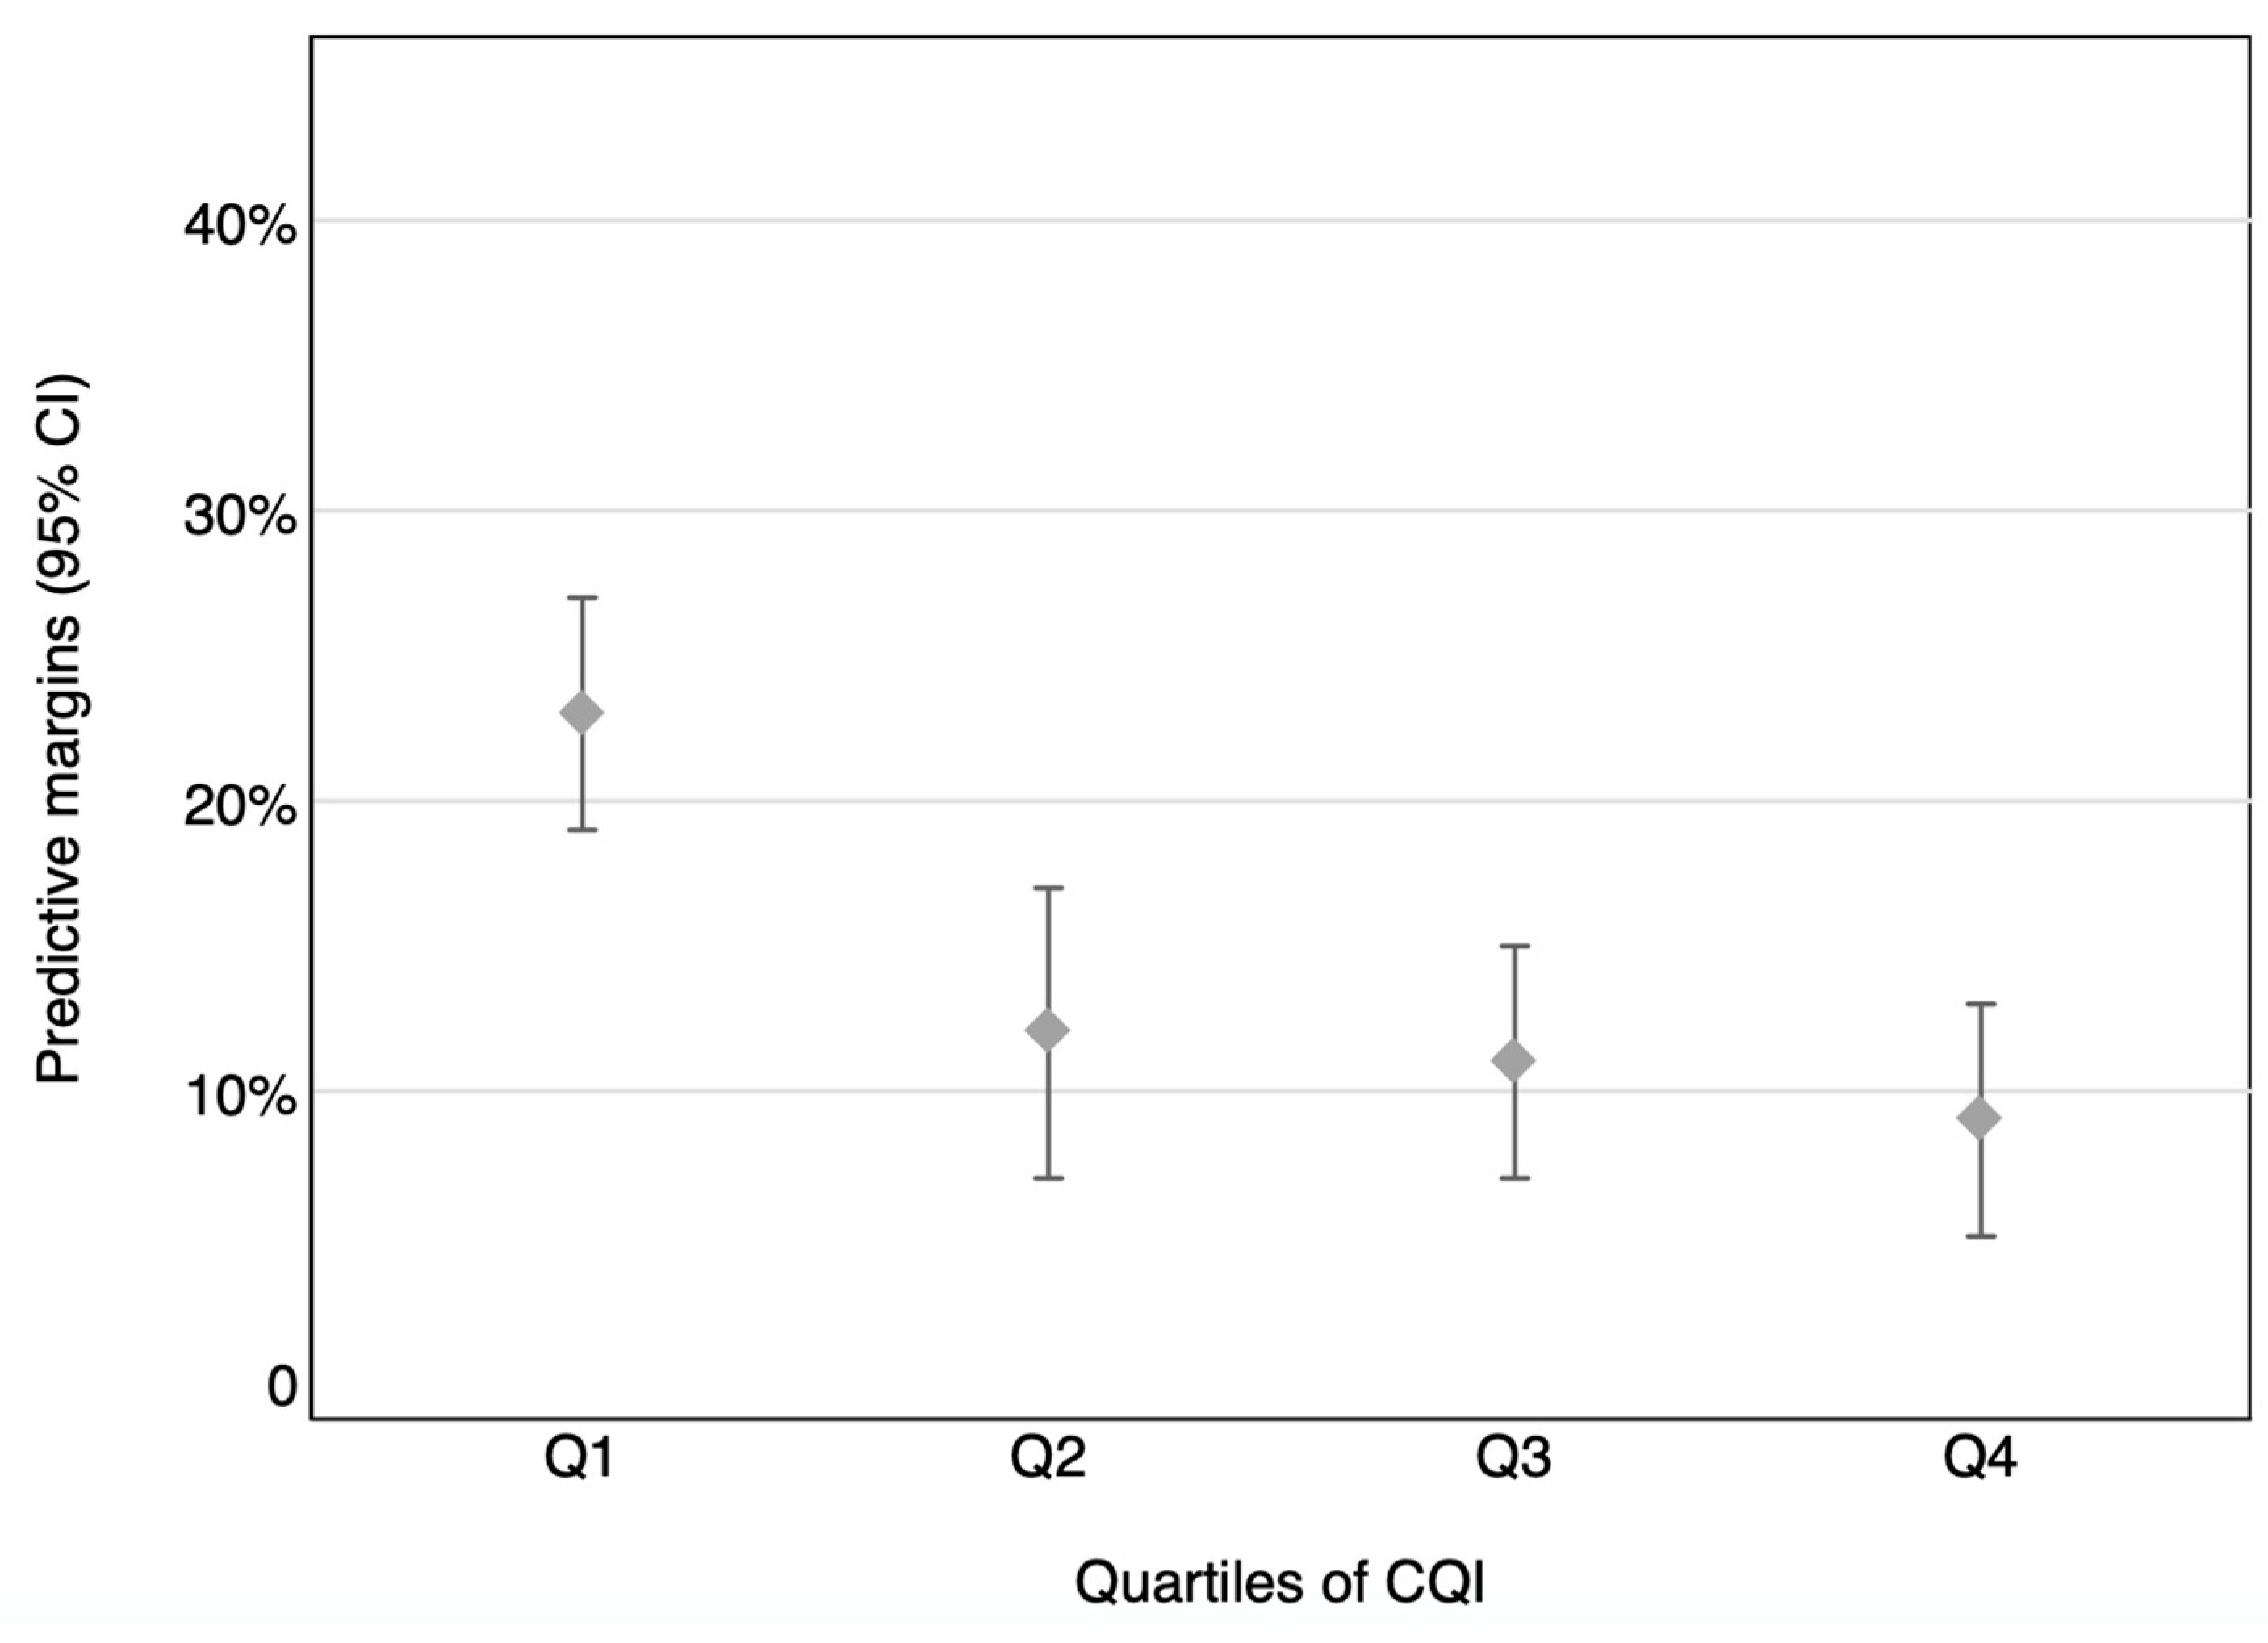

Table 1.
Characteristics of participants and their family in the SENDO project by quartiles of CQI. Numbers are mean (sd) or N (%).
Table 1.
Characteristics of participants and their family in the SENDO project by quartiles of CQI. Numbers are mean (sd) or N (%).
| CQI | |||||
|---|---|---|---|---|---|
| Q1 | Q2 | Q3 | Q4 | p for trend | |
| N | 252 | 178 | 219 | 174 | |
| Range of CQI | 4 to 9 | 10 to 11 | 12 to 14 | 15 to 20 | |
| Mother’s characteristics | |||||
| Maternal age (years) | 39.58 (4.81) | 39.93 (4.10) | 40.32 (4.19) | 39.86 (4.13) | 0.32 |
| Maternal age (years), % | 0.65 | ||||
| <35 | 33 (13.10) | 16 (8.99) | 23 (10.50) | 24 (13.79) | |
| 35-40 | 107 (42.46) | 74 (41.57) | 80 (36,53) | 64 (36.78) | |
| 40-45 | 81 (32.14) | 67 (37.64) | 92 (42.01) | 69 (39.66) | |
| >45 | 31 (12.30) | 21 (11,80) | 24 (10,96) | 17 (9.77) | |
| Maternal high education, % | 199 (78.97) | 144 (80.90) | 181 (82,65) | 145 (83.33) | 0.20 |
| Number of children, % | <0.001 | ||||
| 1 | 32 (12.70) | 17 (9.55) | 25 (11,42) | 33 (18.97) | |
| 2 | 123 (48.81) | 85 (47.75) | 125 (57.08) | 101 (58.05) | |
| 3-4 | 79 (31.35) | 63 (35.39) | 62 (28.31) | 36 (20.69) | |
| 5 or more | 18 (7.14) | 13 (7.30) | 7 (3.20) | 4 (2.30) | |
| Family of history of obesity, % | 51 (20.40) | 37 (21.02) | 45 (20.64) | 24 (14.04) | 0.16 |
| Parental attitudes towards child’s dietary habits, % | <0.001 | ||||
| Low score (<40%) | 29 (11.51) | 7 (3.93) | 3 (1.37) | 4 (2.30) | |
| Medium score (40-70%) | 116 (46.03) | 60 (33.71) | 62 (28.31) | 30 (17.24) | |
| High score (>70%) | 107 (42.46) | 111 (62.36) | 154 (70.32) | 140 (80.46) | |
| Parental knowledge about the child’s nutritional recommendations, % | <0.001 | ||||
| Low score (<40%) | 71 (28.17) | 50 (28.09) | 41 (18.72) | 24 (13.79) | |
| Medium score (40-70%) | 157 (62.30) | 110 (61.80) | 144 (65.75) | 115 (66.09) | |
| High score (>70%) | 24 (9.52) | 18 (10.11) | 34 (15.53) | 35 (20.11) | |
| Children’s characteristics | |||||
| Sex (female), % | 124 (49.21) | 93 (52.25) | 103 (47.03) | 84 (48.28) | 0.64 |
| Age (years) | 5.08 (0.86) | 5.13 (0.90) | 4.93 (0.82) | 4.83 (0.76) | <0.001 |
| Race (white), % | 242 (96.03) | 171 (96.07) | 216 (99.08) | 165 (94.83) | 0.99 |
| Gestational age (weeks), % | 0.04 | ||||
| <38 | 36 (14.34) | 25 (14.12) | 35 (16.06) | 17 (9.88) | |
| 38 to 40 | 109 (43.43) | 77 (43.50) | 81 (37.16) | 64 (37.21) | |
| >40 | 106 (42.23) | 75 (42.37) | 102 (46.79) | 91 (52.91) | |
| Birthweight (g) | 3216 (568,72) | 3211 (570,72) | 3273 (477,50) | 3250 (475.23) | 0.24 |
| Birthweight (g), % | 0.23 | ||||
| <2500 | 27 (10.76) | 20 (11.30) | 17 (7.80) | 12 (6.98) | |
| 2500-3000 | 59 (23.51) | 35 (19.77) | 43 (19.72) | 39 (22.67) | |
| 3000-3500 | 92 (36.65) | 69 (38.98) | 94 (43.12) | 70 (40.70) | |
| 3500-4000 | 60 (23.90) | 48 (27.12) | 48 (22.02) | 43 (25.00) | |
| >4000 | 13 (5.18) | 5 (2.82) | 16 (7.34) | 8 (4.65) | |
| Breastfeeding duration (months), % | <0.001 | ||||
| No breastfeeding | 49 (19.44) | 37 (20.79) | 34 (15.53) | 17 (9.77) | |
| <6 | 90 (35.71) | 50 (28.09) | 57 (26.03) | 40 (22.99) | |
| 6 to 12 | 64 (25.40) | 48 (26.97) | 58 (26.48) | 42 (24.14) | |
| >12 | 49 (19.44) | 43 (24.16) | 70 (31.96) | 75 (43.10) | |
| Child’s position among siblings, % | 0.09 | ||||
| The oldest/singletons | 70 (27.78) | 69 (38.76) | 87 (39.73) | 72 (41.38) | |
| 2nd/3, 2nd or 3rd/4 | 48 (19.05) | 36 (20.22) | 31 (14.16) | 11 (6.32) | |
| The youngest or beyond the fourth | 134 (53.17) | 73 (41.01) | 101 (46.12) | 91 (52.30) | |
| Z-score of the BMI | 0.18 (1.12) | (-)0.08 (1.14) | 0.12 (1.20) | (-)0.05 (1.10) | 0.16 |
| Nutritional Status, % | 0.08 | ||||
| Low weight | 32 (12.70) | 32 (17.98) | 34 (15.53) | 27 (15.52) | |
| Normal weight | 184 (73.02) | 123 (69.10) | 154 (70.32) | 136 (78.16) | |
| Overweight/obesity | 36 (14.29) | 23 (12.92) | 31 (14.16) | 11 (6.32) | |
| Moderate-vigorous physical activity (h/day) | 1.00 (0.70) | 1.02 (0.72) | 1.21 (0.84) | 1.26 (0.80) | <0.001 |
| Screen time (hours/day) | 1.19 (0.90) | 1.07 (0.89) | 1.14 (1.21) | 0.97 (0.70) | 0.05 |
Table 2.
Nutritional Characteristics of participants according to quartiles of CQI. Mean values and standard deviations; number of participants and percentages.
Table 2.
Nutritional Characteristics of participants according to quartiles of CQI. Mean values and standard deviations; number of participants and percentages.
| CQI | |||||
|---|---|---|---|---|---|
| Q1 | Q2 | Q3 | Q4 | p for trend | |
| n | 252 | 178 | 219 | 174 | |
| Total energy intake (Kcal/d) | 1923 (445.5) | 2143 (469.9) | 2072 (501.0) | 2042 (436.2) | 0.01 |
| Carbohydrate intake (% of TEI) | 42.84 (4.94) | 42.47 (5.11) | 43.76 (5.31) | 44.60 (5.38) | <0.001 |
| Protein intake (% of total energy) | 17.09 (1.96) | 17.09 (2.40) | 17.20 (2.18) | 16.84 (2.13) | 0.40 |
| Fat intake (% of total energy) | 40.06 (5.00) | 40.44 (5.21) | 39.04 (5.40) | 38.56 (5.33) | <0.001 |
| SFA intake (% of total energy) | 11.73 (2.13) | 11.67 (2.07) | 10.87 (2.04) | 10.28 (2.02) | <0.001 |
| PUFA intake (% of total energy) | 4.72 (1.34) | 4.70 (0.94) | 4.68 (1.03) | 4.64 (1.03) | 0.40 |
| MUFA intake (% of total energy) | 15.25 (3.32) | 15.53 (3.60) | 15.08 (3.56) | 15.46 (3.50) | 0.90 |
| Fibre intake (g/d) | 15.91 (4.19) | 20.21 (3.87) | 22.51 (5.42) | 27.17 (6.10) | <0.001 |
| KIDMED score (p50 (IQR)) | 5 (4-6) | 6 (5-7) | 7 (6-8) | 7 (6-8) | <0.001 |
| Food groups | |||||
| Vegetables (g/d) | 132.1 (79.1) | 192.7 (95.3) | 209.7 (103.8) | 254.2 (116.3) | <0.001 |
| Fruits (g/d) | 266.3 (157.6) | 333.1 (155.0) | 415.9 (216.3) | 516.2 (247.2) | <0.001 |
| Legumes (g/d) | 24.42 (12.55) | 31.51 (13.99) | 22.59 (16.61) | 42.04 (24.93) | <0.001 |
| Dairy (g/d) | 528.5 (235.3) | 518.3 (260.6) | 471.4 (225.2) | 397.3 (225.0) | <0.001 |
| Cereals (g/d) | 77.28 (37.02) | 76.73 (40.67) | 78.41 (41.59) | 74.32 (34.31) | 0.59 |
| Potatoes (g/d) | 14.69 (15.13) | 18.82 (16.93) | 20.38 (24.17) | 21.90 (17.78) | <0.001 |
| Meat (g/d) | 133.43 (42.44) | 146.15 (44.36) | 133.2 (47.17) | 119.2 (46.20) | <0.001 |
| Fish (g/d) | 30.77 (15.06) | 36.18 (17.77) | 36.75 (16.83) | 38.45 (16.38) | <0.001 |
| Nuts (g/d) | 3.08 (4.40) | 4.46 (6.00) | 5.80 (6.53) | 8.98 (11.88) | <0.001 |
| Bakery and sweets (g/d) | 77.32 (44.67) | 95.75 (71.37) | 79.44 (49.02) | 79.44 (49.02) | 0.16 |
| Sugar-sweetened beverages (g/d) | 57.67 (95.31) | 52.24 (66.83) | 37.23 (70.77) | 23.93 (39.29) | <0.001 |
| Fast Food (g/d) | 58.72 (25.69) | 64.72 (28.46) | 59.84 (31.67) | 52.33 (25.32) | 0.01 |
| Eggs (g/d) | 18.24 (11.17) | 19.83 (7.18) | 20.96 (10.90) | 20.26 (7.86) | 0.01 |
| Olive oil (g/d) | 9.96 (11.99) | 13.08 (15.92) | 9.95 (12.40) | 8.21 (11.95) | 0.05 |
| Other fats (g/d) | 3.22 (4.55) | 2.52 (3.67) | 2.48 (3.13) | 2.22 (3.43) | 0.009 |
TEI: total energy intake.
Table 3.
Energy-adjusted intake of micronutrients by quartiles of CQI. Mean (sd).
| CQI | |||||
|---|---|---|---|---|---|
| Q1 | Q2 | Q3 | Q4 | p for trend | |
| N | 252 | 178 | 219 | 174 | |
| Micronutrients | |||||
| Vitamin A (equiv Retinol) (µg/d) | 922 (26.7) | 1008 (31.7) | 1143 (28.4) | 1255 (31.8) | 0.001 |
| Vitamin C (mg/d) | 106 (3.37) | 124 (4.00) | 155 (3.59) | 184 (4.03) | 0.001 |
| Vitamin D (µg/d) | 2.98 (0.11) | 2.93 (0.13) | 3.27 (0.12) | 3.41 (0.13) | 0.002 |
| Vitamin E (mg/d) | 8.02 (0.17) | 7.83 (0.20) | 8.36 (0.18) | 9.36 (0.20) | 0.001 |
| Vitamin B1 (mg/d) | 1.40 (0.01) | 1.40 (0.02) | 1.47 (0.02) | 1.50 (0.02) | 0.001 |
| Vitamin B2 (mg/d) | 2.03 (0.03) | 2.05 (0.04) | 2.08 (0.03) | 2.02 (0.04) | 0.93 |
| Vitamin B3 (mg/d) | 33.6 (0.47) | 35.6 (0.55) | 36.6 (0.50) | 38.1 (0.55) | 0.001 |
| Vitamin B6 (mg/d) | 2.08 (0.26) | 2.21 (0.03) | 2.37 (0.03) | 2.58 (0.03) | 0.001 |
| Folic Acid (µg/d) | 262 (4.42) | 282 (5.25) | 318 (4.70) | 355 (5.27) | 0.001 |
| Vitamin B12 (µg/d) | 4.63 (0.08) | 4.63 (0.10) | 4.84 (0.88) | 4.60 (0.10) | 0.68 |
| Ca (mg/d) | 1205 (15.8) | 1155 (18.7) | 1165 (16.8) | 1137 (18.8) | 0.01 |
| I (µg/d) | 111 (1.45) | 109 (1.71) | 110 (1.54) | 107 (1.72) | 0.18 |
| Fe (mg/d) | 12.9 (0.12) | 13.6 (0.14) | 14.4 (0.13) | 15.3 (0.14) | 0.001 |
| P (mg/d) | 1667 (40.6) | 1655 (48.2) | 1788 (43.2) | 1841 (48.5) | 0.001 |
| Mg (mg/d) | 269 (2.37) | 289 (2.81) | 310 (2.52) | 341 (2.82) | <0.001 |
| Se (µg/d) | 71.0 (0.83) | 70.4 (0.99) | 73.6 (0.89) | 72.8 (0.99) | 0.03 |
| Zn (mg/d) | 9.02 (0.12) | 9.62 (0.15) | 9.95 (0.13) | 10.07 (0.15) | <0.001 |
| Cr (µg/d) | 62.3 (1.25) | 66.1 (1.49) | 67.0 (1.33) | 74.7 (1.50) | <0.001 |
| K (mg/d) | 3073 (34.4) | 3278 (40.8) | 3542 (36.6) | 3848 (41.0) | <0.001 |
| Na (mg/d) | 3060 (53.2) | 2994 (56.7) | 2886 (63.5) | 2886 (63.5) | 0.01 |
Table 4.
Odds Ratio (OR) and 95% Confidence Interval (CI) for inadequate intake of ≥3 micronutrients associated with quartiles of CQI.
Table 4.
Odds Ratio (OR) and 95% Confidence Interval (CI) for inadequate intake of ≥3 micronutrients associated with quartiles of CQI.
| CQI | p for trend | ||||
|---|---|---|---|---|---|
| Q1 | Q2 | Q3 | Q4 | ||
| n | 252 | 178 | 219 | 174 | |
| Crude | 1.00 (ref) | 0.29 (0.16-0.51) | 0.29 (0.17-0.51) | 0.27 (0.15-0.48) | <0.001 |
| Multivariate adjusted model 1 | 1.00 (ref) | 0.34 (0.17-0.67) | 0.30 (0.16-0.54) | 0.24 (0.12-0.48) | <0.001 |
| Multivariate adjusted model 2 | 1.00 (ref) | 0.33 (0.16-0.67) | 0.29 (0.15-0.54) | 0.22 (0.11-0.47) | <0.001 |
| Multivariate adjusted model 3 | 1.00 (ref) | 0.33 (0.16-0.66) | 0.28 (0.15-0.54) | 0.22 (0.10-0.48) | <0.001 |
Model 1: adjusted for sex (male vs. female), age (continuous), nutritional status (low weight, normal weight, overweight/obesity), and energy intake (continuous). Model 2: additionally adjusted for maternal age (continuous), number of children (1, 2, 3-4, 5 or more), breastfeeding duration (none, <6 months, 6-12 months, >12 months), birth weight (continuous), parental knowledge about nutritional recommendations (low, medium, and high score) for children and parental attitudes towards child’s dietary habits (low, medium, and high score). Model 3: additionally adjusted for moderate-vigorous physical activity (continuous) and screen time (continuous).
Disclaimer/Publisher’s Note: The statements, opinions and data contained in all publications are solely those of the individual author(s) and contributor(s) and not of MDPI and/or the editor(s). MDPI and/or the editor(s) disclaim responsibility for any injury to people or property resulting from any ideas, methods, instructions or products referred to in the content. |
© 2023 by the authors. Licensee MDPI, Basel, Switzerland. This article is an open access article distributed under the terms and conditions of the Creative Commons Attribution (CC BY) license (http://creativecommons.org/licenses/by/4.0/).
Copyright: This open access article is published under a Creative Commons CC BY 4.0 license, which permit the free download, distribution, and reuse, provided that the author and preprint are cited in any reuse.


