
Submitted:
09 February 2024
Posted:
12 February 2024
You are already at the latest version
Abstract
Ensuring access to water, sanitation, and hygiene (WASH) facilities, coupled with behavior change education in schools, is fundamental for fostering a conducive learning environment and promoting principles of inclusion, dignity, and equality. This study focuses on 12 primary schools in Anápolis, Brazil, encompassing 4,394 students and 248 teachers. WASH assessments were conducted through a questionnaire, observation of water and sanitation facilities and structures, and microbiological analysis. Over the period 2018 to 2020, the proportion of schools with safely managed drinking water surged from 42% to 92%. However, sanitation conditions in the schools were categorized as a basic level, with hygiene services rated as limited in 92% of the schools due to the absence of soap. While this study reveals that Anápolis schools generally align with WASH guidelines for basic/advanced drinking water services, there is a crucial need for enhancements in both hardware and software facilities to address sanitation and hygiene challenges.
Keywords:
drinking water
; human rights
; SDG 6
; services ladders
; wash in schools
1. Introduction
Population growth and increased contamination of aquatic ecosystems are factors that must be monitored to achieve better drinking water distribution [1]. During the Millennium Development Goal (MDG) period, international monitoring of water, sanitation, and hygiene (WASH) services in developing countries relied predominantly on household surveys identifying access to “improved” and “unimproved” services. However, these indicators fell short of the key health-based conditions that the MDG water and sanitation targets sought to encourage [2].
The beginning of the Sustainable Development Goal (SDGs) period offers an opportunity to learn from these limitations to better align indicators and measures with intended outcomes [2]. The safe management of WASH services is not yet widespread in the so-called poorest areas of the world; think that, as reported by UNICEF/WHO (2019) [3], in 2017,673 million people still defecated in the open and 435 million people used unimproved water sources. What has been said makes it clear that nowadays a quality water service is still not guaranteed in many areas of the world; a situation worsened by increasingly incisive climate change, which brings with it, among other problems, water scarcity.
It is in this context that this work, attributable to targets 6.1, 6.2, and 6.3 of SDG 6 and target 4a of SDG 4, is of fundamental importance to guarantee better access for the school community to basic services essential for health, such as safe drinking water, soap for handwashing, clean bathrooms, sewage collection, and treatment.
Thus, water treatment and water supply systems are projected for supplying drinking water, and wastewater drainage, treatment and reuse includes structures, equipment and services designed for the treatment, disposal and reuse of human urine and feces. These facilities and hygiene are the key points of the Sustainable Development Goal n.6 [4]. According to Bain et al., (2018) [5] there are some limitations to SDG monitoring approaches: (i) direct measurement of water quality; (ii) use of a binary indicator that reflects a poor range of services for people; (iii) emphasis on national media without taking into account the most marginalized members of society; (iv) failure to consider the levels of treatment of reclaimed water.
From then on, the global effort to achieve sanitation and water for all by 2030 extends beyond the household to include institutional settings, such as schools, healthcare facilities, and workplaces. This has been reinforced by global education for all strategies highlighting how WASH in schools improves access to education and learning outcomes, particularly for girls, by providing a safe, inclusive, and equitable learning environment for all [4]. According to the UNICEF/WHO evaluation in 2021, access to basic drinking water services (water from a good source available at the school) varied from 46% in low-income countries to 100% in high-income countries. For basic sanitation services, the coverage ranged from 47% in low-income countries to 100% in high-income countries. Hygiene services were particularly challenging in low-income countries, with only 23% of schools having soap and water for handwashing [6].
For the first time, the global policy agenda includes early childhood education as an unambiguous priority. SDG 4 calls for “quality … pre-primary education” for all children to achieve universal, inclusive, equitable education; prepare children for school; and promote life-long learning. SDG target 4a calls for “safe, non-violent, inclusive and effective learning environments,” and indicator 4.a.1 calls for appropriate sanitation and handwashing facilities, as well as access to drinking water [7].
According to UNICEF/WHO (2019) [8], having water, sanitation, and hygiene facilities in schools has various clear advantages. Having a safe water supply and encouraging regular drinking improves cognitive performance. Implementing good hand hygiene helps lower the risk of diseases, keeping children healthy and reducing absenteeism. Additionally, having accessible and suitable toilets enhances well-being and improves concentration during classes. Specific obligations about access to safe drinking water and sanitation have also increasingly been recognized in core human rights treaties, mainly as part of the right to an adequate standard of living and the right to health.
At the international level, the human right to water and sanitation was established by the 2010 United Nations General Assembly with resolution A/RES/64/292. Considering the worrying situation of people without access to drinking water and sanitation, which in 2010 represented 884 million and 2.6 billion, respectively [9], the resolution recognizes equitable access to drinking water and sanitation as an integral component of access to all human rights. It confirms the responsibility of States as promoters and protectors of such rights.
Human rights indicators were developed to monitor specific legal norms. They reflect and measure all human rights elements to water and sanitation, including availability, accessibility, quality, affordability, and acceptability. A health-based approach using water service levels was proposed in 2003, and a human rights-based approach was adopted in 2008 [2]. Thus, the Joint Monitoring Programmer (JMP) has developed service ladders for WASH in schools to make it easier to benchmark and compare progress across countries. These service ladders build on the classification of facilities into improved and unimproved types, which are primarily designed to track progress towards a basic level of drinking water, sanitation, and hygiene service, which is the indicator selected for global monitoring of progress towards the WASH-related SDG targets in schools.
Multi-level service ladders for monitoring WASH in schools (Figure 1) allow countries at different development stages to track and compare progress in reducing inequalities. There are separate ladders for drinking water, sanitation, and hygiene. Within each category, the core service ladders include three levels: no service, limited service, and basic service, where the “basic” service threshold corresponds to the SDG indicator for Target 4a.
In countries where achieving a “basic” level of service is not seen as an ambitious goal and there are extra resources for monitoring, we propose an additional “advanced” service level. This level is determined by human rights criteria, including availability, accessibility, quality, affordability, and acceptability.
The Human Right to Water and Sanitation in Brazil
Brazil successfully met the Millennium Development Goals (MDG) by cutting in half the percentage of the population without access to clean drinking water by 2015. As the Sustainable Development Goals (SDGs) were introduced, focus turned to addressing the most urgent areas lacking services or having low-quality services, along with addressing inequalities between rural and urban areas [10]. Despite compliance with MDG 7 for drinking water, official indices and data available in the National Health Information System (NHIS), prepared by the Ministry of Cities, demonstrate that, from 1995 to 2015, access to drinking water and services sanitation sector made progress, but from 2016 to 2019 it stagnated, as can be seen in Table 1 and Table 2 [10]. In terms of drinking water supply, there was stagnation in the provision of this essential service, from 2016 to 2018, and even a reduction in investments, from 5.9 billion in 2016 to 5.5 billion in 2017.
Between 1995 and 2015, the portion of people connected to wastewater collection grew from 18.5% to 48.6%, accompanied by a rise in investments from 41.5 million to 5.2 billion. Yet, similar to drinking water, the numbers for people served and wastewater treated stayed the same from 2016 to 2019. Additionally, investments decreased from 4.2 billion in 2016 to 3.8 billion in 2017
Despite the increase in financial resources for the WASH sector between 2000 and 2015 (MDG period), a human rights approach is necessary to better address the inequalities and critical issues that still exist between regions, mainly in the North and Northeast of Brazil. Low investments in drinking water supply and sewage treatment have a direct impact on the quality of life and health of Brazilians, especially for the 40 million without access to treated water and more than 99 million without sewage collection and treatment [10].
In 2013, the National Plan for Basic Health Services (PLANSAB) was approved with objectives for a time horizon of 20 years (2013 to 2033), the PLANSAB has 29 objectives, with eight indicators for water supply, six for wastewater, and eight for municipal solid waste. The plan prioritizes eliminating open defecation, achieving universal access to safely managed water, and achieving at least 92% access to safely managed sanitation by 2033. Additionally, according to the plan, expanding access to WASH helps reduce regional and local inequalities [11]. PLANSAB includes adequate water, sanitation, and hygiene in institutions and, therefore, in schools. Even in the school context, disparities must be taken into account and greater attention must be given to the most vulnerable groups: the poor, favela residents, indigenous populations, ethnic minorities, and rural populations [12].
According to JMP estimates, 39% of Brazilian schools do not have basic handwashing facilities [13]. Disparities are visible between private schools, which have more than twice the coverage, public schools, and between regions. For example, only 19% of public schools in the state of Amazonas have access to a water supply, compared to the national average of 68%. In the sanitation sector, the situation is even more dramatic, with some northern states registering less than 10% of schools with access to sewage collection and treatment [14]. The state of Acre has only 9% of public schools with access to the sewage network. In the state of Amapá, only 5%, and in Rondônia, 6% [14].
Schools with well-built sanitation and water supply systems enhance learning, safeguard students from illnesses like diarrhea, lower dropout rates, and improve students’ overall quality of life. Hence, the novelty of this work is centered in the evaluation of crucial aspects of water supply and sanitation, including solid waste disposal and hygiene, vital for health and human development, that have been overlooked in numerous schools globally, including those in Brazil.
Therefore, this research aimed to evaluate the level of WASH services in 12 public schools (including students and teachers) of the municipality of Anápolis (Brazil) compared with the global level to improve the management of these services and implement good WASH management practices in schools.
2. Materials and Methods
The assessment of the WASH services level demands a careful study of water quality, toilet facilities, handwashing with soap, disposal of wastewater, and responsibility for maintenance and repair of the school’s water and sanitation system.
2.1. Study Site
Anápolis is a Brazilian municipality located in the central-western region of Brazil in the State of Goiás. It is situated between Brasilia and Goiania and has become the state’s industrial center, mainly in the pharmaceutical sector. The city has more than 398 thousand inhabitants [15]. The education census shows that in Anápolis there are 143 public schools with 63,250 students, of which 100 are municipal with 32,175 35,750 students and 43 do not have a public wastewater collection and treatment system [16].
For this study, twelve public primary schools from Anápolis (Brazil) were selected, nine urban and three rural schools covering 4,394 students and 248 teachers. The criteria used to select the institutions was the geographic distribution seeking to cover the north, south, east, and west regions, as shown in Figure 2.
2.2. Data Collection
Before beginning the study, all participating schools needed to sign a Consent Form, agreeing to the collection of data and water samples for microbiological analysis. The research received approval from the Municipal Secretary of Education in Anápolis.
The research was carried out over 24 months and two WASH evaluations were carried out, one at the beginning of the project and another at the end, to compare the results and verify whether the actions implemented in schools had significant effects. Each school was visited six times: four times to collect water for microbiological analysis and twice to assess WASH services.
2.3. Data Collection Instrument
The WASH assessment was made using several tools for collecting valid information on water, sanitation, and hygiene services. The data were collected through structured observations of the facilities, using a questionnaire developed according to the recommendations of the World Health Organization (WHO) and UNICEF: WASH in Schools Monitoring Package and Core questions and indicators for monitoring WASH in Schools in the Sustainable Development Goals [4]. The questionnaire consisted of six blocks divided into general information about the school; water management (17 questions); sanitation (13 questions), hygiene (14 questions), waste disposal (9 questions), and operation and maintenance (10 questions).
The questionnaire focused on key WASH issues, including general information on the school, main water sources, functionality and quality, accessibility for youngest children and physical disabilities, handwashing facilities, cleanliness and accessibility of toilets and availability of soap, operation, and maintenance of systems, and disposal waste. It also seeks to generate important insights into the needs for improvement and appropriate maintenance of the schools, considering not only standard provision of hardware such as WASH infrastructure but also aspects that affect pupils’ and hinder acceptability, such as cleanliness, safety, privacy, and provision of consumables. Data were tabulated using the Excel software.
2.4. Microbiological Analysis
Microbiological analysis of water was carried out according to the criteria of the “Practical Manual of Water Analysis of the National Health Foundation” (FUNASA, 2006). The analysis were performed in the microbiology laboratory of the State University of Goiás (UEG) for detecting fecal coliforms (E. coli). The method used was the most probable number (MPN) of total coliforms (CT) and E. coli, which uses multiple tube method, according to APHA (2017) [17]. The presumptive detection of CT was performed in Lactated Broth and confirmed in Brilliant Green Broth and 2% Bile. The detection of E. coli was carried out in E.C. Broth, selective for the growth of Escherichia coli. The samples were incubated at 35 ± 2 °C for 48 hours and 44.5 ± 0.2 °C for 24 hours in the CT and E. coli assays, respectively. Positive tube results were interpreted according to the MPN/dL table.
In the first year, to standardize the samples, water was collected in the morning period, on the first tap on the right side of the drinking fountain and the main kitchen tap. In the second year, the water was collected at four points (water entry point at school, point of exit from the water storage tank, drinking water fountain, and kitchen main tap) to evaluate schools contamination.
3. Results and Discussion
The total number of students from the twelve schools was 4,394 (47% female), aged between six and fifteen. There were 58 students with physical disabilities (1.25%). The number of teachers was 248 (92% are female).
3.1. Drinking Water
The United Nations General Assembly declared safe and clean drinking water and sanitation a human right essential to the full enjoyment of life and all other human rights [9]. The SDG indicator 4.a.1 ‘percentage of schools with drinking water available from improved source’ defines the basic drinking water service, where an improved source is a water delivery point that by nature of its construction or through active intervention, is protected from outside contamination, particularly fecal matter. This includes piped water, public taps, protected dug wells, protected springs, etc.
To meet the SDG criteria for a basic service, schools must have access to an improved source. Schools with access to an improved source but no water available at the time of the survey are categorized as having a limited service. Schools using an unimproved source or with no source at all are classified as having no service. Adams, et al. (2009) [18] recommend a secure water point accessible for staff and schoolchildren, including those with disabilities, at all times. The following ratios have to be observed: one water point for 12 students of preschool level; one water point for 20 students above a preschool level and one water point for 10 staff members.
In Anápolis, all schools had an improved drinking water source, located on the premises of schools, accessible to all when needed and available in insufficient quantities in the schoolyard. The average student-by-drinking water points ratio was 81:1. Despite having insufficient drinking fountains, water is available at all times in 100% of schools in quantity sufficient (Table 3).
The research showed that urban schools use public networks as an improved source while two rural schools use protected dug wells and one rural school uses both protected dug wells and piped networks. All schools have their water storage containers in ferrocement or polyvinyl chloride (PVC), with capacities of 2000 to 5000 liters that are cleaned by the municipal authorities in January and July months. In 10 schools (83,3%) the drinking water storage containers were properly covered. The storage tank properly covered means that the cover must avoid mosquito breeding, including species that transmit zica and dengue virus, and help to prevent fecal contaminants and sunlight, which will promote algal growth, from reaching the water.
The water is used for drinking, handwashing, food preparation, and pour-flushing toilets. The water supply is functional all day and provides enough water for the needs of the school, four schools (33,3%) have as alternative water sources truck tankers. All urban schools receive chlorinated water directly from the water supply company and on school premises, the water is treated by filtration. In rural schools, water does not undergo a chlorination process before being used, and the only method of treatment is the activated carbon filter of drinking fountains.
In addition, the directors have informed that the water source of the school (dug well) was of good quality and safe to drink. Students in all schools drink water from a drinking fountain that has an activated carbon ceramic filter. It was noted that 50% of schools exchanged the filter twice a year, 33% exchanged it once a year, and 17% never exchanged the filter for a drinking fountain. The height of the taps is adapted for children with physical disabilities and the youngest children. Some students bring drinking water from home to 50% of schools because the water tastes bad to them.
Figure 3 shows that 100% of schools surveyed in Anápolis had drinking water available from an improved source, availability, and accessibility to children with disabilities and younger. However, only 25% of schools had an alternative water supply.
The accessibility of water is directly related to availability and ease of access, including for people who face specific barriers, and will have an impact on people’s health, work, education, and dignity. Access to safe drinking water is a fundamental precondition for the enjoyment of several human rights, including the rights to education, housing, health, life, work, and protection against cruel, inhuman, or degrading treatment or punishment. It is also a crucial element to ensure gender equality and eradicate discrimination [19].
In the first year, a microbiological analysis carried out in drinking fountains revealed that seven out of twelve schools (42%) had water contaminated by E. coli. In the 20th month, schools’ water storage tanks were washed by the city hall and eleven schools changed the drinking fountain filters. Microbiological analyses carried out in the 22nd month showed that 8% of schools, one rural identified the presence of E. coli in the water. Therefore, the school was classified as providing a basic drinking water service. Between the first and second year, the proportion of schools using safely managed drinking water increased from 42% to 92%, and the ‘percentage of schools with drinking water storage tank properly covered’, increased from 83% to 100%. These indicators define the advanced and safely managed drinking water service, where the indicator for microbiological quality is E. coli. This increase was due to good practices implemented in hardware management such as replacing damaged water tanks and cleaning them and replacing drinking fountain filters every 6 months.
According to the UNICEF/WHO global report (2022) [6], the worldwide availability of basic drinking water in schools increased slightly from 70% to 71% between 2015 and 2021. In Brazil, data from the Ministry of Education census [16] indicates that only 8% of schools have their water supply, and the public water network reaches just 71% of schools. However, in Anápolis, the research revealed that all schools (100%) have access to basic drinking water services. By the second year of the project, 92% of schools achieved an advanced level, ensuring safe water without microbiological contamination.mSecuring the microbial safety of drinking water supplies is based on the use of multiple barriers, including source water protection and appropriate treatment processes, as well as protection during storage and distribution.
3.2. Sanitation
The guideline WHO edited by Adams et al. (2009) [18] defines one toilet for 25 girls and one for female staff; one toilet plus one urinal for 50 boys, and one for male staff. The toilets should be easily accessible to all, including staff and children with physical disabilities, male and female toilets should be entirely separated, and handwashing stations that include soap and water. Toilets should provide privacy and security and should be hygienic to use and easy to clean. The indicator proportion of schools with a basic sanitation service’ defines schools with improved sanitation facilities, single-sex and usable. Improved sanitation facilities in schools are those that effectively separate excreta from human contact and ensure that excreta does not re-enter the immediate environment. Schools with improved sanitation facilities that are either not usable or not single-sex are classified as providing a limited service [4].
The twelve schools evaluated had improved sanitation facilities. In 58% of schools, wastewater is disposed of in the septic tank (on-site system). While 42% of the wastewater is collected and treated in a sewage station (off-site system). This data is no different from the school census where in Brazil, 47% of schools have a sewage collection system, 50% use a septic tank and 5% do not have any form of treatment for the sewage generated [16]. Regarding sewage treatment, 58% of schools sent wastewater to septic tanks and 100% did annual maintenance on tanks. All schools had a drainage system for removing ‘gray water’ from handwashing stations. However, the rural schools had no system for removing rainwater from the school grounds.
Solid waste is collected twice a week and sent to the landfill. Only in one school there is a selective waste collection, in the other, there are containers for selective collection, but recyclable materials are not separated. In Brazil, 77% of schools have garbage collection and 23% still burn garbage as a form of recycling [16]. Irregular incineration and clandestine burning of domestic solid waste produce gases that are rich in potentially toxic substances, in addition, these components are associated with some respiratory, reproductive, and oncogenic clinical manifestations with a high impact on the health of the population.
All schools evaluated had toilet facilities separate by gender and not shared with teachers. The number of toilets for students was insufficient in 100% of schools. In the twelve schools, there was a total of 76 toilets and 4394 students 2098 girls and 2296 boys. The ratio between the number of girls and boys and the number of bathrooms was 53:1 and 62:1, respectively. In the first year, 58% of school bathrooms were observed to be inadequate for use. Typical problems were defective flush handles, toilets in disuse due to defects, and lack of hygienic conditions (dirty toilets, strong odor at the time we visited). These schools were classified as limited services. The other schools (42%) were classified as basic service level (see Table 4).
Cleaning the school environment is an important strategy for the health and permanence of students in schools. This requires the school manager to have basic materials available for regular cleaning and disinfection of the school environment, including bathrooms, classrooms, canteens, and courtyards. In Anápolis, during the visit, it was noticed that 58% of schools didn’t have liquid detergents and soap for cleaning. The directors mentioned that they receive limited funding, and sometimes they can’t afford to purchase necessary materials.
After the data was presented to the secretary of education and principals, they committed to improving the cleanliness of the bathrooms and the city hall made some repairs to the bathrooms and all schools were classified as basic service for sanitation service. WASH assessment in Anápolis showed that coverage of basic sanitation services varied widely in the first and second years of the research, increasing the proportion of schools with improved sanitation facilities by 58 percentage points (42% to 100%), (Table 4), thanks to good management practices implemented in schools.
Looking at accessibility, 58% of schools had no toilets accessible to children with disabilities and 25% had no toilets available designed for younger children. This implies that these students cannot use the services independently, respecting dignity and privacy. The Brazilian Educational Census [16] shows that the percentage of schools with accessible sanitation facilities for students with disabilities has increased rapidly in the last decade, from 7% in 2005 to 42% in 2019. Between 2009 and 2016, the percentage of schools with accessible toilets for young children doubled, from 27% to 49%. The same trend occurs in Anápolis, Figure 4 shows that the proportion of schools with accessible toilets for disabled children increased from 42% to 83%.
The JMP suggests that in 2016, 335 million girls went to school without access to water and soap for washing their hands, bodies, and clothes. In addition, over 620 million girls and boys worldwide lack a basic sanitation service at their schools [4].
3.3. Hygiene and Education
Hygiene is inevitably linked to water and sanitation as a means to break the transmission of dangerous micro-organisms from feces to mouth through dirty fingers, flies, food, floor (soil), and fluids (water). Sanitation reduces the first contact, water treatment reduces the transmission line through water and hygiene reduces transmission through other paths. Hygiene education and effective use of handwashing facilities are more effective for good health than water supply improvement [20].
The indicator “Proportion of schools with basic handwashing facilities” defines the percentage of primary and secondary schools with a handwashing facility with soap and water in or near sanitation facilities. According to Adams et al. (2009) [18], the following ratios have to be observed for handwashing stations:
- -
- 1 sink for 8 students of preschool level;
- -
- 1 sink for 15 students above a preschool level;
- -
- 1 sink for 15 staff members.
100% of schools in Anápolis had handwashing (HW) stations available in insufficient quantities, the average students by HW points ratio was 46:1 (Table 5). In addition, in 25% of the schools, sink faucets were not working properly in some cases, leaks were causing flooding of bathroom floors.
The toilets were renovated/built and the ratio between the number of students and the handwashing station dropped to 40:1, but it is still not enough to meet the UNICEF criterion of 15:1. 42% of the schools had no HW station accessible to children with disabilities and 33% had no HW points available designed for younger children. Regarding the flooding of the floors, the directors replaced the broken taps. Soap was not available in 100% of the schools, which represents an important risk of diarrheal disease contamination. These schools were classified as limited services because they provide water, but there is no soap available for handwashing.
In the second year of research, only 8% of schools had soap available at the time of the survey. This highlights the challenge of maintaining handwashing facilities so that soap and water are available to students for handwashing at critical times, for example, before eating and after using the toilet. About hygiene education, 50% of school coordinators said it is taught as a component of the basic curriculum (for example, in science classes), 33% as an integral part of a special module on healthy living and life skills, and 17% are taught sporadically. In 67% of schools, it was possible to check the hygiene education material, which stressed the importance of handwashing with soap at critical times as after defecation and before eating.
All principals replied that there is a designated period allotted for students to wash their hands before eating. However, this period was observed in only four schools (33%). There is a de-worming program for children in all schools once during the year and in 100% of schools, there was no program on menstrual hygiene for girls.
In Anápolis, the percentage of schools with handwashing facilities accessible to children with disabilities increased from 42% to 75% (Figure 5). Education is widely recognized as a fundamental human right. Children with disabilities have historically been excluded from educational opportunities but under international law, they have a right to education without discrimination and based on equal opportunities.
In 2020, 47% of schools in Brazil had sanitation facilities accessible to students with limited mobility, but coverage was much lower in rural schools (20%) than in urban schools (60%), and in pre-primary schools (41%) than in secondary schools (67%). However, the biggest gap in accessibility is between Federative districts: just one in six schools in Amazonas have accessible toilets, compared with nine out of ten schools in the capital Distrito Federal [6].
Inaccessible WASH facilities in schools prevent, mainly, girls and women with disabilities from participating fully in social and economic life, besides being, the barrier to school attendance. During the research conducted in Anápolis, it was observed that children washed their hands after using the bathroom and only 32% washed their hands. Furthermore, the soap was absent in 92% of schools. A major recommendation from this study is that far greater emphasis is needed on handwashing with soap before eating and after using the toilets.
Water quality in schools is not normally monitored and general maintenance of the water supply equipment remains an important issue. The promotion of good hygiene practices through the display of messages as posters was uncommon in all schools surveyed. It is common sense that improving hygiene is mainly achieved through education, leading to behavioral change.
However, good hygiene behavior and the effectiveness of hygiene promotion in schools are severely limited where water supply and sanitation facilities are inadequate or nonexistent. Teachers cannot credibly convey the importance of handwashing if there is no water or soap in the school, or promote the proper use of toilets if they avoid their use because the toilets are dirty or unsafe [18].
4. Conclusion
This study demonstrated that schools in Anápolis do conform to WASH guidelines for basic drinking water service. However, for sanitation and hygiene, it will be necessary to improve the hardware and software facilities. Lack of funds was a major hindrance to the proper maintenance (repair or improvement) of WASH facilities. Furthermore, the principals and staff of schools are not aware of the importance of good management of the WASH services.
Therefore, is necessaire not only hardware interventions such as the exchange of filters, increasing the quantity of bathrooms, and making soap available in all schools, but also software interventions like the creation WASH evaluation committee, workshops on WASH for staff and teachers, besides awareness campaign about hygiene for students. The data collected in this research can be used to facilitate political dialogue between school managers, education administrators, decision-makers, and general society to improve the management of WASH services. The results described here can also be used in future research to observe progress in the implementation and maintenance of WASH services in schools of Anápolis.
Acknowledgments
The SIPEC Foundation, CeTAmb, Instituto 4eles, Stateal University of Goiás, Aqualit Saneamento, and Arquitetura Viva are gratefully acknowledged for their support of this research. The authors are very grateful for the support granted by the Research Unit GeoBioTec, through the project reference UIDB/04035/2020, funded by the Fundação para a Ciência e a Tecnologia, IP/MCTES through national funds (PIDDAC).
References
- J. Sátiro, A. Cunha, A. P. Gomes, R. Simões, and A. Albuquerque. Optimization of Microalgae–Bacteria Consortium in the Treatment of Paper Pulp Wastewater. Applied Sciences. 2022, 12, 5799. [CrossRef]
- E. Thomas, A. L. Andrés, C. Borja-Vega, and G. Sturzenegger. Innovations in WASH Impact Measures Water and Sanitation Measurement Technologies and Practices to Inform the Sustainable Development Goals, 2018.
- 3. World Health Organization. Surveillance of water, sanitation, and hygiene in schools: A practical tool. World Health Organization and United Nations Children’s Fund. 1–115, 2019.
- UNICEF and WHO. Core questions and indicators for monitoring WASH in Schools in the Sustainable Development Goals. 2018.
- R. Bain, R. Johnston, F. Mitis, C. Chatterley, and T. Slaymaker. Establishing sustainable development goal baselines for household drinking water, sanitation, and hygiene services. Water (Switzerland). 10, 2018. [CrossRef]
- UNICEF and WHO. Progress on drinking water, sanitation, and hygiene in schools: 2000-2021. vol. 33, 2023.
- J. T. Wagner and I. Pramling Samuelsson. WASH from the START: Water, Sanitation and Hygiene Education in Preschool. International Journal of Early Childhood. 2019, 51, 5–21. [CrossRef]
- WHO/UNICEF. Surveillance of water, sanitation, and hygiene in schools: A practical tool. World Health Organization and United Nations. 2019, 1–115.
- WHO/UNICEF. Progress on drinking water, sanitation, and hygiene: 2017. World Health Organization and United Nations. 2017.
- BRASIL 2019. Ministério do Desenvolvimento Regional. Secretaria Nacional de Saneamento. Plansab: documento em revisão submetido à apreciação dos conselhos nacionais de saúde, recursos hídricos e meio ambiente. Brasília, 240p.
- C. M. M. Dias, L. P. Rosa, J. M. A. Gomez, and A. D‘avignon. Achieving the sustainable development goal 06 in Brazil: The universal access to sanitation as a possible mission. Anais da Academia Brasileira de Ciencias. 2018, 90, 1337–1367. [CrossRef]
- Brasil. Plansab: documento em revisão submetido à apreciação dos conselhos nacionais de saúde, recursos hídricos e meio ambiente. 2019.
- WHO and JMP. Progress on drinking water, sanitation, and hygiene: special focus on inequalities. 2020.
- IBGE. 2019. Censo Escolar da Educação Básica 2018. Brasília. MEC/INEP. https://ces.ibge.gov.br/base-de-dados/metadados/inep/educacao-basica.html.
- IBGE. 2022. Censo demográfico. Brasil Instituto Brasileiro de Geografia e Estatistica Brasília. <https://cidades.ibge.gov.br/brasil/go/anapolis/panorama> (Accessed January 2023).
- MEC/INEP 2019. Censo escolar da educação básica 2019. Brasilia: MEC, 2019. Disponível em < https://qedu.org.br/municipio/5201108-anapolis/censo-escolar > (Accessed January 2023).
- APHA. Standard Methods. Encyclopedia of Forensic Sciences: Second Edition. 2017, 522–527.
- Adams, J., Simms, J., Chartier, Y., Bartram, J. & Organization, W. H. Water, Sanitation and Hygiene Standards for Schools in Low-Cost Settings. 2019. World Health Organization, Geneva, Switzerland.
- UN - UNITED NATIONS (2010). Office of the High Commissioner for Human Rights (OHCHR). Fact Sheet No. 35, The Right to Water, August 2010, No.35, available at: <https://www.refworld.org/docid/4ca45fed2.html> (Accessed 5 May 2022).
- H. Waddington, B. Snilstveit, H. White, and L. Fewtrell. Water, sanitation, and hygiene interventions to combat childhood diarrhea in developing countries. 2009.
Figure 1.
New JMP service ladders for monitoring WASH in schools in the SDGs [4].
Figure 1.
New JMP service ladders for monitoring WASH in schools in the SDGs [4].
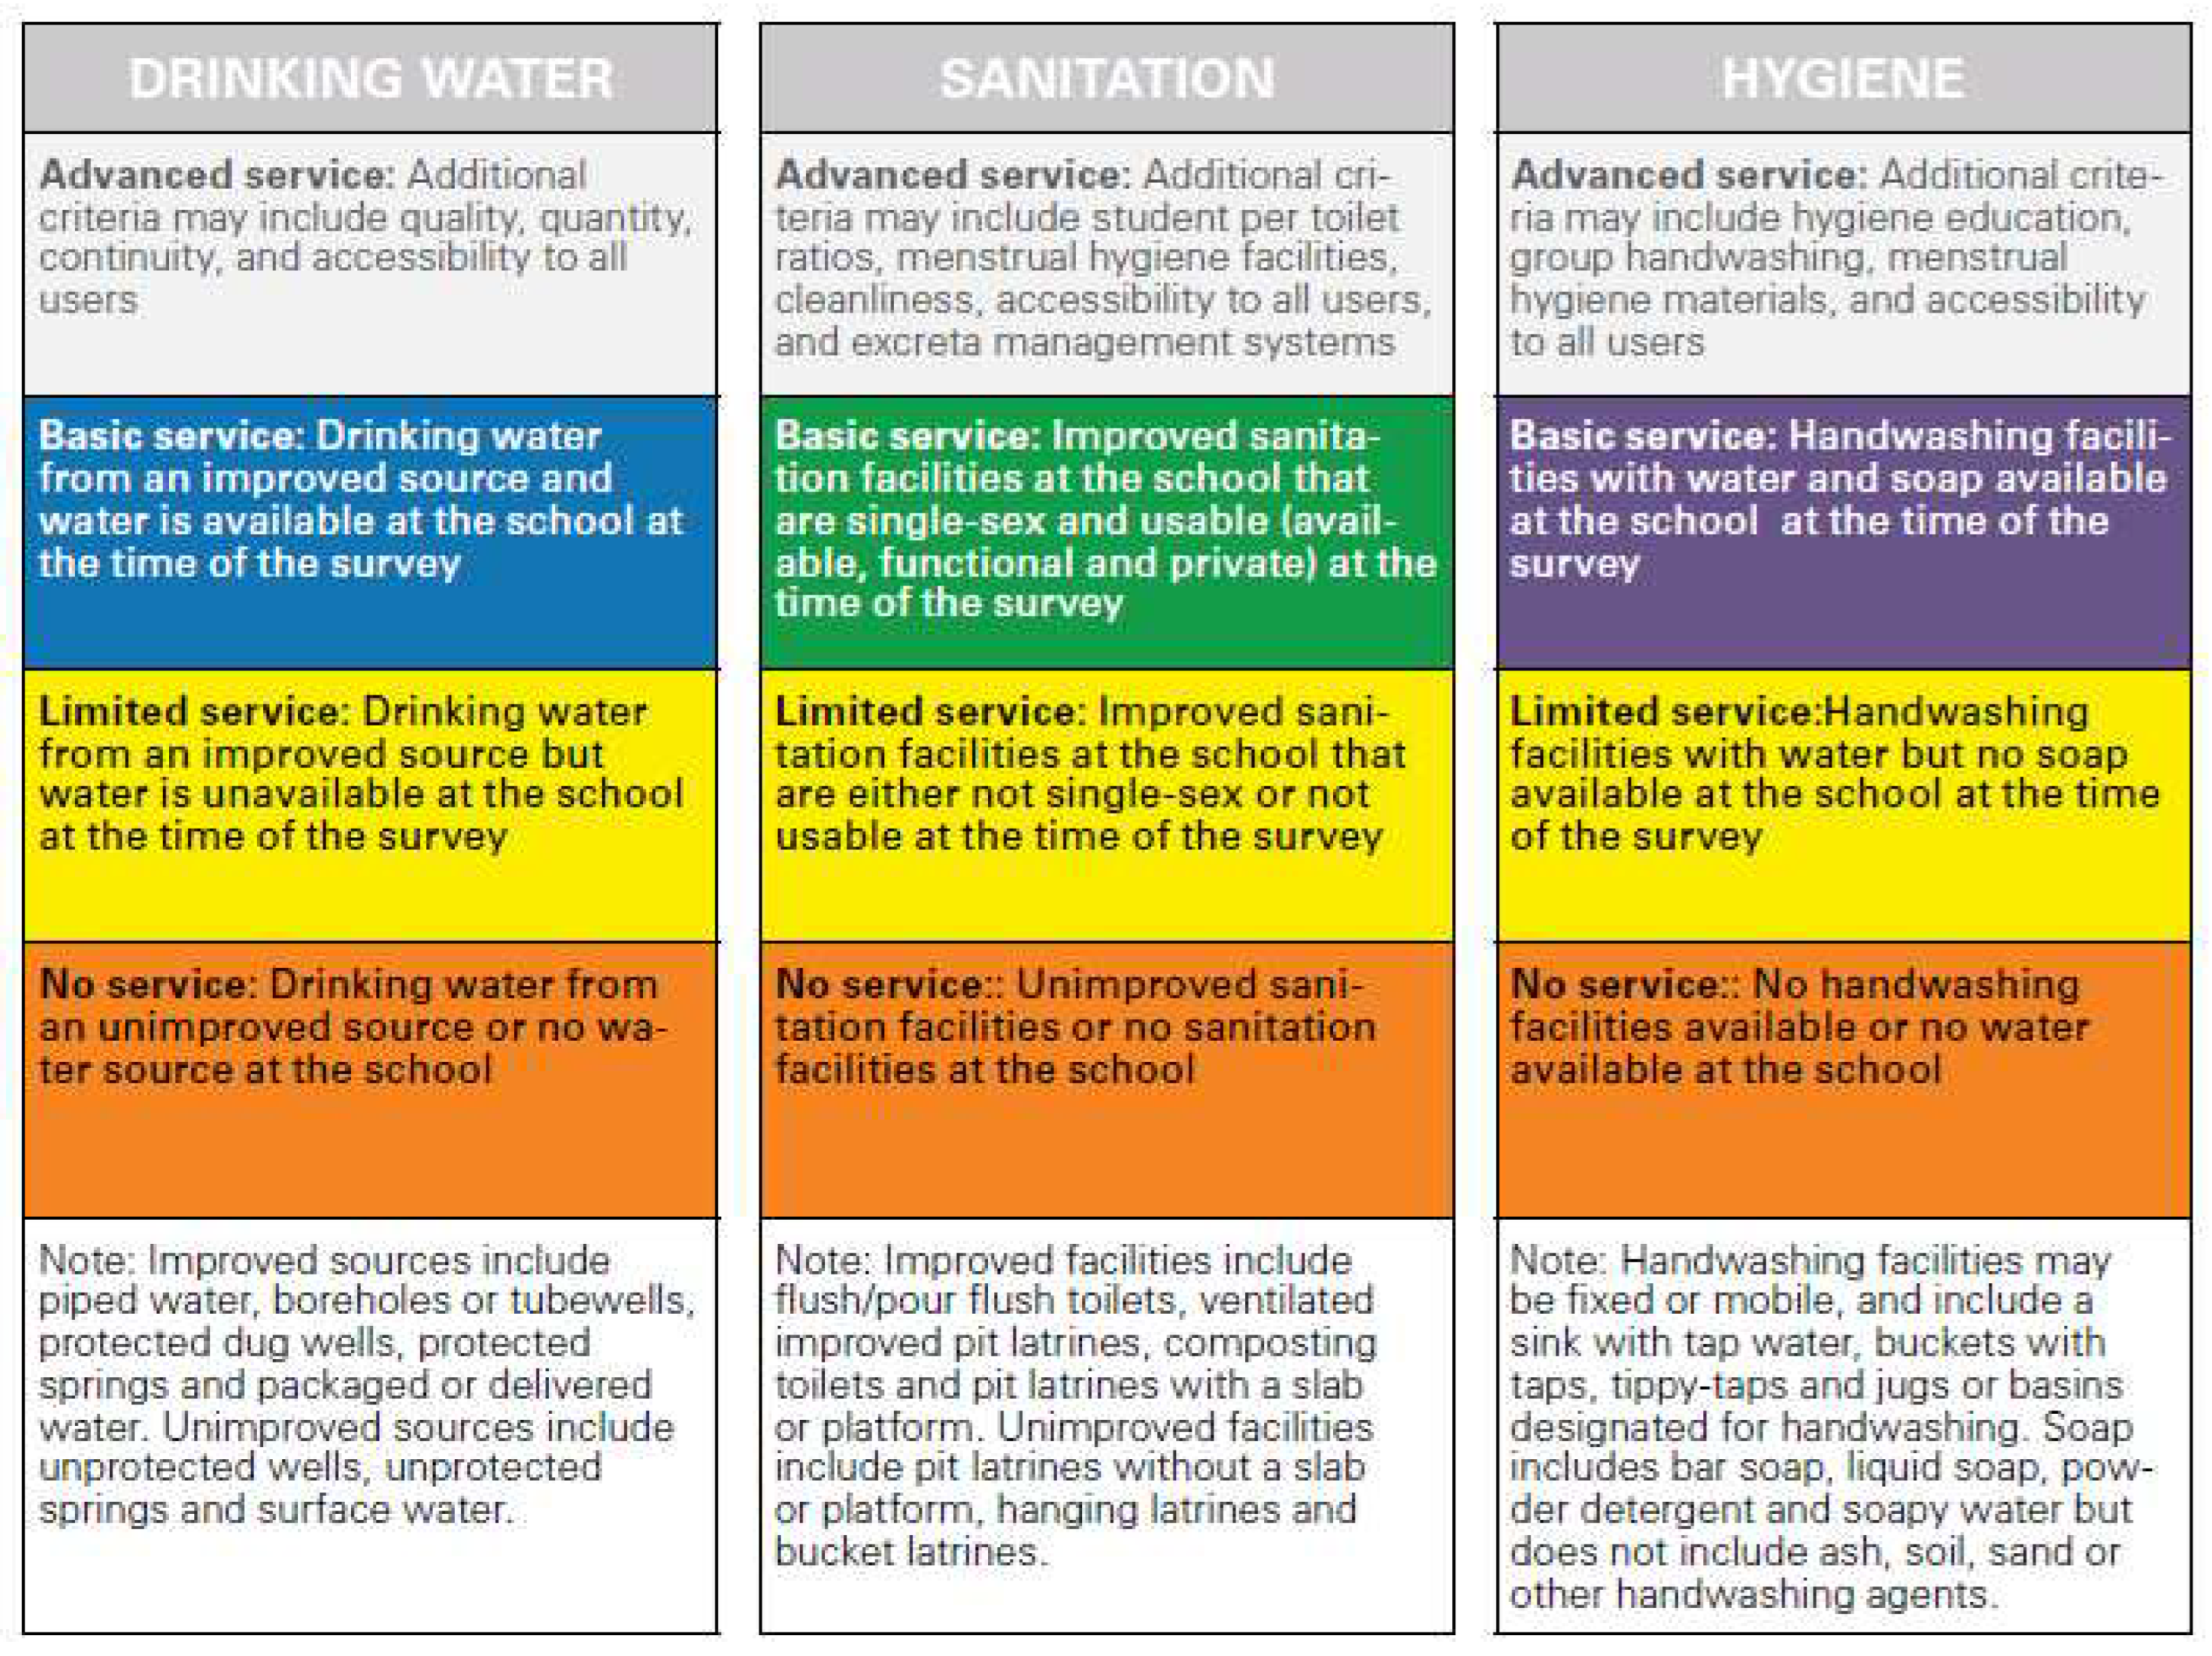
Figure 2.
Location of schools under investigation.
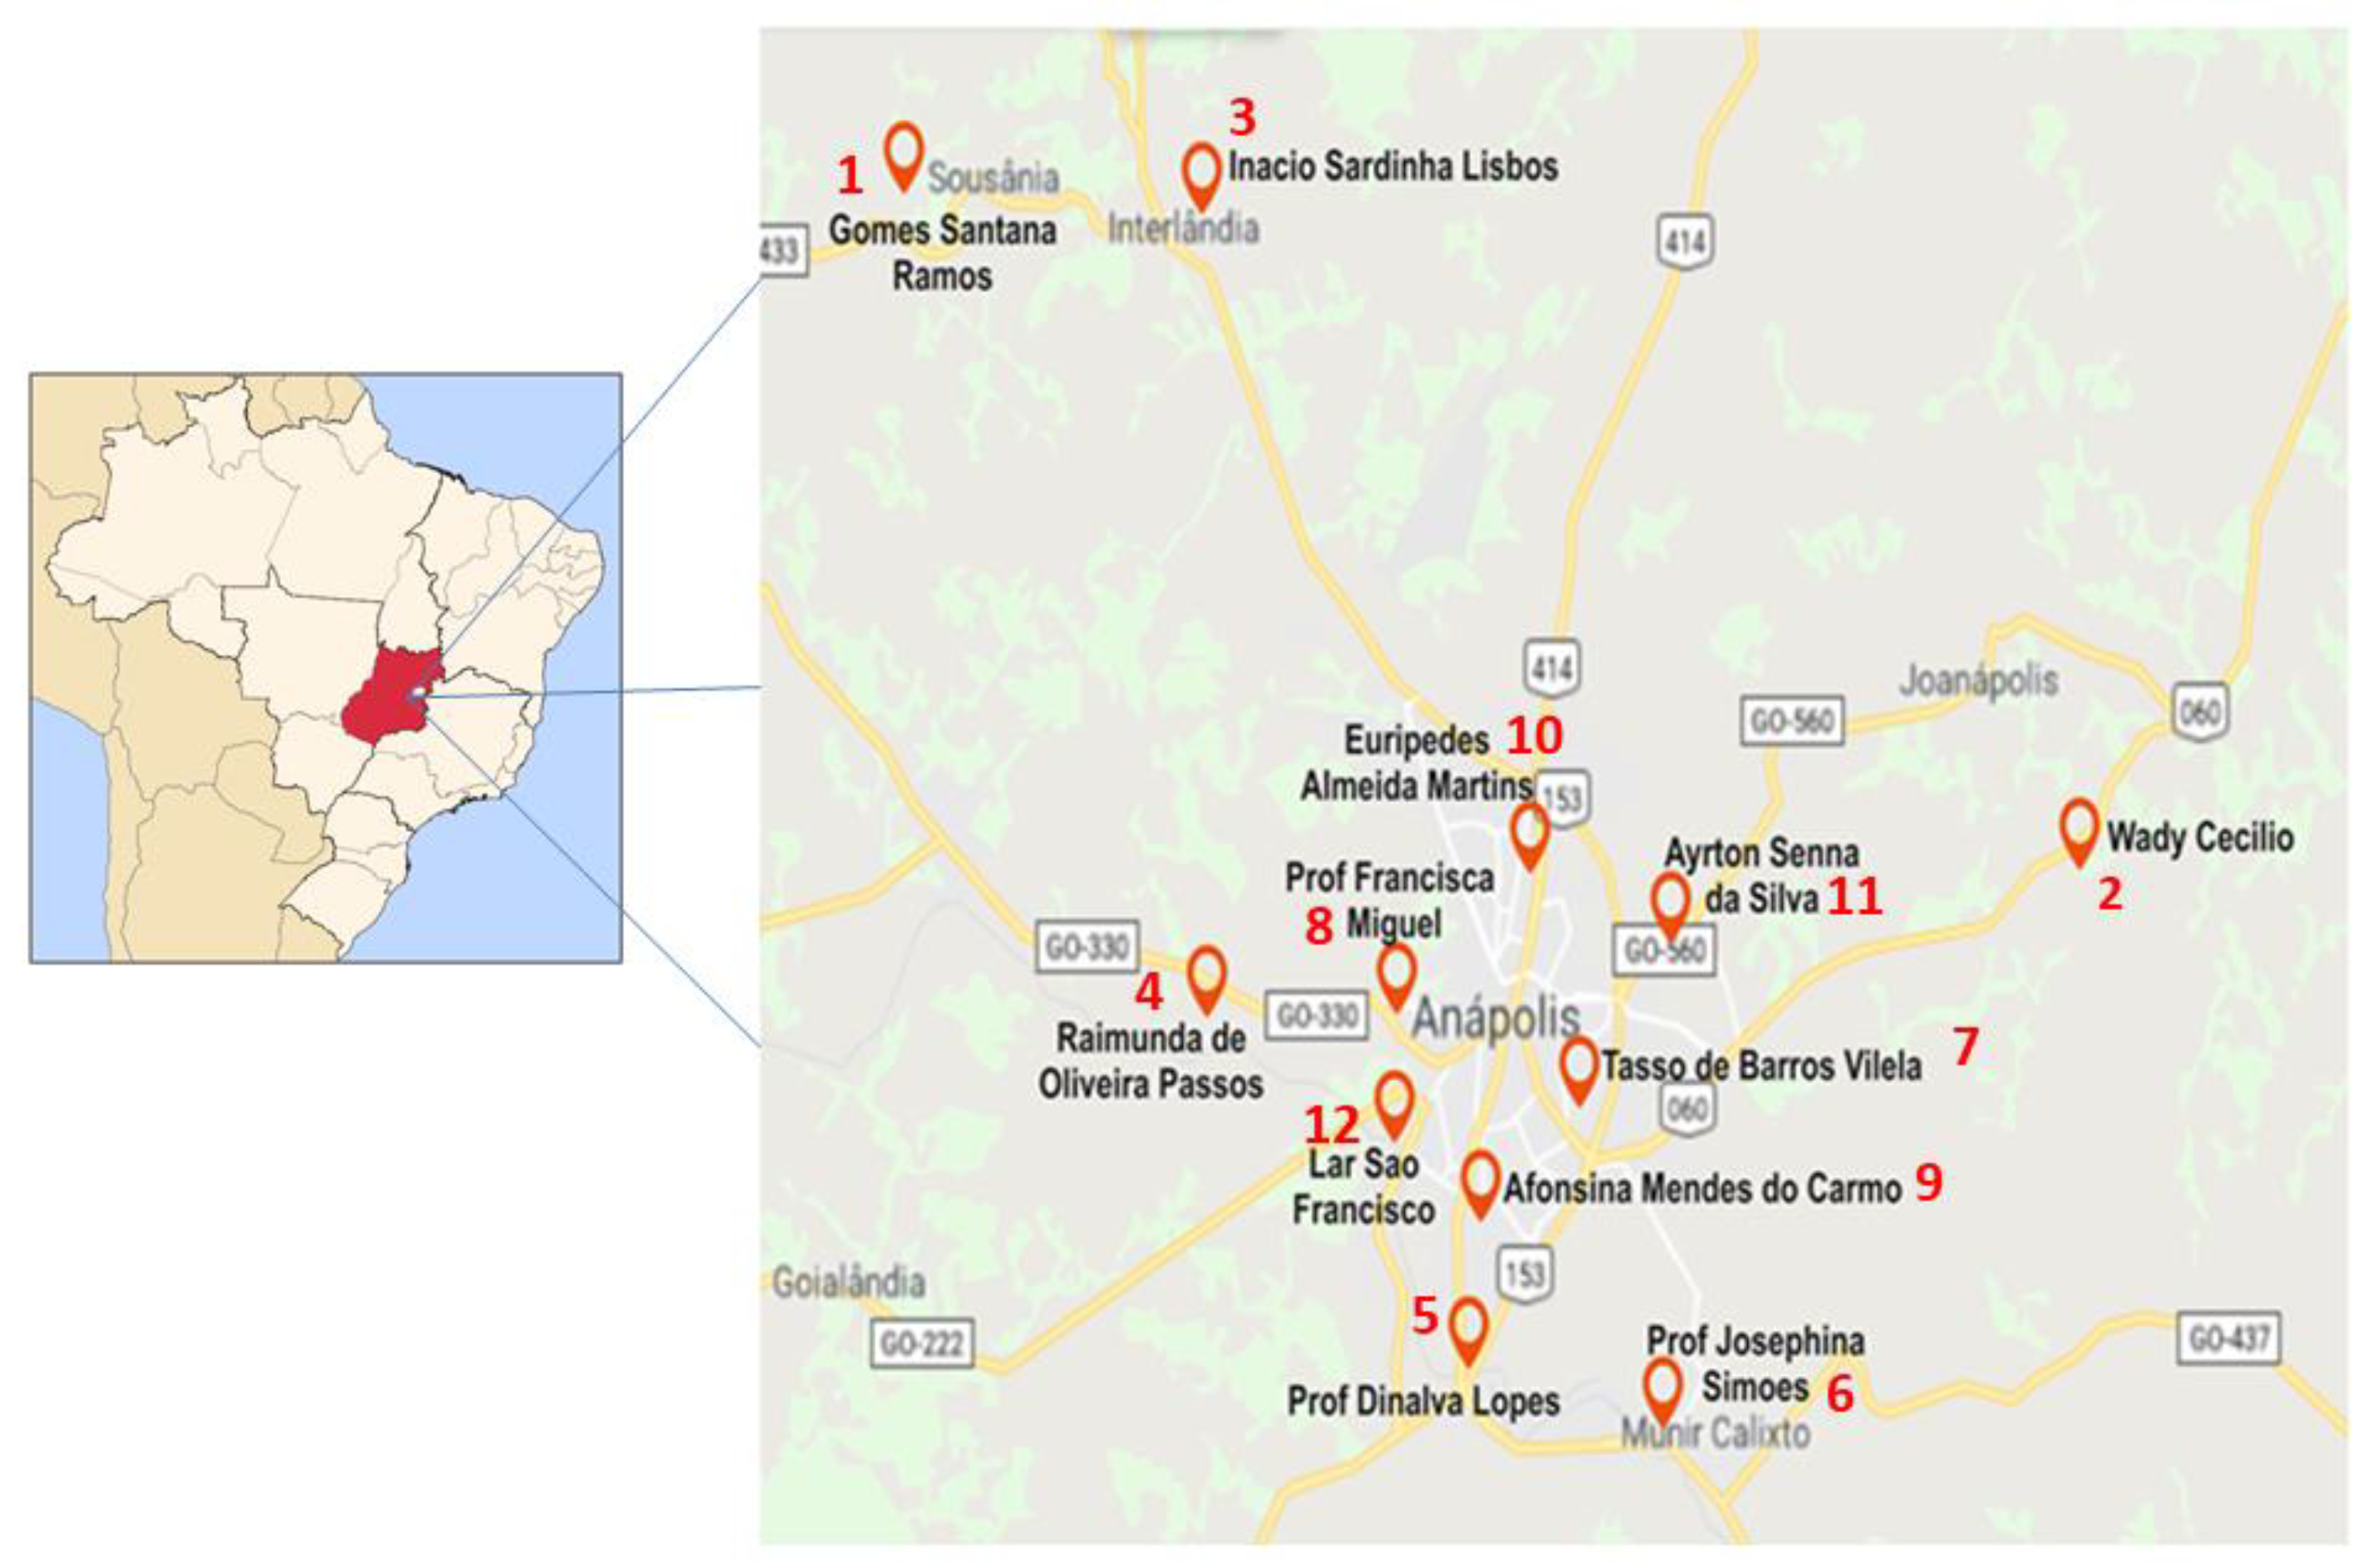
Figure 3.
Drinking water: proportion of schools with basic and advanced service, Anápolis 2018-2020.
Figure 3.
Drinking water: proportion of schools with basic and advanced service, Anápolis 2018-2020.
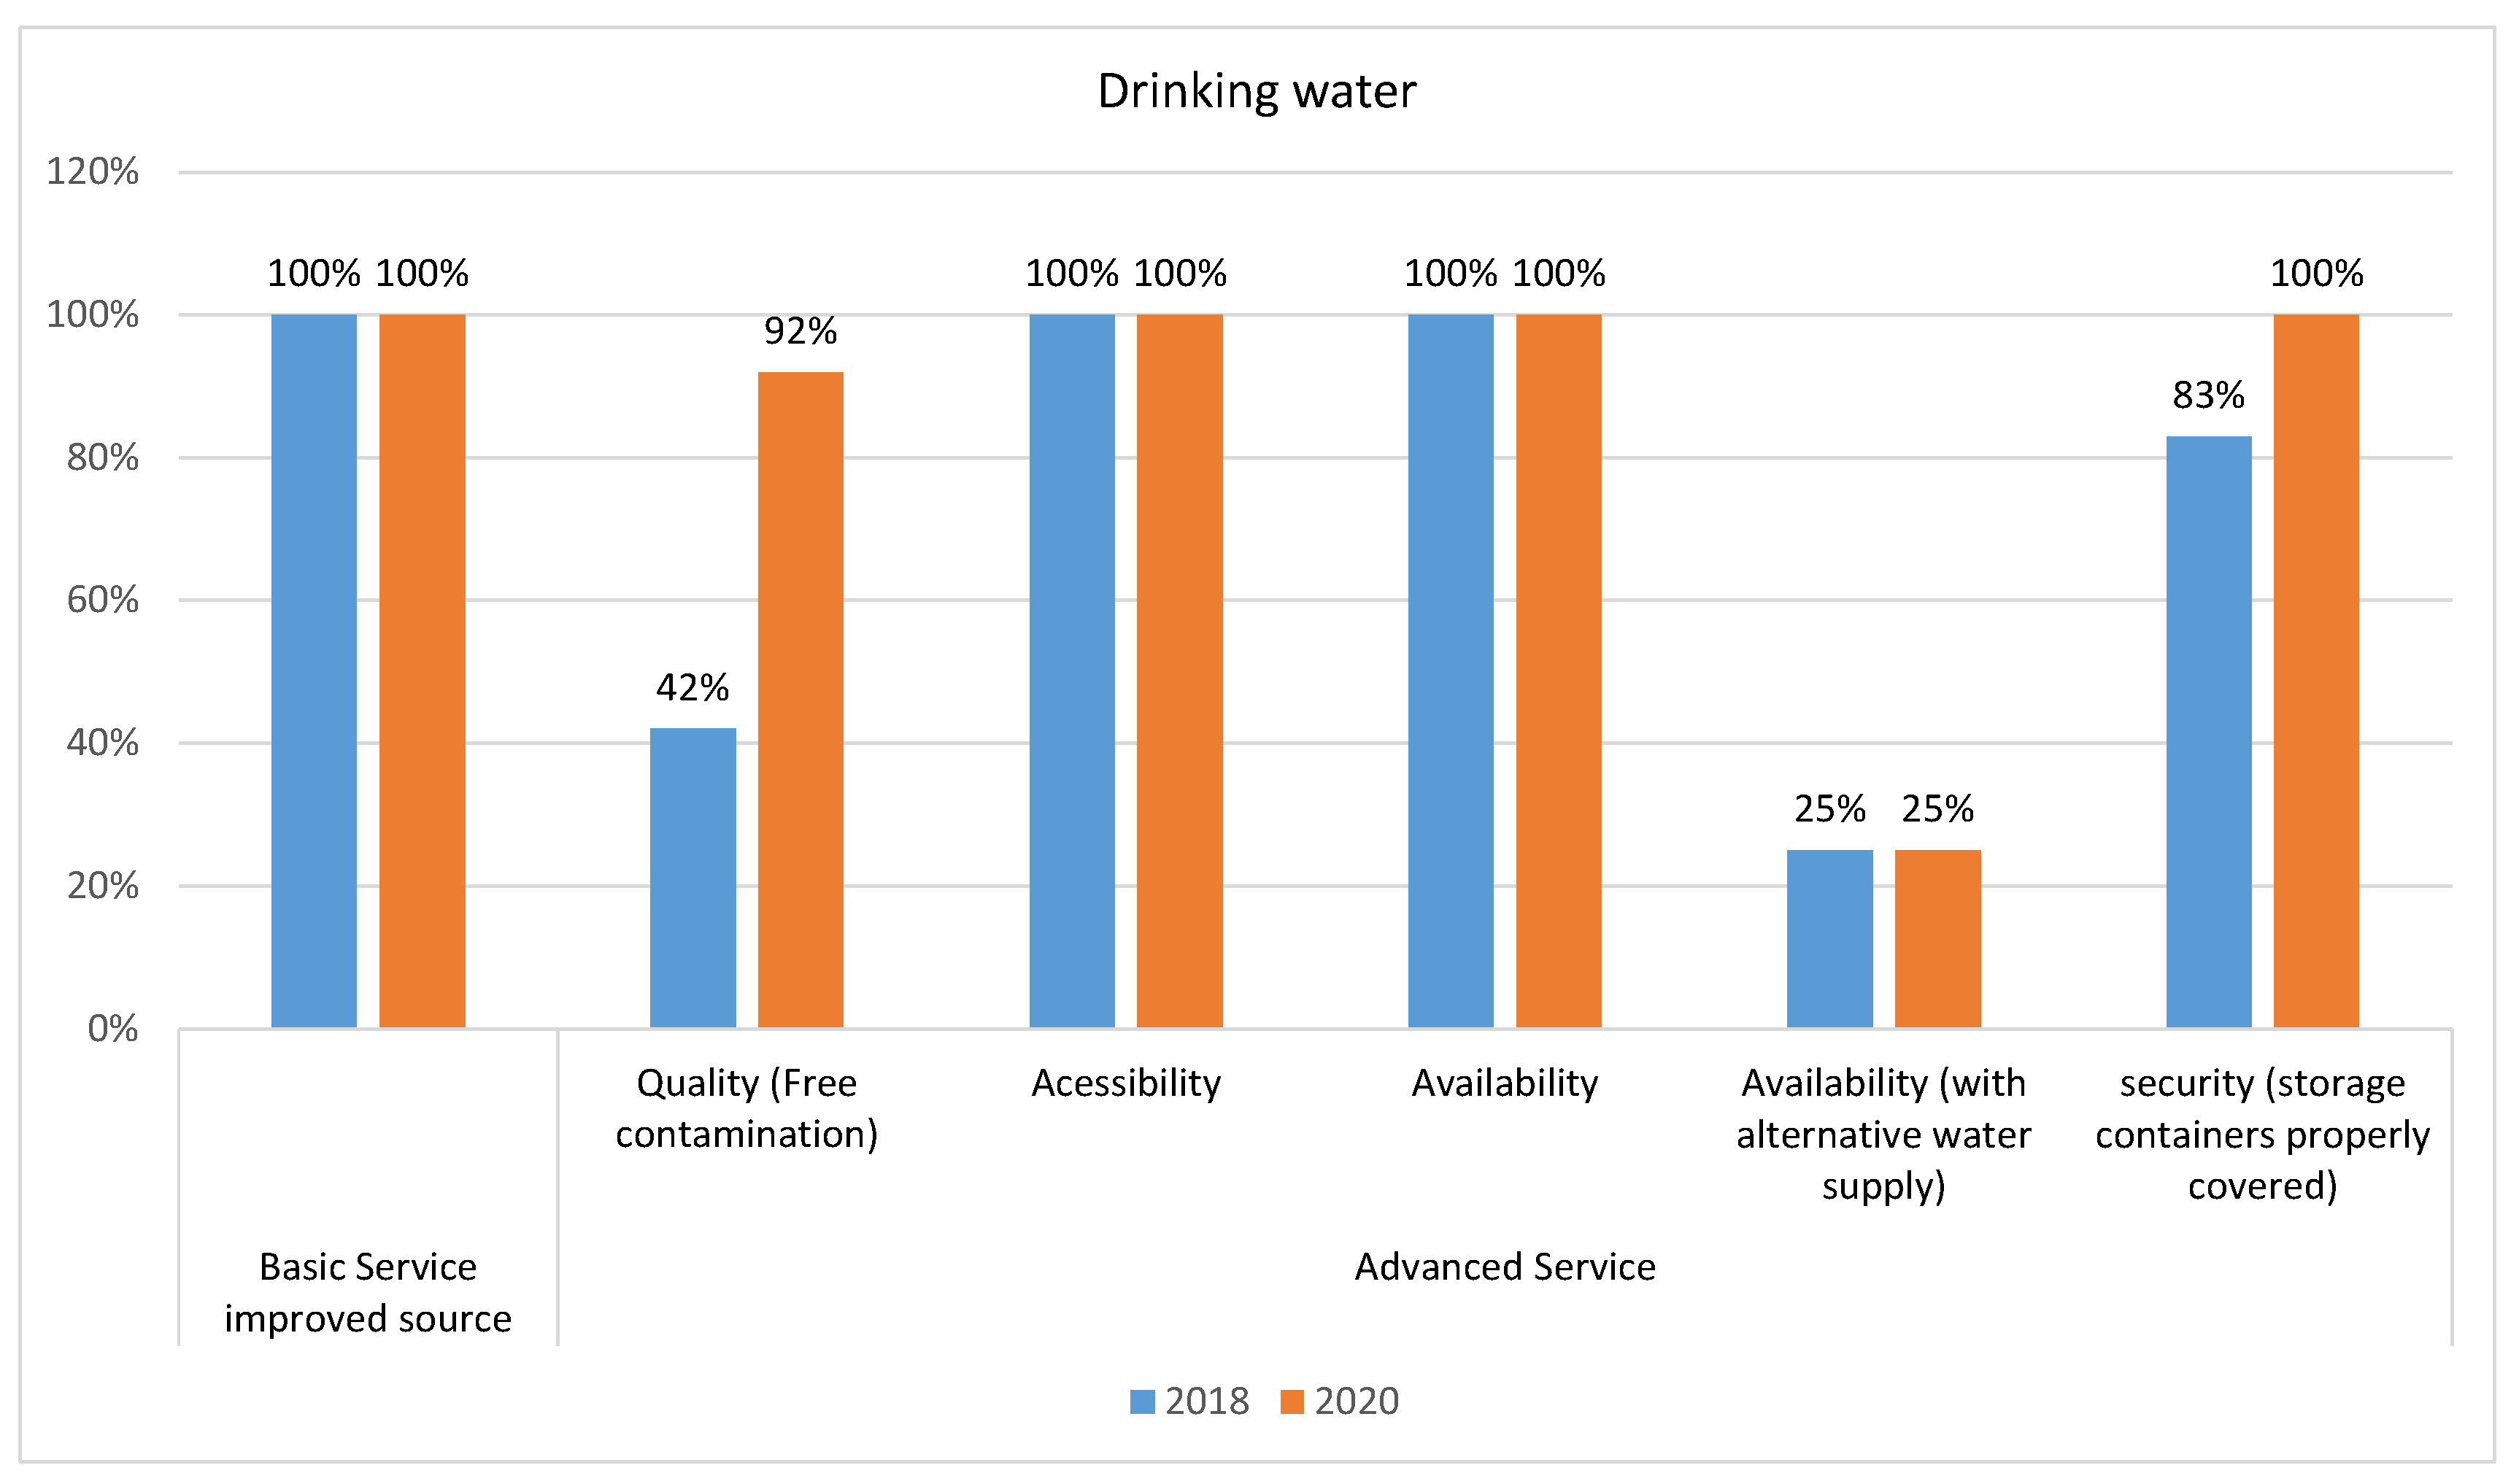
Figure 4.
Sanitation: proportion of schools with basic and advanced service, Anápolis.
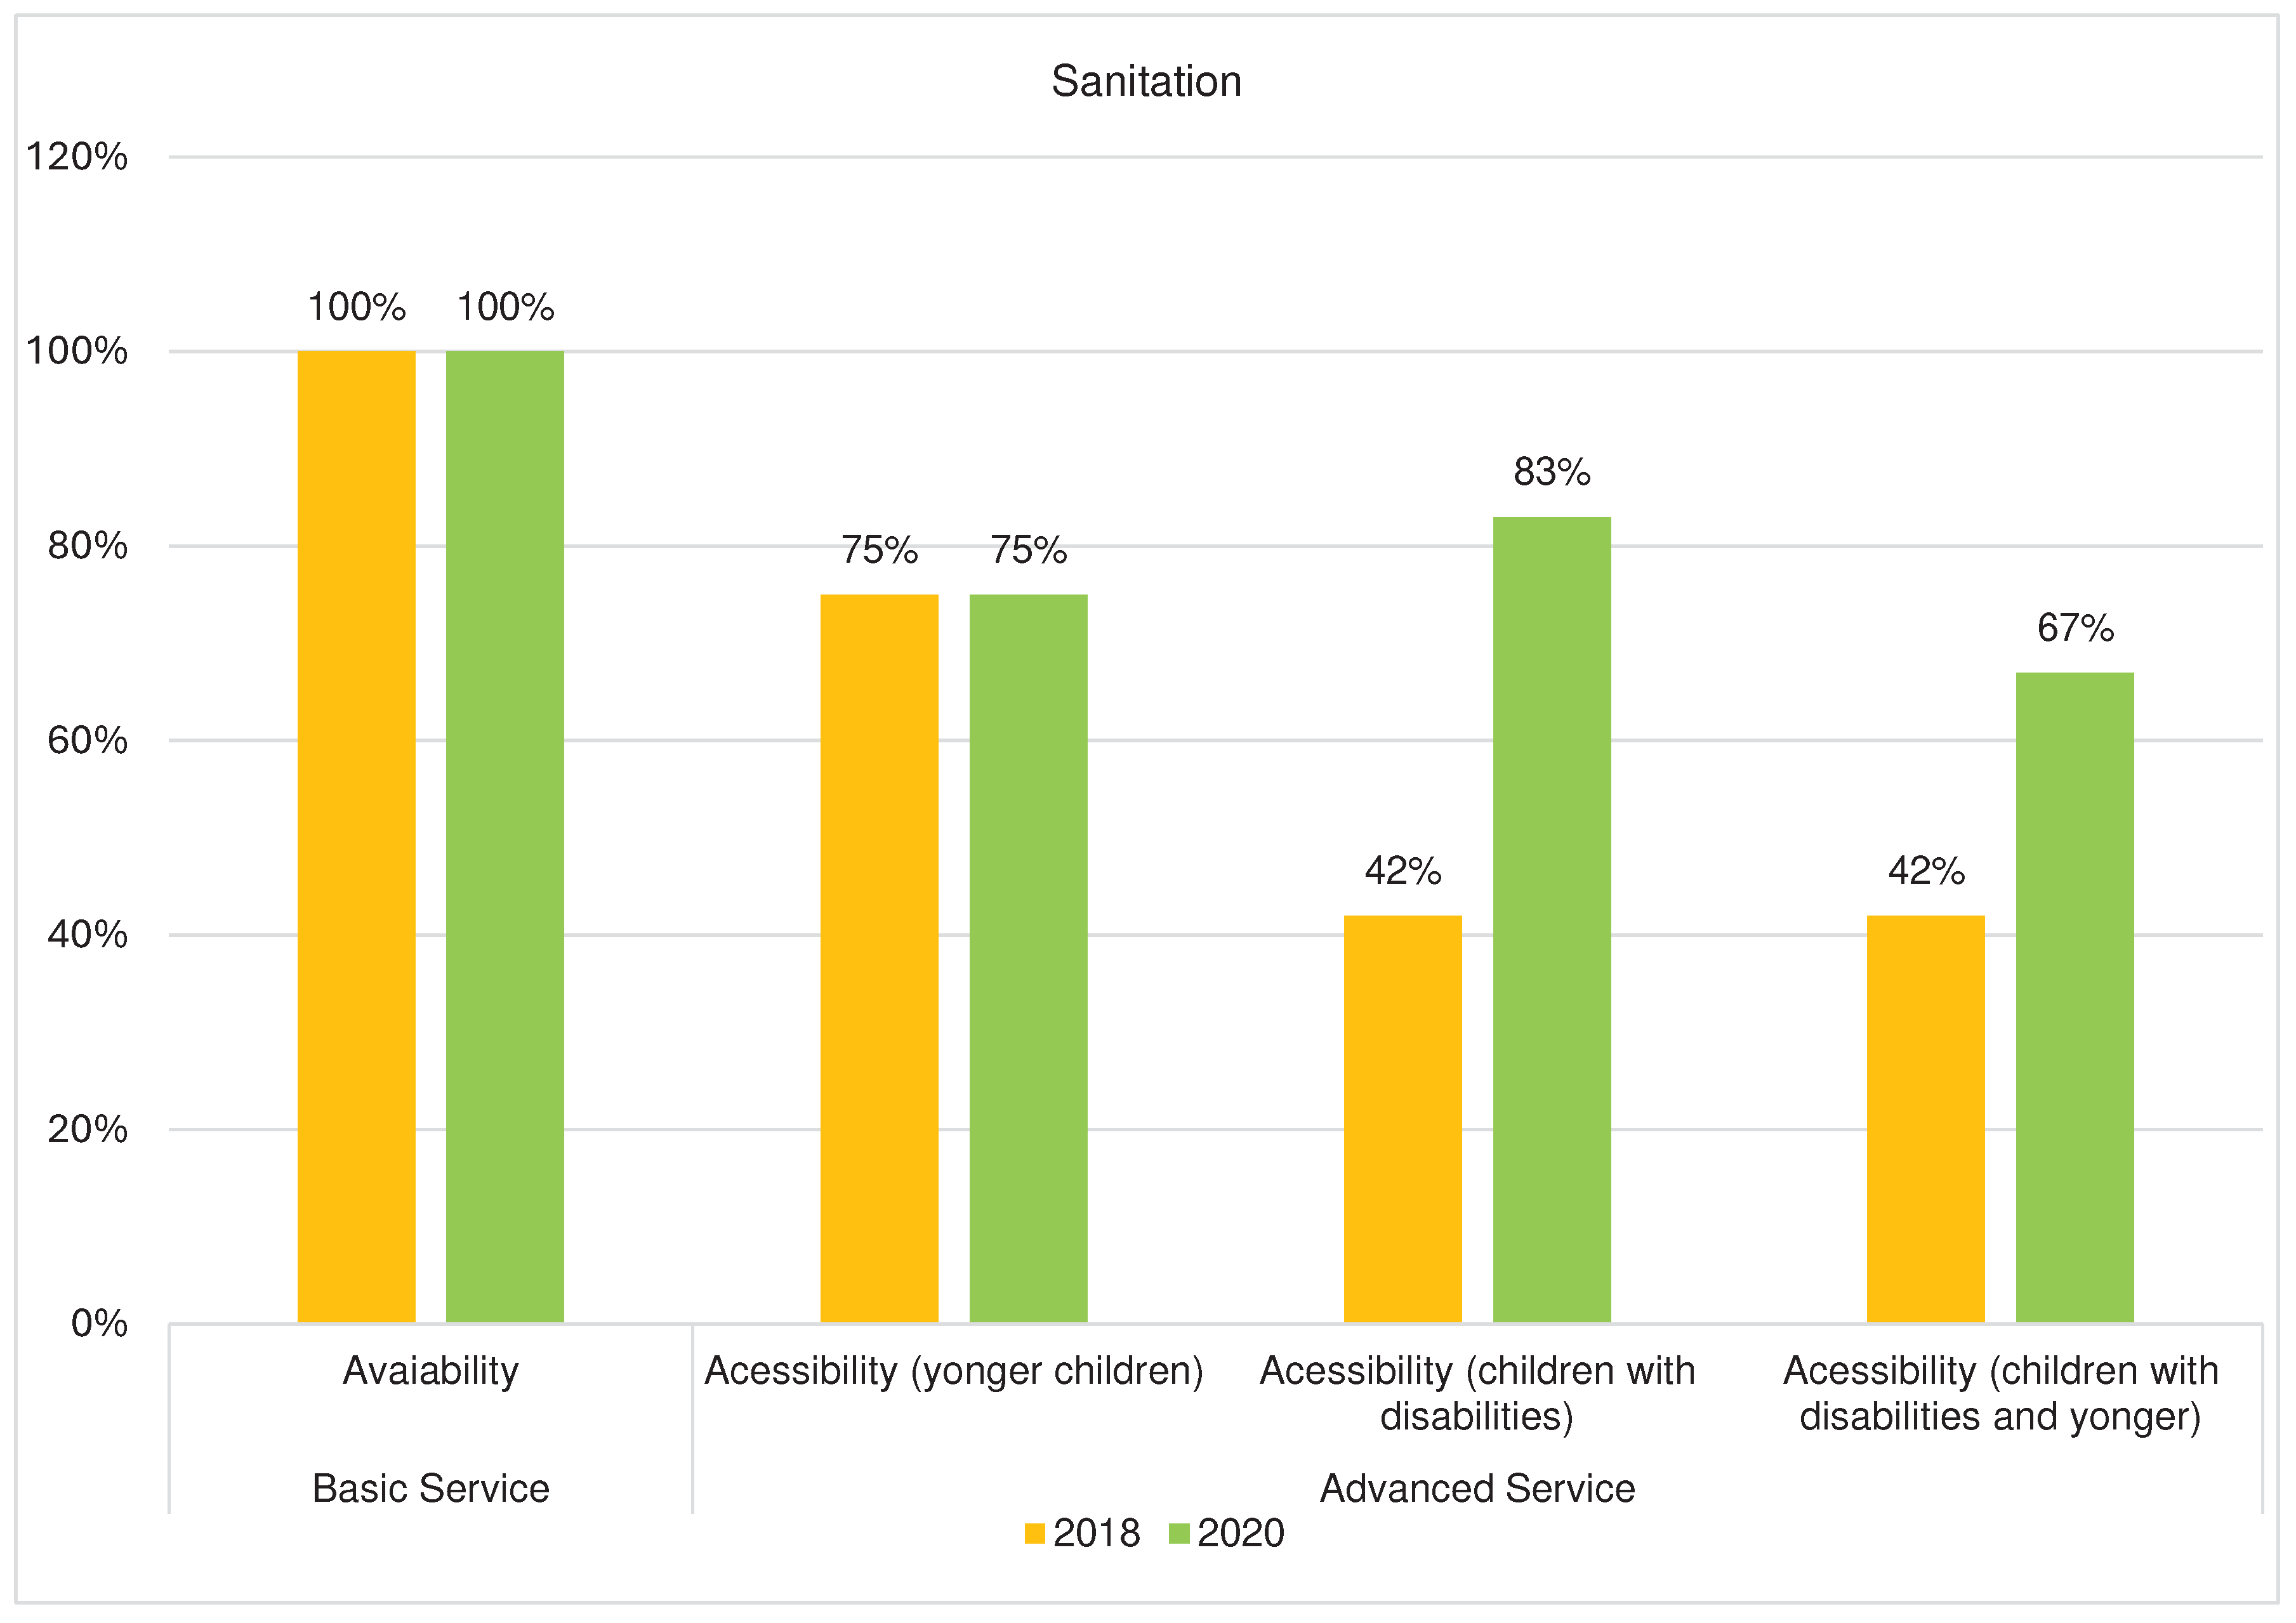
Figure 5.
Hygiene: proportion of schools with limited and basic service.


Table 1.
Drinking water: population served and investments, Brazil 2015-2019 [10].
Table 1.
Drinking water: population served and investments, Brazil 2015-2019 [10].
| Years | Brazilian population (million) | Population served (million) | Investment (R$) |
|---|---|---|---|
| 1995 | 162 | 84.6 (52.2%) | 65x108 |
| 2000 | 174 | 95.1 (54.6%) | 102x108 |
| 2015 | 204.5 | 164.8 (80.5%) | 5.7x10⁸ |
| 2016 | 206.2 | 166.6 (80.5%) | 5.9x10⁸ |
| 2017 | 207.8 | 167.7 (80.7%) | 5.5x10⁸ |
| 2018 | 209.5 | 169.1 (80.7%) | 5.7x10⁸ |
| 2019 | 210.0 | 170.8 (81.3%) | 5.7x10⁸ |
Table 2.
Sanitation: population served, investments, and wastewater treated, Brazil 2015-2019 [10].
Table 2.
Sanitation: population served, investments, and wastewater treated, Brazil 2015-2019 [10].
| Years | Brazilian population (million) | Population served (million) | Investment (R$) | Wastewater treated (%) |
|---|---|---|---|---|
| 1995 | 162 | 30.3 (18.5%) | 41.5x10⁵ | 9.2 |
| 2000 | 174 | 39.8 (22.8%) | 96x106 | 61.2 |
| 2015 | 204.5 | 99.8 (48.6%) | 5.2x10⁸ | 73.3 |
| 2016 | 206.2 | 103.8 (50.3%) | 4.2x10⁸ | 74.8 |
| 2017 | 207.8 | 105.2 (50.6%) | 3.8x10⁸ | 73.9 |
| 2018 | 209.5 | 107.5 (51.3%) | 4.7x10⁸ | 74.5 |
| 2019 | 210.0 | 110.3 (52.2%) | 5.3x10⁸ | 78.5 |
Table 3.
Indicator WASH for drinking water and services level in Anápolis (Brazil).
| Basic service indicator | Advanced service indicator | Wash services level | |||||||||
|---|---|---|---|---|---|---|---|---|---|---|---|
| Schools | Students number | Number of drinking water points | Ratios students/water points | An improved source at the school | An available source at the school | Water-free contamination (E. Coli) 1st year | Water-free contamination (E. coli) 2nd year | Drinking water accessible (limited mobility and smallest children) | Sufficient quantity of water | 1st year | 2nd year |
| 1. Rural | 263 | 4 | 65,75 | Yes | Yes | No | No | Yes | Yes | basic | basic |
| 2. Rural | 213 | 3 | 71,00 | Yes | Yes | No | Yes | Yes | Yes | basic | advanced |
| 3. Rural | 545 | 4 | 136,25 | Yes | Yes | No | Yes | Yes | Yes | basic | advanced |
| 4. Urban | 250 | 3 | 83,33 | Yes | Yes | Yes | Yes | Yes | Yes | advanced | advanced |
| 5. Urban | 353 | 3 | 117,67 | Yes | Yes | Yes | Yes | Yes | Yes | advanced | advanced |
| 6. Urban | 725 | 8 | 90,63 | Yes | Yes | No | Yes | Yes | Yes | basic | advanced |
| 7. Urban | 284 | 4 | 71,00 | Yes | Yes | No | Yes | Yes | Yes | basic | advanced |
| 8. Urban | 250 | 3 | 83,33 | Yes | Yes | No | Yes | Yes | Yes | basic | advanced |
| 9. Urban | 525 | 4 | 131,25 | Yes | Yes | Yes | Yes | Yes | Yes | advanced | advanced |
| 10. Urban | 260 | 3 | 86,67 | Yes | Yes | Yes | Yes | Yes | Yes | advanced | advanced |
| 11. Urban | 436 | 14 | 31,14 | Yes | Yes | Yes | Yes | Yes | Yes | advanced | advanced |
| 12. Urban | 290 | 2 | 145,00 | Yes | Yes | No | Yes | Yes | Yes | basic | advanced |
| Total | 4394 | 54 | 81,37 | Yes | |||||||
Table 4.
Indicator WASH for sanitation and services level, Anápolis (Brazil).
| 1st year | 2nd year | Basic service indicator | Advanced service indicator | Wash services level | |||||||||
|---|---|---|---|---|---|---|---|---|---|---|---|---|---|
| Schools | N. student | N. functional toilet | Ratios students/toilet | N. functional toilet | Ratios students/toilet | Improved sanitation facilities | Usable (available, functional, and private) | Accessible to smallest children 1st 2nd year | Accessible to children with limited mobility in 1st year | Accessible to children with limited mobility 2nd year | Cleanliness | first year | second year |
| 1. rural | 263 | 6 | 43,83 | 6 | 43,83 | Yes | Yes | Yes | Yes | Yes | Yes | basic | basic |
| 2. rural | 213 | 4 | 53,25 | 8 | 26,62 | Yes | Yes | No | No | Yes | No | limited | basic |
| 3. rural | 545 | 8 | 68,13 | 12 | 45,41 | Yes | Yes | Yes | No | Yes | Yes | limited | basic |
| 4. urban | 250 | 8 | 31,25 | 8 | 31,25 | Yes | Yes | Yes | Yes | Yes | Yes | basic | basic |
| 5. urban | 353 | 6 | 58,83 | 6 | 58,83 | Yes | Yes | No | No | Yes | Yes | limited | basic |
| 6. urban | 725 | 12 | 60,42 | 12 | 60,42 | yes | yes | Yes | No | Yes | Yes | limited | basic |
| 7. urban | 284 | 4 | 71,00 | 4 | 71,00 | yes | yes | Yes | Yes | Yes | Yes | basic | basic |
| 8. urban | 250 | 2 | 125,00 | 7 | 35,71 | yes | yes | Yes | No | Yes | Yes | basic | basic |
| 9. urban | 525 | 6 | 87,50 | 10 | 52,50 | yes | yes | Yes | Yes | Yes | Yes | limited | basic |
| 10. urban | 260 | 4 | 65,00 | 4 | 65,00 | yes | yes | Yes | No | No | Yes | basic | basic |
| 11. urban | 436 | 11 | 39,64 | 11 | 39,64 | yes | yes | Yes | Yes | Yes | No | limited | basic |
| 12. urban | 290 | 5 | 58,00 | 5 | 58,00 | yes | yes | No | No | No | No | limited | basic |
| Total | 4394 | 76 | 57,82 | 93 | 47,24 | ||||||||
Table 5.
Indicator WASH for hygiene and services level, Anápolis (Brazil).
| 2018 | 2020 | Basic service indicator | Advanced service indicator | ||||||||
|---|---|---|---|---|---|---|---|---|---|---|---|
| Schools | N. student | N. HW station | Ratios students/ HW | N. HW station | Ratios student/ HW | HW facilities with water | HW facilities with soap | HW facilities accessible to younger children | HW facilities accessible to children with limited mobility | Hygiene education | Wash services level |
| 1. rural | 263 | 10 | 26,30 | 10 | 26,30 | Yes | No | Yes | Yes | Yes | limited |
| 2. rural | 213 | 2 | 106,50 | 4 | 53,25 | Yes | No | No | No | Yes | limited |
| 3. rural | 545 | 10 | 54,50 | 14 | 38,92 | Yes | No | No | No | Yes | limited |
| 4. urban | 250 | 5 | 50,00 | 5 | 50,00 | Yes | No | No | Yes | Yes | limited |
| 5. urban | 353 | 12 | 29,42 | 12 | 29,42 | Yes | No | Yes | Yes | Yes | limited |
| 6. urban | 725 | 12 | 60,42 | 12 | 60,42 | Yes | No | No | Yes | Yes | limited |
| 7. urban | 284 | 7 | 40,57 | 7 | 40,57 | Yes | No | Yes | Yes | Yes | limited |
| 8. urban | 250 | 6 | 41,67 | 10 | 25,00 | Yes | No | Yes | No | Yes | limited |
| 9. urban | 525 | 8 | 65,63 | 12 | 43,75 | Yes | Yes | No | Yes | Yes | basic |
| 10. urban | 260 | 4 | 50,00 | 4 | 50,00 | Yes | No | No | No | Yes | limited |
| 11. urban | 436 | 12 | 29,42 | 12 | 29,42 | Yes | No | Yes | Yes | Yes | limited |
| 12. urban | 290 | 7 | 60,42 | 7 | 60,42 | Yes | No | No | No | Yes | limited |
| Total | 4394 | 95 | 46,25 | 109 | 40,31 | ||||||
Disclaimer/Publisher’s Note: The statements, opinions and data contained in all publications are solely those of the individual author(s) and contributor(s) and not of MDPI and/or the editor(s). MDPI and/or the editor(s) disclaim responsibility for any injury to people or property resulting from any ideas, methods, instructions or products referred to in the content. |
© 2024 by the authors. Licensee MDPI, Basel, Switzerland. This article is an open access article distributed under the terms and conditions of the Creative Commons Attribution (CC BY) license (http://creativecommons.org/licenses/by/4.0/).
Copyright: This open access article is published under a Creative Commons CC BY 4.0 license, which permit the free download, distribution, and reuse, provided that the author and preprint are cited in any reuse.


