
Submitted:
09 February 2024
Posted:
09 February 2024
You are already at the latest version
Abstract
Food composition data in the EMR countries are often lacking, obsolete or unreliable. The study aims to provide reliable and up-to-date nutrient data of selected food products consumed in Oman in order to evaluate consistency of nutrition labelling and update the current used food composition database. Contents of total fat, fatty acids, carbohydrates, total nitrogen, sugars and sodium were chemically analyzed in 221 foods and beverages purchased in 2022 and label and corresponding laboratory values were compared using the tolerance levels of the European Union. Food items were classified according their nutritional composition, the extent of processing and coded according FoodEx2 system. Results indicate that the nutrient values stated on a label align with the values obtained in the laboratory with the exception of a 6.3% discrepancy in TFAs content, where the reported values are higher than the appropriate reference values. The category with the highest frequency (71.5%) consisted of ultra-processed foods. In terms of inconsistencies in the nutrition claims, 5.1% of food products with claims did not comply with the statement “sugar free” or “low salt”. These findings underscore the significance of vigilant monitoring of nutritional labels as a means to implement measures that promote the well-being of consumers.
Keywords:
laboratory values
; nutrition label
; ultra-processed products
; NOVA system
; nutrient profile
; FoodEx2 system
; traffic light label
1. Introduction
Food composition tables (FCTs) are used for various sectors including research, education, health, trade, agriculture, industry, food processing, retailing, and are therefore useful in manifold ways, such as nutritional surveillance, food consumption survey, nutrition labeling, siding diet and disease evaluation challenges, developing school menus or standards meal planning, setting dietary guidelines and even assessment of environmental impact of foods [1,2,3,4,5,6,7].
FCTs provide information relating to nutrient composition of foods with specific reference to energy, major components (water, protein, fat, carbohydrate, alcohol, ash), inorganic constituents, vitamins and other components (flavonoids, phytoestrogens phytonutrients, additives, pesticides and other residues). The nutrient values are either based on chemical analyses performed in analytical laboratories or calculated from the nutrient contents of recipe ingredients using retention and/or yield factors [8]. They are also borrowed values from other tables and databases or presumed values [8].
The Eastern Mediterranean Region (EMR) is facing the challenges to reduce the growing burden of diet-related non communicable diseases (NCDs) including type 2 diabetes mellitus, cardiovascular diseases (CVDs), chronic respiratory disease and some types of cancer [9]. Unhealthy diet is the major risk factor for raised blood pressure, overweight and obesity, raised blood glucose and raised lipids, which are metabolic and physiological risk factors of NCDs. Increased salt consumption is associated with hypertension and CVDs and there is evidence that lower sodium consumption can have a beneficial effect on these morbidities [10,11,12,13,14]. Saturated fatty acids (SFAs) are associated with increased serum levels of low-density lipoprotein, CVDs and incidence of cancer [15,16]. Trans fatty acids (TFAs), are recognized as harmful nutrients, associated with an increased risk of CVDs and mortality [17,18].
In the vast majority countries of the EMR, average intakes of salt are almost double WHO recommended levels (i.e. less than 5 g per day), sugar intakes are also well above WHO recommendations (free sugars less than 10% of total energy intake), intakes of total fat (TF) have steadily increased over the last 50 years, TFAs intakes are over 1% and SFAs intakes are above the recommended upper limit (10% of total daily energy) [19,20].
Reducing sugar, fat, and salt consumption, in line with WHO’s best buy recommendations, is a feasible and meaningful health solution to prevent and control NCDs. The implementation of WHO recommendation to reduce salt, sugar, TF, TFAs and SFA consumption has led to a greater focus on reliable nutrient data, hence the need for databases to be reviewed regularly. Data on the composition of foods in the EMR countries are often lacking, obsolete or unreliable. Some countries do not have food composition data. In this context, the main objective of our study was to provide reliable data using laboratory analysis on nutritional composition of selected food products consumed in the Sultanate of Oman, an EMR country, in order to use them to: i) compare label and laboratory values in the selected food products; ii) update the current used FCT; iii) assess food consumption patterns of the population.
2. Materials and Methods
The design, sampling and laboratory analyses were done in 2022.
2.1. Study Area
Sultanate of Oman, an EMR country with a land area of 309,500 km2 and a population of 5.032 million in 2023, has recently undergone rapid increase of NCDs burden with significant social and economic impact in terms of health care, loss of productivity and premature mortality [21]. Recent study reported that two-thirds of Omani adults were overweight or obese, one-third obese, one-third have high blood pressure or was currently under medication and more than 15% having a diagnosis of raised blood glucose or were on diabetes meds and/or diagnosed with diabetes [22]. Unhealthy diet behaviours of Omani adults underlined the predominance of NCDs burden in the country, e.g., 61% did not meet the recommended number of five servings/day of fruits and/or vegetables; 76% added often/always salt to food before or when eating; 25% reported eating processed food high in salt; 80% consumed vegetable oils. The most prevalent risk factor is primarily related to high salt, sugar and fat intake [22] that is why our study focused on the assessment of the level of these nutrient in the food products frequently consumed by Omani population.
2.2. Identification of food products
In order to obtain a list of the most consumed food products, four of the big hypermarkets from the Governorate of Muscat (Oman capital city) was contacted. Muscat governorates markets were chosen due to the presence of many citizens from different governorates of the Sultanate and the compilation of the most common options in foodstuffs. One of those hypermarkets respond to us and send us the list of all foods and drinks sold in the market as this type of information is confidential for most the markets. The list was sorted and the most consumed products were selected. In each food item from the top five, we choose the Omani brands to facilitate the reformulation’s interventions in addition to the other brands in the top five list. A final list of 221 food items was selected from the most consumed products and purchased from the markets.
2.3. Analytical parameters
Chemical analyses to assess the nutrient contents of the selected food products were carried out in the United Integrated Laboratories located in Barka near the capital Muscat. For every food item, the content of total fat (g), SFAs (g), polyunsaturated fatty acids (PUFAs) (g), monounsaturated fatty acids (MUFAs) (g), TFAs (g), carbohydrates (g), total nitrogen (g), total sugars (g), glucose (g), sucrose (g), maltose (g), lactose (g), sodium (g) were analyzed. Official methods of analysis of Association of Official Analytical Chemist (AOAC) were used to analyze nutrients in foods [23,24,25,26,27] (Table 1).
2.4. Food products description
2.4.1. Food items coded according FoodEx2 system
In order to harmonize our food dataset and allow comparison across groups and countries, we used FoodEx2, a standardized system of Global Dietary Database and WHO/FAO GIFT for classifying and describing food data [28,29,30]. FoodEx2 consists of a core list of food items that represent the minimum level of detail needed for food assessments, and facets that provide further detail to the information of the food list term. The nature of the food itself is linked to level of processing: raw primary commodities (RPC), RPC derivatives, composite foods. RPC are unprocessed single-component foods or whose nature has not been changed by processing. RPC derivatives are single-component foods which have been physically changed by processing. Composites are foods consisting of multiple components [31].
2.4.2. Food items classified according NOVA system
The NOVA Classification, which was developed in 2010 by Monteiro (Brazil) and is popularized around the world, does not take account of nutritional values but rather the extent of processing of the foods. It distinguishes four food groups according to the extent of their processing [32].
- NOVA 1- Unprocessed or minimally processed foods: are natural foods subjected to one or more essentially physical processing operations that do not substantially alter the nutritional properties or manner of consumption of the original foods
- NOVA 2- Processed culinary ingredients: are substances derived from the group 1 foods by physical and chemical processes such as pressing, refining, grinding, milling and spray-drying (oil, butter, sugar), or derived directly from nature, such as salt. They are used for preparing, seasoning and cooking Group 1 foods.
- NOVA 3- Processed foods: are products designed to increase the durability of group 1 foods by modifying or enhancing their sensory qualities. This can be made essentially by adding salt, sugar, oil, vinegar or other culinary substances from group 2 to group 1 foods (canned fish, fruits or vegetables, fruit preserves, cheeses, fresh bread products).
- NOVA 4- Ultra-processed foods (UPFs): are industrial formulations typically made from five or more ingredients, or even more. These ingredients are often those used in processed foods, such as sugar, salt, oils or other fats, stabilizers and preservatives. The processes used for combining the usually numerous ingredients and for creating the “ultra-processed” end product include several processes without any domestic equivalents, such as hydrogenation and hydrolysis, extrusion and molding, and pre-treatment for frying.
Our food items were classified into the 4 NOVA groups.
2.4.3. Food items classified according the EMR nutrient profile
Data provided from chemical laboratory analyses were used to classify food products according the nutrient profile model developed by the WHO for the EMR [33]. It consists of classifying foods according to their nutritional composition in order to allow differentiation between foods that can form part of a healthy diet and those that are less healthy.
The model consists of 18 food categories or groups for which thresholds have been established in relation to the energy, total fats, saturated fats, total sugars, added sugars, non-sugar sweeteners and salt. The thresholds not to be exceeded are based on the dietary objectives recommended by the WHO for the prevention of obesity and related non-communicable diseases, as well as on the recommendations concerning sugars and salt [34,35,36]. If one of the thresholds is exceeded, no marketing action aimed at children should be permitted. This model was used to classify our food items in three groups according the permission or not of their advertisement: “permitted”, “permitted subject to certain conditions” and “not permitted”.
2.5. Different uses of food composition data
In addition of the food consumption surveys, the food composition data have a wide variety of uses including nutrition labelling, complying with national and international standards and regulations, as well the promoting healthy diet.
2.5.1. Creation of Front of Pack (FoP) nutrition labelling
The FoP colour-coded nutrient-based schemes were developed in accordance with the guidance of UK Food Standards Agency [37] and contains:
Format “energy + 4”: information on the energy value in kcal and kJ, plus the amounts of total fat, saturates, sugars and salt in grams per 100 g/ml and per portion of the product “as sold”.
2.5.2. Calculation of percentage reference intake
Percentage reference intake (% RI) given on a per 100 g/ml of the product “as sold” using ‘Reference intake of an average adult (8400 kJ/2000 kcal) (Table 3). The daily reference intake (RI) for FoP nutrition labels set by the European Commission and Member States [37].
The food item is considered a high source of the considered nutrient if % RI is > 20%, good source when % RI is between 11 and 20%, medium if % RI is between 5 and 10% and low if % RI is < 5%.
2.5.3. Comparison of Label and Laboratory nutrient values
Available food labelling values on protein, carbohydrates, total fat, SFAs, sugar, sodium were compared to the corresponding values obtained by laboratory analyses. The nutrition labelling compliance was tested using the tolerance thresholds set by the Regulation (EU) No 1169/2011 of the European Parliament including the uncertainty of measurement associated with a measured value [40] and the Regulation (EU) 2019/649 of 24 April 2019 established for TFAs, other than TFAs naturally occurring in fat of animal origin [41] (Table 4). For every food item, food labelling value is considered compliant with the analyzed value if this later value is within the lower and the higher tolerance of the declared value, calculated using the following tolerance thresholds.
Among the analyzed food products, 32.6% (n=74) presented nutritional information with claims. Only compliance of claims on energy, protein, sugar and salt were tested using content thresholds set by the Regulation (EC) No. 1924/2006 for nutritional or health claims [42] (Table 5). For food products (with added vitamins and minerals claims), no laboratory data were available in order to compare or control the label values.
2.6. Statistical analyses of data
Management, check, calculation of the derived variables (energy) and creation of new classifications of the data files were performed using the Stata software (version 14.0; StataCorp, College Station, USA) [43].
3. Results
3.1. Food products description
Food products were categorized into eight aggregated groups from the nutrient profile food groups. Out of the total of 221 food products, 25.3% were sweet snacks, cakes, biscuits, chocolate and sugar confectionary, 20.4% dairy products, 19.5% beverages, 12.2% processed fruit, vegetables and legumes, 10.0% sauces and dressings, 8.6% processed meat, poultry and fish, 3.2% bread and cereal products, 0.9% natural food (Table 6).
Our analysis found that only 66.5% of these products displayed clear food information to consumers and 55.5% mandatory nutritional information (energy in both kilojoules (kJ) and kilocalories (kcal), fat, saturates, carbohydrate, sugars, protein and salt) [39]. Among these food products, 42.1% had claims on the package (Table 6).
According the FoodEx2 system classification, 52.0% of the food item products analyzed by our laboratory were composites, 46.6% were raw primary commodity derivatives and only 1.4% were raw primary commodities (Supplementary Table 1).
The distribution of food products classed according to the NOVA system is detailed in the Supplementary Table 2. According to the extent of industrial processing, ultra-processed and processed food products were the most frequent with an overall average frequency of 88.2% (71.5% and 16.7%, respectively) (Figure 1). Details on NOVA classification are reported in the Supplementary Table 2.
Overall the 221 analyzed food products, only 12.2% were exempt from marketing restrictions and considered to be part of a healthful diet according the nutrient profile model used in EMR region. For the other items of products, 35.3% were classified as “not permitted marketing” category (the whole category is classified as not permitted and don’t need to check the levels for salt, sugar, SFAs, total fat). Out of the remaining 52.5% products, 19.0% as not permitted because of high salt; 10.4% not permitted because of high salt and total fat; 9.5% not permitted for excess of sugar; 5.0% not permitted because of high total fat; 5.0% not permitted for excess of salt, total fat and SFAs; 1.8% not permitted for excess of salt and sugar; 0.9% not permitted for excess of total fat and sugar; 0.5% not permitted for excess of total fat and TFAs; 0.4% not permitted for excess of SFAs and salt. Results are detailed in the Supplementary Table 3.
3.2. Energy and nutrient composition of food products
Energy and nutrient contents of each food item product assessed by laboratory analyses were detailed in the Supplementary Table 4. Table 7 presents energy, macronutrient and sodium values in food products classified into eight groups.
On average, these food products contain protein between 0 (Group1) and 18.3 g (Group5), total fats between 0 (Group1) and 22.2 g (Group2) and carbohydrates between 5 (Group4) and 82.8 g (Group1). The highest average SFAs content was found in dairy products group (9.7 g) with a maxi content of 27.8 g. The highest TFAs content (4.1 g) was found in (Group2). The lowest and highest total sugar content were shown in Group 1 (80.7 g) and Group 5 (0.5 g). Sucrose content ranged between 0.1 g reported both in Group1 and Group5, and 15.1 g found in Group2. Maltose and lactose content did not vary much between the analyzed food items. Sauces and dressing were the highest in sodium content.
3.3. Food products categorized according the front of pack nutrition labelling
The traffic-lights label system based on the levels of total fat, SFAs, sugars and salt content showed that only 2.7% of food products were considered as healthy as all stated nutrient levels were low. Out of the remaining items, 32.2% showed medium or high levels of one of the stated nutrients, 13.6 % contain medium or high level of two of stated nutrients, 33.0% contain medium or high level of three of stated nutrients, and 18.5% contain medium or high level of all stated nutrients. Details of results regarding the FoP categorization are reported in the Supplementary Table 5.
3.4. Daily reference intake scores provided by food products
For nutrients to be limited, high sources (equal or above 20% of daily reference intake) were found in 35.8% of total food products for total fat, 58.8% for SFAs, 21.3% for sugars and 28.5% for salt, while low sources were found in 52.9%, 43.4%, 47.1% and 35.3%, respectively (Table 8).
For energy, 22.2% of food products were high sources and 39.8% low sources. Only 17.2% of food products were high sources of protein and 23.5% were for carbohydrates. More details regarding the percentage daily reference intake and scores were reported in the Supplementary Table 6.
3.5. Accurateness of the nutritional labels
In the context of food labelling, all reported nutrient values, specifically protein (95.5% of all food products), carbohydrates (96.0%), total fat (96.0%), saturated fatty acids (84.6%), sugars (86.0%), and sodium (90.0%), were found to be consistent with the analyzed samples in the laboratory. Concerning the laboratory values for TFAs, 6.3% of the total food products presented values exceeding the acceptable threshold of 2% of total fat, which falls within the range of 2.7 to 61.7 g/100 g of total fat. Details regarding results of lower and higher tolerance of every item were reported in the Supplementary Table 7.
3.6. Accurateness of the nutrition claims
Two types of food products with nutrition claims “sugar free” and “low salt” did not comply with the regulation while the other evaluated food items were compliant (Table 9).
4. Discussion
This study provides the first comprehensive comparison of laboratory and label values for protein, carbohydrates, sugars, SFAs, TFAs and sodium in major agri-food products contributing in food consumption in Oman. The findings showed that, among the various food products analyzed in this research and categorized using the NOVA classification, the category with the highest frequency (71.5%) consisted of UPFs. This classification was corroborated by the FoodEx2 system, which identified nearly all UPFs (99.4%) as composite foods or RPC derivatives, indicating that these foods had undergone significant processing transformations. This result shows that FoodEx2 system catch perfectly the extend of food processing.
When examining the distribution of UPFs based on the number of red FoP traffic-lights, it was observed that 36.1% of items displayed one red traffic-light, while 40.5% had two, and 8.9% had three, and none receiving all four red traffic-light simultaneously (indicating high levels of fat, SFAs, sugars, and salt). Furthermore, UPFs were found to be prevalent within the green FoP traffic-light labelling category, with figures ranging from 39.9% in products low in fat to 38.6% in products low in saturated fatty acids (SFAs), through 39.9% in products containing sugar and 37.3% in products low in salt. Additionally, 14.6% of UPFs displayed no red FoP traffic-light labelling. These included items such as flavored milks, custards, industrial juices, and malt beverages.
It is well-established that UPFs tend to be high in energy, fats, sugar, and sodium, while lacking in dietary fiber and essential micronutrients [44]. Hence, it was expected that the frequency of UPFs would be reduced in the category signifying the highest nutritional quality, indicated either by the color green or the absence of red traffic-lights. Our results align with those of the UK National Diet and Nutrition Survey [45], which discovered that not all UPFs exhibited an unhealthy nutrient profile, with more than half of them lacking any red FoP traffic-lights. These findings imply that FoP traffic-light labelling, serving as a nutrient profiling system, is capable of distinguishing the nutritional quality of food and beverages to some extent, but it only partially captures the extent and purpose of food processing. In this research, we observed that two food items, both labeled with the same color on Front-of-Pack (FoP) traffic-light labels, actually belong to different NOVA classifications. As example, cream caramel received green and amber FoP traffic-light labels, but it falls under NOVA 4 (UPFs), whereas Laban up also received green and amber FoP traffic-light labels but is classified under NOVA 1.
Typically, products labeled with a green FoP traffic-light are perceived as healthier, which can lead to higher intentions to purchase. Hence, in the absence of information pertaining to other facets of food, consumers may primarily rely on the nutritional quality of food when making food choices, irrespective of other individual factors. In the other hand, food producers tend to reformulate their products to achieve more favorable FoP labelling by decreasing sugar, fat, and salt content or augmenting fiber content to attract consumers, regardless of the degree and scope of processing necessitated for such transformation.
UPFs are characterized as ready-to-eat products primarily comprised of limited or no whole foods, typically demonstrating low nutritional qualities [46,47]. This poses a substantial concern, particularly in light of the increasing worldwide consumption of UPFs. Previous research has shown an association between higher UPF consumption and adverse health outcomes such as obesity, hypertension, breast cancer, diminished life expectancy, and potential risk on both maternal and neonatal health [48,49,50,51]. Some studies have proposed that exposure to endocrine-disrupting chemicals may represent a potential mechanism linking UPF intake to adverse health outcomes [49,52,53]. In addition, an alternative meta-analysis, involving 40 prospective cohort studies, assessed the relation between UPFs and overall mortality. The findings showed a positive correlation between increased intake of sugar-sweetened beverages, artificially sweetened beverages, processed meat, and red meat, and all-cause mortality. Conversely, the consumption of breakfast cereals demonstrated an inverse association with all-cause mortality [54].
Nonetheless, in a recent investigation [55], the researchers examined the reliability and efficacy of the Nova classification system, aiming to ascertain whether this system yields consistent food categorizations among users and its capacity to inform public health policies or furnish valuable insights for consumers. Their findings suggested that the current NOVA criteria do not enable foods to be definitively categorized as ultra-processed, highlighting the need for enhancements in the NOVA classification system to improve the consistency of food assignments.
In the present study, when considering both ultra-processing and nutritional quality of foods, more than one-quarter of the analyzed food products were classified amber and red FoP traffic-light labelling. Processing and nutritional quality are two dimensions of food that may independently or together influence the risk of chronic diseases. Some studies have investigated their individual and combined contributions on overall dietary quality. In this sense, a cross-sectional observational study provides evidence that food nutritional quality and processing are not mutually exclusive, and should be considered as underpinning dimensions of the diet [56]. A prospective cohort study found that adults with poor diets and a higher intake of UPFs faced the greatest risk of all-cause and cardiovascular disease mortality [57]. A review of prospective cohort studies demonstrated that the association between UPFs consumption and obesity and health-related outcomes remained consistent, even after accounting for dietary quality or patterns [58].
The findings of this study indicate that the nutrient values stated on a label generally align with the values obtained in the laboratory when using the tolerance levels of the European Union, with the exception of a 6.3% discrepancy in TFAs content, where the reported values are higher than the appropriate reference values. In terms of inconsistencies in the nutrition claims, 5.1% of food products with claims did not comply with the statement “sugar free” or “low salt”. These findings underscore the significance of vigilant monitoring of nutritional labels as a means to implement measures that promote the well-being of consumers.
The limitation of this study lies in the potential bias introduced during the selection of food products, given that a majority of the chosen items were processed and UPFs accessible in the Oman market. All inquiries were thoroughly deliberated and resolved through unanimous consensus among all the authors.
5. Conclusions
The results showed consistency between NOVA classification and FoodEx2 system in terms of food processing but the labelling captures only the nutritional quality of food and beverage and not the extend of food processing whereas they are complementary. In addition, non-compliance with nutritional claims and nutrition information was identified. These findings emphasize the importance of implementing strategies to address the regulation of UPFs and improve labeling and information for consumers. Government strategies should set up on the one hand, guidelines and regulations to limit the production and marketing of UPFs, especially targeting their negative health effects, and on the other hand, clear and informative labelling which includes not only the nutritional content but also any potential health risks associated with UPFs.
Supplementary Materials
The following supporting information can be downloaded at the website of this paper posted on Preprints.org., Table S1: Food description and coding according FoodEx2 system; Table S2: Classification of food products according the NOVA system; Table S3: Classification of food items according the EMR nutrient profile; Table S4: Nutrient composition of sampled food products; Table S5: Creation of Front of Pack (FoP) nutrition labelling in units of mass and units per portion; Table S6: Percentage reference intake (% RI) and Scores of IR information; Table S7: Label and laboratory values comparison.
Author Contributions
Conceptualization, S.A., A.A.J. and J.E.A.; methodology, S.A. and J.E.A; validation, S.A.S., J.A.G. and I.A.G.; formal analysis, S.A.S. and J.E.A.; investigation, J.A.G.; data curation, S.A.S., I.A.G. and J.E.A.; writing—original draft preparation, J.E.A.; writing—review and editing, S.A., S.A.S., J.A. and I.A.G.; supervision, S.A.; project administration, S.A.; funding acquisition, S.A. All authors have read and agreed to the published version of the manuscript.
Funding
This research was funded by AL JISR FOUNDATION, https://www.aljisrfoundation.org/ and World Health Organization, EMRO.
Informed Consent Statement
Not applicable.
Data Availability Statement
All of the data are contained within the article and the supplementary material.
Acknowledgments
United Integrated Laboratories for conducting the analysis.
Conflicts of Interest
The authors declare no conflicts of interest.
References
- Cunningham, J.; Sobolewski, R. Food composition databases for nutrition labelling: Experience from Australia. J Food Compost Ana 2011, 24(4), 682–685. [Google Scholar] [CrossRef]
- Chiu, T.H.; Huang, H.Y.; Chiu, Y.F.; Pan, W.H.; Kao, H.Y.; Chiu, J.P.; Lin, M.N.; Lin, C.L. Taiwanese vegetarians and omnivores: dietary composition, prevalence of diabetes and IFG. PloS One 2014, 9(2), e88547. [Google Scholar] [CrossRef]
- Drewnowski, A.; Rehm, C.D.; Martin, A.; Verger, E.O.; Voinnesson, M.; Imbert, P. Energy and nutrient density of foods in relation to their carbon foot print. Am J Clin Nutr 2015, 101(1), 184–191. [Google Scholar] [CrossRef]
- Jansen, L.; Roodenburg, A. J. The use of food composition data in the choices international programme. Food Chemistry 2016, 193, 196–202. [Google Scholar] [CrossRef]
- Westenbrink, S.; Brunt, K.; Van der Kamp, J.W. Dietary fibre: challenges in production and use of food composition data. Food chemistry 2013, 140(3), 562–567. [Google Scholar] [CrossRef]
- Dahdouh, S.; Grande, F.; Espinosa, S.N.; Vincent, A.; Gibson, R.; Bailey, K.; King, J.; Rittenschober, D.; Charrondière, U.R. Development of the FAO/INFOODS/IZINCG global food composition database for phytate. J Food Compost Ana 2019, 78, 42–48. [Google Scholar] [CrossRef] [PubMed]
- Švarc, P.L.; Jensen, M.B.; Langwagen, M.; Poulsen, A.; Trolle, E.; Jakobsen, J. Nutrient content in plant-based protein products intended for food composition databases. J Food Compost Anal 2022, 106, 104332. [Google Scholar] [CrossRef]
- Greenfield, H.; Southgate, D.A.T. Food composition data. Production, management and use, 2nd ed; Food and Agricultural Organization of the United Nations: Rome, 2003. [Google Scholar]
- World Health Organization. Regional Office for the Eastern Mediterranean Non-communicable diseases in the Eastern Mediterranean Region / World Health Organization. Regional Office for the Eastern Mediterranean (EMRO Technical Publications Series), 2016, pages 51.
- World Health Organization. Diet, nutrition and the prevention of chronic disease. Report of a Joint WHO/FAO Expert Consultation. Geneva, World Health Organization, 2003 (WHO Technical report series, No. 916).
- He, F.J.; Jiafu, Li.; MacGregor, G.A. Effect of longer-term modest salt reduction on blood pressure. Cochrane Database of Systematic Reviews and meta-analysis of randomized trials. Bmj 2013, 346. [Google Scholar]
- Cutler, J.A.; Follmann, D.; Allender, P.S. Randomized trials of sodium reduction: an overview. Am J Clin Nutr 1997, 65, 643–651. [Google Scholar] [CrossRef] [PubMed]
- He, F.J.; MacGregor, G.A. How far should salt intake be reduced? Hypertension 2003, 42, 1093. [Google Scholar] [CrossRef] [PubMed]
- Strazzullo, P.; D'Elia, L.; Kandala, N.; Cappuccio, F.P. Salt intake, stroke, and cardiovascular disease: meta-analysis of prospective Studies. Bmj 2009, 339, b4567. [Google Scholar] [CrossRef] [PubMed]
- Michels, N.; Van der Meulen, K.; Huybrechts, I. Dietary Trans Fatty Acid Intake in Relation to Cancer Risk: A Systematic Review. JCO Glob Oncol 2018, 4. [Google Scholar] [CrossRef]
- Islam, M.A.; Amin, M.N.; Siddiqui, S.A.; Hossain, M.P.; Sultana, F.; Kabir, M.R. Trans fatty acids and lipid profile: A serious risk factor to cardiovascular disease, cancer and diabetes. Diabetes Metab. Syndr. Clin. Res. Rev. 2019, 13, 1643–1647. [Google Scholar] [CrossRef]
- De Souza, R.J.; Mente, A.; Maroleanu, A.; Cozma, A.I.; Ha, V.; Kishibe, T.; Uleryk, E.; Budylowski, P.; Schünemann, H.; Beyene, J. Intake of saturated and trans unsaturated fatty acids and risk of all-cause mortality, cardiovascular disease, and type 2 diabetes: Systematic review and meta-analysis of observational studies. Bmj 2015, 351, h3978. [Google Scholar] [CrossRef] [PubMed]
- Wang, Q.; Afshin, A.; Yakoob, M.Y.; Singh, G.M.; Rehm, C.D.; Khatibzadeh, S.; Micha, R.; Shi, P.; Mozaffarian, D.; Global Burden of Diseases Nutrition and Chronic Diseases Expert Group (NutriCoDE). Impact of nonoptimal intakes of saturated, polyunsaturated, and trans fat on global burdens of coronary heart disease. J. Am. Heart Assoc. 2016, 5, e002891. [Google Scholar] [CrossRef]
- Al-Jawaldeh, A.; Abbass., M.M. Unhealthy Dietary Habits and Obesity: The Major Risk Factors Beyond Non-Communicable Diseases in the Eastern Mediterranean Region. Frontiers in Nutrition 2021, 9, 817808. [Google Scholar] [CrossRef] [PubMed]
- Hoteit, M.; Zoghbi, E.; Rady, A.; Shankiti, I.; Al-Jawaldeh, A. Fatty acids quality in middle eastern traditional dishes, arabic sweets and market foods frequently consumed in Lebanon. Nutrients 2021, 13(7), 2462. [Google Scholar] [CrossRef]
- World Health Organization. Noncommunicable diseases (NCD) Country profile. 2018.
- World Health Organization/Ministry of Health in Sultanate of Oman. (2017). National health survey of non-communicable diseases risk factors in Sultanate of Oman. STEPS survey report. Centre of Studies and research, Directorate General Planning and Studies, Ministry of Health, Sultanate of Oman, 2017, pp. 238.
- Association of Official Analytical Chemists. AOCS Official Method Ce 2-66. Preparation of Methyl Esters of Fatty Acids. 7th Ed. 2017.
- Association of Official Analytical Chemists. Official methods of analysis of AOAC International, Method 985.35. 2008.
- Ruosch, A. J.; Ellingson, D. J. Sugar Profile Method by High Performance Anion Exchange Chromatography with Pulsed Amperometric Detection in Food, Dietary Supplements, Pet Food and Animal Feed: Interlaboratory Validation Study, Final Action 2018.16. Journal of AOAC International 2018, qsad138. [Google Scholar] [CrossRef]
- Association of Official Analytical Chemists. Official methods of analysis of AOAC International, AOAC Official Method 960.52 Microchemical Determination of Nitrogen. 2008.
- Association of Official Analytical Chemists. Official methods of analysis of AOAC International, Proximate analysis of milk-based infant. Method 986.25-1988. 2002.
- FAO/INFOODS. Guidelines for Checking Food Composition Data prior to the Publication of a User Table/Database; FAO: Rome, 2012. [Google Scholar]
- European Food Safety Authority. Data standardization: Food classification standardization – The FoodEx2 system. In: EFSA [online]. Available online: https://www.efsa.europa.eu/en/data/data-standardisation accessed on January 2024.
- FAO. FAO/WHO GIFT food groups and sub-groups. In: FAO [online]. Available online: http://www.fao.org/giftindividual-food-consumption/methodology/food-groups-and-sub-groups/en/ accessed on January 2024.
- European Food Safety Authority. Technical report on the raw primary commodity (RPC) model: strengthening EFSA’s capacity to assess dietary exposure at different levels of the food chain, from raw primary commodities to foods as consumed. EFSA supporting publication. 2019. [Google Scholar]
- Monteiro, C.A.; Levy, R.B.; Claro, R.M.; Ribeiro de Castro, I.R.; Cannon, G. A new classification of foods based on the extent and purpose of their processing. Cad. Saúde Pública 2010, 26, 2039–2049. [Google Scholar] [CrossRef]
- World Health Organization. Nutrient profile model for the marketing of food and non-alcoholic beverages to children in the WHO Eastern Mediterranean Region. WHO Regional Office for the Eastern Mediterranean. WHO-EM/NUT/278/E. 2017.
- World Health Organization. Guideline: Sodium intake for adults and children; World Health Organization: Geneva, 2012. [Google Scholar]
- World Health Organization. Guideline: Sugar intake for adults and children; World Health Organization: Geneva, 2015. [Google Scholar]
- World Health Organization. Diet, nutrition and the prevention of chronic diseases: report of a joint WHO/FAO expert consultation; WHO Technical Report Series 916; WHO: Geneva, 2003. [Google Scholar]
- Department of Health, Food Standards Agency, Northern Ireland and Wales and British Retail Consortium. Guide to creating a front of pack (FoP) nutrition label for pre-packed products sold through retail outlets. 2016. Available online: https://www.gov.uk/government/publications.
- European Parliament, Council of the European Union. Regulation (EC) No 1924/2006 of the European Parliament and of the Council of 20 December 2006 on nutrition and health claims made on foods. 20 December.
- European Union Law (EUR-Lex). Regulation (EU) No 1169/2011 of the European Parliament and of the Council of 25 October 2011 on the provision of food information to consumers, amending Regulations (EC) No 1924/2006 and (EC) No 1925/2006 of the European Parliament and of the Council, and repealing Commission Directive 87/250/EEC, Council Directive 90/496/EEC, Commission Directive 1999/10/EC, Directive 2000/13/EC of the European Parliament and of the Council, Commission Directives 2002/67/EC and 2008/5/EC and Commission Regulation (EC) No 608/2004 Text with EEA relevance. Document 32011R1169. EU FIC Annex XIII part B. https://eur-lex.europa.eu/eli/reg/2011/1169/oj/eng. Available online: https://eur-lex.europa.eu/eli/reg/2011/1169/oj/eng.
- European Commission. Health and Consumers Directorate-General. Labelling nutrition vitamins minerals-guidance tolerances. 2012. Available online: https://food.ec.europa.eu/system/files/2016-10/labelling_nutrition-vitamins_minerals-guidance_tolerances_1212_en.pdf accessed on August 2023.
- European Commission. Commission Regulation (EU) 2019/649 of 24 April 2019 amending Annex III to Regulation (EC) No 1925/2006 of the European Parliament and of the Council as regards trans fat, other than trans fat naturally occurring in fat of animal origin. 2019. Available online: http://data.europa.eu/eli/reg/2019/649/oj.
- Official Journal of the European Union. Regulation (EC) No 1924/2006 of the European Parliament and of the Council of 20 December 2006 on nutrition and health claims made on foods. 2006. Available online: http://data.europa.eu/eli/reg/2006/1924/oj.
- StataCorp. Stata Statistical Software: Release 14.0; StataCorp LP: College Station, TX, 2015. [Google Scholar]
- Gibney, M.J. Ultra-Processed Foods: Definitions and Policy Issues. Curr. Dev. Nutr 2019, 3, nzy077. [Google Scholar] [CrossRef]
- Dicken, S. J.; Batterham, R. L.; Brown, A. C. Nutrients or processing? An analysis of food and drink items from the UK National Diet and Nutrition Survey based on nutrient content, the NOVA classification, and front of package traffic light labelling. medRxiv 2023. [Google Scholar] [CrossRef]
- Martinez Steele, E.; Popkin, B.M.; Swinburn, B.; Monteiro, C.A. The share of ultra-processed foods and the overall nutritional quality of diets in the US: evidence from a nationally representative cross-sectional study. Popul. Health Metrics 2017, 15. [Google Scholar] [CrossRef]
- Moubarac, J.C.; Parra, D.C.; Cannon, G.; Monteiro, C.A. Food classification systems based on food processing: significance and implications for policies and actions: a systematic literature review and assessment. Curr. Obes. Rep. 2014, 3, 256–272. [Google Scholar] [CrossRef]
- Buckley, J.P.; Kim, H.; Wong, E.; Rebholz, C. M. Ultra-processed food consumption and exposure to phthalates and bisphenols in the US National Health and Nutrition Examination Survey, 2013–2014. Environment international 2019, 131, 105057. [Google Scholar] [CrossRef]
- Fiolet, T.; Srour, B.; Sellem, L.; Kesse-Guyot, E.; Allès, B.; Méjean, C.; Deschasaux, M.; Fassier, M.; Latino-Martel, P.; Beslay, M.; Hercberg, S.; Lavalette, C.; Monteiro, C.A.; Julia, C.; Touvier, M. Consumption of ultra-processed foods and cancer risk: results from NutriNet-Santé prospective cohort. Bmj 2018, 360. [Google Scholar] [CrossRef] [PubMed]
- Ben-Avraham, S.; Kohn, E.; Tepper, S.; Lubetzky, R.; Mandel, D.; Berkovitch, M.; Shahar, D.R. Ultra-processed food (UPF) intake in pregnancy and maternal and neonatal outcomes. Eur. J. Nutr 2023, 62, 1403–1413. [Google Scholar] [CrossRef]
- Cummings, J.R.; Lipsky, L.M.; Schwedhelm, C.; Liu, A.; Nansel, T.R. Associations of ultra-processed food intake with maternal weight change and cardiometabolic health and infant growth. Int. J. Behav. Nutr. Phys. Act. 2022, 19, 61. [Google Scholar] [CrossRef]
- Kim, H.; Hu, E.A.; Rebholz, C.M. Ultra-processed food intake and mortality in the USA: results from the Third National Health and Nutrition Examination Survey (NHANES III, 1988–1994). Public health nutrition 2019, 22(10), 1777–1785. [Google Scholar] [CrossRef] [PubMed]
- Rico-Campà, A.; Martínez-González, M.A.; Alvarez-Alvarez, I.; de Deus Mendonça, R.; de la Fuente-Arrillaga, C.; Gómez-Donoso, C.; Bes-Rastrollo, M. Association between consumption of ultra-processed foods and all causes mortality: SUN prospective cohort study. Bmj 2019, 365. [Google Scholar] [CrossRef] [PubMed]
- Taneri, P.E.; Wehrli, F.; Roa-Diaz, Z.M.; Itodo, O.A.; Salvador, D.; Raeisi-Dehkordi, H.; Bally, L.; Minder, B.; Kiefte-de Jong, J.C.; Laine, J.E.; Bano, A.; Glisic, M.; Muka, T. Association Between Ultra-Processed Food Intake and All-Cause Mortality: A Systematic Review and Meta-Analysis. Am. J. Epidemiol. 2022, 191, 1323–1335. [Google Scholar] [CrossRef]
- Braesco, V.; Souchon, I.; Sauvant, P.; Haurogné, T.; Maillot, M.; Féart, C.; Darmon, N. Ultra-processed foods: how functional is the NOVA system? European Journal of Clinical Nutrition 2022, 76(9), 1245–1253. [Google Scholar] [CrossRef]
- Julia, C.; Baudry, J.; Fialon, M.; Hercberg, S.; Galan, P.; Srour, B.; Andreeva, V.A.; Touvier, M.; Kesse-Guyot, E. Respective contribution of ultra-processing and nutritional quality of foods to the overall diet quality: Results from the NutriNet-Sante study. Eur J Nutr 2023, 62(1), 157–164. [Google Scholar] [CrossRef] [PubMed]
- Bonaccio, M.; Di Castelnuovo, A.; Ruggiero, E.; Costanzo, S.; Grosso, G.; De Curtis, A.; Cerletti, C.; Benedetta Donati, M.; de Gaetano, G.; Iacoviello, L. ; Moli-sani Stufy Investigator. Joint association of food nutritional profile by Nutri-Score front-of-pack label and ultra-processed food intake with mortality: Moli-sani prospective cohort study. Bmj 2022, 378. [Google Scholar]
- Dicken, S.J.; Batterham, R.L. The role of diet quality in mediating the association between ultra-processed food intake, obesity and health-related outcomes: a review of prospective cohort studies. Nutrients 2021, 14(1), 23. [Google Scholar] [CrossRef] [PubMed]
Figure 1.
Frequency (%) of food products classed according to the NOVA system.
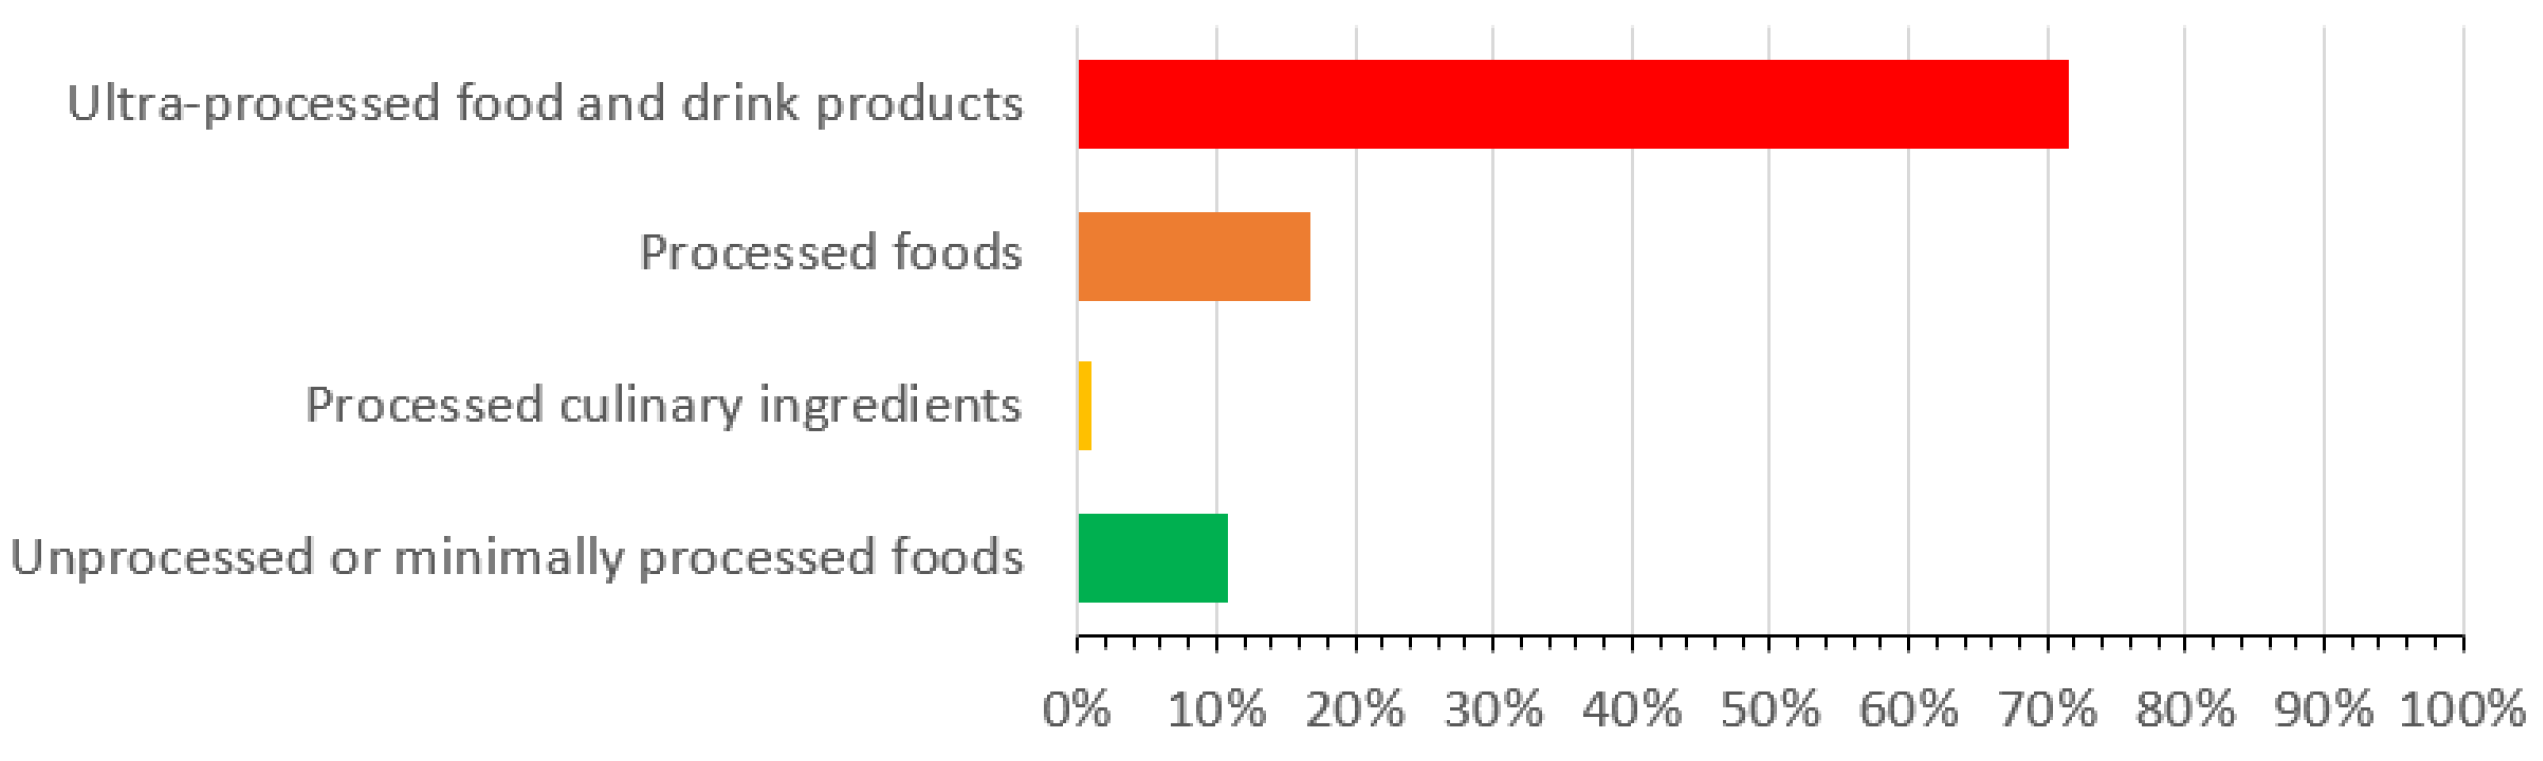

Table 1.
Analytical methods of nutrient in food products.
| Test Parameters | UIL Method of Test | Reference Method |
|---|---|---|
| Total Fat (TF) | UIL-SOP-TECH-033 | AOCS Official Method Ce 2-66, 2017 [23]. |
| Saturated Fatty Acids (SFAs) | UIL-SOP-TECH-033 | |
| Poly Unsaturated Fatty Acids (PUFAs) | UIL-SOP-TECH-033 | |
| Monounsaturated Fatty Acids (MUFAs) | UIL-SOP-TECH-033 | |
| Trans Fatty Acids (TFAs) | UIL-SOP-TECH-033 | |
| Sodium (Na)1 | UIL-SOP-TECH-008 | Official methods of analysis of AOAC international, 2008 [24]. |
| Total Sugar | UIL-SOP-TECH-023 | Official methods of analysis of AOAC international, 2007 [25]. |
| Glucose | UIL-SOP-TECH-023 | |
| Fructose | UIL-SOP-TECH-023 | |
| Sucrose | UIL-SOP-TECH-023 | |
| Maltose | UIL-SOP-TECH-023 | |
| Total Nitrogen2 | UIL-SOP-TECH-014 | Official methods of analysis of AOAC international, 2008 [26]. |
| Carbohydrates | UIL-SOP-TECH-016 | Official methods of analysis of AOAC international, 2002 [27]. |
Table 2.
Criteria for 100 g/ml of foods and drinks (per 100 ml) [32].
Table 2.
Criteria for 100 g/ml of foods and drinks (per 100 ml) [32].
| Food whether or not it is sold by volume | Drinks | |||||||
|---|---|---|---|---|---|---|---|---|
| Text | LOW | MEDIUM | HIGH | LOW | MEDIUM | HIGH | ||
| Colour code | Green | Amber | Red | Green | Amber | Red | ||
| >25% of RIs | >30% of RIs | >25% of RIs | >30% of RIs | |||||
| Total Fat | ≤3.0 g/100g | >3.0 to ≤17.5 g/100g | >17.5 g/100g | >21 g/portion | ≤1.5 g/100ml | >1.5 to ≤8.75 g/100ml | >8.75 g/100ml | >10.5 g/portion |
| SFAs | ≤1.5 g/100g | >1.5 to ≤5.0 g/100g | >5.0 g/100g | >6.0 g/portion | ≤0.75 g/100ml | >0.75 to ≤2.5 g/100ml | >2.5 g/100ml | >3.0 g/portion |
| Sugars | ≤5.0 g/100g | >5.0 to ≤22.5 g/100g | >22.5 g/100g | >27 g/portion | ≤2.5 g/100ml | >2.5 to ≤11.25 g/100ml | >11.25 g/100ml | >13.5 g/portion |
| Salt | ≤0.3 g/100g | >0.3 to ≤1.5 g/100g | >1.5 g/100g | >1.8 g/portion | ≤0.3 g/100ml | >0.3 to ≤0.75 g/100ml | >0.75 g/100ml | >0.9 g/portion |
Table 3.
Reference intake (RI) for FoP nutrition labels [37].
Table 3.
Reference intake (RI) for FoP nutrition labels [37].
| Nutrient | Value | Nutrient | Value |
| Energy (kJ) | 8400 | Carbohydrates (g) | 260 |
| Energy (kcal) | 2000 | Sugars (g) | 90 |
| Total Fat (g) | 70 | Protein (g) | 50 |
| Saturated fatty acids (g) | 20 | Salt (g) | 6 |
The calculation of the % RI used the following formula: % RI = (Amount of per 100 g/ml)/RI x100.
| Nutrient | Tolerances for food products |
| Protein, carbohydrates, sugars | <10 g/100 g: ± 2 g 10-40 g/100g: ± 20% >40 g/100 g: ± 8 g |
| Total Fat | <10 g/100 g: ± 1.5 g 10-40 g/100g: ± 20% >40 g/100 g: ± 8 g |
| Saturated fatty acids | <4 g/100g: ± 0.8 g ≥4 g/100 g: ± 20% |
| Sodium | <0.5 g/100g: ± 0.15 g ≥0.5 g/100 g: ± 20% |
| Trans Fatty Acids | Not exceed 2 g per 100 grams of fat |
Table 5.
Tolerances for food products with nutrition claims [42].
Table 5.
Tolerances for food products with nutrition claims [42].
| Nutrient | Conditions applying to nutrition claims |
|---|---|
| Low energy | The product does not contain more than 40 kcal (170 kJ)/100 g for solids or more than 20 kcal (80 kJ)/100 ml for liquids. |
| Sugar free | The product contains no more than 0.5 g of sugar per 100 g or 100 ml |
| Source of protein | At least 12 % of the energy value of the food is provided by protein |
| High protein | At least 20 % of the energy value of the food is provided by protein |
| Low salt | the product contains no more than 0,12 g of sodium, or the equivalent value for salt, per 100 g or per 100 ml |
Table 6.
Proportion of nutrition components found on the product label by category of food.
| Food groups | Total products | Label clear to read | Food packaging claim | Mandatory nutritional information1 | |
|---|---|---|---|---|---|
| n | % | ||||
| Group1: Natural food | 2 | 0.9 | 100.0 | 0.0 | 0.0 |
| Group2: cakes, biscuits, chocolate, sugar confectionary | 56 | 25.3 | 46.4 | 37.5 | 76.4 |
| Group3: Bread and cereal products | 7 | 3.2 | 14.3 | 100.0 | 85.7 |
| Group4: Dairy products | 45 | 20.4 | 86.7 | 53.3 | 71.1 |
| Group5: Processed meat, poultry and fish | 19 | 8.6 | 52.6 | 63.2 | 57.9 |
| Group6: Processed fruit, vegetables and legumes | 27 | 12.2 | 70.4 | 18.5 | 25.9 |
| Group7: Sauces and dressing | 22 | 10.0 | 63.6 | 22.7 | 54.6 |
| Group8: Beverages | 43 | 19.5 | 83.7 | 44.2 | 27.9 |
| Total | 221 | 100.0 | 66.5 | 42.1 | 55.5 |
1: energy, fat, saturates, carbohydrate, sugars, protein and salt.
Table 7.
Energy and nutrient values for 100 g edible portion of food products distributed into categories.
Table 7.
Energy and nutrient values for 100 g edible portion of food products distributed into categories.
| Natural food (n=2) | Sweet snacks, cakes, biscuits, chocolate and sugar confectionary (n=56) | Bread and cereal products (n=7) | Dairy products (n=45) | Processed meat, poultry and fish (n=19) | Processed fruit, vegetables and legumes (n=27) | Sauces and dressing (n=22) | Beverages (n=43) | |
| Energy (kJ) | 1407.41 | 1933.9 | 1744.8 | 745.8 | 761.0 | 488.2 | 592.4 | 461.4 |
| 1393.0-1421.92 | 486.2-2669.3 | 1624.5-1974.2 | 121.0-1468.5 | 450.5-1116.6 | 212.1-1667.9 | 11.6-2992.9 | 55.3-2201.8 | |
| Energy (kcal) | 331.2 | 461.6 | 412.7 | 179.8 | 181.8 | 115.4 | 142.3 | 109.2 |
| 327.8-334.6 | 115.1-643.3 | 383.0-470.7 | 28.7-353.5 | 106.0-268.8 | 50.1-392.7 | 2.72-727.5 | 13.0-526.8 | |
| Protein (g) | 0 | 7.3 | 10.3 | 6.8 | 18.3 | 4.3 | 0.8 | 2.1 |
| 0 | 0.0-26.0 | 7.2-18.3 | 1.7-24.3 | 11.7-25.6 | 0.4-7.6 | 0.0-5.2 | 0.0-24.9 | |
| Total Fat (g) | 0 | 22.2 | 7.2 | 14.8 | 9.4 | 1.7 | 9.7 | 2.2 |
| 0 | 0.0-51.9 | 2.0-20.9 | 0.6-34.1 | 0.0-20.6 | 0.0-20.8 | 0.0-79.2 | 0.0-29.6 | |
| Saturated Fatty Acids (g) | 0 | 9.5 | 3.3 | 9.7 | 4.0 | 0.4 | 2.2 | 1.4 |
| 0 | 0.0-26.8 | 0.4-11.4 | 0.4-27.8 | 0.0-10.3 | 0.0-2.3 | 0.0-13.6 | 0.0-20.2 | |
| Poly Unsaturated Fatty Acids (g) | 0 | 4.0 | 1.3 | 1.4 | 2.1 | 0 | 0 | 0 |
| 0 | 0.0-18.6 | 0.5-2.7 | 0.0-7.3 | 0.0-5.9 | 0 | 0 | 0.0-0.7 | |
| Monounsaturated Fatty Acids (g) | 0 | 8.8 | 2.6 | 3.3 | 3.4 | 0.7 | 2.4 | 0.5 |
| 0 | 0.0-30.1 | 0.1-6.9 | 0.1-11.4 | 0.0-8.2 | 0.0-11.7 | 0.0-22.0 | 0.0-6.5 | |
| Trans Fatty Acids (g) | 0 | 0.1 | 0 | 0.2 | 0 | 0 | 0 | 0 |
| 0 | 0.0-4.1 | 0 | 0.0-1.8 | 0.0-0.2 | 0 | 0 | 0.0-0.7 | |
| Carbohydrates (g) | 82.8 | 58.2 | 76.6 | 5.0 | 6.0 | 20.8 | 12.8 | 20.3 |
| 81.9-83.6 | 13.7-125.3 | 62.1-84.2 | 0.0-15.4 | 1.0-20.9 | 9.4-88.3 | 0.4-41.6 | 3.0-96.9 | |
| Total Sugar (g) | 80.7 | 20.4 | 18.9 | 2.7 | 0.5 | 6.3 | 9.5 | 18.7 |
| 80.3-81 | 0.0-81.5 | 8.2-27.7 | 0.0-15.3 | 0.0-4.0 | 0.1-63.8 | 0.0-34.1 | 2.2-96.9 | |
| Glucose (g) | 37.1 | 3.9 | 3.1 | 0.4 | 0.4 | 3.0 | 3.6 | 3.0 |
| 37.1-37.2 | 0.0-81.5 | 0.2-9.8 | 0.0-1.8 | 0.0-3.4 | 0.0-33. | 0.0-17.8 | 0.0-31.9 | |
| Fructose (g) | 43.4 | 1.0 | 2.4 | 0 | 0.1 | 1.2 | 2.7 | 3.0 |
| 42.9-43.8 | 0.0-6.8 | 0.0-9.9 | 0.0-0.2 | 0.0-0.2 | 0.1-15.9 | 0.0-15.6 | 0.0-28.7 | |
| Sucrose (g) | 0.1 | 15.1 | 13.7 | 0.5 | 0.1 | 1.7 | 3.1 | 9.5 |
| 0.1-0.1 | 0-52.5 | 4.0-28.1 | 0.0-11.4 | 0.0-0.6 | 0.1-8.1 | 0.0-16.3 | 0.0-87.9 | |
| Maltose (g) | 0.1 | 0.6 | 0.2 | 0 | 0 | 0.4 | 0.8 | 0.2 |
| 0.1-0.1 | 0-5.7 | 0.0-1.1 | 0.0-0.2 | 0.0-0.1 | 0.0-9.0 | 0.0-7.7 | 0.0-3.9 | |
| Lactose (g) | 0.1 | 1.3 | 0.1 | 1.9 | 0.1 | 0.1 | 0.4 | 3.2 |
| 0.1-0.1 | 0.0-8.1 | 0.0-0.3 | 0.0-6.2 | 0.0-0.8 | 0.0-0.5 | 0.0-2.0 | 0.0-45.9 | |
| Sodium (mg) | 0 | 338.6 | 433.8 | 540.8 | 485.0 | 690.0 | 3372.7 | 44.4 |
| 0 | 0.0-1542.5 | 0.3-1364.3 | 0.0-1898.8 | 211.2-1301.1 | 0.0-5040 | 163.5-19900 | 0.0-329.7 |
1: Mean. 2: min-max.
Table 8.
Percentage of daily reference intake scores of analyzed food products.
| Nutrient | Percentage daily reference intake provided by food products | |||
|---|---|---|---|---|
| Low score1 (%) | Medium score2 (%) | Good score3 (%) | High score4 (%) | |
| Energy | 39.8 | 15.4 | 22.6 | 22.2 |
| Protein | 33.9 | 23.5 | 25.3 | 17.2 |
| Carbohydrates | 47.1 | 21.3 | 8.1 | 23.5 |
| Sugars | 47.1 | 13.6 | 18.1 | 21.3 |
| Total Fat | 52.9 | 3.6 | 7.7 | 35.8 |
| Saturated Fatty Acids | 43.4 | 6.8 | 8.6 | 58.8 |
| Salt (g) | 35.3 | 14.0 | 22.2 | 28.5 |
1: Percentage of daily reference intake is < 5%. 2: Percentage of daily reference intake between 5 and 10%. 3: Percentage of daily reference intake between 11 and 20%. 4: Percentage of daily reference intake is > 20%.
Table 9.
Percentage of daily reference intake scores of analyzed food products.
| Name of Product & Brand | Claim | Nutrient content | Comment |
|---|---|---|---|
| Activia Full Fat Fresh Laban | Source of protein | Protein: 21.0% of energy value | Compliant |
| Activia Full Fat Plain Yoghurt | High protein | Protein: 24.8% of energy value | Compliant |
| Boildchick Peas Mara | Sugar free | Sugar: 0.74 g/100 g of the product | Non-compliant |
| Maggi Chicken Stock Less Salt | Low salt | Salt: 1.5 g /100 g of the product | Non-compliant |
| Lipton Peach Ice Tea | Low energy | Energy: 18.5 kcal /100 ml of the product | Compliant |
| Mazoon spread cheese cheddar | TFAs1 free | TFAs: ≤ 0.5% of energy | Compliant |
| Mazoon spread cheese | TEAs free | TFAs: ≤ 0.5% of energy | Compliant |
1: Trans Fatty Acids.
Disclaimer/Publisher’s Note: The statements, opinions and data contained in all publications are solely those of the individual author(s) and contributor(s) and not of MDPI and/or the editor(s). MDPI and/or the editor(s) disclaim responsibility for any injury to people or property resulting from any ideas, methods, instructions or products referred to in the content. |
© 2024 by the authors. Licensee MDPI, Basel, Switzerland. This article is an open access article distributed under the terms and conditions of the Creative Commons Attribution (CC BY) license (https://creativecommons.org/licenses/by/4.0/).
Copyright: This open access article is published under a Creative Commons CC BY 4.0 license, which permit the free download, distribution, and reuse, provided that the author and preprint are cited in any reuse.


