
Submitted:
07 February 2024
Posted:
08 February 2024
You are already at the latest version
Abstract
Quantifying different stocking rates effects in three study areas placed at Mediterranean forest (Cuenca, Spain) was conducted by applying a multiparametric soil quality index, SQI, developed in undisturbed forest soils (> 40 years). The main objective is to advance in the development and application of multiparametric indexes which allow for soil condition assessment. For it, is analyse the effectiveness of a multiparametric soil quality index (SQI) as an indicator livestock impacts on the soil in mediterranean forests. Control areas without stocking rates were compared in forest stands with different age (Thicket forest stand, < 30 years; High polewood forest stand, 30-60 years; Old growth forest stand, > 60 years); with various intensity grazing areas (permanent livestock passage: inactive sheepfold for 2-3 years, and active sheepfold; intermittent livestock passage: bare soil, pine stand, scrubland). The multiparametric soil quality index (SQI) applied sensitive to changes in forest ecosystems depending of different stocking rates. However, for even more preci-sion to assess cattle alteration, multiparameter index recalibrated, creating a new one; Soil Status Index by Livestock (SSIL). Correlation between quality ranges obtained with both indexes in dif-ferent study areas suggest that SSIL can be considered a livestock impact reference indicator in Mediterranean forest soils.
Keywords:
Stocking rate unit
; Livestock unit
; Forest-pasture systems
; Multiparametric index
; Environmental impact assessment
1. Introduction
Sheep farming is an important source of wealth in Cuenca Mountain´s range (Spain) being traditionally practised along with agricultural activities. Most of the sector is bounded with extensive livestock practises, mostly associated with areas in which little economic alternatives are found. That is why this activity plays a key role in terms of territorial articulation, environment preservation and employment promotion in rural areas from Castilla-La Mancha [1]. Spain represents around 10% of the sheep and goat total livestock from the European union (UE-27) and Castilla-La Mancha contribution to national total numbers rise to 11%, according to official agency data, provided by Spain´s government.
Large stocking rate (LSR), determined as a measuring unit comparing different livestock categories depending on the type of animal, age or size (R.D 1053/2022 and R.D 1131/2010), allow to stablish the maximum capacity of a farm. This way, in Spain, the average size of a livestock farming is 18,8 LSR by farm, while in Castilla-La Mancha is 47,4 LSR by farm (wide ranges between autonomous regions). Special mention to Las Majadas (Cuenca´s district) located north in Castilla-La Mancha, where the study area is placed. This area, with a total pasture area of 3.860,19 hectares has a total of 1.126 LSR in extensive practise, which translates as a value of livestock loading unit (LLU= LSR·ha-1) of 0,30 LLU. Of the total number of livestock loading units of the district, 63% corresponds to ovine cattle, 23% to small ruminants, 11,6% to bovine cattle, 1,9 % to equine cattle, 0,1% caprine cattle and a 0,4% to wild ungulates such as deers and fallow dees (statistics obtained from regional forest administration).
Grazing is a biotic factor which affects the ecosystem structure, pasture dynamic [2]; [1] and microbial soil community, mainly by compaction [3] and due to changes in carbon and nutrients balance´s [4]. Nevertheless, microbial biomass response to grazing is not uniform, sometimes increasing with the intensity or not. According to [5], positive effects are commonly visible in high fertility soil ecosystems, while negative ones are more noticeable in those less productive.
Even though forest-pasture systems are considered a sustainable alternative as an integrate livestock management [6] prolonged grazing could be harmful over the soil [7]. Defoliation, trampling and excretes related to an intense livestock use of the soil [8] are the cause of disturbances over its physicochemical properties: micro and macro-nutrients availability (nitrogen, phosphorus, potassium), carbon release from organic matter reservoirs [9], as well as profile salinity [10], while contributing to generate soil erosion [11]. Same way, soil microorganisms, which take part in recycling nutrients coming from plant waste and animals, are also altered in the forest-pasture systems [5,12].
Multiparametric soil quality indexes include physical, chemical and biological soil properties so balance can be reflected when certain environmental conditions are reached if soil functionality is to be ensured. A valid soil quality index must be sensible to external disturbances [13] in order to assess its state.
With this paper, an advance in the application of multiparametric soil quality indices as indicators of environmental impacts is being targeted, notably, those impacts caused by livestock on Mediterranean forest ecosystems. Particularly, the objectives have been: i) to apply a soil quality index (SQI), obtained from mediterranean forest soils undisturbed at least in the last 20-40 years (5 forests in Cuenca´s mountain range, Spain) [14], to soils with various stocking rates intensities, hence sensitivity, as an indicator of livestock impacts, could be evaluated (active soils; 3-year inactive soils, and soils with occasional or null activity); ii) to apply a calibration procedure to readjust a new multiparametric index which allow more precision when evaluating forest soils impact´s caused by grazing activities.
2. Materials and Methods
2.1. Study area and experimental design
Study area was selected in a forest stand from Cuenca´s province (Spain) in the Cuenca´s mountain range natural park, named “Ensanche de Las Majadas” (forest code: MUP 133). It is placed east-central Spain (Figure 1), where continental mediterranean climate made cold winters and mild summer, mean altitude round 1.440 meters, average rainfall is 934 mm while mean temperature is 9,10 °C ranging from -3,70 below zero to 28,50 °C (Spanish Ministery of agriculture, fisheries and food). Predominant type of soil is classified as Inceptisol Xerept Haploxerept [15] (National Centre for Geographic Information CNIG), with a cambrian endopedion and rocky outcrops. Similar conditions can be found all over the area, except from shrub influence (Scr) and bare soil (BS) areas, where mean altitude is 713 meters and rocky areas are even more frequent.
Control areas main forest species is the Spanish black pine (Pinus nigra Arn. ssp salzmannii), sometimes mixed with sporadic individuals of Scots Pine (Pinus sylvestris. L) in Pine stand (Ps) areas. Shrub layer´s composition (Scr) is formed by Prickly junipers (Juniperus oxycedrus L.), howthorns (Crataegus monogyna Jacq.), common barberries (Berberis hispanica Boiss & Reut) and common box (Buxus sempervirens L.). Moreover, other genres as Thymus, Lavandula or Eryngium appear randomly all over the place. Areas without woody vegetation are occupied by pastures. A description of the study´s areas vegetation is shown in Table 1 along with dominant species and coverage.
Three control areas were selected. The first one with no stocking rates in Spanish Black pine stands (Pinus nigra Arn. ssp salzmannii) and three different stand ages: thicket forest stand (Tfst) with less than 30 years; high polewood forest stand, (Hfst), between 30 and 60 years; and old growth forest stand, (Ofst), over 60 years old. In this case, native wild ungulates presence is very sporadic. Second control area is formed by five places with livestock activity; two of them permanently used by livestock; active sheepfold, Ash, with an LLU of 45 and inactive sheepfold for at least 2-3 years, Ish, with an LLU reduced to 0,30). Remaining areas with intermittent livestock activity, even though habitually is used by cattle, had been selected according to vegetation coverage; bare soil (BS), shrubland-pasture type (Scr) and pine stand (Pst). These last areas, located in trashumance routes have a LLU of 0,30. (Figure 1, Table 1)
10x10 m plots were taken as sampling unit, with n=3 samples in each plot, except in control areas, where n=2. Each one was constituted by 6 subsamples, in order to minimize spatial variability [16,17]. Sampling took place for a whole annual cycle (spring, summer, autumn and winter) starting in autumn 2016. A total of 84 samples were taken; 6 from intense livestock activity areas (3 samples in 2 plots), 9 from intermittent livestock activity areas (3 samples in 3 plots) and 6 controls (2 samples in 3 plots). Times 4 seasons make a total of n=168 samples (two replicas included).
2.2. Parameters analyzed
A series of psychochemical, microbiological and enzymatic soil parameters have been analyzed: gravimetric moisture (M, %); pH using a pHmeter and electric conductivity (EC mS/m-1) (Navi Horiba model); total organic carbon (TOC, %) [18], nitrogen, (N,%) [19]; phosphorus (P, ppm) [20]; basal respiration (BR, μgC-CO2 g-1 day-1) [21]; microbial biomass carbon (MBC, μgC g-1) (Vance et al., 1987 fumigation-extraction method , adapted by [22]; dehydrogenase enzyme activity (DHA, μmol (INTF) g-1 h-1) [22]; alkaline phosphatase (APA, μmol (PNF) g-1 h-1]) and β-glucosidase (β-GLU, μmol (PNF) g-1 h-1) were determined following Tabatabai and Bremmer methods [23] and urease enzymatic activity (UA, μmol (N-NH4+) g-1 h-1]) [24].
2.3. Soil quality index (SQI)
A multiparametric soil quality index (SQI) was applied, developed from Mediterranean unaltered forest soils, unmanaged for at least for 20 to 40 years [14]. Those areas are mainly from 5 forests located in Cuenca Mountain´s range (Spain), including the study area “Ensanche de Las Majadas” where the main species is the Spanish Black Pine (Pinus nigra Arn. ssp salzmannii). Index is shown in Equation 1, obtained from a statistical analysis of 13 psychochemical, microbiological and enzymatic variables. After using the method of principal component analysis (PCA) consecutively, representative variables chosen are: moisture (M), pH, total organic carbon (TOC), biomass carbon (MBC) and alkaline phosphatase (APA) and β-glucosidase (βGLU) enzymatical activities.
Quality soil obtained values for each study area resulting from applying equation 1 model were standardized between 0 – 1, environmental quality ranges. Every result was linked to maximum and minimum values of the whole group of data [25]. That allow an accurate comparison between different situations or proceedings in the environment.
A quartile division is carried out to establish different soil quality levels taken as reference: 0 – 0,25 low quality, 0,26 -0,50, low-medium quality, 0,51 – 0,75 high-medium quality and 0,76 – 1, high quality (Table 2).
2.4. Soil multiparametrix index development (SSIL)
A similar methodologic procedure to the one used in development of the SQI has been applied in the study areas (control and various intensity stocking rate´s soils) to calibrate a new index which evaluates livestock impacts with better precision, so that soil condition due to livestock activity can be reflected, analysing in which way that activity is sustainable or not. This new index has been defined as Soil Status Index by livestock (SSIL), following a normalization and selection process by [14] which consists in: i) select representative parameters by consecutive principal component analysis (ACP); ii) transform, normalizing data using standardized functions with each parameter according to its contribution in environmental quality. iii) Analyze values, combining it into a model, having in mind each component´s value and the selected parameter weight. Thus, a mathematic function is obtained, a combination of the selected parameters as multiparametric soil condition index.
The following steps have been: I) A group of 12 psychochemical, microbiological and enzymatic soil variables were analysed: M, pH, EC, TOC, N, P, BR, MCB, DHA, UA, APA y β-GLU. II) A first principal component analysis was carried out, 1ACP, with all the variables, selecting those with higher eigenvalue (> 1,00) as principal components (PC). For each of the selected principal components, those with the maximum eigenvalue and those with an eigenvalue within 90% of the maximum are chosen as representative parameters [26]. III) To discard correlated variables, a second principal component analysis was carried out, 2ACP, using only those selected parameters beforehand. IV) A third and last principal component analysis was carried out, 3 ACP, to obtain the coefficients related to those selected parameters considered into the index. These variables are standardized by functions “more is better” [27], and gaussian type [28]. V) At last, the index is defined by a lineal combination of those transformed and weighted values, giving as a result the SSIL equation (Soil Status Index by Livestock).
2.5. Statististical analisys
Analysis of variance was applied, using general linear models (GLM): i) to characterize physicochemical, microbiological and enzymatic parameters between different study areas. ii) to study soil quality index (SQI) sensitivity in order to analyse the effects of stocking rates intensity, season and interactions between these two, over SQI results.
Consecutive principal component multifactorial analysis were carried out to calibrate a new Soil Status Index by Livestock SSIL, assessing its response significance versus livestock uses, with GLM. Regression models are applied to study relations between SQI and SSFL.
Fisher’s Least Significant Difference (LSD) method (95% confidence interval), was used, with P<0.05, and applied in cases where a significant F value was obtained. Software used for statistical analysis was Statgraphics version centurion XVI.
3. Results
3.1. Physicochemical, Microbiological and Biochemical Characterization of soils
Table 3 show all 12 edaphic variables analysed (TOC, N, P, M, pH, EC, BR, MCB, DHA, UA, APA y β-GLU) in the study area. It is observed that physicochemical parameters such as TOC, have two uniform subgroups. Higher values (more than 6,7%) are registered in Pst and Osh while the rest of the places show lower values (5,61% measured in Ash). On the contrary, N highest value appears in Ash (1,15%) without any significative differences with Pst, Ofst and Ish (1,09%, 1,08% and 1,01% respectively). Remainder areas present significantly lower values, Scr (0,87%) and BS (0,88%) being those with lowest N concentration. Ash and Ish areas show significative higher P values than others (191,78 ppm and 187,10 ppm respectively) while Scr registered the lowest values (37,98 ppm). As for humidity, areas with the highest values are Pst (38,26%) and Ofst (37,40%), BS being the one with the lowest value (19,67%). Lesser pH values are found in Ofst (5,97), followed by Hfst (6,74), while BS (7,92), Scr (7,91) and Ish (7,72) were the highest. EC values are superior in Ash (31,66) y Pst (20,45) while the other areas range within these results and the lowest ones, found in BS (14,55). Both MCB and BR show the lowest values in BS and Scr, while Ofst and Ash have the highest results.
In relation with enzymatic activities, active sheepfold (Ash) stands out showing significative higher values in urease activity (UA), as well as phosphatase activity (APA) which in control areas resulted in the lowest values for these two parameters. Dehydrogenase activity (DHA) also show the lowest values in Hfst and Ofst control areas (0,01), but BS and Scr were significantly higher (0,04). Remainder areas are defined by an intermediate value (0,03). However, β-glucosidase activity shows the highest values in control areas Ofst (59,86) y Hfst (57,45); intermediate values in Pst (51,73) and Tsft (42,70) and the rest ranges between these values and Ish results (28,28), which indicates the lowest end for that parameter (Table 3).
3.2. Sensitivity analysis of the soil quality index SQI applied
Results in Table 4 shows stocking rate, season and interactions between these two variables to have a significative influence (p < 0.001) in SQI applied values, explaining 79,20% of total variability.
3.3. New soil multiparametric index development (SSIL)
First principal component analysis carried out (1PCA) including the full set of variables considered (12) show how 3 of the components, with eigenvalue ≥ 1, explain a 66,36% of the data accumulated variance (CV) (Table 6). Selected parameters of each component are those having the higher weight (in bold and intense shade), and also being inside 90% (in bold and less intense shade).
When a second principal component analysis (2PCA) was carried out, a strong correlation between those highest weighted variables was revealed (Figure 3.2), thus it was decided to select those included in the soil quality index SQI used as reference.
At the third principal component analysis (3PCA), accumulated variance is corrected regarding 100% of the cases (CEV). Corrected component weight (CEV) together with each parameter´s weight is listed in the new index SSIL developed model (Equation 2).
Selected parameters in each consecutive ACP are shown in Figures 3.1.a, 3.2 and 3.3. The scatter plot (Figure 3.1b) shows distribution areas according to the parameters.
Moisture (M), biomass carbon (MCB) and urease activity (UA) are the selected parameters to be part of the SSIL. In Table 7, normalization equations of each variable are displayed, with the adjustment factor, critical value, optimal value, standard deviation and smallest value.
SSIL index is the result of the weighted summatory of the normalized values of moisture (M), biomass carbon (MBC) and urease activity (UA), following the model shown in Equation 2.
3.4. Sensitivity analysis of the new multiparametric index SSIL
Obtained results from fitting linear statistical models to relate SSIL variable to the factors (IZ, intensity zone, S, station and IZ x S interaction), show with a confidence level > 95.0%, the high sensitivity of the SSIL index, by stating significant differences between areas with different livestock grazing intensity under seasonal influence (Table 8).
3.5. Correlation between SQI and SSIL
The best relation between both indexes was obtained with a simple linear regression model (p<0.001), which explains 84,31% of the variability (Table 10). Correlation between both is positive and relatively strong (correlation coefficient of 0,92), although soil quality is reduced by 45% (quantified by SQI) when the effect in the soil caused by livestock increases (quantified by SSIL).
Obtained values for soil quality (SQI) and soil condition by livestock use (SSIL), standardized between 0 and 1, have allowed a correct comparison between different situations or actions in the environment, according to the different soil quality ranges taken as reference in Table 2. This way, a zone classification has been established based on soil quality and usage activity, in this case, livestock use. (Table 11, Figure 5).
Control area (Ofst) show a high quality while (Hfst, Tfst and Pst) show a medium-high quality according to the SQI range, as well as active sheepfold (Ash). The rest of the zones are classified as medium-low quality. However, when taking into account Soil Status Index by Livestock (SSIL), it can be seen that active sheepfold areas (Ash) and inactive sheepfold (Ish) would fall into a medium-high range, significantly different from the rest of the areas, possibly attributable to the greater livestock activity.
4. Discussion
From those physicochemical parameters chosen for this study, micro and macro-nutrients vary significantly between study areas. Carbon (TOC) is higher in control areas and mature stands (Ofst and Pst), where vegetation coverage contributes to organic carbon accumulation in superficial top layers of the soil (0-0,05 meters) [29]. In addition, on pine stands (Pst), light grazing enhances primary production and its own nutrients cycle in pasture ecosystems, as mentioned by [30]. Similar performance is observed with N, which is also increased in higher livestock intensity areas (Ash and Ish) where P shows the highest results as well. Livestock depositions and soil compaction due to trampling in high intensity livestock areas would elevate N and P contribution, though C availability depends more on stand age and crown type [9,31,32,33].
Relation between microbiological parameters and enzymatic activities shows that microbial biomass abundance (MBS) in active sheepfold (Ash) might be due to the accumulation of depositions coming from stocking rates; stockpiled organic wastes like litterfall in mature stands (Ofs); or both circumstances, as happened in pine stand areas (Pst). The high concentration of soil microorganisms detected might be related with organic matter accumulation, coming from animal excretes or organic wastes, in that specific area. This phenomenon might be considered as an incentive to microorganism activity and development, playing a key role in organic matter decomposition and improvement in soil health as based in studies carried out by [34], in various ecosystems of the world.
High sensitivity shown by enzymatic activities when disturbances happen made them excellent alteration indicators in soil dynamics [35]. This way, high values obtained in Urease activity and Phosphatase (in Ash and Ish), associated with nitrogen (N) and phosphorus (P) cycles, respectively, indicate an important metabolic activity related with these biogeochemical cycles, besides associated high stocking rates [36].
SQI sensitivity´s tested, its usefulness standing out in relation with the different areas and the evaluated activity. Control areas, where livestock activity is not carried out, show a superior value of soil quality. This is claimed to be caused by the essential properties of the unaltered areas of vegetation cover, such as the case of Old forest stand areas (Ofst) with high contribution of litterfall. These vegetal remains coming from pine coverage perform an important role in providing organic matter, preventing soil erosion and increasing moisture content which is reflected in the improvement of the mineralization process which leads to a higher nutrient’s liberation. [17].
Moreover, SQI utility can be proved as an indicator of activity or disturbance in soil functionality. This way, in intermittent grazing areas, although livestock activity, positive effects are observed in high fertility ecosystems (as in a standard pine forest with intermediate livestock passage, Pst), while negative effects are commonly associated with less productive ecosystems (bare soil BS, scrubland, Scr and inactive sheepfold, Ish when stocking rates are medium) [5].
Therefore, SQI applied, not only allow to assess soil quality but also helps to understand how livestock activity influence distinguished ecosystems with different fertility levels. Results in this paper support other studies showing grazing activities as having a positive influence, however fluctuating in accordance to involved ecosystems characteristics, which suggest that SQI sensitivity may distinguish various impacts depending on ecosystem conditions [37]. Nevertheless, in active sheepfold (Ash), a less productive area with a high stocking rate, it is also obtained a top value of SQI. It is suggested that these results might be caused by a significant contribution of organic matter coming from animal depositions, consequently triggering enzymes and microorganisms activation [38,39].
Despite SQI validation, when applied to assess unaltered soil´s quality with mature vegetal coverage, it is confirmed in this paper´s results, contradictory data obtained in high intensity stocking rate area lead to investigate a new index.
Validity and sensitivity of the new Soil Status Index (SSIL) is shown, obtained with the established procedure by [14] with altered and unaltered soils, to quantify objectively soil conditions against disturbances such as intense livestock activity. Significant differences observed between high, intermediate stocking rate soils and control areas suggest that SSIL is capable of quantifying effectively disturbances caused by livestock activity. Highest values from SSIL ranges appear in active sheepfold, followed by intermediate stocking rates soils with the lowest values corresponding to control areas [16].
The positive correlation between normalized quality ranges obtained with both indexes (SQI and SSIL), reinforce both SQI usefulness to assess soil quality in natural ecosystems and SSIL against quality disturbances caused by variable intensity in stocking rates. In addition, when comparing SSIL with SQI, different patterns according to stablished ranges are revealed, providing an exhaustive comprehension about soil quality and livestock activity´s impacts in the environment [40,41].
Applied methodology seems to be sensitive and robust to assess livestock activity´s impacts over soil quality. These findings highlight the importance of understanding relations between livestock activity, soil quality and how using indexes as SQI and SSIL can provide valuable information in soil management´s and livestock activity´s decision-making processes [42].
5. Conclusions
SQI (Soil Quality Index) appears to be a versatile tool, as it is sensitive to changes in soil functionality, even in the face of impacts such as grazing. Its applicability in undisturbed forest ecosystems and its ability to detect disturbances and differences between the productivity of various ecosystems make it a valuable tool.
SSIL (Soil Status Index by Livestock Activity) is presented as a specific and objective indicator to quantify the disturbance caused by the stocking rate. Its ability to objectively measure the impact of livestock activity on the soil provides valuable information on soil sustainability.
The significant correlation between the two indices reinforces their usefulness for measuring soil sustainability in the face of disturbances, suggesting that both can provide a more complete and accurate assessment of soil health in grazed forest ecosystems, as useful tools for decision-making in forest management.
The results obtained in this study encourage us to continue advancing in the objective quantification of environmental impacts on the environment through the application of multiparameter indices as indicators, which facilitates informed decision-making on sustainable forestry practices and soil restoration.
References
- Legazpi, V. La ganadería en la provincia de Cuenca en el siglo XVIII. UCLM, Cuenca, 2000.
- Bokdam, J.; Gleichman, J.M. Effects of Grazing by Free-Ranging Cattle on Vegetation Dynamics in a Continental North-West European Heathland. Journal of Applied Ecology 2000, 37, 415–431. [Google Scholar] [CrossRef]
- Jordan, D.; Ponder, F.; Hubbard, V.C. Effects of soil compaction, forest leaf litter and nitrogen fertilizer on two oak species and microbial activity. Applied Soil Ecology 2003, 23, 33–41. [Google Scholar] [CrossRef]
- Guitian, R.; Bardgett, R.D. Plant and soil microbial responses to defoliation in temperate semi-natural grassland. Plant and Soil 2000, 220, 271–277. [Google Scholar] [CrossRef]
- Bardgett, R.D.; Wardle, D.A. Herbivore-Mediated Linkages between Aboveground and Belowground Communities. Ecology 2003, 84, 2258–2268. [Google Scholar] [CrossRef]
- Mahecha, L.; Gallego, L.A.; Peláez, F.J. Situación actual de la ganadería de carne en Colombia y alternativas para impulsar su competitividad y sostenibilidad. Revista Colombiana de Ciencias Pecuarias 2016, 15, 213–225. [Google Scholar] [CrossRef]
- Gerber, P.J., Steinfeld, H., Henderson, B., Mottet, A., Opio, C., Dijkman, J., Falcucci, A. & Tempio, G. Tackling climate change through livestock – A global assessment of emissions and mitigation opportunities.; Food and Agriculture Organization of the United Nations (FAO): Rome, 2013.
- Zhang, T.; Li, F.Y.; Li, Y.; Shi, C.; Wang, H.; Wu, L.; Bai, Z.; Suri, G.; Wang, Z. Disentangling the effects of animal defoliation, trampling, and excretion deposition on plant nutrient resorption in a semi-arid steppe: The predominant role of defoliation. Agriculture, Ecosystems & Environment 2022, 337, 108068. [Google Scholar] [CrossRef]
- Basso, B., G. Shuai, J. Zhang, and G.P. Robertson. “Yield Stability Analysis Reveals Sources of Large-Scale Nitrogen Loss from the US Midwest.” Scientific Reports 2019, 9(1):1–9. [CrossRef]
- Andriulo A., Sasal C., Améndola C., Rimatori, F. Impacto de un Sistema intensivo de producción de carne vacuna sobre algunas propiedades del suelo y del agua. Revista de Investigaciones Agropecuarias, 2003,32(3):27-56. http://www.redalyc.org/articulo.oa?id=86432302.
- Yao, Z.; Shi, L.; He, Y.; Peng, C.; Lin, Z.; Hu, M.-a.; Yin, N.; Xu, H.; Zhang, D.; Shao, X. Grazing intensity, duration, and grassland type determine the relationship between soil microbial diversity and ecosystem multifunctionality in Chinese grasslands: A meta-analysis. Ecological Indicators 2023, 154, 110801. [Google Scholar] [CrossRef]
- Sankaran, M.; Augustine, D.J. Large Herbivores Suppress Decomposer Abundance in a Semiarid Grazing Ecosystem. Ecology 2004, 85, 1052–1061. [Google Scholar] [CrossRef]
- Zornoza, R.; Acosta, J.A.; Bastida, F.; Domínguez, S.G.; Toledo, D.M.; Faz, A. Identification of sensitive indicators to assess the interrelationship between soil quality, management practices and human health. Soil 2015, 1, 173–185. [Google Scholar] [CrossRef]
- Andrés-Abellán, M.; Wic-Baena, C.; López-Serrano, F.R.; García-Morote, F.A.; Martínez-García, E.; Picazo, M.I.; Rubio, E.; Moreno-Ortego, J.L.; Bastida-López, F.; García-Izquierdo, C. A soil-quality index for soil from Mediterranean forests. European Journal of Soil Science 2019, 70, 1001–1011. [Google Scholar] [CrossRef]
- Akça, R.E. ; de Alba, S. ; Álvarez, A.G. et al., Soil atlas of Europe. Luxembourg : European Soil Bureau Network,. 128 p. 2005.
- Wic Baena, C.; Andrés-Abellán, M.; Lucas-Borja, M.E.; Martínez-García, E.; García-Morote, F.A.; Rubio, E.; López-Serrano, F.R. Thinning and recovery effects on soil properties in two sites of a Mediterranean forest, in Cuenca Mountain (South-eastern of Spain). Forest Ecology and Management 2013, 308, 223–230. [Google Scholar] [CrossRef]
- Hedo, J.; Lucas-Borja, M.E.; Wic-Baena, C.; Andrés-Abellán, M.; de las Heras, J. Experimental site and season over-control the effect of Pinus halepensis in microbiological properties of soils under semiarid and dry conditions. Journal of Arid Environments 2015, 116, 44–52. [Google Scholar] [CrossRef]
- Walkley, A.J.; Black, I.A. Estimation of soil organic carbon by the chromic acid titration method. Soil Science 1934, 29–38. [Google Scholar] [CrossRef]
- Bremner, J.M. Total Nitrogen. In Methods of Soil Analysis; 1965; pp. 1149-1178.
- Olsen, S.R.; Sommers, L.E. Phosphorus. In Methods of Soil Analysis; Agronomy Monographs; 1983; pp. 403-430.
- Anderson, J.P.E. Soil Respiration. Methods of Soil Analysis Agronomy Monograph, 1982, 831-871.
- García, C., Gil, F., Hernández, T., & Trasar, C.. Técnicas de análisis de parámetros bioquímicos en suelos: Medida de actividades enzimáticas y biomasa microbiana; CEBAS-CSIC, Ed.; Ediciones Mundi-Prensa: Murcia. 2003.
- Tabatabai, M.A.a.B., J.M. Use of p-nitrophenol phosphate for the assay of soil phosphatase activity. Soil Biology Biochemistry 1969, 1, 301-307. [CrossRef]
- Kandeler, E.; Stemmer, M.; Palli, S.; Gerzabek, M.H. Xylanase, Invertase and Urease Activity in Particle - Size Fractions of Soils. In Effect of Mineral-Organic-Microorganism Interactions on Soil and Freshwater Environments; Berthelin, J., Huang, P.M., Bollag, J.M., Andreux, F., Eds.; Springer US: Boston, MA, 1999; pp. 275–286. [Google Scholar]
- Gómez Orea, D. Evaluación de impacto ambiental: un instrumento preventivo para la gestión ambiental 2º edición ed.; Mundi-Prensa, Ed.; Madrid, 2003.
- Qi, Y.; Darilek, J.L.; Huang, B.; Zhao, Y.; Sun, W.; Gu, Z. Evaluating soil quality indices in an agricultural region of Jiangsu Province, China. Geoderma 2009, 149, 325–334. [Google Scholar] [CrossRef]
- Wymore, A.W. Model-Based Systems Engineering. . CRC Press, Boca Raton. 1993.
- Whittaker, C.W., Anderson, M.S. & Reitemeier R.F. . Liming soils: An Aid to Better Farming. . USDA Farmers Bulletins 1959, 2124.
- McDonald, S.E.; Badgery, W.; Clarendon, S.; Orgill, S.; Sinclair, K.; Meyer, R.; Butchart, D.B.; Eckard, R.; Rowlings, D.; Grace, P.; et al. Grazing management for soil carbon in Australia: A review. J Environ Manage 2023, 347, 119146. [Google Scholar] [CrossRef]
- Zhang, T.; Li, F.Y.; Shi, C.; Li, Y.; Tang, S.; Baoyin, T. Enhancement of nutrient resorption efficiency increases plant production and helps maintain soil nutrients under summer grazing in a semi-arid steppe. Agriculture, Ecosystems & Environment 2020, 292, 106840. [Google Scholar] [CrossRef]
- Li, L.; He, X.Z.; Wang, M.; Huang, L.; Wang, Z.; Zhang, X.; Hu, J.; Hou, F. Grazing-driven shifts in soil bacterial community structure and function in a typical steppe are mediated by additional N inputs. Science of The Total Environment 2024, 912, 169488. [Google Scholar] [CrossRef]
- Xu, H.; You, C.; Tan, B.; Xu, L.; Liu, Y.; Wang, M.; Xu, Z.; Sardans, J.; Peñuelas, J. Effects of livestock grazing on the relationships between soil microbial community and soil carbon in grassland ecosystems. Science of The Total Environment 2023, 881, 163416. [Google Scholar] [CrossRef]
- García-Saucedo, F.; García-Morote, F.A.; Picazo, M.; Wic, C.; Rubio, E.; López-Serrano, F.R.; Andrés-Abellán, M. Responses of Enzymatic and Microbiological Soil Properties to the Site Index and Age Gradients in Spanish Black Pine (Pinus nigra Arn ssp. salzmannii) Mediterranean Forests. Forests 2024, 15, 113. [Google Scholar] [CrossRef]
- Singh, J.S.; Gupta, V.K. Soil microbial biomass: A key soil driver in management of ecosystem functioning. Science of The Total Environment 2018, 634, 497–500. [Google Scholar] [CrossRef]
- Andrés-Abellán, M.; Picazo-Córdoba, M.I.; García-Saucedo, F.; Wic-Baena, C.; García-Morote, F.A.; Rubio-Caballero, E.; Moreno, J.L.; Bastida, F.; García, C.; López-Serrano, F.R. Application of a Soil Quality Index to a Mediterranean Mountain with Post-Fire Treatments. Forests 2023, 14, 1745. [Google Scholar] [CrossRef]
- Eldor, A.P. Soil Microbiology, Ecology and Biochemistry. ; press, A., Ed.; Colorado USA, 2015.
- Mahdi M., Al-Kaisi, B.L. Soil health and Intensification of Agroecosystems; Elsevier, M.M., Ed.; 2017; p. 418.
- Akhzari, D.; Pessarakli, M.; Ahandani, S. Effects of Grazing Intensity on Soil and Vegetation Properties in a Mediterranean Rangeland. Communications in Soil Science and Plant Analysis 2015, 46, 1–9. [Google Scholar] [CrossRef]
- Tuladhar, R.; Sapkota, R.P.; Parajuli, A.; Gautam, B. Impacts of Livestock Grazing on Vegetation and Soil in Lowland Grassland Ecosystem of Nepal. Journal of Institute of Science and Technology 2022, 27, 39–48. [Google Scholar] [CrossRef]
- Askari, M.S.; Holden, N.M. Indices for quantitative evaluation of soil quality under grassland management. Geoderma 2014, 230-231, 131–142. [Google Scholar] [CrossRef]
- De Laurentiis, V.; Secchi, M.; Bos, U.; Horn, R.; Laurent, A.; Sala, S. Soil quality index: Exploring options for a comprehensive assessment of land use impacts in LCA. Journal of Cleaner Production 2019, 215, 63–74. [Google Scholar] [CrossRef] [PubMed]
- Zahedifar, M. Assessing alteration of soil quality, degradation, and resistance indices under different land uses through network and factor analysis. Catena 2023, 222, 106807. [Google Scholar] [CrossRef]
Figure 1.
Study areas and sampling plots.
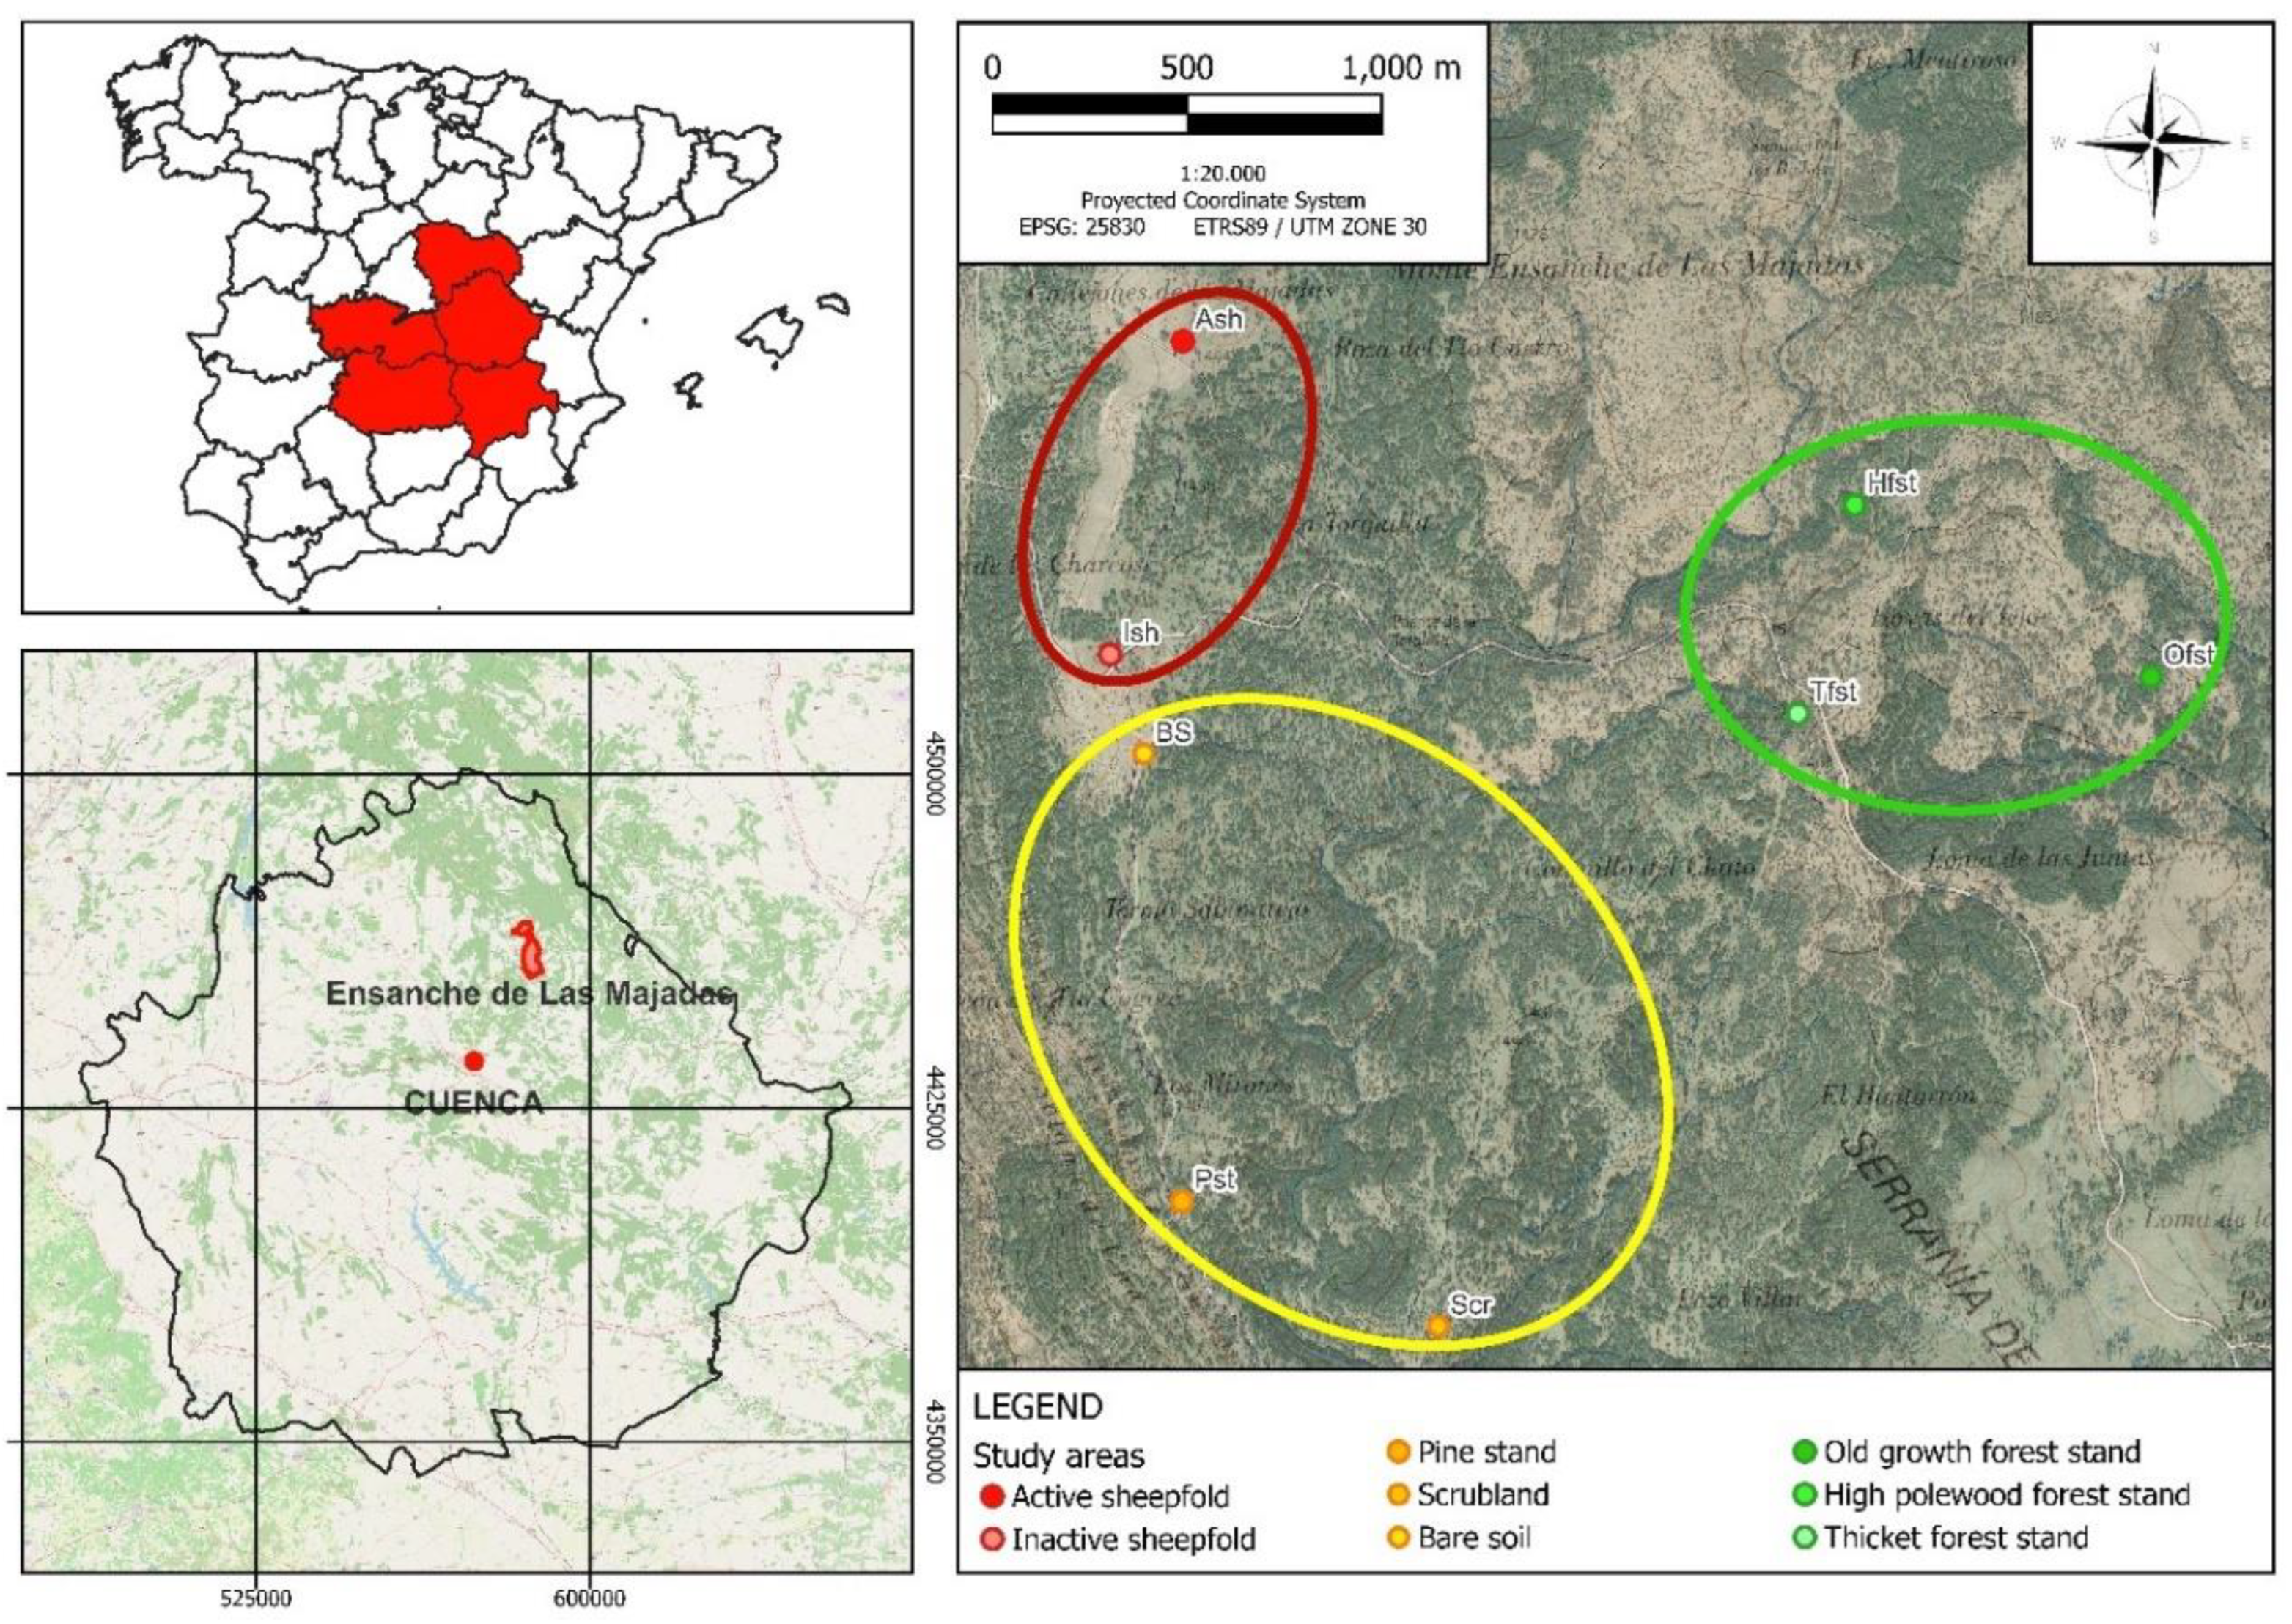
Figure 2.
Mean SQI value, Soil Quality Index, in each study area: Ash, Active sheepfold; Ish, Inactive sheepfold; BS, Bare Soil; Scr, Scrubland; Pst, Pine stand; Tfst, Thicket Forest stand; Hfst, High forest stand and Ofst, Old forest stand (n=168, units shown in the plane of the axes).
Figure 2.
Mean SQI value, Soil Quality Index, in each study area: Ash, Active sheepfold; Ish, Inactive sheepfold; BS, Bare Soil; Scr, Scrubland; Pst, Pine stand; Tfst, Thicket Forest stand; Hfst, High forest stand and Ofst, Old forest stand (n=168, units shown in the plane of the axes).
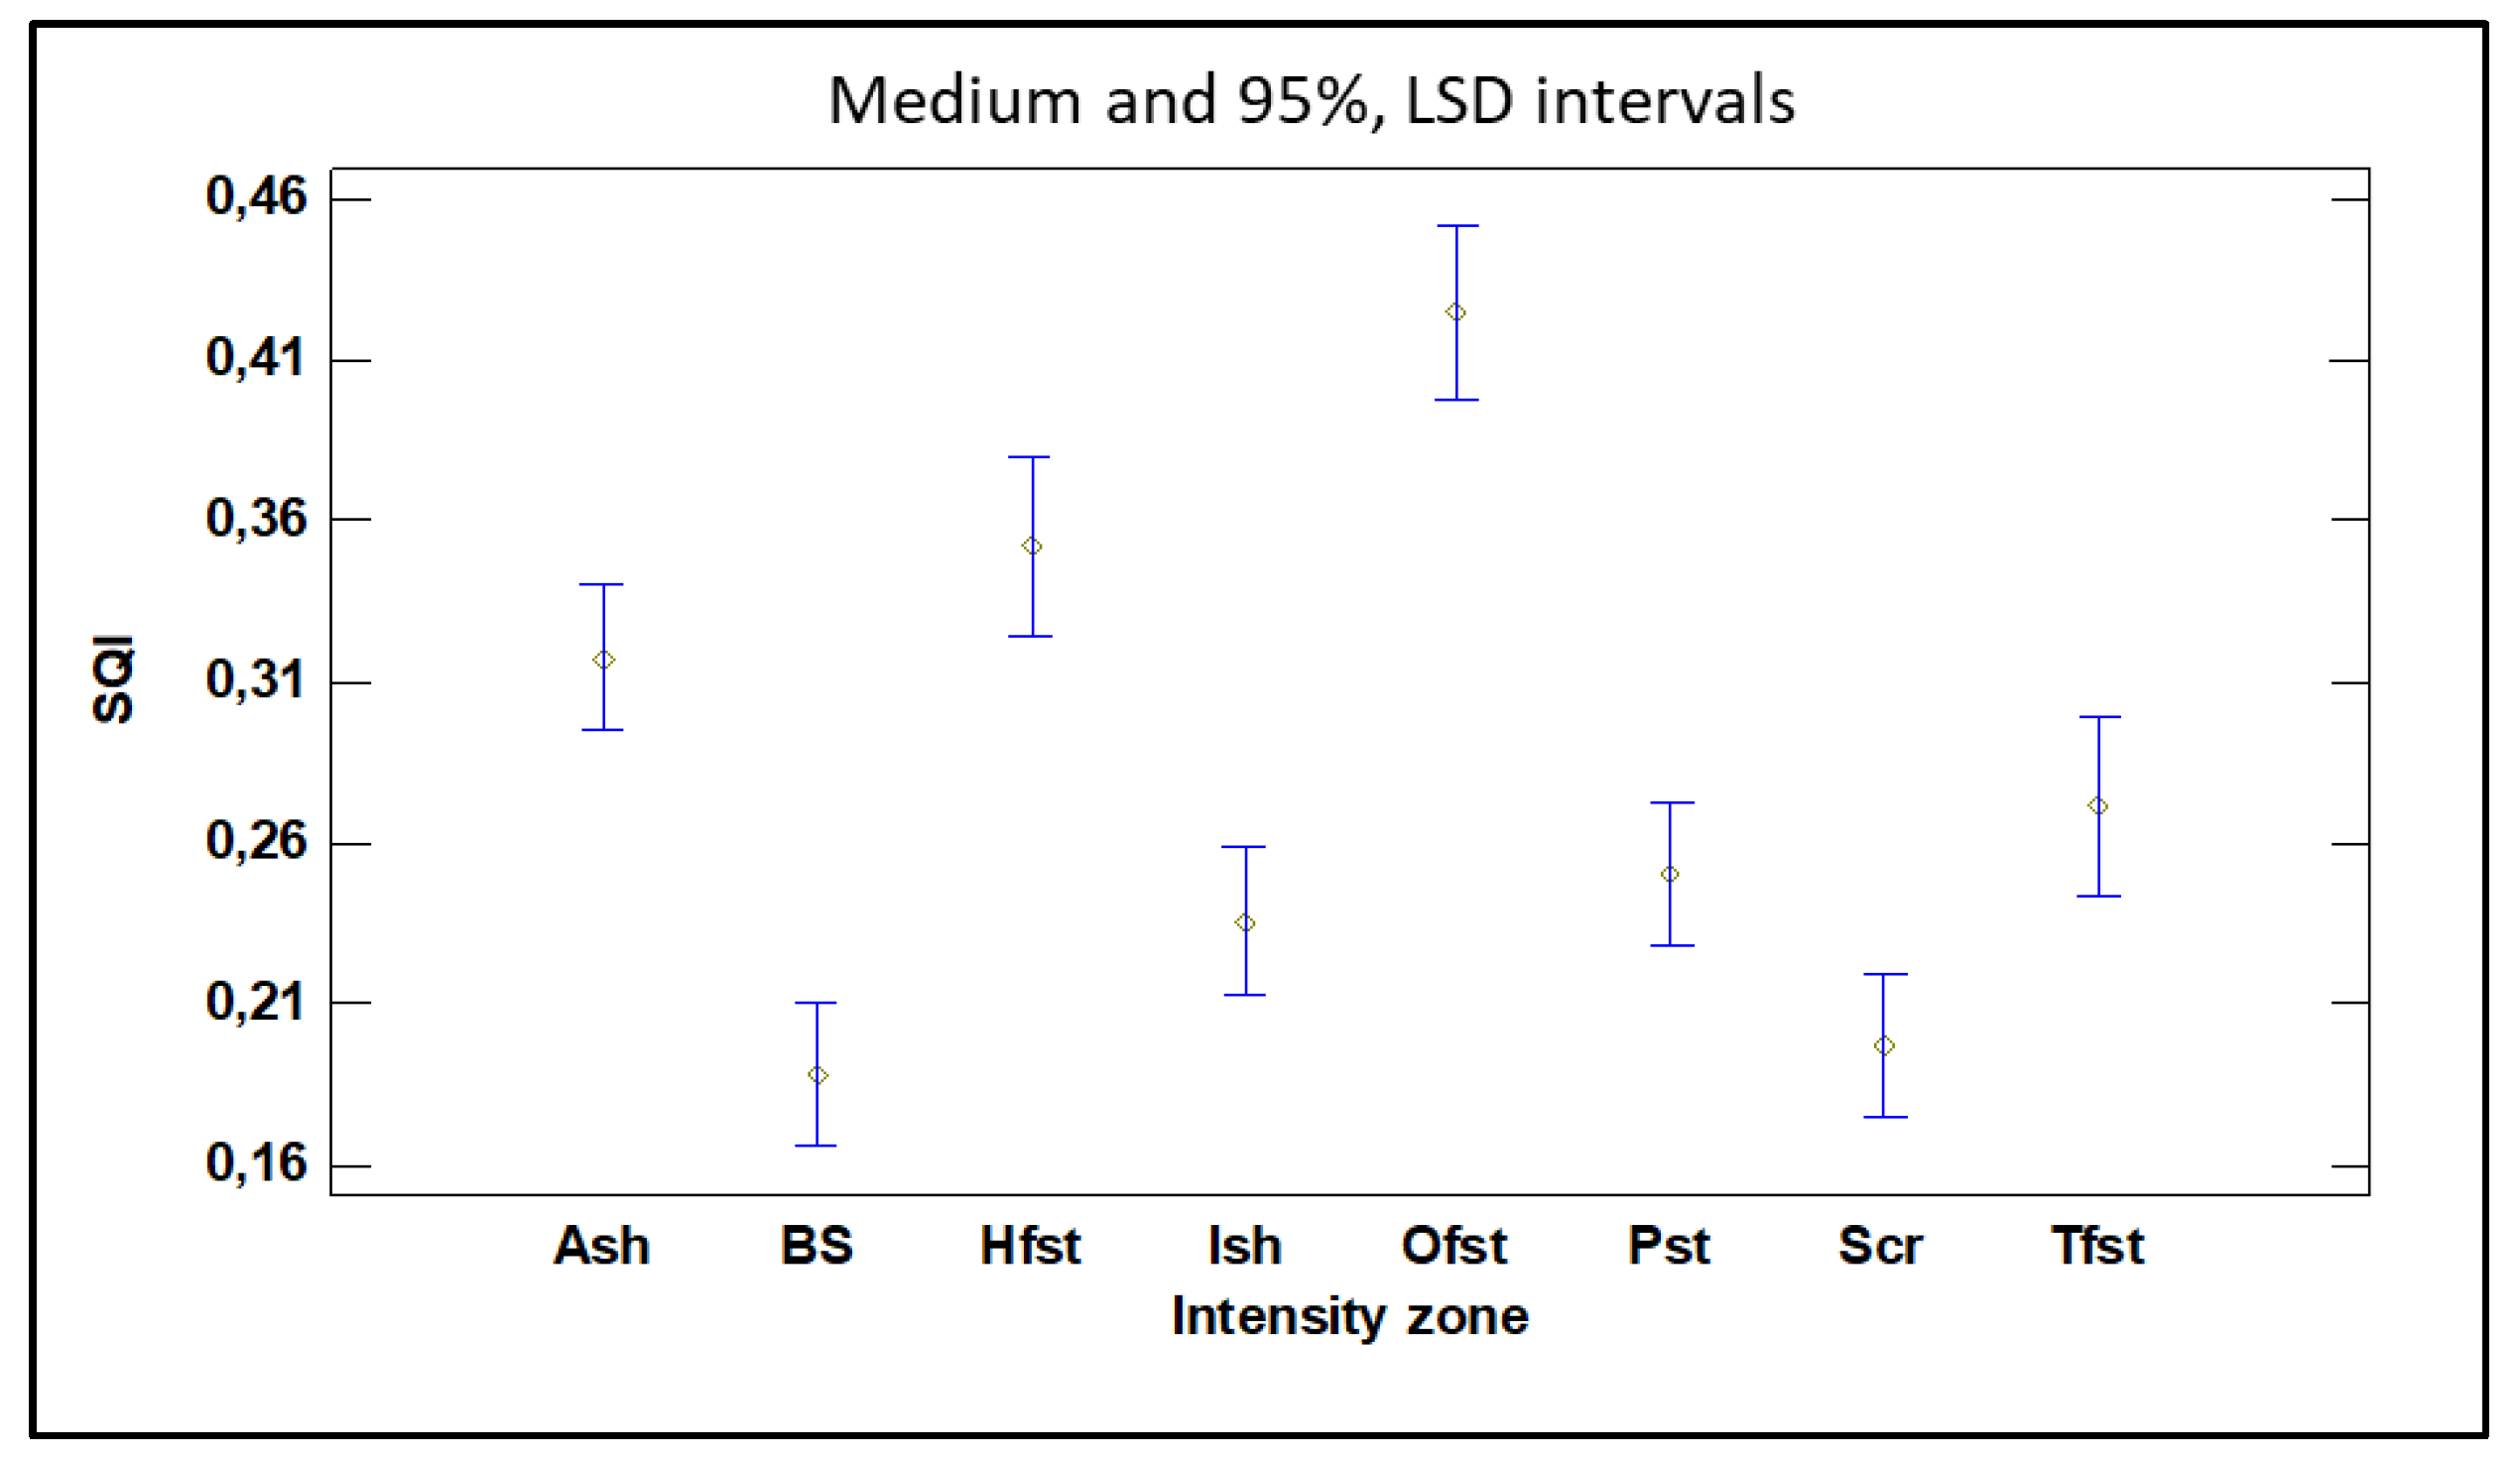
Figure 3.
(F3.1a) Diagram showing eigenvectors for each one of the twelve parameters (as lines) on the first two principal component axes. The longer lines indicate the parametrers that relate strongly to the axes, and the closer they plot, the stronger are the correlations between parameters (n=168, units shown in the plane of the axes). (F3.1b) Scatter plot of the principal component scores of the standardized data Areas: Ash, Active sheepfold; Ish, Inactive sheepfold; BS, Bare Soil; Scr, Scrubland; Pst, Pine stand; Tfst, Thicket forest stand; Hfst, High forest stand and Ofst, Old forest stand; TOC, total organic carbon; N, total nitrogen; M, moisture; pH, soil acidity; BR, basal soil respiration; MBC, microbial biomass carbon; APA, phosphatase activity; β-GLU, β-glucosidase activity. (F3.2) Principal component analysis (2PCA) performed using the selected eight parameters. Eigenvectors for each of the eigth parameters plotted in the plane of (a) 2PC axes 1 and 2. (F3.3) Principal component analysis (3PCA) performed using the selected eight parameters, axes 3PC1 and 3PC2. M, moisture; pH, soil acidity; MBC, microbial biomass carbon; UA, urease activity.
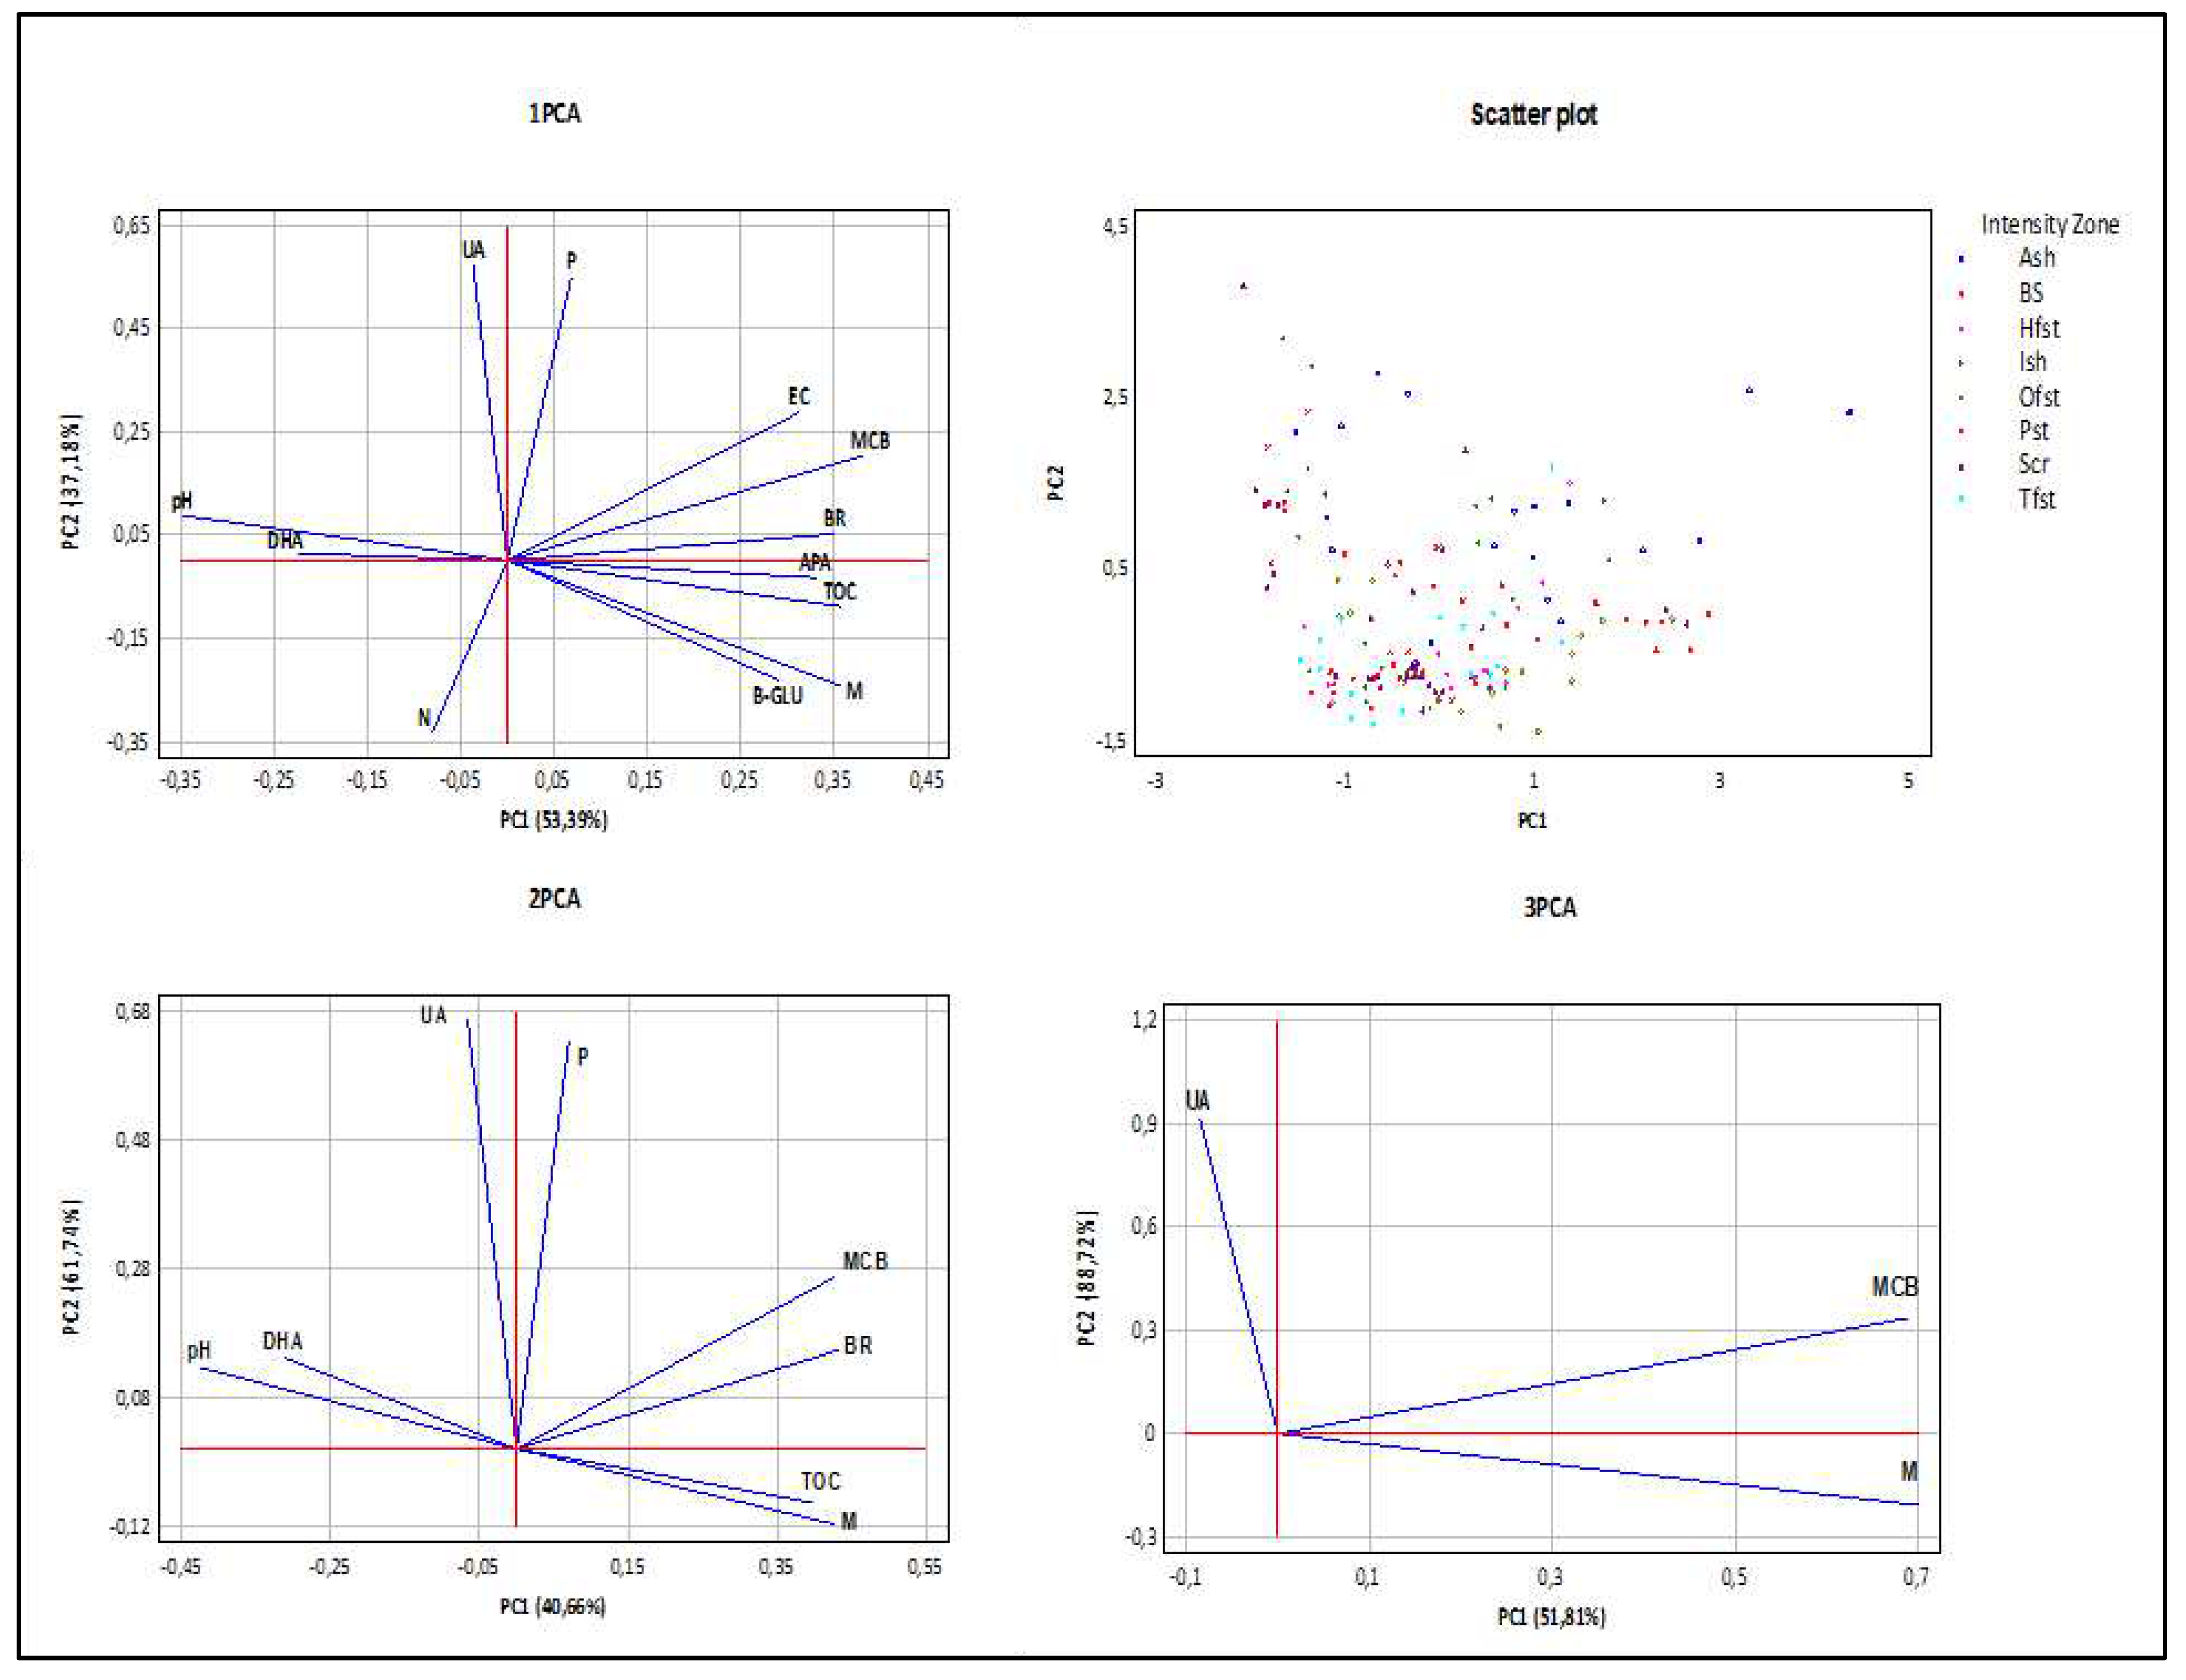
Figure 4.
Average value of SSIL, Soil Status Index for livestock, in each area studied: Ash, Active sheepfold; Ish, Inactive sheepfold; BS, Bare Soil; Scr, Scrubland; Pst, Pine stand; Tfst, Thicket Forest stand; Hfst, High forest stand and Ofst, Old forest stand (n=168, units shown in the plane of the axes).
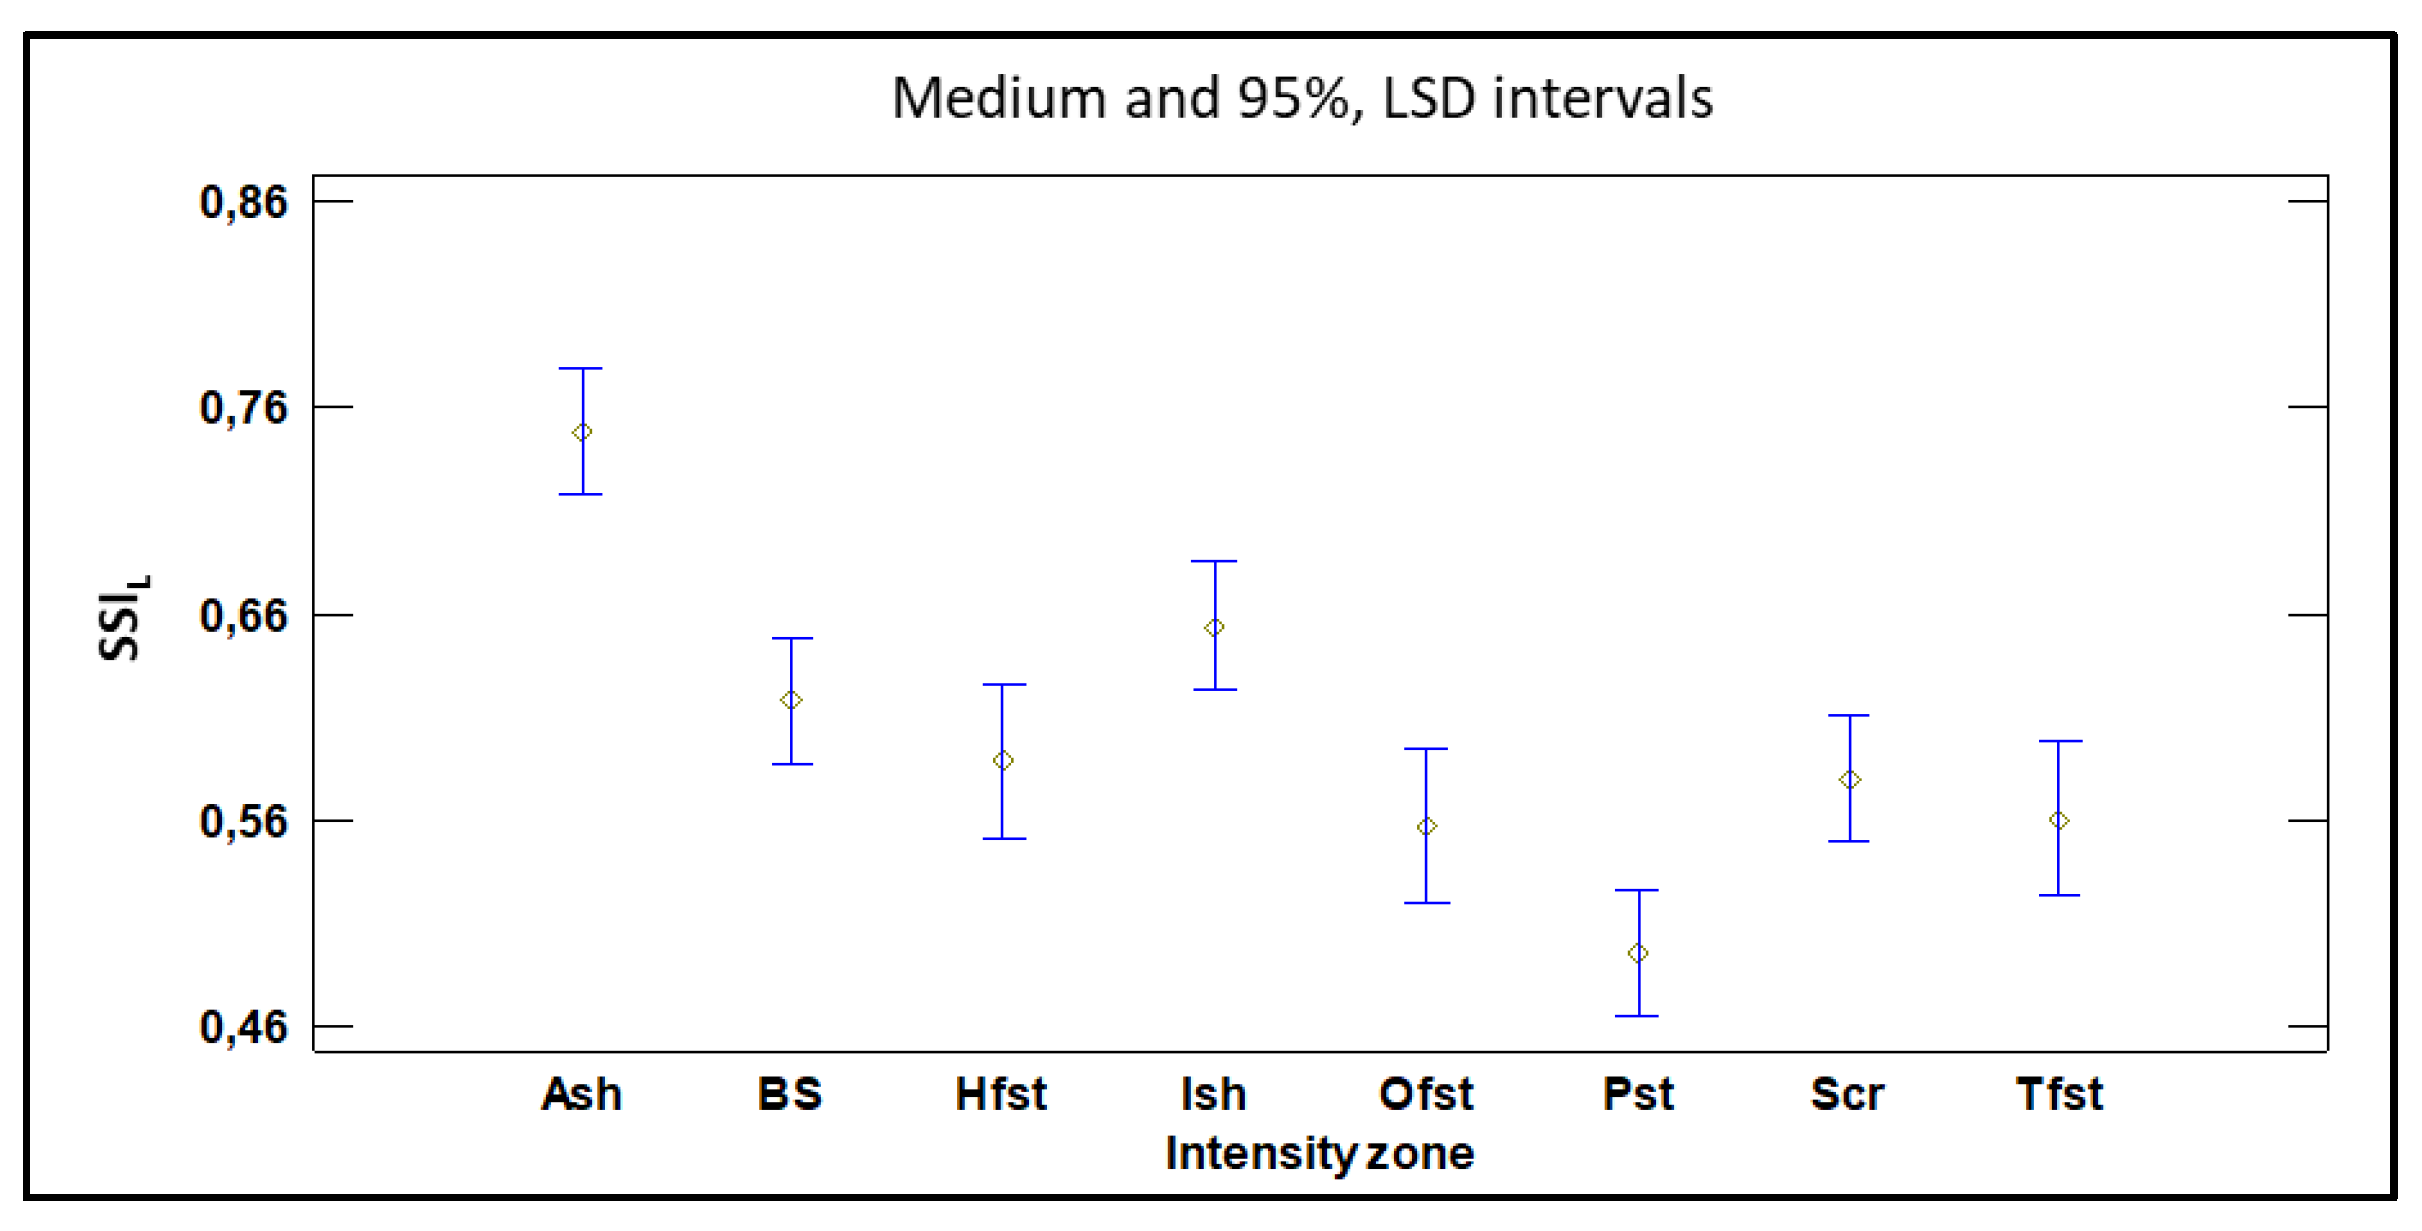
Figure 5.
Ranges RSQI and RSSIL, for each study areas: Ash, Active sheepfold; Ish, Inactive sheepfold; BS, Bare Soil; Scr, Scrubland; Pst, Pine stand; Tfst, Thicket Forest stand; Hfst, High forest stand and Ofst, Old forest stand (n=168, units shown in the plane of the axes).
Figure 5.
Ranges RSQI and RSSIL, for each study areas: Ash, Active sheepfold; Ish, Inactive sheepfold; BS, Bare Soil; Scr, Scrubland; Pst, Pine stand; Tfst, Thicket Forest stand; Hfst, High forest stand and Ofst, Old forest stand (n=168, units shown in the plane of the axes).
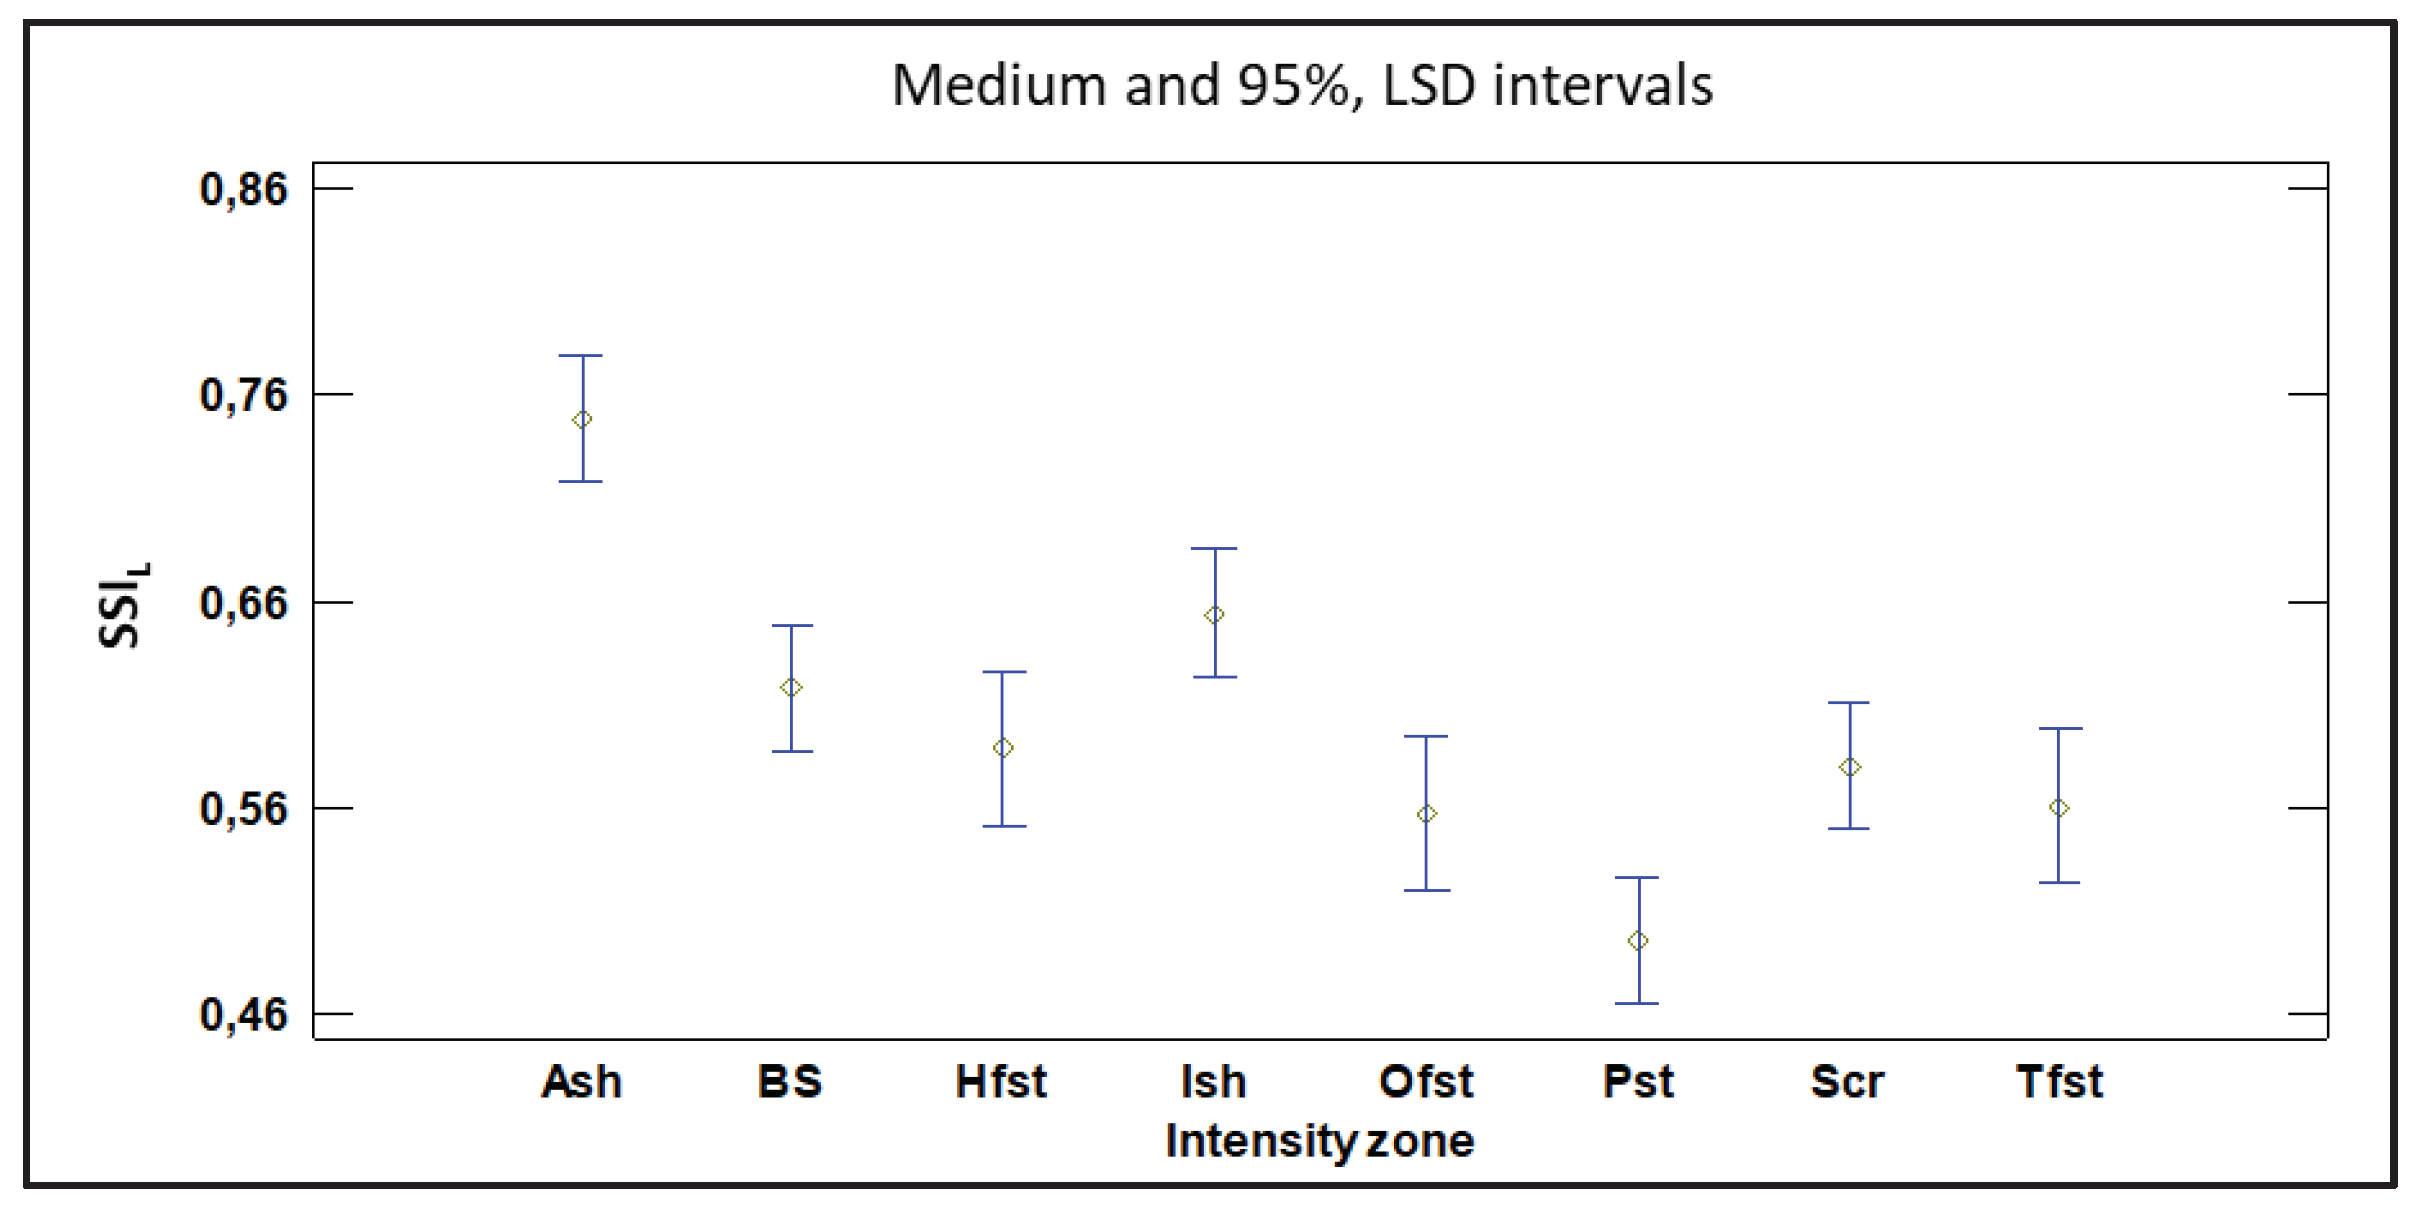

Table 1.
Tree and shrub species, vegetation cover density and main characteristics in the study areas “Ensanche de Las Majadas”.
Table 1.
Tree and shrub species, vegetation cover density and main characteristics in the study areas “Ensanche de Las Majadas”.
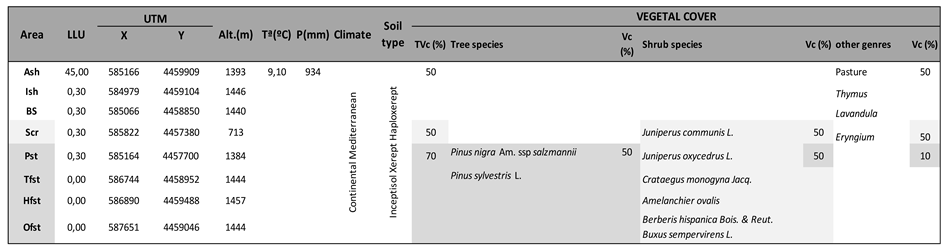
Area: Ash, Active or functional sheepfold Ish, Inactive sheepfold for 3 years; BS, Bare soil; Scr, Shrubland; Pst, Pine stand; Tfst, Thicket forest stand; Hfst, High polewood forest stand; Ofst, Old growth forest stand. LLU, Livestock Loadin Unit. UTM, coordinates. Alt, altitude. Tª, average air temperature. P, precipitation. Soil type according to the Soil Atlas of Europe (2005). Tvc, Total vegetation cover; Vc, Vegetation cover. The colour intensity corresponds to the type of roof of the zones.
Table 2.
Soil quality value ranges.
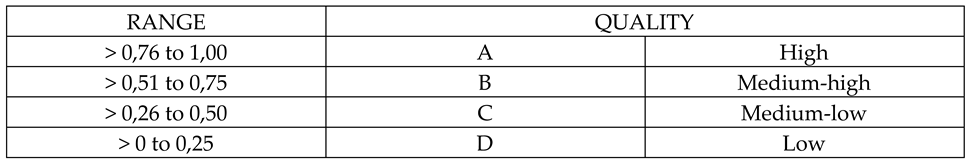
Table 3.
Mean values and standard deviations for each parameter in each study area (n=168).
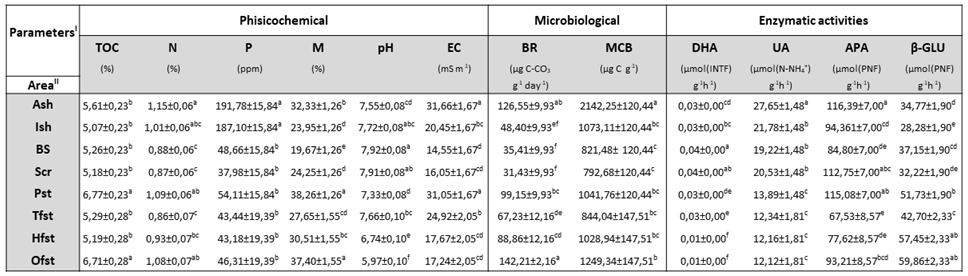
I TOC, total organic carbon; N, total nitrogen; P, phosphorus; M, moisture; pH, pH; EC, electrical conductivity; BR, basal soil respiration; MCB, microbial biomass carbon; DHA, deshydrogenase activity; UA, urease activity; APA, phosphatase activity; β-GLU, β-glucosidase activity. II. Ish, Inactive sheepfold for 3 years; Ash, Active or functional sheepfold; BS, Bare soil; Scr, Srubland; Pst, Pine satand; Tfst, Thicket forest stand; Hfst, High polewood sprest stand; Ofst, Old growth forest stand. a,b,c,d,e,f Homogeneous subgroupings, result of variance analysis.
Table 4.
Factors significance level´s: intensity zone, IZ; Station, S and interaction, IZx S; affecting the SQI variable.
Table 4.
Factors significance level´s: intensity zone, IZ; Station, S and interaction, IZx S; affecting the SQI variable.
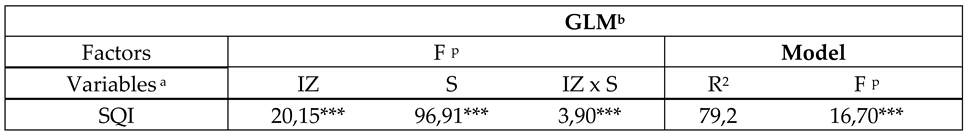
Model fit level [F: F-Snedecor, R2: coefficient of determination, SEE: standard error of the estimate; all models significant, P<0.05 (*); P<0.01 (**); P<0.001 (***); ns, not significant; n=168].
Table 5.
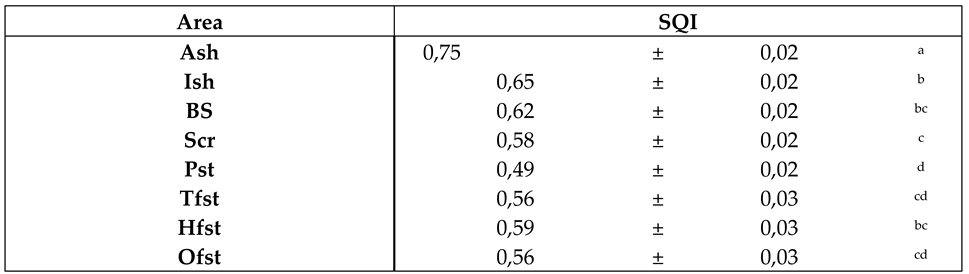
Soil Quality Index SQI.
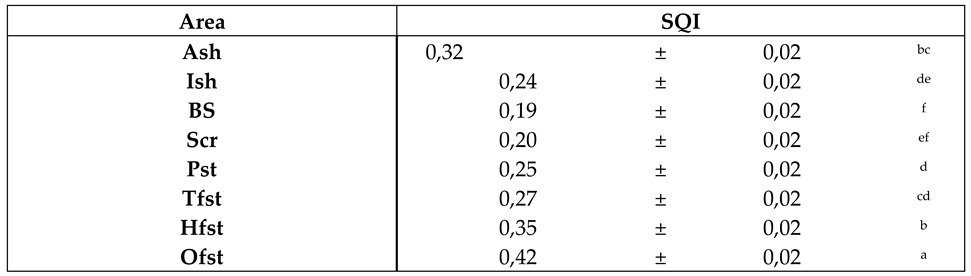
Mean SQI values in each study area: Ash, Active sheepfold; Ish, Inactive sheepfold; BS, Bare Soil; Scr, Scrubland; Pst, Pine stand; Tfst, Thicket Forest stand; Hfst, High forest stand and Ofst, Old forest stand. (n=168, units shown in the plane of the axes). a, b, c, d, homogeneous subgroups, P<0.05.
Table 6.
Results of a principal component analysis (PCA) performed with the full set of parameters: eigenvalues from the first three principal components, percentage variance explained (EV), cumulative variance percentage (CV) and corrected explained variance (CEV).
Table 6.
Results of a principal component analysis (PCA) performed with the full set of parameters: eigenvalues from the first three principal components, percentage variance explained (EV), cumulative variance percentage (CV) and corrected explained variance (CEV).
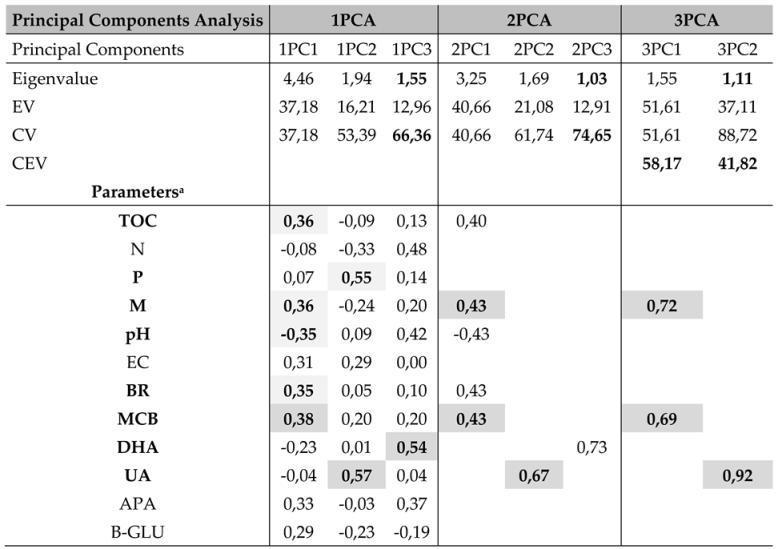
aBold values correspond to larger eigenvectors (>90% of the maximum weight per each PC). M, moisture; β-GLU, β-glucosidase activity; UA, urease activity; DHA, dehydrogenase activity; APA, phosphatase activity; BR, basal soil respiration; MBC, microbial biomass carbon; pH, soil acidity; EC, electrical conductivity; TOC, total organic carbon; N, total nitrogen; P, phosphorus.
Table 7.
Values of the constants of each standardization equation and correlation coefficient for each of the parameters that make up the SSIL.
Table 7.
Values of the constants of each standardization equation and correlation coefficient for each of the parameters that make up the SSIL.
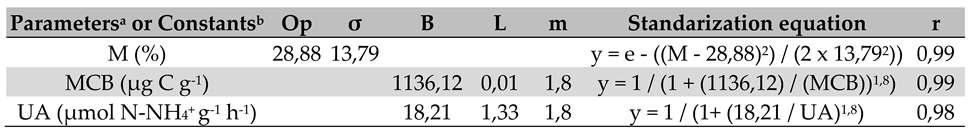
aM, moisture; MCB, microbial biomass carbon; UA, urease activity. bOp, optimal value; σ, standar desviation; B, critical value; L, lower value; m, slope of the equation. .
Table 8.
Factors significance level´s: intensity zone, IZ; Station, S and interaction, IZx S; affecting the SSIL variable.
Table 8.
Factors significance level´s: intensity zone, IZ; Station, S and interaction, IZx S; affecting the SSIL variable.
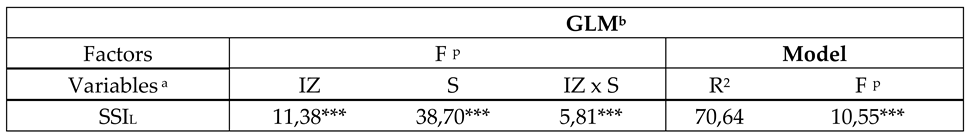
Model fit level [F: F-Snedecor, R2: coefficient of determination, SEE: standard error of the estimate; all models significant, P<0.05 (*); P<0.01 (**); P<0.001 (***); ns, not significant; n=168].
Table 9.
Mean values and standard deviation of the Soil Status Index by Livestock, SSIL.
Mean values of SSIL, Soil Status Index for livestock in each studied area: Ash, Active sheepfold; Ish, Inactive sheepfold; BS, Bare Soil; Scr, Scrubland; Pst, Pine stand; Tfst, Thicket forest stand; Hfst, High forest stand and Ofst, Old forest stand. (n=168, units shown in the plane of the axes). a, b, c, d, homogeneous subgroups, P<0.05.
Table 10.
Adjustment equation and correlation between SQI and SSIL.

Model fit level, SQI variable and adjustment level of the model [F: F-Snedecor, R2: coefficient of determination, SEE: standard error of the estimate; all models significant, P<0.05 (*); P<0.01 (**); P<0.001 (***); ns, not significant; n=168].
Table 11.
Classification of soil areas, studied as quality or livestock activity levels, stablished by the Rank Soil Quality Index, RSQI and Rank Soil Status Index Livestock, RSSIL.
Table 11.
Classification of soil areas, studied as quality or livestock activity levels, stablished by the Rank Soil Quality Index, RSQI and Rank Soil Status Index Livestock, RSSIL.
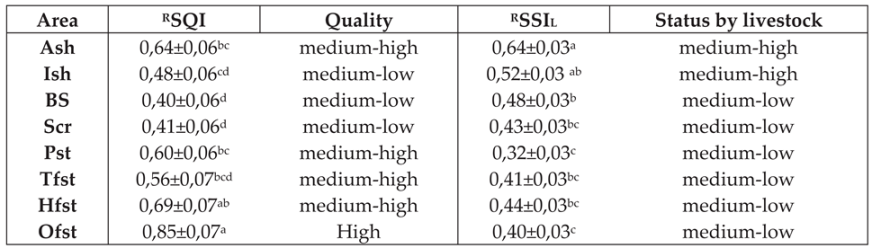
Ash, Active sheepfold; Ish, Inactive sheepfold; BS, Bare Soil; Scr, Scrubland; Pst, Pine stand; Tfst, Thicket forest stand; Hfst, High forest stand and Ofst, Old forest stand.
Disclaimer/Publisher’s Note: The statements, opinions and data contained in all publications are solely those of the individual author(s) and contributor(s) and not of MDPI and/or the editor(s). MDPI and/or the editor(s) disclaim responsibility for any injury to people or property resulting from any ideas, methods, instructions or products referred to in the content. |
© 2024 by the authors. Licensee MDPI, Basel, Switzerland. This article is an open access article distributed under the terms and conditions of the Creative Commons Attribution (CC BY) license (http://creativecommons.org/licenses/by/4.0/).
Copyright: This open access article is published under a Creative Commons CC BY 4.0 license, which permit the free download, distribution, and reuse, provided that the author and preprint are cited in any reuse.


