
Submitted:
08 February 2024
Posted:
08 February 2024
You are already at the latest version
Abstract
This article utilizes the Canny edge extraction algorithm based on contour curvature and the cross-correlation template matching algorithm to extensively study the impact of high-repetition-rate CO2 pulsed Laser on the target extraction and tracking performance of the infrared imaging detector. It establishes a quantified dazzling pattern for lasers on infrared imaging systems. By conducting laser dazzling and damage experiments, a detailed analysis of the normalized correlation between target and dazzling images is performed to quantitatively describe laser dazzling effects. Simultaneously, an evaluation system, including target distance and laser power evaluation factors, is established to determine the dazzling level and whether the target is recognizable. The research results reveal that laser power and target position are crucial factors affecting the detection performance of infrared imaging-guided weapon systems under laser dazzling. Different laser powers are required to successfully interfere with the recognition algorithm of infrared imaging-guided weapons at different distances. And laser dazzling will produce a lot of false edge information, which seriously affects the performance of pattern recognition algorithm. In laser damage experiments, the detector experienced functional damage, with a quarter of the image displaying as completely black. The energy density threshold required for functional damage to the detector is approximately 3 J/cm2. The dazzling assessment conclusions also apply to evaluating damage results. Finally, the proposed evaluation formula aligns with experimental results, objectively reflecting the actual impact of laser dazzling on the target extraction and tracking performance of infrared imaging systems. This study provides an in-depth and accurate analysis for understanding the influence of lasers on the performance of infrared imaging-guided weapons.
Keywords:
Laser dazzling
; edge extraction
; contour curvature
; target detection
1. Introduction
The role and status of electro-optical guided weapons have been increasingly prominent in modern high-tech warfare, especially in the striking of high-value targets through the remarkable cost-effectiveness and combat power demonstrated by infrared imaging guided weapons. Laser suppression dazzling is considered an effective means to counteract them. This method of dazzling saturates or damages the infrared imaging devices on these weapons using lasers, rendering them incapable of target identification and tracking. The irradiation effects of lasers on detectors can be classified into photoelectric effects and material thermal effects. As the energy of laser dazzling continues to increase, saturation, saturation crosstalk, and over-saturation phenomena can be observed in the images. Further increases in laser power result in point, line, surface, functional damage, and blinding damage effects on the images. Therefore, in-depth analysis of the laser dazzling effects on images, especially its impact on target detection performance, holds significant military value and practical significance. It also establishes an application foundation for related industries, national defense, and other fields. Infrared imaging tracking is generally a multimodal tracking mode, and the target tracking algorithm can be divided into four stages based on the size of the target image in the guidance head field. In the early stages, point tracking mode is often used for long-range target distance; in the initial guidance stage, image matching algorithms are applied; in the mid-guidance stage, centroid tracking or correlation tracking (cross-correlation tracking and auto-correlation tracking) is generally employed; in the terminal guidance stage, local image tracking methods are used[1,2,3,4]. Based on these different tracking methods of imaging systems, a theoretical foundation is laid for the subsequent development of laser dazzling evaluation algorithms.
Currently, scholars both domestically and internationally have conducted research on the evaluation of laser dazzling effects from multiple perspectives, such as dazzling image quality assessment and the impact of dazzling on target detection performance, yielding many meaningful research results. Regarding image quality assessment methods, they are mainly divided into objective assessment methods and subjective assessment methods. Subjective assessment methods involve the use of the Human Visual System (HVS) for observation. Objective assessment methods include image grayscale histogram method, image information entropy method, mean square error (MSE) method, peak signal-to-noise ratio (PSNR) method, and structural similarity index (SSIM) method [5,6]. Additionally, based on the need for original images, assessments can be classified as full reference (requiring complete original image information), partial reference (providing certain feature information of the original image), and no reference (not referring to any original image information) [8,9,10,11,12].
From the perspective of the impact on target detection performance in laser dazzling assessment methods, Durécu et al. proposed an algorithm based on edge detection, using correlation and Fourier descriptor as two evaluation indicators to quantitatively assess the impact of laser dazzling on pattern recognition algorithm performance [13]. Hueber et al. used pattern recognition to assess the impact of laser dazzling on image edge information. They applied the Canny algorithm to the original and dazzling images for image processing and quantified the degree of loss using the correlation coefficient of each target image's edge information [14]. Jie et al. analyzed the jamming effect of synthetic fiber laser on airborne defense system, and evaluated the four-image guidance system and image guidance system based on the synthesized fiber laser [15]. Gao et al. systematically analyzed the impact of laser dazzling on target detection algorithms from the perspective of machine learning. By calculating the occlusion rate of the target, the correlation between the target and the target template, and further analyzing the changes in the output features of the images before and after laser dazzling in convolutional networks, they divided the effective dazzling area of the dazzling spot [16]. Fengling et al. used an improved method of image correlation to assess laser dazzling effects. By determining the correlation threshold through human eyes, they accurately evaluated dazzling images under different bands and laser powers, and this method demonstrated certain robustness [17]. Gareth et al. used a scale-invariant template matching algorithm to establish an architecture and employed artificial intelligence algorithms to quantify the effects. They compared the similarity of images before and after laser dazzling and assessed the impact of laser on the tracking performance of infrared imaging guidance heads [18].
In this paper, a Canny edge extraction algorithm based on contour curvature and a cross-correlation template matching algorithm are used to systematically study the evaluation of dazzling effects on infrared guided weapons in the process of CO2 repetitive frequency pulse laser dazzling at both long and short distances. Quantitative practical criteria and methods for laser dazzling effect assessment are provided. During the dazzling process, the algorithm examines the correlation under different laser powers and target positions and provides a set of image quality evaluation functions and thresholds to determine the dazzling level and whether it is recognizable. Specifically, by calculating the norm function N and comparing it with the preset threshold N0, if N is lower than N0, the dazzling is determined to be effective.
2. Canny edge extraction algorithm based on contour curvature
Edge extraction is the most fundamental feature of an image, and preprocessing the image with edge extraction before applying template matching algorithms on interfered images will accelerate image processing speed and achieve real-time processing effects [19]. Edges are collections of pixels with abrupt changes in pixel grayscale values, and image edges reflect most of the image information [20]. Compared to existing edge extraction algorithms such as Robert, Sobel, and Prewitt, the Canny edge extraction algorithm is considered to be more insensitive to noise and has better anti-dazzling capabilities. This is highly beneficial for the accuracy and speed of subsequent pattern recognition algorithms [21]. In laser active imaging, noise mainly consists of speckle noise, CCD noise, and environmental background noise. Conventional edge extraction operators are not effective in extracting contour information from the original image. Therefore, a Canny edge extraction algorithm based on contour curvature is proposed. Firstly, Gaussian filtering is applied to smooth the original image, effectively eliminating some noise in the image. Secondly, differential processing is used to calculate the gradient magnitude and direction of selected edge points, obtaining edge information. Non-maximum suppression is applied to refine the edges. Finally, contour curvature is utilized to classify the edge information. By connecting strong edges and neighboring weak edges, the final edge detection and image segmentation are completed.
2.1. The Gaussian low-pass filter smooths the original image
The transfer function of Gaussian smoothing is defined as ,where and represent the pixel points in the horizontal and vertical directions of the image, respectively, and is a dimensionless coefficient. Gaussian smoothing of the original image results in the processed image , where denotes convolution. The function is transformed into a two-dimensional template for convolution with the image. By converting the Gaussian smoothing process into a two-dimensional template for convolution, noise in the image can be effectively eliminated, making the calculation of derivatives more stable. The application of smoothing filters helps improve the robustness of edge detection algorithms, ensuring that the algorithm can accurately capture the actual edge features in the image without being affected by noise.
2.2. Image edge information is obtained based on differential processing
Generally speaking, images can be represented and classified in both Fourier space and real space. In Fourier space, the representation of an image consists of low to high-frequency information. By applying high-pass or low-pass filtering functions, it is possible to extract edge information or perform denoising (i.e., image smoothing). Similarly, in real space, images are composed of pixels with different amplitude values, and pixels at the edges exhibit relatively large amplitude variations. Therefore, by performing differential processing on the real-space information of an image, it is possible to enhance and highlight drastic amplitude changes in pixels, achieving the extraction of edge information. Based on the image obtained from the previous section after smoothing, the formula (1) is applied for differential processing in the horizontal and vertical directions (i.e., and directions) of the image.
The amplitude information and direction information in the image after differential processing can be expressed using formulas (2) and (3).
where: : and represent the first partial derivatives in the and directions, respectively.
Non-maximum suppression is used to ensure accurate extraction of edge information in the processed image. The edge information at this stage includes both genuine edge information and pseudo-edges generated by noise. To preserve the characteristic information in genuine edge information, an edge filtering method is employed. This involves selecting edge length threshold Ld and edge strength threshold Ls. If the length of a certain edge segment is less than Ld or the strength of the edge is less than Ls, it is considered that the edge is caused by noise. The pixels on such edges are classified as non-edge points, resulting in the generation of a candidate edge image.
2.3. Edge information is divided based on contour curvature
By applying the eleven-point curvature method to calculate contour curvature, we can accurately measure the curvature features of an object's outline. The calculation method for contour curvature involves analyzing eleven points on the object's contour to obtain detailed curvature information. This curvature value can be used to assess the importance of edge information because curvature exhibits different characteristics in different parts of the contour, thereby enhancing the recognition of edge information. Using contour curvature to assess the importance of edge information is defined as:
Let be pixels, where ,. This curvature value measures the degree of curvature in different parts of the contour, aiding in a more accurate understanding of the shape and features of the object's outline, especially for target detection and analysis in image processing and computer vision applications.
By setting a contour curvature threshold , we can divide the edge information into strong edge, weak edge and non-edge. For strong edges, the value of contour curvature is larger. For weak edges, the curvature value is small. Anything else is non-marginal.
The edge information function is defined as , and the edge information is divided into: when , the pixel is a strong edge pixel; When , the pixel is a weak edge pixel. When , it means that the pixel is a non-edge pixel, that is, the contour curvature does not exist. The value of is,
By utilizing formula (5), iterate through the candidate edge image to classify edge pixels. For strong edge pixels, directly label them as edge pixels. For weak edge pixels, it is necessary to examine the surrounding pixels. If there are adjacent strong edge pixels, label the weak edge pixel as an edge pixel as well. This process effectively connects edges, forming continuous edge lines, resulting in the final edge image.
Figure 1 shows the image of the target image and its 3D intensity map after the improved Canny edge extraction algorithm.
3. Cross-correlation template matching algorithm
After processing the laser dazzling image with the Canny algorithm, this paper employs the cross-correlation template matching algorithm for image matching. The template matching algorithm first reads the original image and the template image, converting them into grayscale images. The sizes of the original image and the template image are obtained, and the range to be traversed by the two images is calculated through subtraction. An empty result matrix is created to store the correlation at each position with the template. The template image is converted into a vector, and its norm is calculated for subsequent correlation calculations. Using two nested loops, each position in the original image is traversed, starting from the top-left corner, and the correlation is calculated sequentially. At each position, a sub-matrix of the same size as the template image is extracted from the original image and converted into a vector. The dot product of the sub-matrix from the original image and the vector from the template image is calculated, and the result is divided by the product of their norms to obtain the normalized correlation .
4. Experimental Setup
4.1. Laser Dazzling Effects Experiment
To conduct experiments on the dazzling effects of 10.6 μm pulse laser on infrared imaging systems, a high-repetition-rate CO2 pulsed Laser (wavelength: 10.6 μm; the pulse repetition frequency used in this experiment is 100 Hz; Laser divergence Angle: 5 mrad). The detector employed was a long-wave infrared non-cooled camera (pixel size: 17 μm; lens aperture: 55 mm), and the dazzling distance was set at 50.8 m. The experimental setup is illustrated in Figure 2.
The pulse laser light source passes through a beam splitter and an attenuator before irradiating the surface of the infrared detector. The beam splitter is used for spectral splitting, with a small portion of weak light entering a power meter for real-time monitoring of laser power. The majority of the laser is directed onto the detector. The attenuator controls the degree of laser energy attenuation and irradiation time. The detector is connected to a computer to observe and record changes in the image in real-time. To ensure the accuracy of calibrating the spot size, the experiment utilizes the knife-edge method to measure and verify the size of the spot.
4.2. Laser Damage Effects Experiment
Conducting long-distance damage experiments in an outdoor setting, the experimental schematic is shown in Figure 4. The distance between the laser and the damage target is approximately 2 km, requiring beam expansion treatment for the laser to compress the laser divergence angle, reduce the diameter of the spot on the front surface of the target before reaching, and increase the energy density on the target. To achieve this, a combination beam expansion system was designed for the laser in this experiment. The system employs two-stage expansion, initially performing 2x coaxial expansion on the laser emitted from the laser, then undergoing 5x expansion through the off-axis expansion system, ultimately achieving 10x expansion. The theoretical compression of the laser's far-field divergence angle is 10 times, reaching 0.5 mrad. Combining the exit spot diameter of the expansion system, the theoretical value of the spot diameter at a distance of 1.8 kilometers is approximately 1 m. Therefore, taking advantage of the characteristic that the spot radius in front of the target surface under far-field conditions is much larger than the camera's entrance aperture, the energy meter probe and the camera are placed parallel and adjacent. Lens 2 is placed in front of the probe to receive the laser, enabling simultaneous camera monitoring and energy measurement.
5. Results and Discussion
To investigate the overall assessment of laser interference effects, experiments were conducted using the experimental setup for laser interference effects shown in Figure 2, exploring the infrared laser interference effects on targets at different laser power levels and distances. Figure 3 displays the positions of the laser spot and the target objects, where A represents the distance between the center of the spot and the target object. The measurement results are shown in Table 1.
To explore the overall assessment of laser dazzling images, experiments were conducted using the aforementioned experimental setup with different laser powers and target positions. A series of partial laser dazzling images were obtained, as shown in Figure 5 (a), (c).
The laser dazzling images obtained from the experiment were processed and recognized using the Canny algorithm based on contour curvature and the cross-correlation template matching algorithm introduced in the second part. Figures 5 (b), (d) show the recognition results after algorithm processing, where the images inside the colored squares are the recognized images judged by the algorithm. The recognized results after algorithm processing show that the laser power has a significant impact on the dazzling results. When the target is at a long distance (r=1.7 m), dazzling can be successful when the laser power P≥1.5 mW. However, when the target is at a close distance (r=1.1 m), dazzling can only be successful when the laser power P≥0.4 mW, causing the failure of the infrared imaging guidance weapon tracking recognition algorithm. The target position also influences the effect of laser dazzling. At different distances, different laser powers are required to successfully interfere with the recognition algorithm of the infrared imaging guidance weapon. Higher laser power is needed for successful dazzling at longer distances, while lower laser power is sufficient at shorter distances.
To further refine the evaluation of the laser dazzling image, considering the impact of laser power on the dazzling results, the normalized correlation between the template image and the dazzling image (Formula (6)) is used to calculate the evaluation value. The relationship between the maximum normalized correlation and the target position and laser dazzling power is shown in Figure 6.
Based on the recognition results and the correlation evaluation curves for different laser powers, combined with the Human Visual System (HVS), the following conclusions can be drawn:
1. For targets at a close distance (r=1.1 m), select the dazzling correlation threshold lgN_01=-0.331 (position marked with ☆ on the curve in Figure 7), i.e., N01=0.467. Therefore, dazzling can be considered successful when the normalized maximum correlation N≤0.467.
2. For targets at a long distance (r=1.7 m), select the dazzling correlation threshold lgN_02=-0.226 (position marked with ☆ on the curve in Figure 7), i.e., N02=0.542. Therefore, dazzling can be considered successful when the normalized maximum correlation N≤0.542.
These thresholds are selected based on the analysis of recognition result images and the judgment of the Human Visual System. By analyzing the normalized maximum correlation, we can determine the conditions under which dazzling can be considered successful. Thus, an evaluation system is obtained, which includes laser power and target position evaluation factors is obtained, which is defined as:
where is the laser power and is the distance between the target and the laser center. represents the normalized correlation function of laser dazzling images under different target positions and different laser power conditions. This function comprehensively evaluates and judges the target tracking and recognition algorithm under different dazzling distance and laser power, and linear fits the target position distance and laser power evaluation factor. Coefficient A is used to adjust the weight of the target distance. The smaller the value of A, the greater the weight of the target position distance. From the analysis of the experimental results, the evaluation formula is in agreement with the experimental results.
To quantify the degree of image distortion in the infrared imaging system before and after laser dazzling in the presence of functional damage, experiments were conducted using the experimental setup shown in Figure 3 under far-field conditions with a 10.6 μm pulsed laser for damaging the long-wave non-cooled camera. The camera's built-in video recording function was used to record the imaging situation before and after laser irradiation. Partial damage images obtained from the damage effect experiment are shown in Figure 7.
The camera experienced functional damage, with a quarter of the image displaying as completely black. This region is entirely non-imaging, and reconnecting after power-off does not restore functionality, indicating irreversible damage. While other areas of the imaging frame remain normal, the contrast of the imaging frame decreases with an increase in the number of damages. Moreover, the non-imaging area of the entire camera also expands significantly until blindness occurs, leading to complete camera failure. Restarting the camera does not restore functionality. Therefore, the energy density threshold required for functional damage in the camera is approximately 3 J/cm².
The images in Figure 8 (a) and (b) show different positions of the target image, with a size of 30×30 mm, selected from the background before the damage.
Due to the partial visibility of the target image in the presence of functional damage effects on the camera, an investigation into the dazzling assessment of the detector when functional damage occurs is conducted. The experimentally obtained damaged images are processed using the contour curvature-based Canny algorithm and the cross-correlation template matching algorithm as described above. The backgrounds selected from Figure 8 (a) and (b) at both far and near distances are used as targets. The relationship between laser energy and normalized correlation is depicted in the following figure.
The figure illustrates the correlation between laser energy and normalized correlation, providing insights into the dazzling assessment effect of the detector under functional damage conditions.
Based on the correlation evaluation curves of damaged images and different laser energies, combined with the Human Visual System (HVS), for targets at a close distance, a correlation threshold of N03=0.449 is selected (marked as □ in the near-distance correlation evaluation curve in Figure 9). For targets at a far distance, a correlation threshold of N04=0.481 is chosen (marked as □ in the far-distance correlation evaluation curve in Figure 9). It is observed that the dazzling assessment conclusions are equally applicable to evaluating the damage results. At different distances, varying laser energies are required for successful dazzling with the recognition algorithm of infrared imaging-guided weapons. Higher laser energy is needed for successful dazzling at a far distance, while lower laser energy is sufficient for dazzling at a close distance. Additionally, the normalized correlation value at a far distance is slightly larger than the case of the target at a close distance, which aligns with human eye recognition results.
6. Conclusions
This study utilized the Canny algorithm based on contour curvature and the cross-correlation template matching algorithm to process and recognize 10.6 μm long-wave infrared laser dazzling images and damage images. Based on the maximum normalized correlation of images, this paper proposed an evaluation system that can predict the effect of laser dazzling under different target positions and laser power conditions. The dazzling experiment results indicate that at a far distance (r=1.7 m), with laser power P≥1.5 mW and normalized correlation N≤0.542, recognition fails. At a close distance (r=1.1 m), with laser power P≥0.4 mW and normalized correlation N≤0.467, dazzling is successful, leading to the failure of the infrared imaging-guided weapon tracking and recognition algorithm. According to the damage effect experiment, the energy threshold for functional damage to the long-wave non-cooled camera is determined to be 3 J/cm2. For targets at a close distance, a correlation threshold N03=0.449 is chosen, while for targets at a far distance, a correlation threshold N04=0.481 is selected. Based on the proposed evaluation system, it is possible to quickly determine the success of laser dazzling and evaluate its effectiveness. The discussed evaluation system is applicable to both high-repetition-rate pulsed laser dazzling and continuous laser dazzling, providing a quantitative assessment standard for the impact of laser active imaging systems on target recognition capabilities. This research holds significant military value and practical significance, laying the theoretical and experimental foundation for evaluating the operational effectiveness of infrared electro-optical countermeasure equipment and providing an effective and reliable quantitative evaluation basis for identifying and assessing dazzling equipment.
Author Contributions
Conceptualization, H.Z. and T.S.; formal analysis, T.S. and J.S.; investigation, H.Z. and Y.W.; project administration, T.S.; writing—review and editing, H.Z.; writing—review and editing, T.S. and J.S. All authors have read and agreed to the published version of the manuscript.
Funding
We acknowledge the support by the Fundamental Research Project of Chinese State Key Laboratory of Laser Inter-action with Matter (No. SKLLIM2003).
Data Availability Statement
The data presented in this study are available on request from the corresponding author.
Conflicts of Interest
The authors declare no conflicts of interest.
References
- Lee, S.; Shin, J.; Kim, H.-G.; Cho, D.; Kim, H.J. Deep End-to-end Imitation Learning for Missile Guidance With Infrared Images. Int J Control Autom Syst 2023, 21, 3419-3429. [CrossRef]
- Li, C.; LI, J.; TONG, Z.; JIA, L.; ZHANG, Z. Research on partial image recognition and tracking in infrared imaging terminal guidance. Acta Armamentarii 2015, 36, 1213.
- DiMarco, J.S.; Kemper Jr, P.J.; Pringle, L.N. Closed-loop guidance of imaging infrared missile seekers. In Proceedings of the Infrared Imaging Systems: Design, Analysis, Modeling, and Testing X, 1999; pp. 254-265.
- Yi-Fei, Z.; Hui, Y. Study on Guidance Algorithm of Scene Matching based on Different Source Images for Cruise Missile. In Proceedings of the 2018 IEEE International Conference on Mechatronics and Automation (ICMA), 2018; pp. 912-917.
- Kumar, N.N.; Ramakrishna, S. An Impressive Method to Get Better Peak Signal Noise Ratio (PSNR), Mean Square Error (MSE) Values Using Stationary Wavelet Transform (SWT). Global Journal of Computer Science and Technology Graphics & Vision 2012, 12, 34-40.
- Qian, F.; Guo, J.; Sun, T.; Wang, T. Quantitative assessment of laser-dazzling effects through wavelet-weighted multi-scale SSIM measurements. Optics & Laser Technology 2015, 67, 183-191. [CrossRef]
- Wang, Z.; Bovik, A.C.; Sheikh, H.R.; Simoncelli, E.P. Image quality assessment: from error visibility to structural similarity. IEEE transactions on image processing 2004, 13, 600-612. [CrossRef]
- Larson, E.C.; Chandler, D.M. Most apparent distortion: full-reference image quality assessment and the role of strategy. Journal of electronic imaging 2010, 19, 011006-011006-011021. [CrossRef]
- Ponomarenko, N.; Lukin, V.; Zelensky, A.; Egiazarian, K.; Carli, M.; Battisti, F. TID2008-a database for evaluation of full-reference visual quality assessment metrics. Advances of modern radioelectronics 2009, 10, 30-45.
- Wang, Z.; Bovik, A.C. Reduced-and no-reference image quality assessment. IEEE Signal Processing Magazine 2011, 28, 29-40. [CrossRef]
- Lu, W.; Zeng, K.; Tao, D.; Yuan, Y.; Gao, X. No-reference image quality assessment in contourlet domain. Neurocomputing 2010, 73, 784-794. [CrossRef]
- Ye, P.; Doermann, D. No-reference image quality assessment based on visual codebook. In Proceedings of the 2011 18th IEEE International Conference on Image Processing, 2011; pp. 3089-3092.
- Durécu, A.; Vasseur, O.; Bourdon, P. Quantitative assessment of laser-dazzling effects on a CCD-camera through pattern-recognition-algorithms performance measurements. In Proceedings of the Technologies for Optical Countermeasures VI, 2009; pp. 211-221.
- Hueber, N.; Vincent, D.; Morin, A.; Dieterlen, A.; Raymond, P.; North, P.; Gj, C.; Hueber, N.; Vincent, D.; Morin, A. Analysis and quantification of laser-dazzling effects on IR focal plane arrays. In Proceedings of the Proc. SPIE, 2010; p. 766042.
- Jie, X.; Shanghong, Z.; Rui, H.; Xiaoliang, L.; Jili, W.; Yunxia, L.; Wen, M.; Yanhui, N.; Lihua, M. Laser-jamming analysis of combined fiber lasers to imaging CCD. Optics and Lasers in Engineering 2009, 47, 800-806. [CrossRef]
- Gao, X.; Hu, J.; Ren, L.; Zheng, W.; Li, X. Method of quality assessment based on convolution feature similarity for laser disturbing image. In Proceedings of the MIPPR 2019: Pattern Recognition and Computer Vision, 2020; pp. 387-394.
- Fengling, W.; Yongtao, L. Evaluation method of continuous laser interference effect. Journal of applied optics 2022, 43, 345-351. [CrossRef]
- Lewis, G.D.; Borghgraef, A.; Vandewal, M. The disruptive impact of dynamic laser dazzling on template matching algorithms applied to thermal infrared imagery. In Proceedings of the Technologies for Optical Countermeasures XIX, 2023; p. 1273803.
- Zangeneh-Nejad, F.; Sounas, D.L.; Alù, A.; Fleury, R. Analogue computing with metamaterials. Nature Reviews Materials 2021, 6, 207-225. [CrossRef]
- Vijayarani, S.; Vinupriya, M. Performance analysis of canny and sobel edge detection algorithms in image mining. International Journal of Innovative Research in Computer and Communication Engineering 2013, 1, 1760-1767.
- Ahmed, A.S. Comparative study among Sobel, Prewitt and Canny edge detection operators used in image processing. J. Theor. Appl. Inf. Technol 2018, 96, 6517-6525.
Figure 1.
Image transformation and 3D stereogram. (a) target image and its 3D intensity map; (b) image and its 3D intensity map processed by Canny algorithm based on contour curvature.
Figure 1.
Image transformation and 3D stereogram. (a) target image and its 3D intensity map; (b) image and its 3D intensity map processed by Canny algorithm based on contour curvature.
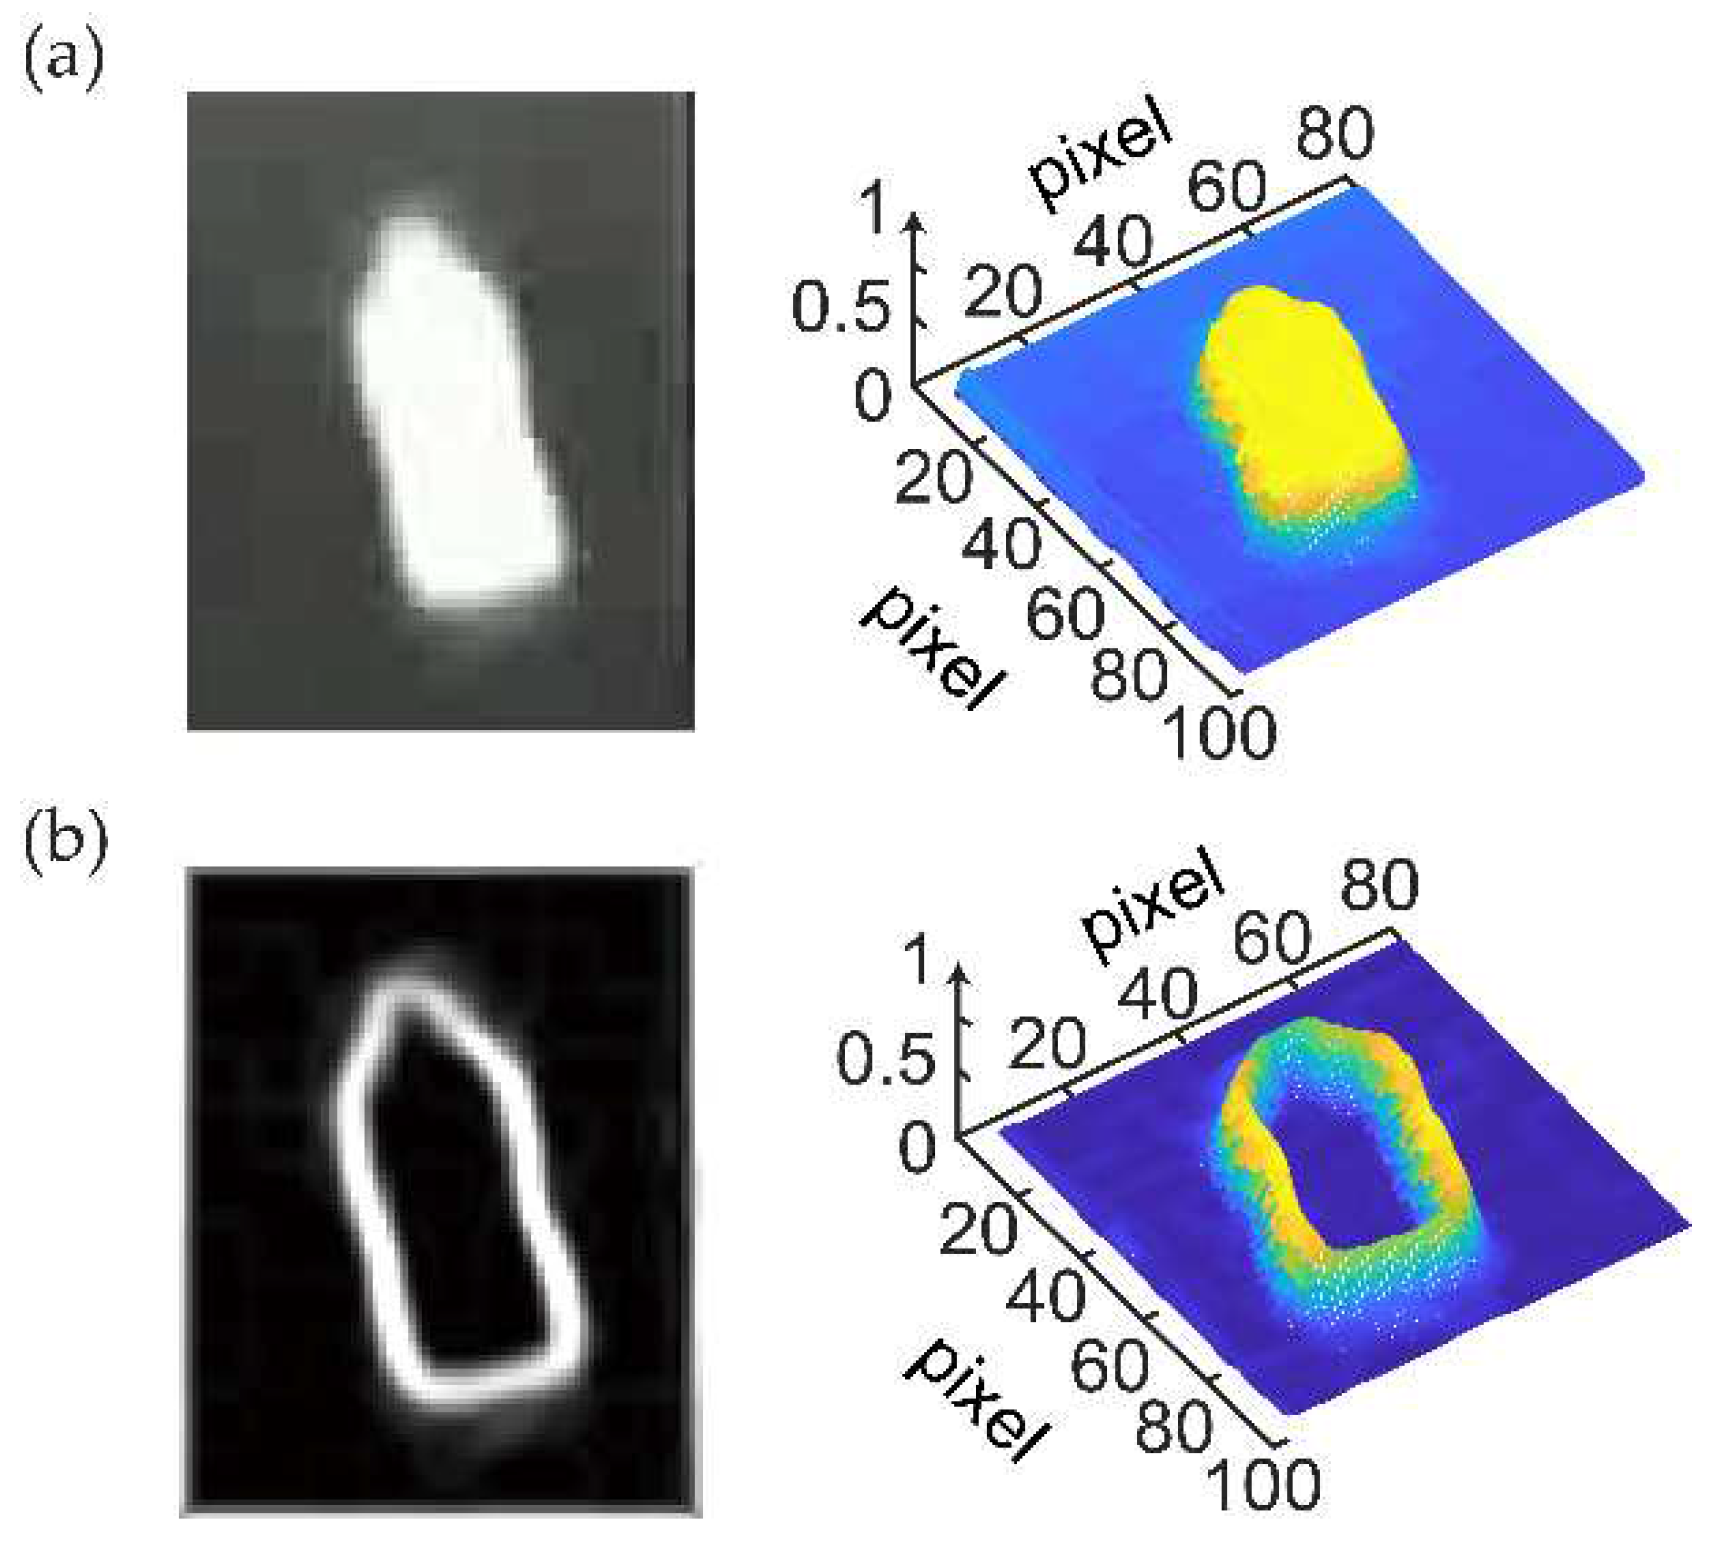
Figure 2.
Dazzling effect experimental device concept diagram.
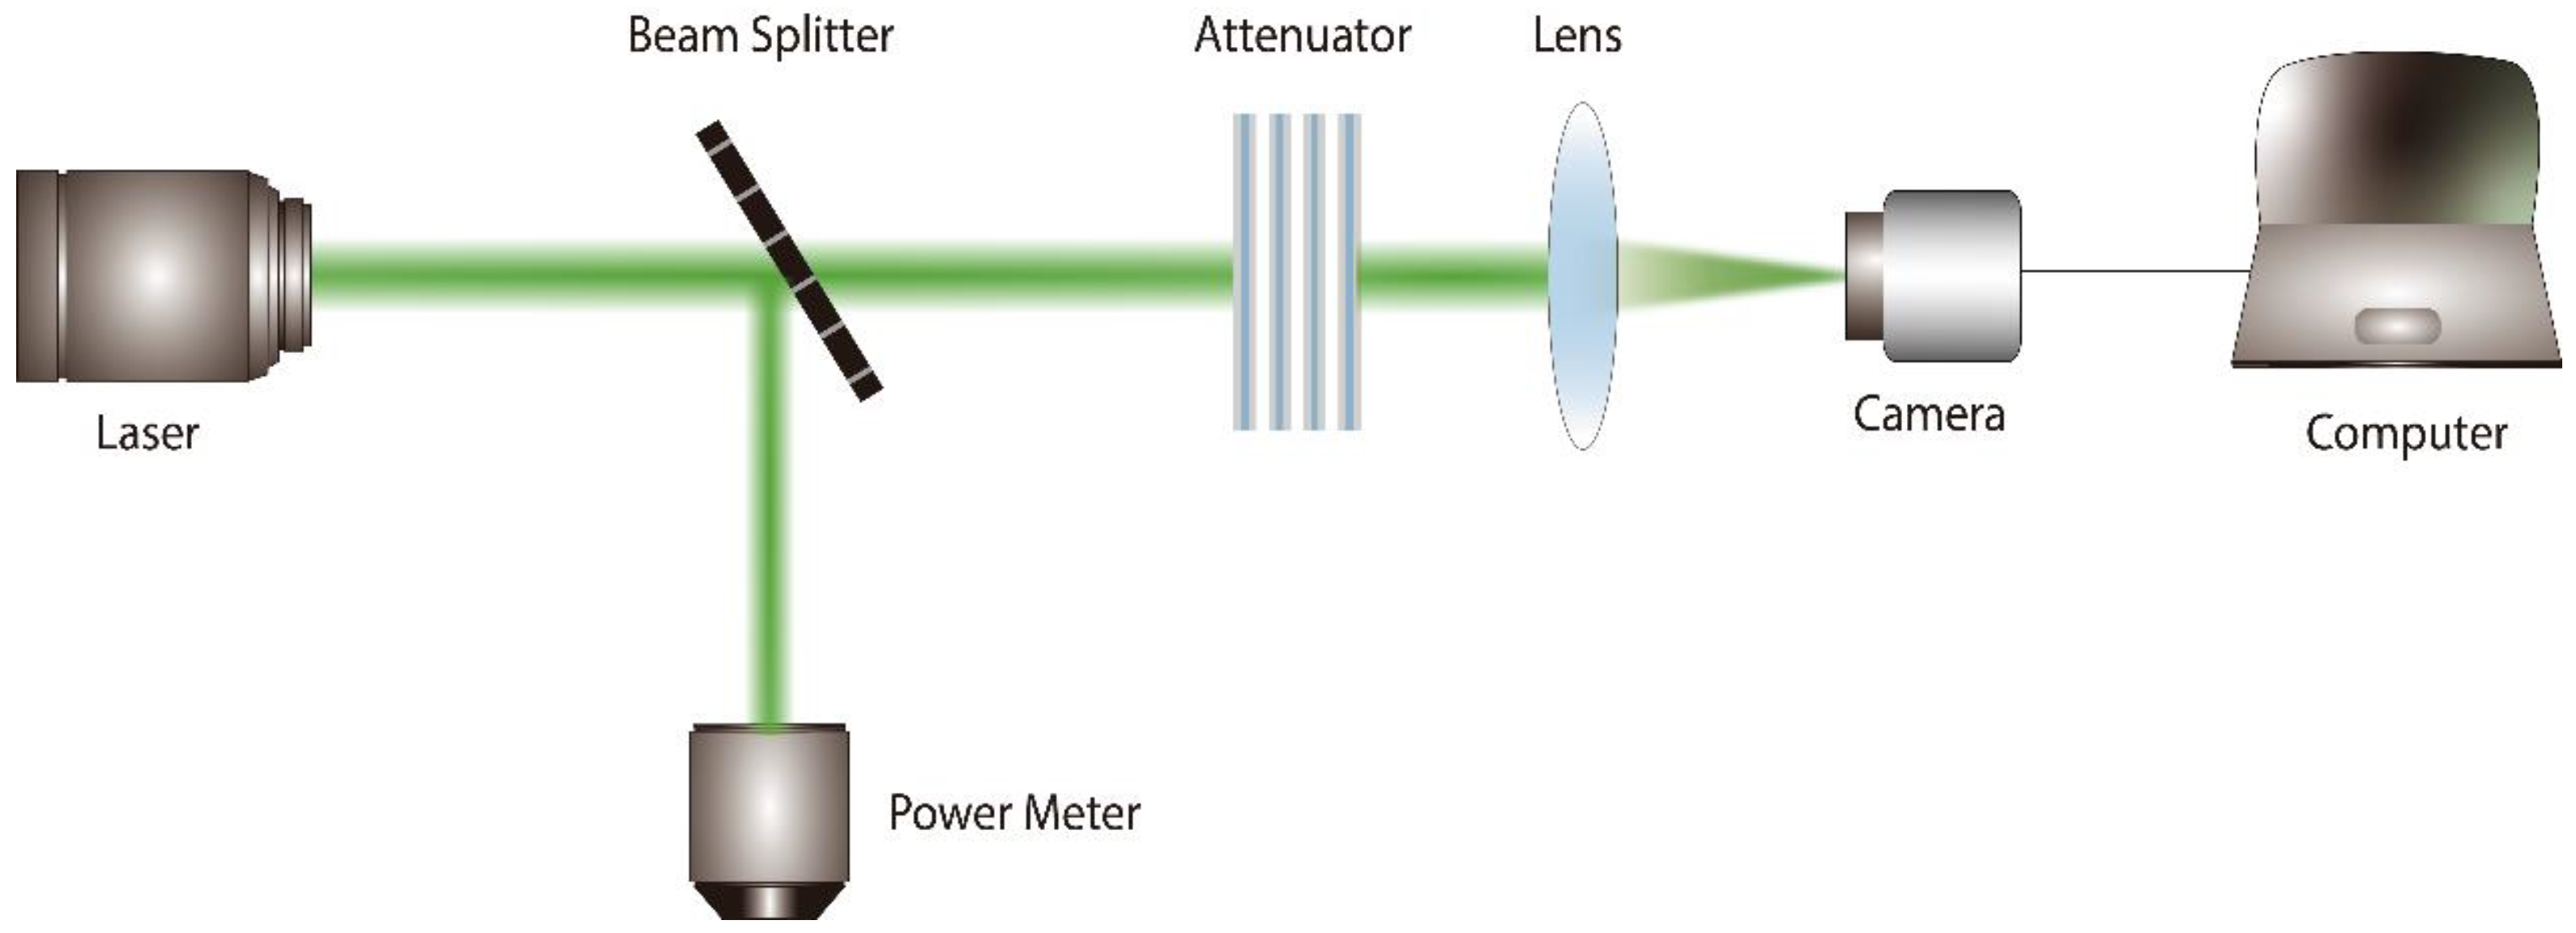
Figure 4.
Schematic diagram of remote damage experiment in external field.
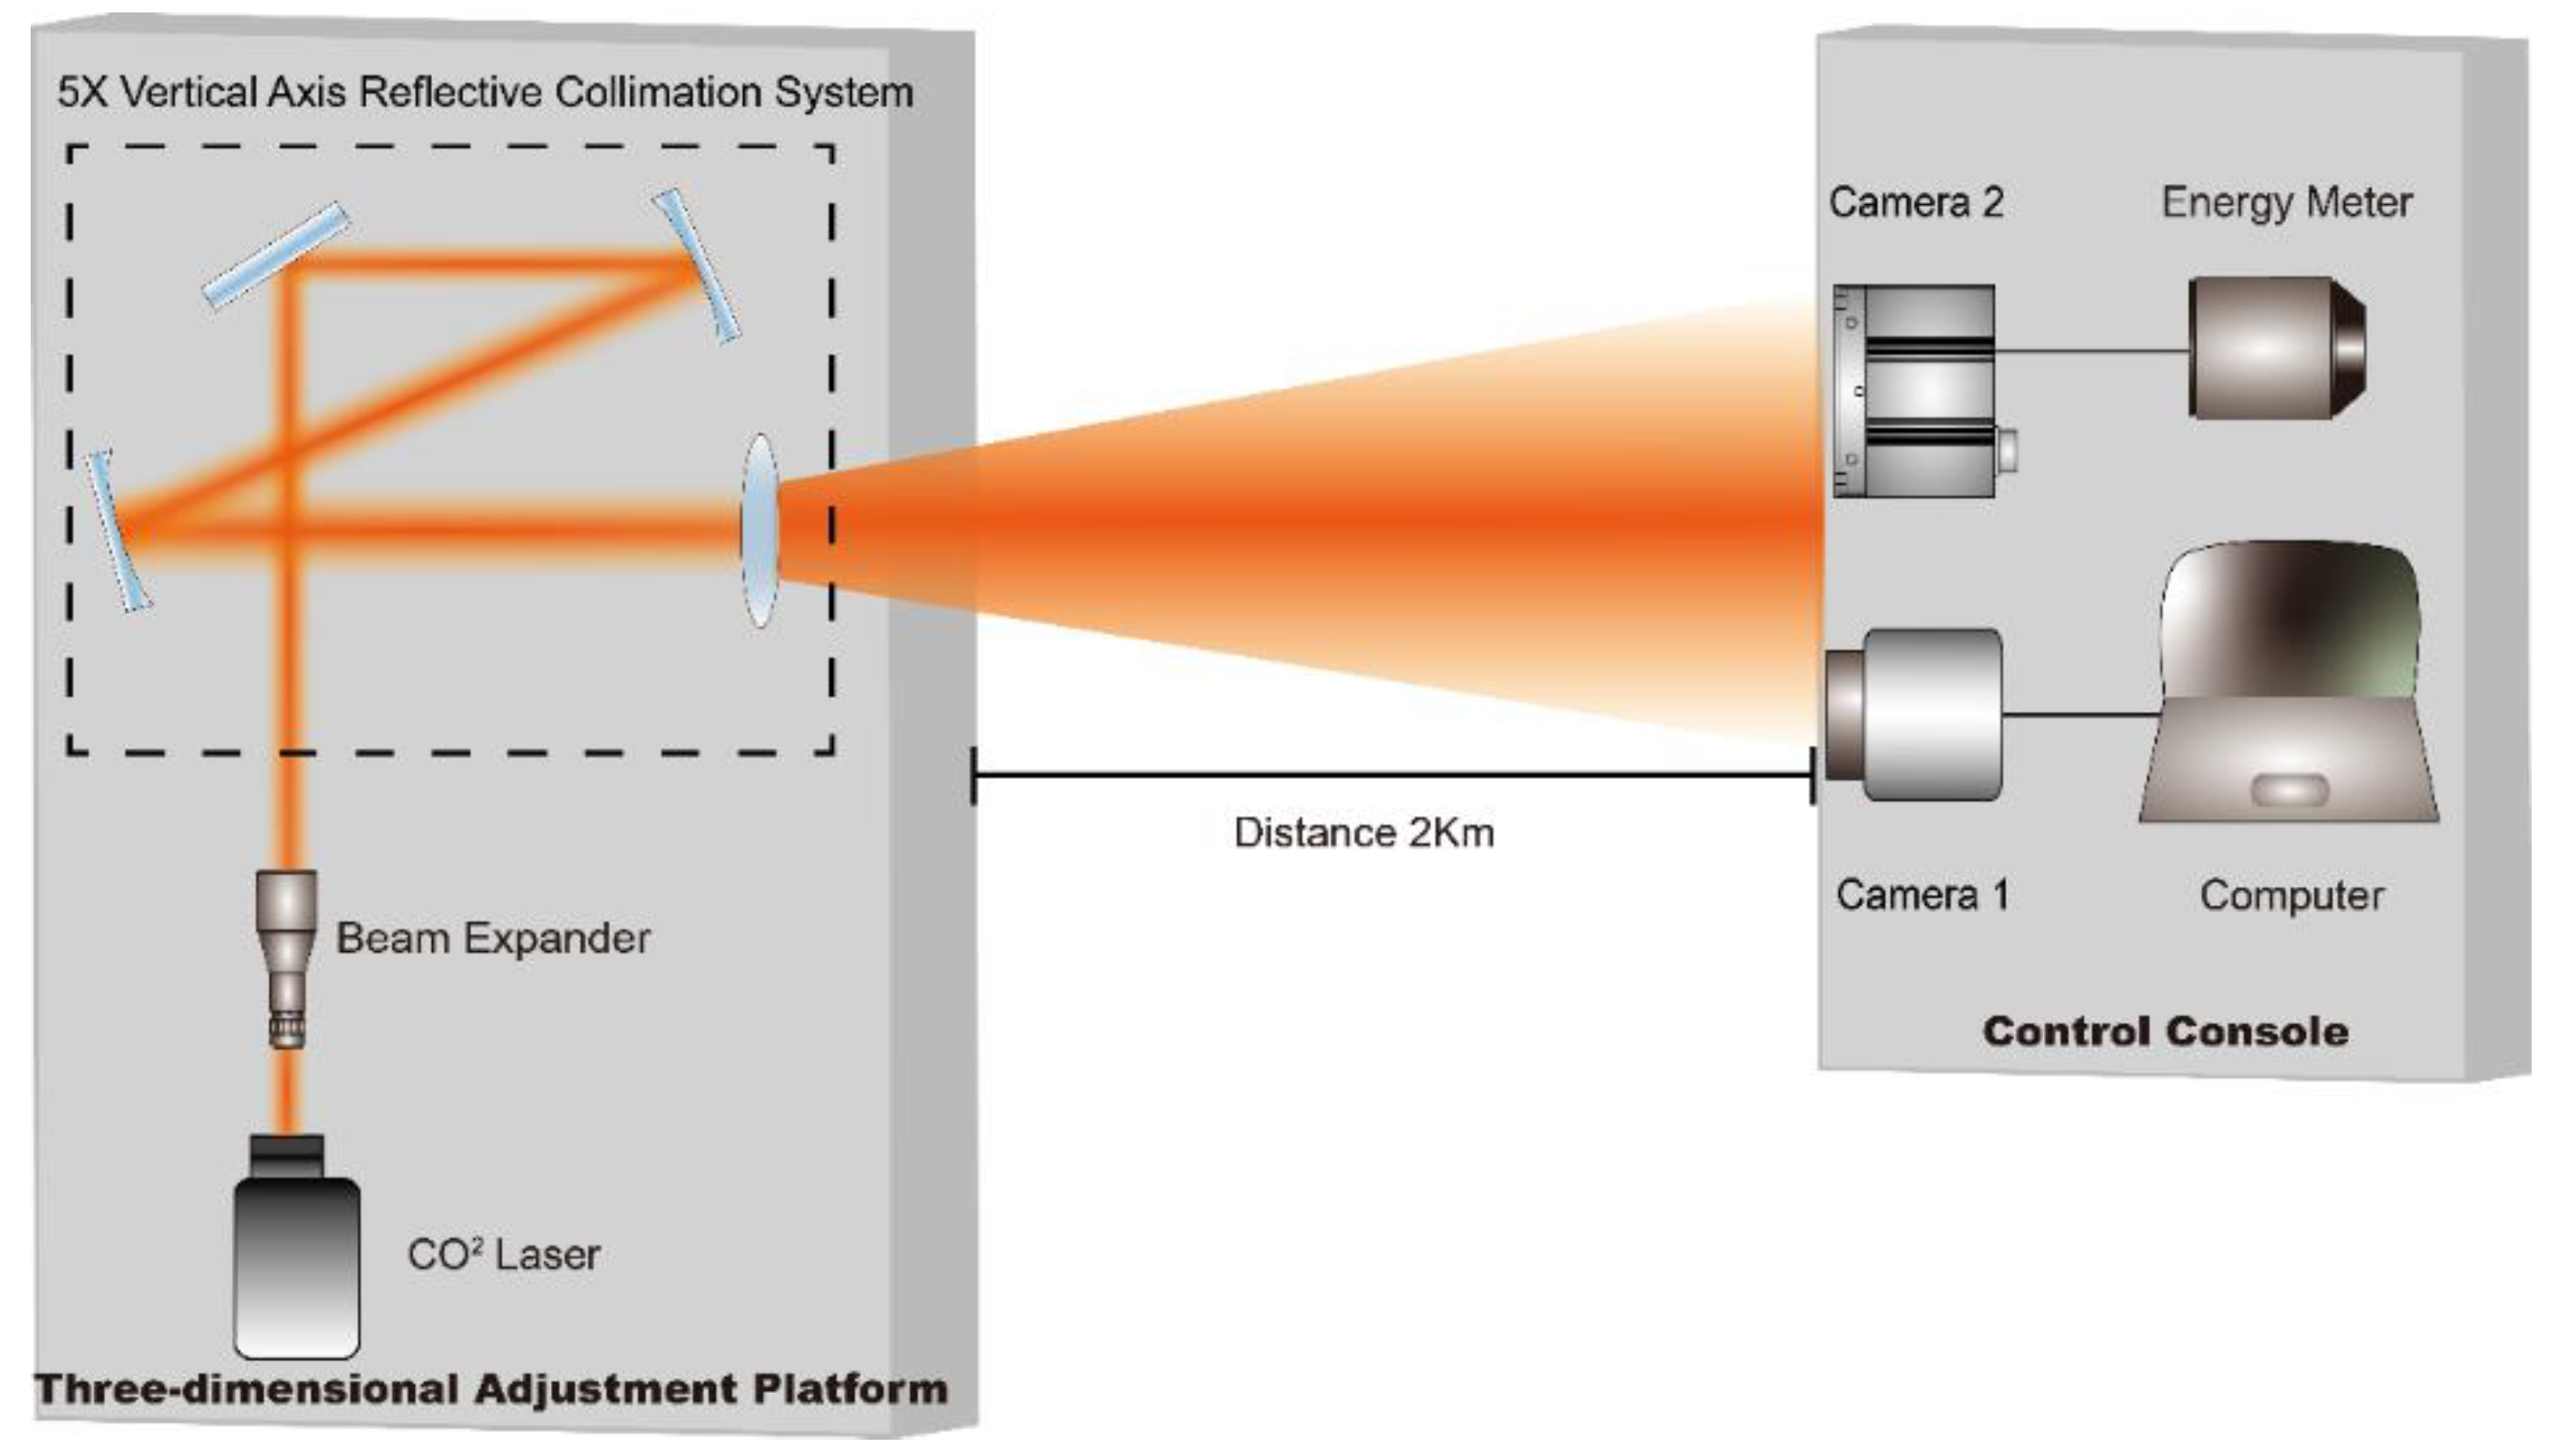
Figure 3.
Infrared laser dazzling and target image.
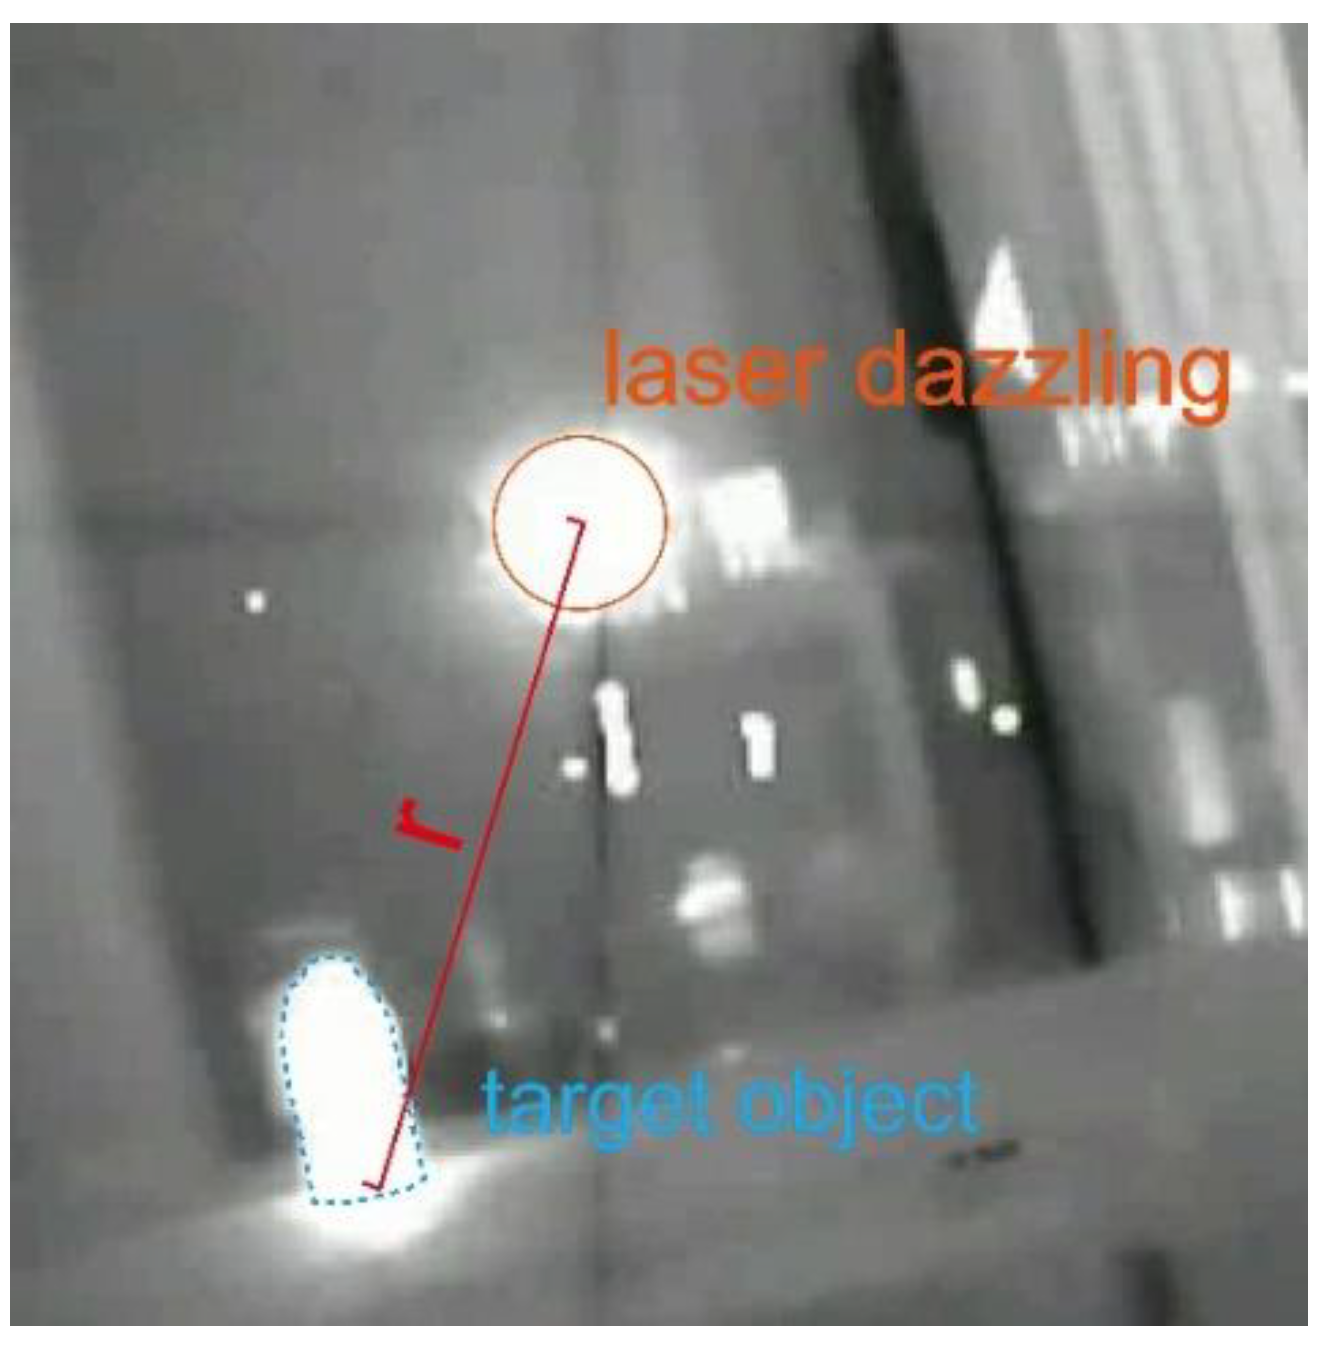
Figure 5.
(a). Close distance(r= 1.1m) laser dazzling image; (b). Close distance (r= 1.1m) recognition of dazzling images; (c). Long distance(r= 1.7m) laser dazzling image; (d). Long distance (r=1.7 m) recognition of dazzling images.
Figure 5.
(a). Close distance(r= 1.1m) laser dazzling image; (b). Close distance (r= 1.1m) recognition of dazzling images; (c). Long distance(r= 1.7m) laser dazzling image; (d). Long distance (r=1.7 m) recognition of dazzling images.
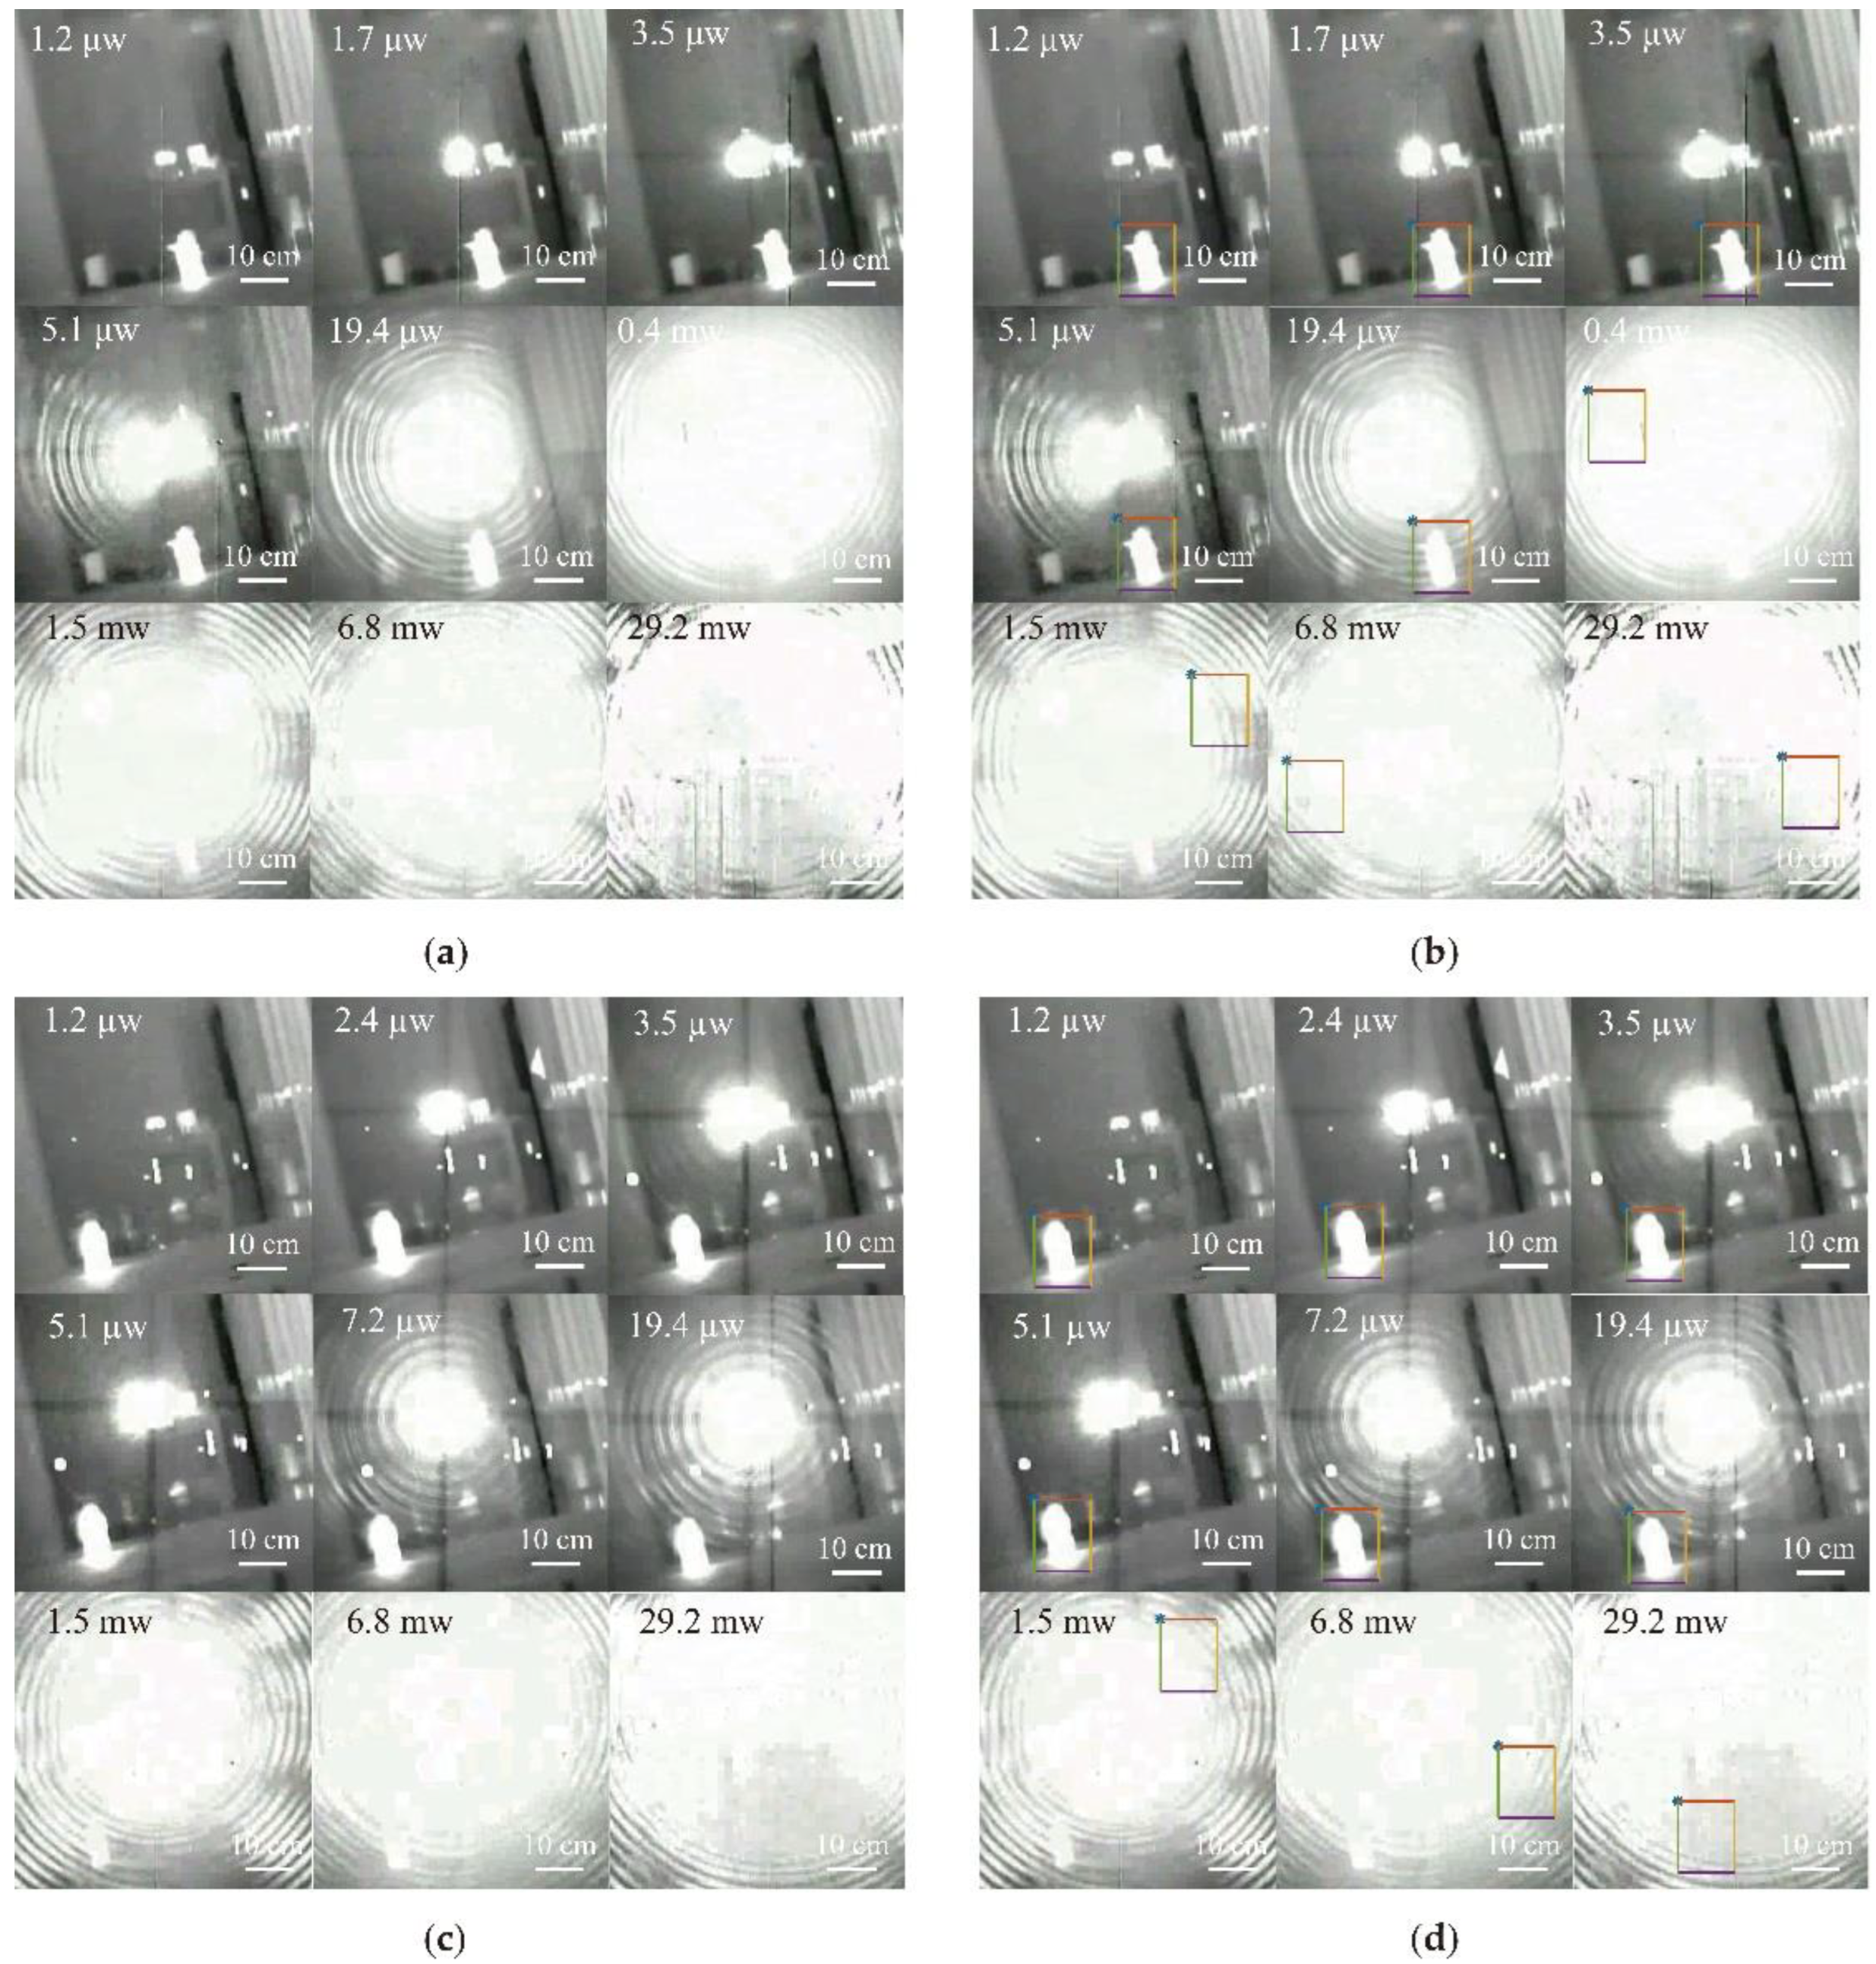
Figure 6.
Different laser power similarity evaluation curves.

Figure 7.
Damage morphology of different laser energy density.
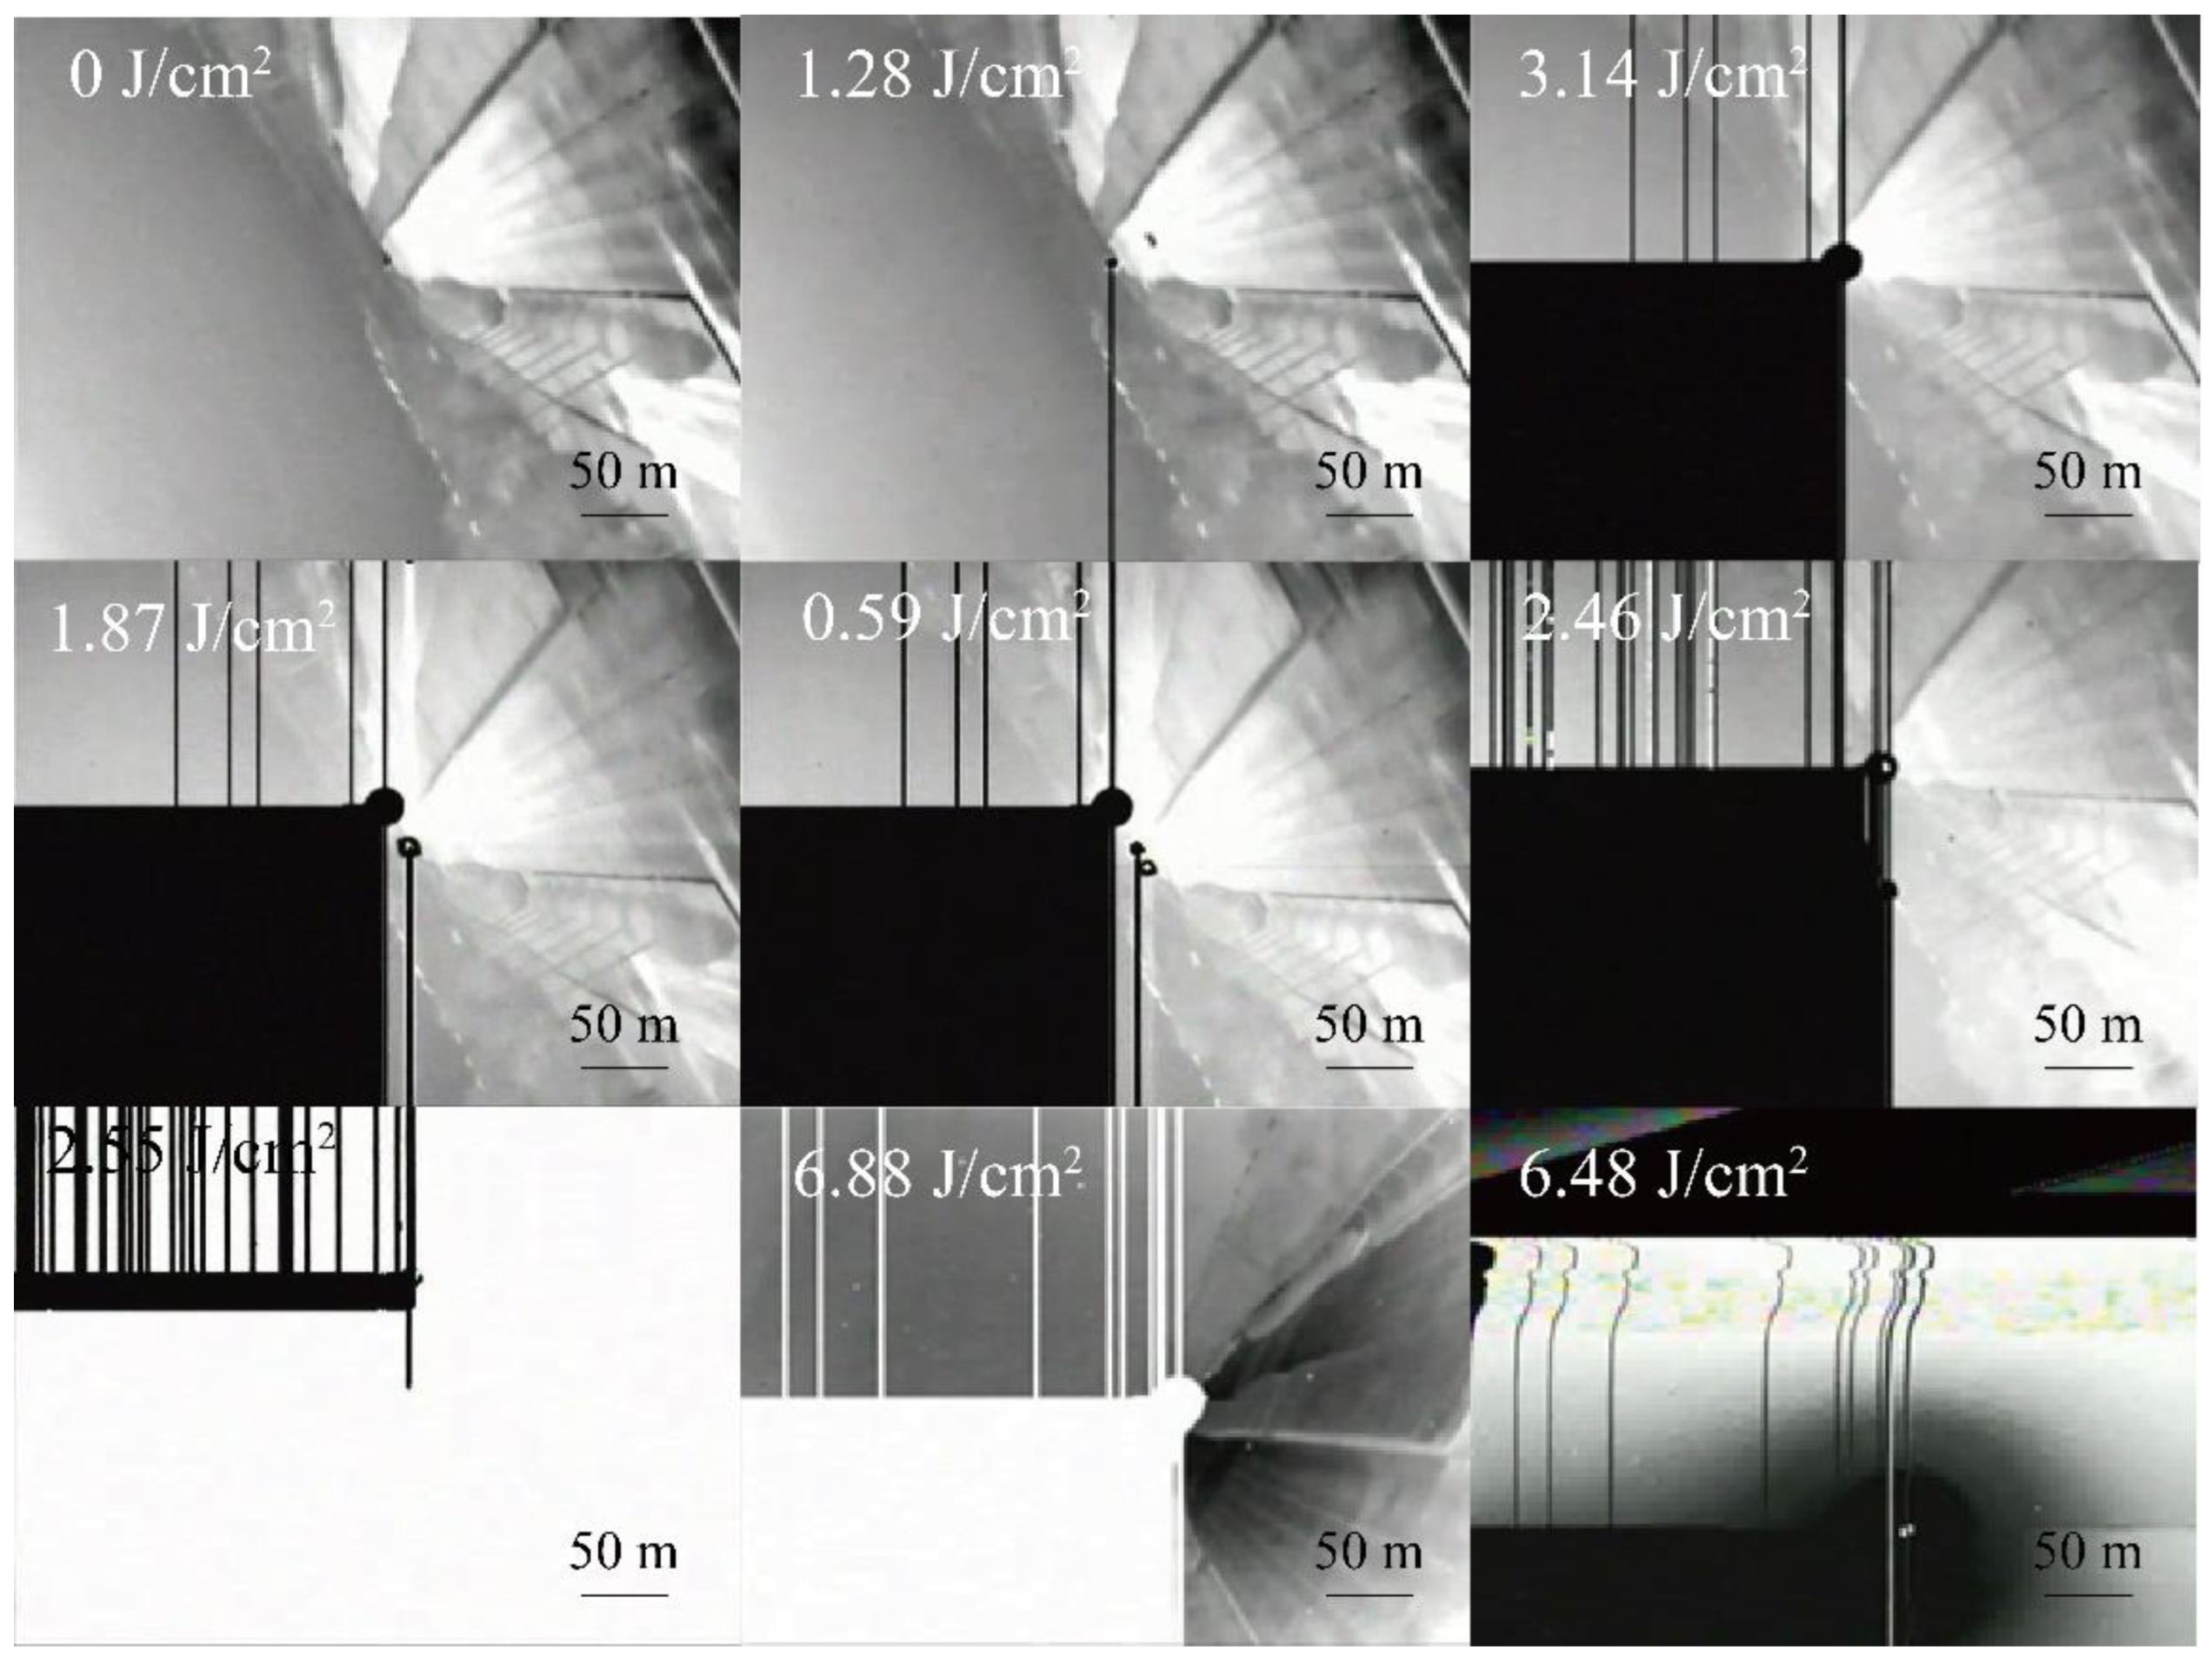
Figure 8.
Different target images at different positions.(a) Close distance target image;.(b) long distance target image.
Figure 8.
Different target images at different positions.(a) Close distance target image;.(b) long distance target image.
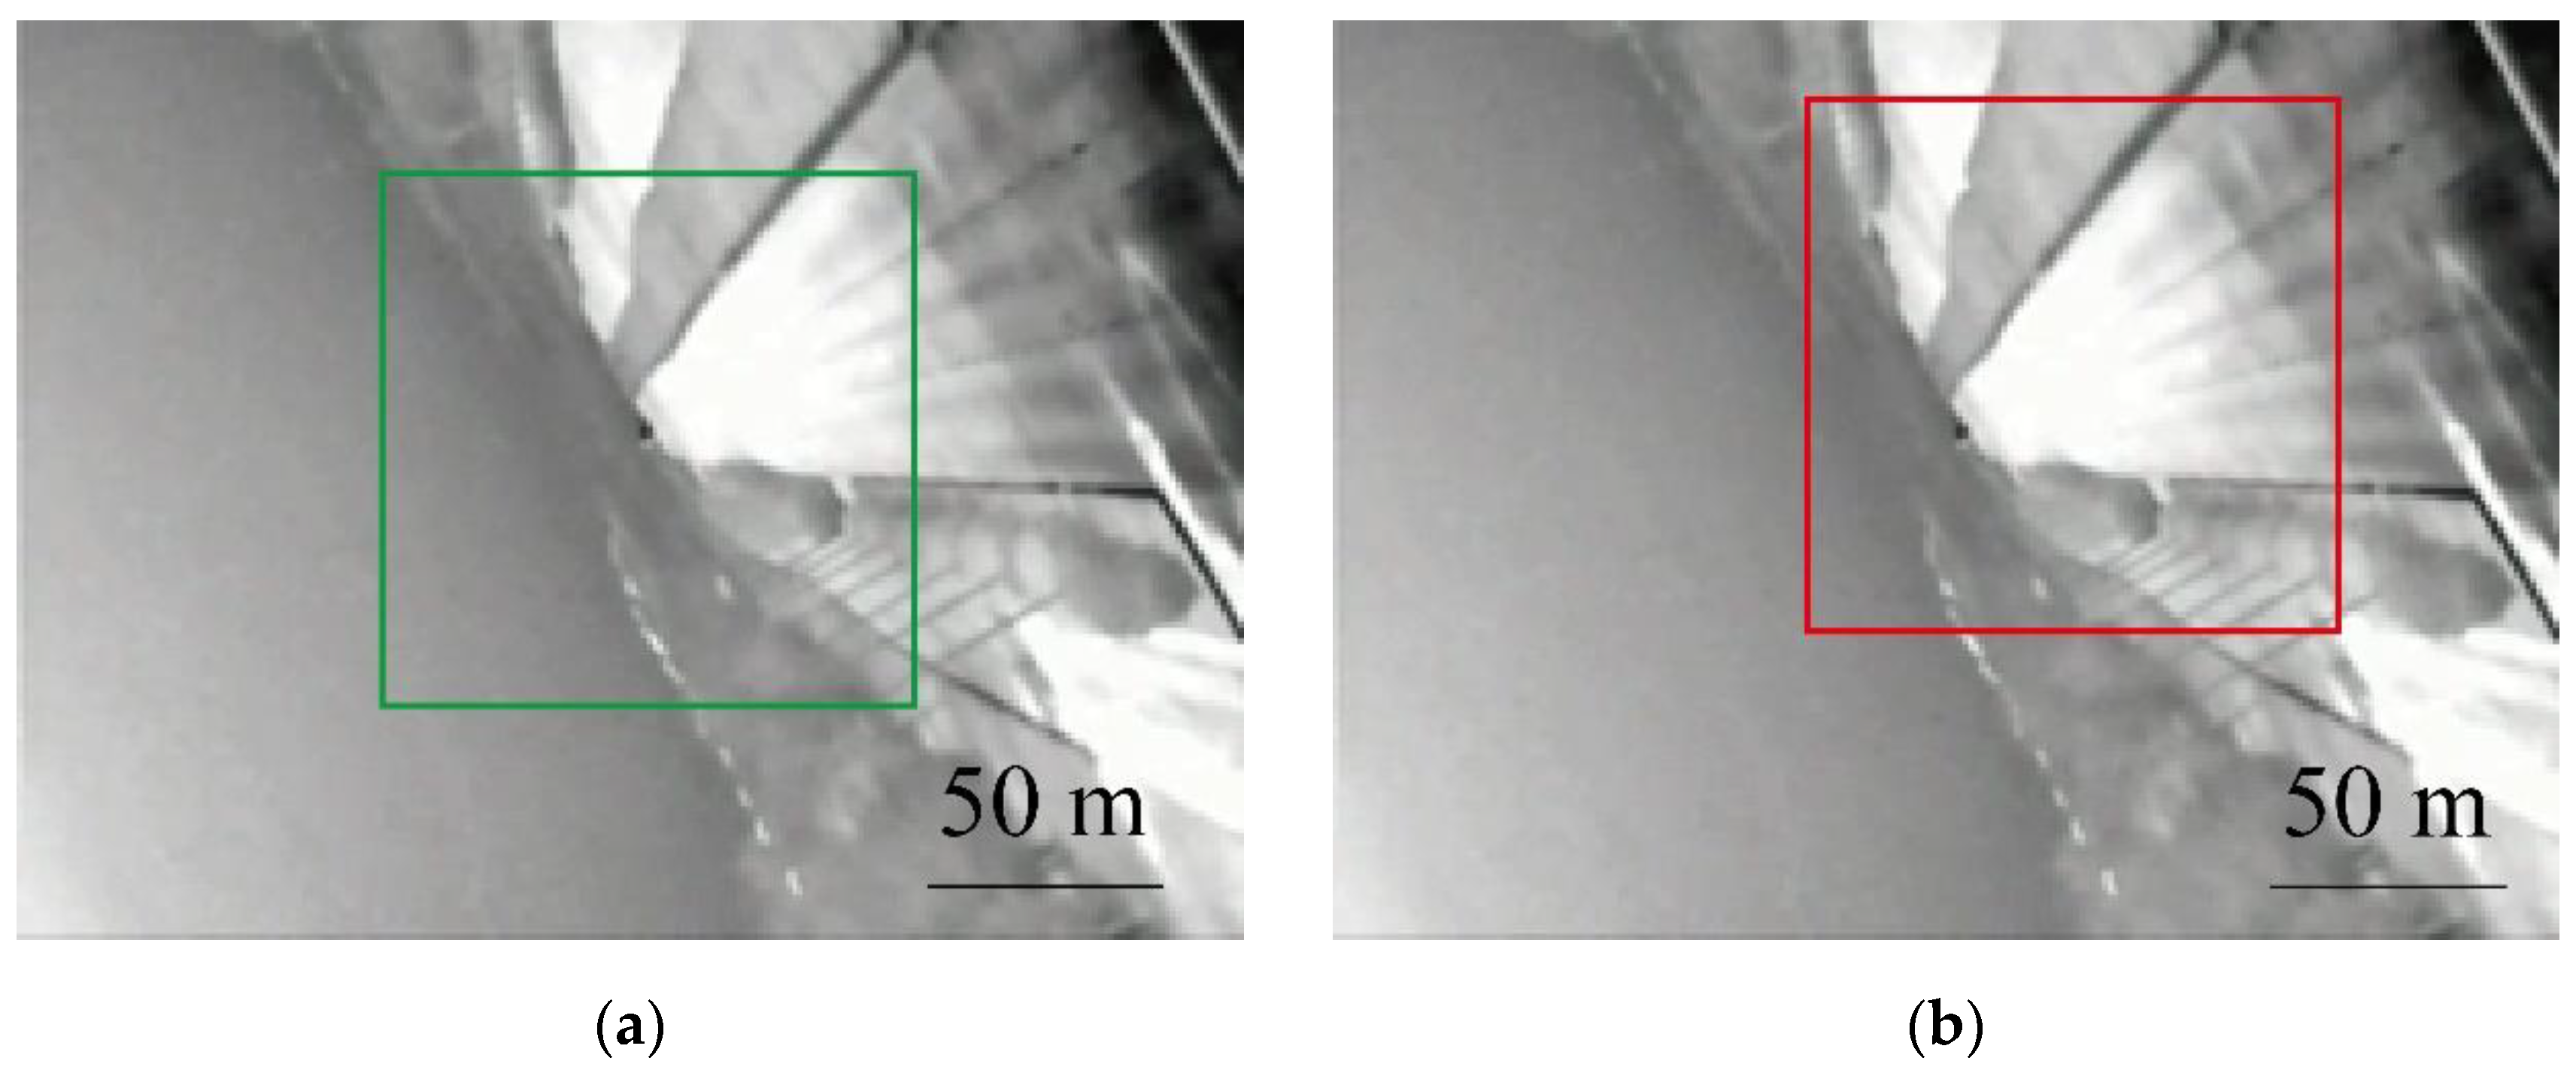
Figure 9.
Evaluation curve of different laser energy correlation.
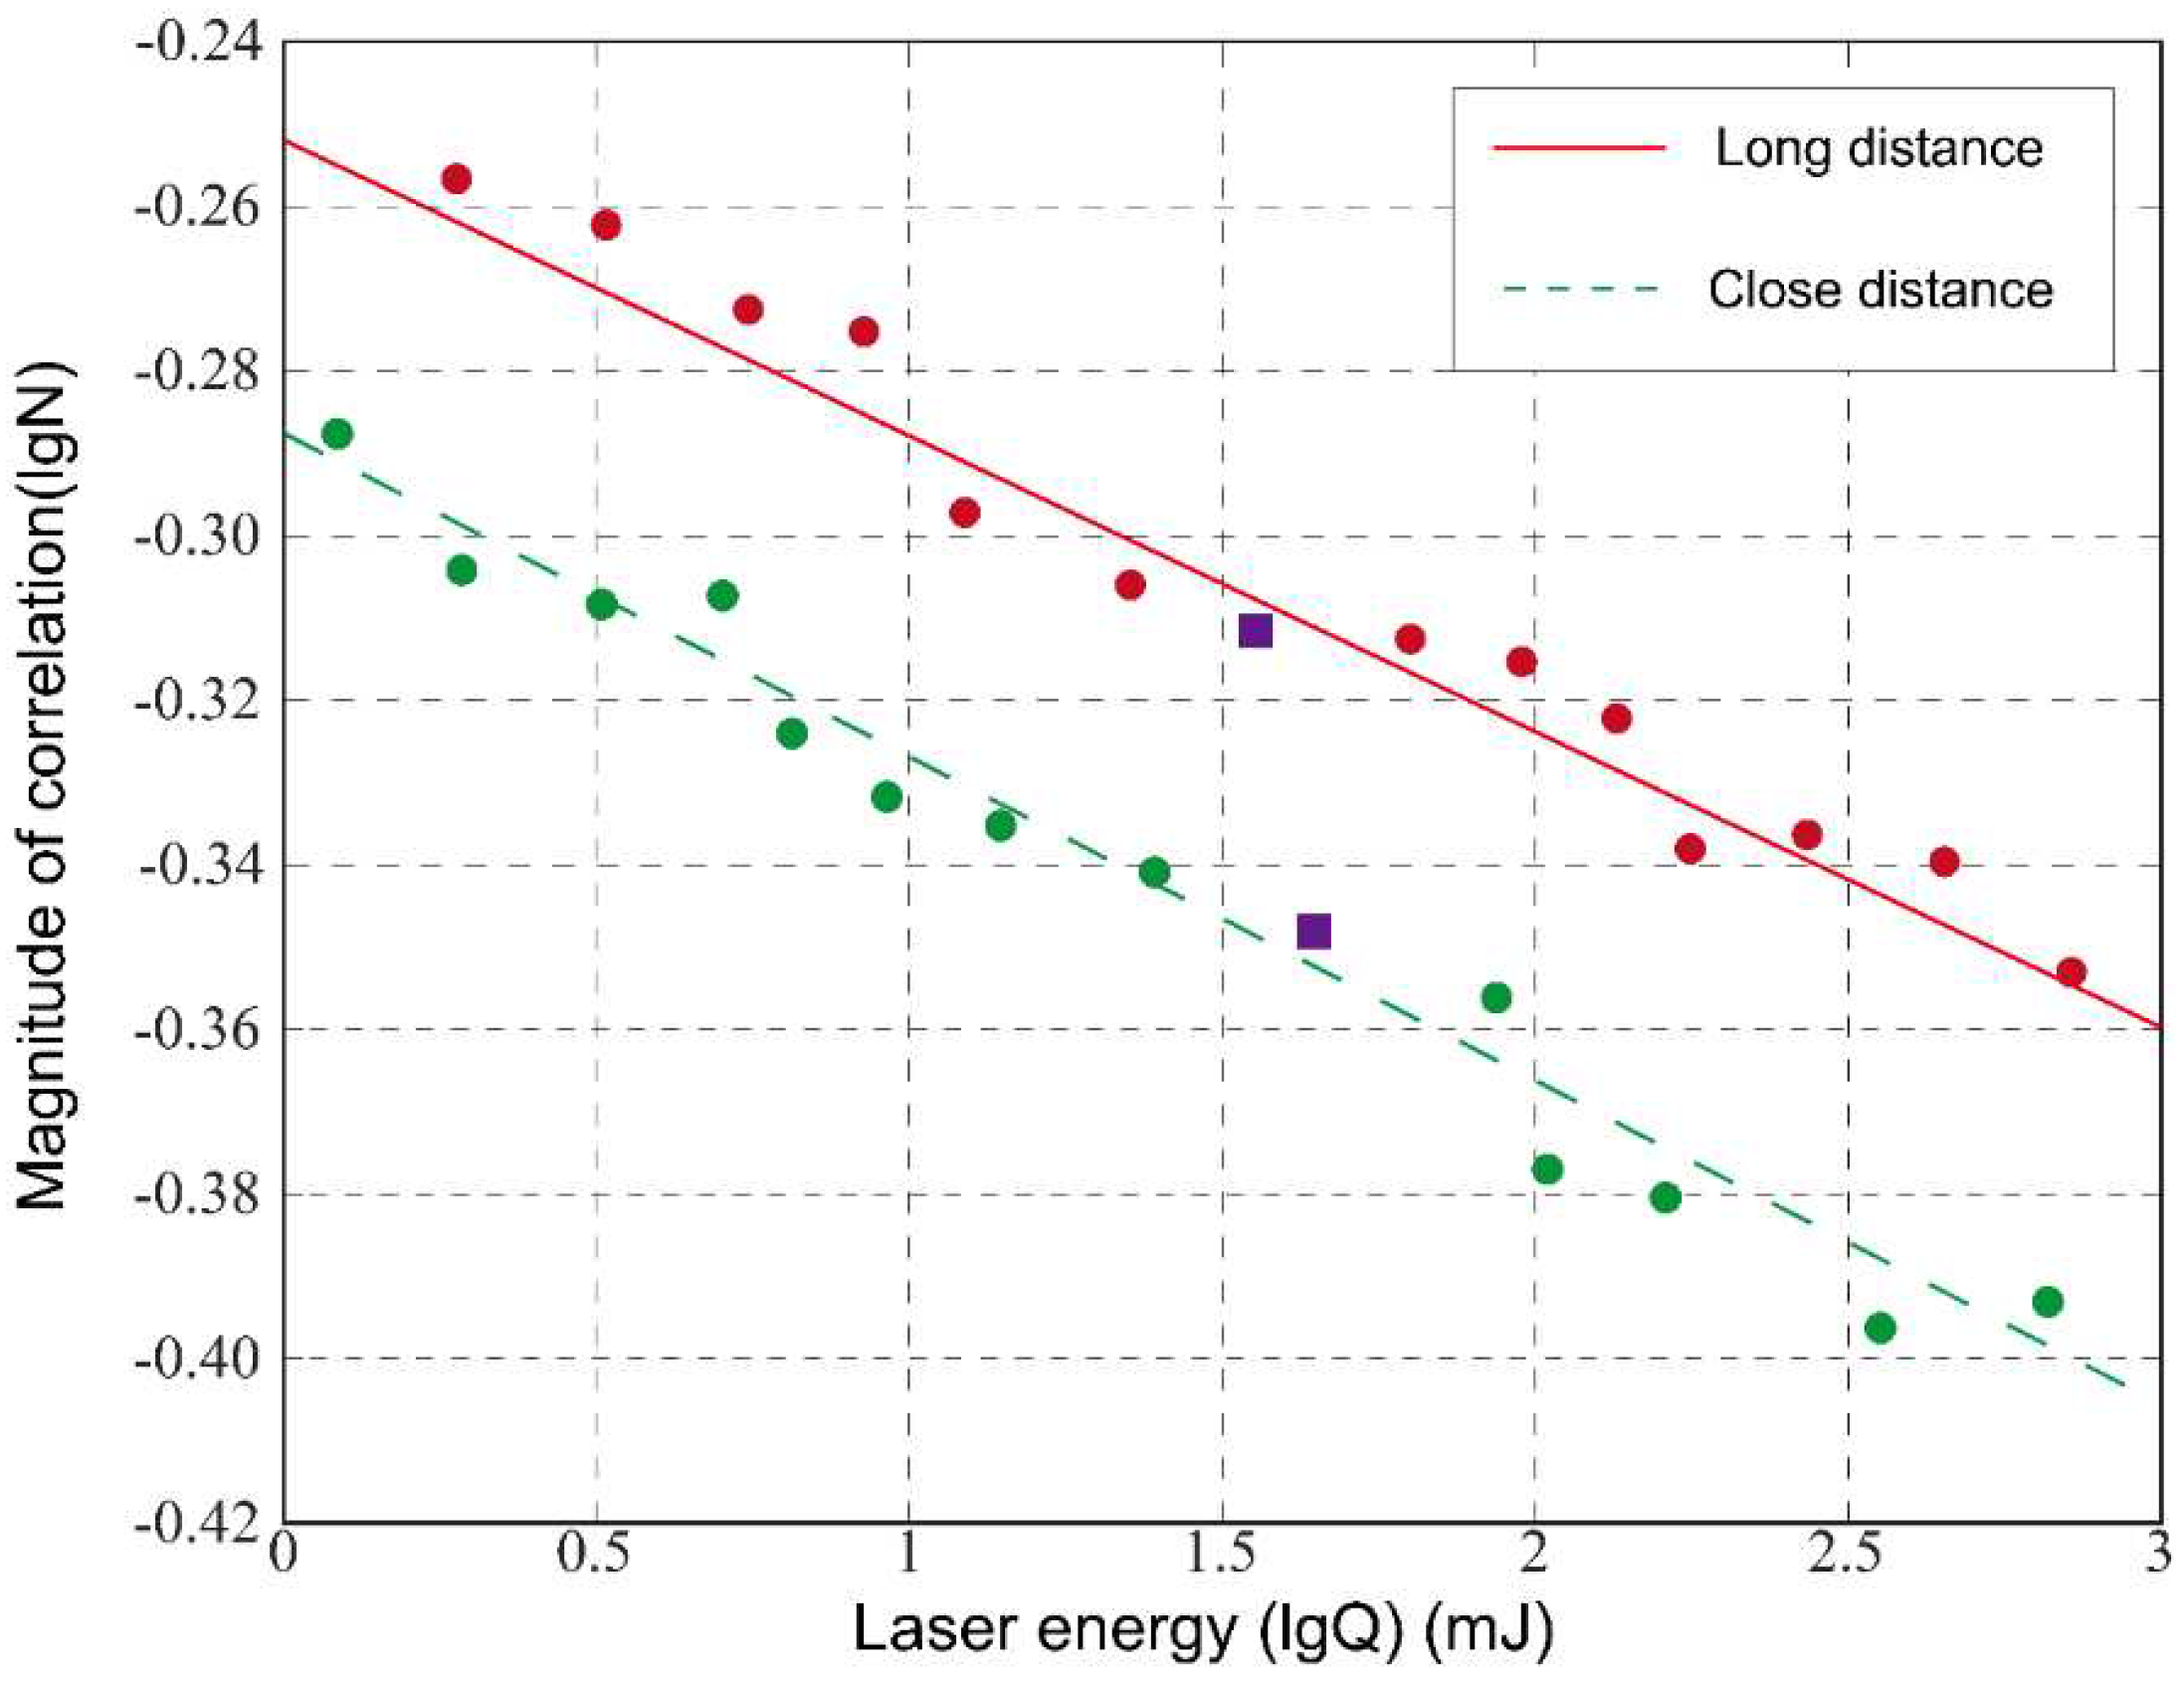

Table 1.
Experimental measurement results of laser dazzling effect.
| Number | Power at Target (mw) | Spot Radius (μm) | Power Density at Target (W/cm2) | Number of Dazzling Pixels | |
| Close Distance | Long Distance | ||||
| 1 | 0.001182 | 6.5 | 0.891310 | 10413 | 10428 |
| 2 | 0.001701 | 6.5 | 1.281858 | 10938 | 10992 |
| 3 | 0.002446 | 6.5 | 1.843532 | 11726 | 11842 |
| 4 | 0.003517 | 6.5 | 2.651317 | 12197 | 12301 |
| 5 | 0.005058 | 6.5 | 3.813050 | 15271 | 15362 |
| 6 | 0.007275 | 6.5 | 5.483823 | 15587 | 15693 |
| 7 | 0.019460 | 6.5 | 14.66922 | 26081 | 27947 |
| 8 | 0.052057 | 6.5 | 39.24018 | 41897 | 42064 |
| 9 | 0.139255 | 6.5 | 104.9674 | 62527 | 64691 |
| 10 | 0.372507 | 6.5 | 280.7880 | 73856 | 74119 |
| 11 | 1.594331 | 6.5 | 1201.772 | 74798 | 75586 |
| 12 | 6.823740 | 6.5 | 5143.587 | 95052 | 95986 |
| 13 | 29.20560 | 6.5 | 22014.55 | 123792 | 127443 |
Disclaimer/Publisher’s Note: The statements, opinions and data contained in all publications are solely those of the individual author(s) and contributor(s) and not of MDPI and/or the editor(s). MDPI and/or the editor(s) disclaim responsibility for any injury to people or property resulting from any ideas, methods, instructions or products referred to in the content. |
© 2024 by the authors. Licensee MDPI, Basel, Switzerland. This article is an open access article distributed under the terms and conditions of the Creative Commons Attribution (CC BY) license (http://creativecommons.org/licenses/by/4.0/).
Copyright: This open access article is published under a Creative Commons CC BY 4.0 license, which permit the free download, distribution, and reuse, provided that the author and preprint are cited in any reuse.


