
Submitted:
05 February 2024
Posted:
05 February 2024
You are already at the latest version
Abstract
Continuous cropping of Platycodon produces problems that significantly impact its yield and quality making it a pressing issue that requires immediate attention. In this study, the sandwich method is employed to evaluate the allelopathic activity of different plant parts (leaves, stems, and roots) of Platycodon. The inhibitory effects of the various Platycodon plant parts were quantified based on their effects on lettuce seedlings growth by Sandwich method, with the following average inhibition percentages at 1 mg/ml (agar) of : leaves (79.4%, 61.8%), stems (58.0%, 45.7%), and roots (53.4%, 49.3%) for lettuce radicals and hypocotyls, respectively. At a concentration of 5 mg/ml, the inhibitory effects were as follow: leaves (91.9%, 72.2%), stems (79.5%, 60.3%), and roots (71.4%, 65.2%). Also, by employing the Plant Box method, it was determined that Platycodon root exudation. The growth inhibition rates of lettuce seedling roots and hypocotyls were 45.5% and 18.9%, respectively. The effect of activated carbon on the adsorption of allelopathic substances was investigated, and the results of the sandwich method with a concentration of 1 mg/ml showed the following growth inhibitory effects on lettuce seedlings and hypocotyls: roots (27.8%, 25.7%), leaves (13.3%, 25.7%), and stem (9.07%, 13.6%). The Plant Box method revealed average rates of inhibition of -16.7% and -4.70% on the growth of lettuce seedlings and hypocotyls, respectively. The results of this study demonstrated that activated carbon has a mitigating effect on the allelopathic inhibition associated with the different plant parts and root exudation of Platycodon, thus may provide a potential solution for overcoming obstacles associated with continuous cropping of Platycodon.
Keywords:
Activated carbon
; Platycodon
; continuous cropping problem
; exudation of allelochemicals
1. Introduction
Platycodon (Platycodon grandiflorus), commonly known as balloon flower, is a perennial herb belonging to the family Campanulaceae. It is also referred to as "ling-danghua" in Chinese and is known as "Hulundanchagan" in Mongolian. The roots of this plant are extensively used in traditional Chinese medicine, while its above-ground parts are consumed as a vegetable. It is primarily distributed across various provinces in Northeast, North, East, and Central China, as well as Guangdong, northern Guangxi, Guizhou, southeastern Yunnan (Mengzi, Yanshan, Wenshan), Sichuan (east of Pingwu, Liangshan), Shaanxi, and other regions. It is also found in parts of Korea, Japan, and southern regions of the Russian Far East and East Siberia. Platycodon typically thrives in sunny grasslands and shrublands at elevations below 2000 meters and is less commonly found in forest understories [1]. Due to its high medicinal and food value, the market demand for Platycodon is increasing, and artificial cultivation has become the main way to supply the market.
Medical research and analysis show that Platycodon contains a variety of active chemical components, mostly comprising Platycodon total saponins [2]. In addition, Platycodon also contains polysaccharides, flavonoids, amino acids, fatty oils, fatty acids, inorganic elements, vitamins and volatile oils [3], and a large amount of unsaturated fatty acids. Therefore, Platycodon has high medicinal and edible value. Studies have shown that Platycodon saponin has weight-loss activity [4]. Platycodon also has the effects of reducing tobacco toxicity and controlling the increase in blood alcohol content in the human body [5]. Therefore, Platycodon can also be processed into thin strips to make cold dishes, and some can also be made into pickles, cans, and other products; it is a very popular functional health food [6]. The demand for medicinal and health food production of Platycodon has increased, and Platycodon has become an important crop in agricultural production. At the same time, it will bring greater economic benefits to the development of Platycodon planting areas. Therefore, research on Platycodon has attracted widespread attention.
The limited availability of land resources suitable for cultivating authentic medicinal herbs is influenced by factors such as soil conditions and planting restrictions. Continuous cropping or replanting is common in this context [7]. Crop rotation is a beneficial measure to overcome the obstacles of continuous cropping; however, the intercropping duration for medicinal plants is often lengthy. For instance, Scrophularia ningpoensis requires an interval of 3–4 years before it can be planted again in the same soil. Ginseng and American ginseng may need more than 30 years before being replanted at the same location [8]. Intercropping with Salvia miltiorrhiza can take as long as 8 years [9]. These extended intercropping intervals significantly impact the stability of the supply of traditional Chinese medicinal herbs. Therefore, finding methods to alleviate the challenges of continuous cropping is crucial for the sustainable development of the traditional Chinese medicine industry.
However, the issue of continuous Platycodon cropping seriously hampers the sustainable development of its cultivation. Previous studies have shown that the continuous cultivation of Platycodon for 2 years results in a significantly decreased yield and quality, while continuous cultivation for 4–5 years may lead to severe root rot, causing a reduction in yield of over 50% or even complete crop failure [10]. Despite attempts to address obstacles to continuous cropping through pest control, disease management, and cultivation techniques, the results remain unsatisfactory [11]. Moreover, the allelopathic effects of Platycodon leaves have been characterized, revealing their strong allelopathic inhibitory effect on the growth of lettuce seedlings and hypocotyls of the test plants [12]. Considering the decline in emergence rates and growth damage observed in replanted crops, it is reasonable to speculate that Platycodon may induce autotoxicity through the release of allelopathic substances.
Allelopathy is a phenomenon in which plants influence the growth of surrounding plants (or microorganisms) by releasing natural compounds, resulting in inhibitory or stimulatory effects [13]. This phenomenon was first named "allelopathy" by German botanist Hans Molisch in 1937, and the compounds causing allelopathy are referred to as allelochemicals. Allelochemicals are primarily released via three pathways: volatilization from the aboveground parts of plants, leaching or shedding from plant debris, and root exudation. They affect not only the growth of neighboring plants, but may also impact the plant’s own community or its own growth [14].
Continuous cropping poses a significant challenge in the cultivation of medicinal herbs, and over 40% of medicinal herbs are artificially cultivation in China. Among the cultivated varieties, root-based medicinal herbs make up approximately 70% and obstacles to continuous cropping are prevalent in their cultivation processes [15,16]. Medicinal herbs such as Rehmannia glutinosa, Pinellia ternata, Pseudostellaria heterophylla, Panax ginseng, Lilium brownii, Panax pseudoginseng, Panax quinquefolius, and Salvia miltiorrhiza all face issues related to continuous cropping obstacles [17,18,19,20,21,22,23,24]. The phrase “continuous cropping obstacles” refers to the phenomenon whereby consecutive planting in the same plot of land results in a decline in seedling emergence and growth inhibition [25]. The main causes include an increase in soil-borne pathogens or the exacerbation of pests and diseases [26], impaired absorption of soil nutrients, deterioration of soil physicochemical properties, and allelopathy [27,28]. Autotoxicity caused by allelopathic substances released by plants is a crucial factor contributing to the formation of obstacles to continuous cropping. Numerous studies have shown a close correlation between the health of medicinal plants under continuous cropping conditions and the content of root exudates, especially by observing the accumulation of organic acids in continuously cropped soil. These organic acids, phenolic acids, terpenoids, coumarins, flavonoids, and other compounds have been identified as allelopathic substances [29]. Some root exudates induce the production of reactive oxygen species, disrupt root tip cells, and affect the levels of chlorophyll and osmoregulatory substances, thus inhibiting the growth of roots and shoots. The allelopathic inhibitory feedback exhibited by roots is more pronounced than that of stems and leaves, which may be a primary mechanism through which allelopathic substances influence the content of active components, especially underground parts, in medicinal plants [30]. Since Platycodon is a type of root-based medicinal herb, the allelopathic effects of root exudates are crucial elements that need to be measured and analyzed when examining the causes of obstacles to continuous cropping.
The allelopathic activity of the entire Platycodon plant and its various parts with respect to its seed germination and seedling growth were investigated, and strong allelopathic inhibitory effects were observed. This suggests that the continuous cropping obstacles associated with Platycodon may arise from autotoxicity caused by allelochemicals released by the plant itself [31]. During the process of continuous cropping obstacle formation, root exudates are also one of the important influencing factors. Therefore, studying the impact of root exudates on plant growth is a key aspect in elucidating the reasons behind continuous cropping obstacles [32]. However, there is currently more research on the impact of aboveground allelochemicals on seedling growth and germination, while studies on the allelopathic effects of the root exudates of Platycodon are relatively scarce. In this study, the allelopathic effects of Platycodon roots and their exudates was initially measured to explore the potential role of the roots in the formation of obstacles to continuous cropping. Subsequently, the allelopathic effects of Platycodon root exudates were comprehensively assessed using the Plant Box method (Figure 2) to better infer the impacts resulting from their contribution to continuous cropping obstacles. Finally, to understand the allelopathic effects of the various parts and root exudates of Platycodon, activated carbon, an effective material in controlling allelopathic inhibition in crops such as asparagus and peach trees was introduced to test its effects on the absorption of Platycodon self-released allelopathic substances.
The definition of activated carbon is not precise, and it is generally described as a substance with a large surface area and strong adsorption capacity that is mainly composed of carbon [33]. Activated carbon has various applications, such as serving as a deodorant in refrigerators and an adsorbent in industries. Its raw materials mainly include wood charcoal, coconut shells, and brown coal. In the agricultural field, the use of activated carbon has been studied for several types of plants, and some have even been put into practical use in Japan. For example, although there are studies on the role of activated carbon in alleviating continuous cropping obstacles in crops such as cucumber, beans, sugar beets, and asparagus [34,35,36,37], research on such obstacles related to Platycodon is relatively limited. Therefore, the aim of this study was to test the absorptive effects of activated carbon on the allelopathic effects of the various parts and root exudates of Platycodon toward establishing a scientific basis for the study of materials that alleviate obstacles to continuous cropping. This study aimed to demonstrate the role of potential autotoxicity of Platycodon from the perspective of allelopathy. Additionally, This study aims to incorporate activated carbon agents to alleviate continuous cropping obstacles in Chinese Platycodon cultivation.
2. Materials and Methods
2.1. Sample Cultivation and Collection
Platycodon seeds (REF-Platycodon: Gansu Ruierfeng Agricultural Science and Trade Co., Ltd., China) were cultivated in experimental greenhouses from May 20 to October 20, 2023, at Meiji University, Faculty of Agriculture. The seeds were planted in culture cups (7.5 cm in diameter) using vegetable cultivation soil (Sakata Seed Co., Ltd., JapanSuper Mix A 40 L). Liquid fertilizer (Hyponex, co., Ltd., in Japan, N-P-K=6-10-5, 1ppm (mL/L)) was applied in appropriate amounts one week after planting (fertilizer: liquid fertilizer di- Ltd., 1000 times). The leaf, root, and stem samples were collected at 60 days (July 20), 90 days (August 20), and 150 days (October 20) of cultivation. After each sampling, the samples were dried in a 60-degree oven for 48 hours. The Plant Box method involved selecting whole plants that weighted approximately 100–300 mg for testing.
2.2. Experimental Methods
Sandwich method (Figure 1): This method was employed to determine the allelopathic effects of the different plant components. A 6-well cell culture plate (Multidish 6 Wells, Nunclon Delta Si, Thermo Fisher Scientific, China) was used, and the prepared samples were divided into two amounts: 10 mg and 50 mg (the reason for choosing 10 mg/10 mL and 50 mg/10 mL was due to the amount of plants present at the site) [40], placed in 3 wells each. The samples were arranged in a sandwich-like layer, with lettuce (Lactuca sativa) seeds (lettuce seed varieties: Cisco, sold by Takii Seed Co., Ltd., Japan) planted on top. After 3 days of emergence, the hypocotyl and radicle lengths of the seedlings were measured to evaluate the biological activity of the samples [38].
Plant Box method (Figure 2): Plants that had been growing for 2 to 3 months in culture cups, with fresh weights ranging from approximately 50 mg to 600 mg, were selected for this experiment. They were transplanted into test boxes containing 0.75% sterilized agar after washing the soil off the roots. After 5 days, the root growth of the lettuce seedlings was measured to assess the allelopathic effects of the plant samples [39].
Adsorption test using activated carbon (Figure 3): Activated carbon has good ability to adsorb allelopathic substance based on previous studies. A flowable activated carbon agent (Dainichiseika Industries Co., Ltd.) was added to the agar medium used in the Sandwich and Plant Box methods at a dilution of 25 times (1:25). The results with and without activated carbon were compared [40].
2.3. Statistical Analysis
Statistical analysis software used: 1. Microsoft Excel 2010 version. 2. T-test: Statistical testing was conducted using IBM SPSS Statistics software.
3. Results
3.1. Bioassay Tests for Assessing the Allelopathic Activity of Platycodon Parts at Different Ages
First assessment (after 60 days): The results revealed that among the various parts of Platycodon, the leaves exhibited the strongest inhibitory effect upon the first assessment. At a concentration of 10 mg/10 mL, the inhibition rates of the lettuce radicals and hypocotyls were 73.9% and 56.2%, respectively. The next-highest inhibitory effect was shown by the root (41.2%, 43.1%) and the lowest by the stem (22.7%, 5.4%), respectively. At a concentration of 50 mg/10 mL, the leaves also caused the highest reduction in radicals and hypocotyls (88.1%, 61.1%), roots (70.9%, 52.6%), and stem (77.2%, 54.2%), respectively.
Second assessment (after 90 days): At a concentration of 10 mg/10 mL, the inhibition percentages, from the highest to the lowest, were as follows: leaves (79.8%, 65.0%), roots (42.6%, 35.9%), and stem (46.8%, 32.4%) in radicals and hypocotyls, respectively. At 50 mg/10 mL, the leaves (92.4%, 34.9%), stem (77.5%, 60.0%), and roots (57.4%, 40.0%) continued to display inhibitory effects. Additionally, during the flowering season of Platycodon, the flower part also demonstrated inhibitory effects, with inhibition rates of 67.4% and 49.0% at 10 mg/10 mL and 81.2% and 59.7% at 50 mg/10 mL. Third assessment (after 150 days): At a concentration of 10 mg/10 mL, the inhibition percentages in radicals and hypocotyls, respectively, were as follows: leaves (84.4%, 64.2%), roots (76.4%, 68.9%), and stem (69.5%, 54.8%). At 50 mg/10 mL, the leaves caused (95.4%, 86.9%), roots (92.3%, 82.6%), and stem (30.5%, 45.3%). Overall, according to the three assessments, at a concentration of 10 mg/10 mL, the average inhibition rates for the leaves and roots were 79.4% and 53.4%, respectively, and at a concentration of 50 mg/10 mL, the average inhibition rates for the leaves and stem were 91.9% and 78.3%, respectively (Table 1).
These results indicate that various parts of Platycodon at different ages possess a significant allelopathic inhibitory effect on the growth and germination of lettuce seedlings. The greatest inhibitory effect was cause by the leaves at different ages. The inhibition rates increased with as the concentration of Platycodon residues increased.
3.2. Effect of Activated Carbon on the Adsorption of Allelopathic Substances from Various Platycodon Components
In this experiment, the activated carbon mixed with agar media at a ratio (1:25) was utilized as part of the Sandwich method to investigate its ability to reduce the negative effect of allelochemicals. The results of the first test (after 90 days) showed inhibitory effects on the growth of lettuce seedling roots and hypocotyls at a concentration of 10 mg/10 mL in the following order: roots (35.7%, 35.1%), leaves (9.7%, 19.1%), and stem (-18.9%, -6.2%). For the stem test, the growth rate of the test plants exceeded that of the control group; thus, it is represented with negative values for statistical purposes. At a concentration of 50 mg/10 mL, inhibitory effects on the growth of lettuce seedlings roots and hypocotyls were observed in the following order: leaves (45.5%, 37.4%), stem (31.5%, 28.5%), and roots (24.5%, 27.2%), respectively.
In the second test (after 150 days), at a concentration of 10 mg/10 mL, the inhibitory effects on the growth of lettuce seedling roots and hypocotyls were observed in the following order: stem (37.1%, 33.5%), roots (19.9%, 16.6%), and leaves (16.8%, 32.3%). On the other hand, at a concentration of 50 mg/10 mL, the inhibitory effects on growth were observed in the following order: roots (61.6%, 49.0%), leaves (56.4%, 54.2%), and stem (28.0%, 34.7%) for radicales and hypocotyls, respectively. The stem’s germination rate was 92.3% at a concentration of 50 mg/10 mL, while that of all other tested areas was 100%.
The average results of the two tests showed that at a concentration of 10 mg/10 mL, the average inhibition rates were 13.3% for the leaves, 27.8% for the roots, and 9.1% for the stem. At a concentration of 50 mg/10 mL, the average inhibition rates were 50.9% for the leaves, 43.0% for the roots, and 29.7% for the stem. Overall, the addition of the activated carbon reagent reduced the allelopathic inhibition rates by various parts of Platycodon (Figure 4, Figure 5 and Figure 6).
The results of the Plant Box method revealed a certain level of allelopathic inhibition in the roots of the test seedlings (Figure 7).
In the first test (after 60 days), Zone 1 exhibited an average inhibition rate of 28.6% in the radicals and 23.9% in the hypocotyls of the tested lettuce seedling. The inhibition rate was higher for the roots closer to the test seedlings and decreased with a higher increase in distance. The germination rate was 90.9%. Zone 2 displayed average inhibition rates of 34.4% in the radicals and 10.4% in the hypocotyls; these also decreased with distance, and there was a germination rate of 100%. Zone 3 showed average inhibition rates of 33.5% in the radicals and 14.9% in the hypocotyls, with a germination rate of 93.9%. Overall, the results from the three test zones indicated that the root secretions of Platycodon had a certain allelopathic inhibitory effect against growth of the tested lettuce plant, with average inhibition rates of 33.1% in radicals and 16.4% in hypocotyls, and an average germination rate of 94.9%.
For the second test (after 90 days), Zone 1 exhibited average inhibition rates of 46.7% in radicals and 21.8% in hypocotyls, with a germination rate of 96.9%. Zone 2 displayed average inhibition rates of 48.3% in radicals and 9.80% in hypocotyls, with a germination rate of 100%. Zone 3 showed average inhibition rates of 41.7% in radicals and 12.4% in hypocotyls, with a germination rate of 100%. This indicated that the root secretions of Platycodon had average inhibitory effects of 45.6% on the radicals and 14.7% on the hypocotyls of lettuce, with an average germination rate of 98.9%.
3.3. Plant Box Method: Allelopathic Activity of Root Secretions from Platycodon
In the third test (after 150 days), Zone 1 exhibited average inhibition rates of 57.7% in radicals and 22.3% in hypocotyls, with a germination rate of 90.9%. Zone 2 displayed average inhibition rates of 55.9% in radicals and 28.6% in hypocotyls, with a germination rate of 87.9%. Zone 3 showed average inhibition rates of 59.6% in radicals and 31.9% in hypocotyls, with a germination rate of 96.9%. Zone 4 exhibited average inhibition rates of 57.7% in radicals and 20.4% in hypocotyls, with a germination rate of 93.9%. The results from these four test zones indicated that the roots of Platycodon had an average inhibitory effect of 57.7% on the roots and 25.8% on the seedlings, with an average germination rate of 92.4% (Table 2).
3.4. Effect of Activated Carbon on the Adsorption of Allelopathic Substances from Platycodon Roots
The results of using the Plant Box method to assess the absorption effect of activated carbon revealed that following the first test (after 90 days), Zone 1 exhibited an average inhibition rate of -34.2% in the radicals and -18.5% in the hypocotyls of the tested lettuce plant. This suggests that the addition of activated carbon significantly eliminated the inhibitory effect of root secretions from Platycodon. This effect promotes the growth of lettuce seedlings, with an average germination rate of 97.9%.
For the second test (after 150 days), Zone 1 displayed average inhibition rates of -10.4% in radicals and 5.13% in hypocotyls, while Zone 2 showed inhibition rates of 23.3% in radicals 8.8% in hypocotyls. Zone 3 exhibited inhibition rates of 3.0% in radicals and 2.0% in hypocotyls, and Zone 4 had inhibition rates of -13.7% in radicals and 3.8% in hypocotyls. The average inhibition rates for radical and hypocotyl growth throughout the four test zones were 0.8% and 9.1%, respectively, with a germination rate of 92.8% (Figure 8).
4. Discussion
4.1. Allelopathic Activity of Various Platycodon Components of Different Ages
In the context of issues with the continuous cropping of plants, the allelopathic substances released by the aboveground parts of plants are some of the main factors contributing to the formation of allelopathic autotoxicity. It has been noticed that with the successive Platycodon cultivation, the yield and quality significantly decreased. Hence, the reason for this issue may be related to the autotoxicity of allelochemical release by this plant. The results of allelopathic tests using various parts of Platycodon showed a strong allelopathic inhibitory effect on the growth of lettuce roots and hypocotyls. This inhibitory effect increased with increasing concentration. For instance, following the first test, the inhibition rate of the roots of lettuce seedlings was 73.9% at a concentration of 10 mg/10 mL, and it increased to 88.1% at a concentration of 50 mg/10 mL. This aligned with previous research findings [41].
As Platycodon has a growth cycle of 2–3 years, fallen leaves and allelopathic substances released by its aboveground parts accumulate in the topsoil layer over the years, potentially affecting the germination rate and growth of the next crop. The results of a previous survey also indicated a decline in the growth and germination rates of Platycodon with the increase in planting years, with the possibility of complete failure after six years of continuous cropping [42]. Therefore, the results suggest that allelopathic substances from various parts of Platycodon accumulate in the topsoil over several years, potentially leading to increasingly severe obstacles to continuous cropping.
Furthermore, the results from the three tests demonstrated that as the growth time was extended, the allelopathic effect of Platycodon was strengthened. For example, at a concentration of 10 mg/10 mL, the rate of inhibition of lettuce growth in the leaf zone increased from 73.9% (first test) to 84.4% (third test). This indicated that as the growth time was extended, the concentration of allelopathic substances released by the plant increased, thus potentially resulting in an elevated concentration of these substances in the planting soil. In a previous study [43], water extracts from a whole Platycodon plant significantly inhibited seed germination, with an increase in the inhibition rate as the extract concentration rose. Therefore, allelopathic substances released by various parts of Platycodon may play a role in the formation of obstacles to continuous cropping. As the number of years of growth of Platycodon increases and obstacles to continuous cropping intensify, it can be inferred that allelopathic autotoxicity caused by the plant’s self-released allelopathic substances may be one of the factors contributing to obstacles to continuous cropping.
4.2. Adsorption Effect of Activated Carbon and Its Impact on the Allelopathic Activity of Various Platycodon Components
In trying to solve problems related to continuous cropping in agriculture, crop rotation is a common method. However, recent studies have focused on mitigating the autotoxicity of the plant itself through methods such as improving soil nutrient composition and adsorbing allelopathic substances. Based on previous research results, this study tested the alleviating effect of activated carbon on continuous cropping obstacles associated with Platycodon.
The results of the Sandwich method with activated carbon added to the culture medium showed that compared to the control group without activated carbon, the addition of activated carbon significantly alleviated the inhibitory effects of various parts of Platycodon on the growth of lettuce seedling roots and hypocotyls. Without activated carbon, at a concentration of 10 mg/10 mL of Platycodon leaves, the average rates of growth inhibition as measured in lettuce seedlings and hypocotyls were 79.4% and 61.8%; those for roots were 53.4% and 49.3%, and those for stems were 51.2% and 45.7%. However, with the addition of activated carbon, the inhibitory effects were significantly reduced. In the presence of activated carbon, the inhibition rates for leaves at a concentration of 10 mg/10 mL were 13.3% and 25.7%, those for roots were 27.8% and 25.8%, and those for stems were 9.07% and 13.6%. Similarly, the inhibition rate at a concentration of 50 mg/10 mL was also significantly reduced. The attenuation of the inhibitory effects with the addition of activated carbon increased with the concentration. This result aligned with the alleviating effect of activated carbon on obstacles to continuous cropping in asparagus and other vegetables observed in other studies [33].
In other studies, activated carbon was proven to exhibit certain alleviating effects on the continuous cropping obstacles for various crops. For asparagus, activated carbon caused reductions in the inhibition rate in the range of 61.5% to 58.7% [36]. Furthermore, activated carbon demonstrated a trend of alleviating inhibitory effects on leguminous crops and other vegetables, thus promoting plant growth [37]. Therefore, the results of this study are consistent with those of previous research, indicating that activated carbon has a certain alleviating effect on obstacles to the continuous cropping of Platycodon., the results of this study are consistent with those of previous research, indicating that activated carbon has a certain alleviating effect on obstacles to the continuous cropping of Platycodon.
4.3. Allelopathic Activity of Root Exudation of Platycodon and its Role as an Obstacle to Continuous Cropping
In the process of plant growth, root secretions play a crucial role in the formation of obstacles to continuous cropping, as they involve interactions with soil microorganisms and soil nutrient components. Therefore, root secretions are essential in processes in which plants trigger allelopathic effects, which lead to obstacles to continuous cropping. Determining the allelopathic effects of root secretions is a key aspect of studying the causes of such obstacles. The results of this study indicate that root secretions of Platycodon had a certain allelopathic inhibitory effect on the growth of lettuce seedlings and hypocotyls, and this inhibitory effect gradually increased with the extension of the growth period. For example, in the results of the three tests, the average rate of root secretions’ inhibition of the growth of lettuce seedlings showed a gradually increasing trend, as it was 33.1% (first test), 45.6% (second test), and 57.7% (third test). As Platycodon has an optimal harvest time of 2–3 years, the secretions released by the roots during the long growth process may have accumulated in the soil, thus affecting the growth and germination rates of the next generation of Platycodon seedlings. Additionally, the allelopathic inhibitory effect of root secretions increased with the concentration, indicating that the concentration of allelopathic substances accumulated in the soil may affect the growth and development of the next generation of seedlings.
An analysis of Platycodon root secretions revealed the presence of various bioactive substances, such as Platycodon saponin [2]. The secretion of these bioactive substances into the soil may affect the growth and germination of other plants or even Platycodon itself. Therefore, in future research, identifying the components of root secretions and conducting assessments of allelopathic effects will be crucial in unraveling the causes of obstacles to the continuous cropping of Platycodon. The preliminary results of this study confirm that the root secretions of Platycodon have a certain allelopathic inhibitory effect.
4.4. Adsorption Effect of Activated Carbon on the Root Secretion Allelopathy of Platycodon
In an experiment evaluating the allelopathic inhibitory effects of root secretions, the results after adding activated carbon revealed a significant alleviation in the inhibition of the roots and height of lettuce seedlings. For instance, without adding activated carbon, the average rates of inhibiting the radicals and hypocotyl length of lettuce were 35.5% and 18.9%, respectively. However, with the addition of activated carbon, the average inhibition rates were -23.9% and -4.7%, indicating not only the successful elimination of the inhibitory effect, but also promotion of the growth of the tested plants. Previous research showed that activated carbon had a strong adsorption effect [40], so the reduction in allelopathic inhibitory effects may be attributed to the adsorption of allelopathic substances by activated carbon. In this test, the addition of activated carbon led to growth rates surpassing those of the control group, suggesting that activated carbon not only adsorbed allelopathic substances, but also had a certain growth-promoting effect. Therefore, activated carbon has the potential to be a material for alleviating the obstacles to continuous cropping associated with Platycodon. This finding provides robust support for future research to further explore the mechanisms by which activated carbon alleviates obstacles to continuous cropping in plants and its prospects for practical applications in agricultural production. Authors should discuss the results and how they can be interpreted from the perspective of previous studies and the working hypotheses. The findings and their implications should be discussed in the broadest context possible. Future research directions may also be highlighted.
The results of the experiment in the laboratory revealed that the addition of activated carbon, diluted at a concentration of 1:25, significantly alleviated the allelopathy inhibition effect of Platycodon. In future studies, field experiments will be conducted to explore the optimal concentration in the field and investigate methods for application in Platycodon cultivation. As discussed earlier, activated carbon has been known to have mitigating effects on crop rotation disorders in vegetables such as asparagus and cucumber. There are also reports suggesting its effectiveness in alleviating crop rotation disorders in leguminous crops. Based on the results of these previous studies and the findings from our current experimental research, activated carbon seems to be a promising material for addressing the crop rotation issues associated with Platycodon.
5. Conclusions
This study analyzed the causes of obstacles to continuous cropping from the perspective of allelopathic effects, and tested the mitigating effects of activated carbon reagents on obstacles to continuous cropping in Platycodon. It provided scientific evidence for research related to alleviating continuous cropping obstacles in Platycodon. The use of materials such as activated carbon to mitigate autotoxicity in the cultivation process of Platycodon offers a new solution to alleviate continuous cropping obstacles, thereby enhancing productivity and facilitating the development of the Platycodon industry. The next step involves conducting combined laboratory and field tests to verify the optimal concentration of activated carbon reagents for mitigating continuous cropping obstacles in Platycodon. This research aimed to provide farmers with the best cultivation techniques and strategies.
Author Contributions
Author contributions: Conceptualization, L.B., Y.F., S.M.; Methodology, Y.F., S.M.; Software, X.Z., G.K.; Validation, L.B., Y.F., K.S.; Formal analysis, L.B., X.Z., G.K.; Investigation, S.M., Y.F.; Data management, L.B., S.M., Y.F.; Preparation of draft, L.B., T.I.; Writing—review and editing, L.B., S.M., Y.F., K.S.; Visualization, T.I., X.Z.; Supervision, Y.F., S.M.; Funding acquisition, S.M. All authors have read and approved the published version of the manuscript.
Funding
Inner Mongolia Autonomous Region University Scientific Research Project (project number: NJZY22173); Inner Mongolia Open University Scientific Research Project (project number: IMOU-GSR2108).
Acknowledgments
I would like to thank the students at the Vegetable Horticulture Laboratory of Meiji University, Japan, for their help during my research.
Conflicts of Interest
The authors declare no conflicts of interest.
References
- "Flora of China" Volume 73 (2) (1983), P. 077.
- Saeki,T. ; Nikaido, T. Evaluations of saponin properties of HPLC analysis of Platycodon grandiforum. J. Pharm. Sci. 2003, 123, 431–441. [Google Scholar] [CrossRef]
- Wei, J.H.; Tu, P.F.; Li, G.; Wang, W.Q.; Wang, W.Q.; Yang, C.M.; Sui, C. Situation and Trends in Development of Chinese Medicinal Agriculture in China. Mod. Chin. Med. 2015, 17, 94–104. [Google Scholar]
- Yong- sook, K. Effects of Platycodon grandiflorum Feeding on Serum and liver Lipid Concentrations in Rats with Diet-induced Hyperlipidemia. J. Nutr Sci Vitaminol 1995, 41, 489–491. [Google Scholar] [CrossRef]
- Wei, S.Z. Comprehensive development and utilization of platycodon resources. J. Shaanxi Univ. Sci. Technol. 2005, 23, 146–148. [Google Scholar]
- Li, G.Q.; Bi, Y.W.; Chen,B. F.; Zhang, J.; Han, J.L.; Wang, Z.F. Research Advancesin Cultivationof Medicinal Plant Platycodon grandiflorum. J. Agric. 2016, 6, 55–59. [Google Scholar]
- Zhang, Z.Y.; Lin, W.X. The allelopathic autotoxicity and consecutive cropping obstacles of medicinal plants. J. Chin. Ecol. Agric. 2009, 17, 189–196. [Google Scholar] [CrossRef]
- Zhang, Z.L.; Wang, W.Q. The formation mechanism and prevention of continuous cropping obstacles of medicinal plants. China Agric. Sci. Technol. Her. 2009, 11, 19–23. [Google Scholar]
- Sun, M.; Ye, L.Q.; Zhang, Z.L. Research progress on the causes and control of continuous cropping disorders of Panax Notoginseng. J. Mt. Agric. Biol. 2015, 34, 63–67. [Google Scholar]
- Zhu, L.X.; Huo, X.H.; Sun, H.X.; Bi, S.; Ma, W.W. Effects of continuous Platycodon grandiflorus cultivation on soil physical-chemical and biological properties. China J. Soil Water Conserv. 2013, 27, 177–181. [Google Scholar]
- Zhu, L.X.; Wang, J.H. Effects of controlled-release fertilizers on campanulaceae growth. China J. Appl. Ecol. 2010, 21, 2304. [Google Scholar]
- Bao, L.; Bai, M.R.; A, D.Q.; Fujii, Y. Screening of allelopathic activity of plants growing in the desert area of Inner Mongolia Autonomous Region and discovery of Sea Buckthorn and Sweet annie as highly active plants and estimation of their active substances. Jpn. J. Arid Land Stud. 2019, 29, 1–10. [Google Scholar]
- Molisch, H. Der einfluss einer pflanze auf die andere-allelopathie. Fischer 1937. [Google Scholar]
- Tukey, H.B., Jr. Implicattions of allelopathy in agricultural plant science. Bot. Rev. 1969, 35, 1–16. [Google Scholar] [CrossRef]
- Vives-peris, V.; De Ollas, C.; Gomez-cadenas, A.; Pérez-Clemente, R. M. Root exudates: from plant to rhizosphere and beyond. Plant Cell Reports 2020, 39, 3–17. [Google Scholar] [CrossRef] [PubMed]
- Wu, L.K.; Lin, X.M.; Lin, W.X. Advances and perspective in research on plant-soil-microbe interactions mediated by root exudates. Chin. J. Plant Ecol. 2014, 38, 298–310. [Google Scholar]
- Wu, H.M.; Lin, W.X. A commentary and development perspective on consecutive monoculture problems of medicinal plants. China J. Eco-Agric. 2020, 28, 775–793. [Google Scholar] [CrossRef]
- Zang, A.H.; Gao, Y.; Xu, Y. Research progress on allelopathic effects of medicinal plants in China. China J. Chin. Herb. Med. 2011, 42, 1885–1890. [Google Scholar]
- Wang, R.; Dong, L.L.; Xu, J.; Chen, J.W.; Li, X.W.; Chen, S.L. Progress in improving continuous monoculture cropping issues in Panax ginseng by controlling soil-borne diseases. China J. Chin. Mater. Medica 2016, 41, 3890–3896. [Google Scholar]
- An, Y.; Yang, D.; Li, X.; Jin, X.J. Study on the effect and physiological mechanism of continuous cropping obstruction of Pinellia ternata. Acta Agric. Borealioccidentalis Sin. 2018, 27, 1017–1022. [Google Scholar]
- Dai, L.; Singh, S.K.; Gong, H.; Tang, Y.; Peng, Z.; Zhang, J.; Wu, D.; Zhang, H.; He, D. Rhizospheric microbial consortium of Lilium lancifolium Thunb. causes lily root rot under continuous cropping system. Front. Microbiol. 2022, 13, 981615. [Google Scholar] [CrossRef]
- Gu, L.; Niu, M.M.; Zheng, H.Y.; Wang, J.M.; Wu, L.K.; Li, Z.F.; Zhang, Z.Y. Effect of continuous cropping of Rehmannia on its morphological and physiological characteristics. J. Chin. Med. Mater. 2013, 36, 691–695. [Google Scholar]
- Tan, Y.; Cui, Y.; Li, H.; Kuang, A.; Li, X.; Wei, Y.; Ji, X. Rhizospheric soil and root endogenous fungal diversity and composition in response to continuous Panax notoginseng cropping practices. Microbiol. Res. 2017, 194, 10–19. [Google Scholar] [CrossRef] [PubMed]
- Liu, H.; Niu, M.; Zhu, S.; Zhang, F.; Liu, Q.; Liu, Y.; Liu, R.H.; Zhang, Y.P. Effect study of continuous monoculture on the quality of Salvia miltiorrhiza Bge roots. BioMed Res. Int. 2020, 4284385. [Google Scholar] [CrossRef] [PubMed]
- Wu, H.; Wu, L.; Zhu, Q.; Wang, J.; Qin, X.; Xu, J.; Kong, L.; Chen, J.; Lin, S.; Umar, K.M.; Amjad, H.; Lin, W.X. The role of organic acids on microbial deterioration in the Radix pseudostellariae rhizosphere under continuous monoculture regimes. Sci. Rep. 2017, 7, 3497. [Google Scholar] [CrossRef] [PubMed]
- Zhang, J.; Fan, S.; Qin, J.; Dai, J.; Zhao, F.; Gao, L.; Lian, X.; Shang, W.; Xu, X.; Hu, X. Changes in the microbiome in the soil of an American ginseng continuous plantation. Front. Plant Sci. 2020, 11, 572199. [Google Scholar] [CrossRef] [PubMed]
- Nishio, M. The current situation and causes of continuous cropping disorders. Jpn. J. Chem. Biol. 1985, 23, 582–589. [Google Scholar]
- Zhang, Y.Y.; Zhu, D.W.; Wang, X.; Zhang, L.Z.; Shi, G.Y.; Zhou, J.; Liu, W. Properties of plant root exudates and obstacles for continuous cropping of medicinal plants. China J. Hubei Agric. Sci. 2014, 53, 1441–1444. [Google Scholar]
- Qu, Y.T.; Zhang, Q.Q.; Yu, Y.F.; Duyxanale, S.; Cai, L.L.; Zhang, S.J.; Li, Y.F.; Li, Y.C. Research advances on mechanisms and preventions of the medicinal plants’ continuous cropping obstacles from the perspective of rhizosphere microecology. J. Zhejiang Univ. (Agric. Life Sci.) 2022, 48, 403–414. [Google Scholar]
- Huang, Y.F.; Zhang, E.H.; Zhang, X.H.; Wang, H.Z.; Wang, Q.; Liu, Q.L.; Cui, J.J.; Xu, S.R. Autotoxicity of water extracts from continuous cropping soil of Lilium davidii var. unicolor Salisb. J. Northwest A&F Univ. (Nat. Sci. Ed. ) 2020, 48, 84–93. [Google Scholar] [CrossRef]
- Liu, R.X.; Li, S.B.; Zhang, R.E.; Nie, C.P.; Li, Y.Y. Allelopathic effects of Platycodon aqueous extract on wheat seedlings. China J. Biol. 2014, 31, 28–32. [Google Scholar]
- Gao, Z.R.; Zang, G.P.; Su, C.C.; Wang, Z.L.; Shi, Z.G.; Gong, Y.F.; Wei, Y.J. Research progress on the formation mechanism and mitigation measures of continuous cropping obstacles in medicinal plants. China J. Anhui Agric. Sci. 2023, 51, 21–25. [Google Scholar] [CrossRef]
- Nishihara, E.; Motoki, S. Agricultural use of activated carbon - New technology for soil purification, Nature and Science and Technology Series. Japan Rural Culture Association, 09, 10-11. 20 March.
- Asao, T.; Hasegawa, Y.; Sueda, K.; Tomita, K.; Taniguchi, T. Autotoxicity of root exudates from taro. Jpn. J. Sci. Hortic. 2003, 97, 389–396. [Google Scholar] [CrossRef]
- Asao, T.; Ohba, T.; Tomita, K.; Ota, K.; Hosoki, T. Effects of adding activated carbon to culture media with different dissolved oxygen concentrations for hydroponically grown cucumbers on plant growth and the number of harvested fruits. Jpn. J. Hortic. Soc. 1999, 68, 1194–1196. [Google Scholar] [CrossRef]
- Motoki, S.; Nishihara, E.; Kitazawa, H.; Kyutoku, Y.; Uehara, T.; Yagasaki, K.; Sakai, H.; Shigemori, I. Effects of the application of activated carbon on soybean growth and yield in continuous legume fields. Jpn. J. Crop Sci. Soc. 2012, 81, 77–82. [Google Scholar] [CrossRef]
- Nishihara, E.; Takahashi, S.; Hirata, T.; Nakano, T. Utilization of activated carbon for allelopathy avoidance technology in fava beans. Kindergart. Sch. Misc. 2006, 75, 569. [Google Scholar]
- Fujii, Y. Establishment of an allelopathy assay method and the function of the active substance L-DOPA contained in Mucuna. Jpn. Agric. Environ. Res. Inst. Rep. 1994, 10, 115–218. [Google Scholar]
- Fujii, Y.; Shibuya, T. Establishment of an activity evaluation method specific to allelopathy - Search for candidate plants by a mixed planting test in agar medium using a plant box. Jpn. Journa Weed Res. 1992, 37, 156–157. [Google Scholar]
- Motoki, S.; Nishihara, E.; Takahashi, N.; Limbers, H.; Shinohara, Y. Effects of astivated carbon to reduce allelopathy during raising the seedling stage. Jpn. J. Hortic. Res. 2007, 6, 603–609. [Google Scholar] [CrossRef]
- Zhai, Z.G. Yellow pines become green, chestnut production increases, etc. Research progress on plant root exudates. Jiangxi J. Agric. 2012, 24, 28–32. [Google Scholar]
- Zhu, L.X.; Bi, S.; Liu, Y. Preliminary study on the autotoxicity of Platycodon grandiflorum. China J. Lishizhen Med. Med. Res. 2013, 24, 1992–1994. [Google Scholar]
- Wang, Y.P.; Wang, H.T. Allelopathic substances secreted by plant roots and their environment in soil Behavior. J. Soil Bull. 2010, 41, 502–507. [Google Scholar]
Figure 1.
Schematic diagram of Sandwich Method.
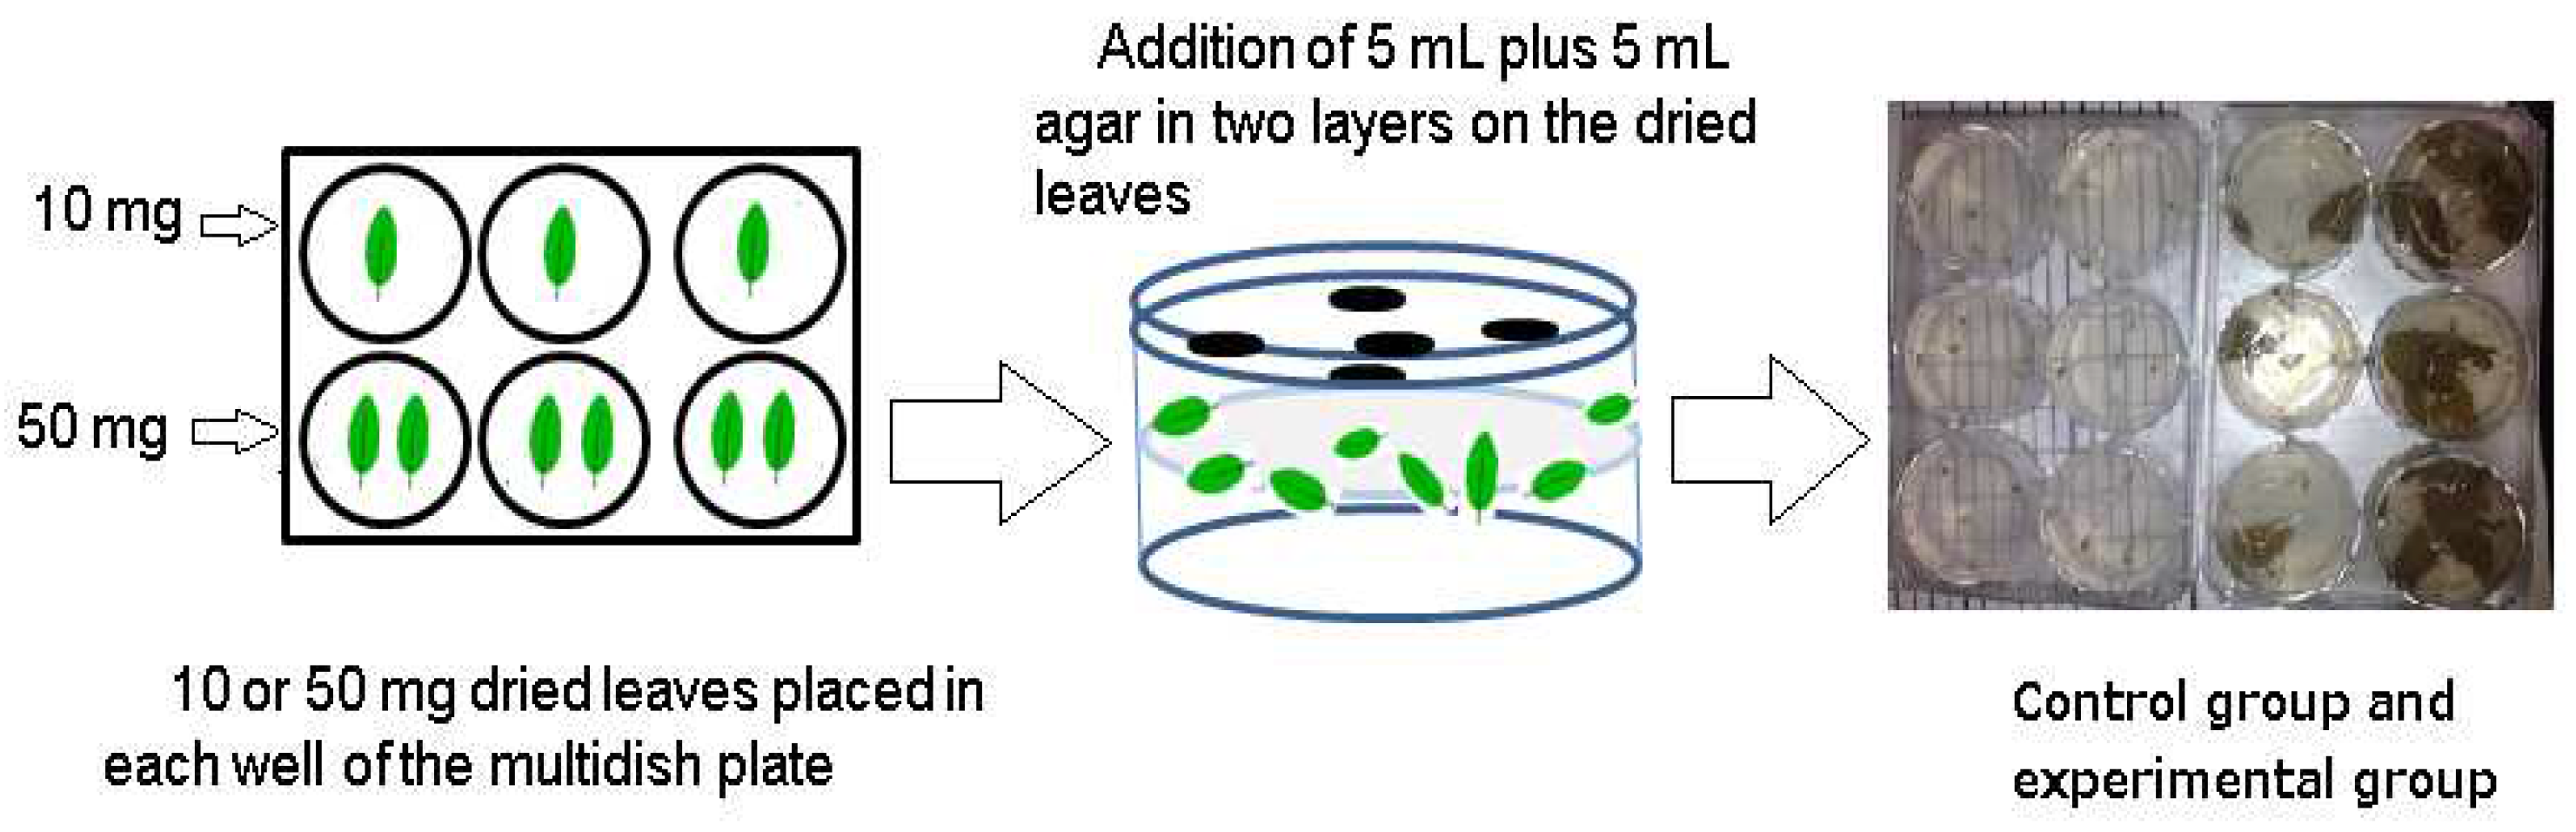
Figure 2.
Schematic diagram of the Plant Box method.
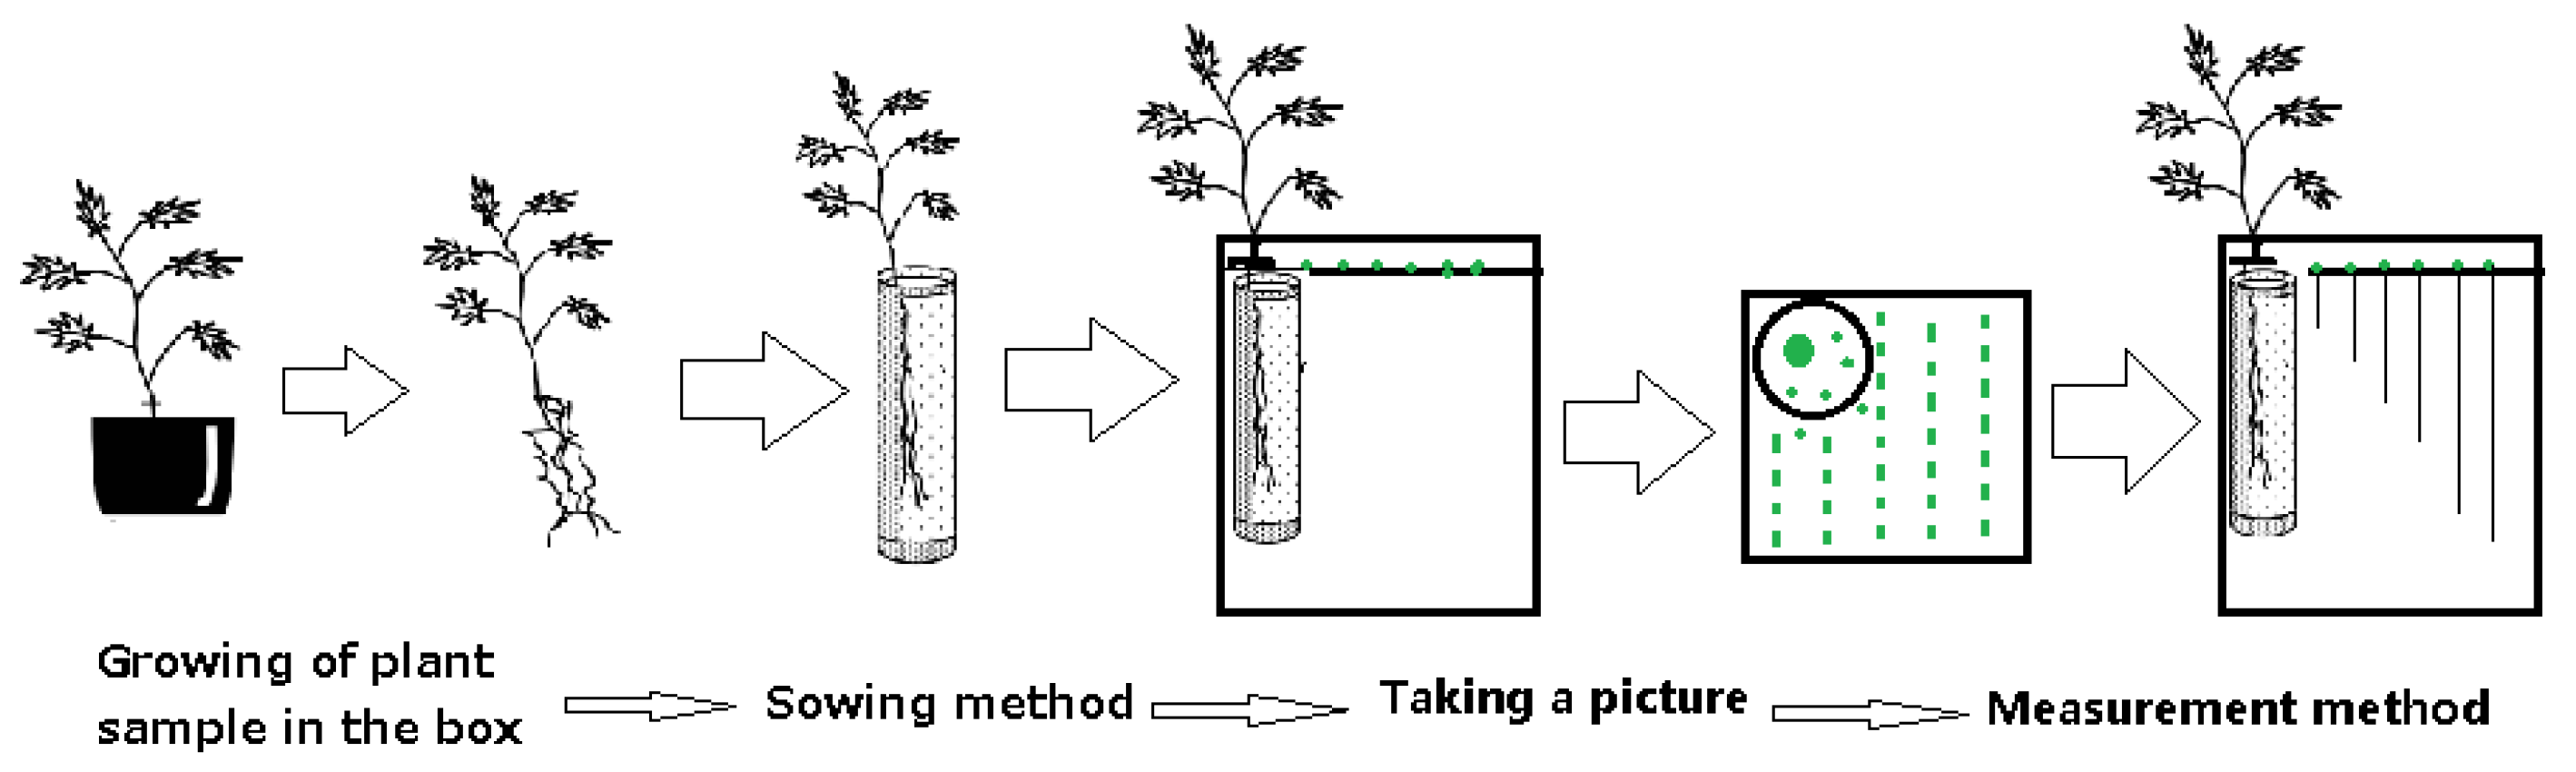
Figure 3.
Model of Activated carbon adsorbing substances.
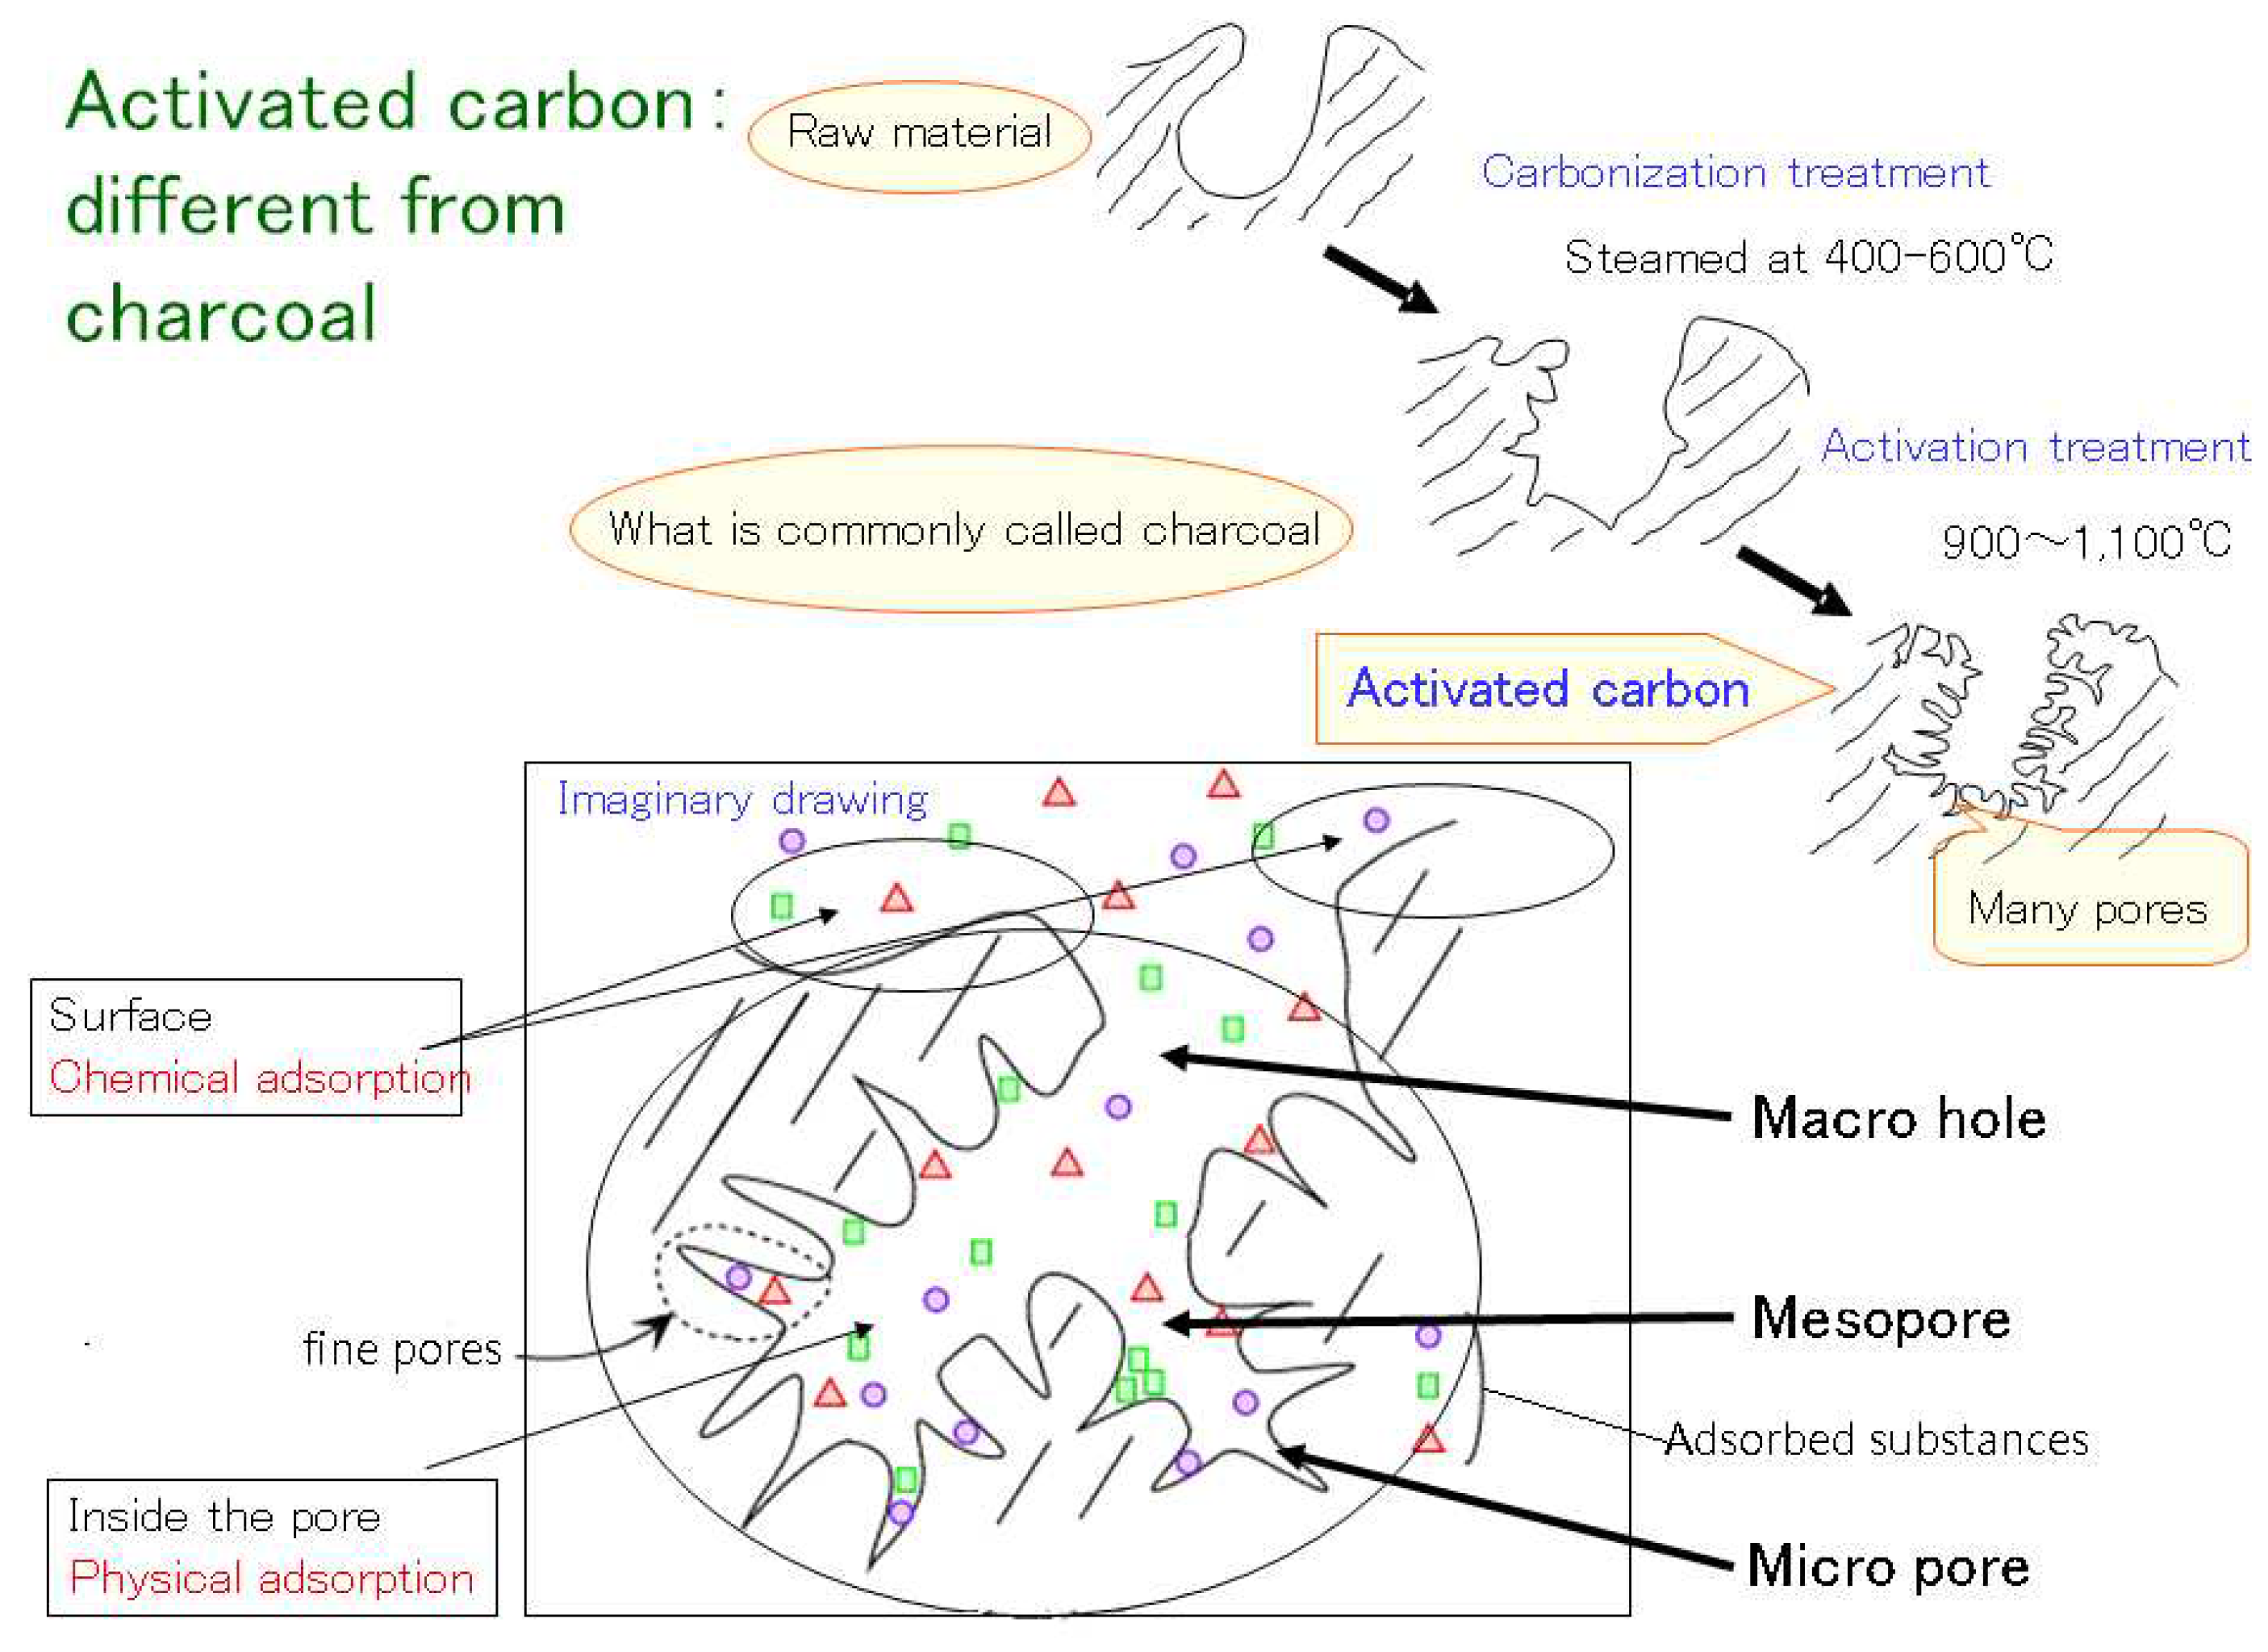
Figure 4.
Sandwich method for the determination of the allelopathic effects of Platycodon leaves. “A” indicates the results of the trial with activated charcoal; results lacking identification represent the trial without the addition of activated charcoal. At a concentration of 10 mg/10 mL, the difference between the results of the non-added and added activated carbon test areas was 2.1%, and this was a significant difference (<5.0%). Bars indicate SD, T-test: R (10) =P<0.001, H (10) =P<0.001, H (50) =P<0.001 significant difference, R (50) =P<0.005 differences.
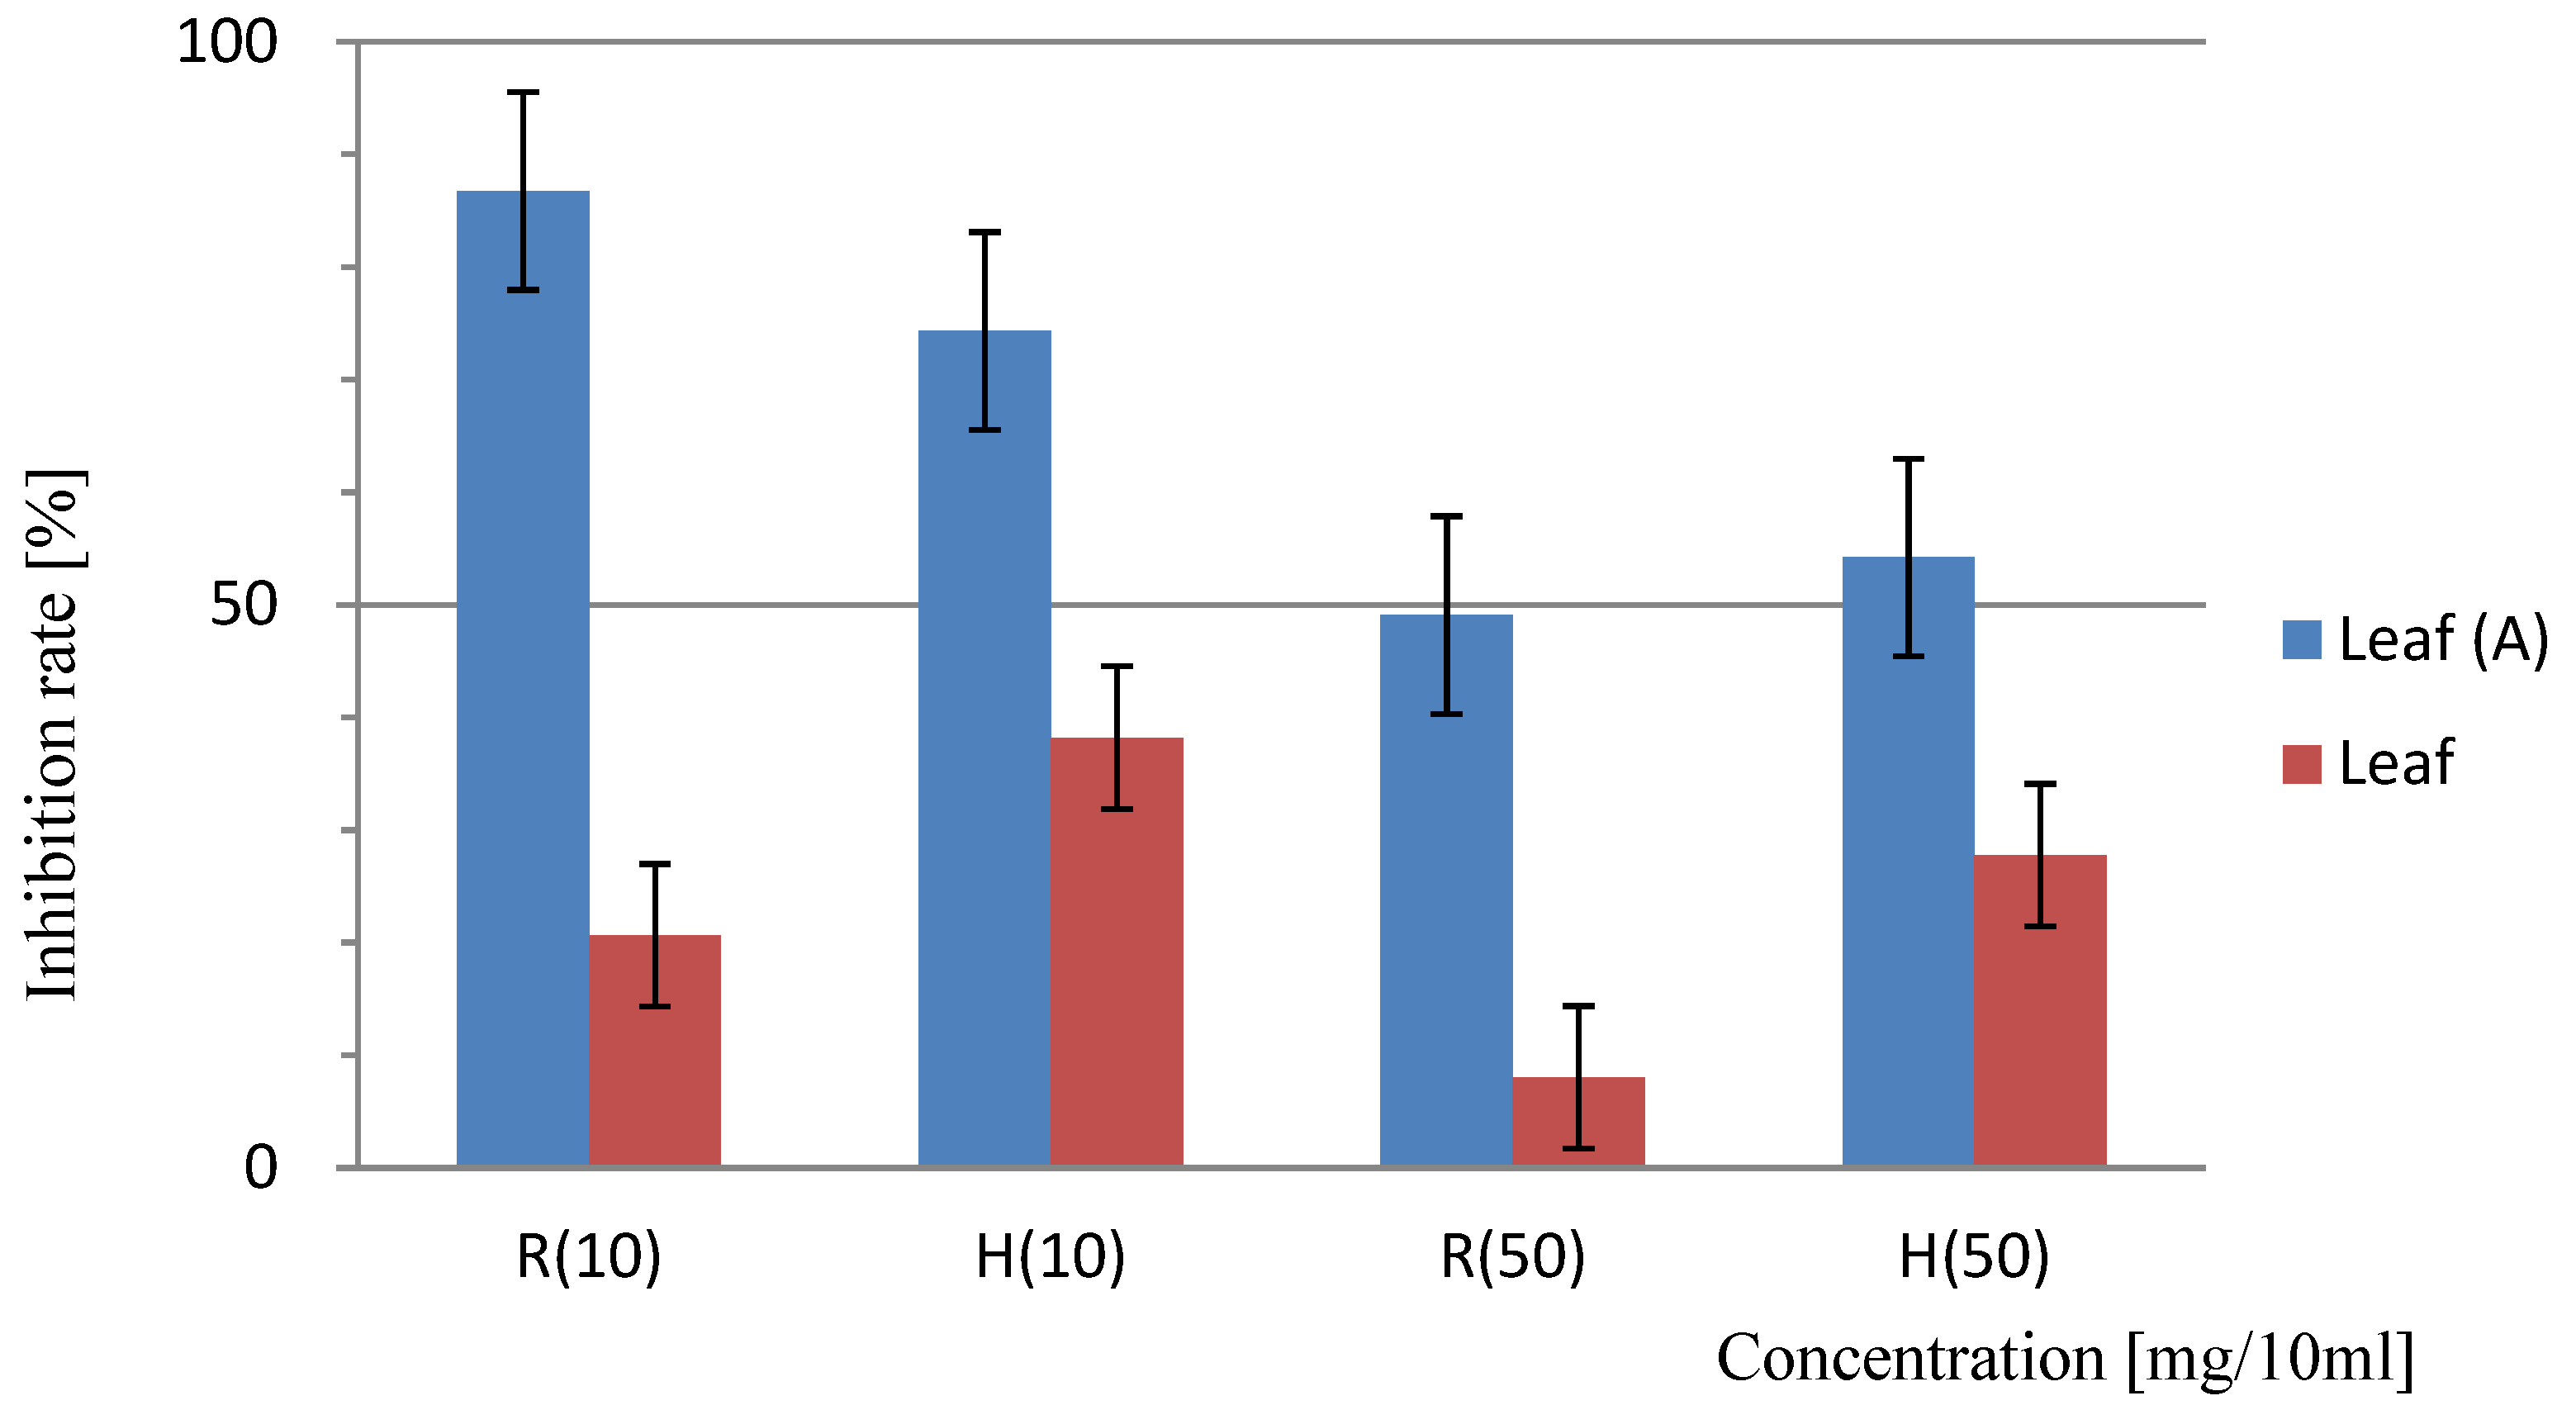
Figure 5.
Sandwich method for the determination of the allelopathic effects of Platycodon roots. “A” indicates the results of the trial with activated charcoal; results lacking identification represent the trial without the addition of activated charcoal. At a concentration of 10 mg/10 mL, the difference between the results of the non-added and added activated carbon test areas was 0.4%, and this was a significant difference (<5.0% ). Bars indicate SD, T-test: R (10) =P<0.001, H (10) =P<0.001, R (50) =P<0.001 H (50) =P<0.001 significant difference.
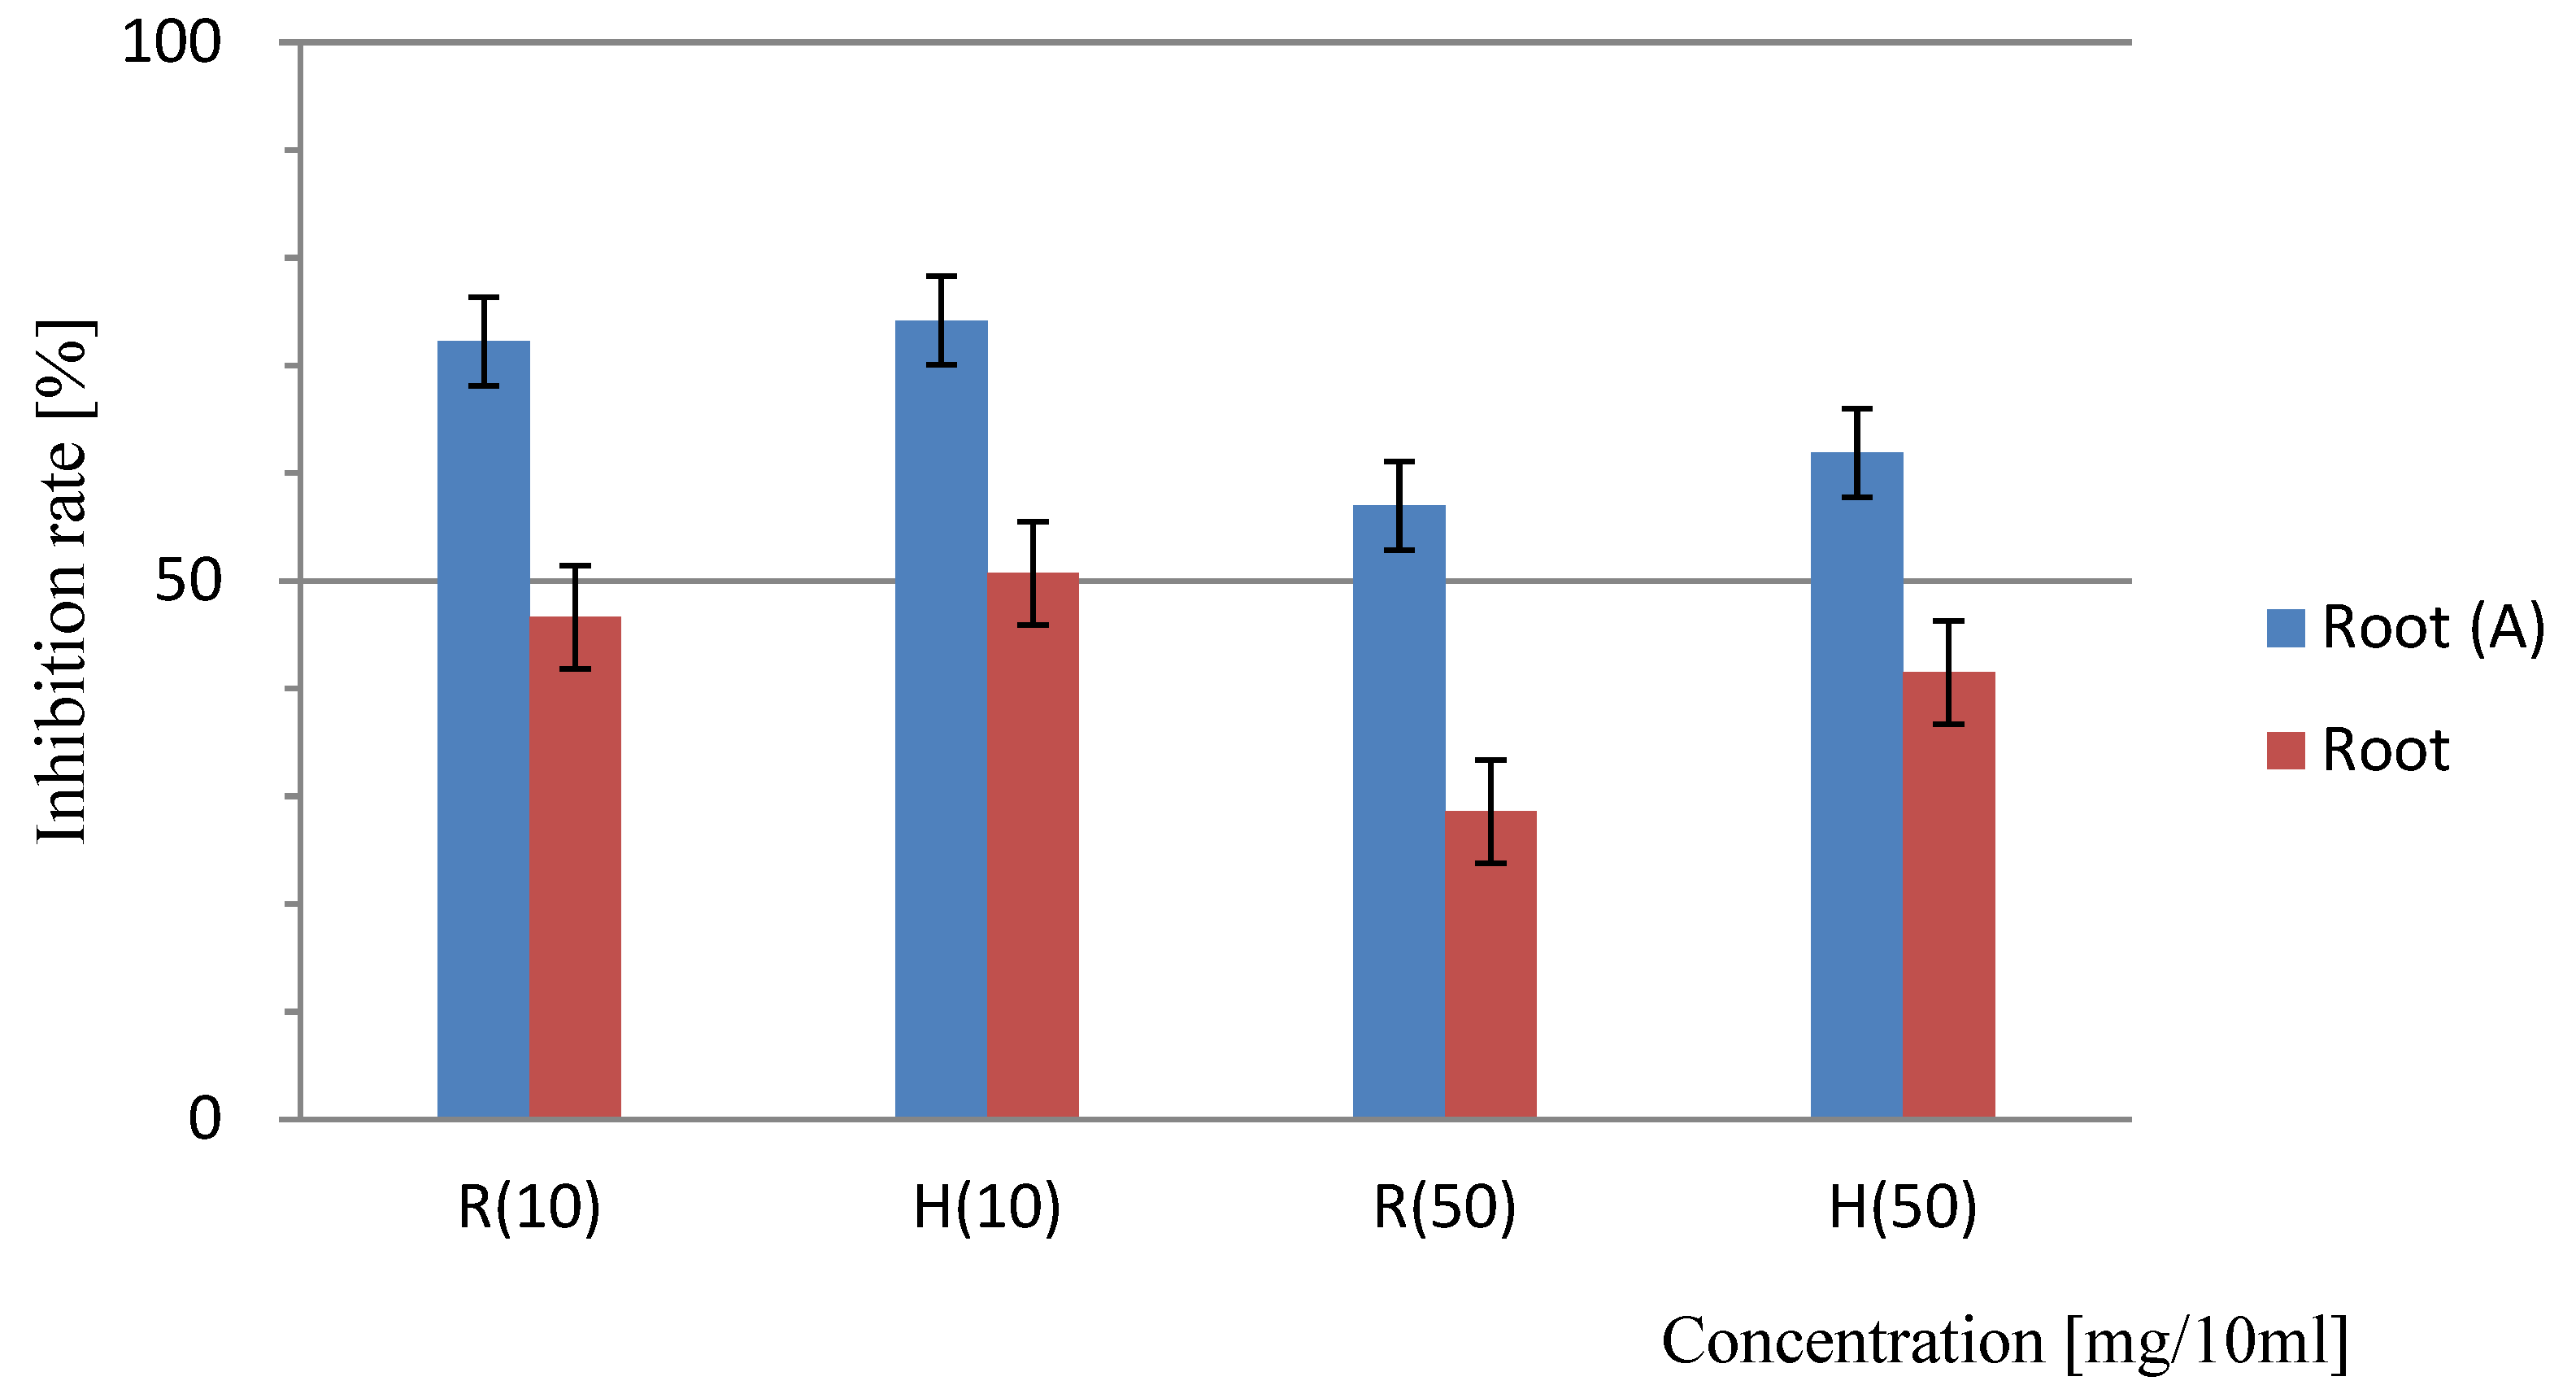
Figure 6.
Sandwich method for the determination of the allelopathic effects of Platycodon stems. “A” indicates the results of the trial with activated charcoal; results lacking identification represent the trial without the addition of activated charcoal. At a concentration of 10 mg/10 mL, the difference between the results of the non-added and added activated carbon test areas was 0.5%, and this was a significant difference (<5.0%). Bars indicate the SD, T-test: R (10) =P<0.001, H (10) =P<0.001, R (50) =P<0.001 H (50) =P<0.001 significant difference.
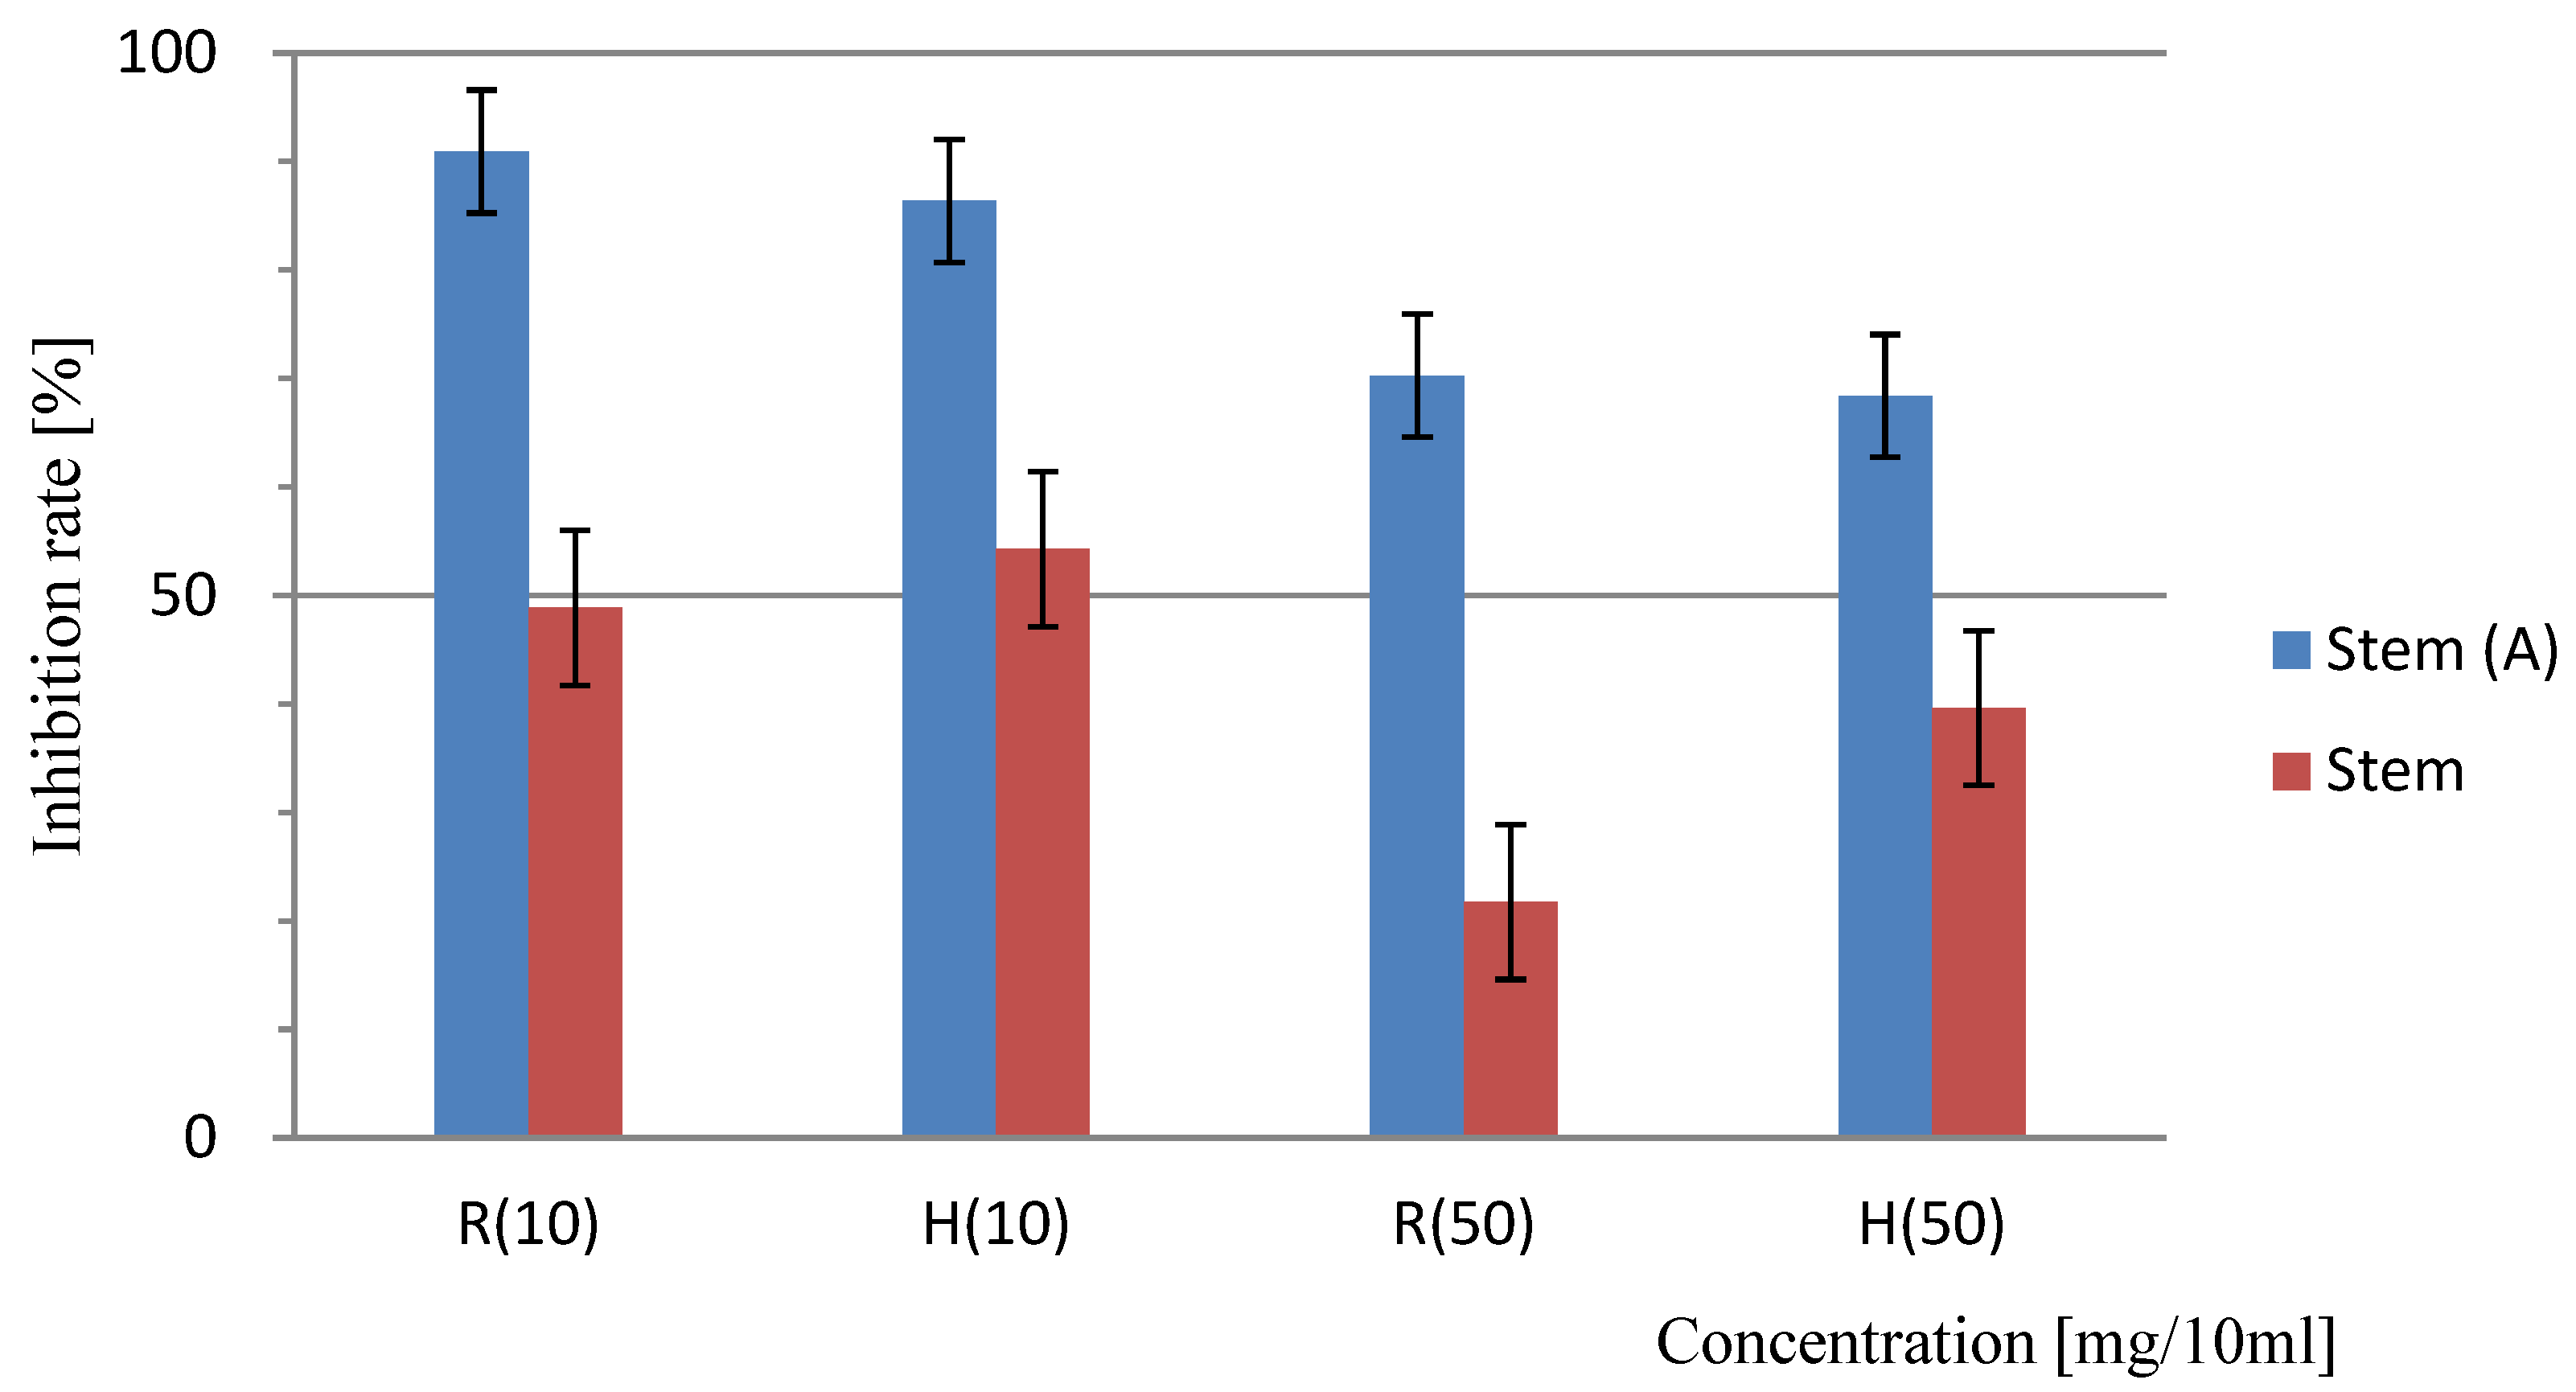
Figure 7.
Results of the allelopathic effects of the root secretions of Platycodon. Control: [r = 0.40; y = 0.17 x + 39.6; n = 29]; root elongation = 100%, Nothing added: [r = 0.82; y = 0.53x + 15.9; n =32]; root elongation = 40.4%, Activated carbon: [r =0.66; y = 0.18x +38.4; n =30]; root elongation =97.0%.
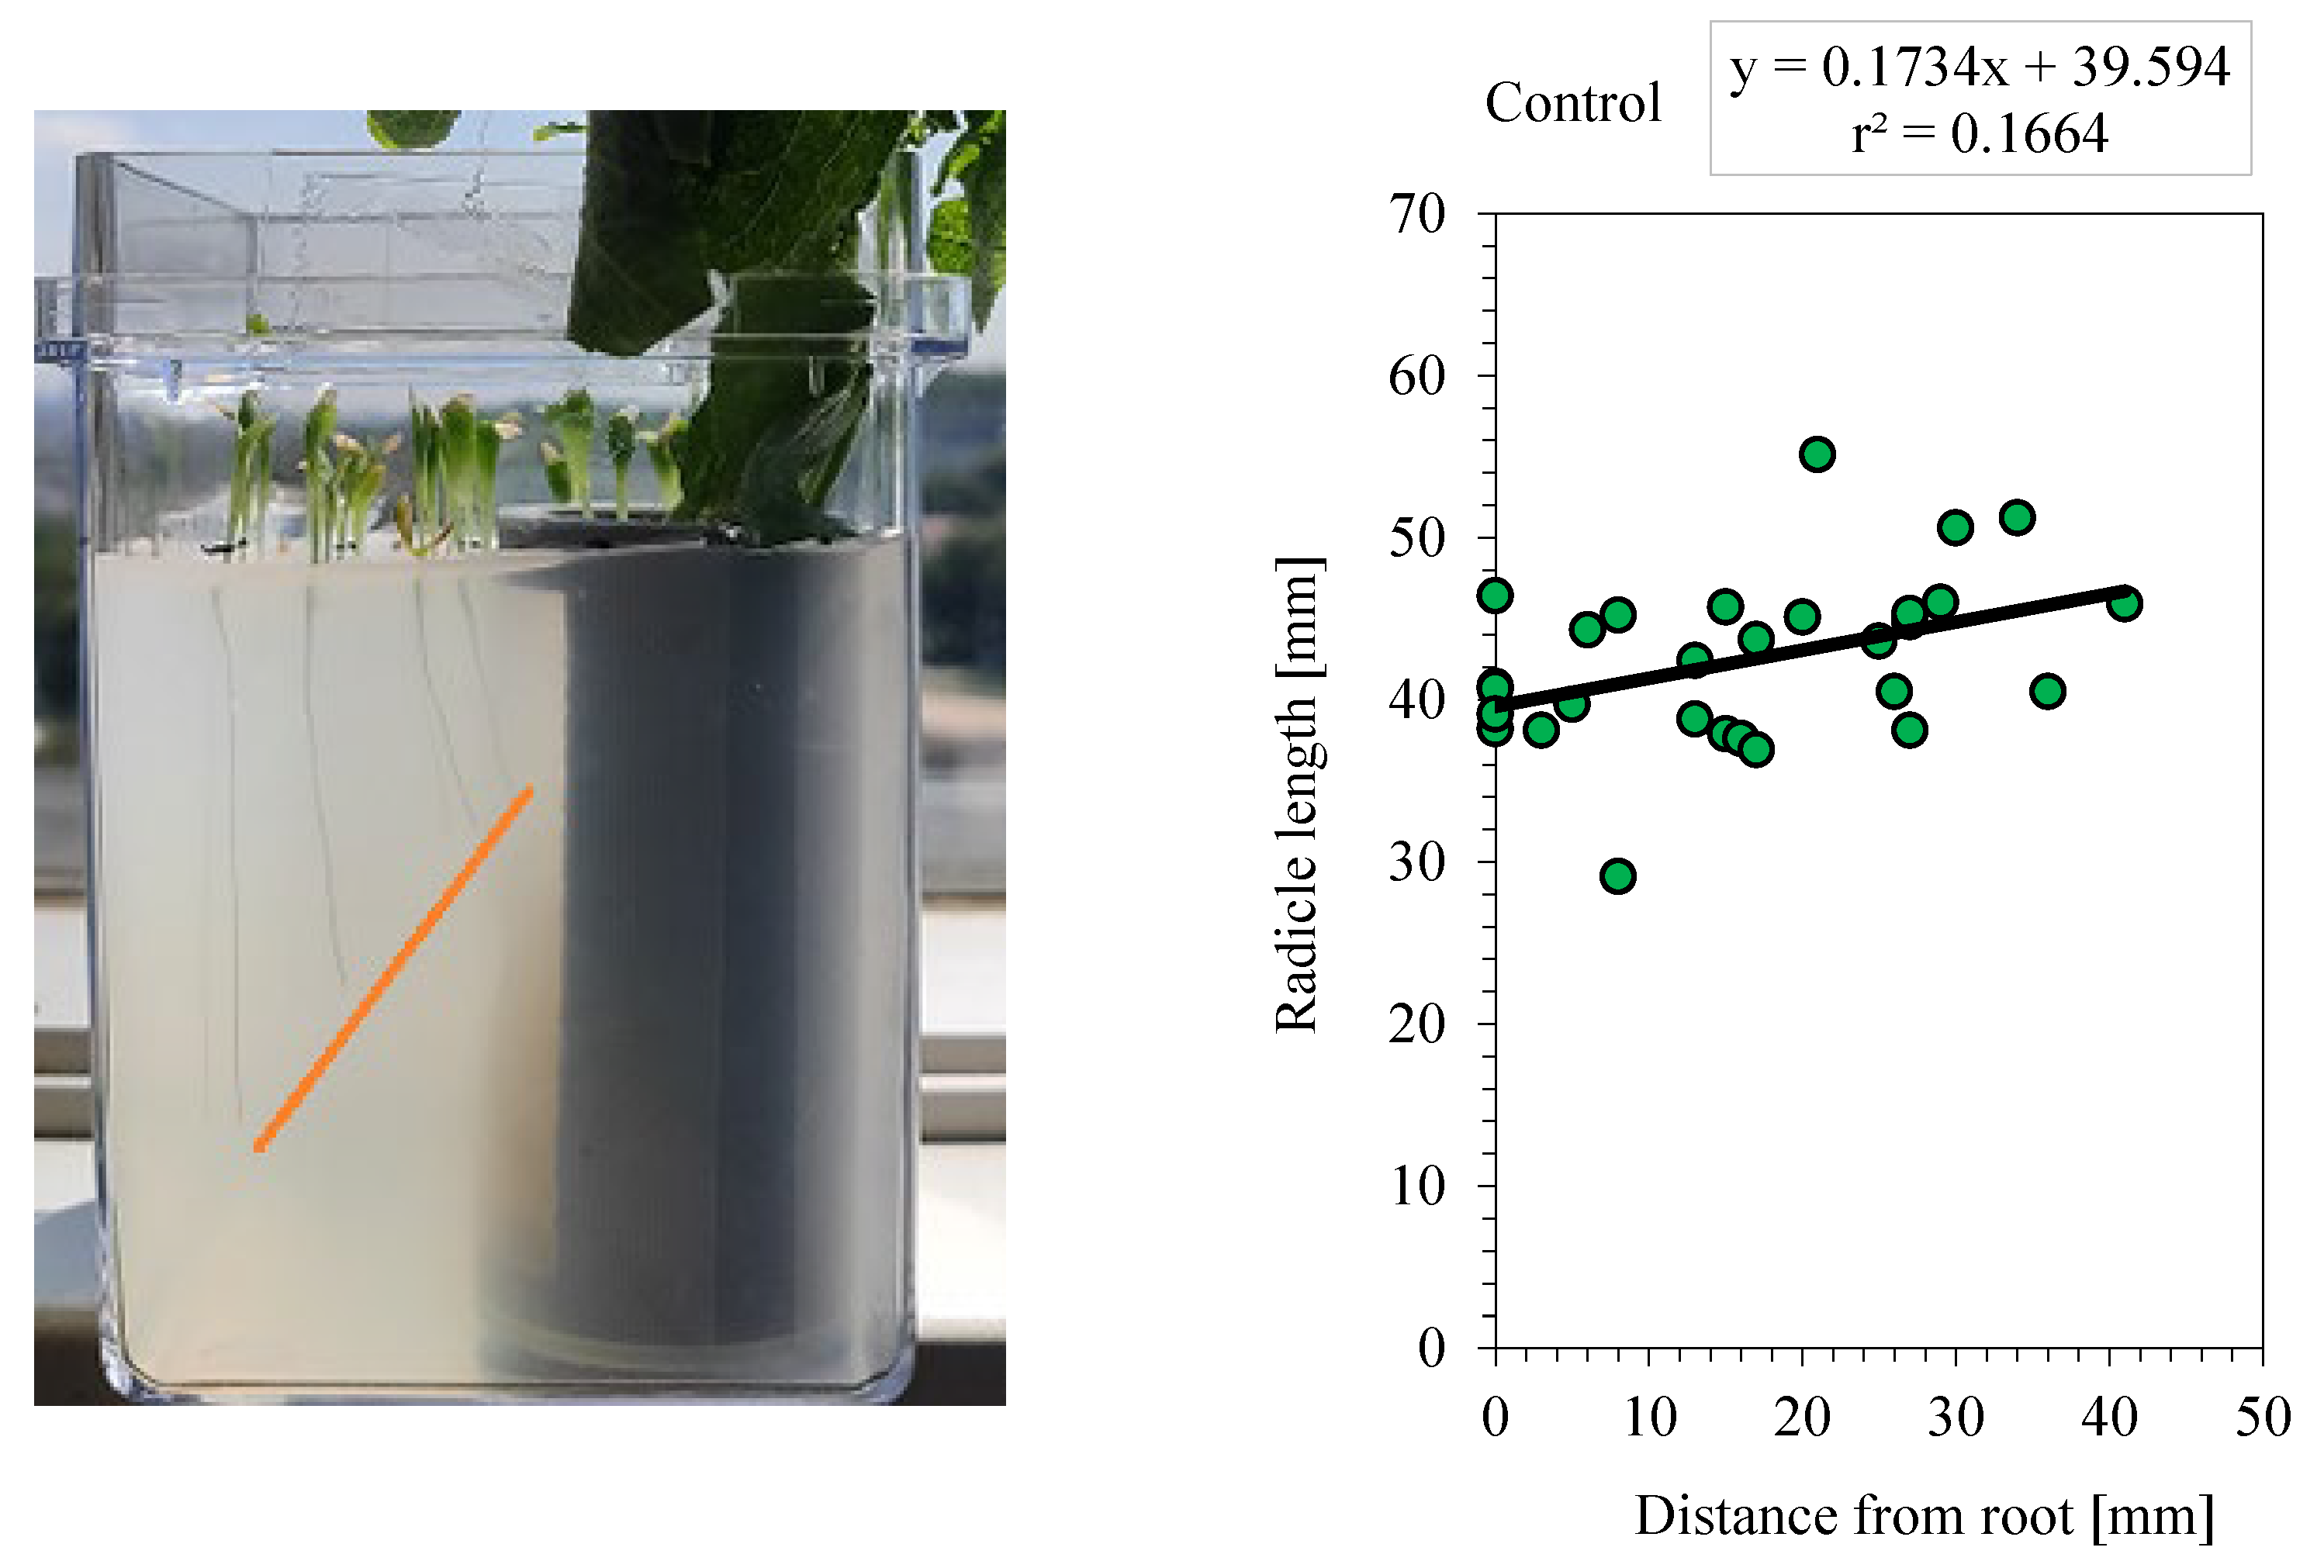
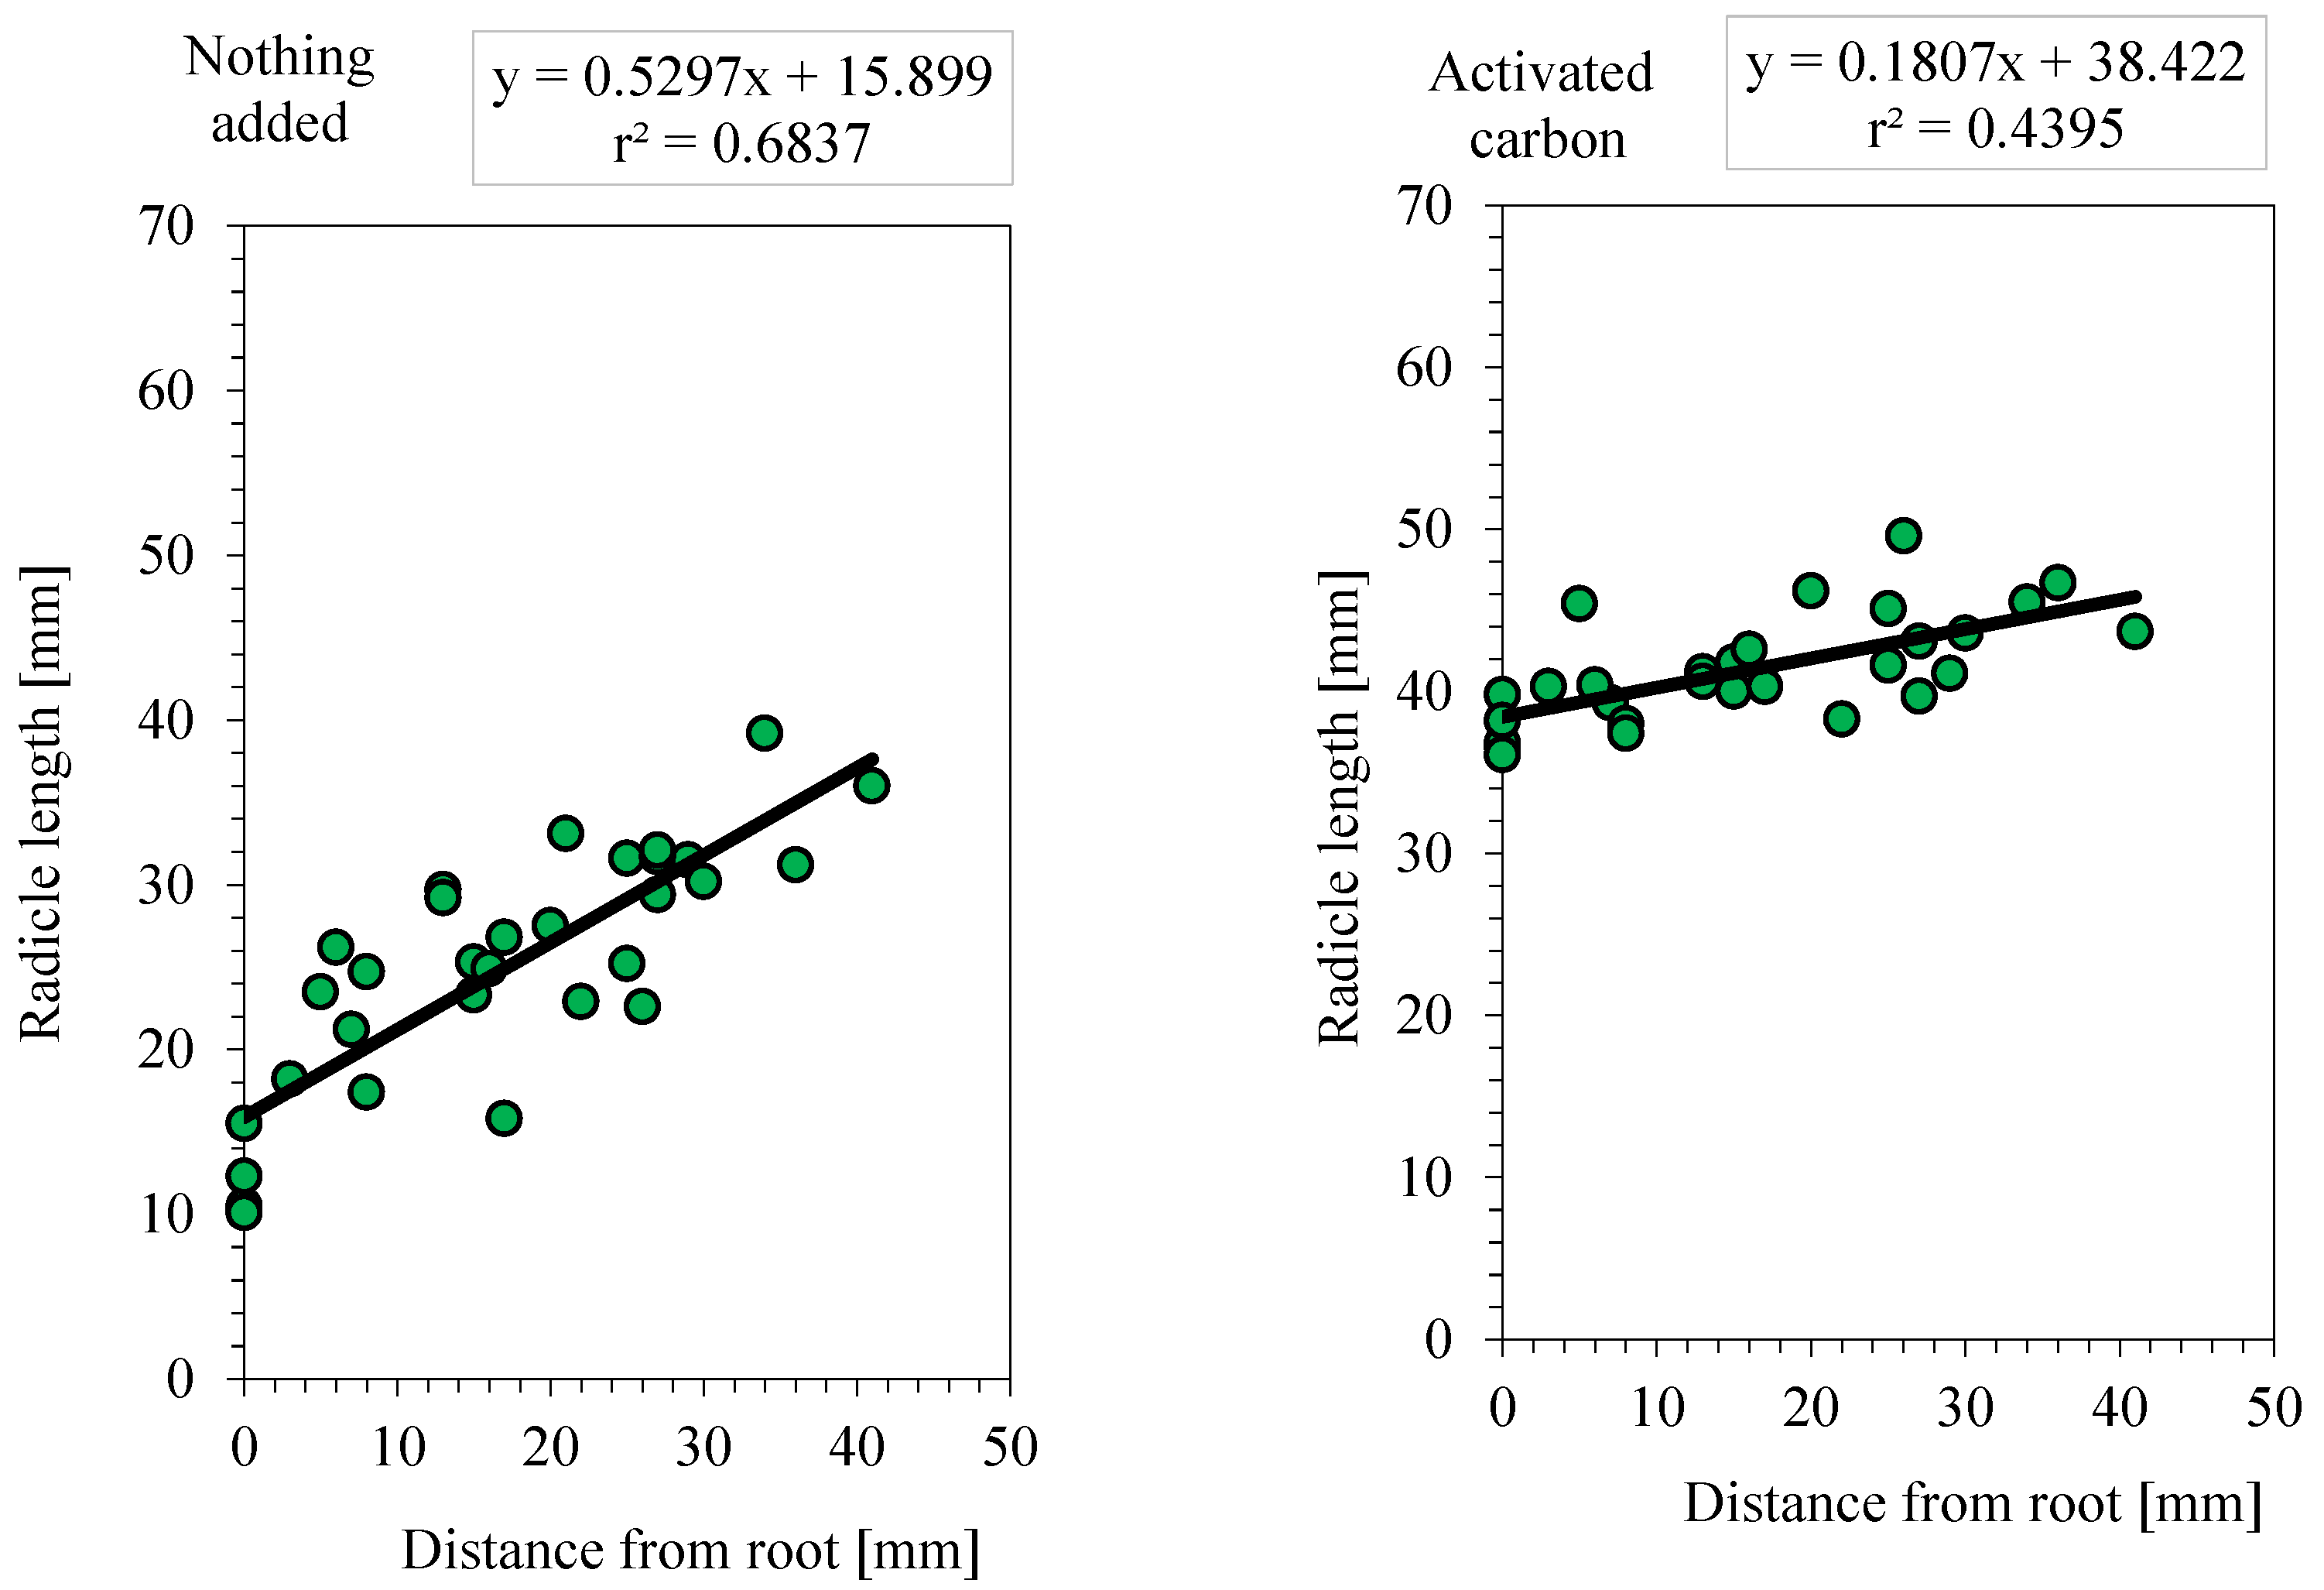
Figure 8.
Effect of activated carbon on the allelopathic activity of root secretions from Platycodon. R: growth rate of young roots of test plants; H: growth rate of test plant seedlings; R+AC: growth rate of radicals of lettuce after adding activated carbon; R+AC: growth rate of hypocotyls after adding activated carbon. When the germination rate of the test plants was not added with activated carbon (95.5%), the test area with activated carbon was added (94.8%). Bars indicate the SD. The significant difference in the root growth rate between adding and not adding activated carbon was 0.3%, and the intentional difference in the seedling growth rate was 3.1%, which was less than 5.0%. T-test: R, H (Jul.20) =P<0.001, R, H (Aug.20) =P<0.001, R, H (Oct.20) =P<0.001 significant difference.
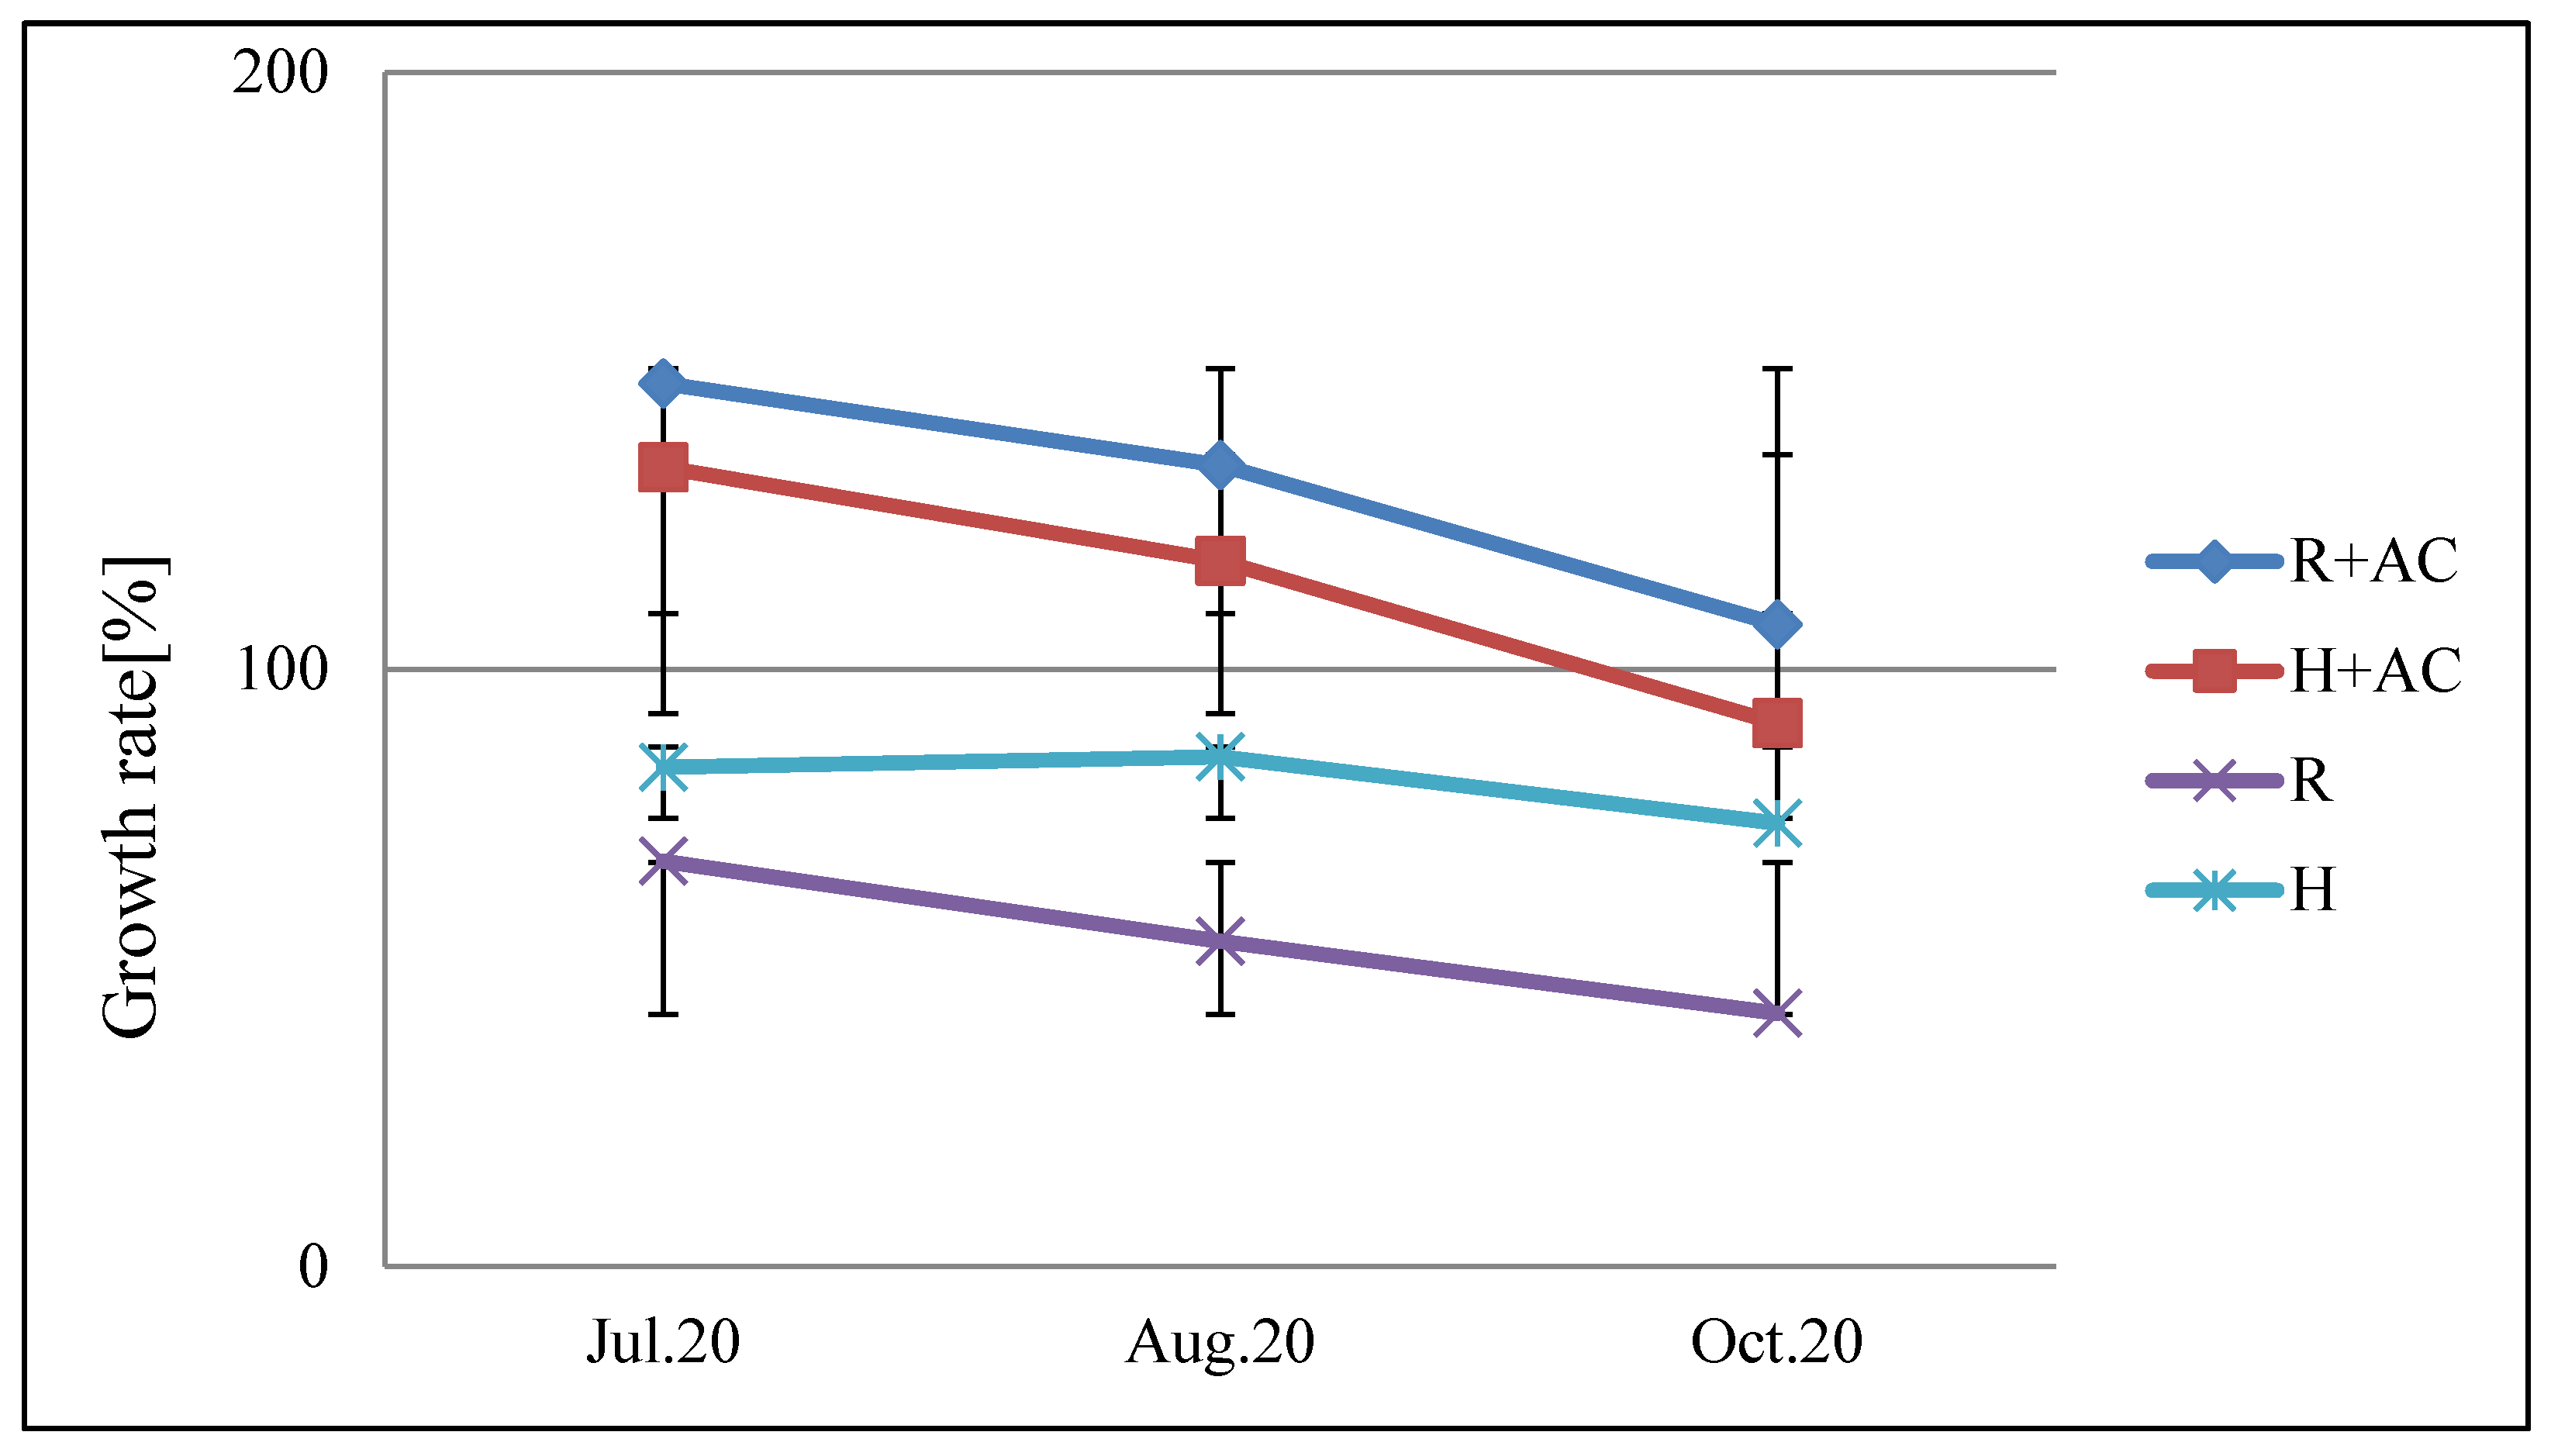

Table 1.
Allelopathic activity of different Platycodon components according to the Sandwich method.
| 10 mg | 50 mg | ||||||
| Date Part R | H | G | R | H | G | ||
| Jul. 20 | Leaf | 26.1±1.3 | 43.8±1.4 | 100±0.0 | 11.9±1.0 | 38.9±1.7 | 86.7±11.5 |
| Root | 58.8±0.7 | 56.9±0.3 | 100±0.0 | 29.1±0.5 | 47.4±0.3 | 100±0.0 | |
| Stem | 77.3±2.2 | 94.6±2.5 | 100±0.0 | 22.8±1.3 | 45.8±1.4 | 93.3±8.9 | |
| Aug. 20 | Leaf | 20.2±1.3 | 34.9±1.6 | 93.3±8.9 | 7.6±1.4 | 31.4±2.3 | 86.7±10.9 |
| Root | 57.4±1.4 | 64.1±1.1 | 100±0.0 | 48.9±0.7 | 60.0±0.6 | 100±0.0 | |
| Stem | 53.1±1.7 | 67.6±1.9 | 100±0.0 | 22.5±1.5 | 40.0±2.0 | 100±0.0 | |
| Oct.20 | Leaf | 15.6±1.6 | 35.8±2.1 | 100±0.0 | 4.6±0.5 | 13.1±0.7 | 93.3±8.9 |
| Root | 23.6±3.5 | 31.0±2.6 | 93.3±8.9 | 7.7±0.7 | 17.0±0.9 | 100±0.0 | |
| Stem | 30.5±3.4 | 45.2±3.1 | 100±0.0 | 19.9±2.5 | 33.1±2.5 | 100±0.0 | |
| AIR | Leaf | 79.4 | 61.8 | 0 | 91.9 | 72.2 | 6.7 |
| Root | 53.4 | 49.3 | 2.2 | 71.4 | 58.5 | 4.4 | |
| Stem | 46.3 | 30.8 | 2.2 | 78.3 | 60.4 | 2.2 | |
Values are the % of growth compared to the control; R: radicle; H: hypocotyl. AIR: average inhibition rate; G: germination ratio (%).
Table 2.
The absorption effect of activated carbon on allelopathic substances from various Platycodon components.
Table 2.
The absorption effect of activated carbon on allelopathic substances from various Platycodon components.
| 10 mg | 50 mg | ||||||
| Date Part R | H | G | R | H | G | ||
| Aug. 20 | Leaf | 90.2±2.7 | 80.9±1.8 | 100±0.0 | 54.5±3.1 | 62.6±3.2 | 100±0.0 |
| Root | 64.3±2.8 | 67.9±1.8 | 100±0.0 | 75.6±2.5 | 72.8±1.4 | 100±0.0 | |
| Stem | 118.9±3.6 | 106.2±2.4 | 100±0.0 | 68.5±2.1 | 71.5±1.6 | 93.3±8.9 | |
| Oct.10 | Leaf | 83.2±1.3 | 67.7±0.9 | 100±0.0 | 43.6±1.6 | 45.9±2.2 | 100±0.0 |
| Root | 80.1±4.2 | 83.4±3.4 | 100±0.0 | 38.4±1.7 | 50.9±0.9 | 100±0.0 | |
| Stem | 62.9±1.8 | 66.6±1.5 | 100±0.0 | 71.9±2.0 | 65.3±1.8 | 100±0.0 | |
| AIR | Leaf | 13.3 | 25.7 | 0 | 50.9 | 45.8 | 0 |
| Root | 27.8 | 24.3 | 0 | 43.0 | 38.1 | 0 | |
| Stem | 9.1 | 13.6 | 0 | 29.7 | 31.6 | 2.2 | |
Values are the % of growth compared to the control; R: radicle; H: hypocotyl. AIR: average inhibition rate; G: germination ratio (%).
Disclaimer/Publisher’s Note: The statements, opinions and data contained in all publications are solely those of the individual author(s) and contributor(s) and not of MDPI and/or the editor(s). MDPI and/or the editor(s) disclaim responsibility for any injury to people or property resulting from any ideas, methods, instructions or products referred to in the content. |
© 2024 by the authors. Licensee MDPI, Basel, Switzerland. This article is an open access article distributed under the terms and conditions of the Creative Commons Attribution (CC BY) license (http://creativecommons.org/licenses/by/4.0/).
Copyright: This open access article is published under a Creative Commons CC BY 4.0 license, which permit the free download, distribution, and reuse, provided that the author and preprint are cited in any reuse.


