
Submitted:
02 February 2024
Posted:
05 February 2024
You are already at the latest version
Abstract
The strong competition in the automotive industry has required manufacturers to implement lean production, both with methods and techniques specific to Industry 4.0. At the same time, universities must provide graduates with specific skills for applying these new production methods and techniques. In this context, a Lean Learning Factory was developed in the Pitesti University Center, which allows students to learn, experiment, and research, in an environment similar to that of enterprises, the new Lean Manufacturing methods and techniques, and Industry 4.0. The research presented in this study had as its objective identifying the minimum number of repetitions necessary to train operators who serve two differently organized workstations, one classic, the other including digital techniques, but on which the same assembly operation is performed. Several indicators were considered in the analysis, such as the number of errors, the number of stops, the effective duration of the work cycle, and the percentage ratio between the standard duration of cyclical activities and the effective duration of the work cycle. The evolution of these indicators was mathematically modelled by regression functions, using the least squares method. The obtained results also highlight the usefulness of applying the DOJO method as a Lean manufacturing-specific learning technique and the efficiency of implementing digital techniques in work organization.
Keywords:
lean learning factory
; assembly workstations
; DOJO
; industry 4.0
; regression analysis
1. Introduction
The concept of Industry 4.0 originated from collaborative efforts among academics, industry professionals, and the German Government. It aimed to enhance the competitiveness of the manufacturing sector by fostering convergence between industrial production and Information and Communication Technologies [1].
The fourth industrial revolution (4IR) or Industry 4.0 (I4.0) is recognized as the current pivotal transformation in manufacturing since the 'Hannover Messe' in 2011. Following this event, a collection of state-of-the-art technologies linked to I4.0 was extensively employed in various innovative frameworks and concepts, promising substantial advancements in manufacturing technologies and processes. This has opened up new business models and capabilities for organizations that were previously unattainable [2].
In the 1950s, Toyota Motor Corporation pioneered the Toyota Production System, giving rise to a groundbreaking management concept known as 'Lean thinking'. The application of lean thinking in manufacturing, referred to as 'Lean production', has proven to reduce manufacturing costs, shorten development and manufacturing cycles, and enhance overall enterprise competitiveness. Beyond the automotive industry, Lean production has extended its reach to machinery manufacturing, electronics, consumer goods, aerospace, shipbuilding, marking another significant milestone in modern production methods alongside mass production. Recognized as a key success factor, Lean Manufacturing Practices (LMP) have played a pivotal role in numerous organizations over the past few decades, offering a straightforward yet potent combination of implementation techniques and tools [3].
The primary goals of implementing the Lean philosophy within a company include reducing costs while maintaining product/service quality, eliminating waste, ensuring customer satisfaction, and establishing streamlined organizational efficiency and efficacy. Companies, seeking enhanced performance efficiency, have increasingly embraced the Lean philosophy [4].
Lean manufacturing techniques derive their foundation from the application of five principles that steer management actions towards success: value, continuous improvement, customer focus, perfection, and a concentrated effort on waste reduction [5].
The connection between the history of Industry 4.0 and Lean Manufacturing traces back to the inception of the Toyota Production System (TPS), the precursor of Lean Manufacturing. Taiichi Ohno, the creator of TPS, emphasized the concept of 'autonomation', advocating the automation of repetitive and value-added activities. He also highlighted the importance of machinery possessing the intelligence to detect and halt abnormalities [6]. LMP plays a positive role in mediating I4.0 and sustainable performance [7].
By combining Lean principles with Industry 4.0 technologies, companies can achieve more flexible production, more efficient supply chain management, and increased adaptability to market changes. Thus, the integration of these two approaches can contribute to optimizing operational performance and enhancing competitiveness in the industrial environment.
A Learning factory (LF) is the realization of a replica of a factory, where operators are trained through education, research and experiments [8]. These Learning Factories improve operators' competences and skills beyond their theoretical knowledge and also contribute to their efficient educational development. Nowadays Learning Factories are a necessity for operators, but also for industry, and with such training they improve the skills they have or acquire new ones, but also industrial and social experiences. [9] According to Sang-Hyun Park [10] we can reduce the number of defects to a minimum and reduce human costs to enable sustainable growth with the introduction of an intelligent manufacturing process. The Learning Factories consist of several courses about building complexity, energy consumption, costs, savings, IAQ and health improvement and they are also realized in research projects and academic works [11]. These LFs actually represent the transposition of industry workstations and are very similar to those in an industrial environment [12]. LF can be implemented both for manual operations where the operator is the one who performs the entire operation, but also automated and during this training they acquire technical (e.g. operation of some systems), transformational and miscellaneous (e.g. teamwork) acquisition of knowledge [13].
Learning factories have a unique implementation and purpose, with a growing emphasis on integrating Industry 4.0 elements in Europe. Industry 4.0 also includes Virtual Learning Factories in parallel to the regular LFs which usually trains operators in the same way as LF normally but in a virtual environment. In addition, these VLFs train and educate students in a sustainable way. It is also mentioned that both LFs and VLFs are competent and effective for improving engineering performance in Industry 4.0 [14].
Within Industry 4.0 we also find Smart Factories that represent a manufacturing system where we find interconnected processes and operations through cyber-physical systems, digital technologies and the Internet of Things [15]. These smart factories improve factory performance and product quality by combining technologies in a production environment [16].
Elbestawi M. et all. [17] created a learning factory with multiple production tools and specialized workstations. The factory is designed to incorporate Industry 4.0, Internet of Things (IoT), and Industrial Internet of Things (IIoT) technologies. This allows for using cloud applications with integrated hardware and software, messaging software platforms, and manufacturing execution systems (MES).
Schallock B., et. all. [18] developed a modular learning factory that is made up of manual workstations and cybernetic systems. The factory is based on the principles of action and social learning and aims to teach participants about Industry 4.0 through practical technology implementation tasks, including RFID, additive manufacturing, robot arms, and performance PLCs. By learning how to choose and implement these technologies, participants can apply them in their workspaces and factories. The authors also plan to introduce special themes for Industry 4.0 technologies, such as 3D printing or smart logistics.
A qualitative analysis of learning and working in digitalized environments, e.g.” learning and teaching in digital laboratories”, draws attention to future transformation processes in university education concerning the training methods, student/ teacher role, mobile access to information, etc. [19].
With the development of Learning Factory and Industry 4.0 concepts, methods, techniques, and tools in the area of training systems have also developed. The DOJO method comes from the Japanese manufacturing environment and, in the context of Lean Manufacturing, represents a dedicated space where employees learn and experience certain activities or processes. It can be used to develop employee skills, promote continuous improvements in processes, and encourage collaboration and knowledge sharing among team members.
DOJO workshops are today in increasing numbers in the industry. They mainly address security and quality [20], but are also applied in other areas, such as education. Thus, Barahona Mora A. [21] conducted a study in which she used ClassDOJO as an instrument to collect data on the scores obtained by participants in assessments, the duration in which they responded to assessments, and the percentage of negative and positive behaviours. In other studies [22,23,24,25,26] it has been shown that using ClassDojo and gamification as digital tools brings benefits for improving desired behaviours and decreasing unwanted ones. Also, to identify the advantages of using the ClassDojo tool, Krach, McCreery and Rimel [26] conducted a study in which they used statistical analysis to compare this tool with other learning methods.
The DOJO method is a learning method that promotes active learning and direct involvement of participants, facilitating the development of knowledge in a collaborative and autonomous way. According to Barkley, Cross, and Major [28], collaborative learning contributes to participants' learning using four fundamental principles: teamwork, interactivity, shared learning, and collective knowledge construction, with the expectation of active involvement in one's own learning process and integration in a supportive and challenging social context.
Organizations in the automotive industry consider the development of their human resources' attitude and competence towards new technologies a crucial objective. Special attention must be given to young operators. The training methods should concentrate on creating dedicated training centers, testing, design and implementation, mentoring, performance evaluation, and so on [29].
The professional training of operators in the automotive industry requires a set of developments in terms of knowledge and skills specific to the work carried out, especially practical skills. Practical skills are automated components of the performed activity, with a smooth and fast development, with the reduction to a minimum of voluntary effort, conscious and analytical control. Performance in the activity of training practical skills at the operator in the automotive industry is determined not only by situational variables (physical work environment, design of work equipment, work methods) and organizational variables (instructor-operator interaction, training and control system), but also by individual variables such as: dexterity, enhanced motor skills, responsibility, perfectionism, perseverance, previous experience. Thus, professional competence becomes a resultant vector of the interaction of the three types of variables, with important contributions to the labour productivity of operators in the automotive industry [30].
Both the Learning Factory and the DOJO method are approaches used in the context of improving participants' skills and behaviour. Although there is no direct link between these two concepts, common elements can be identified that make them complementary in an efficiency-oriented production environment, such as:
- focuses on practical learning; through active participation in exercises and simulations, employees and students acquire practical skills and acquire key concepts in an interactive way;
- encourages problem solving and the implementation of effective solutions.
- contribute to the identification of improvement solutions that can be standardized and widely implemented;
- contributes to the development of skills and the creation of an organizational culture focused on continuous learning and improvement.
By integrating the DOJO method into Learning Factory, an environment conducive to continuous skills development, effective problem solving, and promotion of an organizational culture oriented towards efficiency and excellence in processes can be created.
The research presented in this study had as its objective identifying the minimum number of repetitions necessary to train operators who serve two differently organized workstations, one classic, the other including digital techniques, but on which the same assembly operation is performed. The assembly operation is part of a process carried out on the assembly line as part of the Lean Learning Factory in the Pitesti University Center and includes several manual activities. The workstation with digital techniques was developed to guide the operator in carrying out the activities within it, in order to facilitate the process. The process of training operators in the two workstations is carried out with the help of the DOJO method. Several indicators were considered in the analysis, such as the number of errors, the number of stops, the effective duration of the work cycle, and the percentage ratio between the normalized duration of cyclic activities and the effective duration of the work cycle.
This research is part of a larger study that analyses the impact on the introduction of innovative production and learning methods in industrial production processes. Its originality is mainly given by the use of a learning factory as an experimentation environment.
2. Materials and Methods
2.1. The studied labour processes
The research was carried out within the Lean Learning Factory 31] of the National University of Science and Technology Politehnica of Bucharest, University Center Piteşti. This Lean Learning Factory (LLF) comprises an assembly line made of modular and flexible structures that provide great flexibility of workstations and inter-operational transfer systems that allow different flow systems, such as piece by piece or in small batches. At the same time, innovative equipment, specific to the Industry 4.0 concept, can be integrated into various configurations on the assembly line, such as: 1D scanners, pick by light system, video camera for shape and colour recognition (integrated as Poka-Yoke system), HMI and control panel (PLC systems), ABB robotic arm, automated indexable worktable, general automation control panel, Virtual and Augmented Reality equipment.
An experimental product is assembled on this line – steering wheel, which can be made in 8 models (multiple configurations) by combining its components differently. The technological process of steering wheel assembly includes four operations, performed on each workstation, in which manual activities of positioning, screwing, mounting and detachment are performed.
In the considered operation in this study, the following work phases are performed, Figure 1: (a) taking the steering wheel assembly (A) from the operational transfer case and positioning it in the device; (b) taking the horn assembly (B) from the operational transfer case and positioning it on the steering wheel assembly; (c) picking and positioning of screws (C); (d) screwing screws with electric screwdriver; (e) picking and mounting switches (D) and cover (E); (f) quality check of the correctness of assembly; (g) detachment of the steering wheel product from the device and its positioning in the finished product box.
To analyse the impact of implementing innovative production methods using digital techniques, the workstation associated with an assembly operation of medium complexity was built in two versions: classic and digitalized.
In the classic workstation (marked CWs), Figure 2a, the operator uses only ordinary equipment and means of work to perform specific activities.
- At the digitalized workstation (marked DWs), Figure 2b, the operator uses, in addition to the usual equipment and means of work, equipment comprising digital technologies that guide him in carrying out the activities as:
- sensor and pads for detecting and locking the position of the pallet, used when the product is assembled on the pallet and transferred between assembly line workstations;
- 1D scanner for label reading, which allows identification of the model to be assembled;
- touch screen console (HMI) for operator interaction with PLC, which allows displaying settings, configuring the system, and sending direct commands, recording the duration of activities in the assembly process;
- two-levels light beacon (red and green) and acoustic signal to alert the operator in case of an incident;
- optical system to assist the operator in the selection process of components to be used in the workstation (pick by light): indication of location and sequence of work and system for confirming the selection by the operator of components used in the workstation;
- video camera for checking the presence/ lack of a component on the product to be assembled, equipped with IV-Navigator software, which works as a Poka-Yoke system that identifies errors.
The two workstations have been organized in compliance with ergonomic principles and those of movement economy [32,33,34], so that the operator can carry out the work process in normal conditions and with high efficiency. To determine the duration of the work cycle, the MODAPTS method [35] was used, consisting in observing the work process, decomposing the operator's activities into elementary movements, associating method-specific symbols, and calculating the duration of activities. Based on these elements, working standards have been developed for each workstation (CWs and DWs), based on which the process of training operators and the actual development of the work process takes place.
2.2. The DOJO method
The DOJO method, also known as the dexterity workshop, is used in the industry to learn and train operators to achieve the fastest possible work rhythm and be efficient in servicing a workstation [20]. Since the performance of an assembly line is assessed by indicators such as high productivity, low cycle time, and low inventories, the process of training operators is one of the methods of implementing the concept of Lean Manufacturing [5,6,36,37]. In this study, the DOJO method was applied according to the methodology presented in Figure 3 [38].
The indicators used to evaluate the training performance of the participants are:
- The number of errors, Ne, respectively the number of positioning or sequence (execution order) errors made by the experimenter within a work cycle (operations). Positioning errors occur when the executor positions one or more components in a different place than specified, or the components are positioned incorrectly (for example, upside down). Sequence errors occur when the executor retrieves and assembles components in a different order than the correct one.
- The number of stops, Ns, refers to: stops caused by errors, stops caused by accidents, stops to ask for directions or follow work instructions, but also other types of stops. These stops are counted only if the participant stops the assembly process for more than 3 seconds.
- The effective duration of the work cycle, Tec, represents the duration measured when performing the cyclical activities provided for in the work standard of the workstation. This indicator is most frequently used to evaluate the learning-training performance of operators and their evolution in the training process.
- The degree of training, RTc, which is calculated as a percentage ratio between the standard duration of cyclical activities, Tnc, and the effective duration of the work cycle, Tec:
- This indicator evaluates the extent to which the executor is approaching the achievement of the normed work rhythm within the workstation.
2.3. Preparation and conduct of experiments
For the application of the DOJO method in the considered workstations, volunteer students from the II, III and IV study year of the Faculty of Mechanics and Technology, University Center Pitesti, have worked as operators. These students were selected based on the following criteria:
- age, gender, and educational level (year of study);
- existence of medical conditions;
- skills in using digital techniques;
- practical skills of manual operation.
The criteria of age, gender and educational level, skills to use digital techniques, respectively, practical skills of manual operation were used to form homogeneous groups of students. The selection criterion on medical conditions was used to avoid including students with conditions such as epilepsy, vertigo, or visual impairment in experimental groups, as they may prevent the participant from performing certain activities within the assembly process.
The selection of participants was made through a questionnaire, which was distributed online to students. The questionnaire was structured in three sections, based on the evaluation criteria previously established: the first section refers to the participant's identification data - name, age, gender, educational level, conditions, frequency of hand use and availability of time, the second section identifies skills to use digital technologies - phone/tablet, laptop, PS/Xbox and virtual reality equipment, and the last section of the questionnaire deals with practical manual operating skills - skill, quickness, strength, endurance, accuracy, etc.
Among the respondents to the questionnaire, a target group of 70 participants was retained. Of these, 10 were used in pilot studies (pretesting), presented in this paper, and the other 60 for further research, for the analysis of different production methods. From the 10 participants were formed two groups of participants in experiments, a group of 5 students for applying the DOJO method at the classical workstation, another of 5 students for applying the DOJO method at the digitalized workstation, so that the two groups are homogeneous in terms of characteristics and, at the same time, close to the target group average, Table 2.1 and Table 2.2.

Table 1.
The characteristics of the target group.
| Target group: 70 participants | |||||
|---|---|---|---|---|---|
| Year of study | II: 26/ 37,14 % | III: 19/ 27,14 % | IV: 25/ 35,72% | ||
| Sex | 27 men / 38,67% | 43 women / 61,43% | |||
| Average score of the criterium | Practical skills - AP: 3,92 | Digital skills - AD: 3,08 | |||
Table 2.
The characteristics of the participants in the experimental groups.
| Workstation/ No. of participants | Classic workstation/ 5 | Digitalized workstation/ 5 | ||||||
| Year of study | 2nd year/ 2 | 3rd year/ 2 | 4th year: 1 | 2nd year/ 2 | 3rd year/ 2 | 4th year/ 1 | ||
| Sex | M/ 2 | F/ 3 | M/ 2 | F/ 3 | ||||
| Average score | AP: 4,07 | AD: 3,24 | AP: 3,88 | AD: 3,01 | ||||
The experiments were planned and carried out as follows:
- first the experiments were carried out on the classical workstation, then the experiments were carried out on the digitalized workstation, by the two distinct groups of participants;
- each group of 5 students, associated with a workstation, conducted experiments on two separate days;
- on one day of experimentation, each participant in the group successively performed 10 work cycles (operations).
After planning the experiments, the workstations were prepared: the assembly components were placed within them to complete 10 work cycles (operations) without the need for interruptions for supply, the work equipment (power of the electric screwdriver, calibration of the camera used for control, configuration of the pick by light system, etc.) and the working standard were adjusted. A work process observation sheet, Figure 4, was built to track and centralize the results of each experimentation participant in a training day.
Before the actual start of the experiments, each group of participants was explained the purpose of the experiment, was presented in video projection format how the operation was carried out and was explained the working standard (presented on physical support). Also, the instructor practically exemplified the way of working in the workstation, detailing how to pick and position the components, so that the working standard is respected. At the end of the training process, participants participated separately in the experimentation in order not to be influenced by those who previously perform the assembly operation
During the experiments, at the same time as the results were noted in the sheet, the process carried out by each participant was filmed, to subsequently analyse the activities performed by him and avoid the possibility of omitting certain elements from the experimentation (errors, stops or other causes that disrupted the process). Thus, the experimentation process was watched by two observers: one filled out the process observation sheet, and another filmed the process with a mobile phone.
3. Results
The data recorded during the learning-training processes of the participants were analysed and processed in three stages: (I) determining the average values of the training performance evaluation indicators, (II) choosing the form of the process functions associated with the evaluation indicators of training performance and (III) determination of process function coefficient values and regression analysis, as follows.
I. Determining the average values of the training performance evaluation indicators
The data recorded in the observation sheets of the training processes were analysed simultaneously with the analysis of the footage associated with them. Thus, aberrant data were removed from them, such as process interruption due to disturbance by an external factor.
Based on the validated data, for each of the training performance evaluation indicators of the participants - Ne, Ns, Tec, and RTc, the following values were determined for each operation (work cycle) performed:
- -
- the minimum and maximum values of the indicators, respectively, at the level of the experimental group (of the 5 participants from each workstation);
- -
- the average values of the indicators, as arithmetic averages at the level of the experimental group (of the 5 participants from each workstation). To determine the RTc indicator, the standard values of the work cycle duration were considered: Tnc = 27.062 s for the classic workstation, respectively, Tnc = 29.826 s for the digitalized workstation, established by the work standards.
II. Choosing the form of the process functions associated with the evaluation indicators of training performance
The dependence of the average values of the training performance evaluation indicators of the participants on the number of operations (work cycles) performed was represented graphically: first for each day of experimentation (2 graphs, each with the 10 operations performed in one day), then cumulative (one graph, with all 20 operations). The analysis of the shape of these graphs led to the following conclusions about the choice of the process function forms associated with the training performance evaluation indicators:
- -
- Since the values of the indicators Ne, Ns, Tec, and RTc tend to be constant, respectively, horizontal asymptotes with the stabilization of the learning-training process, the mathematical modelling of their evolution can be carried out through simple mathematical functions, the logarithmic function (2), respectively, power function (3):Y = A0 + A1lnXwhere: X represents the number of operations (work cycles) performed by the participants, and A0 and A1 are the coefficients of the function.Y = A0 XA1
- -
- In the case of the Ne and Ns indicators, only the logarithmic function (2) was considered for the mathematical modelling of their evolution as a process function. The power function cannot be used because the values of these indicators tend to zero with the increase in the number of operations performed by the participants.
- -
- In the case of the Tec and RTc indicators, the logarithmic function (2) and the power function (3) were considered as process functions for the mathematical modelling of their evolution.
III. Determination of process function coefficient values and regression analysis
The values of the coefficients of the process functions associated with the training performance evaluation indicators were determined by the least squares method [39,40]. For this purpose, the average values of the training performance evaluation indicators of the participants obtained during the two training days were used (20 values for each indicator). For each process function, they were determined:
- -
- values of the coefficients of the function, A0 şi A1;
- -
- standard errors of the function coefficients, SE0 for the free coefficient (A0), respective, SE1 for the A1 coefficient;
- -
- sum of square due to residual (or error), SSE;
- -
- sum of square due to model (or regression), SSR;
- -
- coefficient of determination, R2;
- -
- Fisher statistic calculated, Fcalc;
- -
- Student statistic calculated, |tcalc|, for each coefficient Ai.
The analysis of variance (ANOVA) was carried out for each determined process function and consisted of carrying out the following tests:
- test for significance of regression: if Fcalc > Fcritical (α, p-1, df), the null hypothesis would be rejected (the model is statistically significant at significance level α);
- test for significance of the function coefficients: if |tcalc| > tcritical (α/2, df), the null hypothesis would be rejected (the coefficient is statistically significant at significance level α).
Since all functions considered in the mathematical modelling have two coefficients each (p = 2) and in all experiments, 20 operations/work cycles were performed (X has 20 values), the number of degrees of freedom is in all cases (process functions analysed) df = 18.
In the regression analysis, the level of significance α = 0.01 was considered for the application of the two tests. The critical values of the Fisher distribution – Fcritical, respectively, of the Student distribution – tcritical associated with the mentioned experimental conditions are presented in Table 3.
The number of errors, Ne, made by the participants in the experiments at the two workstations – classic and digitalized is presented in Table 4, respectively, Table 6, the evolution of the average number of errors is represented in Figure 5, respectively, Figure 6, and the main results of the regression analysis for the Ne process function are presented in Table 5, respectively, Table 7.
The analysis of the results of operator training in the case of the classic workstation, based on the indicator "number of errors, Ne_CWs" - Table 4 and Figure 5 and the process function associated with it - Table 5, highlights the following:
- -
- on the first day of training, there were "errors" in most of the operations performed by the participants, and their maximum number decreased as the operation was repeated, remaining relatively constant starting from the fourth work cycle; the main categories of errors made by the participants consisted in taking the components in the wrong order and positioning them wrongly on the product.
- -
- on the second day of training the number of errors decreased considerably, reaching zero value after the sixteenth work cycle (repetitions performed).
- -
- the mathematical model considered for the Ne_CWs process function is adequate for a confidence level of 99%, and the coefficients of this function are significant; however, the coefficient of determination of the function has a small value (0.7885), indicating a low correlation of the data; thus, although the number of errors recorded experimentally is zero starting from the 17th working cycle, the zero value of the errors estimated with this function is obtained after the 25th cycle.
The analysis of the results of operator training in the case of the digitalized workstation, based on the "number of errors, Ne" indicator - Table 6 and Figure 6 and the process function associated with it - Table 7, highlights the following:
- -
- on the first day of training, in the first seven work cycles, there were "errors", and their number decreased continuously, as the operation was repeated; the main categories of errors made consisted of the wrong positioning of components on the product.
- -
- on the second day of training, the number of errors decreased significantly, reaching zero after the sixteenth work cycle (repetitions performed).
- -
- the mathematical model considered for the Ne_DWs process function is adequate for a confidence level of 99%, and the coefficients of this function are significant; the coefficient of determination of the function has a higher value (0.8879) than in the case of the classic post, indicating a better correlation of the data; thus, the number of experimental errors is zero starting from the 17th work cycle, and the zero value of the errors estimated with this function is obtained after the 18th work cycle.
The number of stops, Ns, made by the participants in the experiments at the two workstations - classic and digitalized is presented in Table 8, respectively, Table 10, the evolution of the average number of stops is represented in Figure 7, respectively, Figure 8, and the main results of the regression analysis for the process function Ns are presented in Table 9, respectively, Table 11.
The analysis of the results of operator training in the case of the classic workstation, based on the "number of stops, Ns" indicator - Table 8 and Figure 7 and the process function associated with it - Table 9, highlights the following:
- -
- on the first day of training, there were a maximum of two "stops" for the first three work cycles performed, then a maximum of one "stop", reaching zero for the last two operations of the first day, for each participant; the main categories of stops were determined by minor injuries, stops due to errors, following the job description, dropping components on the ground or requesting information.
- -
- on the second day of training, there were some stoppages in the first three operations, but they disappeared from the fourth work cycle.
- -
- the mathematical model considered for the process function Ns_CWs is adequate for a confidence level of 99%, and the coefficients of this function are significant; the coefficient of determination of the function has an acceptable value (0.8669), indicating a better correlation of the data; although the number of experimental stops is zero starting from the 14th duty cycle, the null value of stops estimated with this function is estimated after the 17th cycle.
The analysis of the results of operator training in the case of the digitalized workstation, based on the indicator "number of stops, Ns" - Table 10 and Figure 8 and the process function associated with it - Table 11, highlights the following:
- -
- on the first day of training, there were "stops" in the experiments carried out, but these were only for some participants and in the first work cycles; however, with the increase in the number of performed operations, their number decreased significantly; the main categories of stops were determined by minor accidents, stops due to errors, dropping components on foot or requesting information.
- -
- on the second day of training, the number of stops decreased significantly, disappearing after the fifth work cycle (operations performed).
- -
- the mathematical model considered for the process function Ns_DWs is adequate for a confidence level of 99%, and the coefficients of this function are significant; although the coefficient of determination of the function has a small value (0.7695), which indicates a low correlation of the data, the null value of the stops estimated with this function coincides with the actual experimental one, respectively, the 16th cycle.
The most important indicator used to evaluate the degree of training of operators is the effective duration of the work cycle, Tec. With the help of this indicator, the degree of training of the participants, RTc, is determined as a percentage ratio between the standard duration of cyclical activities, Tnc, and the effective average duration of the work cycle, Tec.
Table 12 presents the effective durations of the work cycle obtained by the participants in the experiment within the classical workstation, in Figure 9 and Figure 10 the evolutions of the average values of the two indicators associated with training at this position are represented, and in Table 13, respectively, Table 14 presents the main results of the regression analysis for the process functions Tec, respectively, RTc.
The analysis of the results of operator training in the case of the classic workstation, based on the "effective duration of the work cycle, Toc" indicator - Table 12 and Figure 9 and the process function associated with it - Table 13, highlights the following:
- -
- on the first day of training, the average effective duration of the work cycle was double the norm (Tnc = 27.062 s) in the first two operations performed by the participants, but it decreased continuously until the end of the day, with the increase in the number of cycles work done by the participants.
- -
- on the second day of training, the effective average duration of the work cycle started from the level obtained at the end of the first day of training, but its decrease with the increase in the number of operations performed by the participants was no longer so pronounced, highlighting a "stabilization of the training process"; however, there were participants who reached or fell below their normalized work cycle time during the second day of the experiment.
- -
- both mathematical models considered for the Tec_CWs process function are adequate for a confidence level of 99%, and the coefficients of these functions are significant; the coefficients of determination of the functions have high values (0.9608 for the logarithmic function, respectively, 0.9522 for the power function), which indicates a high correlation of the data; the logarithm function better approximates the experimental results (having a higher coefficient of determination R2) and, according to it, it is estimated that the normalized duration of the work cycle will be obtained after performing 25 operations (work cycles).
The evolution of the RTc indicator is similar to the evolution of the Tec indicator but in the opposite direction. The analysis of the average values of the RTc indicator (Figure 10) and its associated process function (Table 14) reveals the following trends:
- -
- on the first day of training, the average value of this indicator increases continuously and pronouncedly, from a percentage of approximately 44% to one close to 70%.
- -
- on the second day of training, the increase of this indicator is more moderate, starting from an average value of 82% up to 86%, reaching in some operations the value of 89%.
- -
- both mathematical models considered for the process function RTc_CWs are adequate for a confidence level of 99%, and the coefficients of these functions are significant; the coefficients of determination of the functions have high values (0.9144 for the logarithmic function, respectively, 0.9343 for the power function), which indicates a high correlation of the data; the power function better approximates the experimental results (having a higher coefficient of determination R2) and, according to it, it is estimated that a RTc value = 90 will be obtained after performing 21 operations (work cycles).
The effective duration of the work cycle obtained by the participants in the experiment within the digitalized workstation are presented in Table 15, in Figure 11 and Figure 12 the evolutions of the average values of the Tec and RTc indicators associated with training at this workstation are represented, and Table 16, respectively, Table 17 presents the main results of the regression analysis for the process functions Tec, respectively, RTc.
The analysis of the results of operator training in the case of the digitalized workstation, based on the indicator "effective duration of the work cycle, Tec" - Table 15 and Figure 11 and the process function associated with it - Table 16, highlights the following:
- -
- on the first day of training, the effective average duration of the work cycle was double the norm (Tnc = 29.826 s) in the first operation performed by the participants, then it decreased continuously until the end of the day, with the increase in the number of repetitions of the operation.
- -
- on the second day of training, the average effective duration of the work cycle started from the value of 40%, slightly higher than the level obtained at the end of the first day of training, and continued to decrease with the increase in the number of repetitions of the operation, approaching the standard value; more participants reached or fell below their normalized cycle time during the second day of the experiment.
- -
- both mathematical models considered for the Tec_DWs process function are adequate for a confidence level of 99%, and the coefficients of these functions are significant; the coefficients of determination of the functions have high and close values (0.973 for the logarithmic function, respectively, 0.98 for the power function), which indicates a high correlation of the data; with the help of the logarithm function, it is estimated that the standard duration of the work cycle will be obtained after the completion of 23 operations (work cycles).
The evolution of the RTc indicator for the digitalized workstation is similar to the evolution of the Tec indicator but in the opposite direction. The analysis of the evolution of the average values of the RTc indicator, Figure 12, and of the process function associated with it - Table 17, highlights the following:
- -
- on the first day of training, the value of this indicator increases continuously and sharply, from a percentage of approximately 47% to one of approximately 78%.
- -
- on the second day of training, the increase of this indicator is similar to the first day, starting from a value lower than the one obtained at the end of the first day of experimentation and reaching up to 94%.
- -
- both mathematical models considered for the process function RTc_DWs are adequate for a confidence level of 99%, and the coefficients of these functions are significant; the coefficients of determination of the functions have high values (0.9562 for the logarithmic function, respectively, 0.9696 for the power function), which indicates a high correlation of the data; the power function better approximates the experimental results (having a higher coefficient of determination R2) and, according to it, it is estimated that a value RTc = 90 will be obtained after performing 18 operations (work cycles).
4. Discussion
In the mathematical modelling of the evolution of the Ne and Ns indicators, the logarithm functions used to determine the process functions associated with these indicators are adequate, in the case of both workstations, and their coefficients are significant for a 99% confidence level. However, the values of the coefficient of determination, R2, of these functions are relatively small (values from 0.7695 to 0.8879), which shows that there is not a very high correlation between the average values of the Ne indicators, respectively, Ns, and the number of operations (work cycles) performed by the participants. This is determined by the fact that, on the one hand, the values of these indicators are natural numbers of small and often zero values (as a consequence of the formation process), and, on the other hand, the causes that cause the occurrence of errors and shutdowns are different.
In the mathematical modelling of the evolution of the Tec and RTc indicators, both the logarithm functions and the power functions used to determine the process functions associated with these indicators are appropriate, in the case of both workstations, and their coefficients are significant for a confidence level of 99%. At the same time, the values of the coefficient of determination, R2, of these functions are relatively high (values from 0.9144 to 0.98), which indicates a high correlation between the average values of the Tec indicators, respectively, RTc, and the number of operations (work cycles) performed by the participants.
Regarding the learning-training process of the participants, the analysis of the results obtained for the indicators considered in the evaluation of the learning-training performance at the two workstations allows a series of remarks:
- From the point of view of the errors made - the Ne indicator, it is found that the work process is learned by all participants after 17 work cycles (operations), in the case of both jobs. However, some participants have not made any errors since the end of the first day of training, learning the process faster.
- From the point of view of the stops made - the Ns indicator, it is found that the work process is learned by all participants after 14 work cycles (operations) in the case of the classic workstation, respectively, 16 work cycles (operations) in the case of the digitalized workplace. However, some participants have not made stops since the end of the first day of training, learning the process faster.
- From the point of view of the normalized duration of the work cycle - the Tc indicator, this was not reached as the average of the group of participants during the experiments performed, with only one participant succeeding this. Using the process functions determined for this indicator, it is estimated that reaching the standard duration of the work cycle, at the level of the participant group, will take place after performing 25 work cycles in the case of the classic workplace, respectively 23 work cycles, in the case of the digitalized workstation.
- From the point of view of the degree of training of the operators - the RTc indicator, it is found that to obtain a percentage of 90%, 17 work cycles are sufficient for the digitalized workstation, while for the classic workstation, more than 20 work cycles. Using the process function determined for this indicator in the classical workplace, it is estimated that reaching a training degree of 90%, at the level of the participant group, will take place after performing 21 work cycles.
Taking into account the previous analyses it is found that, from the point of view of errors and stops that occur during training, performing the operation (work cycle) 20 times ensures that the group of participants learns how to work, these not making errors or stops. However, to fit into the standard duration of the operation, carrying out the operation (work cycle) 20 times ensures only the initial learning (RTc = 90%) and, partially, the beginning of the stabilization of the process, the group of participants still needing to repeat the process to gain experience (dexterity in work).
Thus, the study highlights the fact that in the formation of practical skills in operators, along with the training method and the working conditions, considered situational variables, the individual variables of the operators also intervene, such as the system of technical skills, the interest in the activity of learning, gender, age, etc.
Also, the analysis highlights the fact that the learning-training process of the participants in the case of the digitalized workplace is faster than in the case of the classic workplace in terms of all indicators. This is because the operator working at this workstation is guided by the pick-by-light system in carrying out the activities, and the Poka-Yoke type system prevents the appearance of defects at the workstation.
5. Conclusions
It has been shown that it is possible to mathematically model by regression functions some indicators of the training performance regarding the participants - volunteer students - in the learning-training process of an assembly operation with predominantly manual activities.
The determined process functions express the dependence between the average number of errors - Ne, the average number of stops - Ns, the average effective duration of the work cycle - Tec, the average degree of training - RTc, and the number of operations (work cycles) performed by the participants in the learning-training process, for each of the two analysed workstations.
All the modelling functions considered in this study, logarithmic for Ne and Ns indicators, respectively, logarithmic and power for Tec and RTc were adequate for a confidence level of 99%, and their coefficients were significant. A very good correlation of the average values of the Tec and RTc indicators with the number of operations performed by the participants was highlighted, an aspect highlighted by the high values of the function determination coefficients, R2, close to or greater than 0.95.
An important practical characteristic, related to the continuation of research, is that the completion of the work cycle 20 times by new operators, using the DOJO method, will lead to learning the work process (making it without errors and stoppages) and upon obtaining an average degree of training close to the standard work rate (the value of 90% for the RTc indicator). The practical value of the undertaken research also consists of the developed working methodology, which can be used in other similar studies.
The limitations of the study are imposed, on the one hand, by the type of activities carried out at the analysed workstations and, on the other hand, by the use of volunteer students in the experiments, who do not have high practical skills, comparable to those of the operators in the workshop’s assembly.
Future research will be extended to the study of production methods, to analyse the efficiency of the integration of digital techniques in the organization of workplaces. Also, the study can be developed in the direction of using virtual/augmented reality in the process of learning and training operators.
Author Contributions
Conceptualization, E.L.N. and A.C.G.; methodology, E.L.N. and G.C.N.; software, G.C.N., G.G.V. and E.M.D.; validation, E.L.N., A.C.G., M.G. and M.M.S.; formal analysis, M.G., M.M.S.; investigation, G.C.N., G.G.V. and E.M.D.; data curation, G.C.N., G.G.V. and E.M.D.; writing—original draft preparation, G.C.N., A.C.G. and M.M.S.; writing—review and editing, E.L.N.; supervision, E.L.N. and M.G. All authors have read and agreed to the published version of the manuscript.
Funding
This research received no external funding.
Data Availability Statement
The corresponding author will provide the data used in this work upon reasonable request.
Acknowledgments
The authors express their appreciation to the Romanian Ministry of Research and Innovation, which supported the development of the Lean learning factory in the Pitesti University Center, by CCCDI – UEFISCDI, project number PN-III-P1-1.2-PCCDI-2017-0446 / 82-PCCDI- 2018, within PNCDI III.
Conflicts of Interest
The authors declare no conflict of interest.
References
- Kagermann, J.; Helbig, A.; Wahlster, W.; Helbing, J. Recommendations for implementing the strategic initiative Industrie 4.0: Final report of the Industrie 4.0 Working Group; Hellinger, A., Stumpf, V., Eds.; Publisher: Forschungsunion: Frankfurt/Main, Germany, 2013. [Google Scholar]
- Pereira, A.C.; Dinis-Carvalho, J.; Alves, A.C.; Arezes, P. How Industry 4.0 can enhance lean practices. FME Transactions. 2019, 47, 810–822. [Google Scholar] [CrossRef]
- Sanders, A.; Elangeswaran, C.; Wulfsberg, J.P. Industry 4.0 implies lean manufacturing: Research activities in Industry 4.0 function as enablers for lean manufacturing. Journal of Industrial Engineering and Management 2016, 9, 811–833. [Google Scholar] [CrossRef]
- Deshmukh, M.; Gangele, A.; Gope, D.K.; Dewangan, S. Study and implementation of lean manufacturing strategies: A literature review. Mater. Today Proc. 2022, 62, 1489–1495. [Google Scholar] [CrossRef]
- Badurdeen, A. Lean Manufacturing Basics. 2017, (www.leanmanufacturingconcepts.com).
- Ohno, T. Toyota production system: Beyond large-scale production; Productivity Press: Tokyo, Japan, 2019. [Google Scholar]
- Kamble, S.; Gunasekaran, A.; Dhone, N.C. Industry 4.0 and lean manufacturing practices for sustainable organisational performance in Indian manufacturing companies. International Journal of Production Research 2020, 58, 1319–1337. [Google Scholar] [CrossRef]
- Ruppert, T.; Darányi, A.; Medvegy, T.; Cserklei, D.; Abonyi, J. Demonstration Laboratory of Industry 4.0 Retrofitting and Operator 4.0 Solutions: Education towards Industry 5.0. Sensors 2023, 23, 283. [Google Scholar] [CrossRef] [PubMed]
- Jing, Z.; Turi, J.A.; Lu, S.; Rosak-Szyrocka, J. Sustainability through Factory-Based Learning in Higher Education. Sustainability 2023, 15, 5376. [Google Scholar] [CrossRef]
- Park, S.-H.; Lee, K.-H.; Park, J.-S.; Shin, Y.-S. Deep Learning-Based Defect Detection for Sustainable Smart Manufacturing. Sustainability 2022, 14, 2697. [Google Scholar] [CrossRef]
- Cano-Suñén, E.; Martínez, I.; Fernández, Á.; Zalba, B.; Casas, R. Internet of Things (IoT) in Buildings: A Learning Factory. Sustainability 2023, 15, 12219. [Google Scholar] [CrossRef]
- Nikola, G.; Bashir, S.; Amanda, A.; Sajjad, K. Utilization of Industry 4.0 Related Equipment in Assembly Line Balancing Procedure. Processes 2020, 8, 864. [Google Scholar] [CrossRef]
- Burkhard S.; Christoffer R.; Roland J.; Holger K. Learning Factory for Industry 4.0 to provide future skills beyond technical training, 8th Conference on Learning Factories - Advanced Engineering Education & Training for Manufacturing Innovation, 2018.
- Bashir, S.; Mustufa, H.A.; Syed, H.M.; Mohammed, K.; Hisham, A.; Ali, A. Virtual Reality-Based Engineering Education to Enhance Manufacturing Sustainability in Industry 4.0. Sustainability 2019, 11, 1477. [Google Scholar] [CrossRef]
- Ryalat, M.; El Moaqet, H.; Al Faouri, M. Design of a Smart Factory Based on Cyber-Physical Systems and Internet of Things towards Industry 4. 0. Appl. Sci. 2023, 13, 2156. [Google Scholar] [CrossRef]
- Nguyen, H.T.; Yu, G.-H.; Shin, N.-R.; Kwon, G.-J.; Kwak, W.-Y.; Kim, J.-Y. Defective Product Classification System for Smart Factory Based on Deep Learning. Electronics 2021, 10, 826. [Google Scholar] [CrossRef]
- Elbestawi, M.; Centea, D.; Singh, I.; Wanyama, T. SEPT learning factory for industry 4.0 education and applied research. Procedia manufacturing. 2018, 23, 249–254. [Google Scholar] [CrossRef]
- Schallock, B.; Rybski, C.; Jochem, R.; Kohl, H. Learning Factory for Industry 4.0 to provide future skills beyond technical training. Procedia manufacturing. 2018, 23, 27–32. [Google Scholar] [CrossRef]
- Lazarou, E.; Mustata, C.; Dragomirescu, C. Working and learning in industry 4.0 environments. U.P.B. Sci. Bull., Series D: Mechanical Engineering 2019, 81, 353–366. [Google Scholar]
- Ştirbu, L.; Belu, N. DOJO-a Japanese management method applied in the automotive industry. Quality-Access to Success 2008, 9. [Google Scholar]
- Barahona Mora, A. Gamification for classroom management: An implementation using classDojo. Sustainability. 2020, 12, 9371. [Google Scholar] [CrossRef]
- Robacker, C.M.; Rivera, C.J.; Warren, S.H. A token economy made easy through ClassDojo. Interv. Sch. Clin. 2016, 52, 39–43. [Google Scholar] [CrossRef]
- Williamson, B. Decoding ClassDojo: Psycho-policy, social-emotional learning and persuasive educational technologies. Learn. Media Technol. 2017, 42, 440–453. [Google Scholar] [CrossRef]
- Rivera, C.J. Using ClassDojo as a Mechanism to Engage and Foster Collaboration in University Classrooms. Coll. Teach. 2019, 67, 154–159. [Google Scholar] [CrossRef]
- Manolev, J.; Sullivan, A.; Slee, R. The datafication of discipline: ClassDojo, surveillance and a performative classroom culture. Learn. Media Technol. 2019, 44, 36–51. [Google Scholar] [CrossRef]
- Maclean-Blevins, A.; Muilenburg, L. Using Class Dojo to support student self-regulation. In Edmedia+ innovate learning; Association for the Advancement of Computing in Education (AACE), 2013; pp. 1684–1689. [Google Scholar]
- Krach, S.K.; McCreery, M.P.; Rimel, H. Examining teachers’ behavioural management charts: A comparison of Class Dojo and paper-pencil methods. Contemporary School Psychology 2017, 21, 267–275. [Google Scholar] [CrossRef]
- Barkley, E.F.; Cross, K.P.; Major, C.H. Collaborative learning techniques: A handbook for college faculty; Publisher: John Wiley & Sons, 2014. [Google Scholar]
- Purcărea, A.; Albulescu, S.; Negoiță, O.D.; Dănălache, F.; Corocăescu, M. Modeling the human resource development process in the automotive industry services, U. P.B. Sci. Bull., Series D: Mechanical Engineering 2016, 78, 263–275. [Google Scholar]
- Pitariu, H.D. Human resources management: Evaluation of professional performances (in romanian), 2nd ed.; Publisher: All Back: Bucharest, Romania, 2000. [Google Scholar]
- Nitu, E. L.; Gavriluta, A. C. Lean Learning Factory at the University of Pitesti. In Modern Technologies in Industrial Engineering VII, 2019, Vol. 591, 012095.
- Muther, R.; Hales, L. Workplace Layout. In Systematic Layout Planning, 4th ed.; Richard Muther & Associates, Ed.; Publisher: Management & Industrial Research Publications: Marietta, USA, 2015; pp. 12-4–12-11. [Google Scholar]
- Colim, A.; Faria, C.; Braga, A.C.; Sousa, N.; Rocha, L.; Carneiro, P.; Costa, N.; Arezes, P. Towards an Ergonomic Assessment Framework for Industrial Assembly Workstations—A Case Study. Appl. Sci. 2020, 10, 3048. [Google Scholar] [CrossRef]
- Turk, M.; Šimic, M.; Pipan, M.; Herakovič, N. Multi-Criterial Algorithm for the Efficient and Ergonomic Manual Assembly Process. Int. J. Environ. Res. Public Health 2022, 19, 3496. [Google Scholar] [CrossRef] [PubMed]
- Carey, P.; Farrel. J.; Sullivan, B. Heyde's MODAPTS. Heyde Dynamics Pty. Ltd: 2001.
- Arezes, P.M.; Dinis-Carvalho, J.; Alves, A.C. Workplace Ergonomics in Lean Production Environments: A Literature Review. Work 2015, 52, 57–70. [Google Scholar] [CrossRef]
- Botti, L.; Mora, C.; Regattieri, A. Integrating Ergonomics and Lean Manufacturing Principles in a Hybrid Assembly Line. Comput. Ind. Eng. 2017, 111, 481–491. [Google Scholar] [CrossRef]
- Gavriluţă, A.C.; Niţu, E.; Belu, N.; Anghel, D.; Neacşu, C.; Pascu, I. Lean manufacturing methodology for improving production flows on an assembly line. Proceedings of the 7th RMEE International Management Conference, 52-65.
- Allen, T.T. Regression. In Introduction to Engineering Statistics and Lean Sigma: Statistical Quality Control and Design of Experiments and Systems, 2nd ed.; Publisher: Springer-Verlag: London, UK, 2010; pp. 373–408. [Google Scholar]
- Myers, R.; Montgomery, D.; Anderson-Cook, C. Building Empirical Models. In Response Surface Methodology: Process and product optimization using designed experiments, 4th ed.; Balding, D., Cressie, N., Fitzmaurice, G., Givens, G., Goldstein, H., Molenberghs, G., David W. Scott, D., Smith, A., Tsay, R., Weisberg, S., Eds.; Publisher: John Wiley & Sons Inc.: New Jersey, USA, 2016; pp. 13–46. [Google Scholar]
Figure 1.
The assembly operation elements.
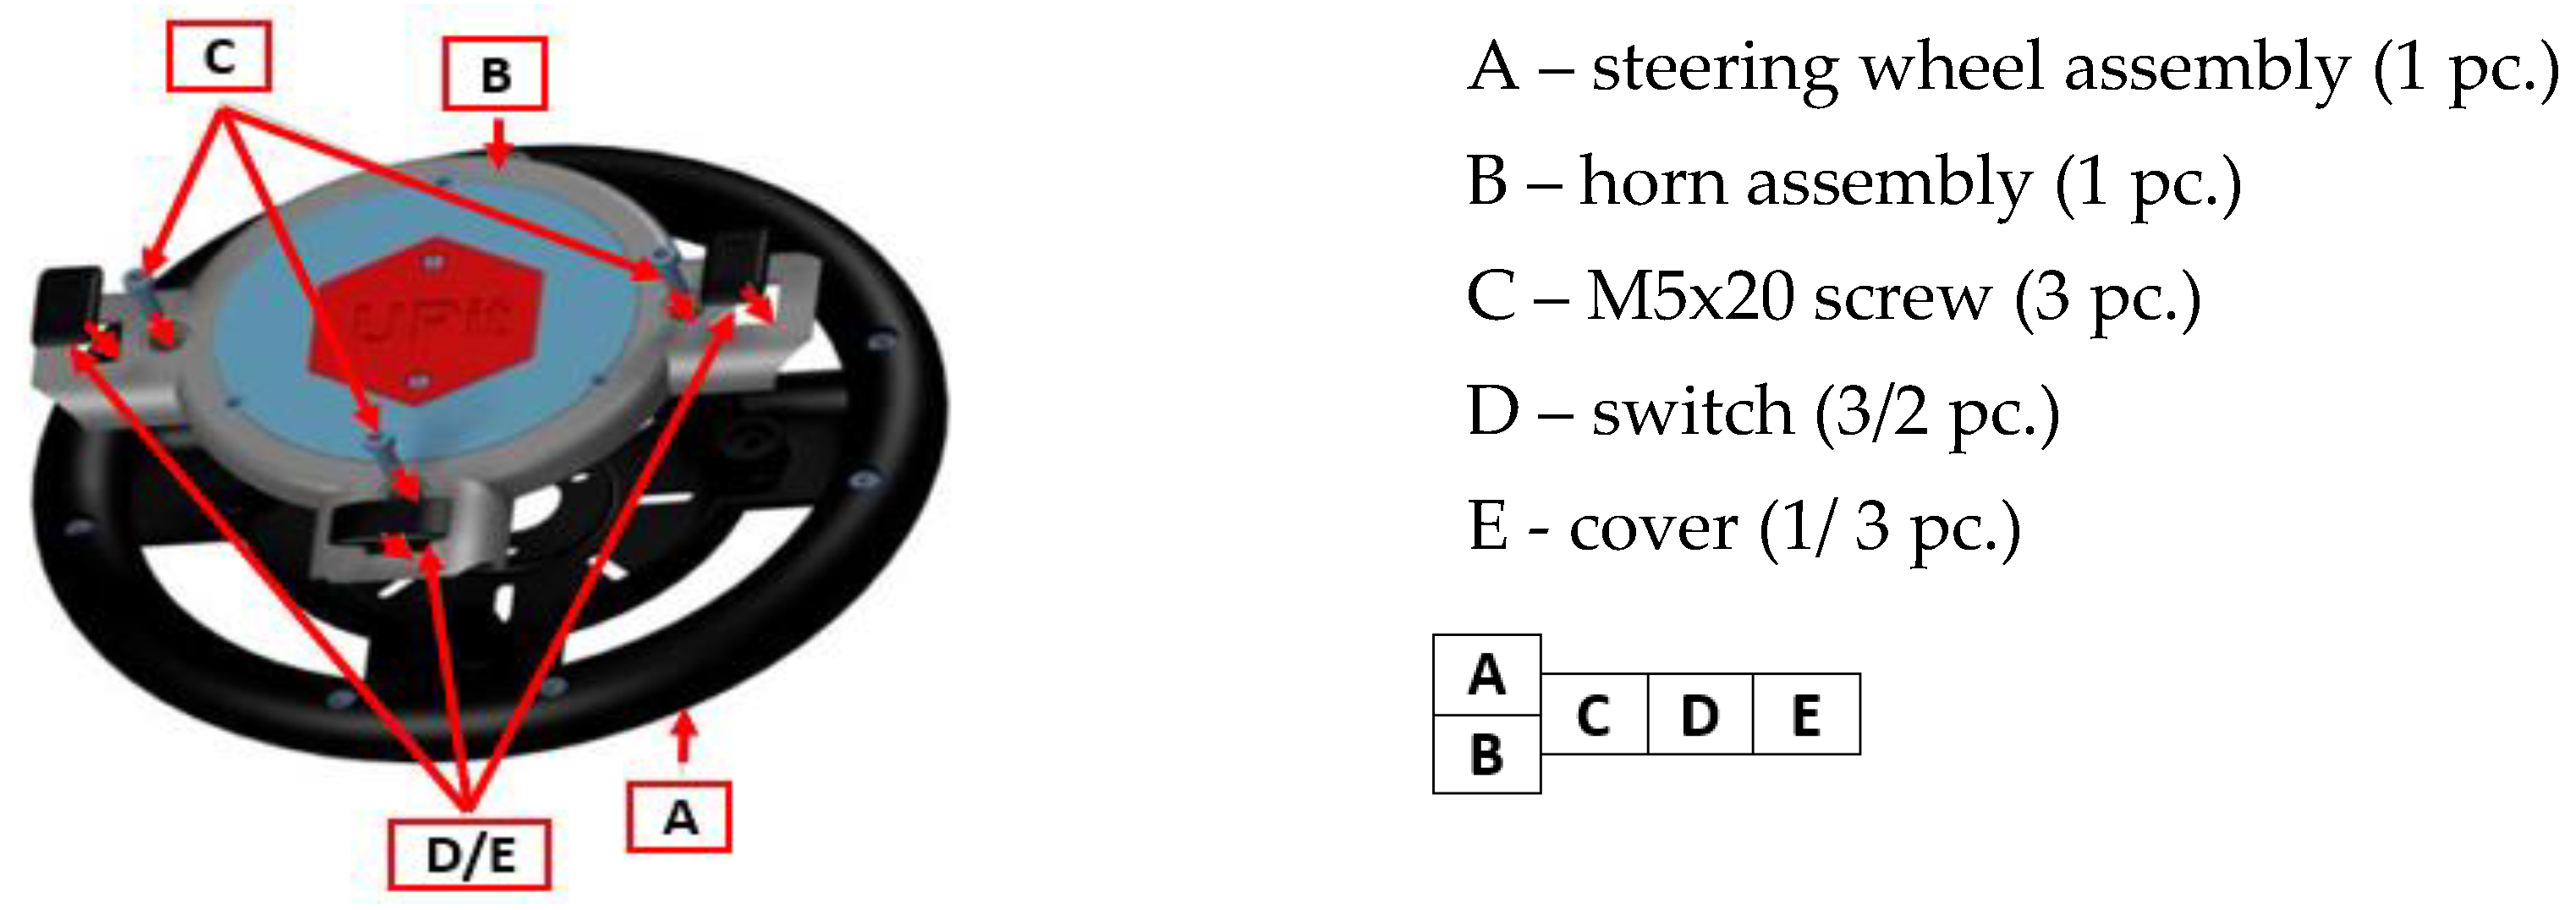
Figure 2.
The workstations used during the experimentation: (a) classic workstation; (b) digitalized workstation.
Figure 2.
The workstations used during the experimentation: (a) classic workstation; (b) digitalized workstation.
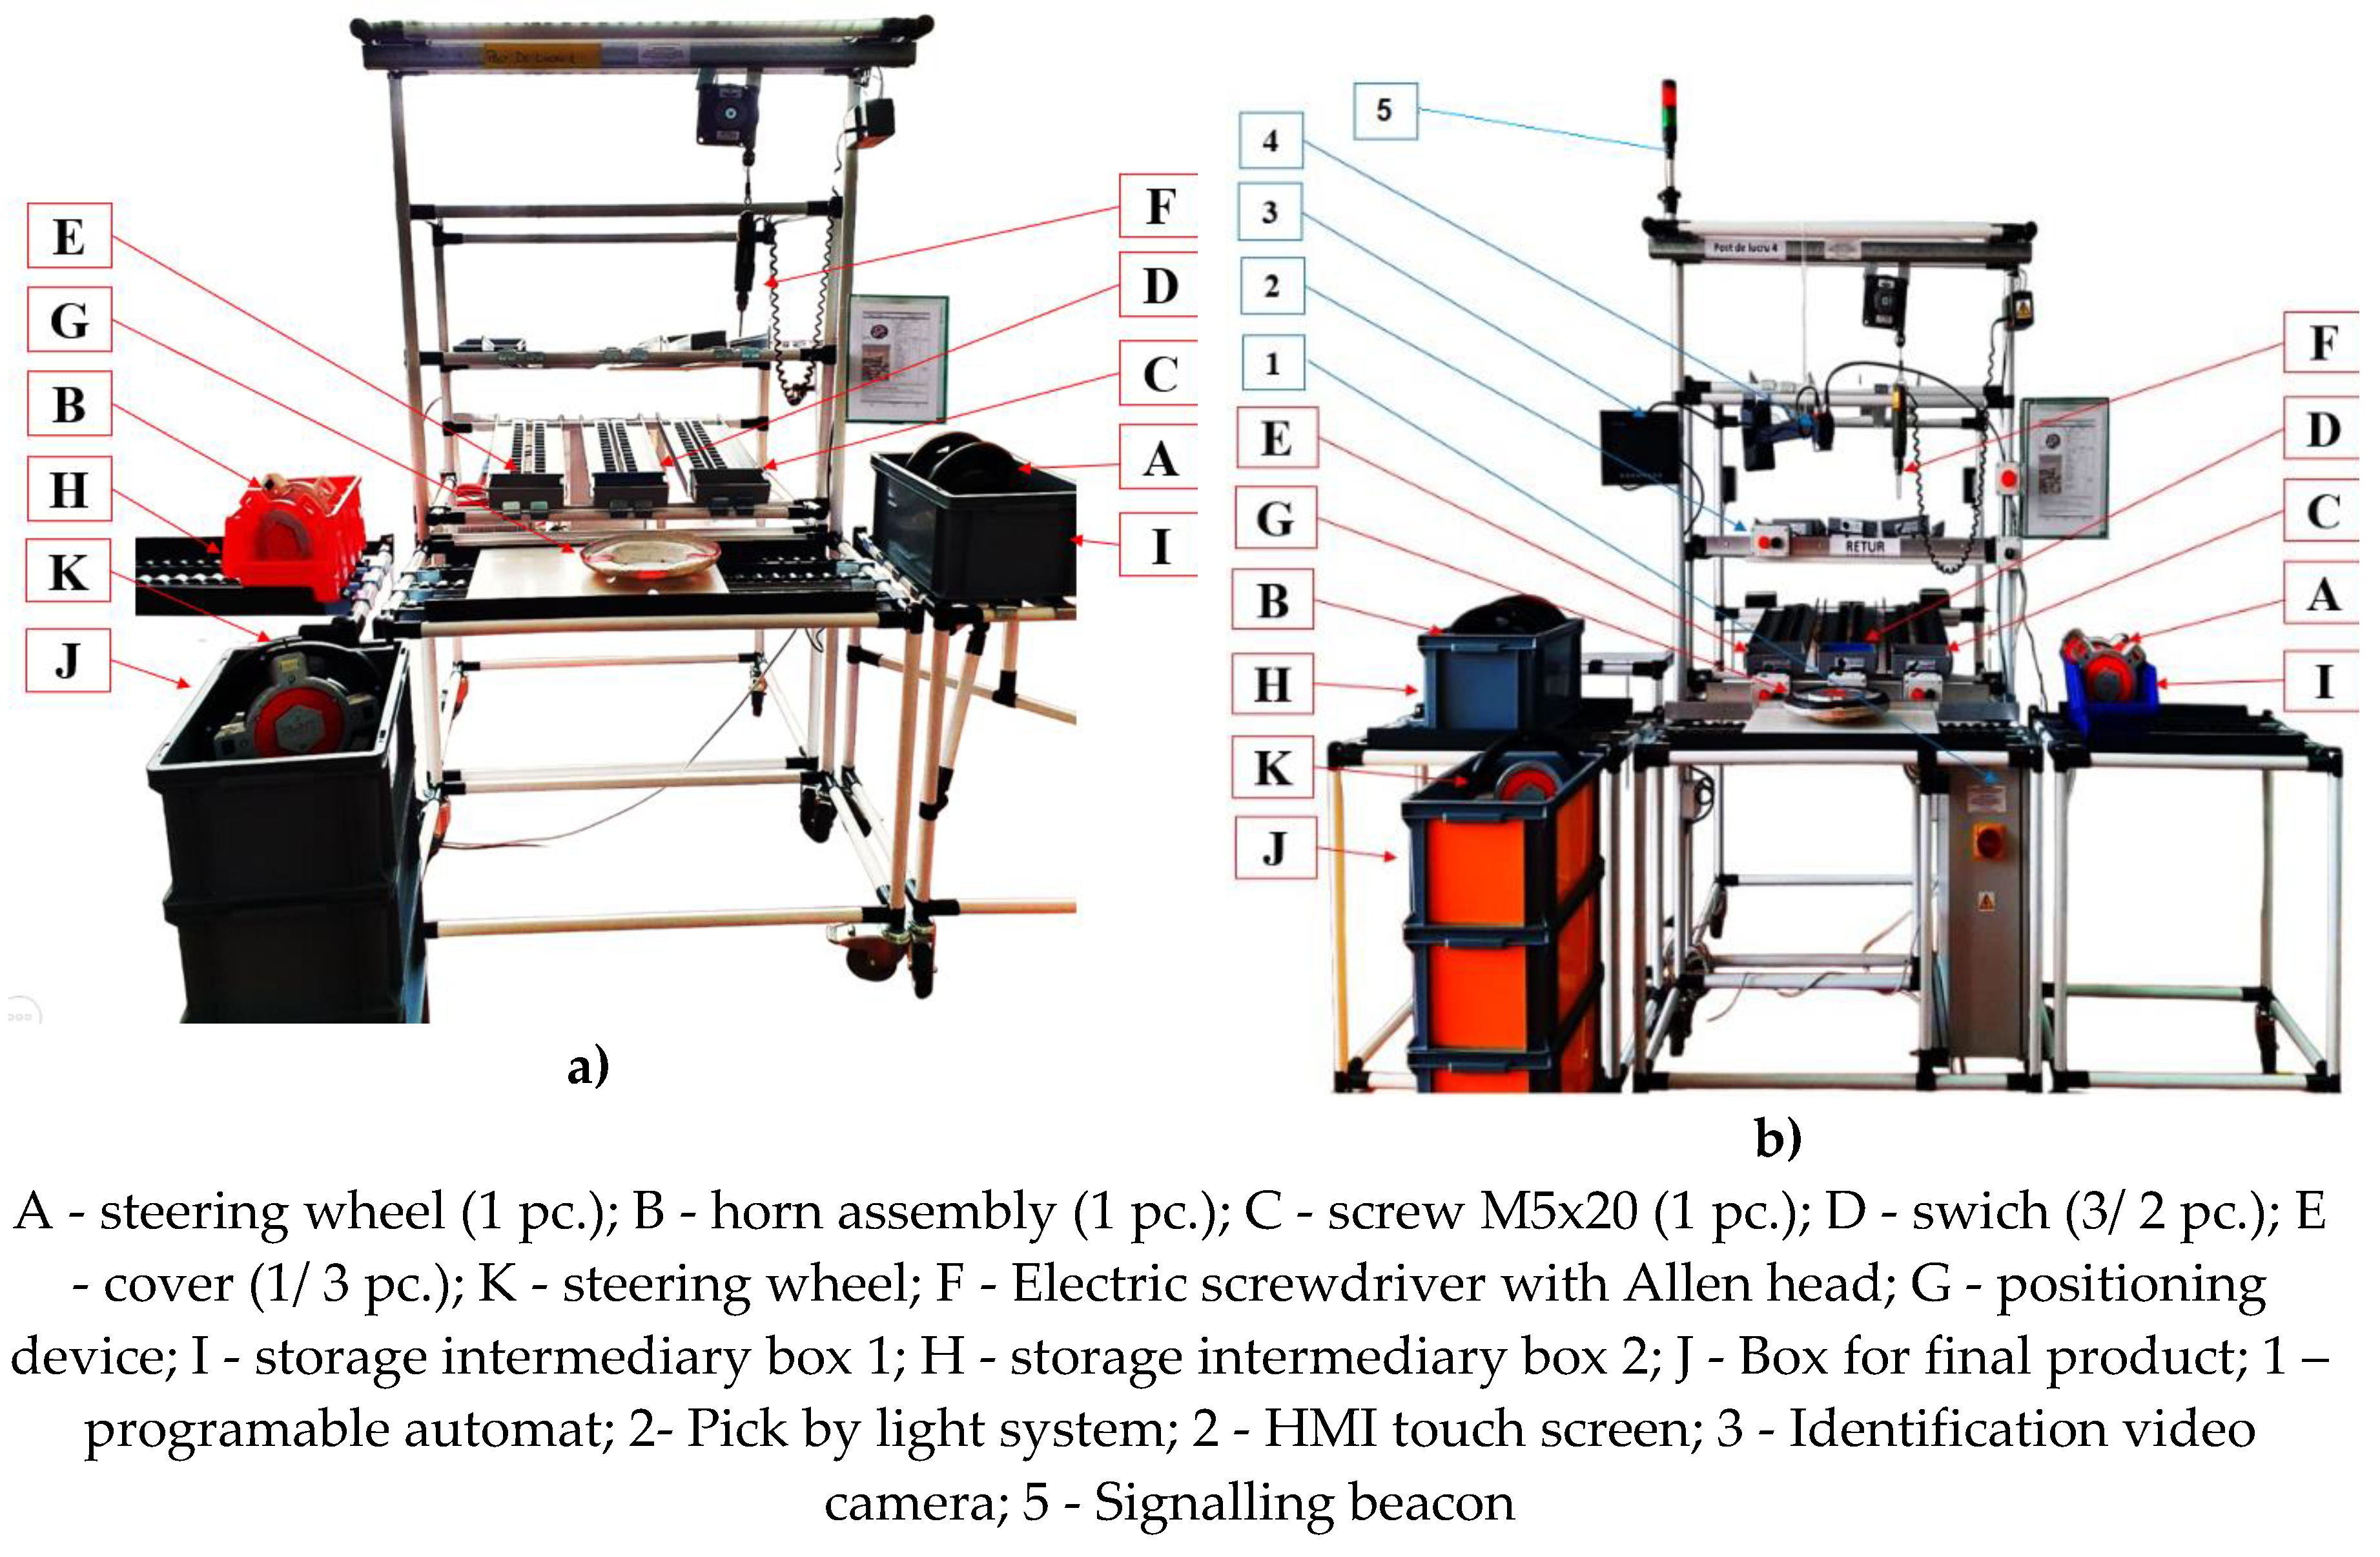
Figure 3.
DOJO methodology.
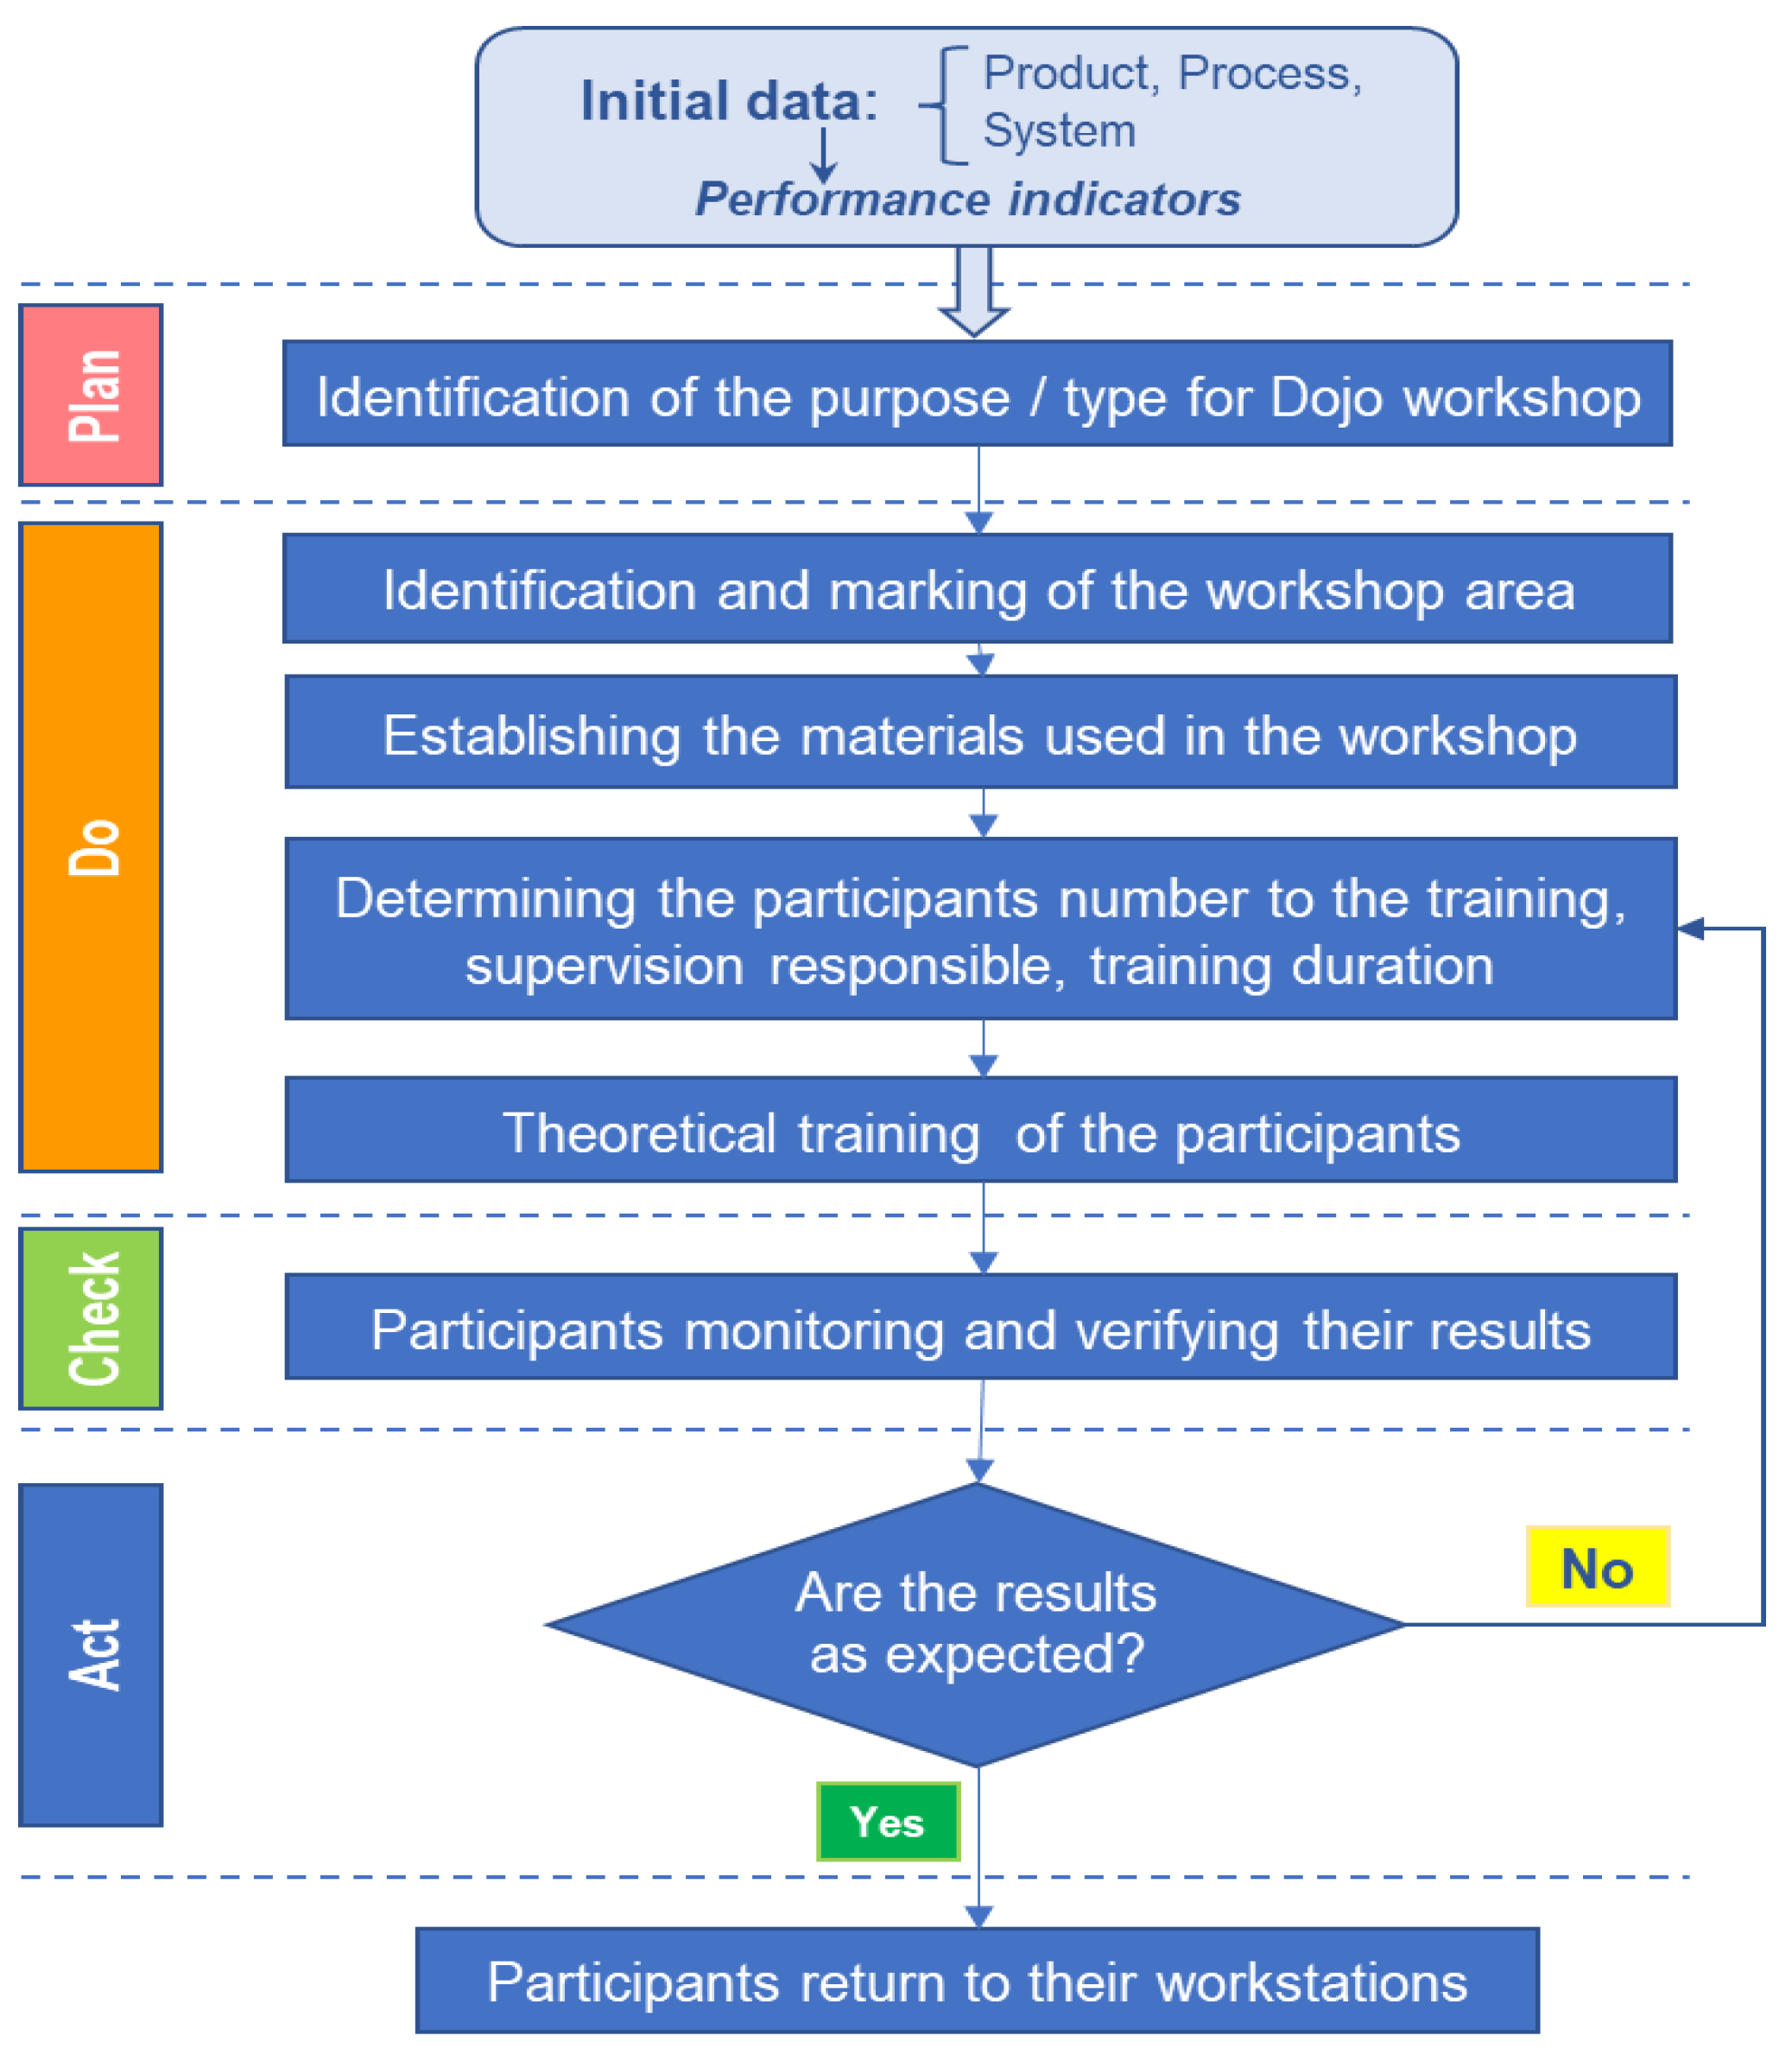
Figure 4.
Observation sheet of the labour process.
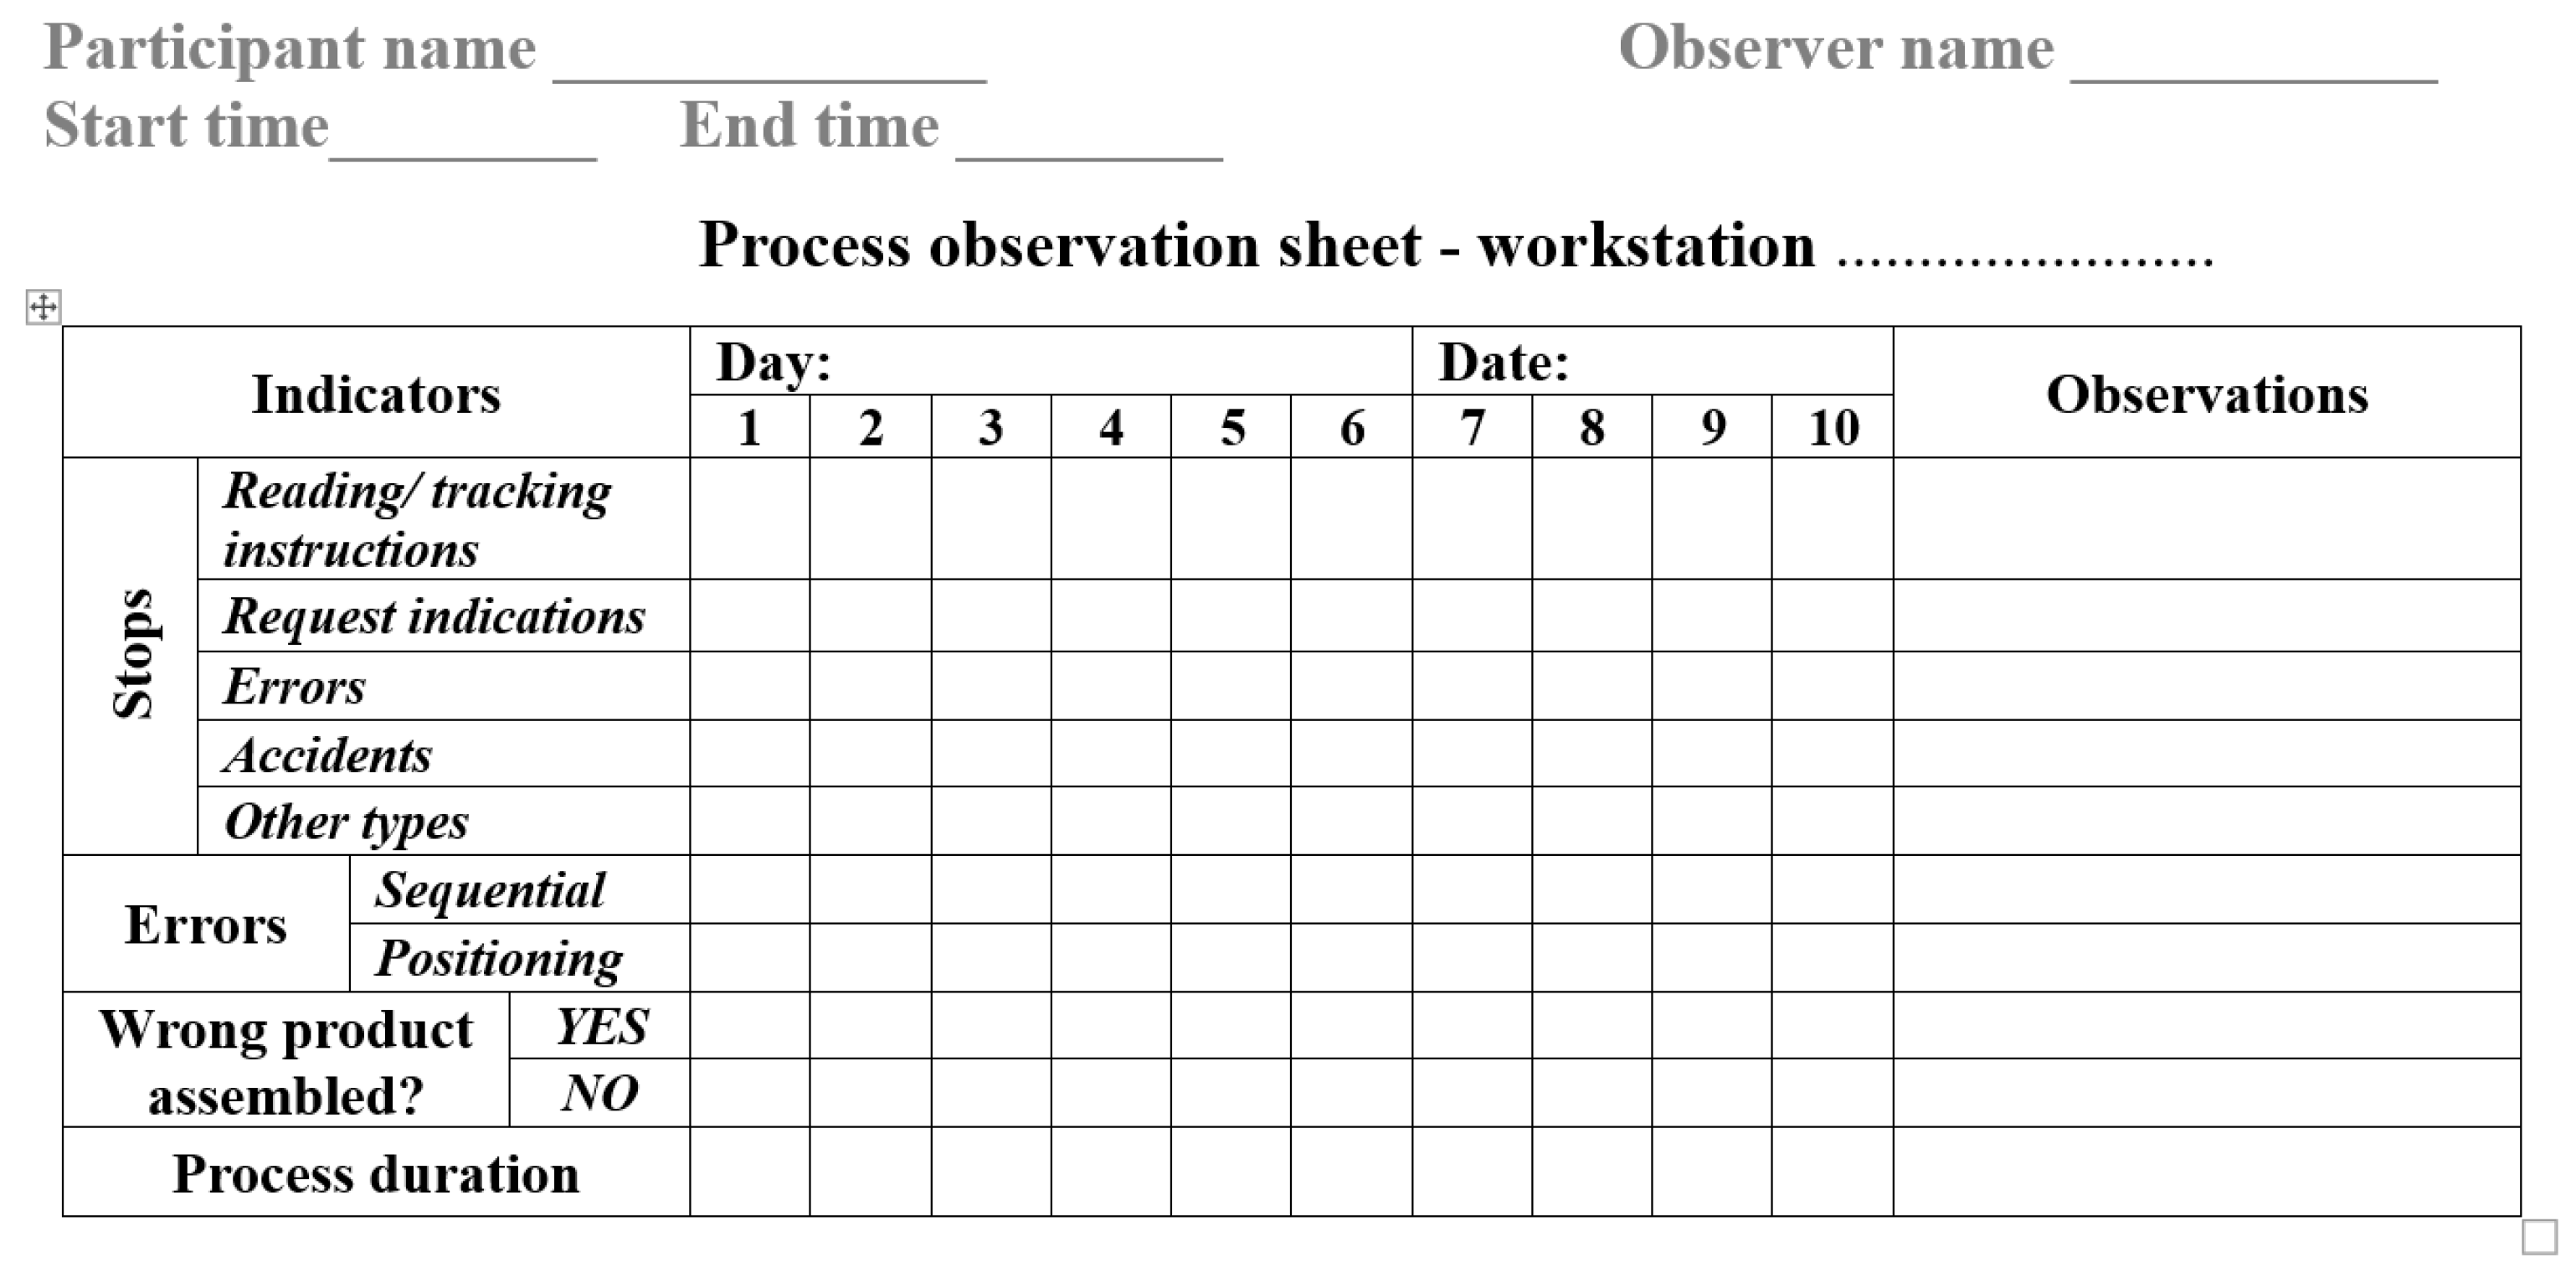
Figure 5.
The evolution of the average number of errors in the classic workstation: (a) representation on experimentation days; (b) process function average number of errors, Ne_CWs.
Figure 5.
The evolution of the average number of errors in the classic workstation: (a) representation on experimentation days; (b) process function average number of errors, Ne_CWs.
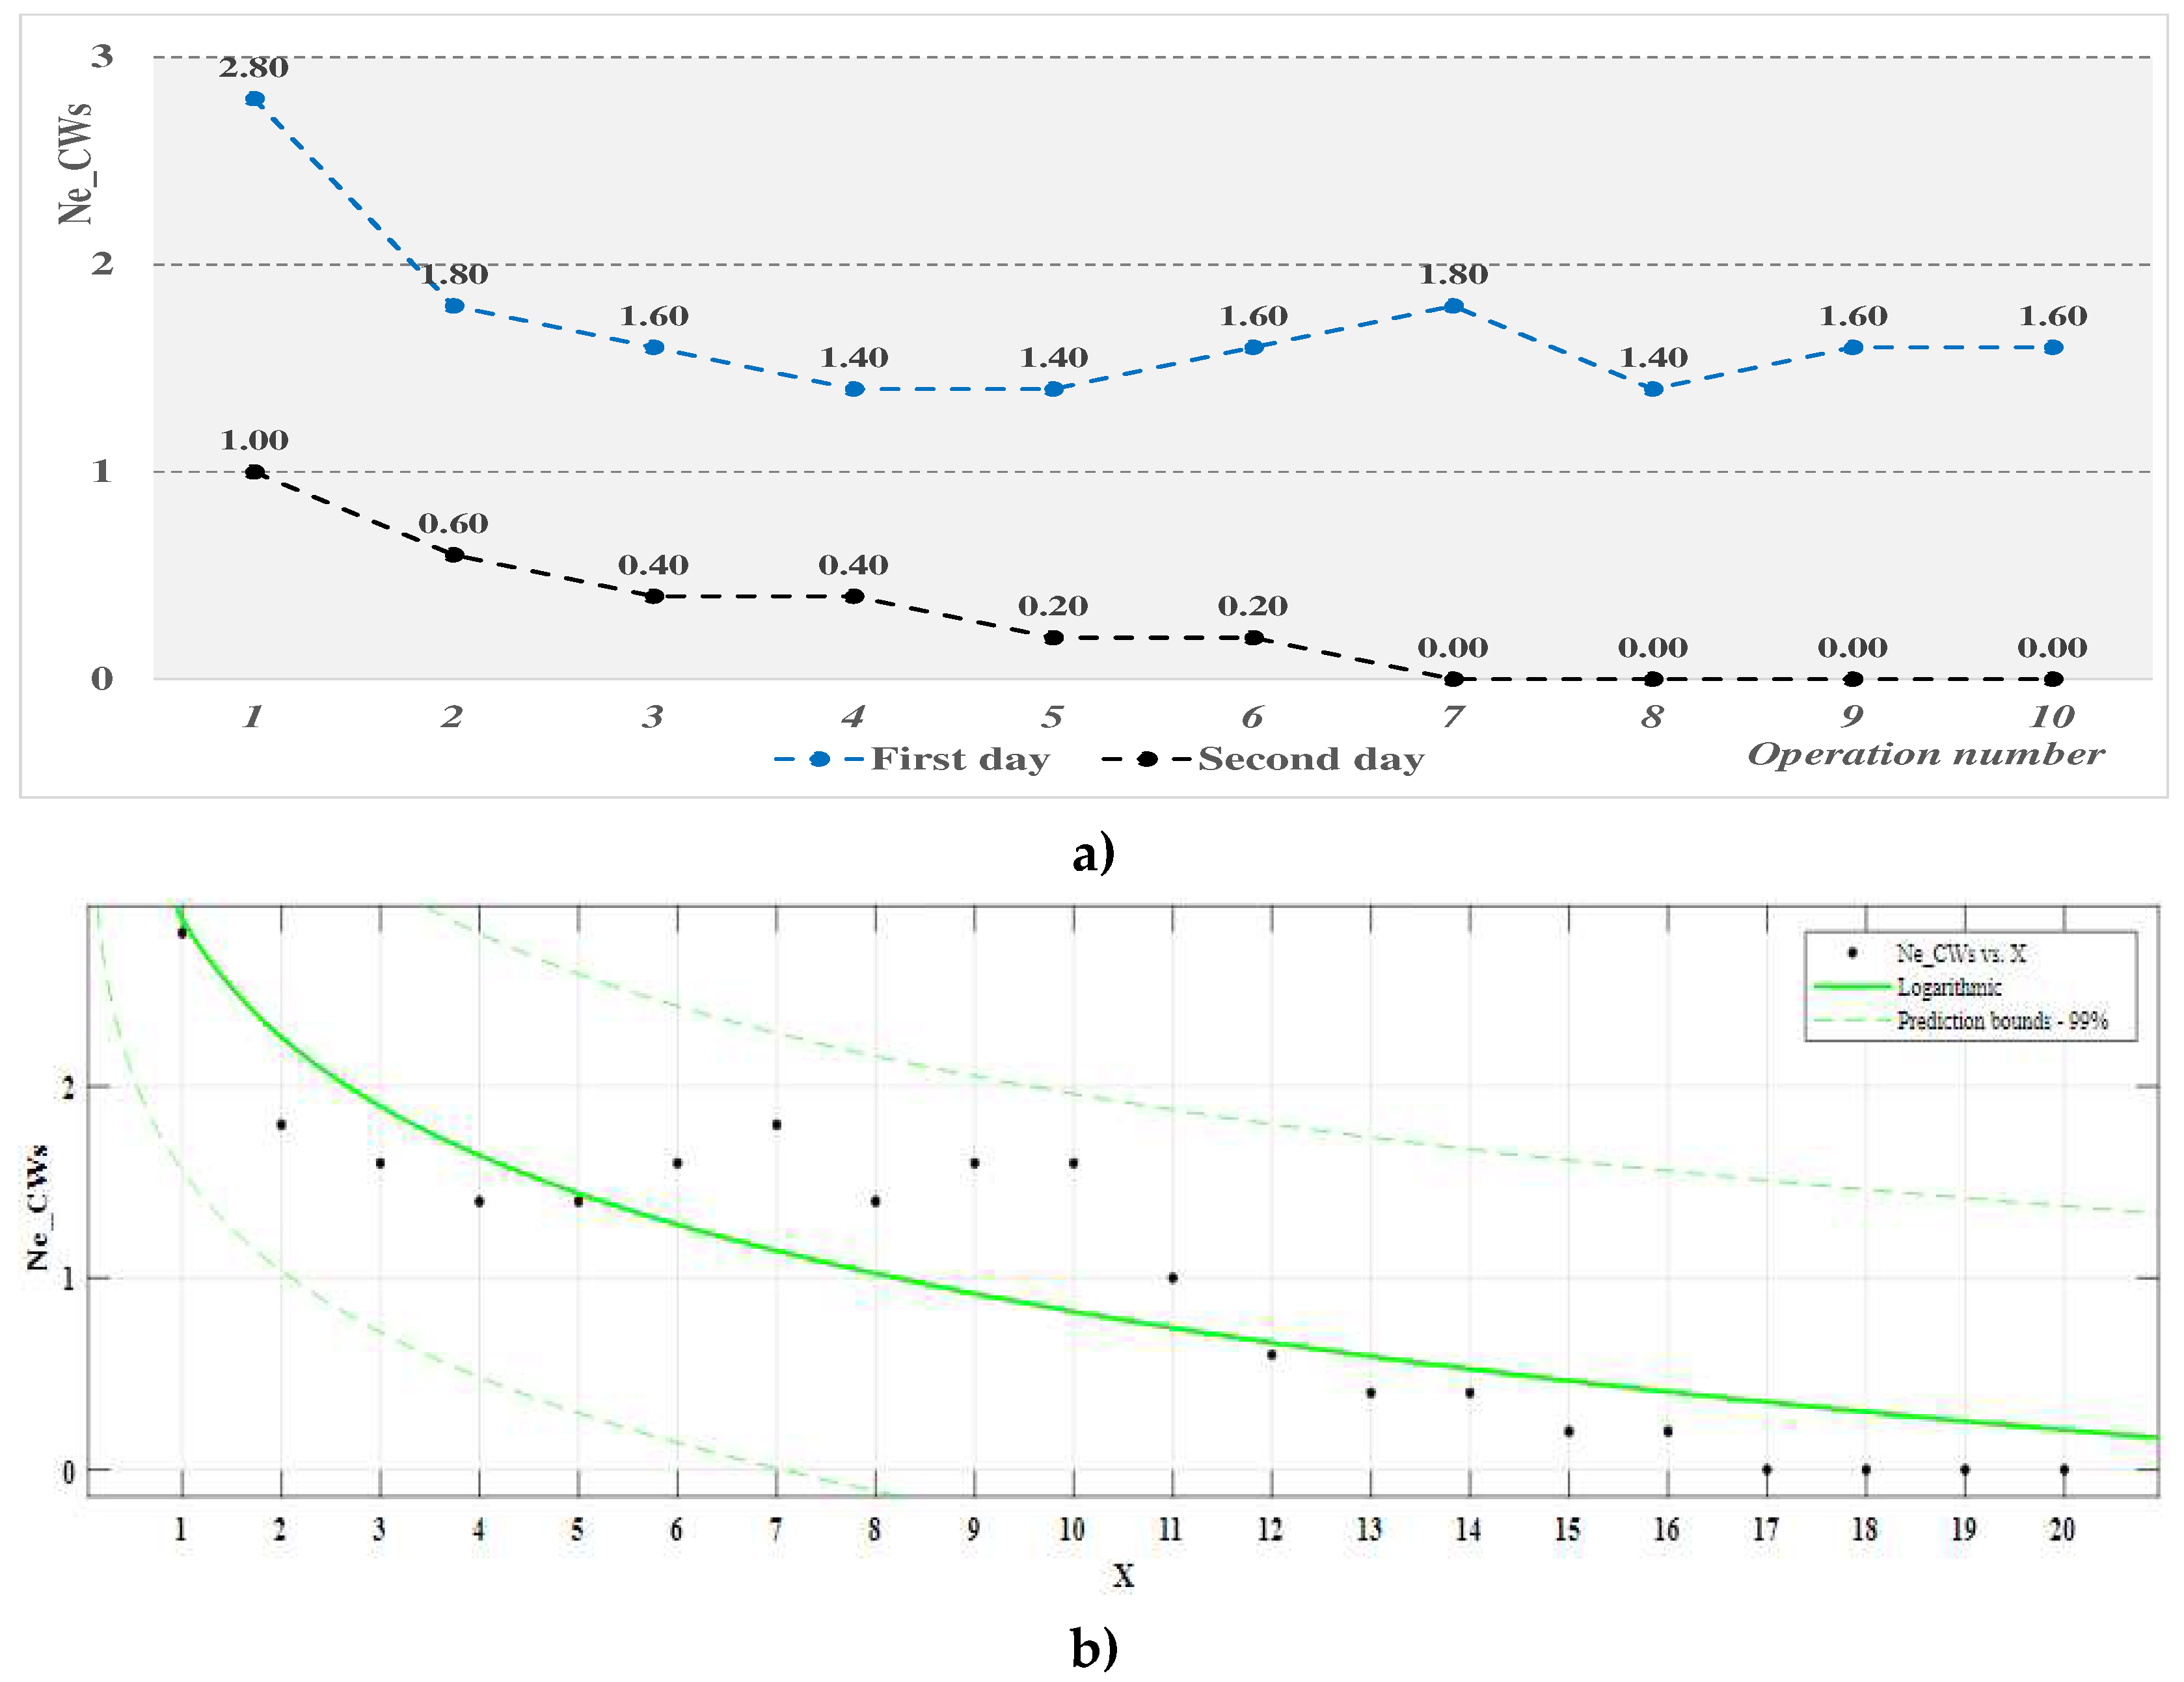
Figure 6.
The evolution of the average number of errors in the digitalized workstation: (a) representation on experimentation days; (b) process function average number of errors, Ne_DWs.
Figure 6.
The evolution of the average number of errors in the digitalized workstation: (a) representation on experimentation days; (b) process function average number of errors, Ne_DWs.
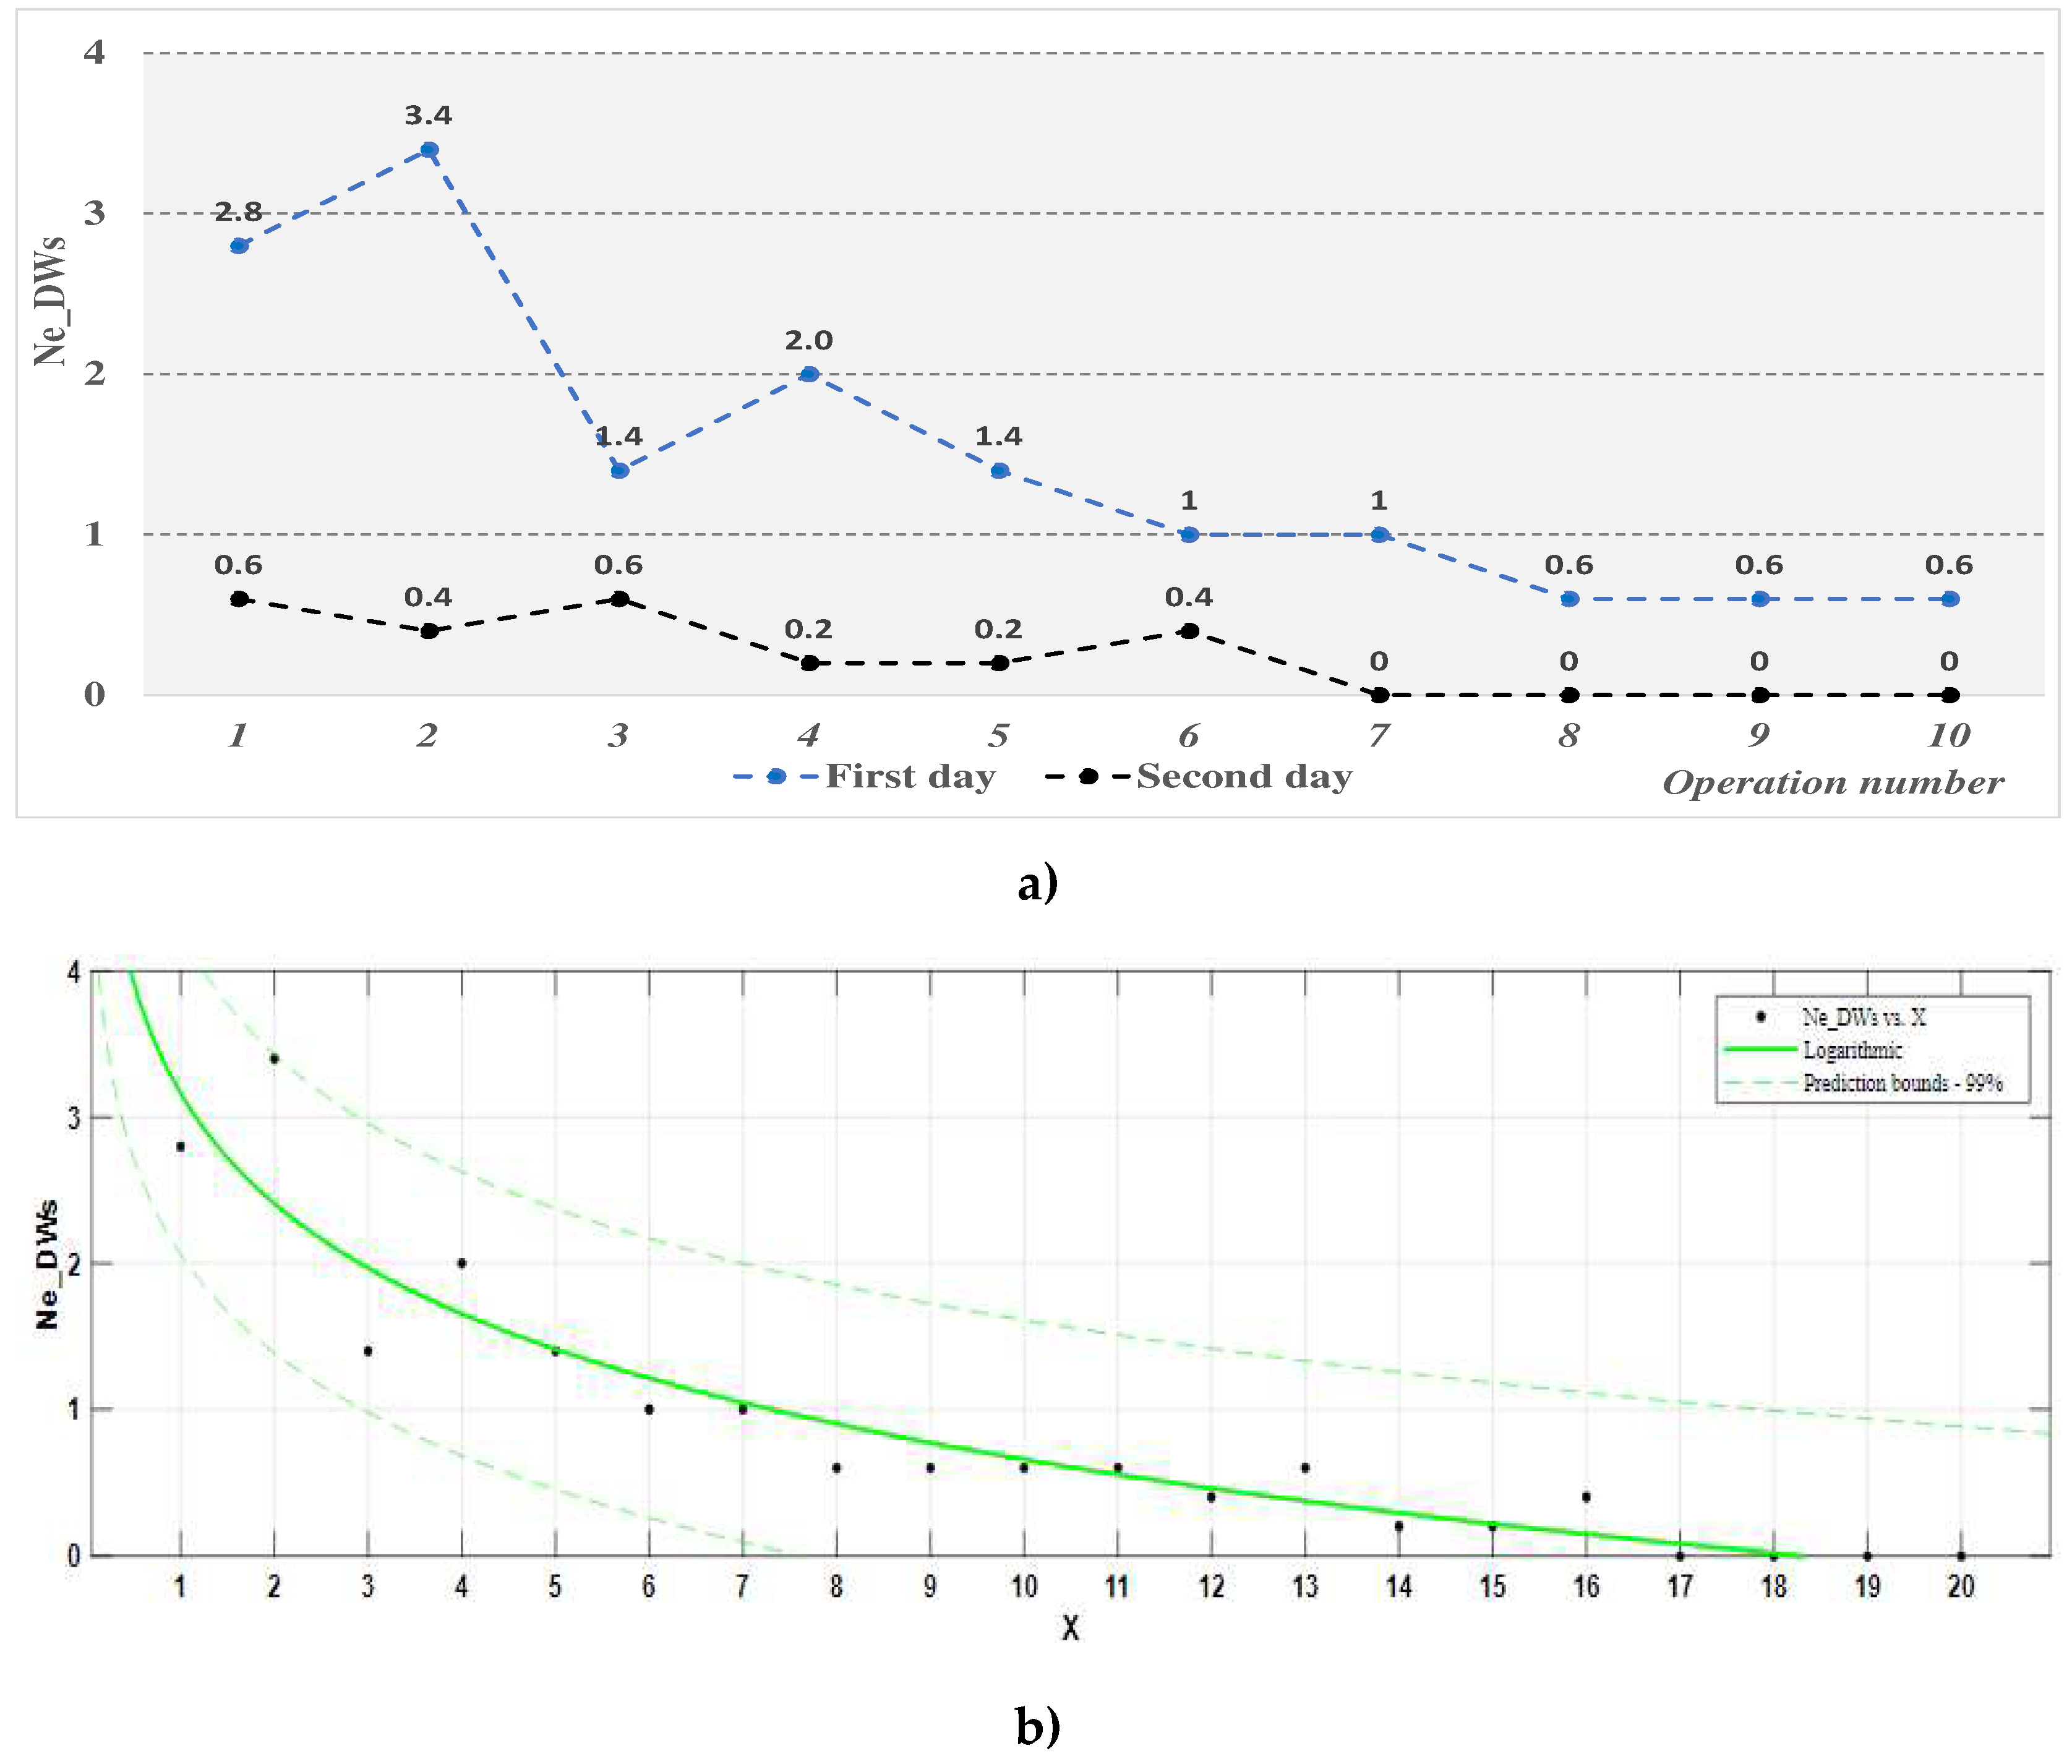
Figure 7.
The evolution of the average number of stops within the classic workstation: (a) representation on experimentation days; (b) process function average number of stops, Ns_CWs.
Figure 7.
The evolution of the average number of stops within the classic workstation: (a) representation on experimentation days; (b) process function average number of stops, Ns_CWs.
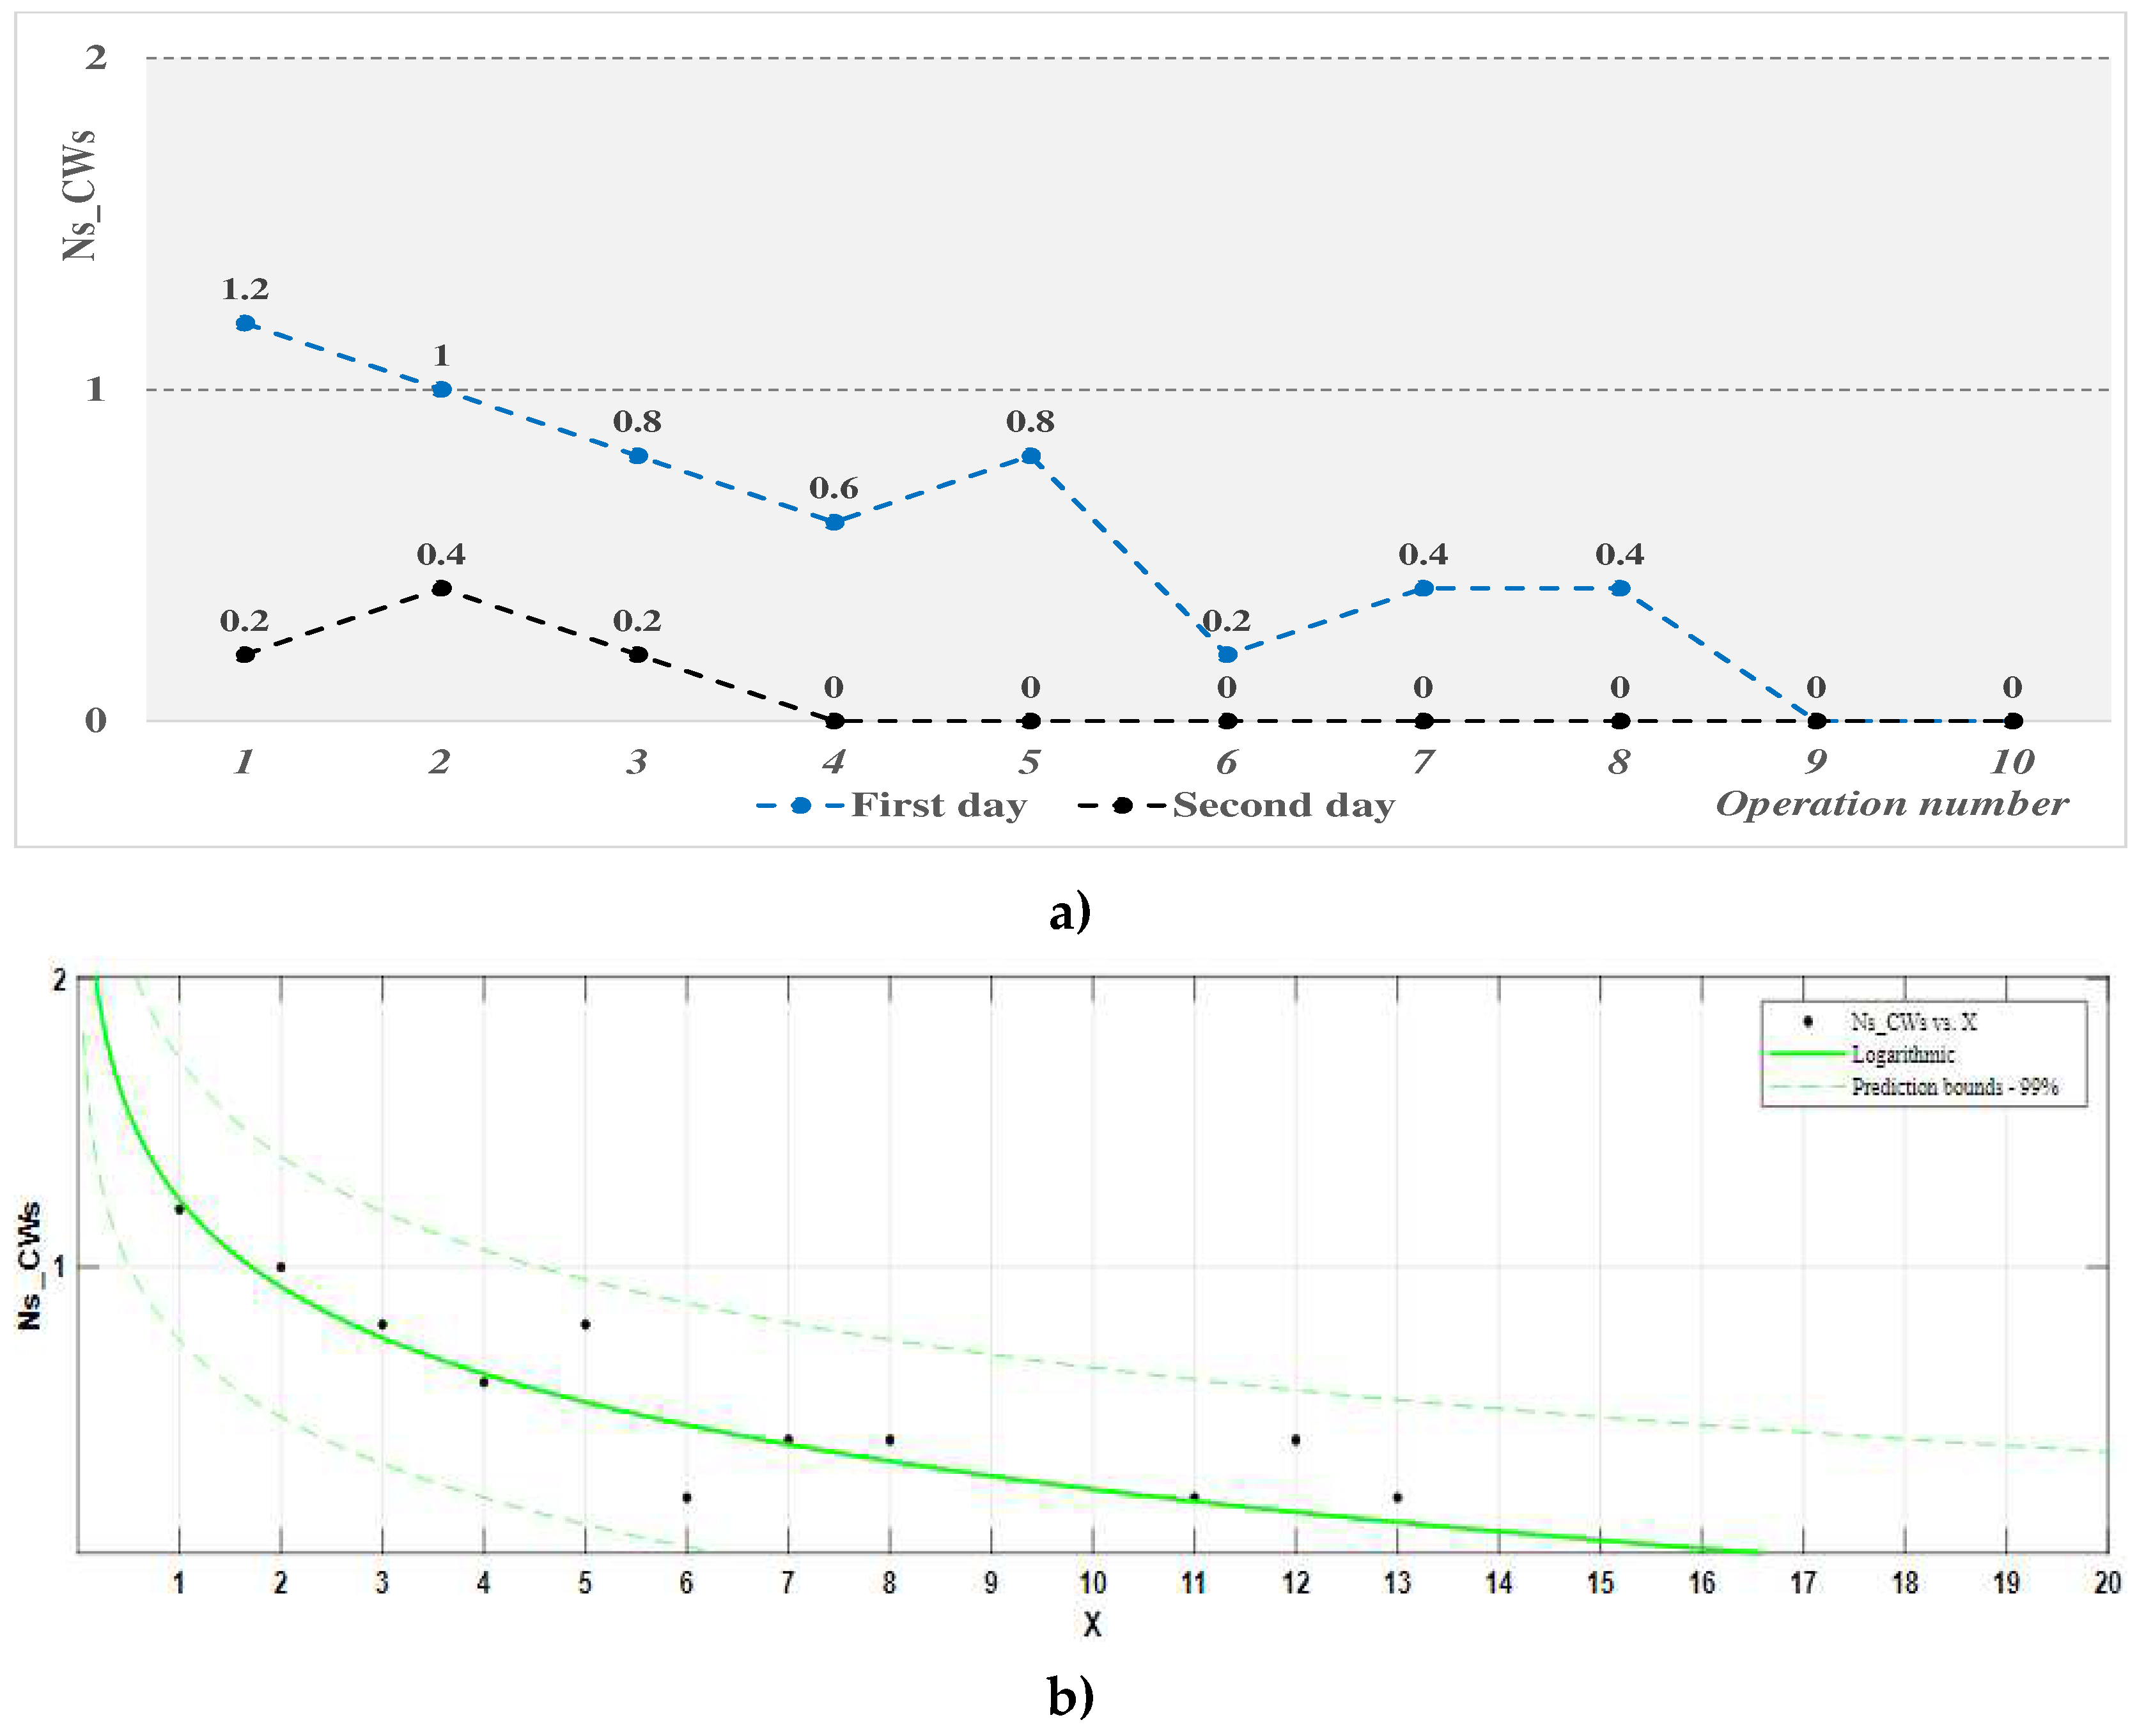
Figure 8.
The evolution of the average number of stops within the digitalized workstation: (a) representation on experimentation days; (b) process function average number of stops, Ns_DWs.
Figure 8.
The evolution of the average number of stops within the digitalized workstation: (a) representation on experimentation days; (b) process function average number of stops, Ns_DWs.
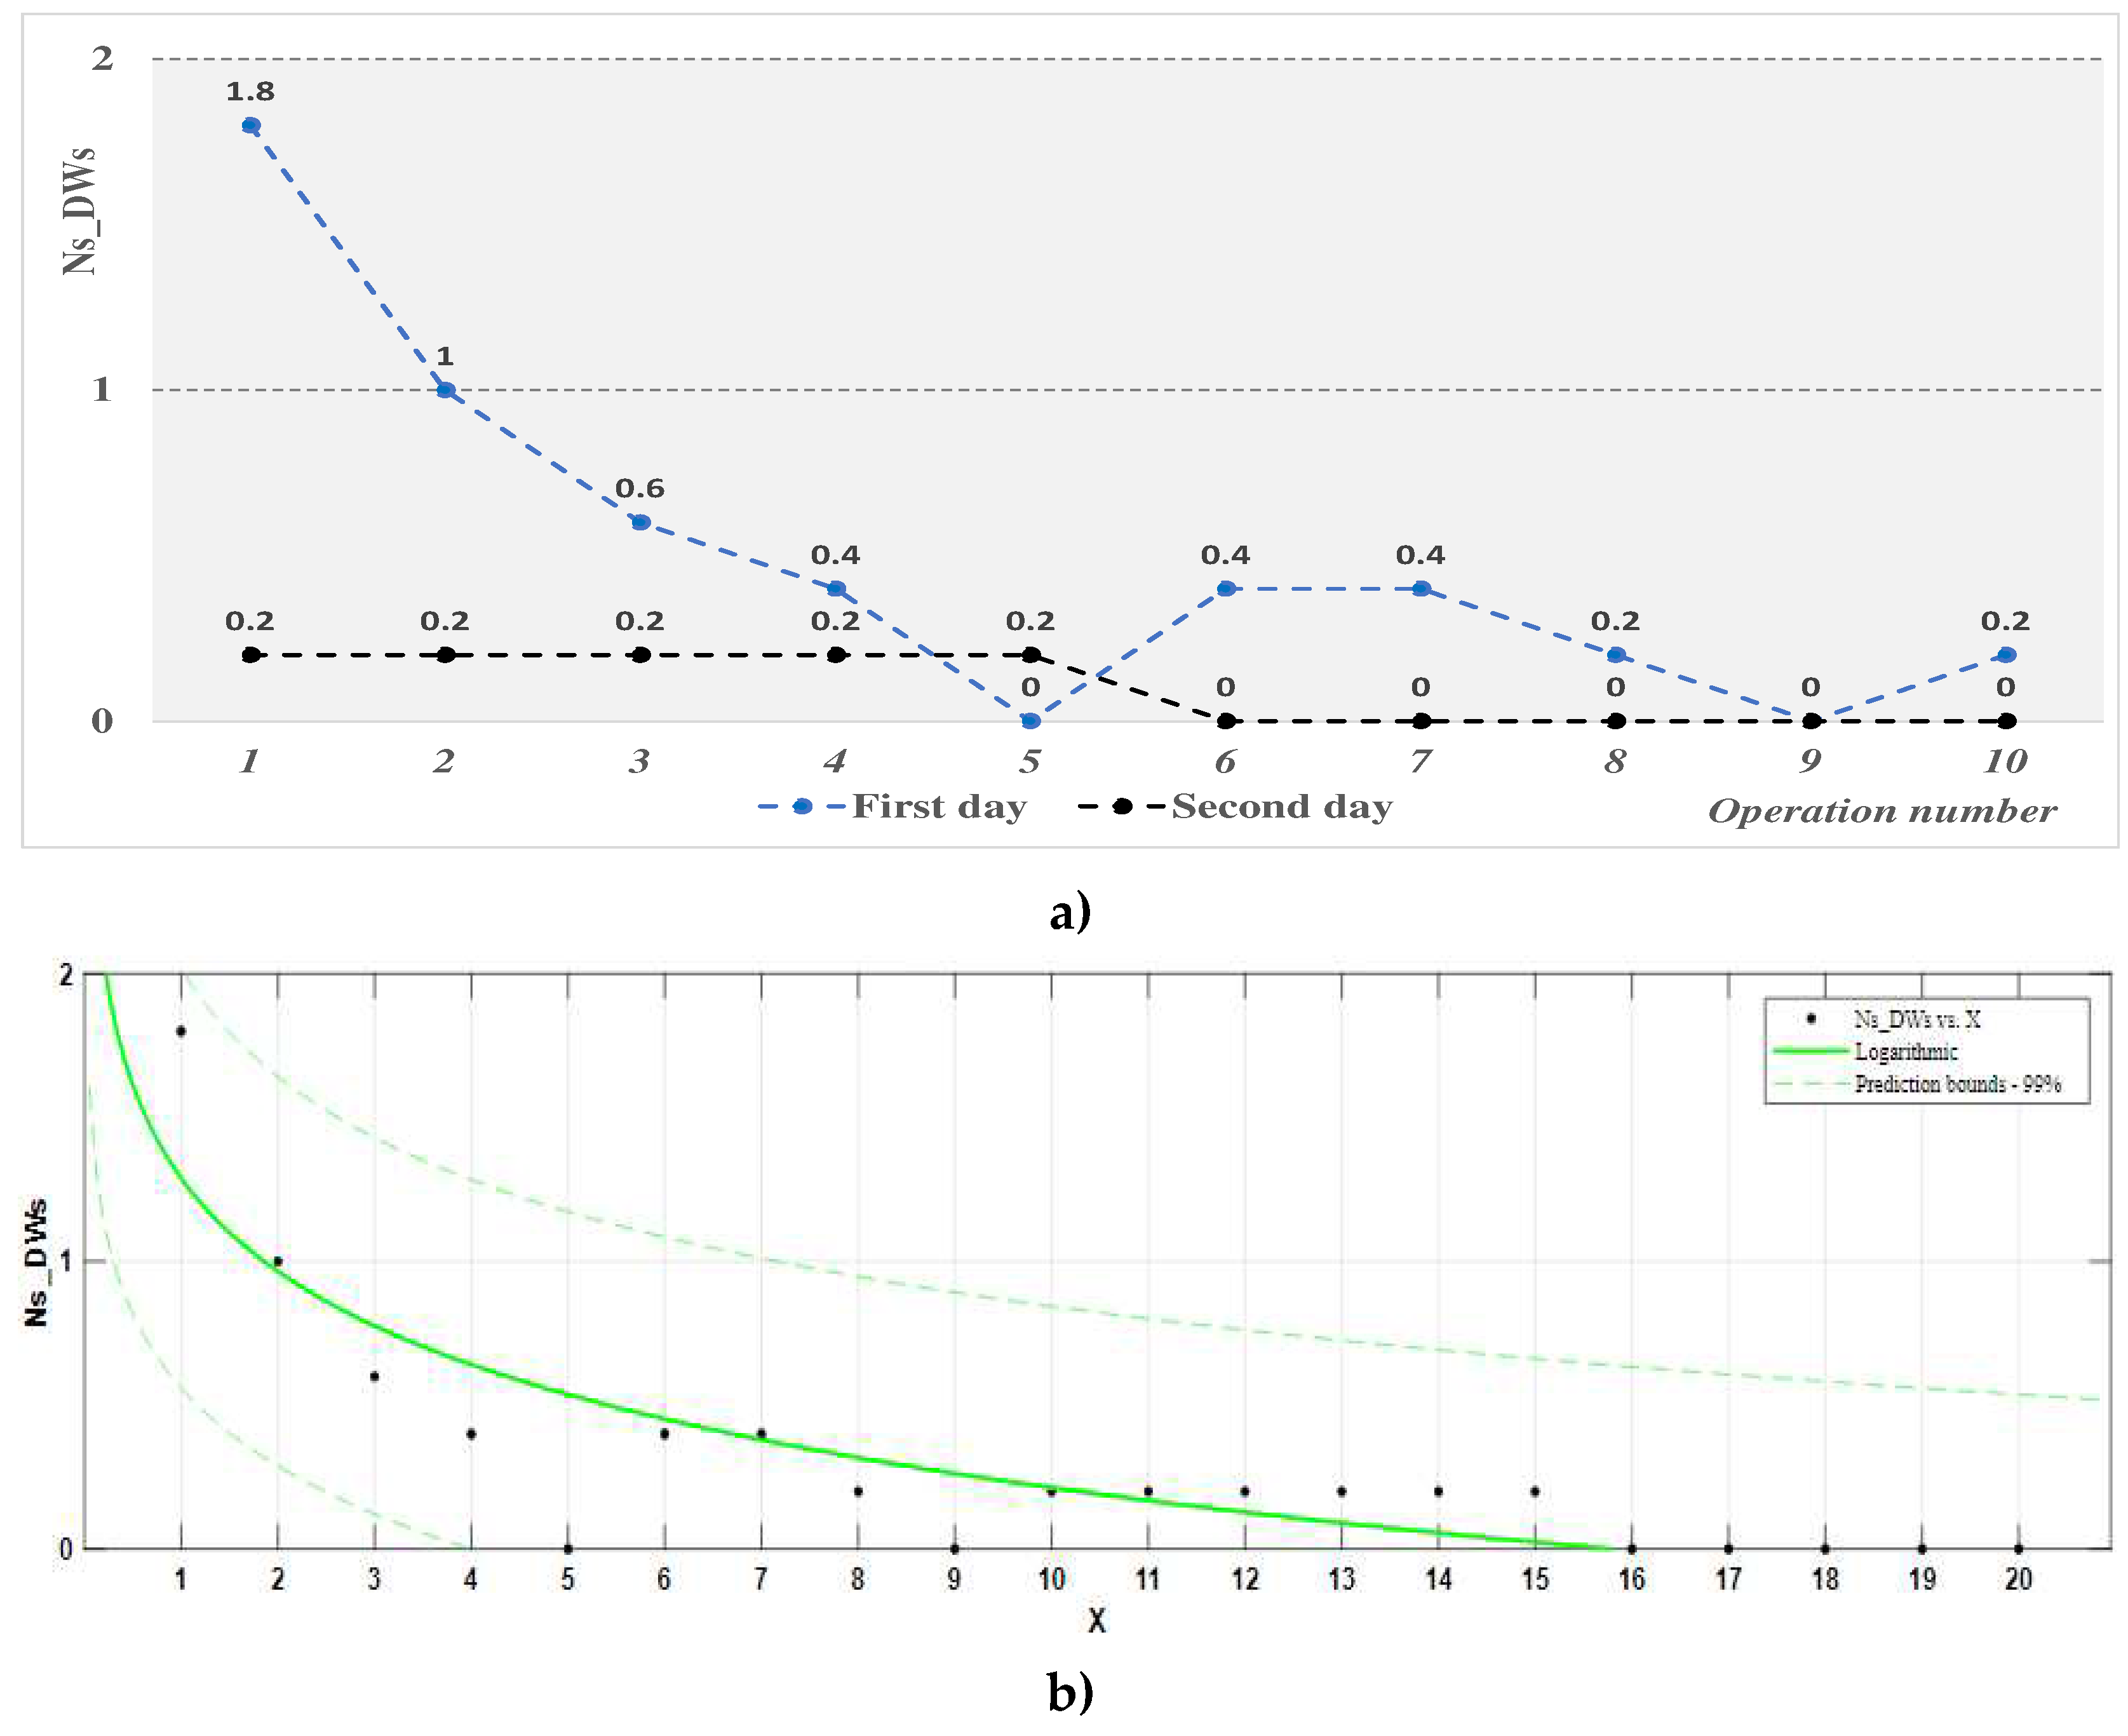
Figure 9.
The evolution of the effective average duration of the work cycle in the classical workstation: (a) representation on experimentation days; (b) logarithmic process function, the effective average duration of the work cycle, Tec_CWs; (c) power process function, the effective average duration of the work cycle, Tec_CWs.
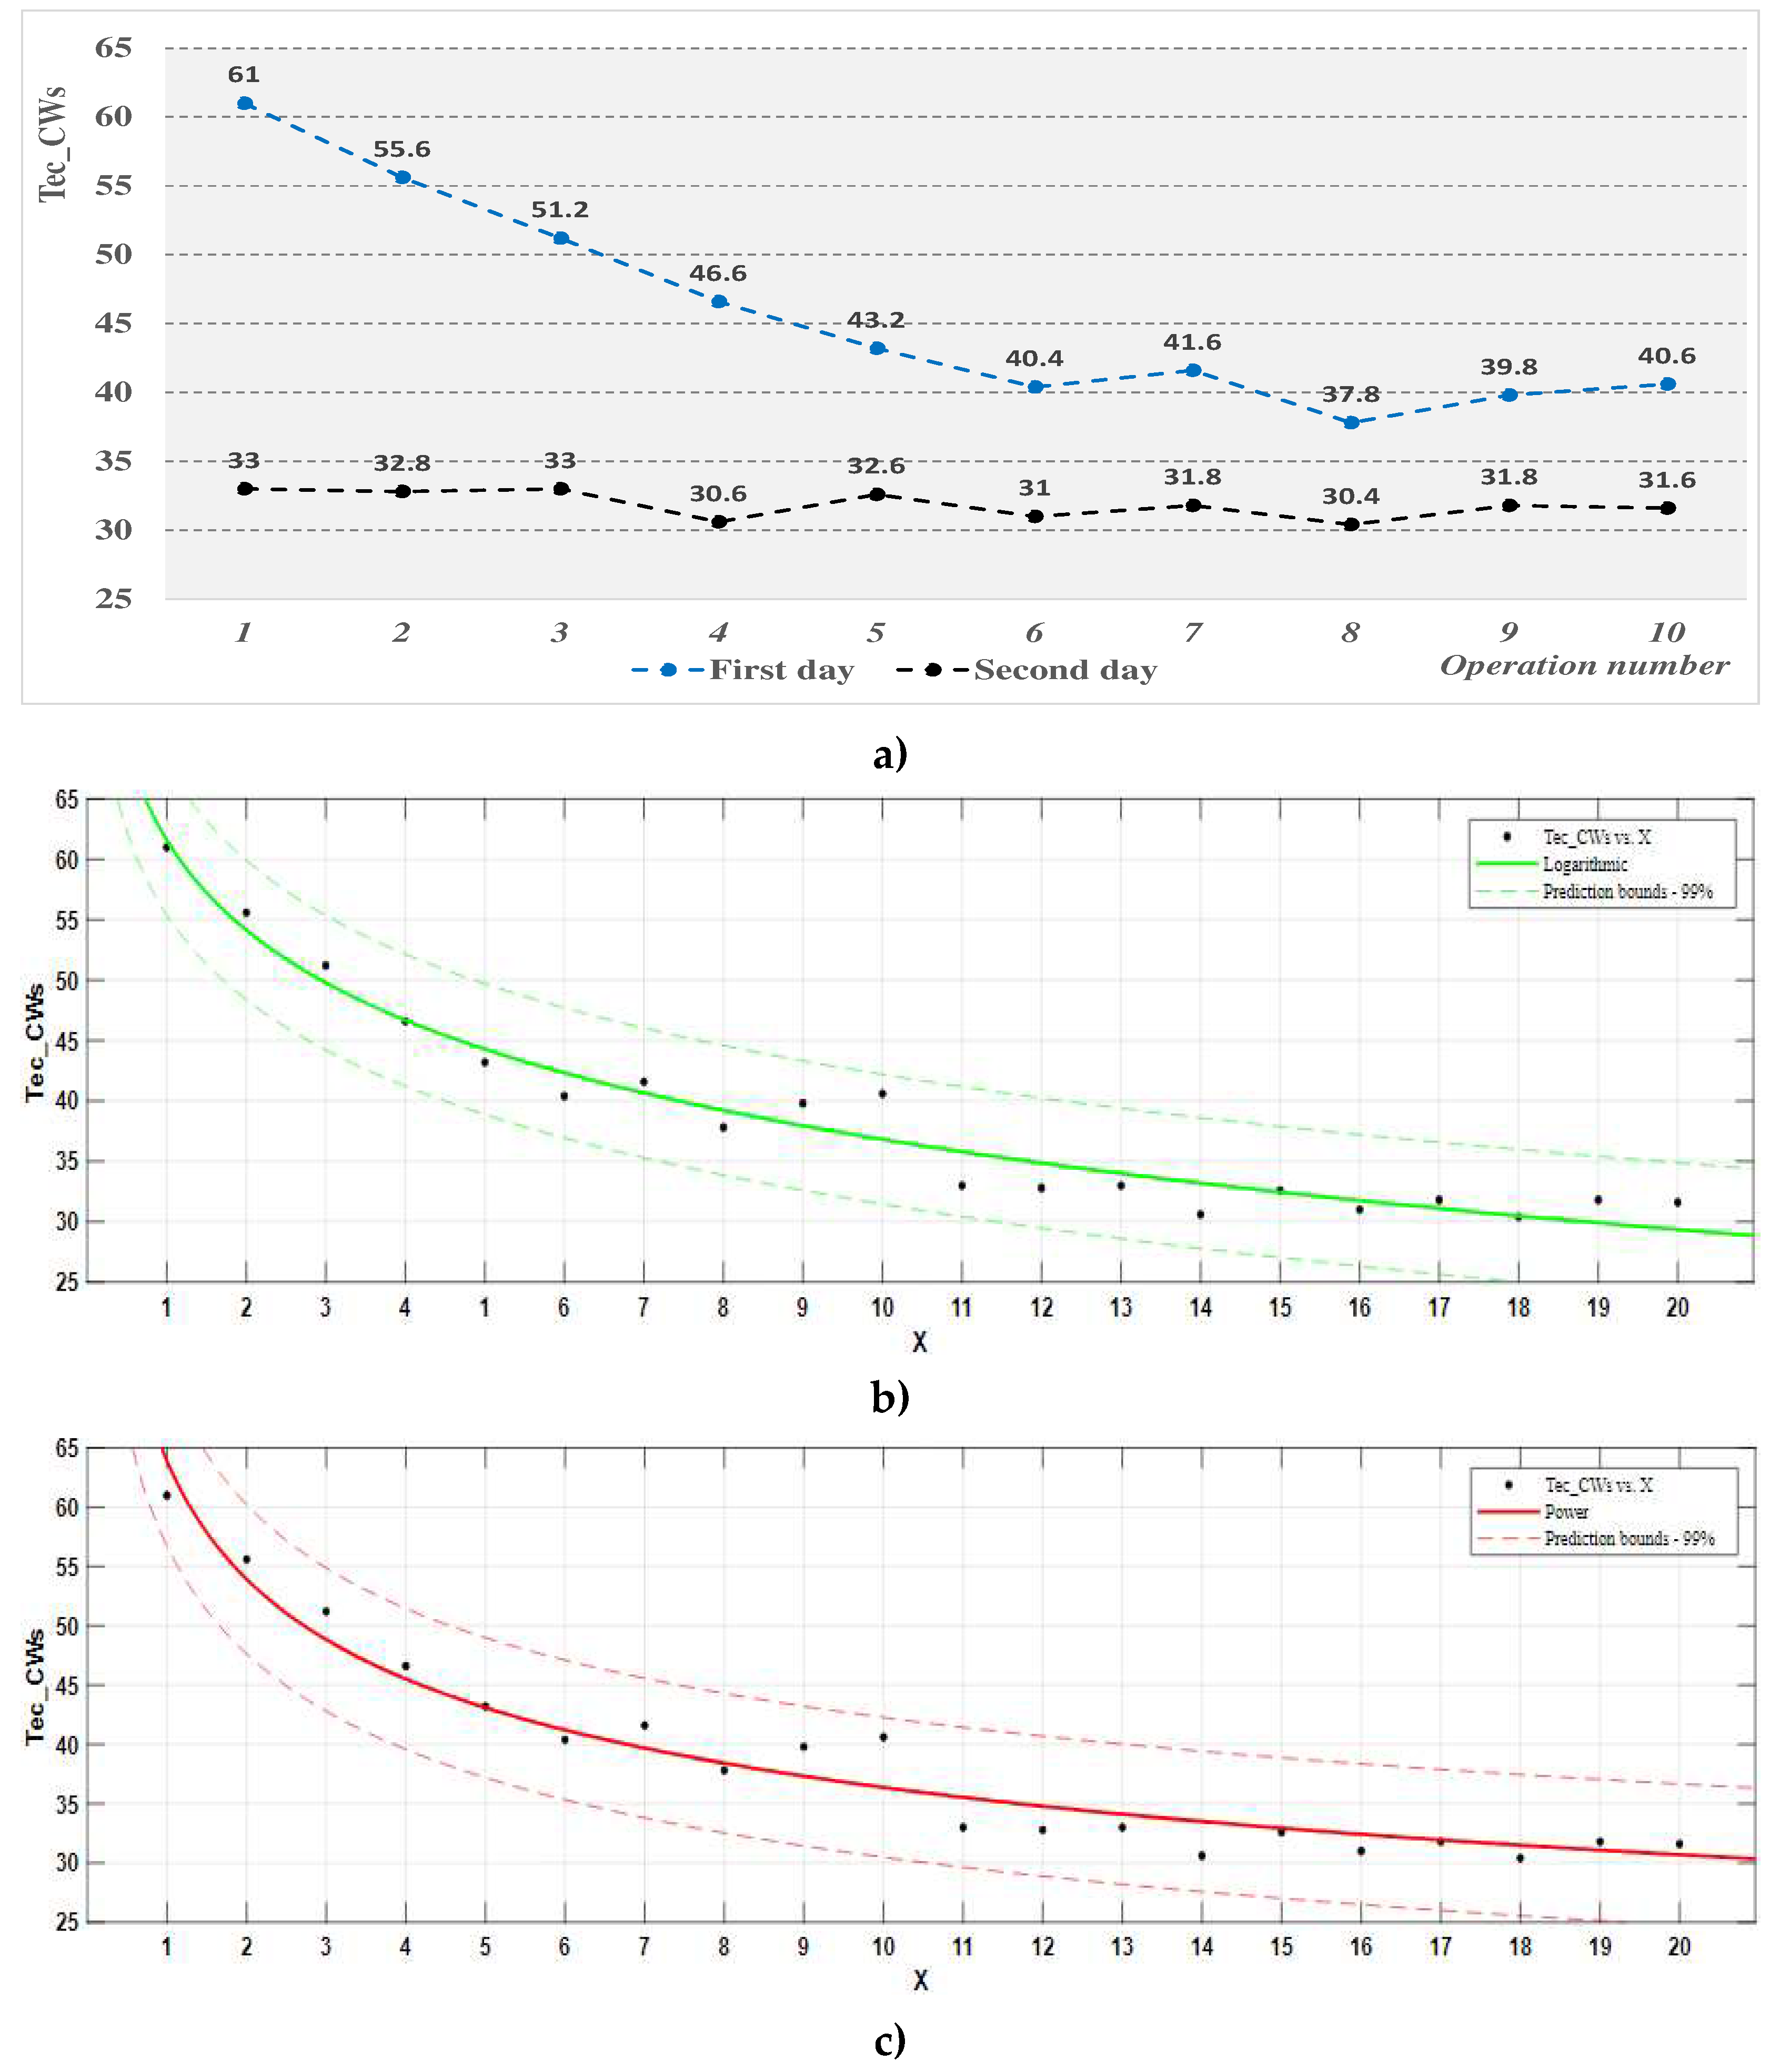
Figure 10.
The evolution of the average degree of training of the participants in the classical workstation: (a) representation on experimentation days; (b) logarithmic process function, the average degree of training of the participants, RTc_CWs; (c) power process function, the average degree of training of the participants, RTc_CWs.
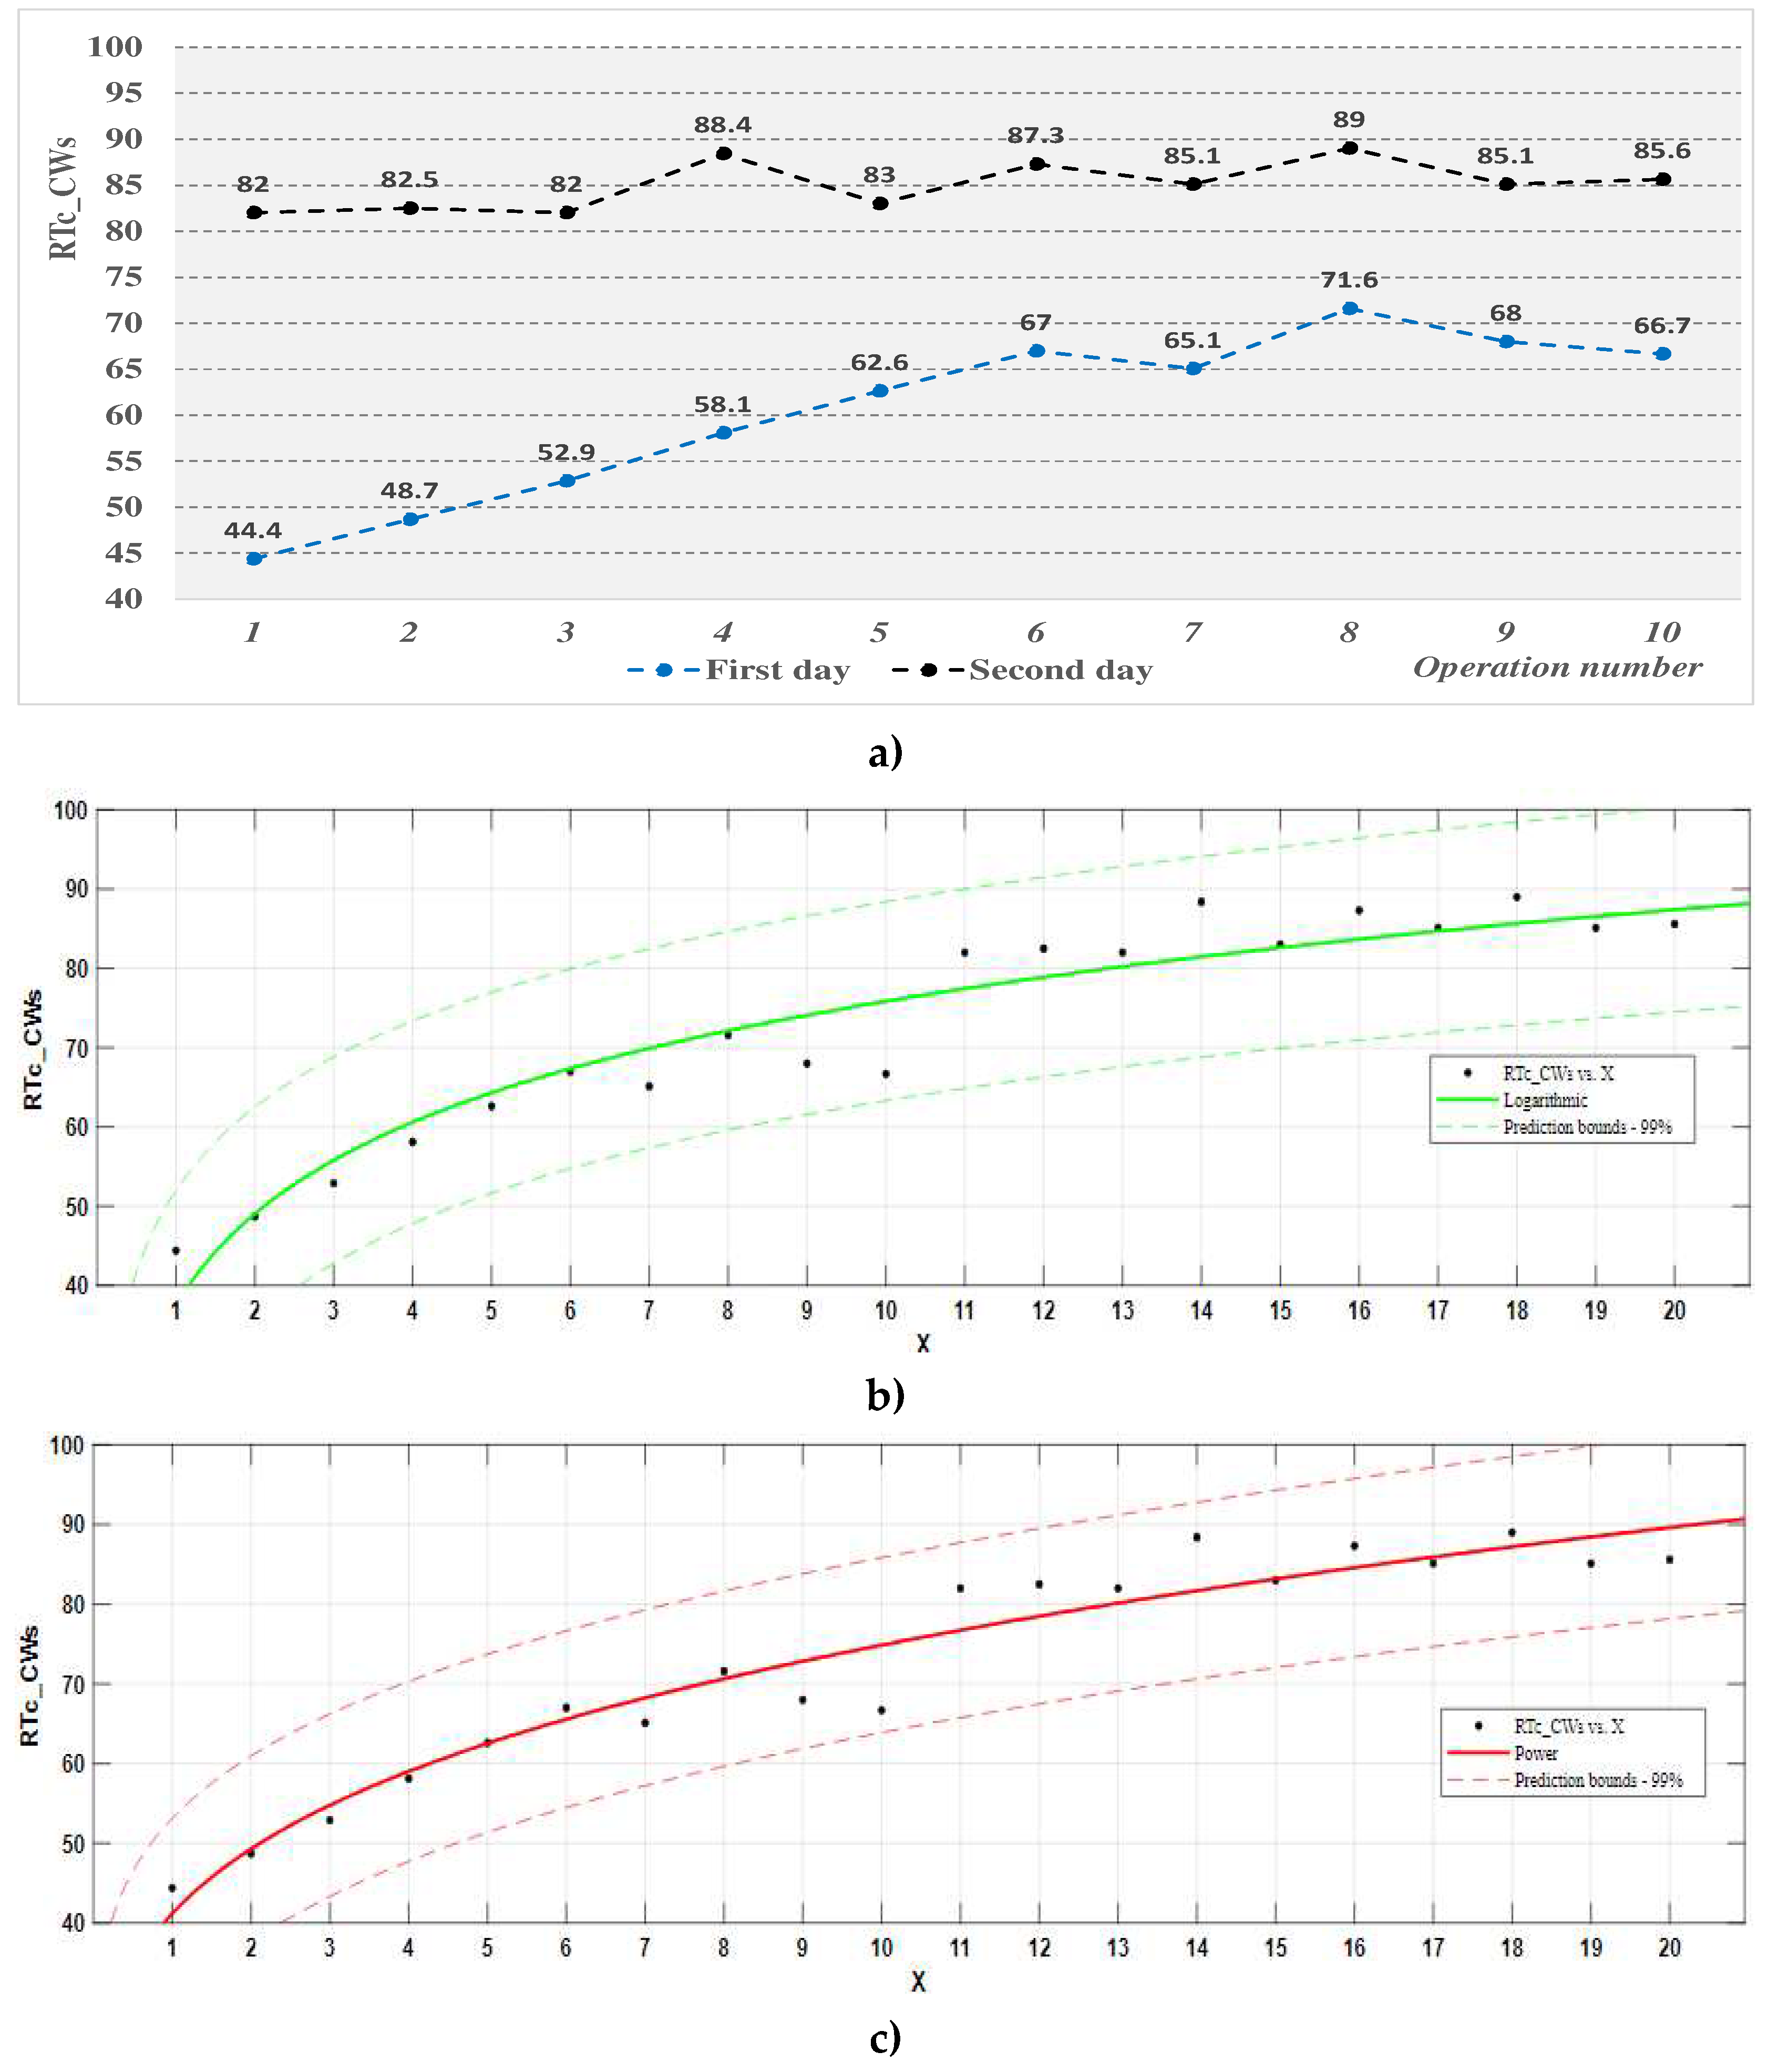
Figure 11.
The evolution of the effective average duration of the work cycle in the digitalized workstation: (a) representation on experimentation days; (b) process function (logarithm) effective average duration of the work cycle; (c) process function (power) effective average duration of the work cycle.
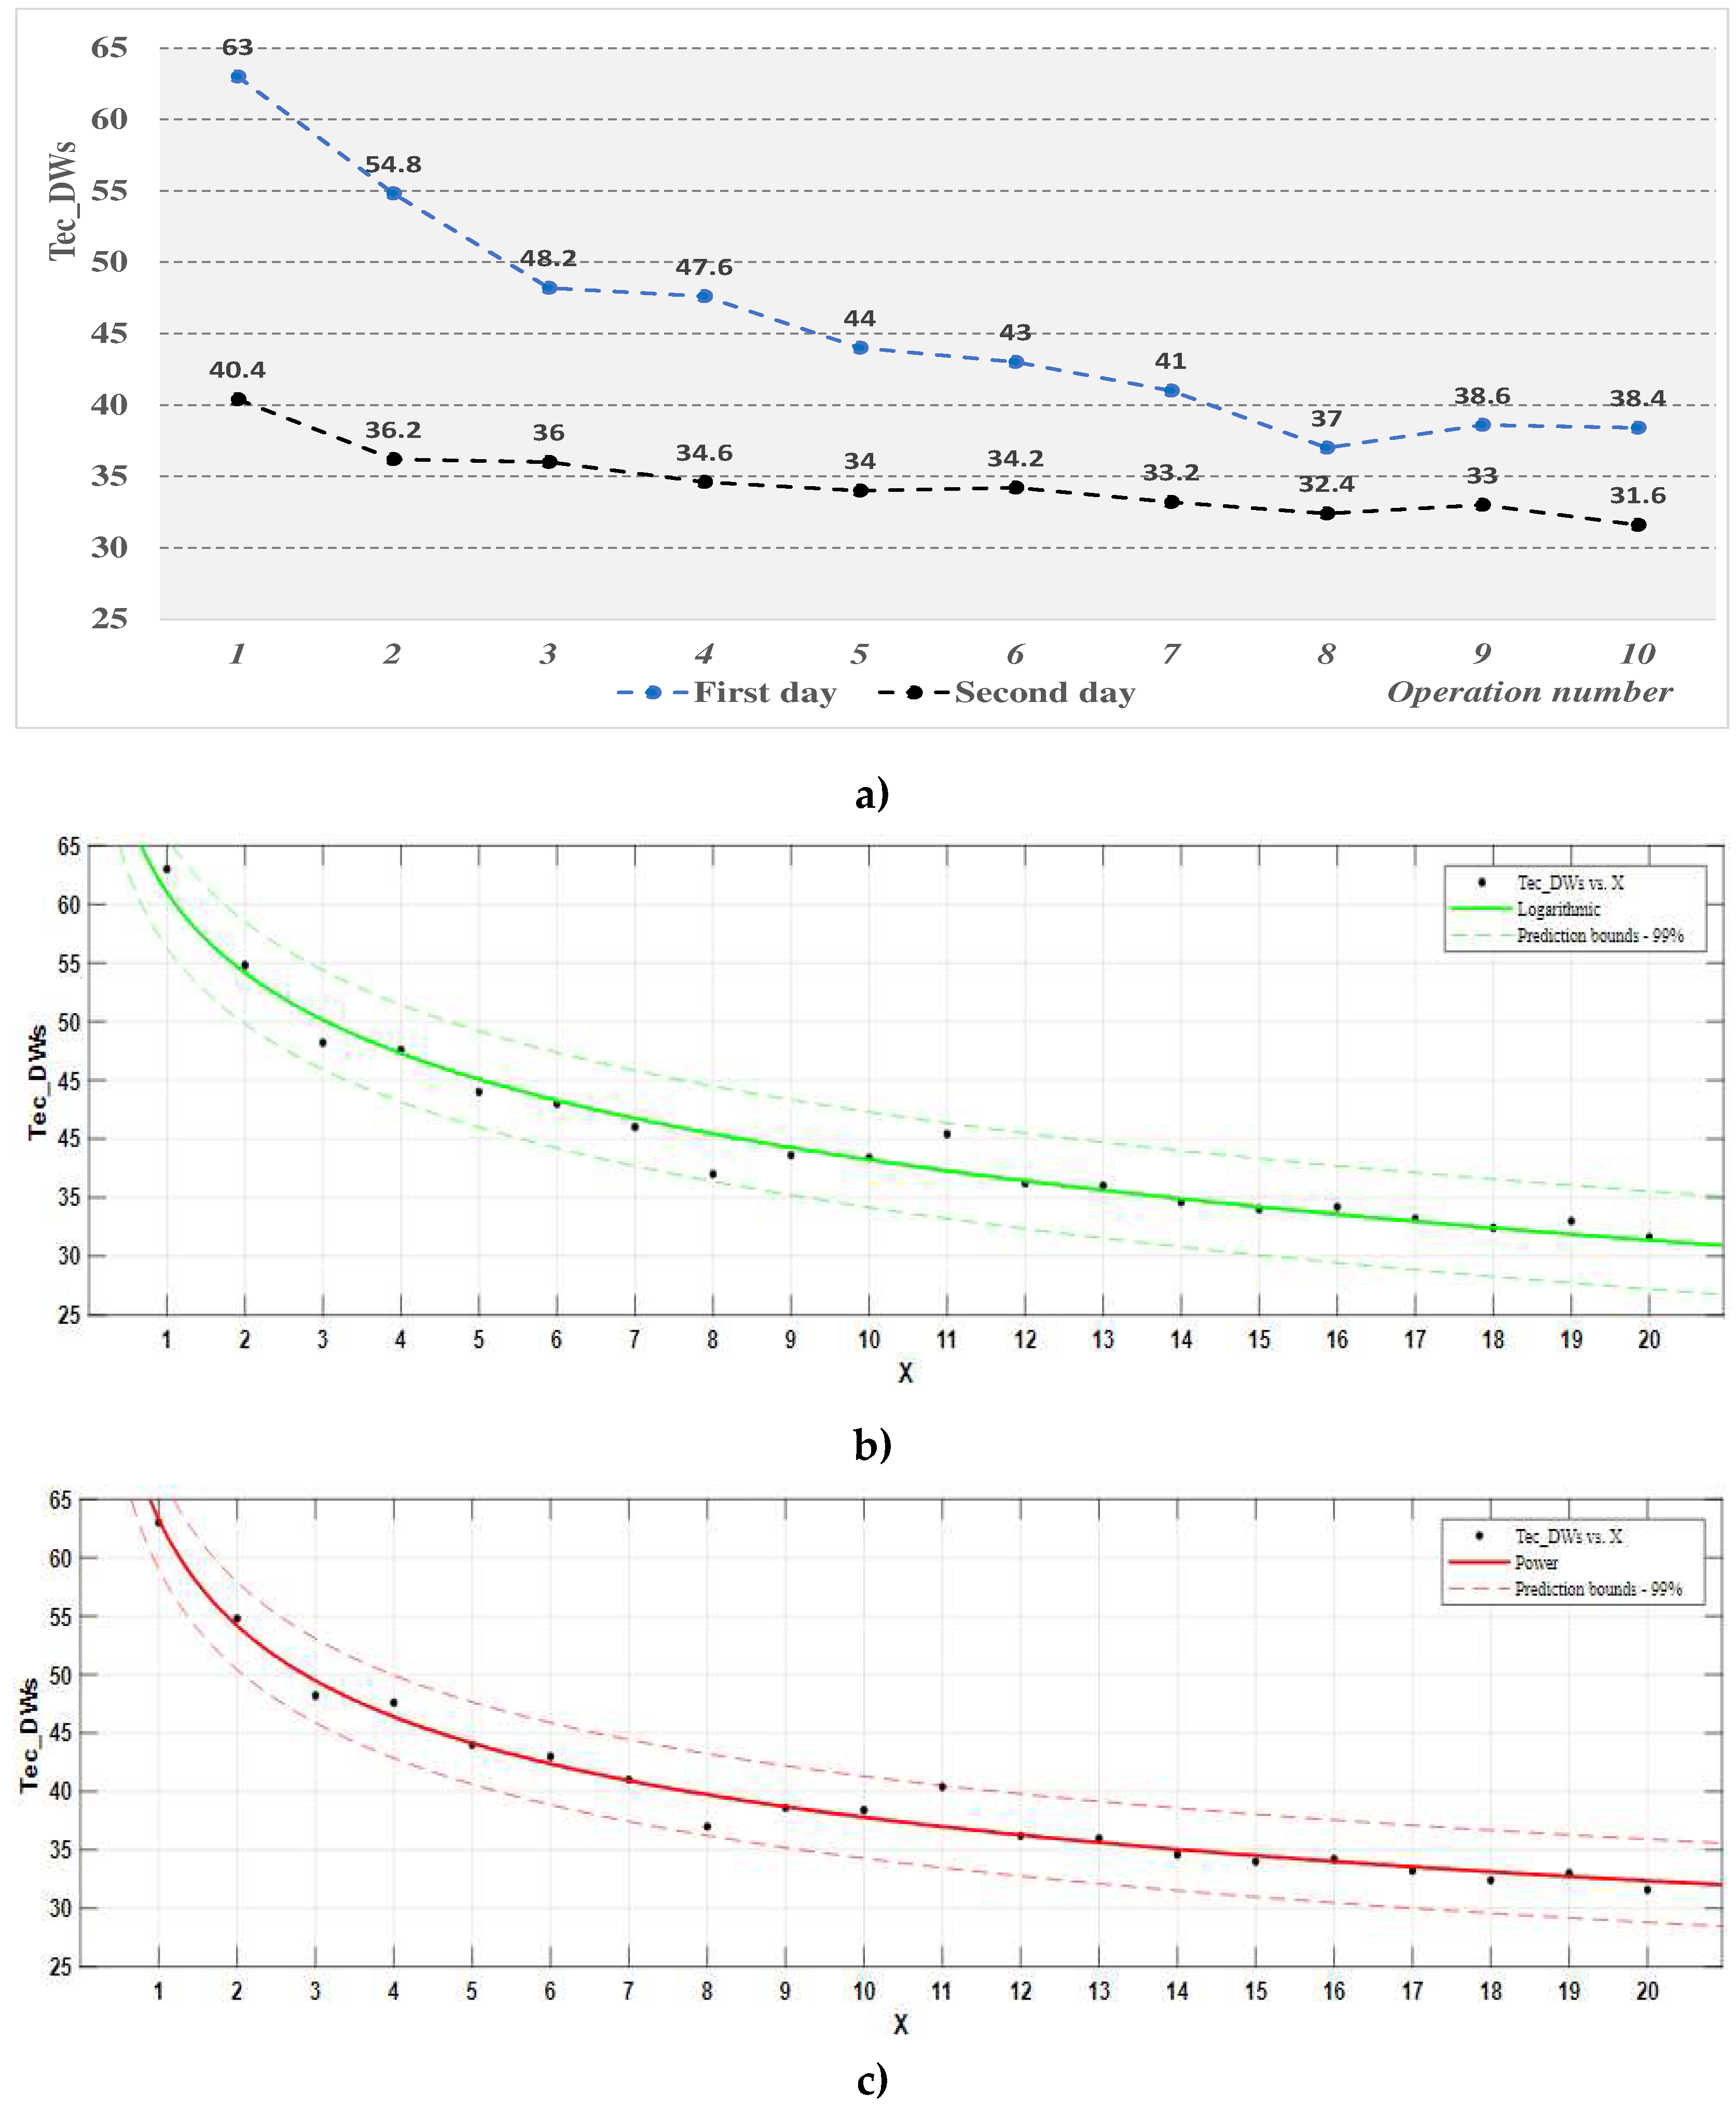
Figure 12.
The evolution of the average degree of training of the participants in the digitalized workstation: (a) representation on experimentation days; (b) process function (logarithm) RTc ; (c) process function (power) RTc.
Figure 12.
The evolution of the average degree of training of the participants in the digitalized workstation: (a) representation on experimentation days; (b) process function (logarithm) RTc ; (c) process function (power) RTc.
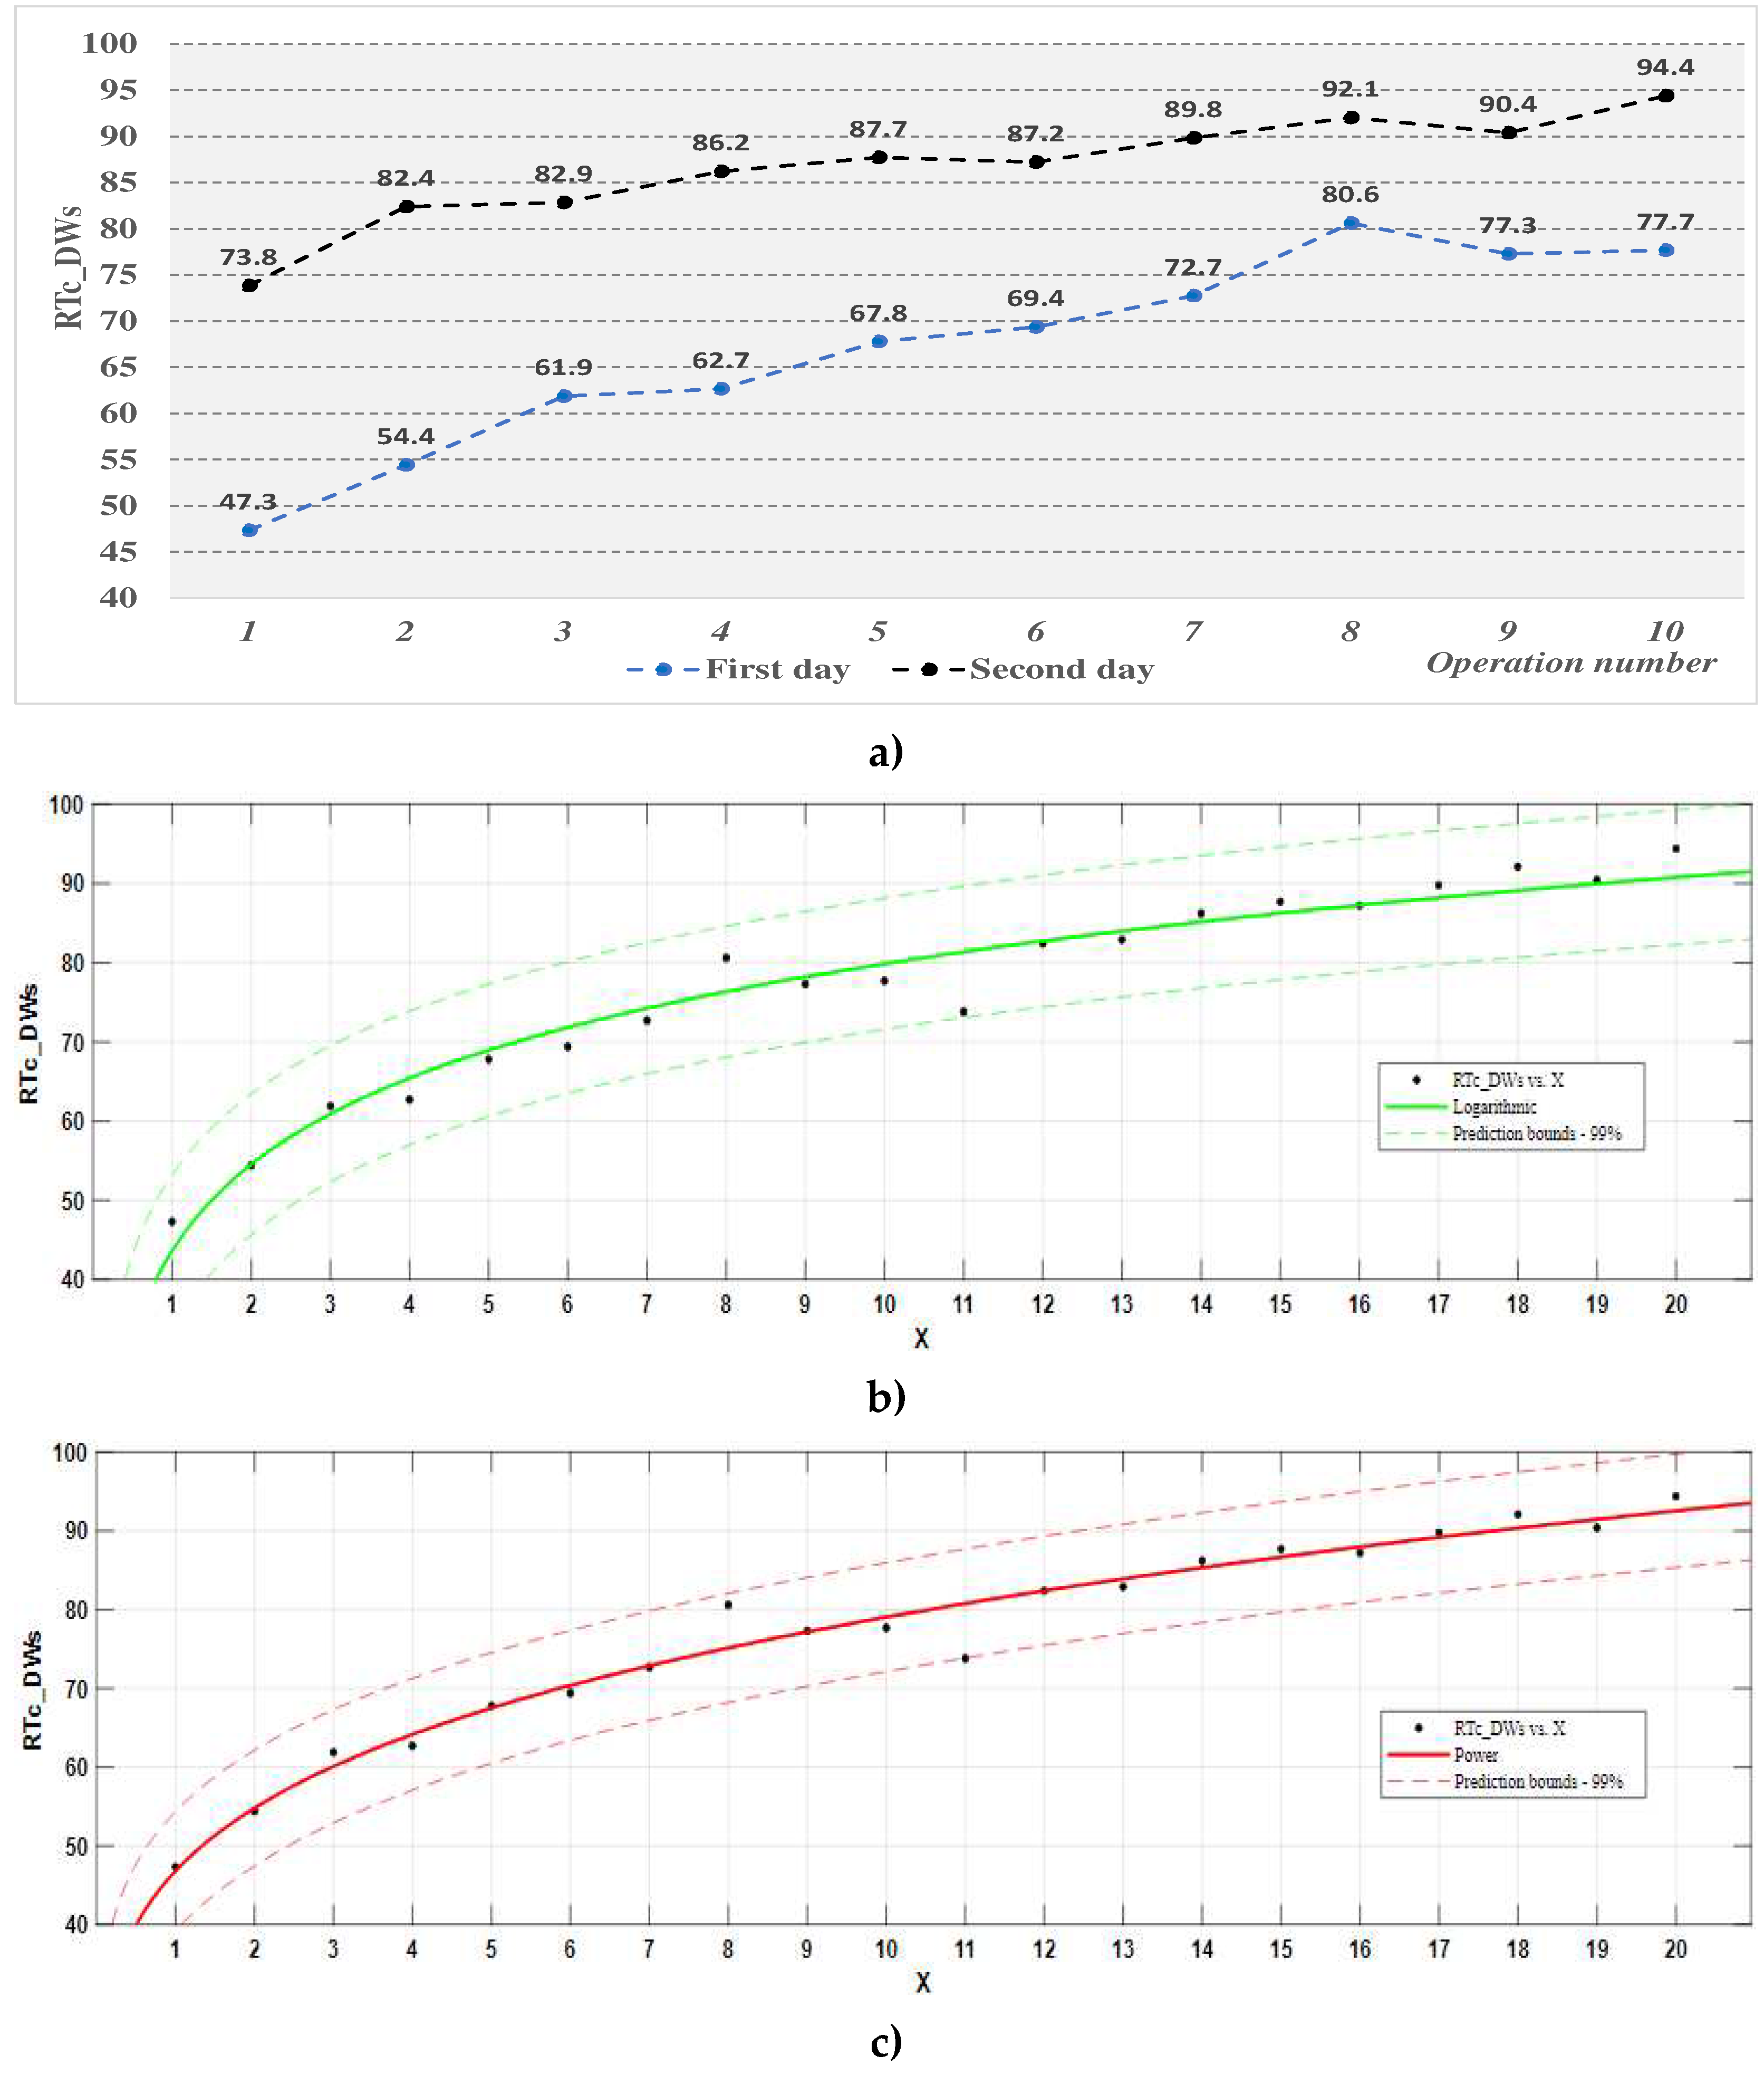
Table 3.
The critical values of the Fisher and Student distributions used in the regression analysis.
Table 3.
The critical values of the Fisher and Student distributions used in the regression analysis.
| Significance level, α | Fcritical (α, 1, 18) | tcritical (α/2, 18) |
| 0.01 | 8.2854 | 3.196 |
Table 4.
The number of errors made by the participants in the experiments - classic workstation.
| No. exp. | First day | ||||||||||
| Indicator | 1 | 2 | 3 | 4 | 5 | 6 | 7 | 8 | 9 | 10 | |
| Ne min | 1 | 1 | 0 | 0 | 0 | 1 | 1 | 1 | 1 | 0 | |
| Ne med | 2,8 | 1,8 | 1,6 | 1,4 | 1,4 | 1,6 | 1,8 | 1,4 | 1,6 | 1,6 | |
| Ne max | 4 | 4 | 3 | 2 | 2 | 2 | 3 | 2 | 2 | 3 | |
| No. exp. | Second day | ||||||||||
| Indicator | 1 | 2 | 3 | 4 | 5 | 6 | 7 | 8 | 9 | 10 | |
| Ne min | 0 | 0 | 0 | 0 | 0 | 0 | 0 | 0 | 0 | 0 | |
| Ne med | 1 | 0,6 | 0,4 | 0,4 | 0,2 | 0,2 | 0 | 0 | 0 | 0 | |
| Ne max | 2 | 2 | 1 | 1 | 1 | 1 | 0 | 0 | 0 | 0 | |
Table 5.
The main results of the regression analysis – the Ne process function, classic workstation.
Table 5.
The main results of the regression analysis – the Ne process function, classic workstation.
| Coeff. | Value | SEi | |tcalc i| | Form of process function | SSE | SSR | R2 | Fcalc |
| A0 | 2.8733 | 0.2454 | 11.7085 | Y = A0 + A1lnX | 2.6632 | 9.9347 | 0.7885 | 67.145 |
| A1 | -0.8897 | 0.1085 | 8.1942 |
Table 6.
The number of errors made by the participants in the experiments - digitalized workstation.
Table 6.
The number of errors made by the participants in the experiments - digitalized workstation.
| No. exp. | First day | ||||||||||
| Indicator | 1 | 2 | 3 | 4 | 5 | 6 | 7 | 8 | 9 | 10 | |
| Ne min | 1 | 2 | 1 | 2 | 1 | 0 | 1 | 0 | 0 | 0 | |
| Ne med | 2,8 | 3,4 | 1,4 | 2 | 1,4 | 1 | 1 | 0,6 | 0,6 | 0,6 | |
| Ne max | 6 | 4 | 3 | 2 | 3 | 2 | 1 | 2 | 2 | 1 | |
| No. exp. | Second day | ||||||||||
| Indicator | 1 | 2 | 3 | 4 | 5 | 6 | 7 | 8 | 9 | 10 | |
| Ne min | 0 | 0 | 0 | 0 | 0 | 0 | 0 | 0 | 0 | 0 | |
| Ne med | 0,6 | 0,4 | 0,6 | 0,2 | 0,2 | 0,4 | 0 | 0 | 0 | 0 | |
| Ne max | 1 | 1 | 1 | 1 | 1 | 1 | 0 | 0 | 0 | 0 | |
Table 7.
The main results of the regression analysis – the Ne process function, digitalized workstation.
Table 7.
The main results of the regression analysis – the Ne process function, digitalized workstation.
| Coeff. | Value | SEi | |tcalc i| | Form of process function | SSE | SSR | R2 | Fcalc |
| A0 | 3.1628 | 0.2059 | 15.3596 | Y = A0 + A1lnX | 1.8751 | 14.8528 | 0.8879 | 142.5791 |
| A1 | -1.0879 | 0.0911 | 11.9407 |
Table 8.
The number of stops made by the participants in the experiments - classic workstation.
| No. exp. | First day | ||||||||||
| Indicator | 1 | 2 | 3 | 4 | 5 | 6 | 7 | 8 | 9 | 10 | |
| Ns min | 0 | 0 | 0 | 0 | 0 | 0 | 0 | 0 | 0 | 0 | |
| Ns med | 1,2 | 1 | 0,8 | 0,6 | 0,8 | 0,2 | 0,4 | 0,4 | 0 | 0 | |
| Ns max | 2 | 2 | 2 | 1 | 1 | 1 | 1 | 1 | 0 | 0 | |
| No. exp. | Second day | ||||||||||
| Indicator | 1 | 2 | 3 | 4 | 5 | 6 | 7 | 8 | 9 | 10 | |
| Ns min | 0 | 0 | 0 | 0 | 0 | 0 | 0 | 0 | 0 | 0 | |
| Ns med | 0,2 | 0,4 | 0,2 | 0 | 0 | 0 | 0 | 0 | 0 | 0 | |
| Ns max | 1 | 1 | 1 | 0 | 0 | 0 | 0 | 0 | 0 | 0 | |
Table 9.
The main results of the regression analysis – the process function Ns, classic workstation.
Table 9.
The main results of the regression analysis – the process function Ns, classic workstation.
| Coeff. | Value | SEi | |tcalc i| | Form of process function | SSE | SSR | R2 | Fcalc |
| A0 | 1.2339 | 0.0911 | 13.543 | Y = A0 + A1lnX | 0.3671 | 2.3909 | 0.8669 | 117.2327 |
| A1 | -0.4364 | 0.0403 | 10.8274 |
Table 10.
The number of stops made by the participants in the experiment - digitalized workstation.
| No. exp. | First day | ||||||||||
| Indicator | 1 | 2 | 3 | 4 | 5 | 6 | 7 | 8 | 9 | 10 | |
| Ns min | 0 | 0 | 0 | 0 | 0 | 0 | 0 | 0 | 0 | 0 | |
| Ns med | 1,8 | 1 | 0,6 | 0,4 | 0 | 0,4 | 0,4 | 0,2 | 0 | 0,2 | |
| Ns max | 5 | 2 | 2 | 1 | 0 | 1 | 1 | 1 | 0 | 1 | |
| No. exp. | Second day | ||||||||||
| Indicator | 1 | 2 | 3 | 4 | 5 | 6 | 7 | 8 | 9 | 10 | |
| Ns min | 0 | 0 | 0 | 0 | 0 | 0 | 0 | 0 | 0 | 0 | |
| Ns med | 0,2 | 0,2 | 0,2 | 0,2 | 0,2 | 0 | 0 | 0 | 0 | 0 | |
| Ns max | 1 | 1 | 1 | 1 | 1 | 0 | 0 | 0 | 0 | 0 | |
Table 11.
The main results of the regression analysis – the process function Ns, digitalized workstation.
Table 11.
The main results of the regression analysis – the process function Ns, digitalized workstation.
| Coeff. | Value | SEi | |tcalc i| | Form of process function | SSE | SSR | R2 | Fcalc |
| A0 | 1.2890 | 0.1362 | 9.4630 | Y = A0 + A1lnX | 0.8204 | 2.7395 | 0.7695 | 60.0994 |
| A1 | -0.4672 | 0.0602 | 7.7523 |
Table 12.
The effective durations of the work cycle for the participants in the experiment - the classic workstation.
Table 12.
The effective durations of the work cycle for the participants in the experiment - the classic workstation.
| No. exp. | First day | ||||||||||
| Indicator | 1 | 2 | 3 | 4 | 5 | 6 | 7 | 8 | 9 | 10 | |
| Tec min | 47 | 42 | 36 | 38 | 33 | 34 | 37 | 28 | 31 | 31 | |
| Tec med | 61 | 55,6 | 51,2 | 46,6 | 43,2 | 40,4 | 41,6 | 37,8 | 39,8 | 40,6 | |
| Tec max | 73 | 69 | 78 | 66 | 58 | 56 | 54 | 49 | 50 | 49 | |
| No. exp. | Second day | ||||||||||
| Indicator | 1 | 2 | 3 | 4 | 5 | 6 | 7 | 8 | 9 | 10 | |
| Tec min | 30 | 29 | 27 | 28 | 29 | 26 | 27 | 25 | 27 | 29 | |
| Tec med | 33 | 32,8 | 33 | 30,6 | 32,6 | 31 | 31,8 | 30,4 | 31,8 | 31,6 | |
| Tec max | 37 | 36 | 41 | 32 | 34 | 33 | 33 | 34 | 34 | 34 | |
Table 13.
The main results of the regression analysis – the Tec process function, classic workstation.
Table 13.
The main results of the regression analysis – the Tec process function, classic workstation.
| Coeff. | Value | SEi | |tcalc i| | Form of process function | SSE | SSR | R2 | Fcalc |
| A0 | 61.6161 | 1.1592 | 53.1538 | Y = A0 + A1lnX | 59.4220 | 1455.45 | 0.9607 | 440.882 |
| A1 | -10.7692 | 0.5128 | 20.9972 | |||||
| A0 | 64.9473 | 0.0325 | 128.372 | Y = A0XA1 | 0.0467 | 0.8081 | 0.9522 | 311.2064 |
| A1 | -0.2537 | 0.0143 | 17.641 |
Table 14.
The main results of the regression analysis – the RTc process function, classic workstation.
Table 14.
The main results of the regression analysis – the RTc process function, classic workstation.
| Coeff. | Value | SEi | |tcalc i| | Form of process function | SSE | SSR | R2 | Fcalc |
| A0 | 37.4447 | 2.7181 | 13.8689 | Y = A0 + A1lnX | 326.708 | 3491.181 | 0.9144 | 192.3469 |
| A1 | 16.6791 | 1.2026 | 13.7761 | |||||
| A0 | 41.6676 | 0.0325 | 114.72 | Y = A0XA1 | 0.0467 | 0.8081 | 0.9343 | 311.2064 |
| A1 | 0.2537 | 0.0143 | 17.641 |
Table 15.
The effective duration of the work cycle for the participants in the experiment - the digitalized workstation.
Table 15.
The effective duration of the work cycle for the participants in the experiment - the digitalized workstation.
| No. exp. | First day | ||||||||||
| Indicator | 1 | 2 | 3 | 4 | 5 | 6 | 7 | 8 | 9 | 10 | |
| Te min | 44 | 36 | 42 | 43 | 41 | 35 | 38 | 35 | 32 | 32 | |
| Te med | 63 | 54,8 | 48,2 | 47,6 | 44 | 43 | 41 | 37 | 38,6 | 38,4 | |
| Te max | 75 | 76 | 56 | 52 | 48 | 46 | 43 | 48 | 45 | 44 | |
| No. exp. | Second day | ||||||||||
| Indicator | 1 | 2 | 3 | 4 | 5 | 6 | 7 | 8 | 9 | 10 | |
| Tec min | 38 | 29 | 32 | 30 | 28 | 20 | 29 | 28 | 28 | 28 | |
| Tec med | 40,4 | 36,2 | 36 | 34,6 | 34 | 34,2 | 33,2 | 32,4 | 33 | 31,6 | |
| Tec max | 48 | 41 | 41 | 40 | 41 | 38 | 38 | 35 | 36 | 34 | |
Table 16.
The main results of the regression analysis – the Tec process function, digitalized workstation.
Table 16.
The main results of the regression analysis – the Tec process function, digitalized workstation.
| Coeff. | Value | SEi | |tcalc i| | Form of process function | SSE | SSR | R2 | Fcalc |
| A0 | 61.0275 | 0.8784 | 69.4695 | Y = A0 + A1lnX | 34.1265 | 1231.321 | 0.973 | 649.4585 |
| A1 | -9.9054 | 0.3886 | 25.4845 | |||||
| A0 | 63.4461 | 0.0193 | 214.634 | Y = A0XA1 | 0.0165 | 0.6377 | 0.98 | 694.2694 |
| A1 | -0.2254 | 0.0085 | 26.349 |
Table 17.
The main results of the regression analysis - the RTc process function, digitalized workstation.
Table 17.
The main results of the regression analysis - the RTc process function, digitalized workstation.
| Coeff. | Value | SEi | |tcalc i| | Form of process function | SSE | SSR | R2 | Fcalc |
| A0 | 43.6285 | 1.7921 | 24.3441 | Y = A0 + A1lnX | 142.0313 | 3106.219 | 0.9562 | 393.6593 |
| A1 | 15.7326 | 0.7929 | 19.8408 | |||||
| A0 | 47.01 | 0.0193 | 199.128 | Y = A0XA1 | 0.0165 | 0.6377 | 0.9696 | 694.269 |
| A1 | 0.2254 | 0.0085 | 26.349 |
Disclaimer/Publisher’s Note: The statements, opinions and data contained in all publications are solely those of the individual author(s) and contributor(s) and not of MDPI and/or the editor(s). MDPI and/or the editor(s) disclaim responsibility for any injury to people or property resulting from any ideas, methods, instructions or products referred to in the content. |
© 2024 by the authors. Licensee MDPI, Basel, Switzerland. This article is an open access article distributed under the terms and conditions of the Creative Commons Attribution (CC BY) license (http://creativecommons.org/licenses/by/4.0/).
Copyright: This open access article is published under a Creative Commons CC BY 4.0 license, which permit the free download, distribution, and reuse, provided that the author and preprint are cited in any reuse.


