
Submitted:
26 January 2024
Posted:
29 January 2024
You are already at the latest version
Abstract
The pathophysiology of Nonketotic Hyperglycinemia (NKH), a rare neuro-metabolic disorder associated with severe brain malformations and life-threatening neurological manifestations, remains incompletely understood. Therefore, a valid human neuronal model is essential. We aimed to investigate the impact of GLDC gene variants, which cause NKH, on cellular fitness during the differentiation process of human induced pluripotent stem cells (iPSCs) into iPSC-derived astrocytes and to identify sustainable mechanisms capable of overcoming GLDC deficiency. We developed the GLDC27-FiPS4F-1 line and performed metabolomic, mRNA abundance and protein analyses. The study showed that although GLDC27-FiPS4F-1 maintained the parental genetic profile, it underwent a metabolic switch to an altered serine-glycine-one-carbon metabolism with a coordinated cell growth and cell cycle proliferation response. We then differentiated the iPSCs into neural progenitor cells (NPCs) and astrocyte-lineage cells. Analysis showed that GLDC-deficient NPCs had shifted towards a more heterogeneous astrocyte lineage with increased expression of the radial glial markers GFAP and GLAST and the neuronal markers MAP2 and NeuN. In addition, we detected changes in other genes related to serine and glycine metabolism and transport, all consistent with the need to maintain glycine at physiological levels. These findings improve our understanding of the pathology and offer new perspectives for therapeutic options.
Keywords:
Human disease model
; Inherited Metabolic Disorders
; Inborn Error of Metabolism
; Nonketotic Hyperglycinemia
; GLDC
; iPSC
; iPSC-derived astrocytes
; serine-glycine-one-carbon metabolism
1. Introduction
The distinctive nature of rare human monogenic diseases, characterized by the limited number of patients available worldwide and restricted access to the most affected tissues, poses challenges in unravelling of the molecular, cellular, tissue, and organ-level processes that sustain the disease condition and influence the response to treatment. Within this context, the ability to reprogram somatic cells to induce pluripotency has revolutionized the approach to modelling human disease. One of the rare diseases that could benefit from this approach is Nonketotic Hyperglycinemia (NKH), a neurometabolic disorder characterized by severe brain malformations and life-threatening neurological manifestations. Classic NKH (MIM#605899) is an autosomal recessive disorder that results from deficient activity of the multi-enzyme mitochondrial complex Glycine Cleavage System (GCS) [1]. GCS mediates the decarboxylation of glycine with a concomitant transfer of a one-carbon group to tetrahydrofolate (THF), resulting in the production of 5,10-methylene-THF. In this way, GCS contributes to maintaining the flux of the serine-glycine-one carbon metabolic pathway. The GCS complex consists of four components: a pyridoxal-dependent glycine decarboxylase (GCSP), encoded by the GLDC gene (MIM*238300) responsible for catalyzing the decarboxylation of glycine with CO2 release; the amino-methyltransferase, a tetrahydrofolate-dependent GCST protein encoded by the AMT gene (MIM*238310); a NAD+-dependent dihydro-lipoamide dehydrogenase; and a small lipoylated H protein encoded by the GCSH gene (MIM*238330), capable of interacting with the other subunits. The GCSH protein is responsible for the transferring of lipoic acid to other mitochondrial apo-enzymes, including the E2 subunit of the pyruvate dehydrogenase and the α-ketoglutarate dehydrogenase complexes [2,3]. Mutations in GLDC or AMT genes can lead to the accumulation of glycine in biological fluids, particularly in cerebrospinal fluid, serving as the biochemical hallmark of NKH. More than 70% of NKH patients carry mutations in the GLDC gene.
The severe neurological symptoms observed in NKH patients have been linked for years to an excess of glycine, which acts on both NMDA receptors in the cortex and glycine receptors in the spinal cord and brain stem neurons [4]. However, glycine metabolism is intimately connected to the maintenance of cellular pools of one-carbon residues. These residues are essential not only for donating methyl groups for the synthesis of amino acids, nucleotides, and phospholipids but also for remodeling the epigenetic state of the cell. This includes the changes that occur during the reprogramming of somatic cells to pluripotent iPSCs [5].
These two faces for explaining the effect of GCS deficiency in the NKH disease condition were previously proposed [6] and it seems to be supported by data in Gldc-/- mice, indicating the involvement of impaired folate 1-carbon metabolism [7] in specific aspects of NKH pathogenesis. Additionally, a strong relationship exists between neural tube disorders (NTDs) and GLDC or AMT mutations [7,8].
Several studies have indicated that astrocytes, which comprise most of the cell population in the human brain, play a key role in the serine-glycine-one carbon metabolism. Here, we utilized a human induced pluripotent stem cell (iPSC) model [9] derived from fibroblasts of a severe NKH patient with hypomorphic GLDC mutations [10] to investigate the effects of GLDC deficiency on cell metabolism, bioenergetics, growth, and cell cycle, from pluripotent iPSCs to differentiated neural cells.
2. Results
2.1. The Human iPSCs Model Recapitulates the GLDC Deficiency
To determine the potential of iPSCs to mimic GLDC deficiency, we examined the expression of GLDC, AMT and GCSH in these cells. We evaluated both control and GLDC27-FiPS4F-1 iPSCs, the latter obtained by reprogramming dermal fibroblasts using a Sendai virus vector kit containing the four Yamanaka factors (OCT3/4, SOX2, KLF4 and c-MYC) [9]. These cell lines were characterized for pluripotency, normal karyotype, and line identity by short tandem repeat analysis. Both were assessed at the same stage of reprogramming. Figure 1A-D shows the results of various analyses, including RT-qPCR analysis, steady-state analysis of GCS proteins (GCSP, GCST and GCSH) under denaturing or native conditions, and glycine exchange activity in both iPSCs and fibroblasts derived from the donor NKH patient and healthy controls. Recapitulating the GLDC deficiency at the protein level, GCSP protein and GCS activity appeared severely reduced in GLDC27-FiPS4F-1 compared to the healthy control. Furthermore, the data show that in the human health control, the process of somatic reprogramming to pluripotency induces the expression of GLDC and the corresponding GCS activity. This suggests an important role for the GCSP protein at the pluripotent stage. Immunofluorescence analysis of GCS proteins in normal and GLDC27-FiPS4F-1 iPSCs (Figure 1E, 1F) supported and confirmed these findings.
2.2. Coordinated Response of the Serine-Glycine-One-Carbon Metabolism to the GLDC Deficiency in iPSCs
Given the involvement of GCS in the serine-glycine-one-carbon pathways, we assessed the cellular response of iPSCs to GLDC deficiency by analyzing primary metabolites and gene expression of key components of the glycine-serine-one-carbon metabolism. Metabolites were quantified in cellular extracts and spent-culture medium of human induced pluripotent stem cells using a targeted metabolomics methodology. Differences in the absorption and excretion of amino acids and short peptides were observed between GLDC27-FiPS4F-1 and control cells, as shown in Figure 2. The GLDC27-FiPS4F-1 cells exhibited markedly different behavior regarding glycine concentrations; while the control cells absorbed glycine from the environment, the GLDC27-FiPS4F-1 cells released high levels of glycine from the cell into the environment. In contrast, both cell lines absorbed serine from the culture medium, but the uptake was notably higher in the GLDC27-FiPS4F-1 line (1.5 times that of the control). Additionally, although both lines exhibited a pattern of absorbing arginine from the medium and releasing proline into the environment, the amount of arginine taken from the medium was considerably greater in the GLDC27-FiPS4F-1 line (more than 2.5 times higher) than in the control line. The GLDC27-FiPS4F-1 cells showed significant increases in the uptake of methionine and cysteine, as well as elevated homocysteine secretion compared to control cells. These last observations suggest a reduced re-methylation due to impaired folate metabolism. Furthermore, the GLDC27-FiPS4F-1 line displayed a significant increase in the absorption of large neutral amino acids (LNAAs), consistent with a higher consumption of these amino acids from the media compared to the healthy control (Figure 2). Additionally, there was a marked increase in the absorption of glutathione from the culture medium in the GLDC27-FiPS4F-1 line (Figure 2), suggesting a substantial decrease in its intracellular levels.
To explore the molecular underpinnings of the metabolomics data, we analyzed the expression of genes linked to serine-glycine-one-carbon metabolism (Figure 3). Our study included the transcriptional analysis of PHGDH (phosphoglycerate dehydrogenase), PSAT1 (phosphoserine aminotransferase) and PSPH (phosphoserine phosphatase), which are associated with the cytosolic production of serine from the glycolytic intermediate, -3-phosphoglycerate- (3-PG). We also examined the cytosolic (SHMT1) and mitochondrial (SHMT2) isoforms of serine hydroxymethyl-transferases (SHMTs) responsible for the reversible conversion of L-serine to glycine. Furthermore, we assessed the cytosolic (MTHFD1) and mitochondrial (MTHFD2) isoforms of methyl-tetrahydrofolate dehydrogenase, along with the folate cycle enzymes, mitochondrial DHFR and MTHFR encoding for the dihydrofolate and 5,10-methylene-THF reductases respectively. In a subsequent step, we evaluated TYMS (thymidylate synthetase) for thymidylate pyrimidine nucleotide synthesis. The results revealed a significant reduction in the expression of PSAT1, PSPH, SHMT2, MTHFD2, MTHFR and DHFR, while PHGDH, SHMT1 and MTHFD1 were increased, all in comparison to the control iPSCs (Figure 3A). Western blot analysis at the protein level corroborated the gene expression data (Figure 3B).
2.3. Metabolic Alterations in GLDC27-FiPS4F-1 Impact Cell Growth and Cell Cycle Progression
In line with the contribution of serine and glycine metabolism in their synthesis, the intracellular levels of purines and pyrimidine derivatives were significantly impaired in GLDC27-FiPS4F-1 (Figure 4A). This finding was also consistent with the decreased demand of aspartate, needed for the novo synthesis of nucleotides, detected in GLDC27-FiPS4F-1 (Figure 2). A reduction in nucleotide precursors can result in altered cell proliferation and impact cell cycle progression. Figure 4B illustrates a significant reduction in the number of the GLDC27-FiPS4F-1 cells compared to the control at all seeding densities tested. For assessing cell cycle distribution, cells in asynchronous growth were stained with propidium iodide and flow cytometry was used to analyse their DNA content. The study revealed a noticeable difference in cell cycle distribution between control and GLDC27-FiPS4F-1 cells. In GLDC27-FiPS4F-1 we detected a significant accumulation of cells in quiescence (sub-G1 phase), in addition to an increased proportion of cells with 4N DNA content (G2/M) and a reduction in cells with 2N DNA content (G1 phase) (Figure 4C). To further investigate the potential impact of specific cyclins on these observed differences in the cell cycle, we employed RT-qPCR to measure the expression levels of various cyclins and CDKs that play crucial roles in cell cycle regulation (Figure 4D). The results showed a significant decrease (52%) in the expression level of CCND1, gene encoding cyclin D1. Additionally, gene expression levels of CDK1, CCNA2, and CDK2 were all statistically significantly decreased concerning the control. These findings suggest a delayed transition from the G2/M phase back to the G1 phase in the cell cycle.
2.4. Mitochondria Function in GLDC27-FiPS4F-1
To explore the potential impact of nucleotide depletion on mitochondrial DNA (mtDNA) levels, we first investigated the ratio of mtDNA to nuclear (nDNA) by comparing ND1/18S and 12S/18S (Figure 5A) levels measured by RT-PCR. We observed an increased ratio of mtDNA/nDNA in the GLDC27-FiPS4F-1 cells compared to control. Consistent with this increase, we also detected higher level of the mtDNA-translated MTCO1 protein through western blot analysis of the OxPhos proteins (Figure 5B). Subsequently, we assessed the basal mitochondrial function of GLDC27-FiPS4F-1 and control iPSCs using the Seahorse Bioscience XF96 (Figure 5C). We did not observe significant differences between the two groups regarding basal respiration or ATP production. Electron microscopy analysis of mitochondria structures revealed a preferential presence of spherical mitochondria with poorly developed cristae in both GLDC27-FiPS4F-1 and control iPSCs (Figure 5D). In GLDC-deficient iPSCs, we identified a reduced population of condensed mitochondria characterized by a dense matrix and dilated cristae, a feature not observed in the control group.
2.5. GLDC27-FiPS4F-1 and Control iPSCs Are Efficiently Differentiated to Neural Progenitor Cells
The primary neural progenitor cells (NPCs) possess the potential to differentiate into neural and glial cell types. Thus, we initiated the neuralization process by culturing undifferentiated GLDC27-FiPS4F-1 and control iPSCs in the presence of a dual SMAD signaling inhibitor using the STEMCell Technologies monolayer protocol to generate neural progenitors. The ability of our iPSCs lines to generate neural cells was evaluated by analyzing the transcription of various mRNAs. As is shown in Figure 6A-C, gene expression analysis of iPSCs at day 0 of differentiation revealed high expression levels of the pluripotency biomarkers OCT3/4 and LIN28B. These levels decreased by day 20 of differentiation, coinciding with the upregulation of neuroepithelial markers NESTIN, PAX6, and SOX1 in both patient and control NPCs. Confocal microscopy, using specific antibodies against PAX6, Nestin and OCT3/4 corroborated the RNA results (Figure 6D). Our findings confirmed that neural induction had been successfully conducted for both cell lines. After 20 days in culture, the GCSP protein kept drastically reduced at the NPC stage in GLDC-deficient cells (Figure 6E). NPCs of both groups retained their proliferative capacity but exhibited some morphological differences (Figure 6F), which deserved further evaluation. We compared the expression levels of the same markers in the GLDC27-FiPS4F-1 and the control NPCs lines (Figure 6G). The GLDC27-FiPS4F-1NPCs line exhibited higher levels of PAX6, NES, and SOX1 markers specific to the NPC stage. Additionally, it displayed FOXG1 and MAP2 markers, specific to immature and mature neurons, respectively.
2.6. Astrocyte Induction from Neural Progenitors Shows Different Phenotypes
The final stage of the study involved differentiating NPCs lines into human-induced astrocytes (iAs) using a biphasic protocol. The differentiation process was validated by the downregulation of PAX6 and the upregulation of a panel of cell-specific markers, including those expressed in radial glia, mature astrocytes, and neurons, which were measured on day 42 of the NPCs to iAs differentiation process (Figure 7A-C). Our data demonstrated that all markers analyzed except PAX6 exhibited higher expression levels in iAs compared to the corresponding NPCs (Figure 7B, 7C). In addition, GLDC27-FiPS4F-1-iAs expressed higher levels of GFAP, S100β, AQP4, and ALDH1L1 than those measured in control iAs (Figure 7D). Moreover, confocal analysis following immunostaining with GFAP and S100β showed a significant difference in the morphology and frequency of positive cells between the groups. The control culture displayed strong S100β labelling, while GFAP staining was weak. The analysis of patient-derived iAs revealed a population of cells that were morphologically heterogeneous and smaller in size than the control group (Figure 7E). The cells displayed a star-shaped morphology with long and numerous projections and exhibited positive staining for S100β and GFAP, although not always colocalized (Figure 7F). Cells expressing GFAP resembled radial glia (Figure 7F). Quantification of MAP2 and NeuN expression levels confirmed a significant increase in the expression of mature neuronal markers in GLDC27-FiPS4F-1iAs compared to control iAs (Figure 8A). Confocal analysis corroborated the RT-qPCR result (Figure 8B).
The functional maturity of the astrocytes produced was subsequently examined. A key indicator of astrocyte function is the Na+-dependent glutamate uptake, which reflects the activity of GLAST and GLT-1 transporters. This function can be directly measured using a radioactive assay. The presence of both transporters was evaluated using RT-qPCR and immunostaining of GLAST and GLT-1 (Figure 8C, 8D). The data revealed that 6-week-old iPSC-derived astrocytes were capable of glutamate uptake, albeit with varying efficiencies. GLDC27-FiPS4F-1 iAs, with the highest levels of GLAST protein expression, exhibited the most robust transport activity (Figure 8E). This was corroborated by a significant reduction in extracellular glutamate levels in GLDC27-FiPS4F-1 iAs compared to the control cells (Figure 8F).
In summary, the differentiation of the two NPCs lines yielded distinct iAs cultures, differing in the presence of key markers and functional capacity, as evidenced by their glutamate transport capabilities.
2.7. Maintenance of glycine homeostasis in GLDC27-FiPS4F-1 iAs
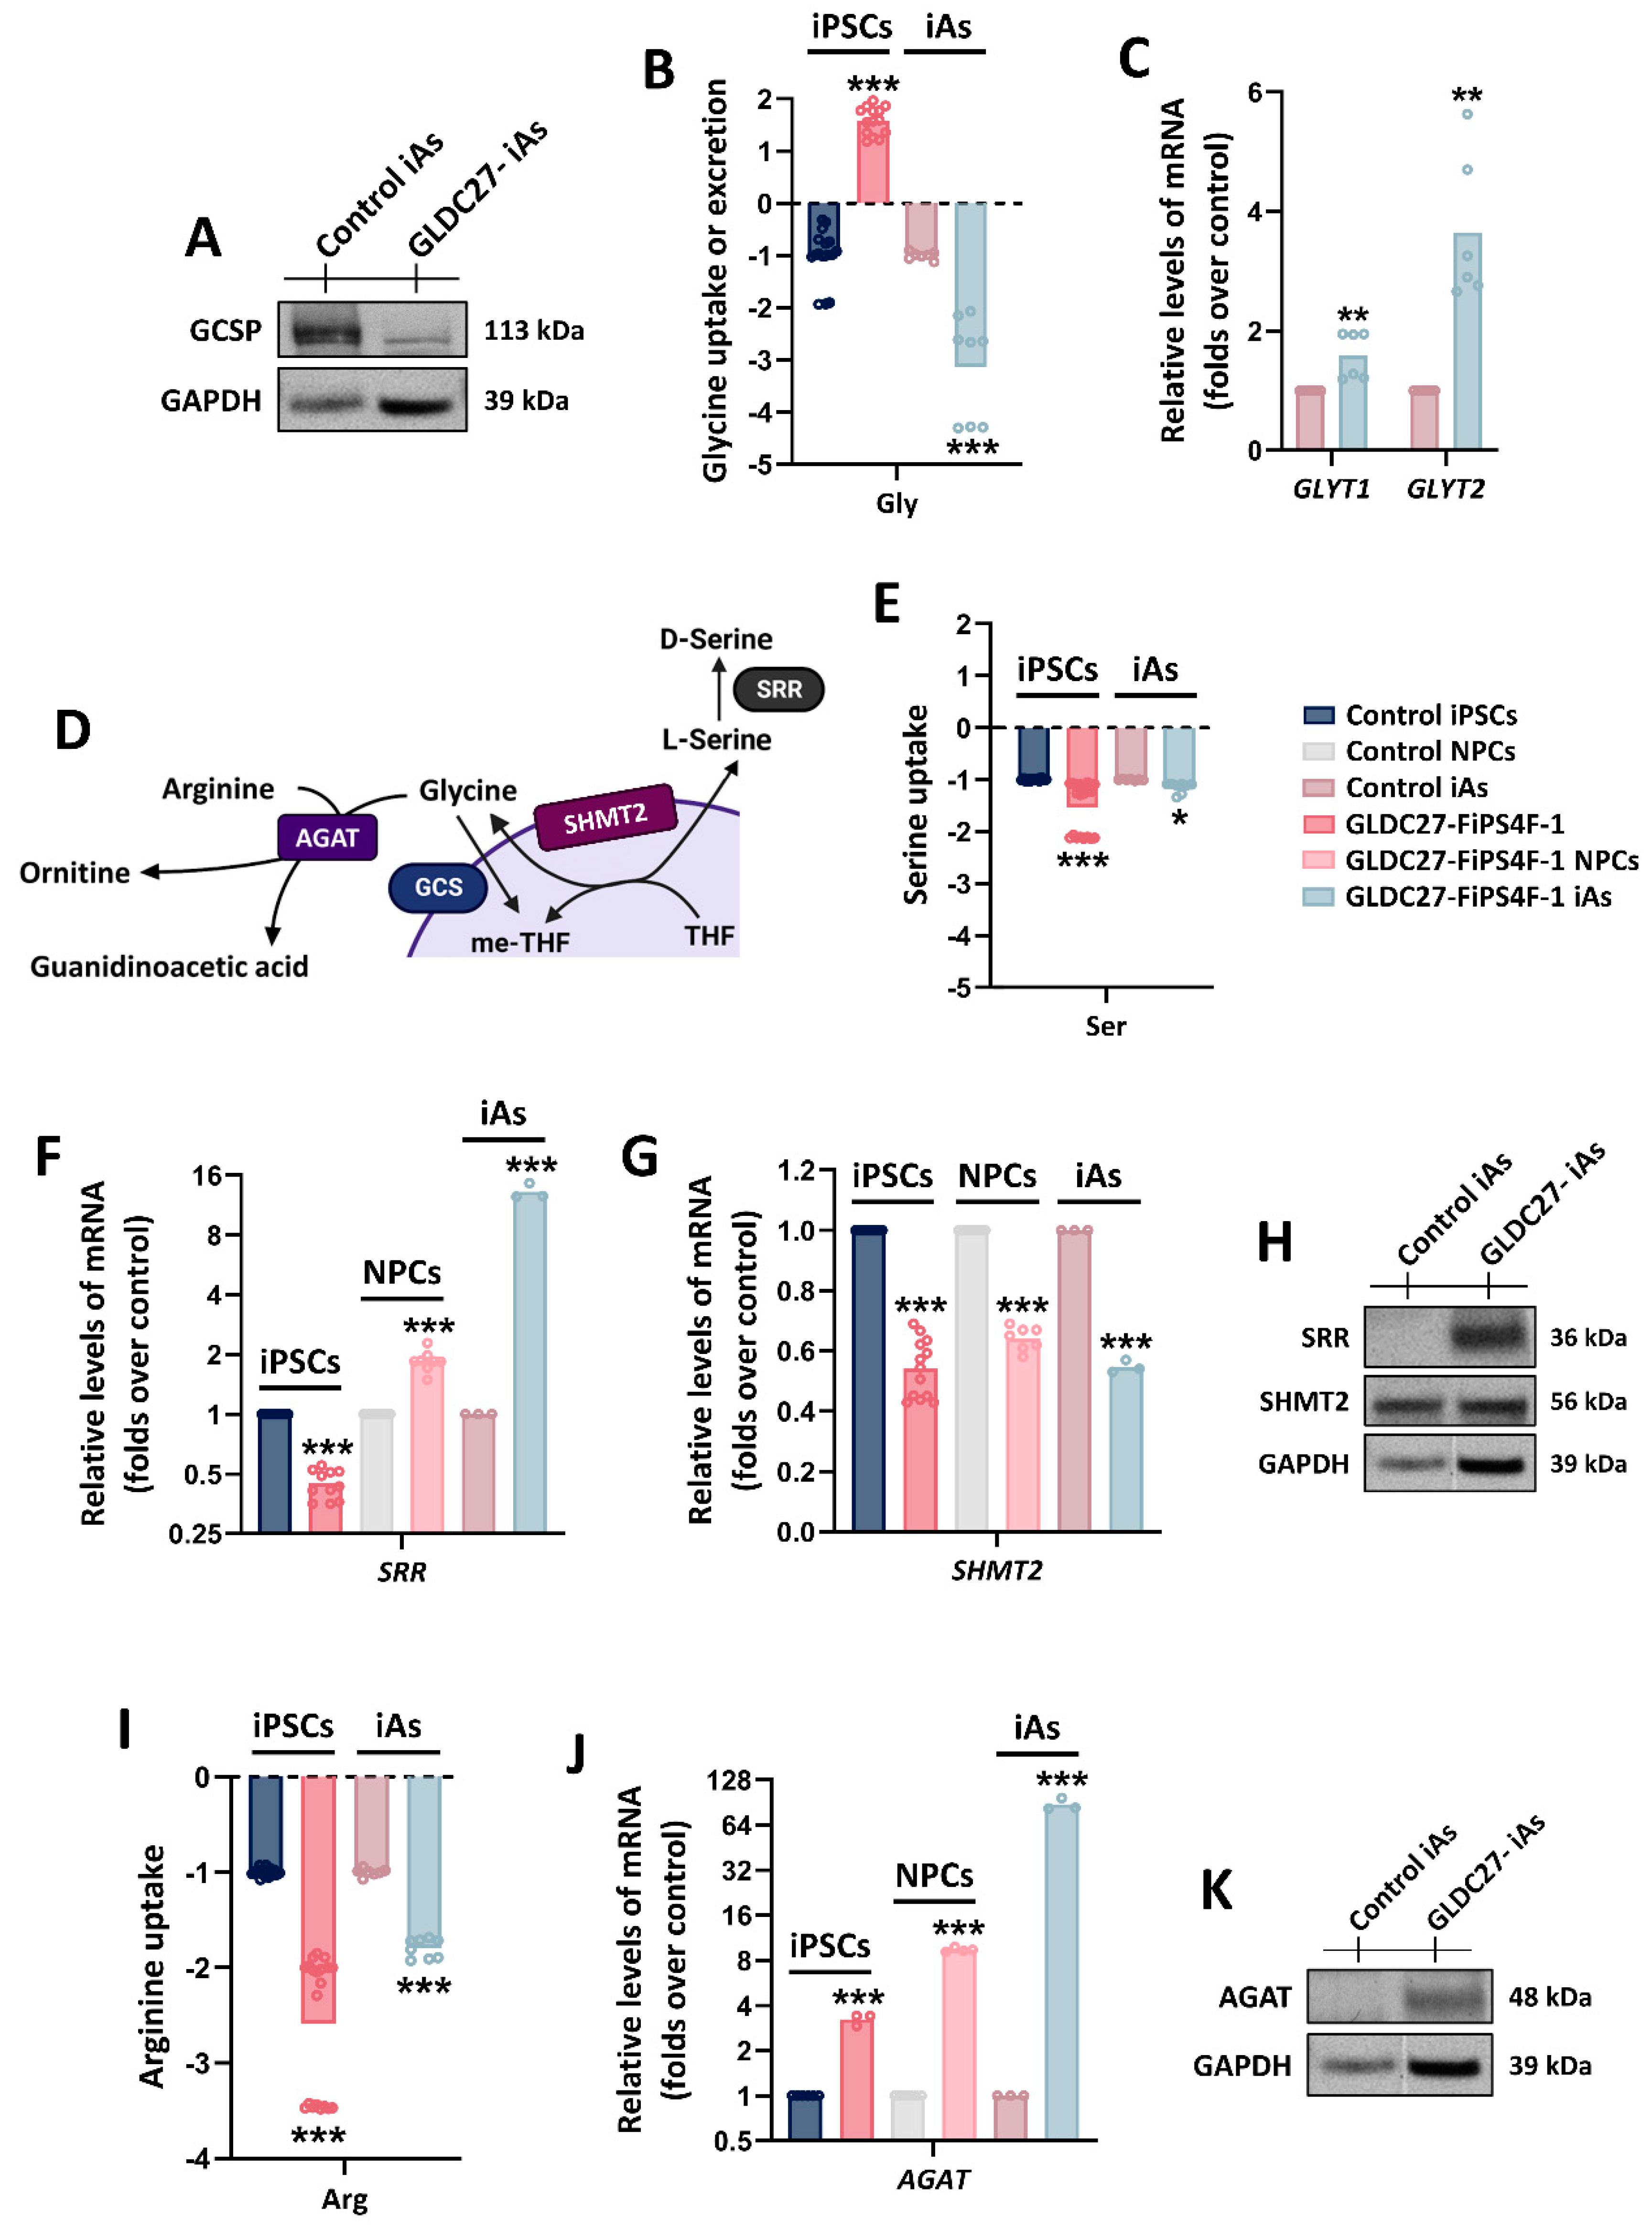
After confirming the absence of GCSP protein in GLDC27-FiPS4F-1 iAs (Figure 9A), we proceed to compare the amino acid levels with those detected in the control iAs culture and the corresponding iPSCs. Notably, there was a significantly higher uptake of glycine from the medium in GLDC27-FiPS4F-1 iAs compared to control iAs (Figure 9B). Consistent with this finding, the expression levels of the glycine transporters GLYT1 and GLYT2 were respectively 1.5 and 4 times higher in the GLDC27-FiPS4F-1 iAs than in the control (Figure 9C). Subsequently, we examined the expression levels of representative genes (Figure 9D) to assess the flux through alternative metabolic pathways that could help maintain physiological glycine levels. No significative alterations in serine uptake from the medium profile were detected in GLDC-deficient iAs (Figure 9E). We measured the expression of the SRR gene, which encodes serine racemase, to estimate the synthesis of D-serine from L-serine. The expression of this gene consistently increased during the differentiation process. However, at the astrocyte stage, the expression level in patient-derived cells was ten times higher than in control iAs (Figure 9F). On the contrary, the expression of the SHMT2 gene was impaired in the GLDC-deficient iPSCs, NPCs, and iAs (Figure 9G). These results were further confirmed at the protein level (Figure 9H). Additionally, we observed an increased demand for arginine from the medium observed in GLDC27-FiPS4F and GLDC27-FiPS4F-1 iAs (Figure 9I). This finding was concordant with a simultaneous increase in AGAT gene expression (Figure 9J, 9K), which encodes for L-arginine: glycine amidino transferase, in the GLDC-deficient iPSCs, NPCs, and iAs.
3. Discussion
The primary aim of this study was to establish a valid human model of GLDC deficiency to serve as a basis for testing potential therapeutic strategies in Nonketotic Hyperglycinemia (NKH). We generated a human iPSCs line that exhibited biochemical characteristics of GLDC deficiency while maintaining pluripotency, the capability to differentiate into three germ layers and genomic stability [9]. The GLDC27-FiPS4F-1 line showed a noteworthy decrease in the amounts of GCSP protein and the assembled GCS complex. The decarboxylase activity in this line was only 15% of that in the control line. Due to the impaired ability of the NKH line to catabolize glycine, there was an accumulation of this amino acid in the culture medium. In contrast, the control line required the uptake glycine. We hypothesize that this remaining GCS activity enables the cells to survive and develop adaptive mechanisms to compensate for the reduced enzyme activity.
The impact of GLDC deficiency on cellular metabolism was evaluated by quantifying specific sets of metabolites and proteins. Previous studies had reported disturbances in the serine shuttle and metabolism in NKH patients [11]. In GLDC27-FiPS4F-1, we observed an increased demand for serine, methionine, and cysteine from the extracellular milieu, which could be understood in the context of the cellular response to maintain 5,10-methylen-THF. We investigated whether this specific metabolite pattern could be explained by a down or up-regulation of specific metabolic pathways related to the serine-glycine-one-carbon metabolism. The “de novo” process of serine synthesis begins with 3-phosphoglycerate (3-PG), which is then sequentially processed by the enzymes PHGDH, PSAT1, and PSPH. Our findings indicate a significant increase in PHGDH expression, accompanied by a decrease in PSAT1 and PSPH gene expression in the patient-derived line.
The main function of PHGDH in proliferative cells is to maintain folate stores intended for nucleotide synthesis [12]. Consistent with the significant reduction in NADH production via the GCS flux, GLDC27-FiPS4F-1 cells seemed to process 3-PG to obtain NADH but reduced the expression of the other enzymes in the pathway, resulting in poor L-serine synthesis. This could justify the increase in serine uptake from the medium. We also detected impairment in mitochondrial SHMT2 and MTHFD2 and increases in the cytosolic SHMT1 and MTHFD1. These variations from normal flux may reflect a compensatory cytosolic mechanism to reverse the loss of mitochondrial one-carbon metabolism, like that described in [13] for proliferating mammalian cell lines. Our study found that despite the metabolic shift to meet the proliferative demand of the iPSCs, there was a concomitant alteration in cell growth and cell cycle progression, with a significant number of cells in quiescence. This was consistent with the decreased demand for aspartate and a nearly 50% decline in levels of nucleotide metabolites, as described in [14]. Furthermore, in line with earlier findings in mouse models and human cells [15], culture medium from GLDC27-FiPS4F-1 exhibited a substantial decrease in glutathione levels, probably implying a greater necessity to counteract ROS production.
The data support a metabolic rewiring at the pluripotent stage in GLDC27-FiPS4F-1, which is necessary but probably insufficient to meet the changing biosynthetic demands at different cell cycle stages and could influence cell fate during the differentiation process. The expression of GCS in radial glia has been proposed as a relevant factor in the proper development of the cerebral cortex [16]. We evaluated the capacity of iPSCs to differentiate into astrocytes through an intermediate stage of neural progenitors capable of producing neurons and glial cells.
The loss of OCT3/4 and LIN28B markers, accompanied by the gain of PAX6, NES, and SOX1 expression compared to the iPSC stage, confirmed that both cell lines correctly differentiated to the NPC stage [17]. Differences in morphology and expression of neuroepithelial and neuronal lineage markers, which appeared up-regulated, were observed in the patient-derived NPC line. This observation may indicate premature senescence and differentiation, in agreement with the reduced cell viability and proliferative capacity measured in patient-derived iPSCs [18,19]. To characterize iAs, we evaluated an extensive set of astrocytic markers including GFAP, S100ß, ALDH1L1, AQP4, APOE, GLAST, and GLT-1 [20,21,22]. All markers exhibited significantly higher expression in iAs compared to NPCs, confirming their higher degree of astroglia differentiation. However, we noted differences in the morphology and relative expression of specific markers between control and patient-derived iAs. The control group displayed a quiescent morphology, characterized by reduced expression of GFAP and GLAST, and increased level of GLT-1, all of which are typical of mature astrocytes [23]. In contrast, the iAs derived from the patient showed a fibrous or radial morphology. Relative to the control group, these cells exhibited reduced GLT-1 expression and significant increases in GFAP and GLAST expression. Such changes have also been observed in radial glia and astrocytes [24], supporting the notion that a considerable proportion of radial glia cells are present in GLDC27-FiPS4F-1 iAs [25,26,27]. Elevated GFAP expression has also been linked to reactive phenotypes associated with pathological conditions [20,26,27,28]. Furthermore, we observed increased expression of the neuronal markers MAP2 and NeuN in GLDC27-FiPS4F-1 iAs, indicating the presence of mature neurons in this culture. A ten-fold increase in SRR gene expression detected in GLDC27-FiPS4F-1 iAs culture corroborated these findings [27]. Additionally, the GLDC27-FiPS4F-1 iAs culture exhibited significant increases in glutamate and glycine uptake, along with elevated expression of glycine transporters (GLYT1 and GLYT2) [32,33]. Considering the presence of neurons, these changes may represent a regulatory response to maintain neurotransmitter balance in an active neural network, as both amino acids serve as neurotransmitters in the central nervous system (CNS) [30].
Finally, we hypothesized that GLDC-deficient cells would activate metabolic pathways to re-establish glycine homeostasis. We observed a significant increase in arginine absorption, accompanied by substantial upregulation in AGAT gene expression at both the iPSC and iA stages. This pattern is compatible with an increased synthesis of guanidinoacetate like that described in the brains of adult Gldc-deficient mice [31]. Such upregulation could adjust the intracellular glycine concentration by enhancing the synthesis of guanidinoacetate, acting as an 'exit strategy.'
4. Materials and Methods
4.1. Cell Culture Conditions
Healthy CC2509 fibroblasts (Lonza, Basel, CHE) and patient-derived fibroblasts were cultivated according to standard procedures and used before reaching 10 passages. In brief, the cells were maintained in Minimum Essential Medium (MEM) (Sigma- Aldrich, St Louis, MO, USA) supplemented with 1% (v/v) glutamine, 10% fetal bovine serum (FBS) and a 0.1% antibiotic mixture (penicillin/streptomycin) under standard cell culture conditions (37°C, 95% relative humidity, 5% CO2).
4.2. iPSCs Characteristics
One healthy control iPSCs line (registered as FiPS Ctrl2-SV4F-1), matched for age, sex, ethnicity and reprograming method with the GLDC27-FiPS4F-1 line used in this study, was obtained from the Banco Nacional de Líneas Celulares of the Instituto de Salud Carlos III. The GLDC27-FiPS4F-1 line was reprogrammed at our laboratory [9] from NKH patient-derived fibroblasts who suffered a severe clinical course and carried two biallelic variants in the GLDC gene that led to a significant decrease in protein levels and exchange activity in vitro, as previously described [10]. These were then registered in the Banco Nacional de Líneas Celulares of the Instituto de Salud Carlos III as GLDC27-FiPS4F-1.
4.3. Genetic Background of the iPSCs Lines
Prior to beginning iPSCs differentiation, we identified potential pathogenic nucleotide sequence variations in both cell lines using array CGH and whole exome sequencing. Variants from over 2000 genes were filtered based on minor allele frequency (MAF), while also considering commonly occurring mitochondrial DNA mutations in iPSCs clones. Annex 1 presents a summary of the identified variations in both cell lines.
4.4. Sample Collection and Metabolite Analysis
Harvested at two days of culture in mTeSR, six-well plates of each cell line, as described [36], were counted. Aliquots of the spent-culture medium and the corresponding cells, without any residual medium, were collected separately and immediately frozen in liquid nitrogen and stored at -80°C until analysis. Blank culture medium samples were also collected and stored under the same conditions. Both medium and cell extracts were processed and deproteinized before measurement. Amino acids were measured by Ionic Exchange Chromatography (IEC). Purines and pyrimidines were determined by High-Performance Liquid Chromatography (HPLC) according to [37,38]. Total homocysteine, quantified after derivatization with SBD-F by HPLC with fluorescence detection, was measured as described in [39,40]. The results of the spent-culture medium represent the consumption or excretion values of the metabolite using the baseline value measured in the blank medium. Raw data were in pmol/µg protein /72h. Total protein concentrations were measured by Bradford’s assay.
4.5. Oxygen Consumption Rate (OCR) Evaluation
Cellular Consumption Respiration (OCR) was analyzed using the Flux Analyzer XFe96 (Agilent-Seahorse) device. We seeded iPSCs or NPCs on Matrigel-coated Seahorse XF96 cell plates. The test was carried out using the Seahorse XF Cell Mito Stress Test Kit (Agilent). Before measurements, cells were washed and incubated for 1 h at 37°C in CO2-free conditions in XF DMEM Medium pH 7.4 (Agilent), previously warmed and supplemented with pyruvate, glucose, and glutamine at final concentrations of 1mM, 10mM and 2mM, respectively. Subsequently, various drugs were sequentially injected to reach a final concentration of oligomycin (1.5μM), carbonyl-cyanide-p-trifluoro-methoxy phenylhydrazone (FCCP 20μM), and a combination of rotenone/antimycin A (0.5 μM each). FCCP concentration was previously optimized through titration. Following the completion of the measurement, all wells in the p96 plate were stained with Hoechst (1:100) for 30 min at room temperature. The number of cells per well was quantified for data normalization using the Cytation 5 image reader. The data obtained were processed using software provided by the manufacturer (seahorseanalytics.agilent.com).
4.6. Cell Viability and Cycle Progression
Cell viability assays were conducted 72 h after plating iPSCs seeded at varying densities (10,000; 20,000 and 40,000 cells per well) using the CellTiter 96 Aqueous One Solution Cell Proliferation kit® on 96-well plates, following the manufacturer’s protocol. For cell cycle analysis via flow cytometry, iPSCs prepared as described in [27] were treated with Propidium Iodide/RNase Staining Buffer (BD Pharmingen, San Diego, CA, USA) for 30 minutes at 37°C in darkness. The data were collected using a BD FACSCanto II flow cytometer (BD Biosciences, San Jose, CA) and FACSDiva software. The relative percentages of cells in the sub-G1/G1, S, and G2/M phases of the cell cycle were determined using FlowJo v.2.0 software.
4.7. RT-qPCR
Total RNA was extracted using TRIzol and subsequently converted to cDNA with the NZY First-Strand cDNA Synthesis (NZYTech) kit. Amplification was performed using Perfecta SYBR Master Mix (Quantabio) on a LightCycler 480 (Roche). Primers were designed by using the Primer3 software. For data normalization, three different genes - ACTB, GAPDH and GUSB - were initially analyzed, with ACTB proving to be the most stable. Relative quantification was carried out using the standard 2-ΔΔCt method. See Table S1 for primers sequences.
4.7. Mitochondrial DNA Content
Mitochondrial DNA (mtDNA) content was calculated using quantitative RT-PCR by measuring the threshold cycle ratio (ΔCt) of the mitochondria-encoded genes mtDNA ND1 and 12S and the nuclear 18S. Data were expressed as mtDNA/nuclear DNA (nDNA).
4.8. Enzymatic Activity
4.9. Protein Levels by SDS Western Blot
Cell lysates were prepared using a lysis buffer (2% Triton X-100, 10% glycerol, 150 mM NaCl, 10 mM Tris–HCl pH 7.5, 150 mM NaCl) and subjected to freeze-thaw cycles. The resulting supernatants were used for western blotting, with protein concentration determined using the Bradford method (Bio-Rad Laboratories, Hercules, CA). Electrophoretic separation was performed using two different systems: NuPAGE gradient gels of 4-12% acrylamide or manually prepared 10% acrylamide/bisacrylamide gels. Both systems employed Lonza’s ProSieve™ Color Protein Markers as molecular weight standards. Following electrophoresis, gels were transferred onto 0.2 mm nitrocellulose membranes using the iBlot Gel Transfer Stacks Nitrocellulose Regular system. In all studies, detection was achieved using a secondary horseradish peroxidase-conjugated antibody, followed by membrane development with ECL (GE Healthcare, Piscataway, NJ). Band intensities were quantified using a BioRad G-8000 scanner. The specific antibodies used in this study are listed in Table S2.
4.10. Protein Complex Analysis in Native Conditions
The analysis of the GCS complex was conducted using the NativePAGE™ Novex® Bis-Tris Gel System (Invitrogen). Cell sediments were resuspended in a mixture of 2% digitonin, 4X Sample Buffer and dH2O and incubated for 15 min at 4°C. This was followed by centrifugation at 20,000 g for 15 min to collect the supernatant, whose protein concentration was measured using the Bradford method. Prior to loading onto NativePAGE™ Novex 3-12% gels, G-250 additive was added to the samples. The electrophoretic separation was carried out in two phases. After separation, the gels were washed and incubated with 2 x transfer buffer, and then transferred to PVDF membranes with the iBlot™ 2 Gel Transfer Device (Invitrogen). This was followed of an incubation with 8% acetic acid and subsequent washing with 100% methanol. Finally, the immunodetection procedure was performed using primary and secondary antibodies, as detailed in Table S2.
4.11. Immunofluorescence Staining
For Immunofluorescence staining, cells were fixed in 10% formalin for 20 min at room temperature, washed with 0.1% PBS-Tween, and permeabilized with PBS/0.1% Triton X-100 for 10 min. The cells were then incubated in a blocking solution for a minimum of 30 min. Following this, cells were incubated overnight at 4˚C with primary antibodies at appropriate concentrations (Table S2). Next, secondary antibodies, already conjugated to fluorophores (ThermoFisher), were incubated in the blocking solution at the appropriate concentrations for 30 min. To stain cell nuclei, DAPI at a dilution 1:5,000 (Merck) was used. The cells were then mounted using Prolong Diamond Antifade (ThermoFisher). The samples were examined using an Axiovert200 inverted microscope (Zeiss, Jena, Germany) equipped with GFP, DsRed and Cy5 fluorescence filters (10X, 25X and 40X). Image visualization and fluorescence quantification were carried out using the ImageJ-FiJi software.
4.12. Differentiation to Neural Progenitor Cells (NPCs) and induced Astrocytes (iAs)
Both Ctrl2-SV4F-1 and GLDC27-FiPS4F-1 iPSC lines underwent differentiation into Neural Progenitor Cells (NPCs) following an adapted protocol as described previously described [43] and following the supplier’s instructions. We implemented a rigorous standardization of iPSCs reprogramming and differentiation. Both cell lines matched for time in culture and passages. Cells plating densities were optimized to prevent potential alterations due to local growth factors. A panel of cell markers was used to assess cell types along the differentiation pathway, and the quality of cultures was monitored by evaluating cellular functionality.
Briefly, iPSCs were seeded at a density of 250,000 cells per well in Matrigel-coated 6-well plates (Corning) using mTesR plus (STEMCell Technologies) containing 10μM ROCK inhibitor Y-27632 (STEMCell Technologies). On day 3, the medium was switched to STEMdiffTM SMADi Neuronal Induction Kit (STEMCell Technologies) and refreshed daily. By day 8, the cells were replated at a density of 250,000 cells/cm2 on Matrigel-coated 6-well plates. This process was repeated twice more. After the third passage, the culture medium was changed to STEMdiffTM Neural Progenitor Medium, with daily replacements. At this differentiation stage, cells were analyzed using RT-qPCR and immunofluorescence for expression of the NPCs markers SOX1, PAX6 and NES. Cell banks at this passage were cryopreserved in STEMdiffTM Neural Progenitor Freezing Medium, employing a slow freezing protocol (approximately 1°C/min reduction) according to the supplier’s guidelines.
For astrocyte differentiation, cryopreserved NPCs were thawed in Matrigel-coated 6-well plates. Once 80-90% confluence was reached, NPCs were harvested using AcutaseTM (Millipore) and plated at a density of 2 x 10⁵ cells/cm2 in STEMdiffTM Astrocyte Differentiation Medium (STEMCell Technologies) in a Matrigel® (Corning) precoated 6-well plates. After seven days in culture, with daily medium changes, the first cell colony passage was performed. The cells were dissociated using AcutaseTM (Millipore) and seeded at 1.5 x 10⁵ cells/cm2 in new Matrigel® treated 6-well plates (Corning). This process was repeated twice. From the second passage (day 14 of the differentiation process), the culture medium was changed every 48 hours. Following the third passage, the culture medium was switched to STEMdiffTM Astrocyte Maturation. After three further passages in STEMdiffTM Astrocyte Maturation, the developed cell line was characterized through confocal microscopy, RT-qPCR analysis of specific markers, and functional evaluation of glutamate transport. Additionally, expression analysis of proteins related to NKH pathology, serine-glycine-one-carbon metabolism, and metabolite measurement in the culture medium were conducted at this stage.
4.13. Glutamate Uptake
Glutamate transport was quantified using previously established methods [44]. In brief, 2.5 x 10⁵ iAs cells underwent preincubation with 0.5 ml of HEPES-buffered saline for 10 min, followed by incubation in 250 µL HEPES-buffered saline containing [U-14C]-glutamate (0.1 pCi) for 15 min. Subsequently, cells were rinsed with 2 x 0.5 ml fresh HEPES-buffered saline (2-4°C) within 5 s and dissolved in 250 µL of 0.2 M NaOH. A 150 µL sample was placed in micro vials and measured for radioactivity using a liquid scintillation counter. The collected data were normalized to the protein content measured through Bradford’s assay.
4.14. Statistical Analysis
The statistical significance was obtained using a two-tailed Student t-test performed with the GraphPad Prism 6 program. Differences were considered significant at p values of *<0.05; **<0.01; ***<0.001. GraphPad Prism 6 program and BioRender were used for images.
5. Conclusions
Our research shows consistent results at the iPSC stage, indicating their potential as a tool for early-stage NKH disease research. GLDC-deficient iPSCs exhibited high resilience and survival capacity through metabolic adaptations or "rewiring". However, the deficiency resulted in diminished cell viability and proliferative capacity, leading to cellular quiescence. These observations supported previous findings in murine pluripotent stem cells that suggested that activation of GCS by GLDC is a critical regulator of cell fate determination [32,33,34,35]. Therefore, the first therapeutic interventions for this disease should be carried out during early embryonic stages. The differentiation of iPSCs lines into iAs resulted in complex outcomes. Our results suggest that GLDC deficiency may lead to irregular differentiation, resulting in a heterogeneous cell culture. Although caution must be exercised in interpreting these results, this study may provide new insights into the neurological features of NKH, but further research is needed.
Supplementary Materials
The following supporting information can be downloaded at the website of this paper posted on Preprints.org. Annex 1: Genetic background of the iPSCs; Table S1: Oligonucleotide sequence; Table S2: Antibodies used.
Author Contributions
Conceptualization: PRP, BP. Methodology: LAC, IBA, ER, MC, FGM. Investigation: LAC, IBA, FZ, ER. Resources: MU, BP. Data curation: PRP, IBA, RN. Formal analysis: LAC, PRP. Writing, reviewing, and editing: all authors. Supervision and funding acquisition: PRP and BP
Funding
This research was funded by the Instituto de Salud Carlos (ISCIII), the European Regional Development Fund [PI22/00699]. The institutional grant of Fundación Ramón Areces (Madrid, Spain) is also acknowledged. Laura Arribas-Carreíra has been funded by Asociación Española Para el Estudio de Enfermedades Metabólicas Congénitas (AEPEMEC).
Institutional Review Board Statement
The study was conducted according to the guidelines of the Declaration of Helsinki and approved by the Ethics Committee of Universidad Autónoma Madrid codes: CEI-105- 2052 (March 13, 2020) and CEI-129- 2655 (February 3, 2023).
Informed Consent Statement
Informed consent was obtained from all subjects involved in the study.
Acknowledgments
We thank Dr Álvaro Briso-Montiano, Esmeralda Barroso, Aristides López-Márquez and Mar Álvarez for their advice on the iPSC work. We thank the optical, confocal and electron microscopy units of the Centro de Biología Molecular Severo Ochoa. We are especially grateful to the parents of the NKH patient. They gave us the opportunity to deepen the study of the pathology. We would also like to thank Dra Celia Pérez-Cerdá and Dr Ignacio Arroyo for their enthusiastic collaboration.
Conflicts of Interest
The authors declare no conflicts of interest.
References
- Van Hove JLK, Coughlin C II, Swanson M, et al. Nonketotic Hyperglycinemia. 2002 Nov 14 [Updated 2019 May 23]. In: Adam MP, Feldman J, Mirzaa GM, et al., editors. GeneReviews® [Internet]. Seattle (WA): University of Washington, Seattle; 1993-2024. https://www.ncbi.nlm.nih.gov/books/NBK1357/.
- Tort, F.; Ferrer-Cortes, X.; Thio, M.; Navarro-Sastre, A.; Matalonga, L.; Quintana, E.; Bujan, N.; Arias, A.; Garcia-Villoria, J.; Acquaviva, C.; et al. Mutations in the Lipoyltransferase LIPT1 Gene Cause a Fatal Disease Associated with a Specific Lipoylation Defect of the 2-Ketoacid Dehydrogenase Complexes. Hum Mol Genet 2013. [CrossRef] [PubMed]
- Baker, P.R.; Friederich, M.W.; Swanson, M.A.; Shaikh, T.; Bhattacharya, K.; Scharer, G.H.; Aicher, J.; Creadon-Swindell, G.; Geiger, E.; MacLean, K.N.; et al. Variant Non Ketotic Hyperglycinemia Is Caused by Mutations in LIAS, BOLA3 and the Novel Gene GLRX5. Brain 2014, 137, 366–379. [Google Scholar] [CrossRef] [PubMed]
- Riché, R.; Liao, M.; Pena, I.A.; Leung, K.-Y.; Lepage, N.; Greene, N.D.E.; Sarafoglou, K.; Schimmenti, L.A.; Drapeau, P.; Samarut, É. Glycine Decarboxylase Deficiency–Induced Motor Dysfunction in Zebrafish Is Rescued by Counterbalancing Glycine Synaptic Level. JCI Insight 2018, 3, e124642. [Google Scholar] [CrossRef] [PubMed]
- Tian, S.; Feng, J.; Cao, Y.; Shen, S.; Cai, Y.; Yang, D.; Yan, R.; Wang, L.; Zhang, H.; Zhong, X.; et al. Glycine Cleavage System Determines the Fate of Pluripotent Stem Cells via the Regulation of Senescence and Epigenetic Modifications. Life Sci Alliance 2019, 2. [Google Scholar] [CrossRef] [PubMed]
- Sato, K. Why Does Hyperglycinemia Exhibit so Grave Brain Anomalies and so Severe Neurological Symptoms? J Theor Biol 2018, 455, 97–100. [Google Scholar] [CrossRef] [PubMed]
- Santos, C.; Pai, Y.J.; Mahmood, M.R.; Leung, K.-Y.; Savery, D.; Waddington, S.N.; Copp, A.J.; Greene, N.D.E. Impaired Folate 1-Carbon Metabolism Causes Formate-Preventable Hydrocephalus in Glycine Decarboxylase–Deficient Mice. Journal of Clinical Investigation 2020, 130, 1446–1452. [Google Scholar] [CrossRef] [PubMed]
- Pai, Y.J.; Leung, K.-Y.; Savery, D.; Hutchin, T.; Prunty, H.; Heales, S.; Brosnan, M.E.; Brosnan, J.T.; Copp, A.J.; Greene, N.D.E. Glycine Decarboxylase Deficiency Causes Neural Tube Defects and Features of Non-Ketotic Hyperglycinemia in Mice. Nat Commun 2015, 6. [Google Scholar] [CrossRef]
- Arribas-Carreira, L.; Bravo-Alonso, I.; Lopez-Marquez, A.; Alonso-Barroso, E.; Briso-Montiano, A.; Arroyo, I.; Ugarte, M.; Perez, B.; Perez-Cerda, C.; Rodriguez-Pombo, P.; et al. Generation and Characterization of a Human IPSC Line (UAMi005-A) from a Patient with Nonketotic Hyperglycinemia Due to Mutations in the GLDC Gene. Stem Cell Res 2019, 39, 101503. [Google Scholar] [CrossRef]
- Bravo-Alonso, I.; Navarrete, R.; Arribas-Carreira, L.; Perona, A.; Abia, D.; Couce, M.L.; Garcia-Cazorla, A.; Morais, A.; Domingo, R.; Ramos, M.A.; et al. Nonketotic Hyperglycinemia: Functional Assessment of Missense Variants in GLDC to Understand Phenotypes of the Disease. Hum Mutat 2017, 38, 678–691. [Google Scholar] [CrossRef]
- Swanson, M.A.; Miller, K.; Young, S.P.; Tong, S.; Ghaloul-Gonzalez, L.; Neira-Fresneda, J.; Schlichting, L.; Peck, C.; Gabel, L.; Friederich, M.W.; et al. Cerebrospinal Fluid Amino Acids Glycine, Serine, and Threonine in Nonketotic Hyperglycinemia. J Inherit Metab Dis 2022, 45, 734–747. [Google Scholar] [CrossRef]
- Reid, M.A.; Allen, A.E.; Liu, S.; Liberti, M.V.; Liu, P.; Liu, X.; Dai, Z.; Gao, X.; Wang, Q.; Liu, Y.; et al. Serine Synthesis through PHGDH Coordinates Nucleotide Levels by Maintaining Central Carbon Metabolism. Nat Commun 2018, 9, 5442. [Google Scholar] [CrossRef]
- Ducker, G.S.; Chen, L.; Morscher, R.J.; Ghergurovich, J.M.; Esposito, M.; Teng, X.; Kang, Y.; Rabinowitz, J.D. Reversal of Cytosolic One-Carbon Flux Compensates for Loss of the Mitochondrial Folate Pathway. Cell Metab 2016, 23, 1140–1153. [Google Scholar] [CrossRef]
- Mukha, D.; Fokra, M.; Feldman, A.; Sarvin, B.; Sarvin, N.; Nevo-Dinur, K.; Besser, E.; Hallo, E.; Aizenshtein, E.; Schug, Z.T.; et al. Glycine Decarboxylase Maintains Mitochondrial Protein Lipoylation to Support Tumor Growth. Cell Metabolism 2022, 34, 775–782.e9. [Google Scholar] [CrossRef]
- Jog, R.; Chen, G.; Wang, J.; Leff, T. Hormonal Regulation of Glycine Decarboxylase and Its Relationship to Oxidative Stress. Physiol Rep 2021, 9. [Google Scholar] [CrossRef] [PubMed]
- Sato, K. Why Is Glycine Cleavage System Segmentally Expressed in Radial Glia? J Theor Biol 2019, 470, 17–19. [Google Scholar] [CrossRef]
- Chambers, S.M.; Fasano, C.A.; Papapetrou, E.P.; Tomishima, M.; Sadelain, M.; Studer, L. Highly Efficient Neural Conversion of Human ES and IPS Cells by Dual Inhibition of SMAD Signaling. Nat Biotechnol 2009, 27, 275–280. [Google Scholar] [CrossRef]
- Kang, P.J.; Zheng, J.; Lee, G.; Son, D.; Kim, I.Y.; Song, G.; Park, G.; You, S. Glycine Decarboxylase Regulates the Maintenance and Induction of Pluripotency via Metabolic Control. Metabolic Engineering 2019, 53, 35–47. [Google Scholar] [CrossRef] [PubMed]
- Tian et al. - 2019 - Glycine Cleavage System Determines the Fate of Plu.Pdf. [CrossRef]
- Escartin, C.; Galea, E.; Lakatos, A.; O’Callaghan, J.P.; Petzold, G.C.; Serrano-Pozo, A.; Steinhäuser, C.; Volterra, A.; Carmignoto, G.; Agarwal, A.; et al. Reactive Astrocyte Nomenclature, Definitions, and Future Directions. Nat Neurosci 2021, 24, 312–325. [Google Scholar] [CrossRef]
- Clavreul, S.; Dumas, L.; Loulier, K. Astrocyte Development in the Cerebral Cortex: Complexity of Their Origin, Genesis, and Maturation. Frontiers in Neuroscience 2022, 16. [Google Scholar] [CrossRef]
- Gorina, Y.V.; Salmina, A.B.; Erofeev, A.I.; Gerasimov, E.I.; Bolshakova, A.V.; Balaban, P.M.; Bezprozvanny, I.B.; Vlasova, O.L. Astrocyte Activation Markers. Biochemistry Moscow 2022, 87, 851–870. [Google Scholar] [CrossRef] [PubMed]
- Roybon, L.; Lamas, N.J.; Garcia-Diaz, A.; Yang, E.J.; Sattler, R.; Jackson-Lewis, V.; Kim, Y.A.; Kachel, C.A.; Rothstein, J.D.; Przedborski, S.; et al. Human Stem Cell-Derived Spinal Cord Astrocytes with Defined Mature or Reactive Phenotypes. Cell Reports 2013, 4, 1035–1048. [Google Scholar] [CrossRef] [PubMed]
- Engel, M.; Do-Ha, D.; Muñoz, S.S.; Ooi, L. Common Pitfalls of Stem Cell Differentiation: A Guide to Improving Protocols for Neurodegenerative Disease Models and Research. Cell Mol Life Sci 2016, 73, 3693–3709. [Google Scholar] [CrossRef] [PubMed]
- Doetsch, F.; Caillé, I.; Lim, D.A.; García-Verdugo, J.M.; Alvarez-Buylla, A. Subventricular Zone Astrocytes Are Neural Stem Cells in the Adult Mammalian Brain. Cell 1999, 97, 703–716. [Google Scholar] [CrossRef]
- Lattke, M.; Guillemot, F. Understanding Astrocyte Differentiation: Clinical Relevance, Technical Challenges, and New Opportunities in the Omics Era. WIREs Mechanisms of Disease 2022, 14, e1557. [Google Scholar] [CrossRef]
- Wolosker, H. Serine Racemase and the Serine Shuttle between Neurons and Astrocytes. Biochim Biophys Acta 2011, 1814, 1558–1566. [Google Scholar] [CrossRef] [PubMed]
- Gomeza, J.; Hülsmann, S.; Ohno, K.; Eulenburg, V.; Szöke, K.; Richter, D.; Betz, H. Inactivation of the Glycine Transporter 1 Gene Discloses Vital Role of Glial Glycine Uptake in Glycinergic Inhibition. Neuron 2003, 40, 785–796. [Google Scholar] [CrossRef]
- Shahsavar, A.; Stohler, P.; Bourenkov, G.; Zimmermann, I.; Siegrist, M.; Guba, W.; Pinard, E.; Sinning, S.; Seeger, M.A.; Schneider, T.R.; et al. Structural Insights into the Inhibition of Glycine Reuptake. Nature 2021, 591, 677–681. [Google Scholar] [CrossRef]
- Bonvento, G.; Bolaños, J.P. Astrocyte-Neuron Metabolic Cooperation Shapes Brain Activity. Cell Metabolism 2021, 33, 1546–1564. [Google Scholar] [CrossRef]
- Leung, K.; De Castro, S.C.P.; Santos, C.; Savery, D.; Prunty, H.; Gold-Diaz, D.; Bennett, S.; Heales, S.; Copp, A.J.; Greene, N.D.E. Regulation of Glycine Metabolism by the Glycine Cleavage System and Conjugation Pathway in Mouse Models of NON-KETOTIC Hyperglycinemia. J of Inher Metab Disea 2020, 43, 1186–1198. [Google Scholar] [CrossRef]
- Tian, S.; Feng, J.; Cao, Y.; Shen, S.; Cai, Y.; Yang, D.; Yan, R.; Wang, L.; Zhang, H.; Zhong, X.; et al. Glycine Cleavage System Determines the Fate of Pluripotent Stem Cells via the Regulation of Senescence and Epigenetic Modifications. Life Sci. Alliance 2019, 2, e201900413. [Google Scholar] [CrossRef]
- Panopoulos, A.D.; Yanes, O.; Ruiz, S.; Kida, Y.S.; Diep, D.; Tautenhahn, R.; Herrerías, A.; Batchelder, E.M.; Plongthongkum, N.; Lutz, M.; et al. The Metabolome of Induced Pluripotent Stem Cells Reveals Metabolic Changes Occurring in Somatic Cell Reprogramming. Cell Res 2012, 22, 168–177. [Google Scholar] [CrossRef]
- KDM5B Focuses H3K4 Methylation near Promoters and Enhancers during Embryonic Stem Cell Self-Renewal and Differentiation - PMC. Available online: https://www.ncbi.nlm.nih.gov/pmc/articles/PMC4053761/ (accessed on 17 January 2024).
- Shyh-Chang, N.; Ng, H.-H. The Metabolic Programming of Stem Cells. Genes Dev 2017, 31, 336–346. [Google Scholar] [CrossRef]
- Alonso-Barroso, E.; Brasil, S.; Briso-Montiano, A.; Navarrete, R.; Perez-Cerda, C.; Ugarte, M.; Perez, B.; Desviat, L.R.; Richard, E. Generation and Characterization of a Human IPSC Line from a Patient with Propionic Acidemia Due to Defects in the PCCA Gene. Stem Cell Res 2017, 23, 173–177. [Google Scholar] [CrossRef]
- Simmonds, H.A.; Duley, J.A.; Fairbanks, L.D.; McBride, M.B. When to Investigate for Purine and Pyrimidine Disorders. Introduction and Review of Clinical and Laboratory Indications. J Inherit Metab Dis 1997, 20, 214–226. [Google Scholar] [CrossRef]
- Castro, M.; Perez-Cerda, C.; Merinero, B.; Garcia, M.J.; Bernar, J.; Gil Nagel, A.; Torres, J.; Bermudez, M.; Garavito, P.; Marie, S.; et al. Screening for Adenylosuccinate Lyase Deficiency: Clinical, Biochemical and Molecular Findings in Four Patients. Neuropediatrics 2002, 33, 186–189. [Google Scholar] [CrossRef] [PubMed]
- Gilfix, B.M.; Blank, D.W.; Rosenblatt, D.S. Novel Reductant for Determination of Total Plasma Homocysteine. Clinical Chemistry 1997, 43, 687–688. [Google Scholar] [CrossRef] [PubMed]
- Pfeiffer, C.M.; Huff, D.L.; Gunter, E.W. Rapid and Accurate HPLC Assay for Plasma Total Homocysteine and Cysteine in a Clinical Laboratory Setting. Clin Chem 1999, 45, 290–292. [Google Scholar] [CrossRef] [PubMed]
- Toone, J.R.; Applegarth, D.A.; Coulter-Mackie, M.B.; James, E.R. Biochemical and Molecular Investigations of Patients with Nonketotic Hyperglycinemia. Mol Genet Metab 2000, 70, 116–121. [Google Scholar] [CrossRef]
- Lowry, O.H.; Rosebrough, N.J.; Farr, A.L.; Randall, R.J. Protein Measurement with the Folin Phenol Reagent. J Biol Chem 1951, 193, 265–275. [Google Scholar] [CrossRef]
- Chambers, S.M.; Fasano, C.A.; Papapetrou, E.P.; Tomishima, M.; Sadelain, M.; Studer, L. Highly Efficient Neural Conversion of Human ES and IPS Cells by Dual Inhibition of SMAD Signaling. Nature Biotechnology 2009, 27, 275–280. [Google Scholar] [CrossRef]
- Casado, M.; Bendahan, A.; Zafra, F.; Danbolt, N.C.; Aragón, C.; Giménez, C.; Kanner, B.I. Phosphorylation and Modulation of Brain Glutamate Transporters by Protein Kinase C. J Biol Chem 1993, 268, 27313–27317. [Google Scholar] [CrossRef] [PubMed]
Figure 1.
GCS complex in the GLDC27-FiPS4F-1 line. (A) Relative quantification of GLDC, GCSH and AMT gene expression in GLDC27-FiPS4F-1 line related to control iPSCs. Standardization was performed using the endogenous ACTB gene. Data represents the average of n=3 biological replicates conducted in triplicate. (B) Representative SDS-PAGE western blot of GCSP, GCSH, and GCST proteins in iPSCs lines. GAPDH was used as the loading control. (C) Supramolecular structure analysis using native gels under non-denaturing conditions and GCSP or GCSH antibodies. CV-ATP5α was used as the loading control. (D) Glycine exchange enzyme activity evaluation in control and NKH patient fibroblasts as well as in control and GLDC27-FiPS4F-1 iPSCs lines. Data represents the average of n=2 biological replicates conducted in triplicate. (E, F) Immunofluorescence staining and laser scanning confocal imaging of GCS complex proteins in control and GLDC27-FiPS4F-1 iPSCs. Scale bar: 10 μm. 40X magnification. Data represents the average of n=3 biological replicates conducted in triplicate. (A, D) Statistical analysis t student (*p<0.05; **p<0.01; ***p<0.001).
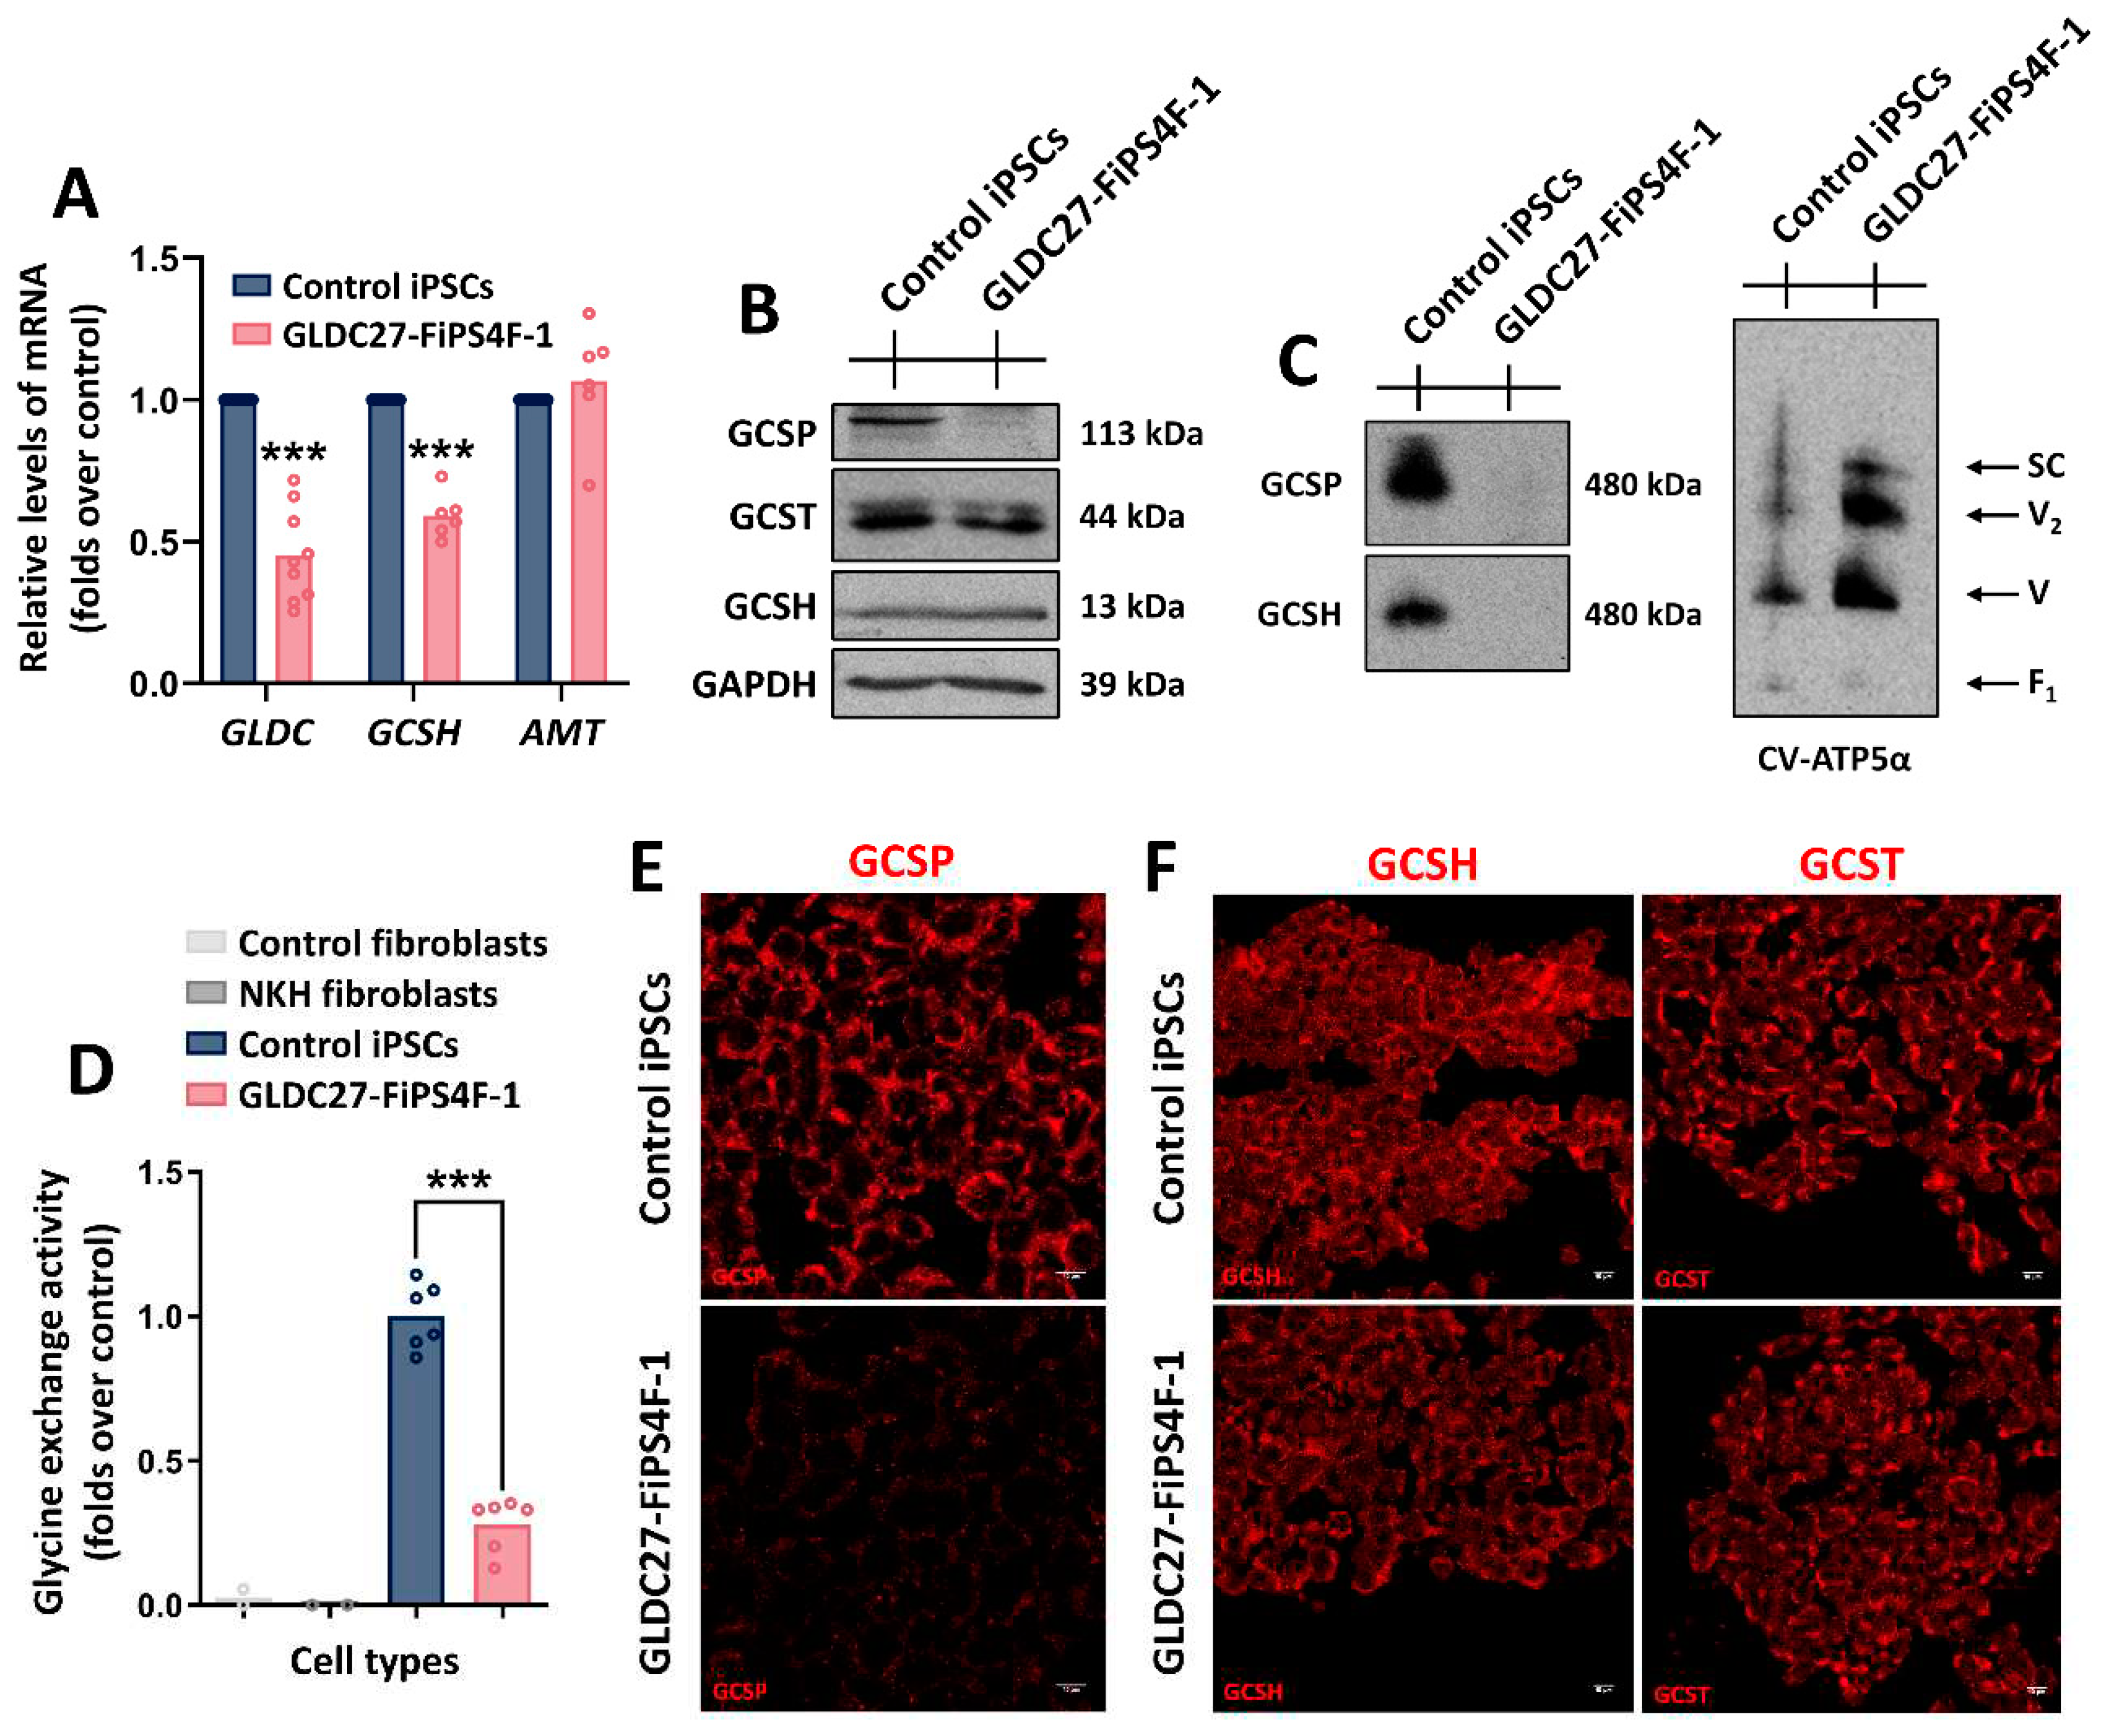
Figure 2.
Relative quantification of amino acids and GSH in the extracellular medium after 72 hours of culture. Simplified overview of amino acids metabolism in the cell. The colors represent different amino acid metabolic groups as defined by the KEGG platform (https://www.genome.jp/kegg/pathway.html#amino). Metabolite measurements were performed on n=20-30 samples in iPSCs lines that had undergone 3-6 passages post-thawing. The graphs illustrate the GLDC27-FiPS4F-1 line (different pink, red and brown shades) capacity for uptake or secretion of various metabolites compared to that of the control iPSCs line (blue). The control line is assigned a value of 1 or -1, indicating whether it (1) or absorbs (-1) the metabolite from the medium. The dotted line represents the 0 value. All values obtained in the measurement are normalized by protein. Baseline values of each metabolite in the medium were used to determine the iPSCs lines’ behavior (either uptake or secretion). Statistical analysis t student (*p<0.05; **p<0.01; ***p<0.001). ACoA: acetyl-CoA; 3-H-3-MGCoA: 3-hydroxy-3-methylglutaryl-CoA; SCoA: succinyl-CoA; α-KG: α -ketoglutarate; 3-M-2-OP: 3-methyl-2-oxopentanoate; 2-O-IP: 2-amino-3-ketobutyrate; SAM: S-adenosylmethionine; 5,10 MTHF: 5,10-methylenetetrahydrofolate; P5C: pyrroline-5-carboxylate; GA: guanidinoacetic acid; ORT: ornithine; GSH: glutathione.
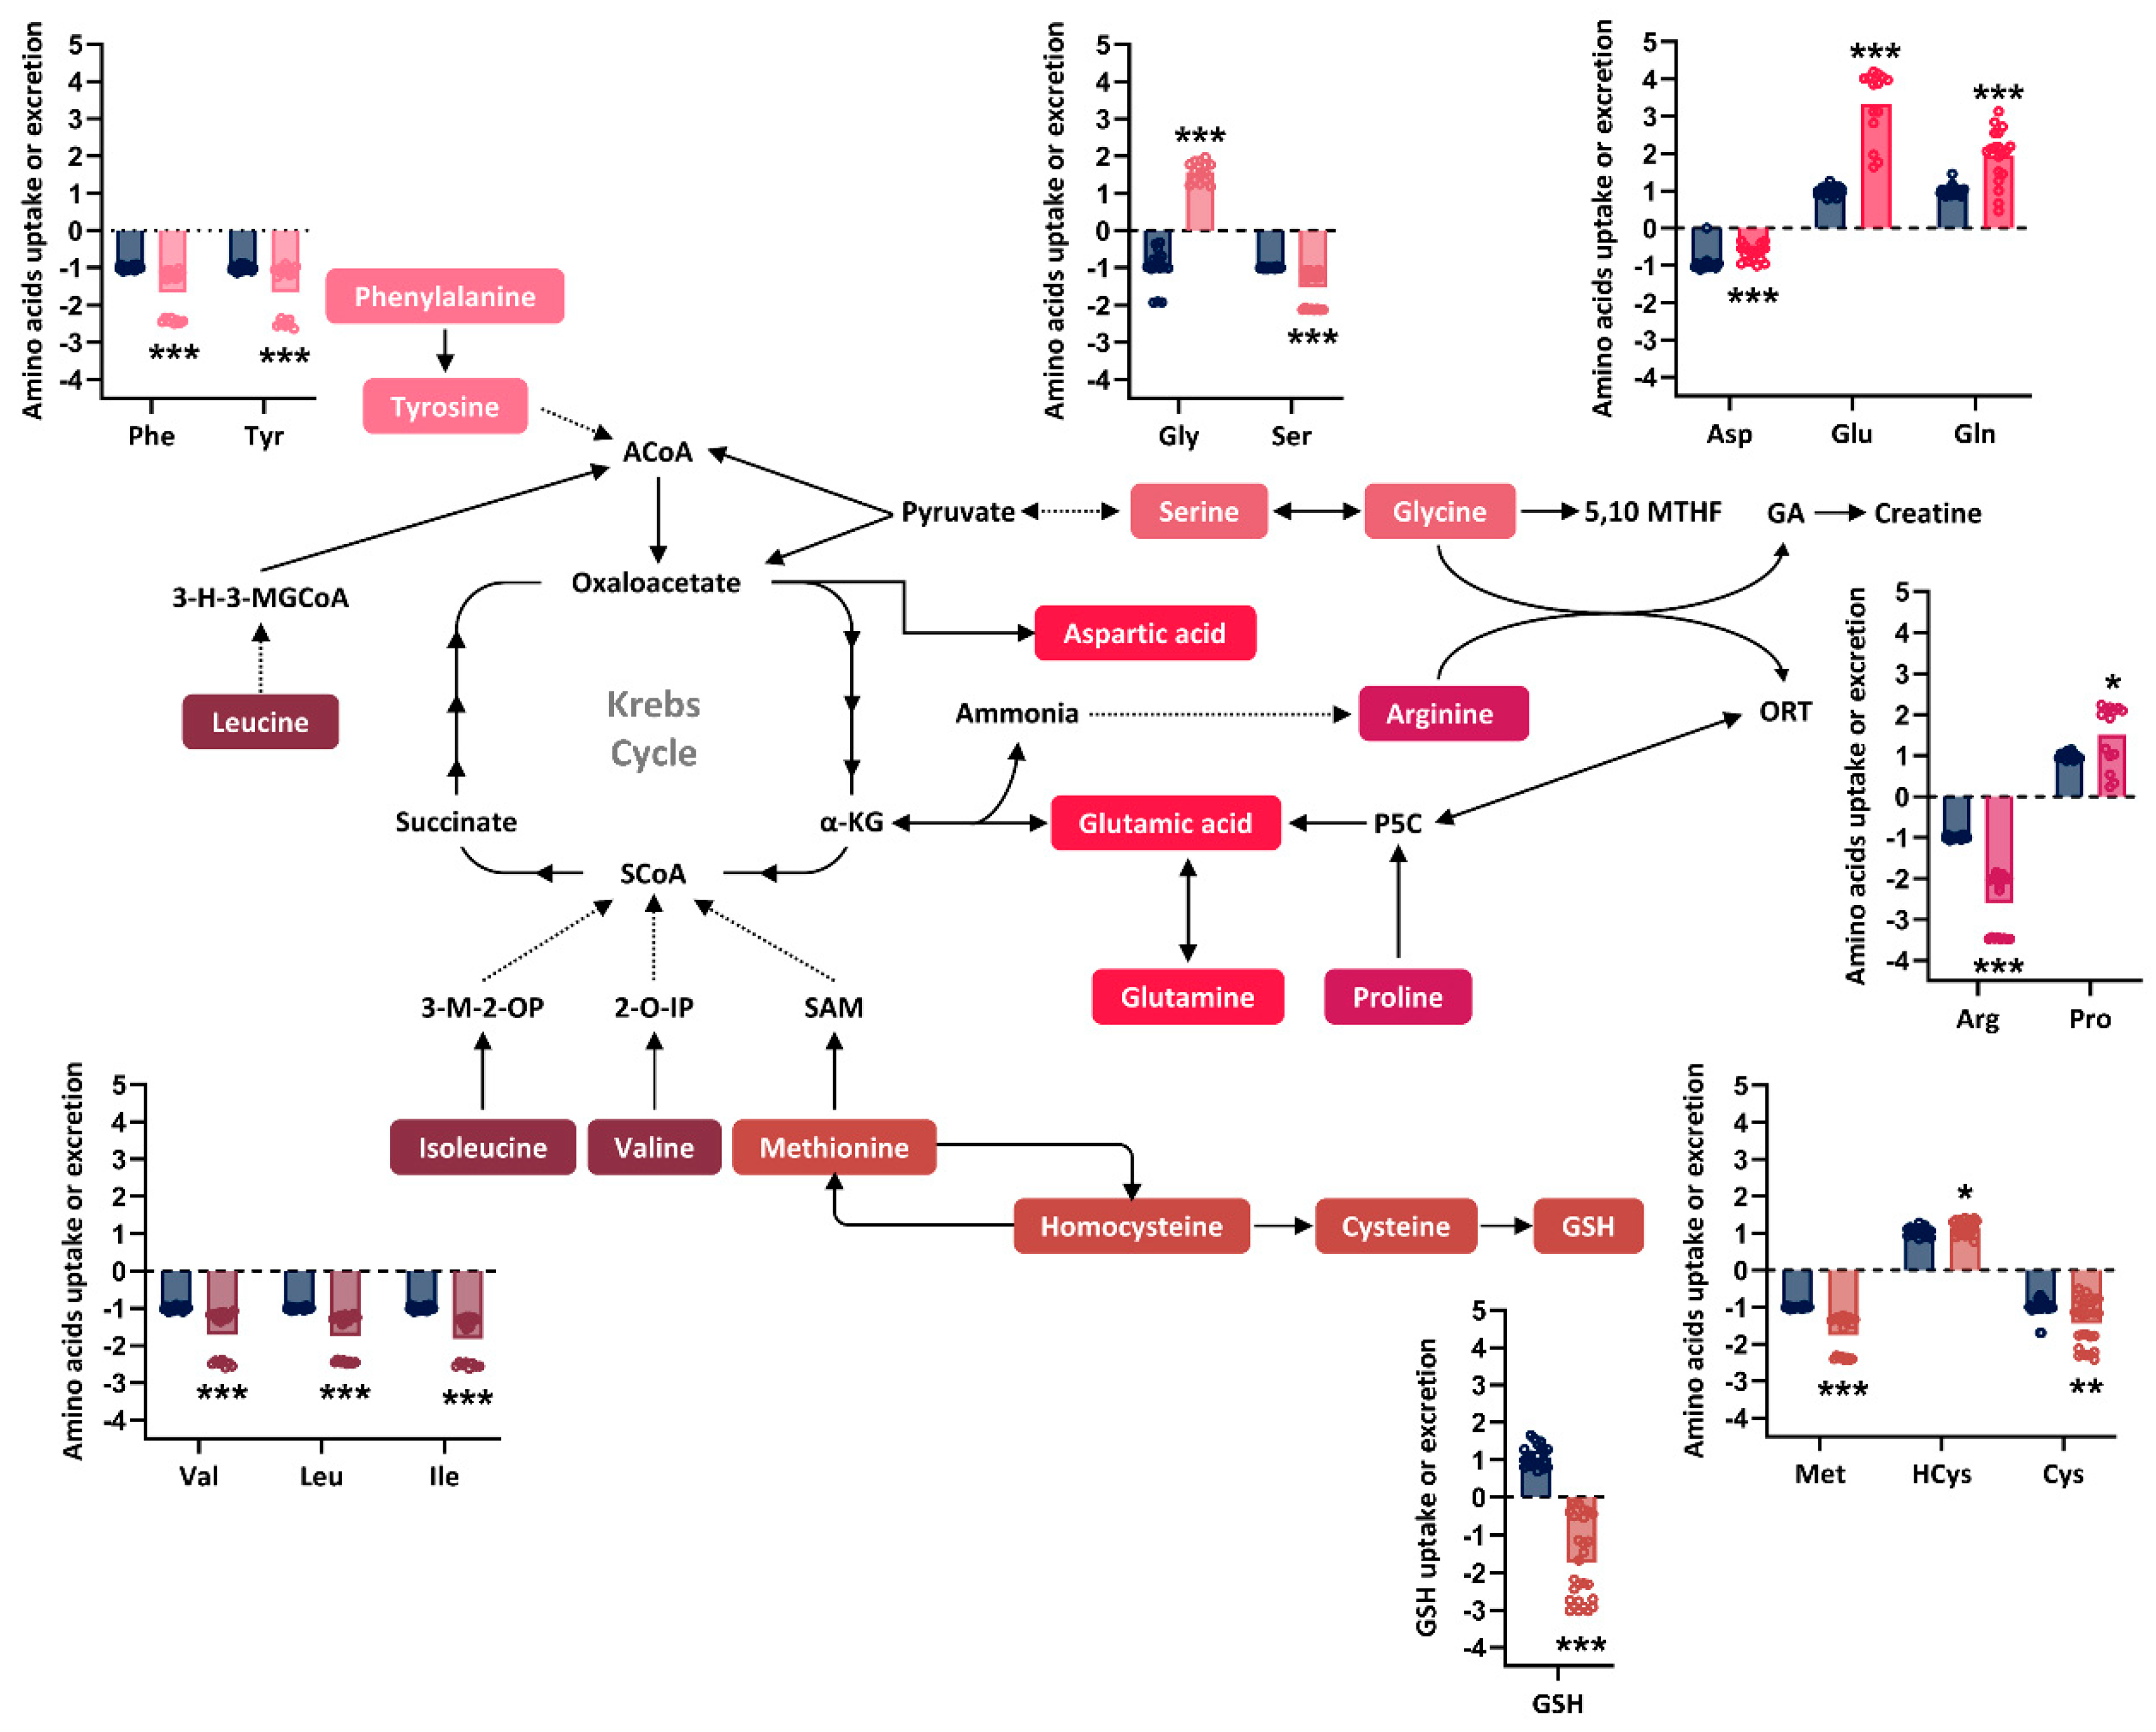
Figure 3.
Serine-glycine-one-carbon metabolism. (A) Relative quantification by RT-qPCR of genes related to serine-glycine metabolism (PHGDH, PSAT1, PSPH, SHMT1, and SHMT2) and genes involved in one-carbon metabolism (folate cycle) (MTHFD1, MTHFD2, MTHFR, DHFR, and TYMS). Data were standardized against the endogenous ACTB gene. Data represent the average of n=3 biological replicates conducted in triplicate. (B) Representative western blot and protein quantification using GAPDH as loading control. Data represents the average of n=2 biological replicates. (A, B) Statistical analysis t student (*p<0.05; **p<0.01; ***p<0.001).
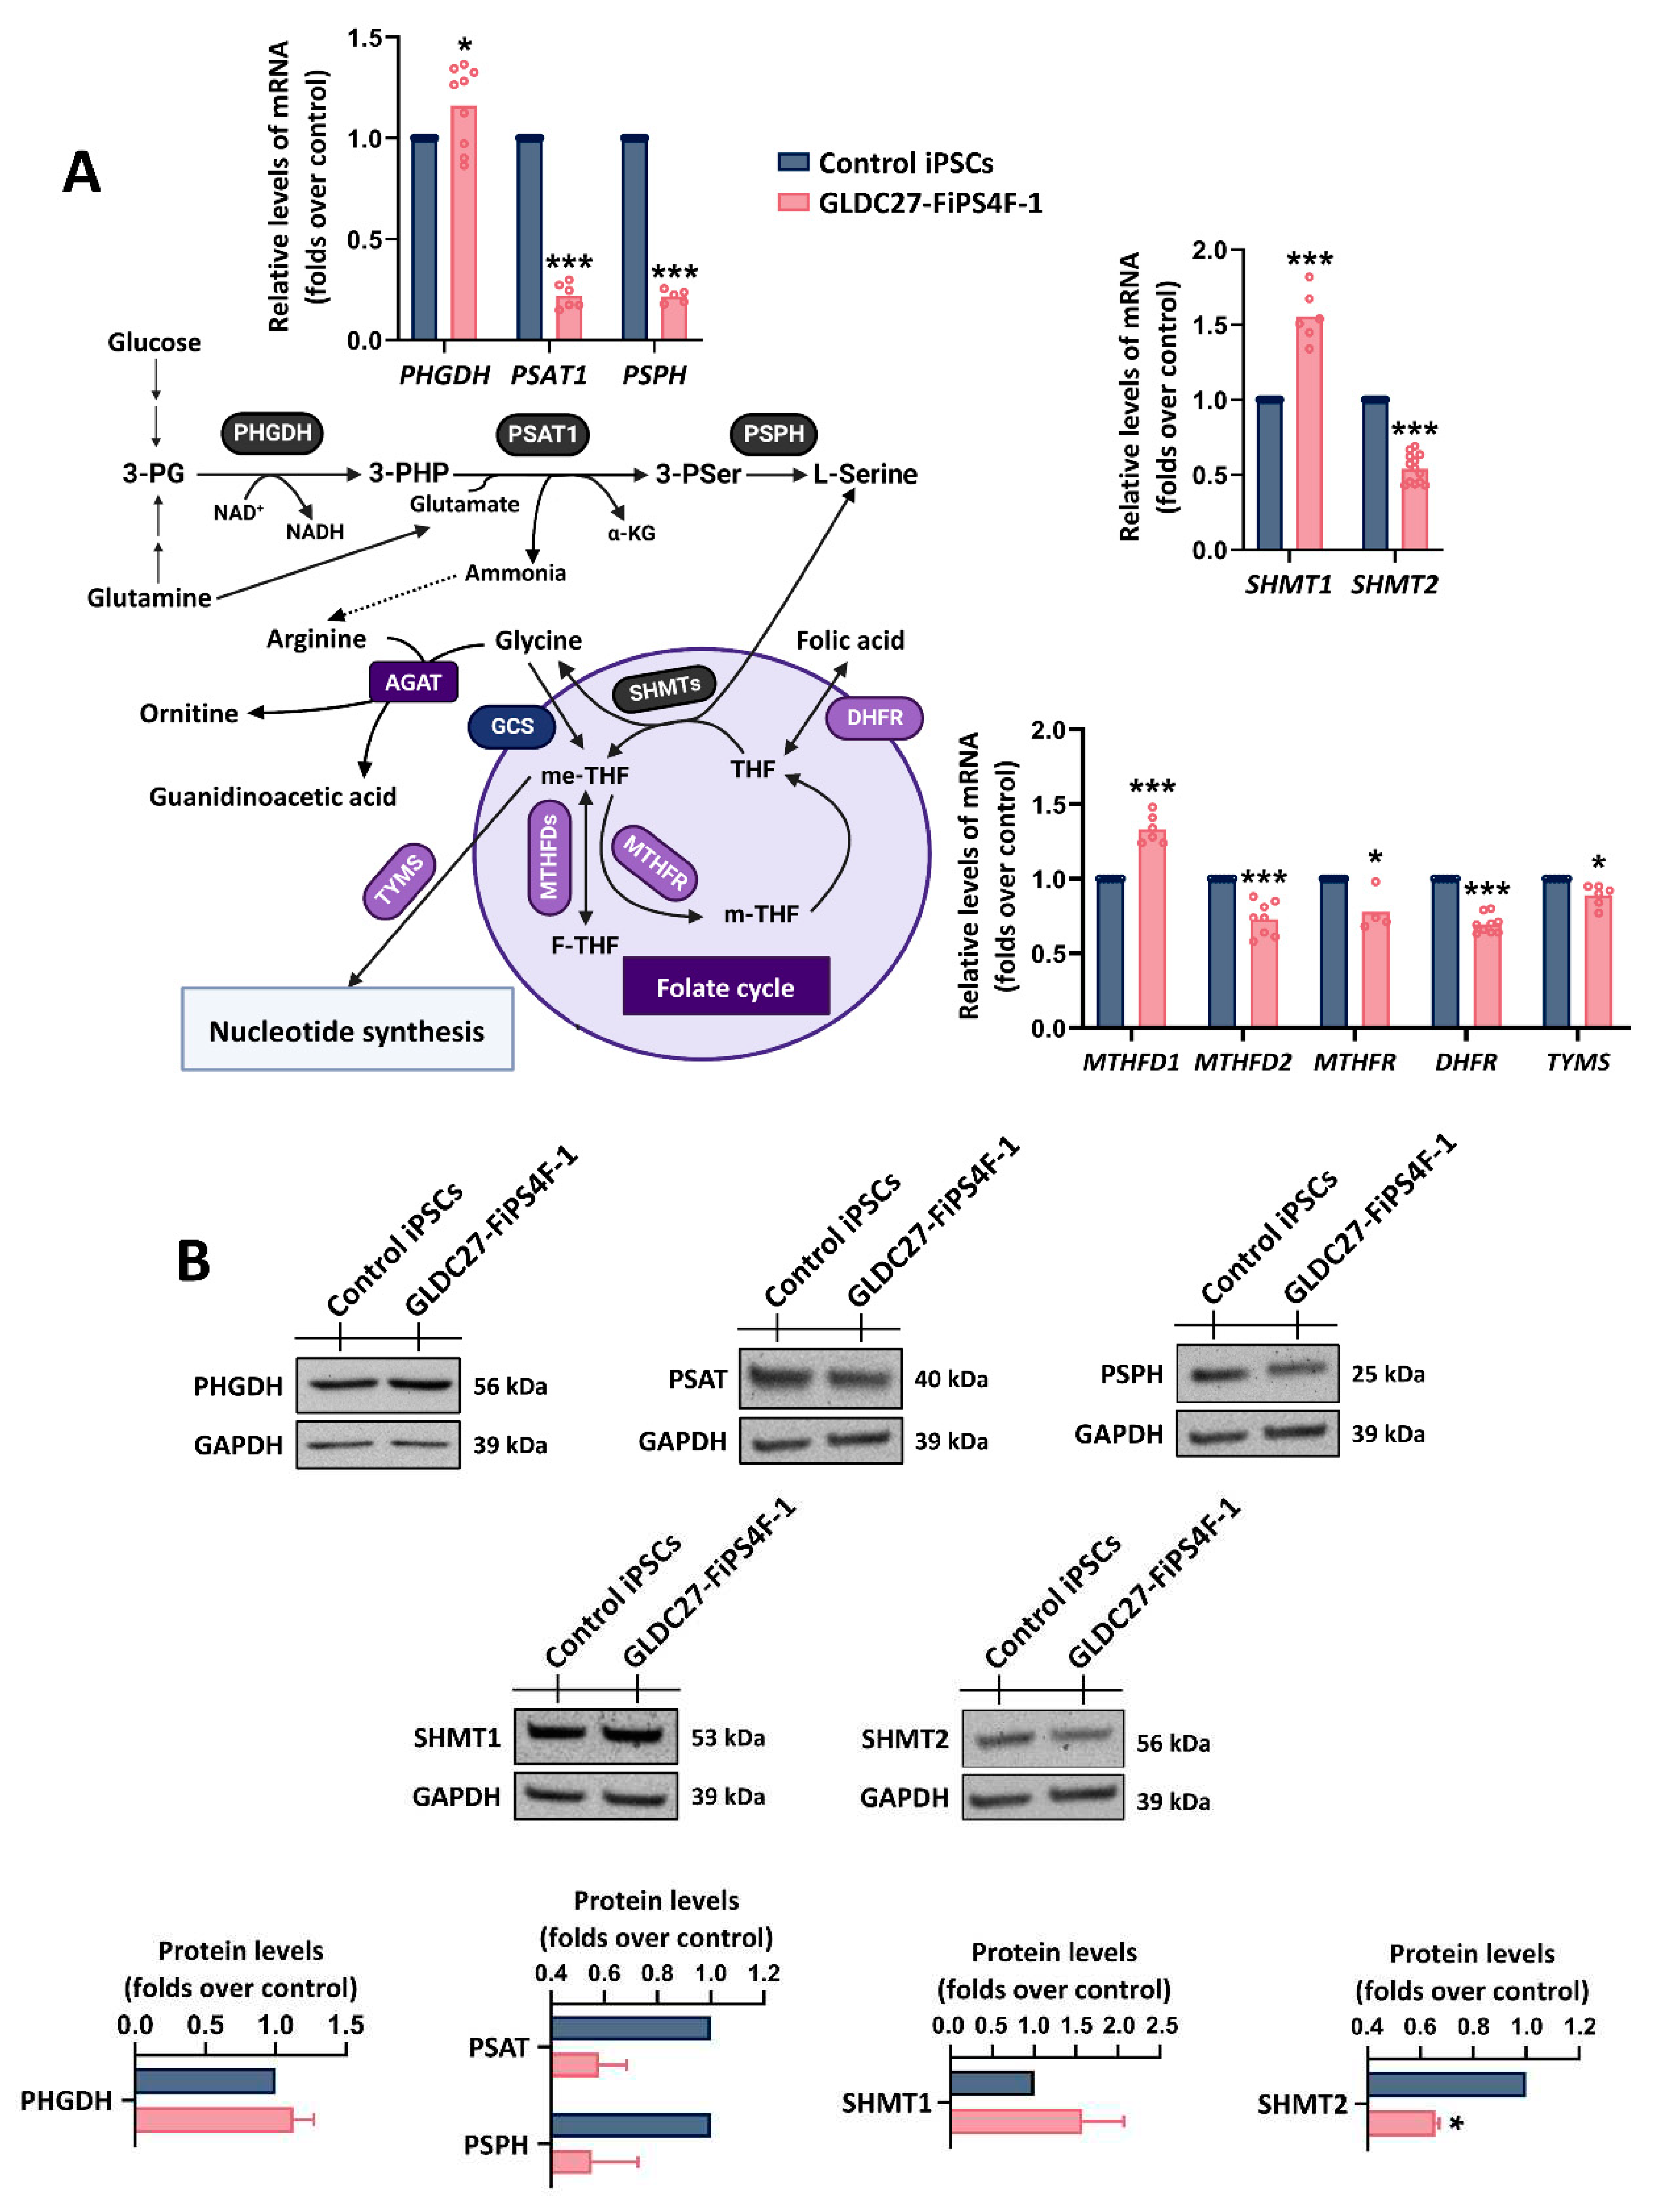
Figure 4.
Nucleotide synthesis, viability, and cell cycle of iPSCs lines. (A) Relative quantification of intracellular purines and pyrimidines derivatives levels in control and GLDC27-FiPS4F-1 extracts after 72 hours of culture. Nucleotide measurements were performed on n=17 iPSCs samples that had undergone 3-6 passes post-thawing. (B) Relative quantification of GLDC27-FiPS4F-1 cell density at three different platting densities compared to the control line measured after 72 hours of culture. (C) Analysis of cell cycle distribution by flow cytometry. On bars, percentages represent the fraction of cells in each cycle stage. Data represents the average of n=3 biological replicates conducted in triplicate. (D) Schematic representation and relative quantification of cyclin-coding genes and CDKs-coding genes expression involved in cell cycle regulation. Data represents the average of n=2 biological replicates conducted in triplicate and was standardized against the endogenous ACTB gene. (A-D) Statistical analysis t student (*p<0.05; **p<0.01; ***p<0.001).
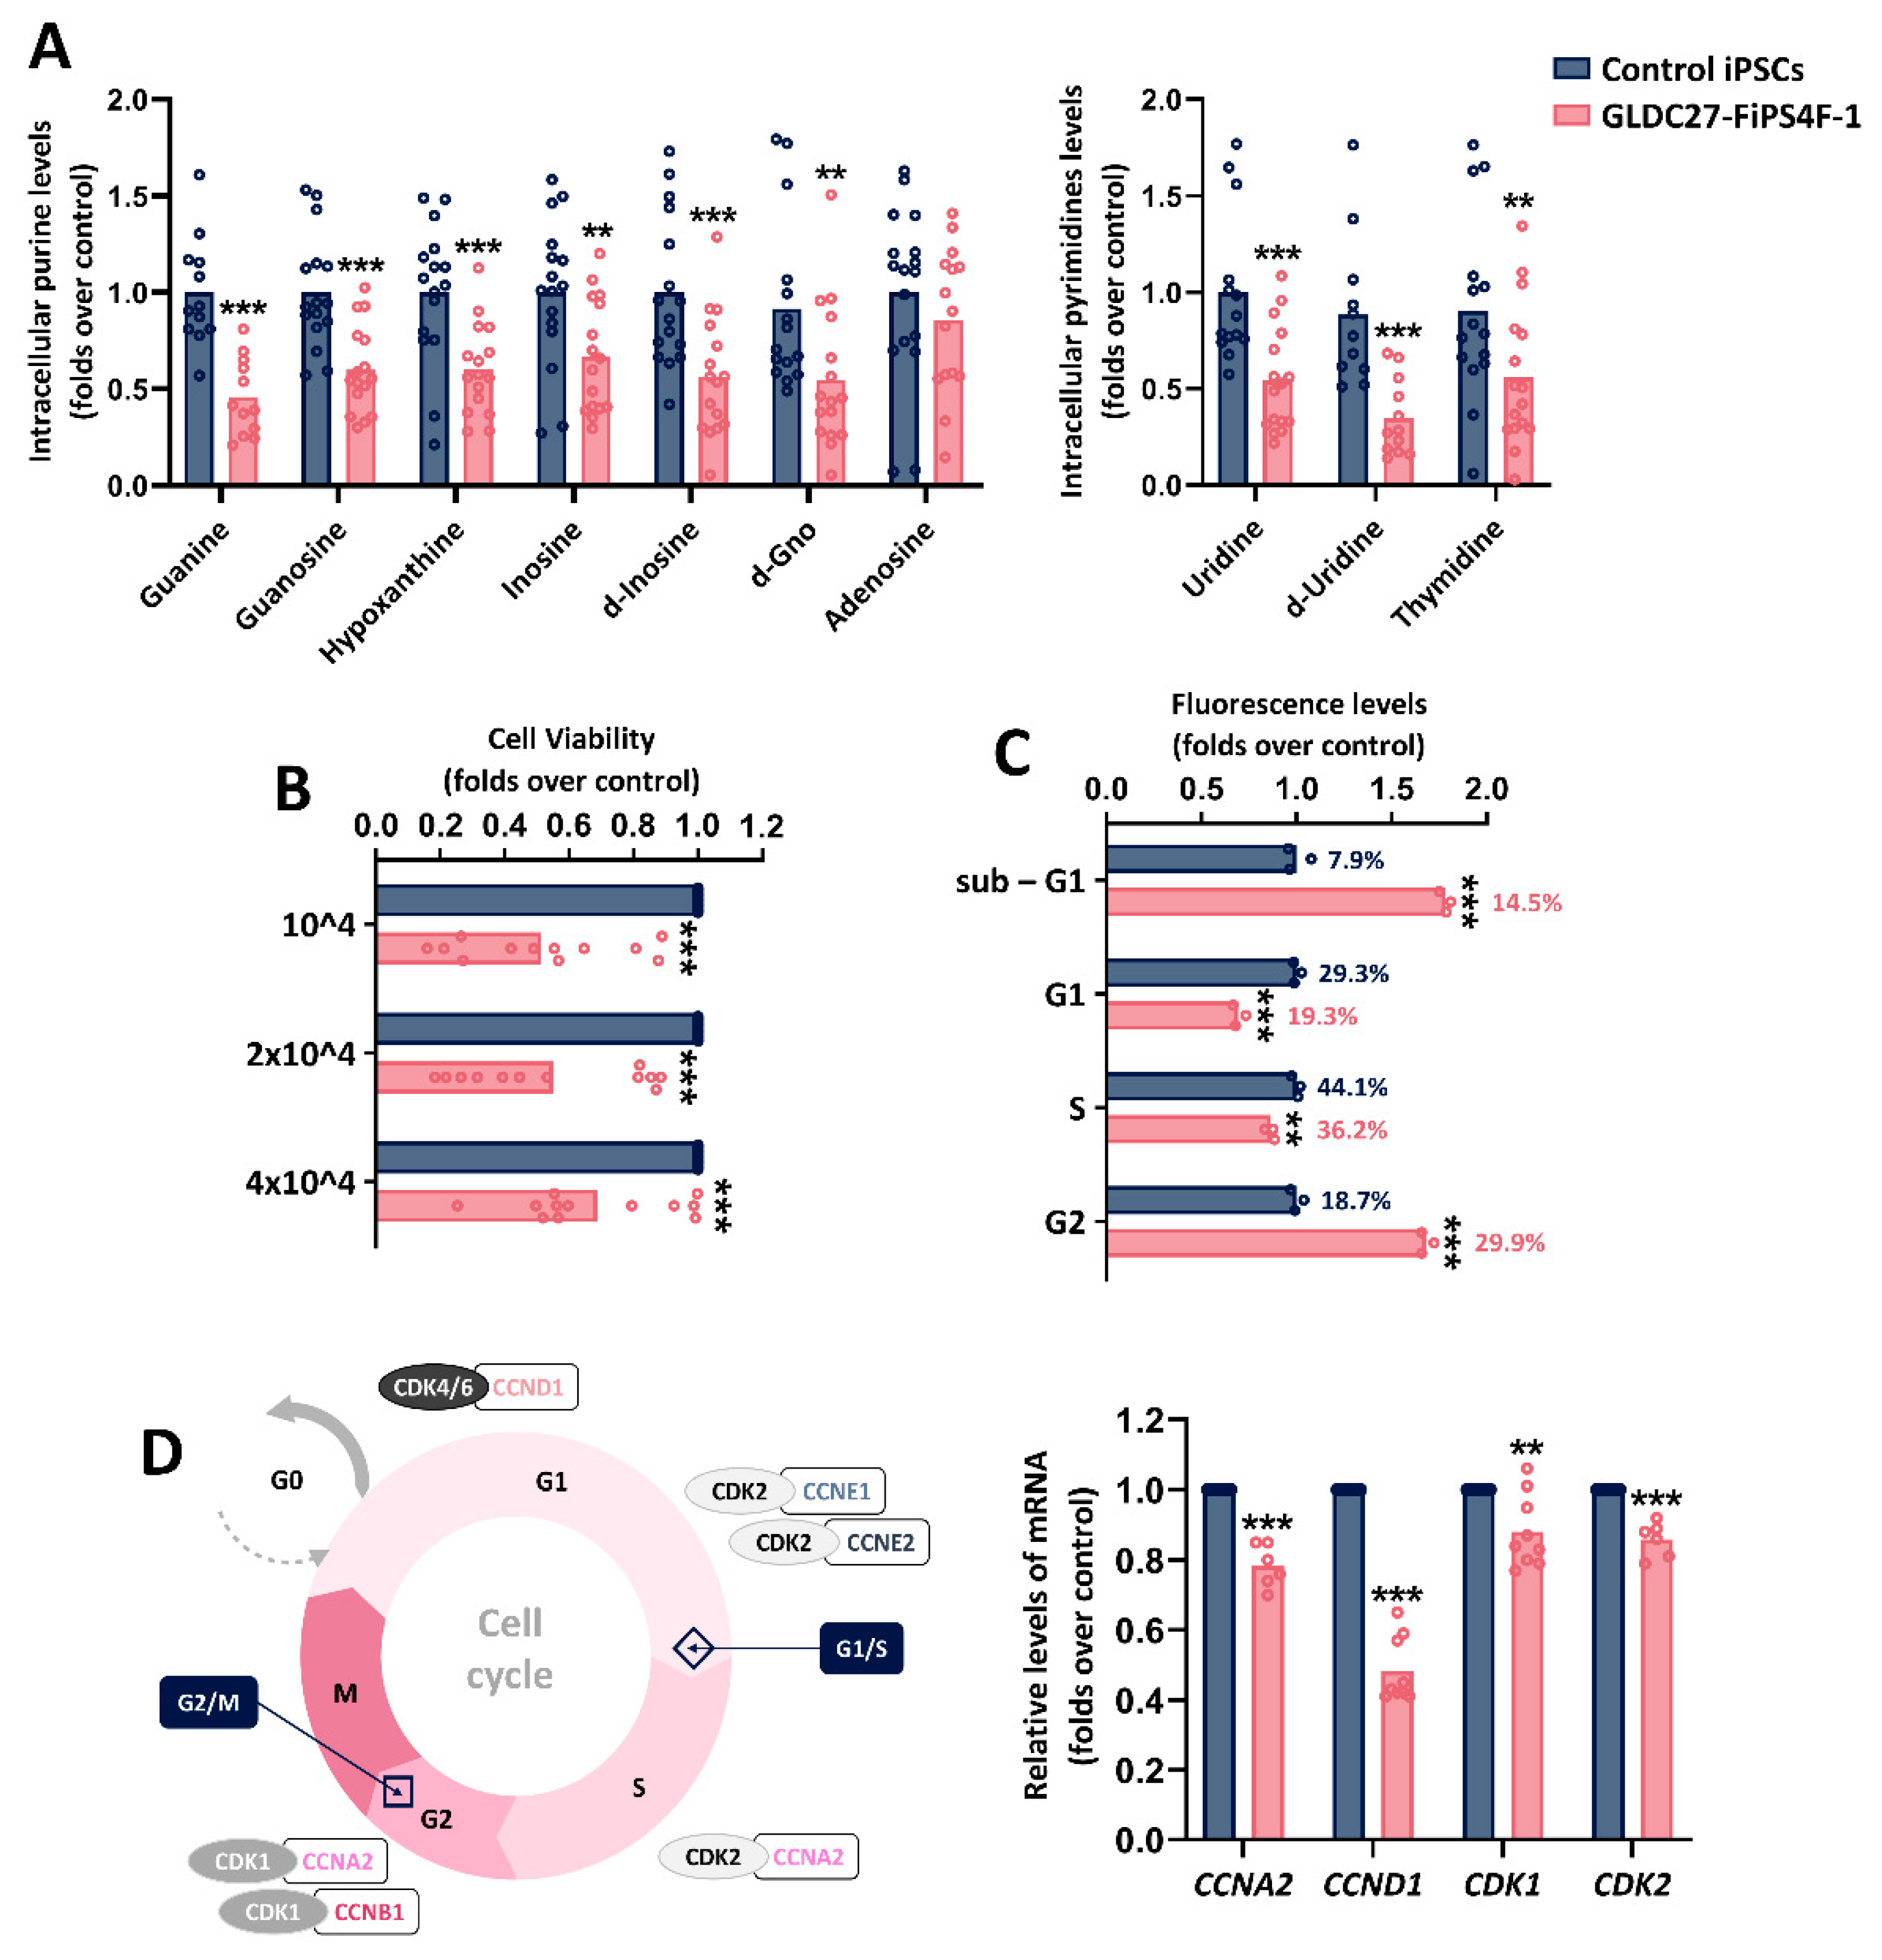
Figure 5.
Mitochondrial function of GLDC27-FiPS4F-1. (A) Mitochondrial DNA depletion analysis by evaluation of 12S/18S and ND1/18S ratios measured by RT-PCR. Data represents the average of n=2 biological replicates conducted in triplicate. (B) Representative SDS-PAGE western blot of OxPhos proteins using an antibody cocktail against different proteins of these complexes. (C) Mitochondrial respiration in GLDC27-FiPS4F-1 compared to control iPSCs. Graphs represent the respiratory parameters derived from oxygen consumption (OCR). Rmax: Maximal Respiration; Spare: Spare Capacity; ATP-linked: ATP production. Data represents the average of n=3 biological replicates with measurements acquired 20 times. (D) Mitochondrial morphology analyzed by transmission electron microscopy in control (left panel) and GLDC27-FiPS4F-1 (right panel) iPSCs. Mitochondria are indicated by black and white arrowheads. (A, C) Statistical analysis t student (*p<0.05; **p<0.01; ***p<0.001).
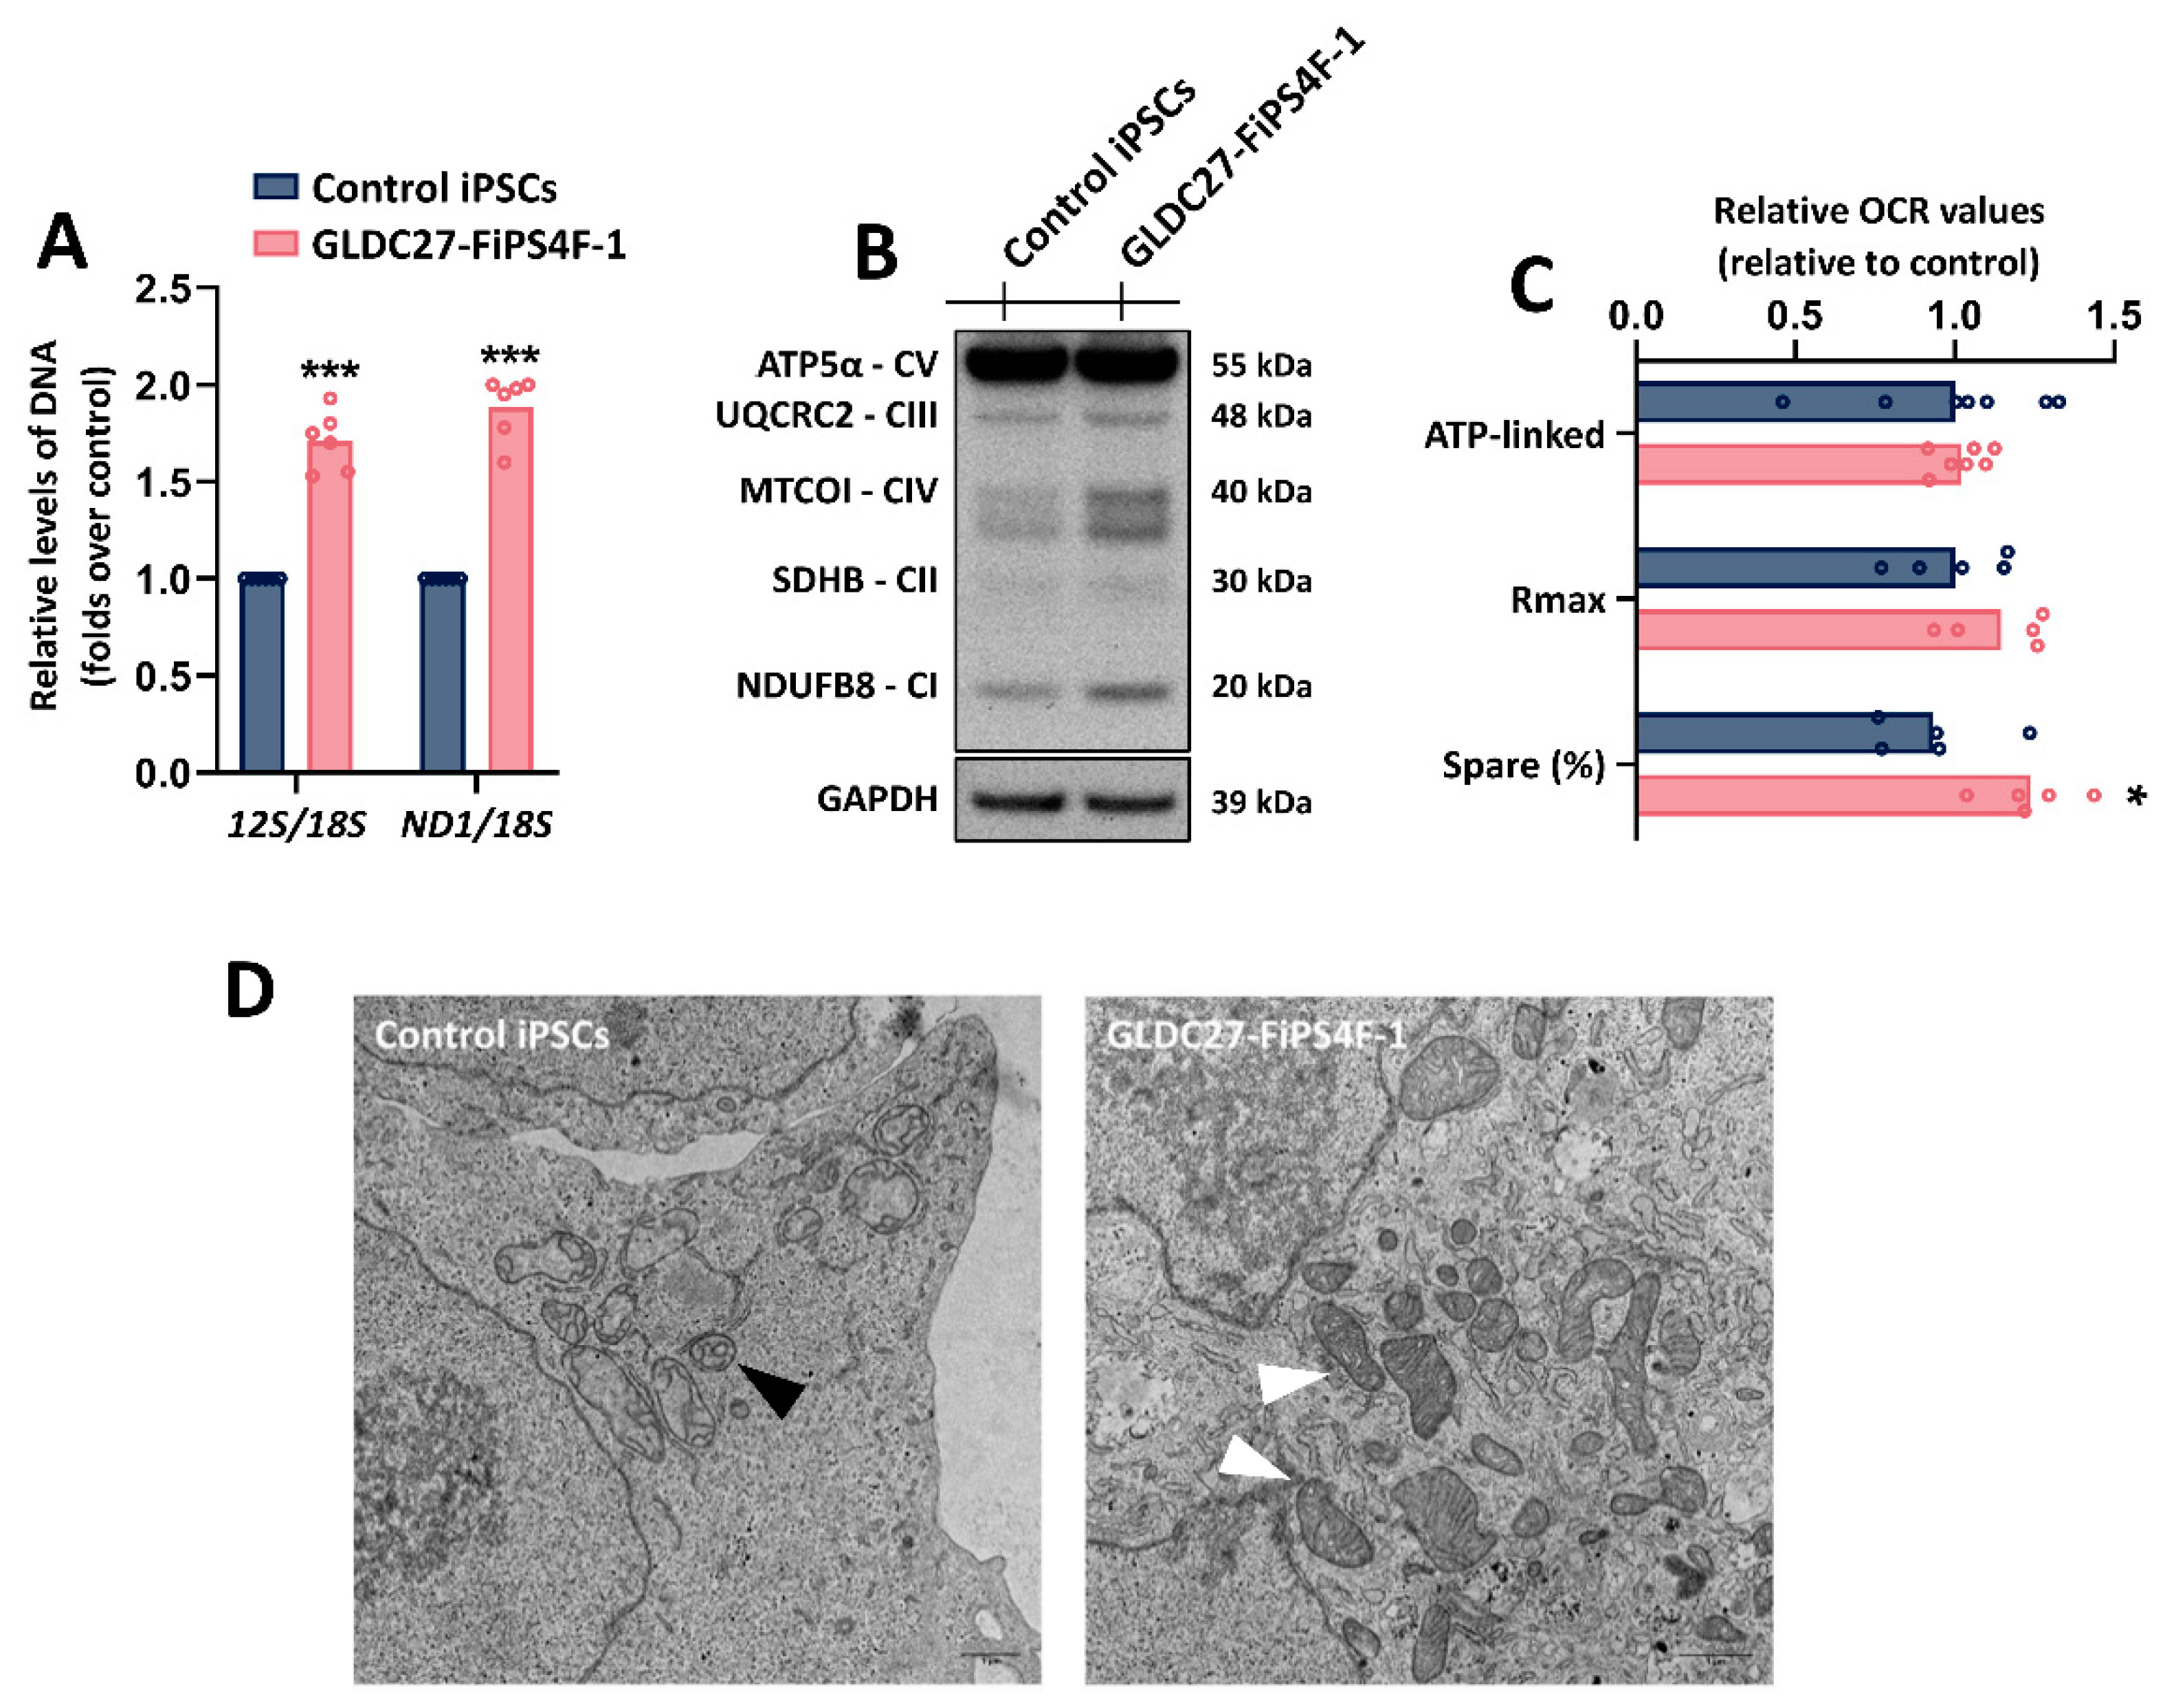
Figure 6.
Characterization of the generated NPCs lines. (A) Schematic representation of characteristic markers in iPSCs differentiation to NPCs. (B, C) Relative gene expression of pluripotency markers (OCT3/4, LIN28B), early neuroepithelium markers (SOX1) and neuroepithelium and radial glia markers (PAX6, NES). Graphs show gene expression levels in both control (C) and GLDC-deficient (-) lines compared to iPSCs lines at days 0 (iPSCs) and 20 (NPCs) of differentiation. (D) Immunofluorescence staining and laser scanning confocal imaging of PAX6, Nestin and OCT3/4 markers in control and GLDC27-FiPS4F-1 NPCs. Dapi: Nuclear marker (blue). Scale bar: 50 μm. Magnifications of 10X. (E) Representative western blot showing GCSP protein levels in NPCs cultures. “GLDC27-NPCs” refers to the GLDC27-FiPS4F-1 NPCs line. (F) Representative images of NPCs cultures using phase contrast microscopy. (G) Relative gene expression levels of neural lineage markers in GLDC27-FiPS4F-1 NPCs compared to control NPCs. (B, C, G) Data represents the average of n=2 biological replicates conducted in triplicate standardized against the endogenous ACTB gene. Statistical analysis t student (*p<0.05; **p<0.01; ***p<0.00).
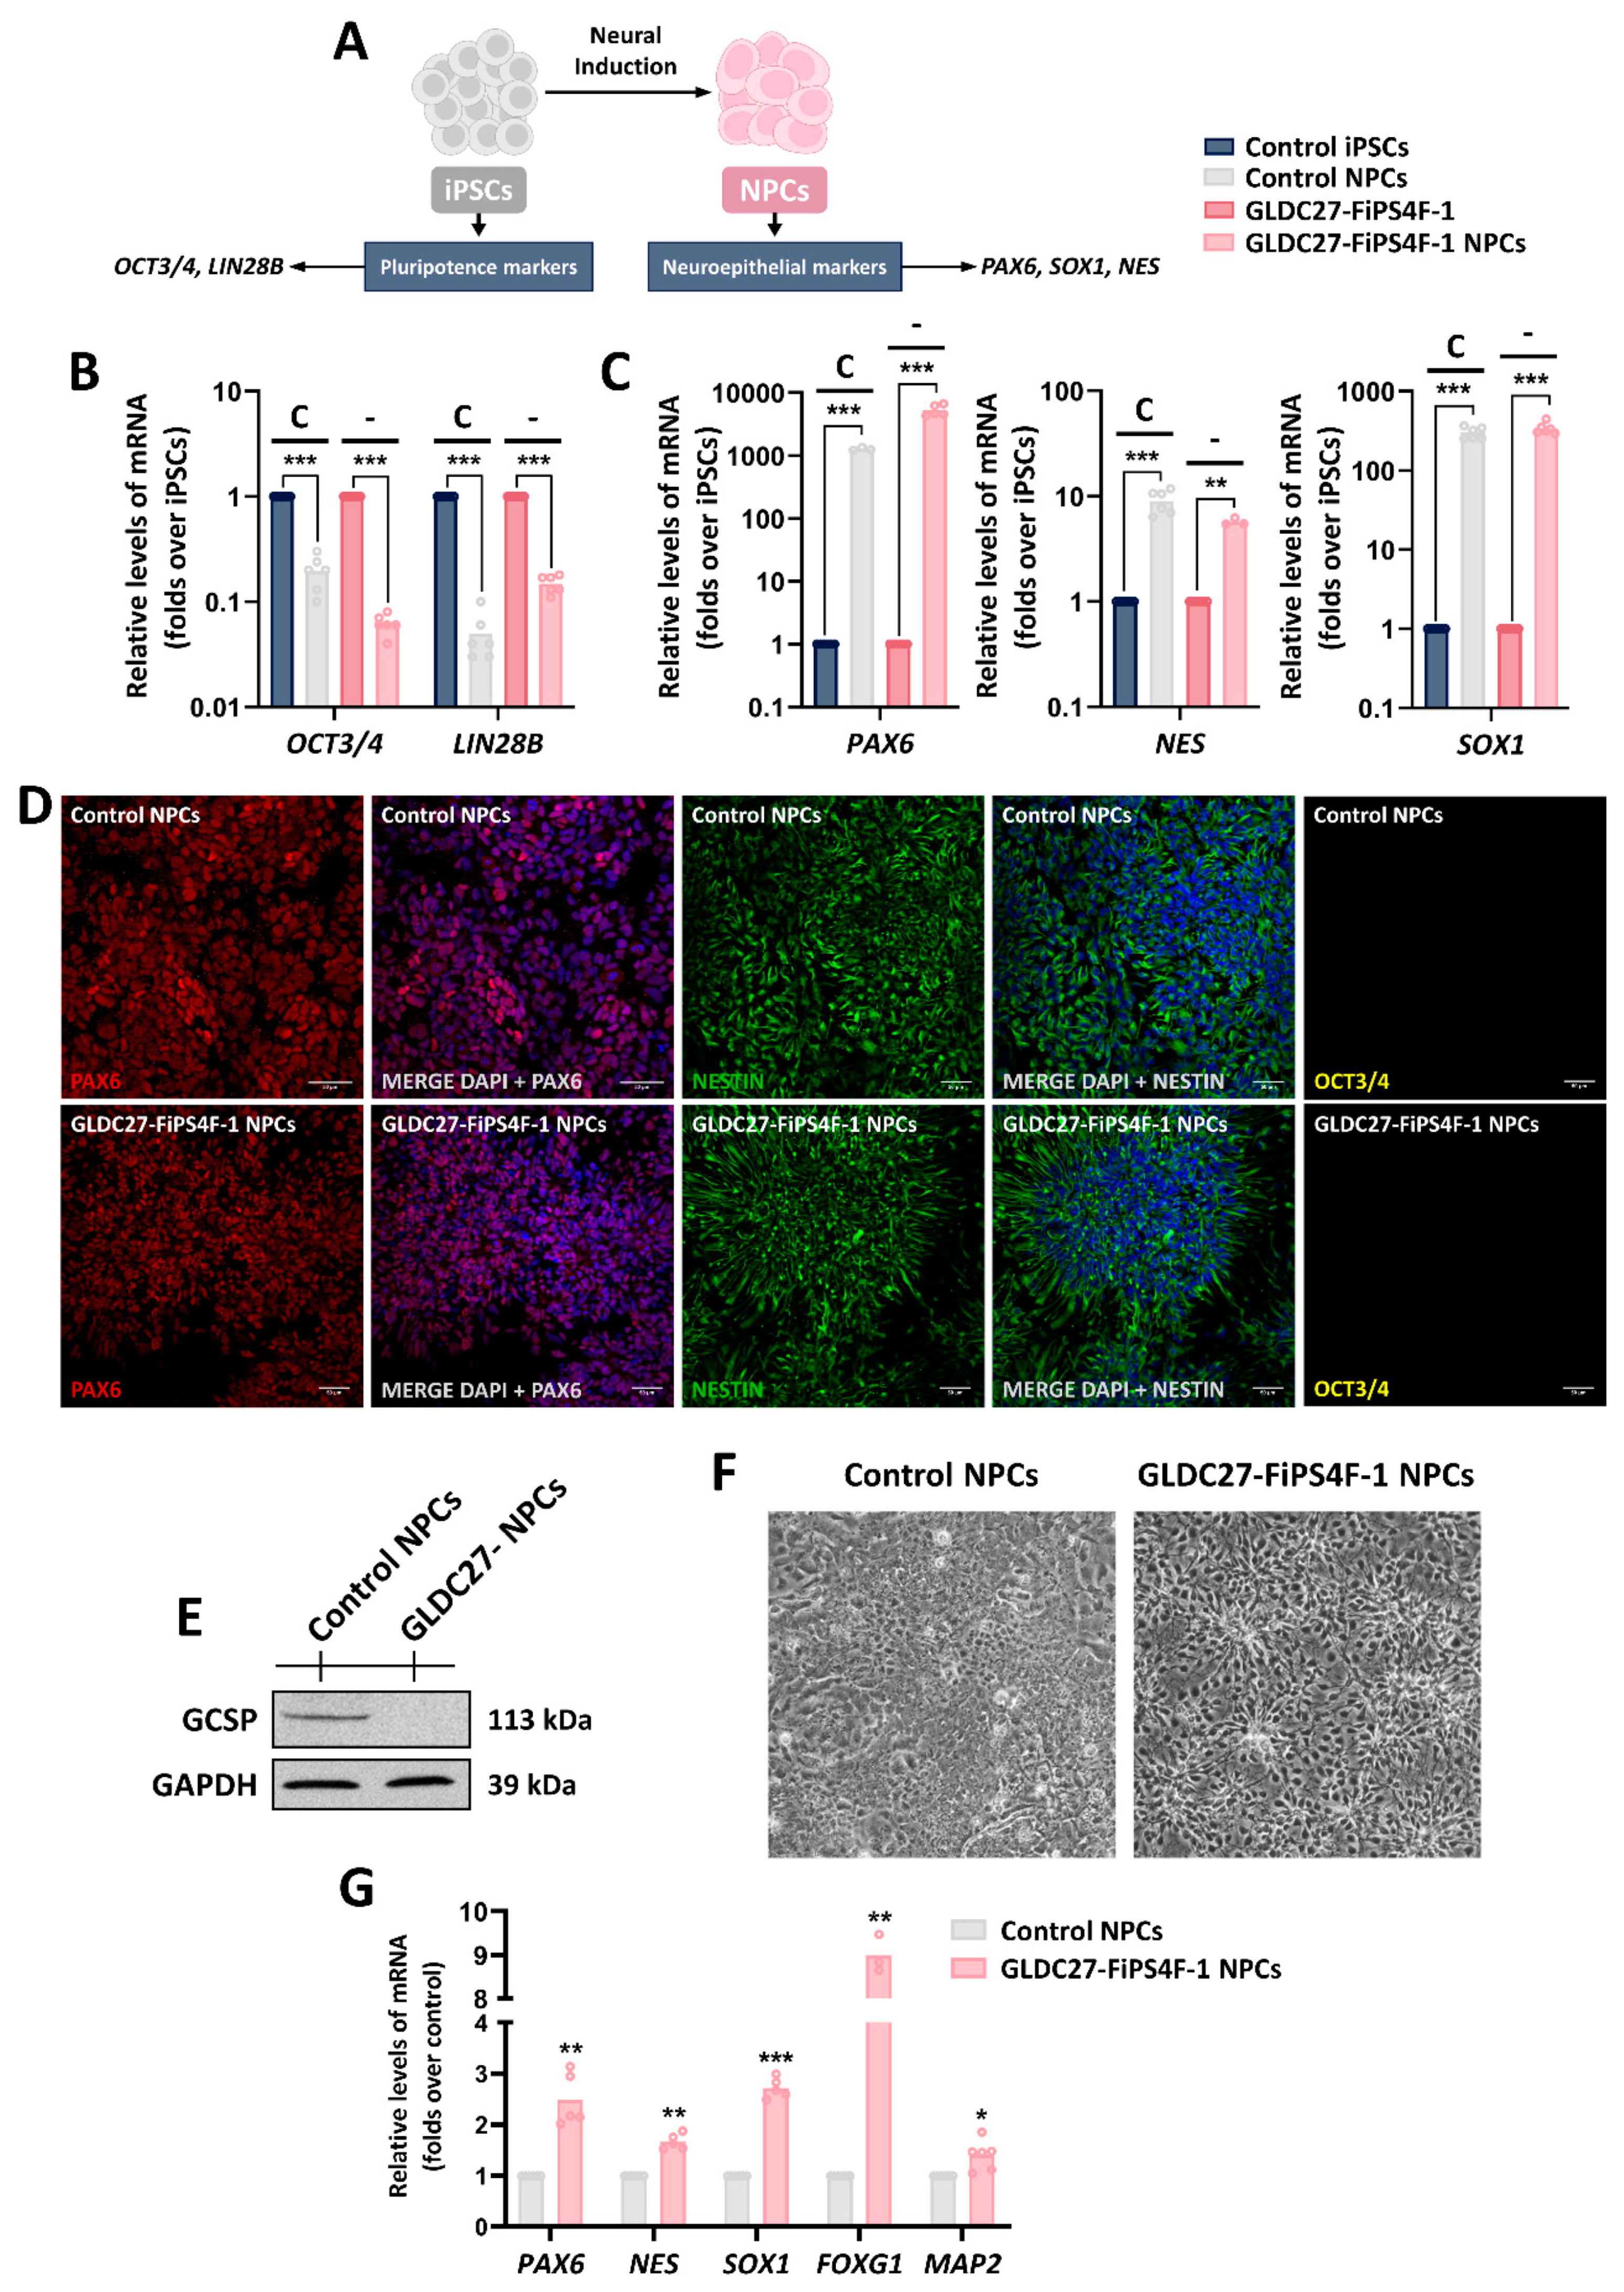
Figure 7.
Characterization of the generated iAs cultures. (A) Schematic diagram showing the differentiation stages of various cell types derived from neuroepithelial cells and the respective markers expressed in each stage (B) Relative quantification of radial glia markers (PAX6 and VIM) and (C) astrocyte markers (GFAP, S100β, APOE and AQP4) gene expression. (B, C) Graphs show gene expression levels of these markers in both control (C) and GLDC-deficient (-) iAs cultures compared to NPCs lines. (D) Relative quantification of astrocyte markers (GFAP, S100β, APOE, AQP4 and ALDH1L1) expression levels in GLDC27-FiPS4F-1 iAs related to control iAs. (E, F) Immunofluorescence staining and laser scanning confocal imaging of GFAP and S100β markers. Dapi: Nuclear staining (blue). (E) Scale bar: 10 μm. Magnifications of 40X. (F) Scale bar: 100 μm. Magnifications of 25X. (B, C, D) Data represents the average of n=2 biological replicates conducted in triplicate and was standardized against the endogenous ACTB gene. Statistical analysis t student (*p<0.05; **p<0.01; ***p<0.001).
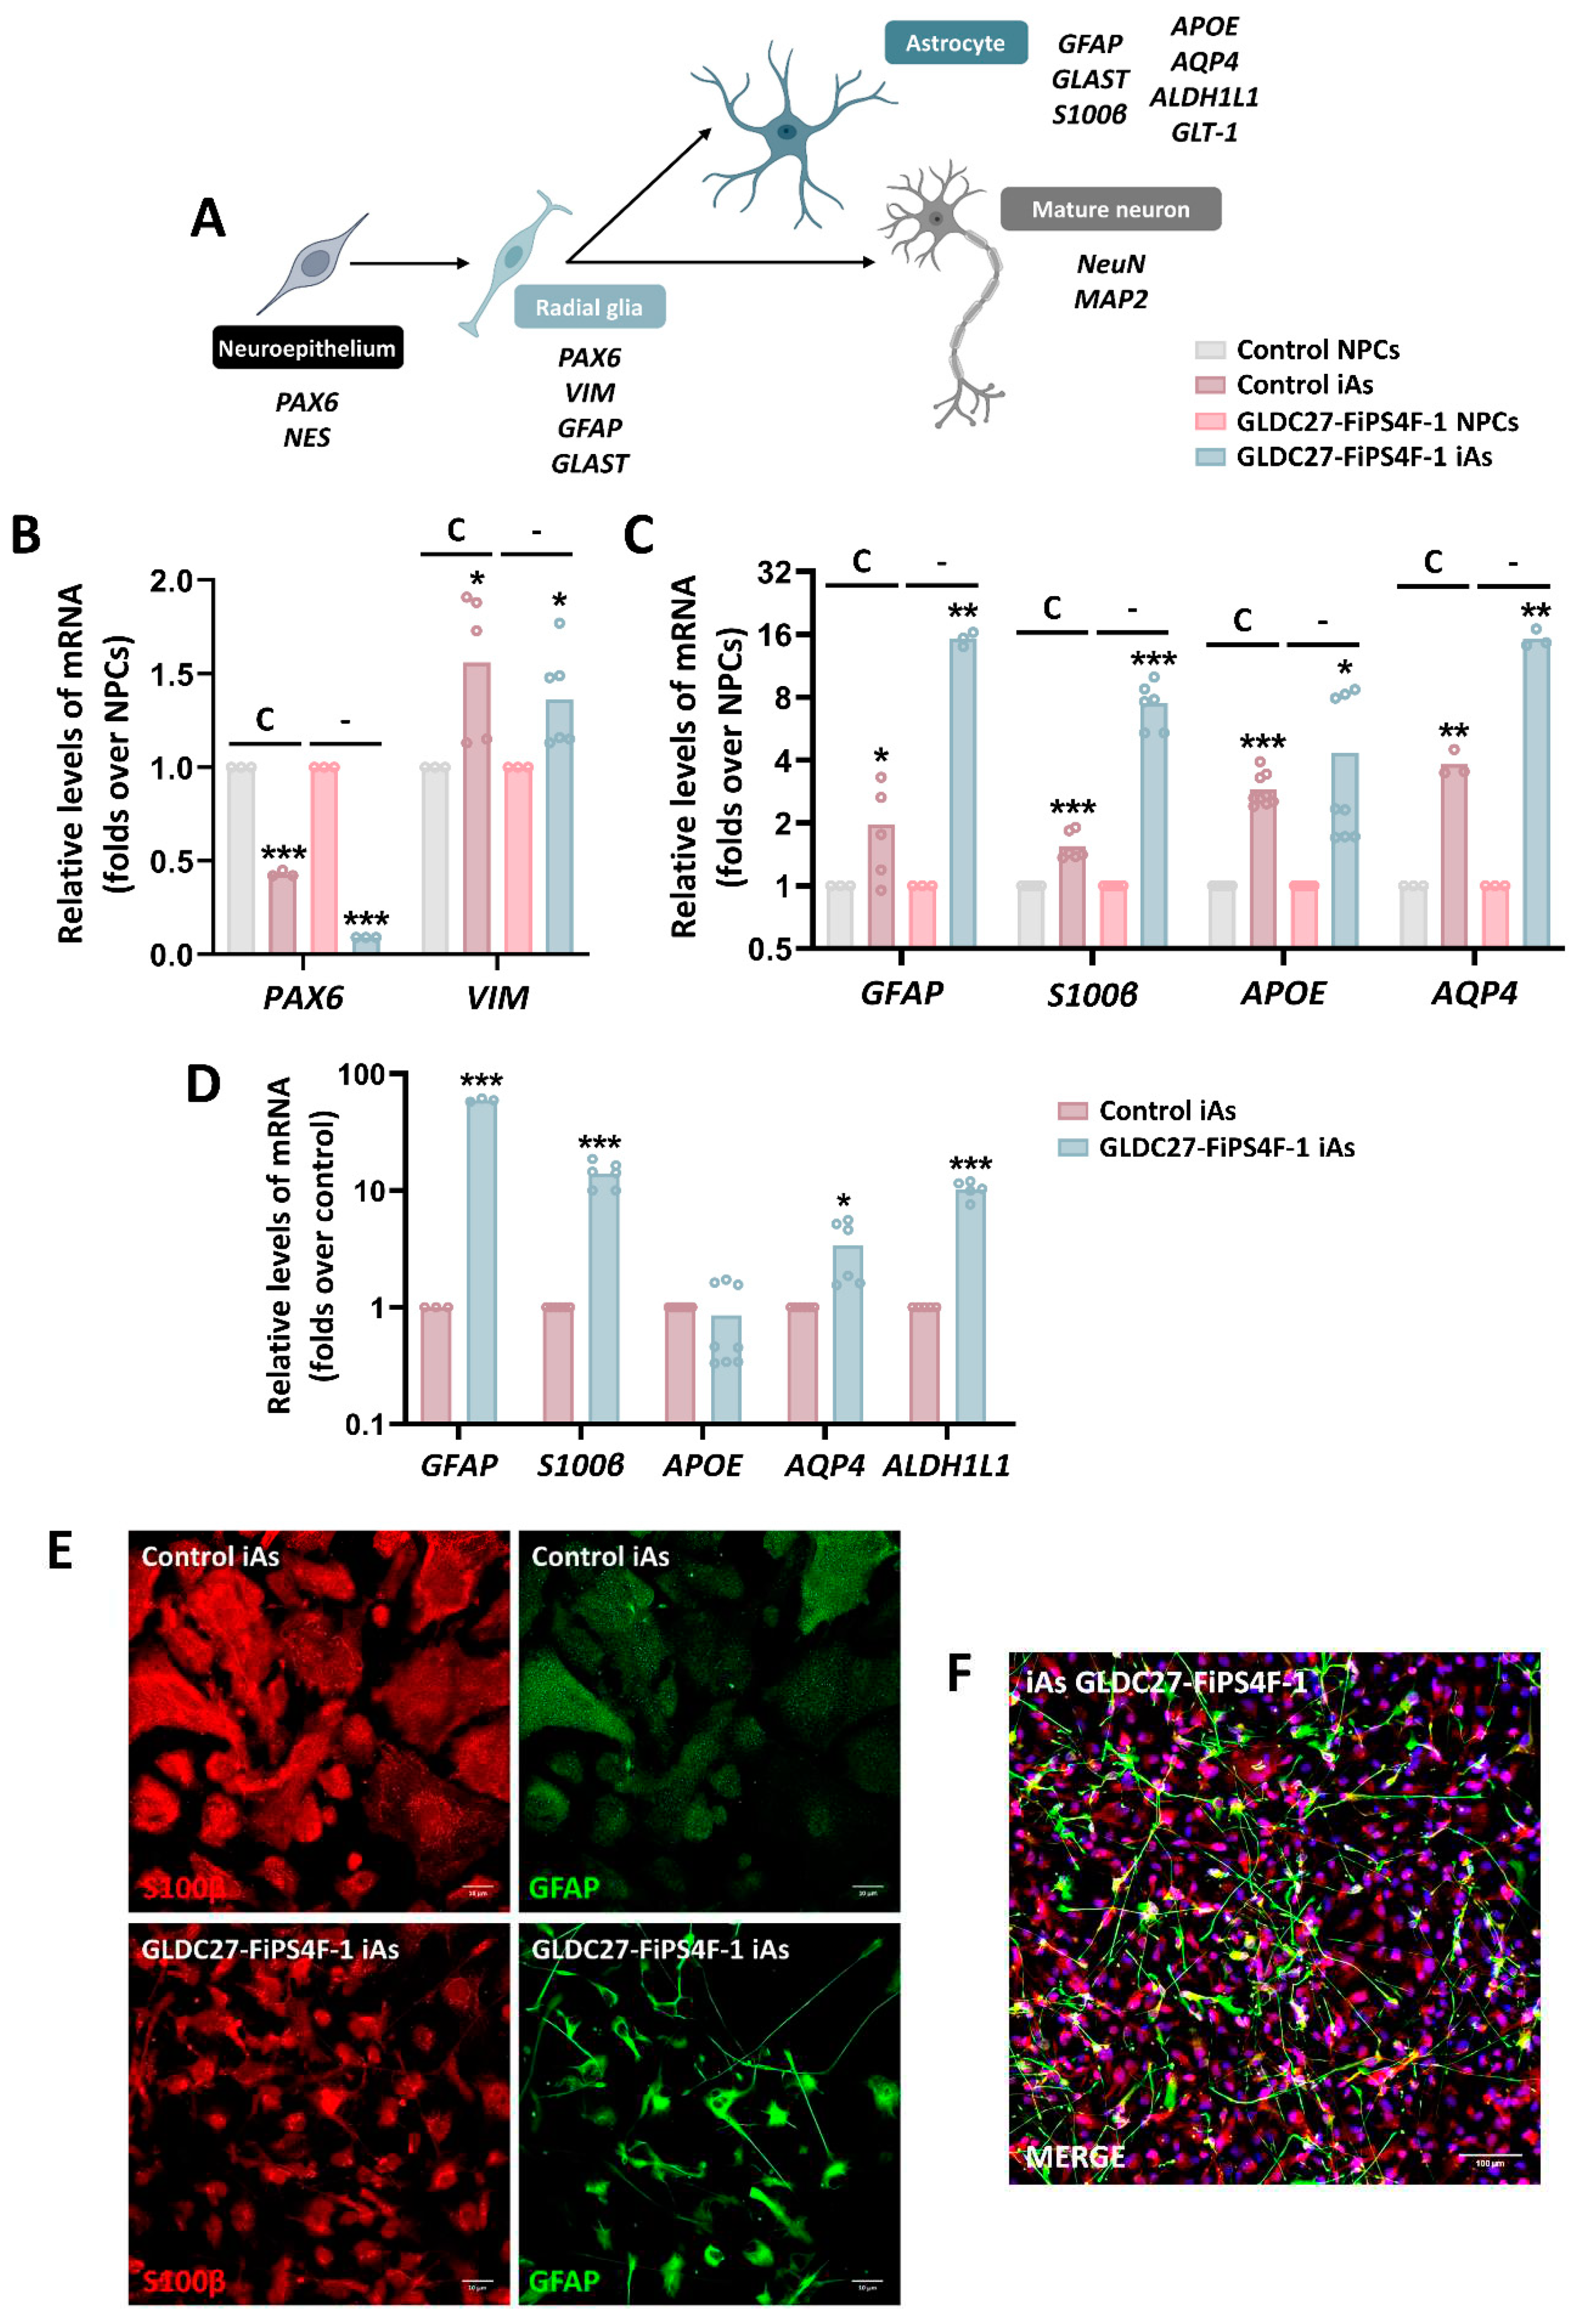
Figure 8.
Presence of mature neurons and functional analysis of the iAs cultures. (A) Relative quantification of mature neuron markers MAP2 and NeuN gene expression levels in GLDC-deficient iAs compared to control iAs. (B) Immunofluorescence staining and laser scanning confocal imaging of neuronal marker MAP2 in both iAs cultures. (C) Relative gene expression levels of GLAST and GLT-1 in GLDC27-FiPS4F-1 iAs related to control iAs. (D) Immunofluorescence staining and laser scanning confocal imaging of GLAST and GLT-1 markers in control and GLDC27-FiPS4F-1 iAs cultures. (E) Radiolabeled glutamate transport measurement in GLDC27-FiPS4F-1 iAs compared to control iAs. Data were evaluated in two complete differentiation processes by quintuplicate. (F) Relative quantification of glutamate extracellular levels in control and GLDC27-FiPS4F-1 iAs after 72 hours of culture. Control iAs were assigned a value of 1. The dotted line represents the 0 value. All values obtained in the measurement were normalized by protein content. A total of n=10 samples were evaluated. (A, C) Data was standardized against the endogenous ACTB gene. Data were analyzed in triplicate (B, D) Scale bar: 10 μm. Magnifications of 40X. (A, C, E, F) Statistical analysis t student (*p<0.05; **p<0.01; ***p<0.001).
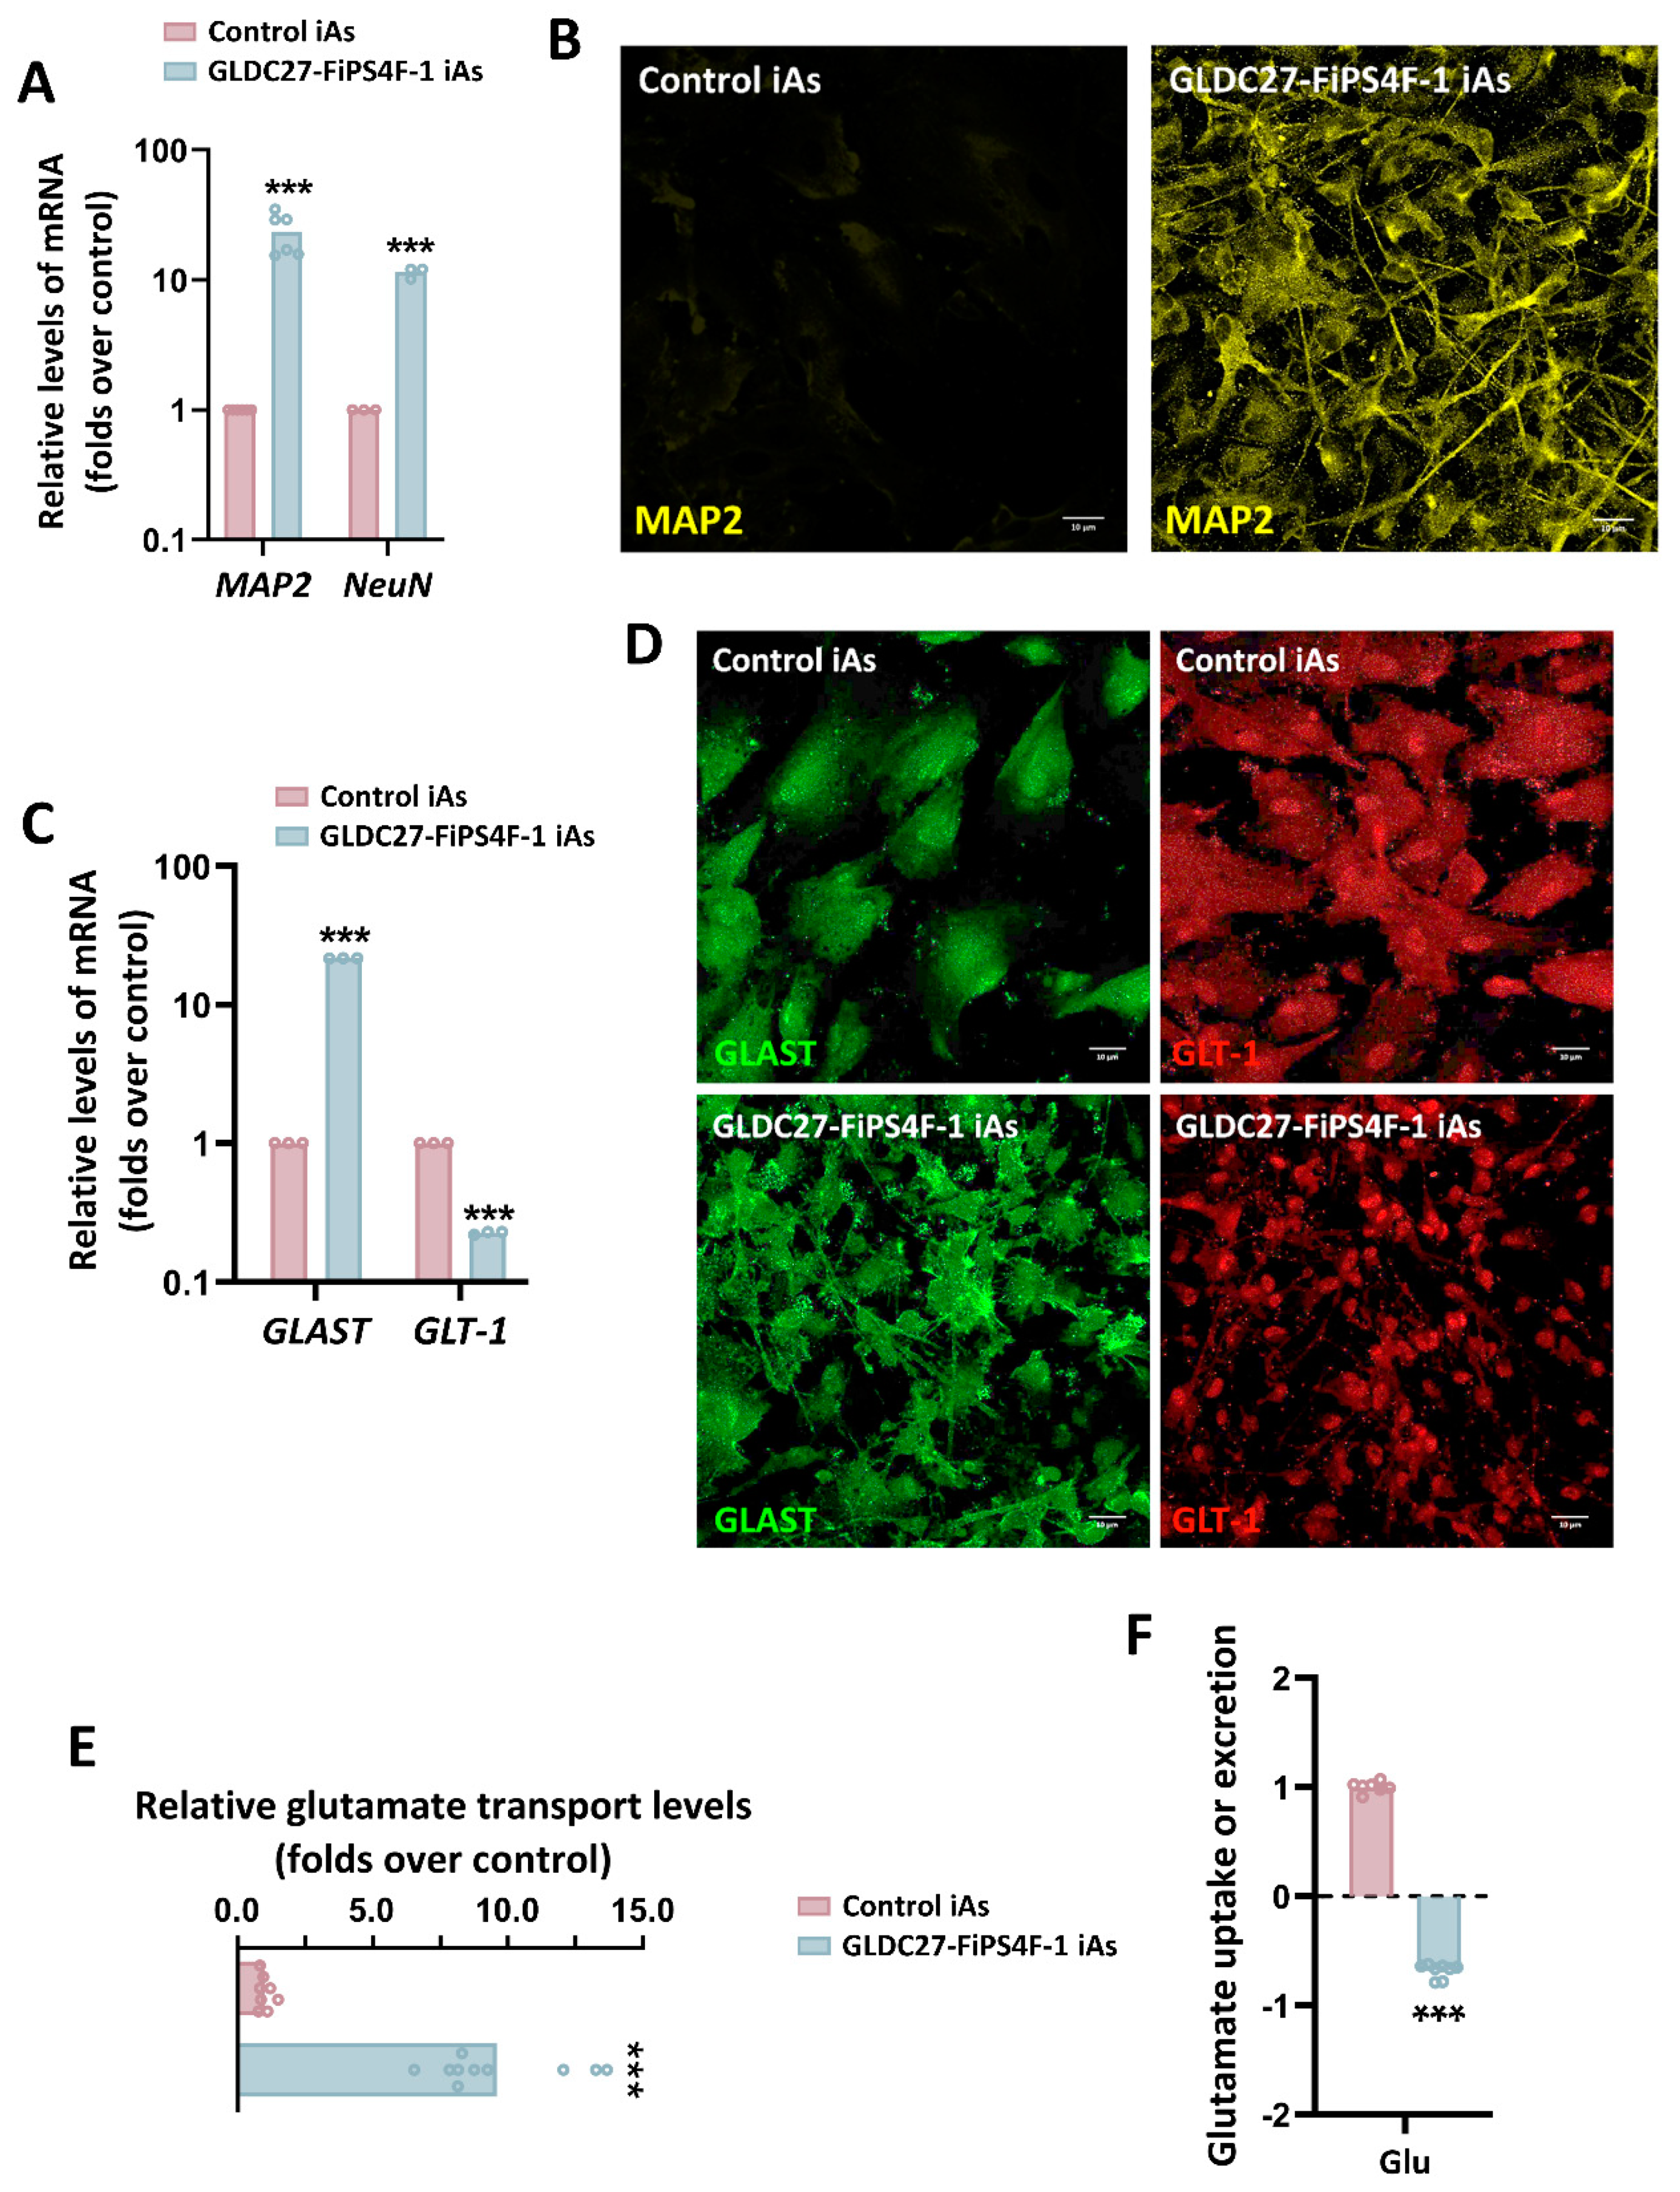
Figure 9.
Glycine homeostasis in GLDC-deficient iAs culture. (A) Representative western blot showing GCSP protein levels in iAs cultures. (B) Relative quantification of glycine extracellular levels in control and GLDC27-FiPS4F-1 iPSCs and iAs after 72 hours of culture. (C) GLYT1 and GLYT2 gene expression levels (involved in glycine transport) in GLDC-deficient iAs related to control iAs. (D) Schematic representation of SHMT2, SRR and AGAT enzymes involvement in serine and creatine metabolism which are closely related to glycine. (E) Relative quantification of serine extracellular levels in control and GLDC27-FiPS4F-1 iPSC lines and iAs cultures after 72 hours of culture. (F) Relative quantification of SRR and (G) SHMT2 genes in GLDC-deficient iPSCs, NPCs and iAs compared to control. (H) Representative western blot of SHMT2 and SRR proteins. (I) Relative quantification of arginine extracellular levels in control and GLDC27-FiPS4F-1 iPSCs and iAs after 72 hours of culture. (J) Relative quantification of AGAT gene in GLDC-deficient iPSCs, NPCs and iAs compared to control line. (K) AGAT protein levels in iAs cultures. (A, H, K) GAPDH was used as loading control. “GLDC27-iAs” refers to GLDC27-FiPS4F-1 iAs culture. (B, E, I) Control iPSCs and iAs were given a value of -1. The dotted line represents the 0 value. Positive levels represented a release of the metabolite into the medium while negative levels rendered an uptake from it. All values obtained in the measurement are normalized by protein. A total of n=10 samples were evaluated. (C, F, G, J) Data was standardized against the endogenous ACTB gene and analyzed in triplicate. (B, C, E, F, G, I, J) Statistical analysis t student (*p<0.05; **p<0.01; ***p<0.001).
Disclaimer/Publisher’s Note: The statements, opinions and data contained in all publications are solely those of the individual author(s) and contributor(s) and not of MDPI and/or the editor(s). MDPI and/or the editor(s) disclaim responsibility for any injury to people or property resulting from any ideas, methods, instructions or products referred to in the content. |
© 2024 by the authors. Licensee MDPI, Basel, Switzerland. This article is an open access article distributed under the terms and conditions of the Creative Commons Attribution (CC BY) license (http://creativecommons.org/licenses/by/4.0/).
Copyright: This open access article is published under a Creative Commons CC BY 4.0 license, which permit the free download, distribution, and reuse, provided that the author and preprint are cited in any reuse.


