Submitted:
24 January 2024
Posted:
25 January 2024
You are already at the latest version
Abstract
Nuclear speckles are compartments enriched in splicing factors present in the nucleoplasm of mammalian cells. Their morphology is linked to the transcriptional and splicing activities of the cell through a recruitment mechanism. Speckles have been studied mostly in mammalian culture cells, and few studies are devoted to speckles in tissue cells. In mammals, speckles are present in different tissues and their morphology also depends on the hormonal cycle in rats. In the present work, we explore whether a similar situation is also present in non-mammalian tissue cells dur-ing the reproductive cycle. We studied the speckled pattern in several tissues of a viviparous rep-tile, the lizard Sceloporous torquatus, during two different stages of reproduction. We used immu-nofluorescence staining against splicing factors in hepatocytes and oviduct epithelium cells and fluorescence and confocal microscopy. The distribution of splicing factors in the nucleoplasm of oviductal cells and hepatocytes coincides with the nuclear speckled pattern described in mam-mals. In addition, the morphology of speckles varies in oviduct cells at the two stages of the re-productive cycle analyzed, paralleling the phenomenon observed in the rat. The results show that the morphology of speckles in reptile cells depends upon the reproductive stage as it occurs in mammals.
Keywords:
cell nucleus
; nuclear speckles
; reptile
; splicing factors
; SR proteins
; ribonucleoproteins
1. Introduction
The cell nucleus is a highly compartmentalized organelle. Nuclear compartments are visualized by light and electron microscopy. By light microscopy, the nucleus contains several nuclear bodies, including nucleoli, Cajal bodies, and speckles [1].
Nuclear speckles are interchromatin compartments enriched in splicing factors [2]. They are well-known in mammalian cells in culture and some tissues [3,4]. Morphologically, speckles are surrounded by a diffuse pattern [5,6], and their number and size vary in relation to gene expression [7,8]. The speckles are composed of ribonucleoproteins (RNP) and non-ribonucleoproteins splicing factors; among the latter are the SR family of splicing factors [9,10,11,12]. Their function is associated with transcriptional and splicing activities within the nucleoplasm [1,13].
Ultrastructurally, the speckles constitute the Interchromatin Granule Clusters (IGC), while the diffuse pattern that connects them represents the Perichromatin Fibers (PCF), the sites of active transcription [6,9,14]. The IGCs are clusters of 0.8-1.8 μm in diameter or 0.3-3.0 μm [15], formed with interconnected granules of 20-25 nm [1]. On the other hand, the PCFs are fibrillar structures of 3-5 nm width, present in the periphery of the IGC or other nucleoplasmic regions [2,14,16,17], but generally, they are always associated with the periphery of compact chromatin [16,18,19,20].
The morphology of speckles is different depending on the transcriptional and splicing activities of the cell [7,21]. The speckles become rounded and more compact when cells are treated with RNA polymerase II inhibitors such as α-amanitin or DRB [22,23,24,25,26]. When transcription is activated, speckles constituents are recruited from the speckles to the sites of active transcription [7,27].
The nuclear speckles had also been reported for cell nuclei in tissues of non-mammalian animals [28]. However, it is not known whether the morphology of speckles changes during the reproductive cycle of non-mammalian vertebrate cells, similar to those observed in the rat [3]. We documented here that a similar situation observed in rats is present in the oviductal cells of the viviparous lizard Sceloporus torquatus at different stages of reproduction.
2. Results
2.1. Samples
Samples of the middle oviduct and liver of the viviparous lizard Sceloporus torquatus in two stages of the reproductive cycle were selected. The reproductive stages were identified according to the morphological, histological, and histochemistry conditions of their gonads [29] (Figure 1). The early-vitellogenic female showed follicles with a vacuolated ooplasm and acidophilic staining in the periphery, a thin differentiated zona pellucida, and a granulose layer with the three typical cell types: small cells, intermediate cells, and piriform cells (Figure 1a). The late-vitellogenic female showed follicles with an ooplasm full of yolk platelets, a thick and differentiated zona pellucida, and a granulose layer on its way to regression to a monolayer, composed solely of piriform cells (Figure 1b).
2.2. Distribution of splicing factors in several reptile cell types
The antibody used recognizes a speckled pattern in mammalian cells (Figure 2a) and also recognized reptile cells used in this study (Figure 2 b-d). Regardless of reproductive condition and cell type, all cells analyzed in this study presented a positive antibody labeling in the nucleoplasm, which was absent in the nucleolus (Figure 2b-d). The pattern in the nucleoplasm includes the presence of intensely stained speckles and a diffuse pattern of lighter and homogeneous staining as described in mammalian cells. Regardless of cell state, S. torquatus oviductal cells (Figure 2c, d) presented an average of 7.6 to 9.3 speckles per cell, with a maximum of 27. Their average cross-sectional area varied between 0.477 and 0.811 μm2. Additionally, hepatocytes (Figure 2b) showed an average of 11.2 speckles, with a maximum of 26 per cell. These had an average cross-sectional area of 0.387 μm2.
In order to better analyze the speckled patterns, we enhance the fluorescence labeling by confocal microscopy followed by a procedure of image processing that uses a super-resolution algorithm recently described, known as MSSR [30]. We validate this procedure by showing the comparison of a confocal and a MSSR image (Figure 3). Therefore, we used MSSR images to illustrate further results in this work.
2.3. Distribution of speckled pattern in different reproductive stages of the lizard
2.3.1. Oviduct
We analyzed the variations in the speckled pattern of splicing factor in different cell types of the middle oviduct of two females of S. torquatus.
The glandular epithelial cells showed a similar average number of speckles per cell in both animals (8.9 ± 4.6 and 7.0 ± 4.1). The average size of the speckles was smaller and more regular in the early-vitellogenic (0.26 ± 0.09 μm2) than in the late (1.09 ± 1.01 μm2) (with significant difference) (Figure 4a, b) (Figure 5). The glandular cells of the female in early vitellogenesis presented a negative response to the Coomassie Blue (CB) and Periodic Acid Schiff (PAS) reactions (Figure 4c, e), while the same ones in the female in late vitellogenesis presented a positive reaction to CB staining for proteins in their cytoplasm and a very intense reaction to PAS (Figure 4d, f).
The luminal epithelium showed different morphology according to the vitellogenic stage. In the early vitellogenic female the epithelium was 10.43 ± 1.13 μm high and showed a predominance of cuboidal-columnar cells with microvilli on their apical face, occasionally bearing cilia. In the late-vitellogenic female, the epithelium was higher (19.09 ± 1.94 μm) and showed columnar ciliated cells with elongated nuclei, interspersed with secretory cells with basal nuclei (Figure 6c-f).
The average number of speckles in the ciliated cells of the luminal epithelium was similar in both females (9.9 ± 3.9 and 11.1 ± 5.9), showing significant differences between them and the secretory cells of the late-vitellogenic female (6.9 ± 3.0). The average size of speckles was significantly different and smaller in the early-vitellogenic female cells (0.26 ± 0.07 μm2) than in the late-vitellogenic (ciliated 0.65 ± 0.32 μm2 and secretory 0.84 ± 0.60 μm2). (Figure 6a, b) (Figure 5). These cells also differ in their histochemistry, in the early vitellogenic female the CB staining was negative (Figure 6c), versus a slightly positive staining in the late vitellogenic female (Figure 6d). The PAS reaction was positive in both early and late vitellogenic luminal cells, although it was more intense in the secretory cells (Figure 6e, f).
2.3.2. Liver
In order to evaluate the speckled pattern in another organ involved to some extent in the reproductive functions of reptiles, we study the liver. We analyzed hepatocytes during the early and late vitellogenic stages in females. In both cases the speckled pattern was similar (Figure 7a, b) (Table 1). At these stages, hepatocytes show positive strong PAS reaction (Figure 7c, d). In addition, the cytoplasm of hepatocytes presents droplets in the cytoplasm as detected by toluidine blue staining of semithin sections (Figure 7c, d, insets).
3. Discussion.
We have shown that speckled patterns of splicing factors are present in reptile cell nuclei and that these patterns show morphological differences depending upon the reproductive stage of lizard Sceloporous torquatus females.
3.1. Speckled pattern of splicing factors are present in reptile cell nuclei
The fluorescent immunolocalization of the protein splicing factors carried out in the present study used a primary monoclonal antibody that recognizes four of the SR proteins that accumulates in the nuclear speckles, namely SRSF4, SRSF5, SRSF6, and SRSF7 [32] in several species. In addition, it recognizes 20 other nuclear proteins, including U1 70K (a component of U1 snRNP) and the two subunits of U2AF1. All these proteins are involved in pre-mRNA processing, and their presence in nuclear speckles have been previously recognized [26].
The distribution of these proteins in the nucleoplasm and not in the nucleolus, in a pattern of intense speckles immersed in more homogeneous diffuse staining, confirms the existence, in these cells, of the speckled pattern of splicing factors [6,33], in cells of a non-mammalian vertebrate, as reported [28]. Several cell types display the speckled pattern in the lizard, i.e.,: hepatocytes, oviduct gland, and luminal epithelial cells. Lizard cells display up to 26 speckles per cell, which is like to the reported number of 25-50 speckles per cell in mammalian culture cells [1] and in tissue cells of the rat [3]. However, speckles size in reptilian cells is smaller than those reported for mammals, maybe due to the small size of cells. Therefore, nuclear speckles are present in several tissue cells in reptilian cells, extending their presence in other vertebrates in addition to mammals.
3.2. Morphology of speckled pattern in reptile oviductal cells changes upon the reproductive stage
In order to evaluate whether cells exposed to hormones during the reproductive cycle in reptiles behave as those in mammals, we decided to work with the viviparous lizard
S. torquatus, which presents a middle oviduct also named glandular uterus with gland and luminal epithelium [34]. Our results show that the speckled pattern of splicing factors found in oviductal reptilian tissues varies according to the reproductive condition of the specimen in both gland and luminal epithelium.
In the oviductal epithelia, the speckled pattern displays smaller speckles in early than during late vitellogenic stages. There is a different physiological condition in every stage. In fact, the morphological, histological, and histochemical conditions of the oviductal cells in reptiles change along the reproductive cycle, and those changes are mediated by a rise of estradiol (E2) in plasma together with the expression of E2 receptors in the oviductal tissues, as previously reported [35,36]. These changes allow the middle or glandular oviduct to fulfill its function in embryo incubation and deposit of the shell membranes [34,37,38]. Among the mentioned modifications are an increase in epithelial width, differentiation of the cell populations of the luminal epithelial, and an increase in the number and activity of the glands [34]. We found that the oviduct of the early-vitellogenic female presents evidence of early stages of preparation for reproduction, as suggested by its lower epithelium, composed of undifferentiated cells and the absence of material accumulated in its glands. The level of plasma E2 for the specie in this reproductive stage is increasing but it has not yet reached a peak [31]. The glandular and luminal cells of the oviduct of this animal showed smaller and more compact speckles.
On the other hand, during the late vitellogenic stage, the width of the luminal epithelium of the oviduct is higher, there is a differentiation of its cell populations into ciliated and secretory ones, as well as the characteristics of a more considerable number and size of the glands, and evidence of accumulation of proteins and PAS positive material that is only shown in the final phases of vitellogenesis [39], along with a peak in the level of the circulating hormone. The oviductal cells show larger and irregular speckles.
Our results agree with those previously described for mammals [3], where changes were detected in the speckled pattern in the luminal and glandular epithelia of the rat uterus, depending upon the estrus cycle, as well in experiments of castration and further injection of E2 to control the hormone, leading to the conclusion that the action of steroid hormones may mediates the changes in the speckled pattern. The same situation may occur in reptiles given that their reproductive cycle is mediated by steroid hormones in a similar way than in mammals [40]. In S. torquatus, the E2 concentration during the reproductive cycle has been reported [31]. The concentration is lower in the early than during the late vitellogenic stages. We propose accordingly, that in reptiles, the changes in the morphology of the speckled pattern of splicing factors in oviductal cells depend on the reproductive condition because of steroid hormones, as in mammals.
3.3. Morphology of speckled pattern in reptile hepatocytes does not change upon the reproductive stage
The liver histological features of the specimens in our study reflects its role in the metabolism of nutrition [41,42], and the event of vitellogenesis in females [43,44]. Those variations imply changes in the size of the hepatocytes [45], the presence of glycogen [42], and the accumulation of lipids [43,46], among others.
The lipid accumulation visualized by the presence of cytoplasmic droplets in females, was higher in the late vitellogenic stage, in agreement to the increase in lipid content in the liver reported in reptiles during the vitellogenesis, which is mediated by the rise of plasma E2 [47].
The lack of differences in the speckled pattern in the hepatocytes of females in different stages of vitellogenesis may be due to a restricted effect of the E2 in the liver, which may be focused on the induction of transcription of the vitellogenin gene and the post-translational modifications of the proteins [48,49].
3.3. Final considerations
Our results are consistent with the notion that the morphology of the speckled pattern is modified in culture and tissue cells submitted to different conditions that modify the transcriptional and splicing activities, including the hormone effect during the estrus cycle in mammals. We now extend this model to other vertebrates as viviparous reptiles.
4. Materials and Methods
Two specimens of Sceloporus torquatus were collected in the REPSA, in Mexico City, during the fall of 2022. Immediately after the collection, the specimens were sacrificed through an overdose of sodium pentobarbital (Dolethal) with previous sedation with Midazolam and Ketamine. Once the absence of heart rhythm was verified using a Doppler ultrasound, the animals were dissected, and ovarian, liver and oviduct fragments were fixed according to the needs of each processing, which will be described below. The bodies and other tissues of the animals, which were not used for this study, were donated to the Wildlife Group of the REPSA's Executive Secretariat (SEREPSA). To carry out the collections, euthanasia, and dissection procedures, we had the collection permit from SEMARNAT (Office No SGPA/DGVS/02556/22), entry and collection permit granted by the SEREPSA (Office: REPSA/92/2022, Project 583) and the opinion approving the project by the Ethics and Scientific Responsibility Committee of the Faculty of Sciences of the UNAM (Office: CEARC/Bioética/12062022).
Characterization of tissues
We implemented the General Histological Technique (GHT) to analyze the tissue's general structure. The tissues samples were fixed by immersion in 4% paraformaldehyde for 2 hours and then dehydrated using ethanol of increasing concentrations (30%, 50%, 60%, 70%,80%, 90%, and 100%) to continue clearing in xylol and the inclusion in paraffin. We obtained sections between 3 and 5 μm thick in previously gelatinized slides with a manually rotating microtome. Finally, the slides were stained with, the Periodic Acid Shift Reaction (PAS), the Masson’s Trichrome and the Coomassie Blue (CB) for protein staining [50].
Also, some fragments were fixed with Karnovsky's mixture (2.5% glutaraldehyde-4% paraformaldehyde) for one hour and post-fixed with osmium tetroxide (OsO4) for 12 hours. Then, gradual dehydration was carried out using increasing concentrations of ethanol, followed by propylene oxide as an intermediate agent and slow pre-inclusion with mixtures of propylene oxide and epoxy resin. Finally, it was included in epoxy resin in a silicone mold and allowed to polymerize in the oven for 24 hours at 600C. Semi-thin sections 300 to 500 nm width were obtained using a Leica Ultracut RT ultramicrotome and stained with Toluidine Blue.
The stained sections were observed and photographed under a Nikon E800 microscope using the NIS Elements software.
Fluorescent immunolocalization
Sections obtained with the previously described GHT were used to carry out the fluorescent immunolocalization of the SR proteins. The slides were rehydrated with ethanol in decreasing concentrations (100%, 96%, 90%, 70%, 50%) and finally in distilled water. Then the Antigen retrieval protocol with citrate buffer was implemented according to the AbCam protocol ([https://www.abcam.com/protocols/ihc-antigen-retrieval-protocol]). After that, the tissues were blocked with BSA (5 %) for 2 hours. Then, incubation was carried out with the mouse monoclonal antibody (Ab) anti-SR proteins (Non-snRNP Splicing Factor) (USBiological, Cat No.: S6570) (specificity of the antibody provided by the manufacturer), with a 1:100 dilution, for 18 hours, in a humid chamber at 4ºC. After incubation, the slides were washed with TBST buffer to remove excess Ab and incubated with the secondary Ab, a polyclonal rabbit anti-mouse immunoglobulin coupled to Texas Red or FITC (Dako, R0270 or F0232). A 1:20 dilution was used, and the incubation was made for one hour in a dark, humid chamber at room temperature. The slides were finally washed with TBST buffer. The slides were mounted with Vectashield fluorescence mounting medium (H-1000) and observed and photographed in a Nikon E800 microscope using the NIS Elements software and a confocal microscope, Olympus FV1000 using the software Olympus Fluoview v4.0.
Image analysis
The images obtained by optical microscopy (bright field and fluorescence) were analyzed with the Fiji software version 1.53t.
The fluorescence images were processed with the recently published Mean-Shift Super Resolution algorithm (MSSR) using the MSSR 2.0 plugin at Fiji. MSSR is a deconvolution algorithm that allows us to increase the resolution of the fluorescence signal and denoise the image [30]. The parameters employed were: MSSR of Order 1, with an Amplification of 2 and a full width at half maximum (FWHM) calculated for each image with the Image Decorrelation Analysis plugin (also accessible in Fiji).
After that, an automatic segmentation threshold was applied to each cell, and the Particle analysis tool was used to measure the area of the elements.
The statistical analysis was carried out in the software Statistica v.10.
The sample means of the parameters were compared using a Simple Parametric Variance Analysis (ANOVA) for those that meet the premises of normality and homogeneity of variance. A posteriori comparison test was carried out employing a Tukey test for the comparisons where the Ho was rejected. Data that did not meet the premises for parametric tests were compared using the non-parametric Kruskal-Wallis ANOVA.
Author Contributions
“Conceptualization, J.A-C., M.L.S-V. and L.F.J-G.; methodology, J.A-C, S.J.C-G., A.P.M-vdB.; software, J.A-C.; validation, J.A-C., M.L.S-V. and L.F.J-G.; formal analysis, J.A-C., M.L.S-V. and L.F.J-G.; investigation, J.A-C., M.L.S-V. and L.F.J-G.; resources, M.L.S-V and L.F.J-G.; data curation, J.A-C., M.L.S-V. and L.F.J-G.; writing—original draft preparation, J.A-C., M.L.S-V., S.J.C-G., A.P.M-vdB. and L.F.J-G.; writing—review and editing, J.A-C., M.L.S-V. and L.F.J-G.; visualization, J.A-C., M.L.S-V. S.J.C-G., A.P.M-vdB. and L.F.J-G.; supervision, M.L.S-V.; project administration, M.L.S-V. and L.F.J-G.; funding acquisition, M.L.S-V. and L.F.J-G. All authors have read and agreed to the published version of the manuscript.”.
Funding
“This research was funded by UNAM-DGAPA-PAPIIT, grant number IN223223”.
Institutional Review Board Statement
“The animal study protocol was approved by the Ethics Committee of Faculty of Sciences of the UNAM (CEARC/Bioética/12062022). Collection permit from SEMARNAT (Office No SGPA/DGVS/02556/22), entry and collection permit granted by the SEREPSA (Office: REPSA/92/2022, Project 583)”.
Data Availability Statement
The original contributions presented in the study are included in the article, further inquiries can be directed to the corresponding author/s.
Acknowledgments
This paper is part of the requirements for obtaining a Doctoral degree at the Posgrado en Ciencias Biológicas, UNAM of JA-C, who obtained a CONAHCyT (CVU: 1014003) and DGAPA (IN223223) scholarships. We thank Mónica Salmerón, Pablo Arenas, Guadalupe Hiriart, María de los Remedios Ramírez, Rosario Labastida, Karla Daniela González and Alfonso Salgado for technical support. We thank José Guadalupe Cisneros for providing the human fibroblasts.
Conflicts of Interest
“The authors declare no conflict of interest.”.
References
- Spector, D.L. Nuclear domains. J Cell Sci 2001, 114, 2891–2893. [Google Scholar] [CrossRef] [PubMed]
- Lamond, A.I.; Spector, D.L. Nuclear speckles: a model for nuclear organelles. Nat Rev Mol Cell Biol 2003, 4, 605–612. [Google Scholar] [CrossRef] [PubMed]
- George-Téllez, R.; Segura-Valdez, M.L.; González-Santos, L.; Jiménez-García, L.F. Cellular organization of pre-mRNA splicing factors in several tissues. Changes in the uterus by hormone action. Biol Cell 2002, 94, 99–108. [Google Scholar] [CrossRef]
- Acosta-Cárdenas, J.; Jiménez-García, L.F.; Segura-Valdez, M.L. Speckles in tissues. MOJ Anat Physiol 2022, 9, 1–3. [Google Scholar] [CrossRef]
- Spector, D.L.; Smith, H.C. Redistribution of U-snRNPs during Mitosis. Exp Cell Res 1986, 163, 87–94. [Google Scholar] [CrossRef] [PubMed]
- Spector, D.L.; Fu, X.D.; Maniatis, T. Associations between distinct pre-mRNA splicing components and the cell nucleus. EMBO J 1991, 10, 3467–3481. [Google Scholar] [CrossRef] [PubMed]
- Jiménez-García, L.F.; Spector, D.L. In Vivo Evidence That Transcription and Splicing Are Coordinated by a Recruiting Mechanism. Cell 1993, 73, 47–59. [Google Scholar] [CrossRef]
- Jiménez-García, L.F.; Lara-Martínez, R.; Gil-Chavarría, I.; Zamora-Cura, A.L.; Salcedo-Alvarez, M.; Agredano-Moreno, L.T.; Moncayo-Sahagún, J.d.J.; Segura-Valdez, M.d.L. Biología celular del splicing. Mensaje Bioquímico 2007, XXXI, 141–156. [Google Scholar]
- Fakan, S.; Leser, G.; Martin, T.E. Ultrastructural distribution of nuclear ribonucleoproteins as visualized by immunocytochemistry on thin sections. J Cell Biol 1984, 98, 358–363. [Google Scholar] [CrossRef]
- Nyman, U.; Hallman, H.; Hadlaczky, G.; Pettersson, I.; Sharp, G.; Ringertz, N.R. Intranuclear localization of snRNP antigens. J Cell Biol 1986, 102, 137–144. [Google Scholar] [CrossRef]
- Spector, D.L. Higher order nuclear organization: three-dimensional distribution of small nuclear ribonucleoprotein particles. Proc Nat Acad Sci 1990, 87, 147–1511990. [Google Scholar] [CrossRef] [PubMed]
- Saitoh, N.; Spahr, C.S.; Patterson, S.D.; Bubulya, P.; Neuwald, A.F.; Spector, D.L. Proteomic analysis of interchromatin granule clusters. Mol Biol Cell 2004, 15, 3876–3890. [Google Scholar] [CrossRef] [PubMed]
- Hall, L.L.; Smith, K.P.; Byron, M.; Lawrence, J.B. Molecular Anatomy of a Speckle. Anat Rec A 2006, 288, 664–675. [Google Scholar] [CrossRef]
- Fakan, S. Perichromatin fibrils are in situ forms of nascent transcripts. Trends Cell Biol 1994, 4, 86–90. [Google Scholar] [CrossRef]
- Chen, Y.; Belmont, A.S. Genome organization around nuclear speckles. Curr Opin Genet Dev 2019, 55, 91–99. [Google Scholar] [CrossRef]
- Monneron, A.; Bernhard, W. Fine Structural Organization of the Interphase Nucleus in Some Mammalian Cells. J Ultrastruct Res 1969, 27, 266–288. [Google Scholar] [CrossRef] [PubMed]
- Biggiogera, M.; Cisterna, B.; Spedito, A.; Vecchio, L.; Malatesta, M. Perichromatin fibrils as early markers of transcriptional alteration. Differentiation 2007, 76, 57–65. [Google Scholar] [CrossRef]
- Fakan, S.; Nobis, P. Utrastructural localization of transcription sites and of RNA distribution during the cell cycle of synchronized CHO cells. Exp Cell Res 1978, 113, 327–337. [Google Scholar] [CrossRef]
- Visa, N.; Puvion-Dutilleul, F.; Harper, F.; Bachellerie, J.P.; Puvion, E. Intranuclear Distribution of Poly(A) RNA Determined by Electron Microscope in Situ Hybridization. Exp Cell Res 1993, 208, 19–34. [Google Scholar] [CrossRef]
- Cmarko, D.; Verschure, P.J.; Martin, T.E.; Dahmus, M.E.; Krause, S.; Fu, X.D.; Fakan, S. Ultrastructural Analysis of Transcription and Splicing in the Cell Nucleus after Bromo-UTP Microinjection. Mol Biol Cell 1999, 10, 211–223. [Google Scholar] [CrossRef]
- Spector, D.L.; O'keefe, R.T.; Jiménez-García, L.F. Dynamics of transcription and pre-mRNA splicing within the mammalian cell nucleus. Cold Spring Harbor Symp Quant Biol 1993, 58. [Google Scholar] [CrossRef]
- Carmo-Fonseca, M.; Pepperkok, R.; Carvalho, M.T.; Lamond, A.I. Transcription-dependent Colocalization of the U1, U2, U4/U6, and U5 snRNPs in Coiled Bodies. J Cell Biol 1992, 117, 1–14. [Google Scholar] [CrossRef]
- Wu, J.Y.; Maniatis, T. Specific Interactions between Proteins Implicated in Splice Site Selection and Regulated Alternative Splicing. Cell 1993, 75, 1061–1070. [Google Scholar] [CrossRef] [PubMed]
- Spector, D.L. Nuclear Organization and Gene Expression. Exp Cell Res 1996, 229, 189–197. [Google Scholar] [CrossRef] [PubMed]
- Misteli, T.; Spector, D.L. Serine/Threonine Phosphatase 1 Modulates the Subnuclear Distribution of Pre-mRNA Splicing Factors. Mol Biol Cell 1996, 7, 1559–1572. [Google Scholar] [CrossRef] [PubMed]
- Mintz, P.J.; Patterson, S.D.; Neuwald, A.F.; Spahr, C.S.; Spector, D.L. Purification and biochemical characterization of interchromatin granule clusters. EMBO J 1999, 18, 4308–4320. [Google Scholar] [CrossRef]
- Misteli, T.; Cáceres, J.F.; Spector, D.L. The dynamics of a pre-mRNA splicing factor in living cells. Nature 1997, 387, 523–527. [Google Scholar] [CrossRef] [PubMed]
- Segura-Valdez, M.d.L.; Negrete-García, C.; Rodríguez-Gómez, Y.; Sanz-Ochotorena, A.; Lara-Martínez, R.; Moncayo-Sahagún, J.d.J.; Gómez-Arizmendi, C.M.; Jiménez-García, L.F. Organización intranuclear de proteínas SR en vertebrados. TIP Revista Especializada en Ciencias Químico-Biológicas 2007, 10, 65–69. [Google Scholar]
- Uribe, M.C.A.; Mendez-Omana, M.E.; González-Quintero, J.E.; Guillette Jr, L.J. Seasonal Variation in Ovarian Histology of the Viviparous Lizard Sceloporus torquatus torquatus. J Morphol 1995, 103–119. [Google Scholar] [CrossRef]
- Torres-García, E.; Pinto-Cámara, R.; Linares, A.; Martínez, D.; Abonza, V.; Brito-Alarcón, E.; Calcines-Cruz, C.; Valdés-Galindo, G.; Torres, D.; Jablonski, M.; et al. Extending resolution within a single imaging frame. Nat Commun 2022, 13, 7452. [Google Scholar] [CrossRef]
- Cruz-Cano, N.B.; Sánchez-Rivera, U.A.; Álvarez-Rodríguez, C.; Dávila-Govantes, R.; Cárdenas-León, M.; Martínez-Torres, M. Sex steroids are correlated with environmental factors and body condition during the reproductive cycle in females of the lizard Sceloporus torquatus. Gen Comp Endocrinol 2021, 314, 113921. [Google Scholar] [CrossRef]
- Manley, J.L.; Krainer, A.R. A rational nomenclature for serine/arginine-rich protein splicing factors (SR proteins). Genes Dev 2010, 24, 1073–1074. [Google Scholar] [CrossRef]
- Huang, S.; Spector, D.L. Nascent pre-mRNA transcripts are associated with nuclear regions enriched in splicing factors. Genes Dev 1991, 5, 2288–2302. [Google Scholar] [CrossRef] [PubMed]
- Siegel, D.S.; Miralles, A.; Chabarria, R.E.; Aldridge, R.D. Female reproductive anatomy: cloaca, oviduct, and sperm storage. In Reproductive biology and phylogeny of snakes; Aldridge, R.D., Sever, D.M., Eds.; CRC Press: Queensland, Australia, 2011; Volume 9, pp. 347–409. [Google Scholar]
- Mead, R.A.; Eroschenko, V.P.; Highfill, D.R. Effects of Progesterone and Estrogen on the Histology of the Oviduct of the Garter Snake, Thamnophis elegans. Gen Comp Endocrinol 1981, 45, 345–354. [Google Scholar] [CrossRef]
- Paolucci, M.; Di Fiore, M.M.; Ciarcia, G. Oviduct 17β-Estradiol Receptor in the Female Lizard, Podarcis s. sicula, during the Sexual Cycle: Relation to Plasma 17β-Estradiol Concentration and Its Binding Proteins. Zool Sci 1992, 9, 1025–1035. [Google Scholar]
- Blackburn, D.G. Structure, Function, and Evolution of the Oviducts of Squamate Reptiles, With Special Reference to Viviparity and Placentation. J Exp Zool 1998, 282, 560–617. [Google Scholar] [CrossRef]
- Rojas, C.A.; Barros, V.A.; Almeida-Santos, S.M. A histological and ultrastructural investigation of the female reproductive system of the water snake (Erythrolamprus miliaris): Oviductal cycle and sperm storage. Acta Zool 2019, 100, 69–80. [Google Scholar] [CrossRef]
- Girling, J.E. The Reptilian Oviduct: A Review of Structure and Function and Directions for Future Research. J Exp Zool 2002, 293, 141–170. [Google Scholar] [CrossRef]
- Jones, S. Hormonal Regulation of Ovarian Function in Reptiles. In Hormones and Reproduction of Vertebrates; Norris, D.O., Lopez, K.J., Eds.; Elsevier Inc: Amsterdam, Netherlands, 2011; Volume 3, pp. 89–115. [Google Scholar]
- Moura, L.R.; Santos, A.L.Q.; Belleti, M.E.; Vieira, L.G.; Orpinelli, S.R.T.; De Simone, S.B.S. Morphological aspects of the liver of the freshwater turtle Phrynops geoffroanus Schweigger, 1812 (Testudines, Chelidae). Braz J Morphol. Sci. 2009, 26, 129–134. [Google Scholar]
- Firmiano, E.M.S.; Cardoso, N.N.; Vieira, D.A.; Sales, A.; Santos, M.A.J.; Mendes, A.L.S.; Nascimento, A.A. Histological study of the liver of the lizard Tropidurus torquatus Wied 1820, (Squamata: Tropiduridae). J Morphol. Sci. 2011, 28, 165–170. [Google Scholar]
- Goldberg, S.R. Seasonal Weight and Cytological Changes in the Fat Bodies and Liver of the Iguanid Lizard Sceloporus jarrovi Cope. Copeia 1972, 1972, 227–232. [Google Scholar] [CrossRef]
- Yaron, Z.; Widzer, L. The control of vitellogenesis by ovarian hormones in the lizard Xantusia vigilis. Comp Biochem Physiol 1978, 60, 279–284. [Google Scholar] [CrossRef]
- Feria-Ortiz, M.; Ugarte-Salgado, I.H.; García-Vázquez, U.O. Fat Body, Liver, and Carcass Mass Cycles In the Viviparous Lizard Sceloporus torquatus torquatus (Squamata: Phrynosomatidae). Southw. Naturalist 2018, 63, 1–7. [Google Scholar] [CrossRef]
- Ganser, L.R.; Hopkins, W.A.; O'Neil, L.; Hasse, S.; Roe, J.H.; Sever, D.M. Liver Histopathology of the Southern Watersnake, Nerodia fasciata fasciata, Following Chronic Exposure to Trace Element-Contaminated Prey from a Coal Ash Disposal Site. J Herpetol 2003, 37, 219–226. [Google Scholar] [CrossRef]
- Price, E.R. The physiology of lipid storage and use in reptiles. Biol Rev 2016, 92, 1406–1426. [Google Scholar] [CrossRef]
- Skipper, J.K.; Hamilton, T.H. Regulation by estrogen of the vitellogenin gene. PNAS 1977, 74(6), 2384–2388. [Google Scholar] [CrossRef] [PubMed]
- Lewis, J.A.; Clemens, M.J.; Tata, J.R. Morphological and biochemical changes in the hepatic endoplasmic reticulum and Golgi apparatus of male Xenopus laevis after induction of egg-yolk protein synthesis by oestradiol-17β. Mol Cell Endocrinol 1976, 4(5), 311–329. [Google Scholar] [CrossRef] [PubMed]
- Kiernan, J.A. Histological and Histochemical Methods: Theory and practice, 5th ed.; Scion Publishing Ltd.: Banbury, United Kingdom, 2015; 588p. [Google Scholar]
Figure 1.
Reproductive stages of ovaries of S. torquatus. a) Early vitellogenic female, Masson´s Trichrome; b) Late vitellogenic female, Toluidine blue. Bright field. Bars: 10 µm.
Figure 1.
Reproductive stages of ovaries of S. torquatus. a) Early vitellogenic female, Masson´s Trichrome; b) Late vitellogenic female, Toluidine blue. Bright field. Bars: 10 µm.
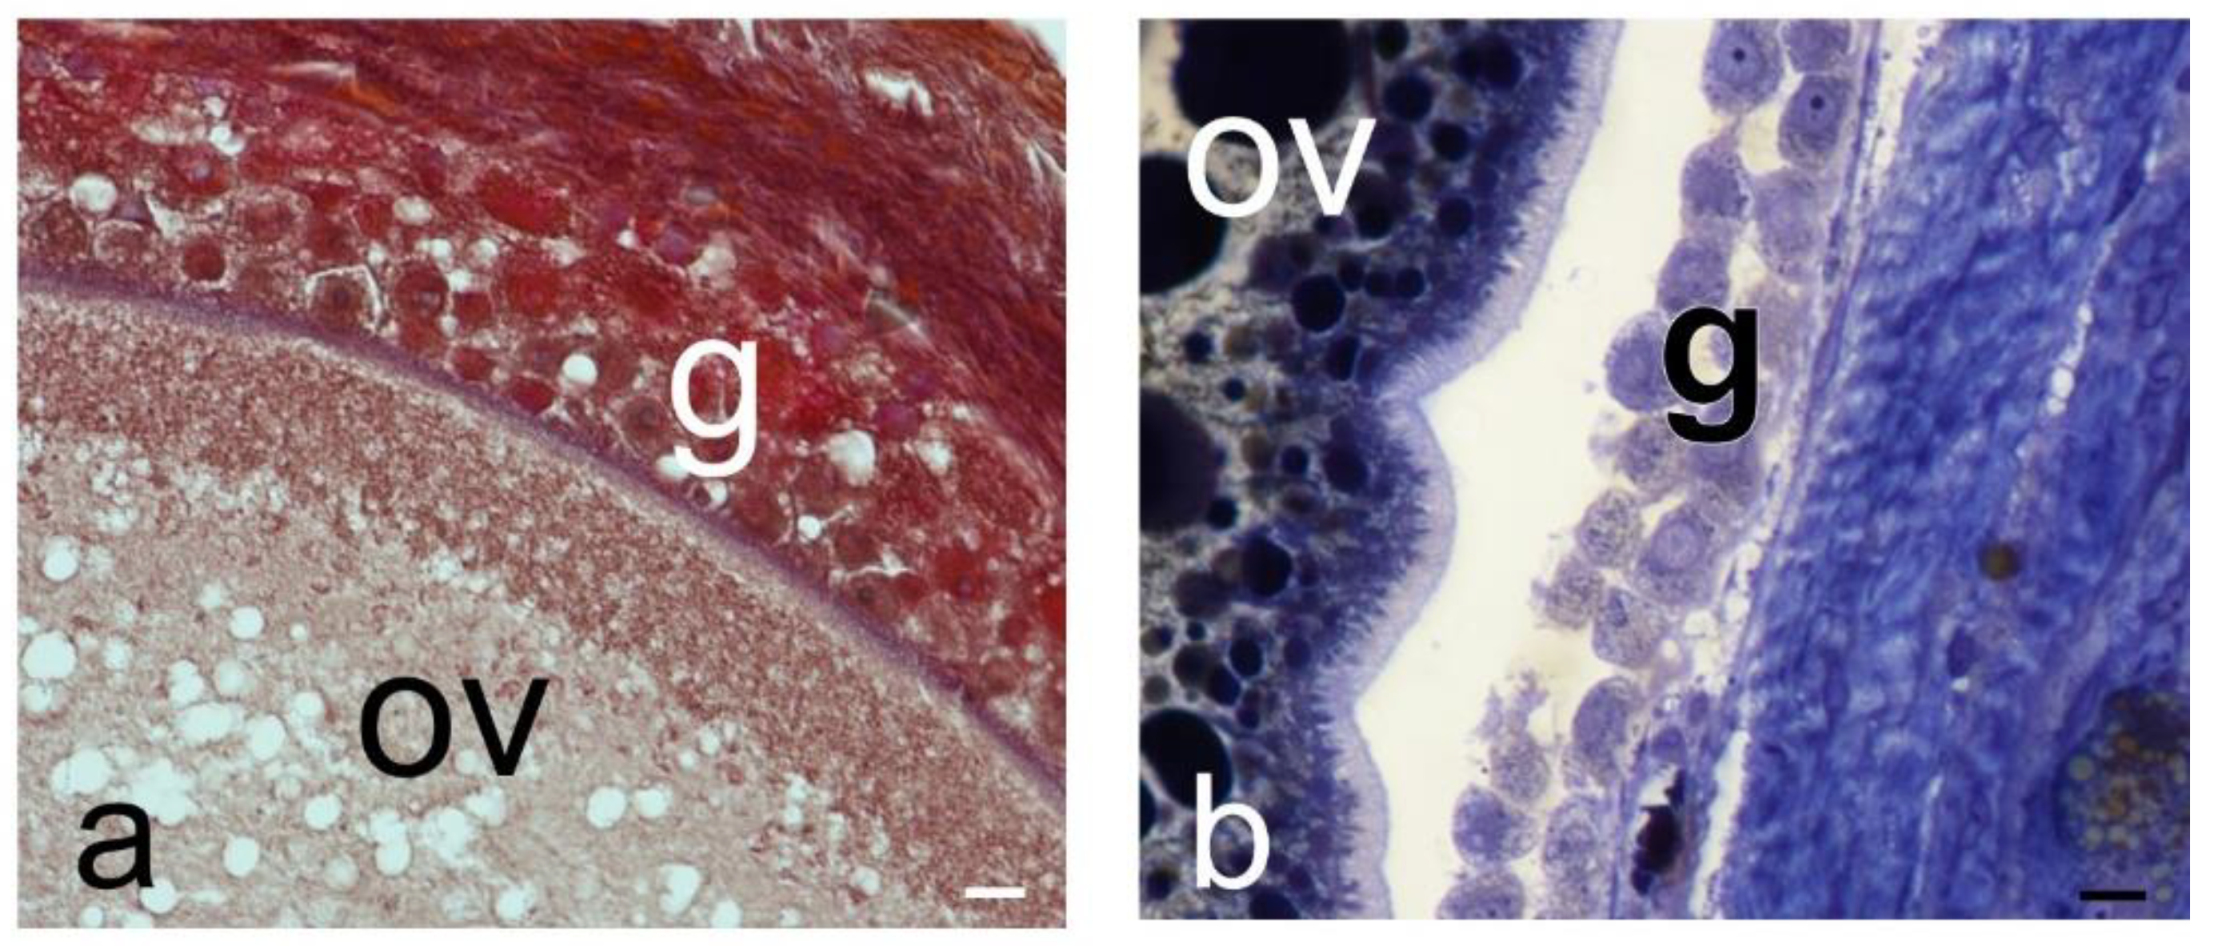
Figure 2.
Immunofluorescence of splicing factors in mammals and reptiles. a) Lung human fibroblasts, bar: 10 μm. b) Hepatocytes of Sceloporus torquatus, bar: 2 μm. c) Luminal epithelial cells of the oviduct of S. torquatus, bar: 2 μm. d) Glandular epithelial cells of the oviduct of S. torquatus, bar: 2 μm. N, nucleus.
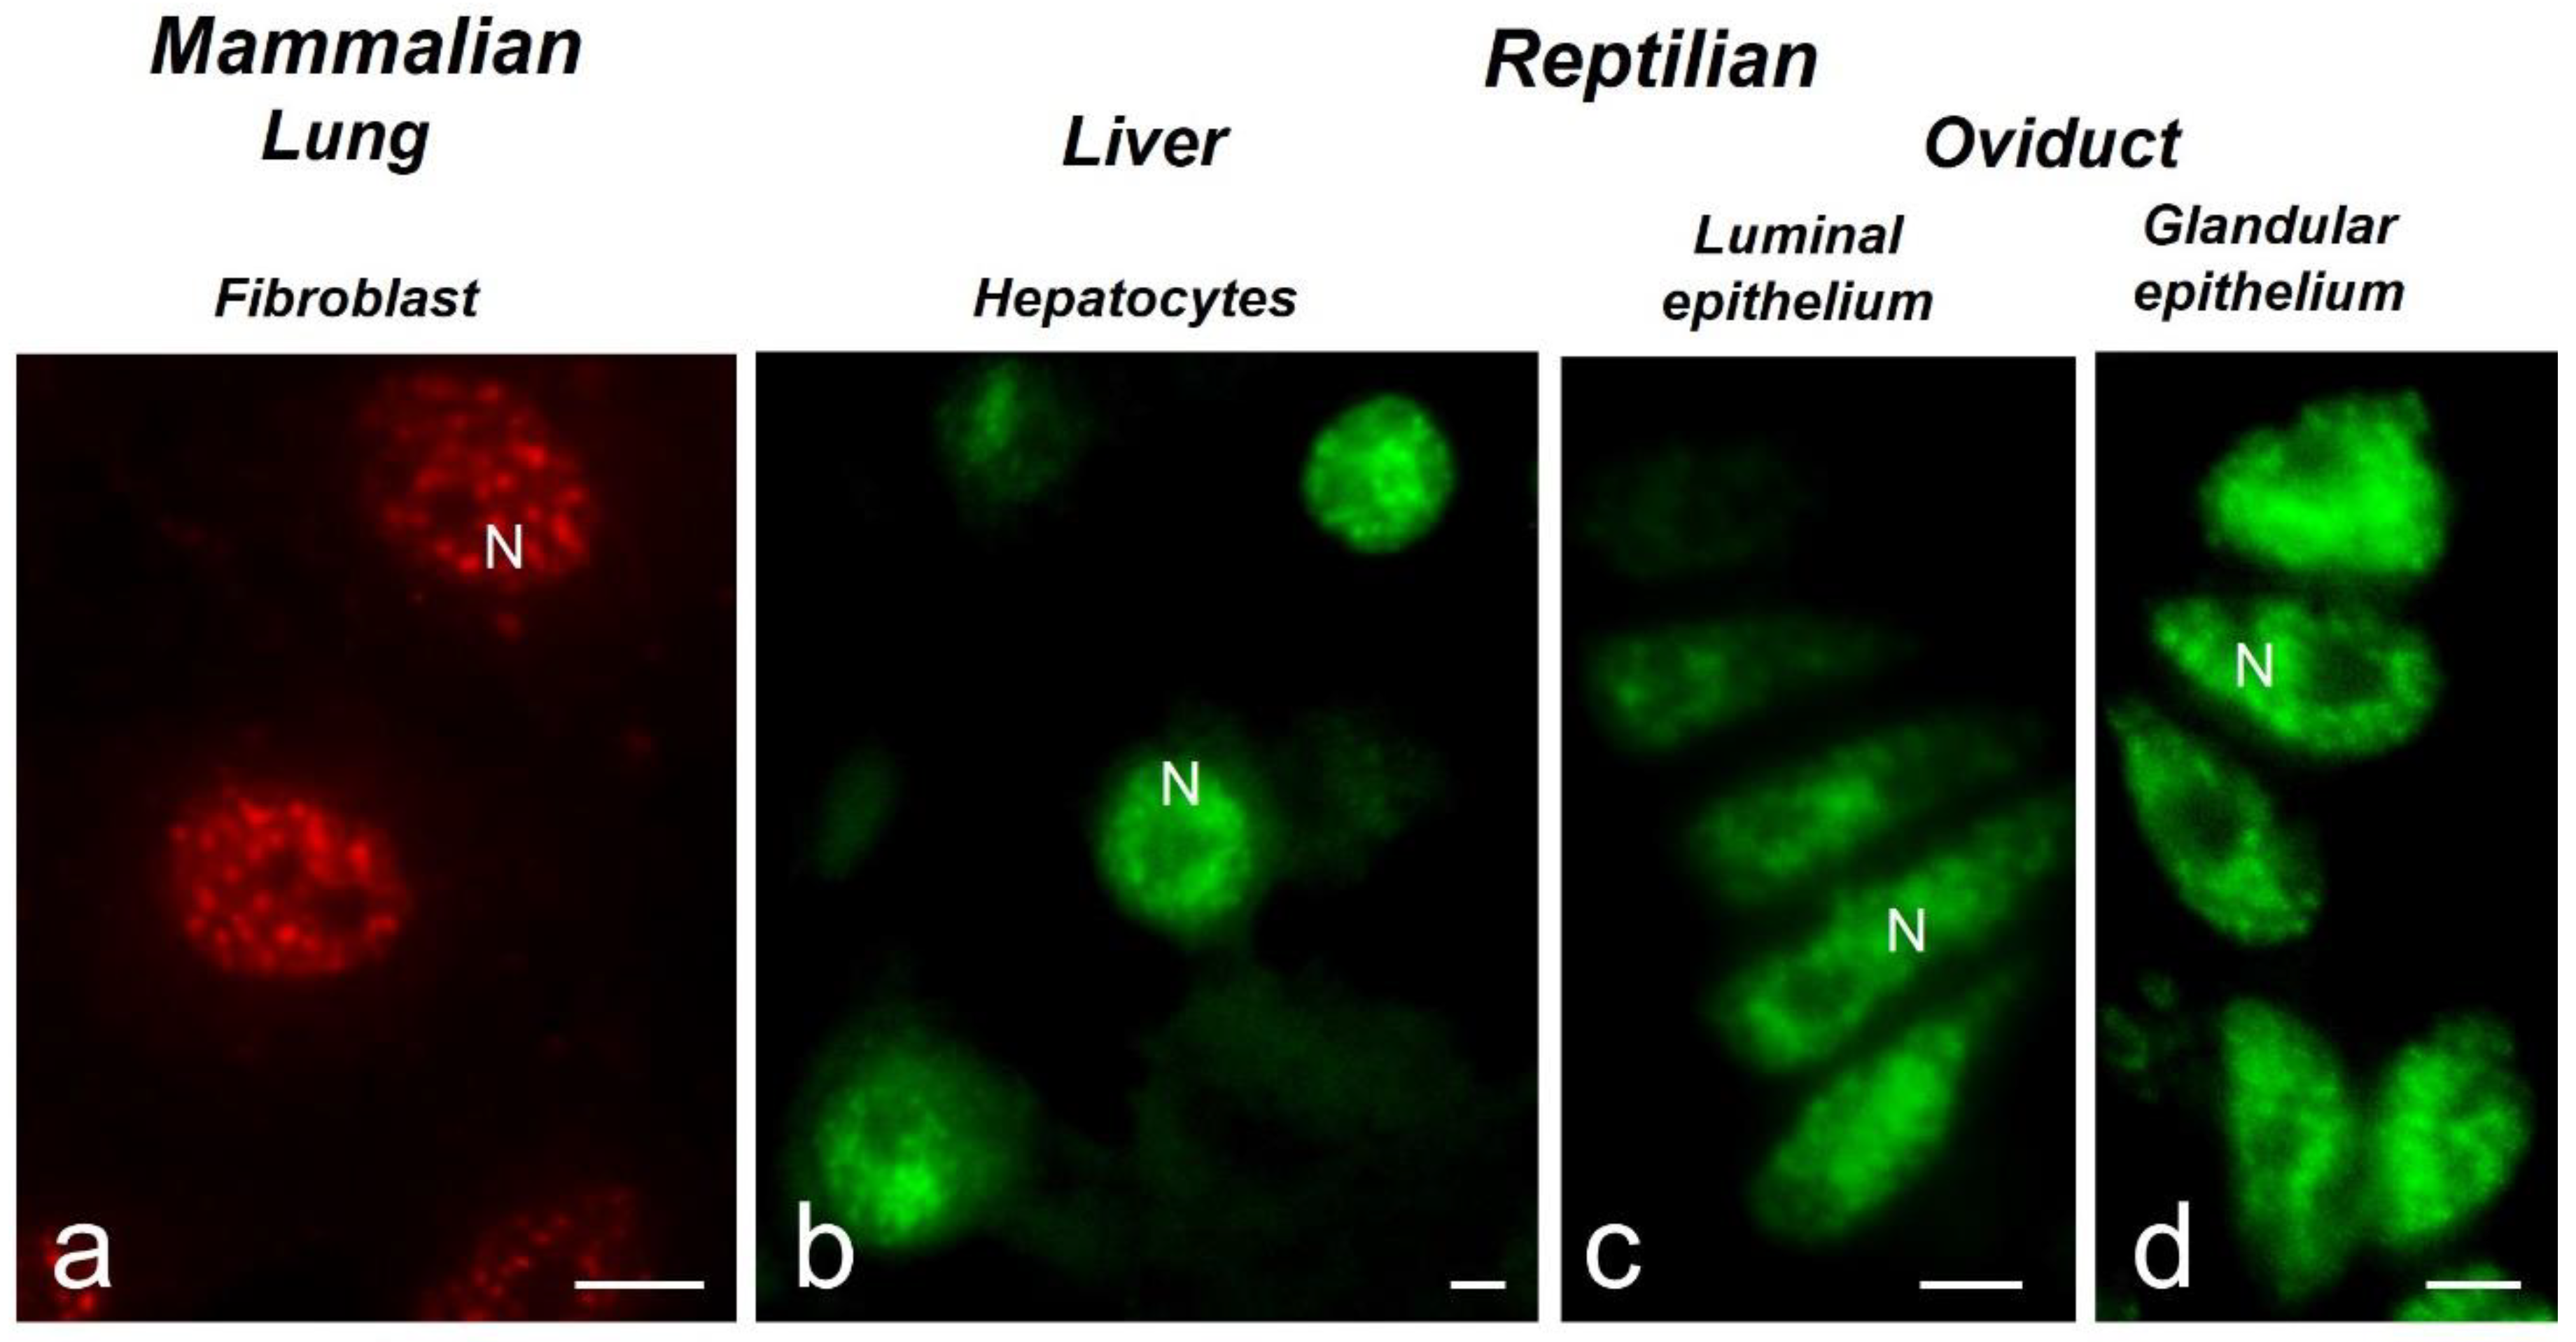
Figure 3.
Immunofluorescence of splicing factors in reptile hepatocytes. a) Confocal image. b) MSSR image. N, nucleus, bars: 5µm.
Figure 3.
Immunofluorescence of splicing factors in reptile hepatocytes. a) Confocal image. b) MSSR image. N, nucleus, bars: 5µm.
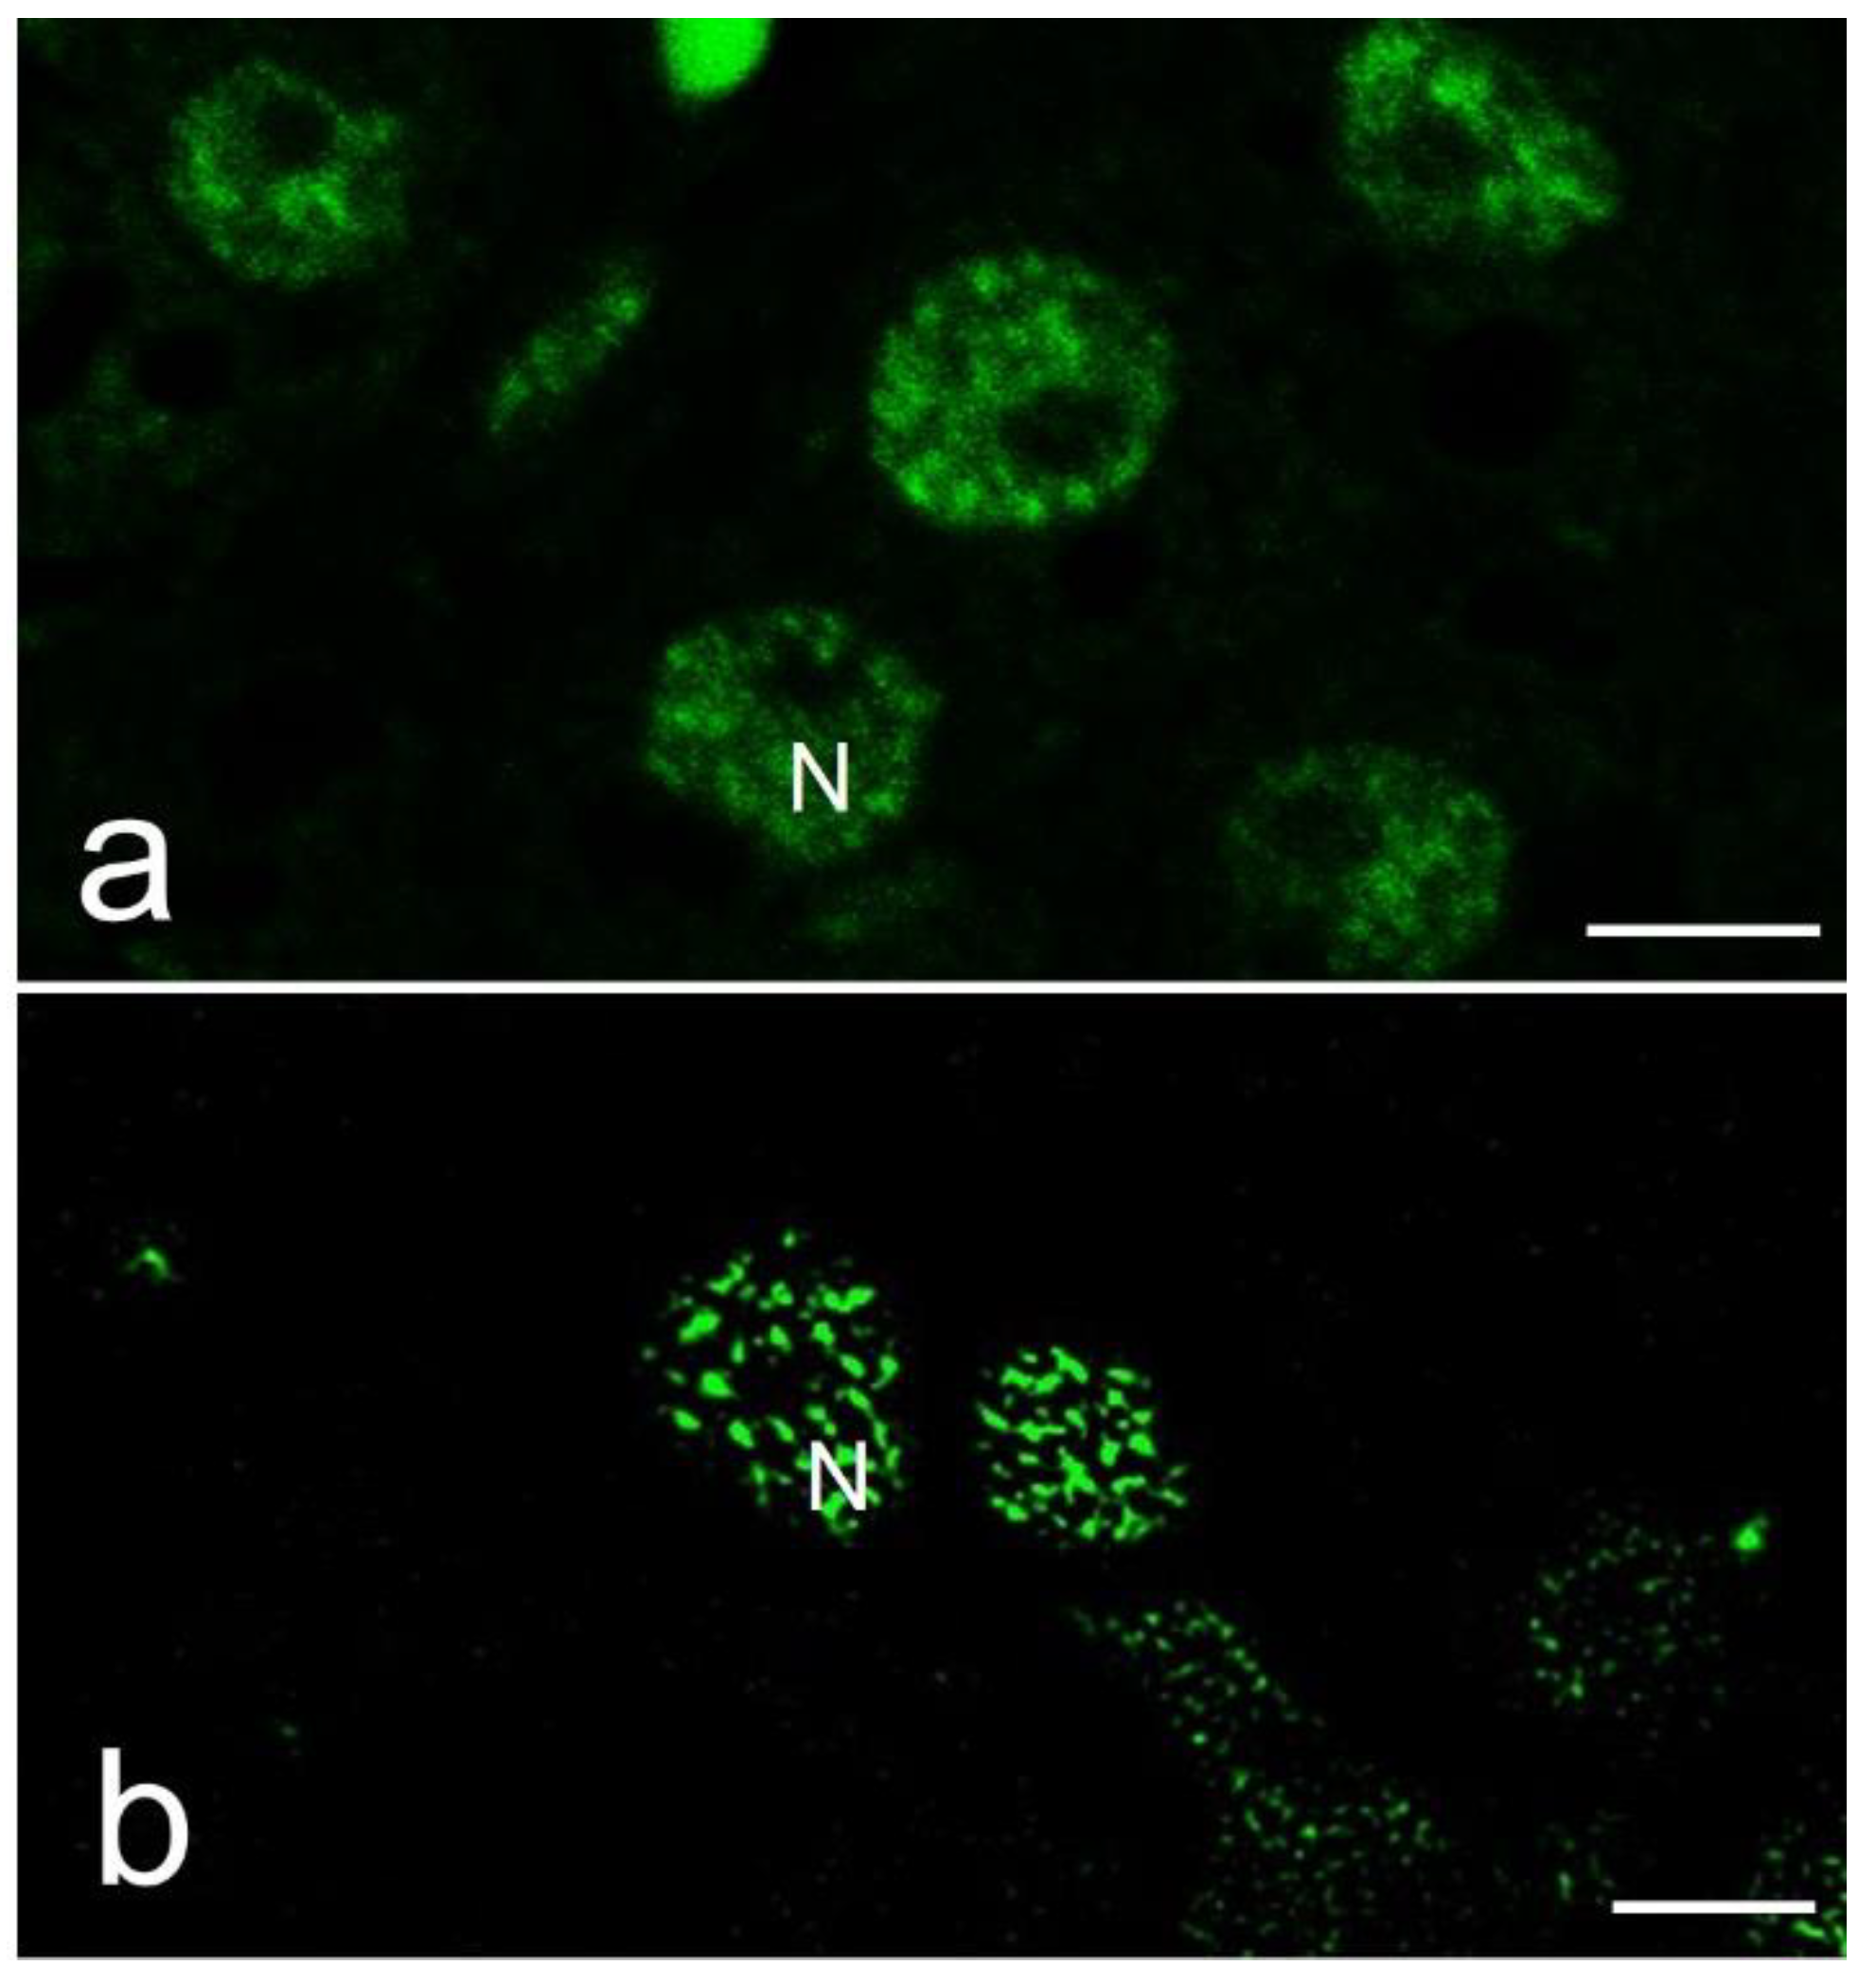
Figure 4.
MSSR images of splicing factor in glandular cells at early (a) and late (b) vitellogenic stage of S. torquatus. At early vitellogenic stage, a pale staining is observed with CB (c) and PAS (e) histochemistry in the glands (G). At late vitellogenic stage, a strong staining is observed with CB (d) and PAS (f) histochemistry. N, nucleus; bars: 10 μm.
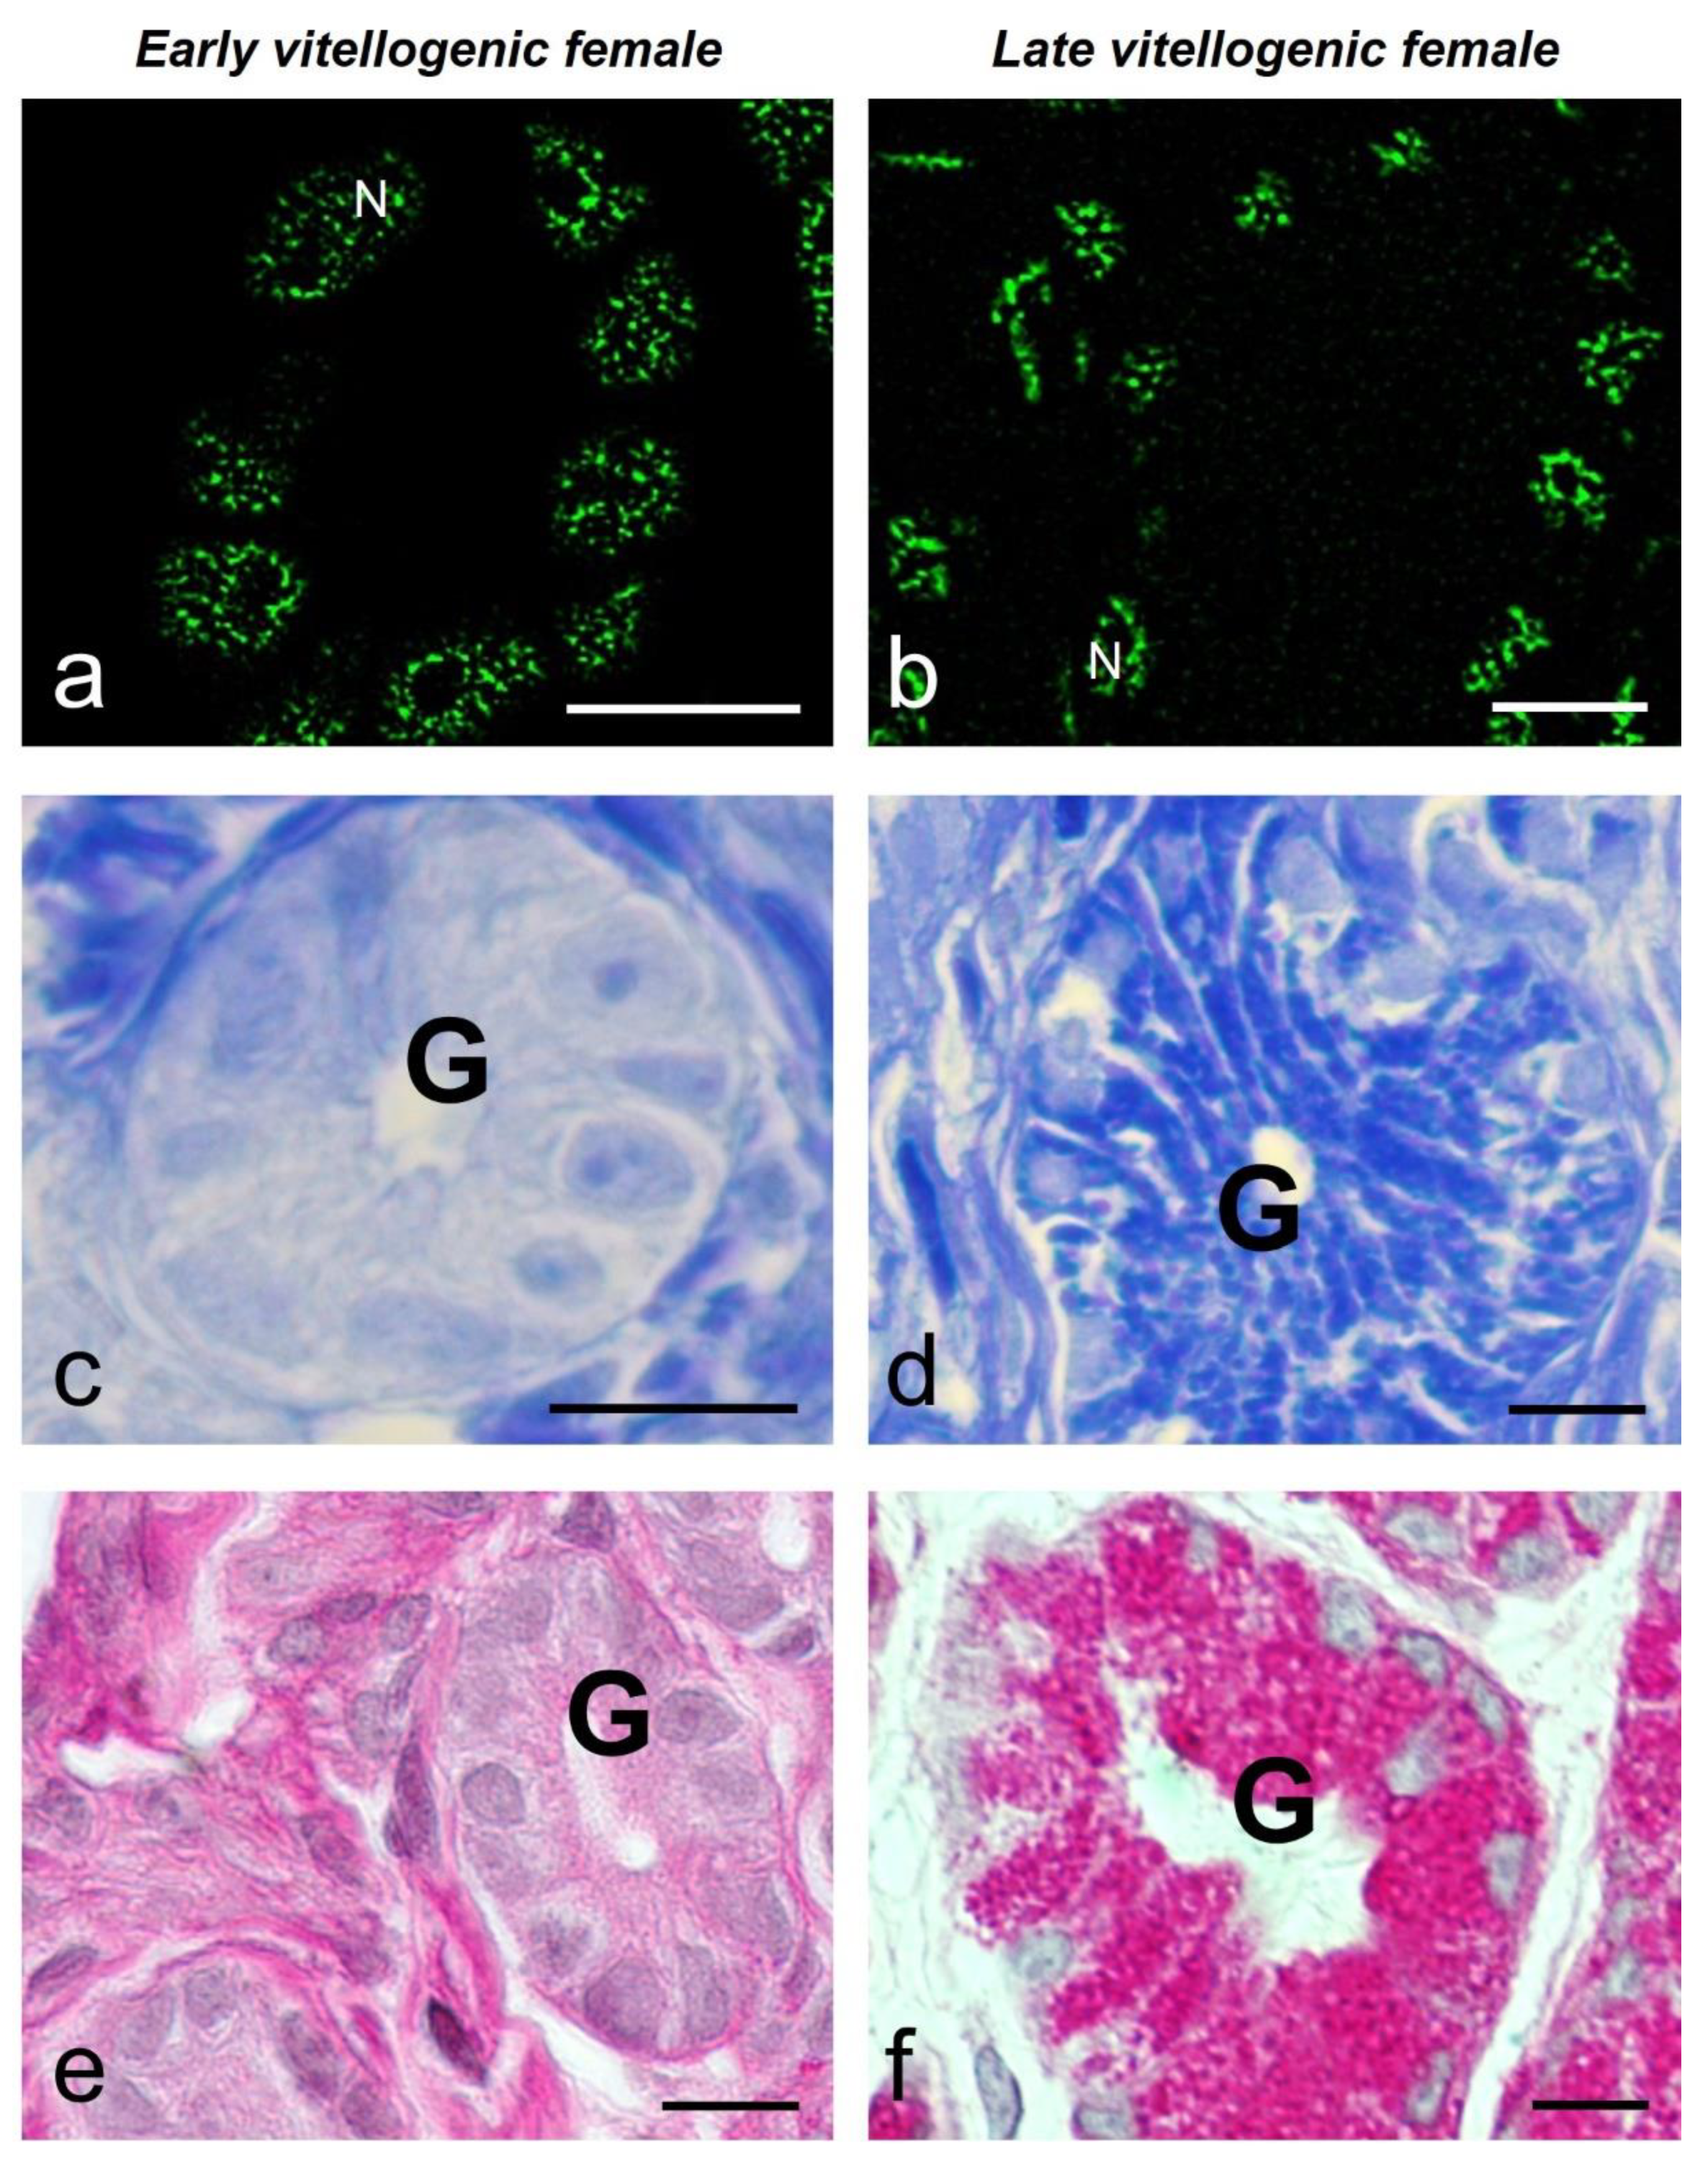
Figure 5.
The size of speckles in the oviductal cells in relation to reported hormonal levels during the reproductive cycle of S. torquatus [31]. In the glandular and luminal epithelial cells, the size of speckles is much higher in the late-vitellogenic female than in the early-vitellogenic. G: Glandular cell, L: Luminal cell, Lc: Ciliated luminal cell, Ls: Secretory luminal cell.
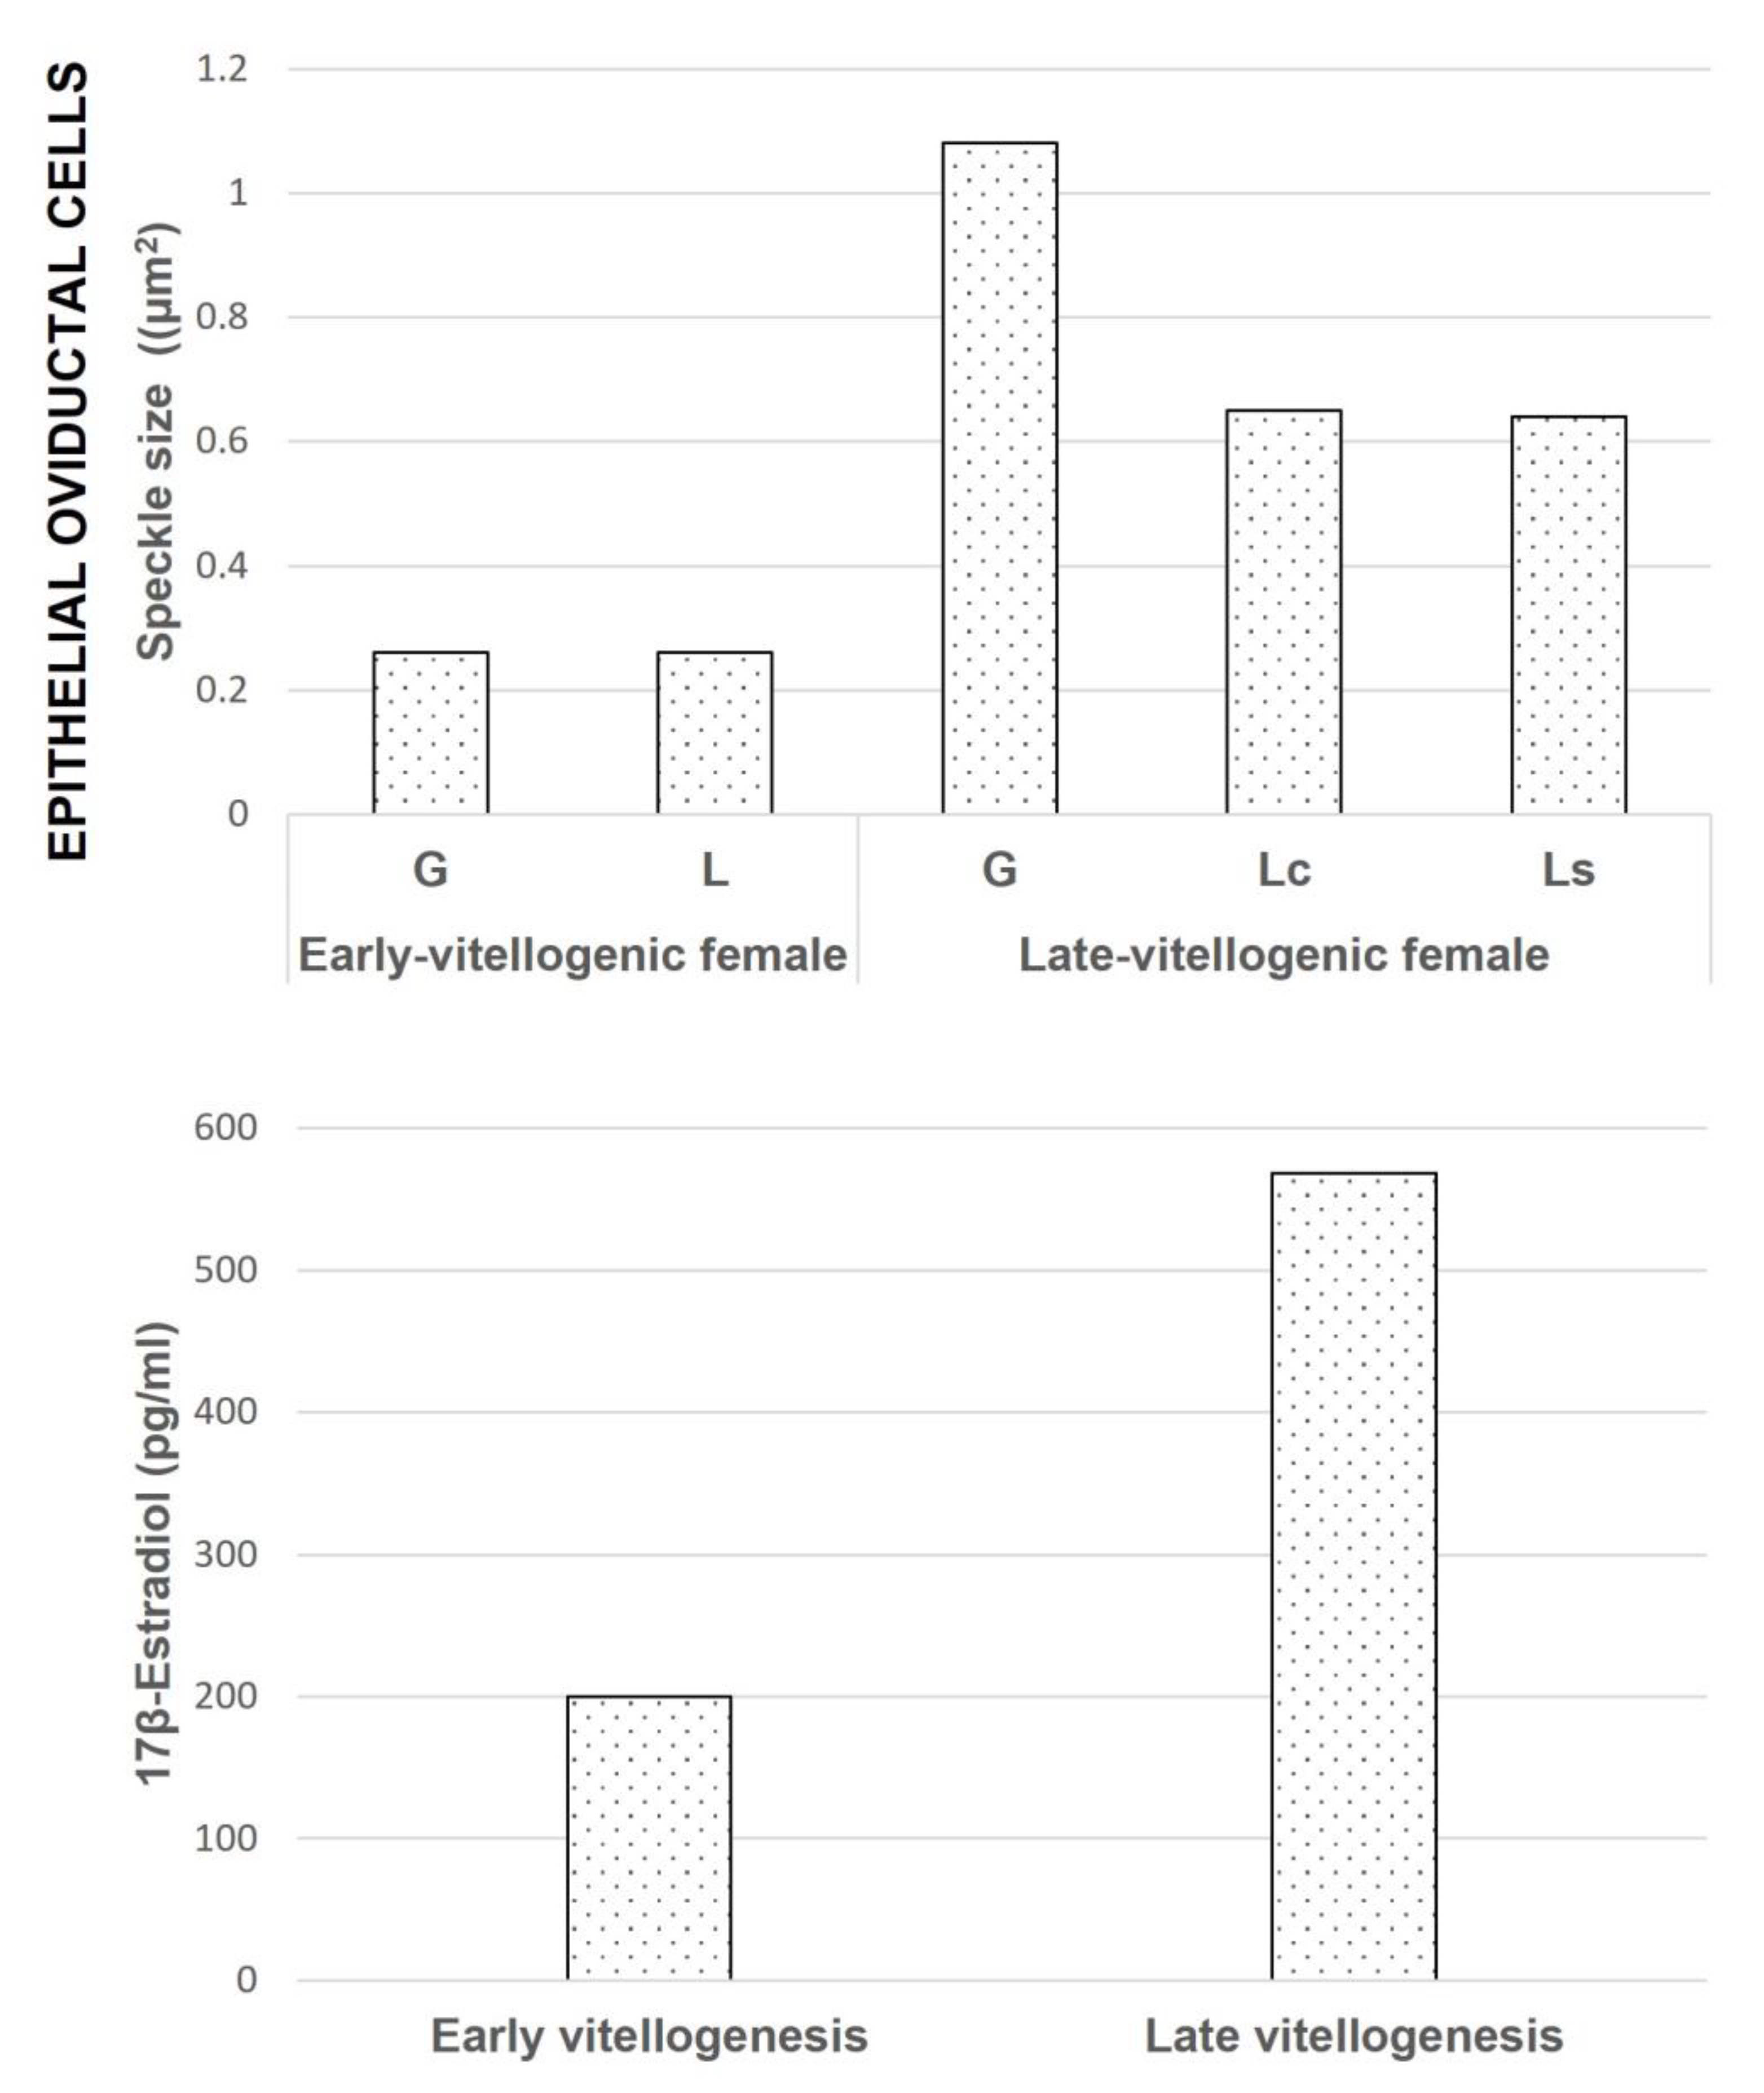
Figure 6.
MSSR images of splicing factor in luminal epithelial cells at early (a) and late (b) vitellogenic stage of S. torquatus. At early vitellogenic stage, a pale staining is observed with CB (c) and PAS (e) histochemistry in the epithelium (E). At late vitellogenic stage, a strong staining is observed with CB (d) and PAS (f) histochemistry. N, nucleus; bars: 10 μm.
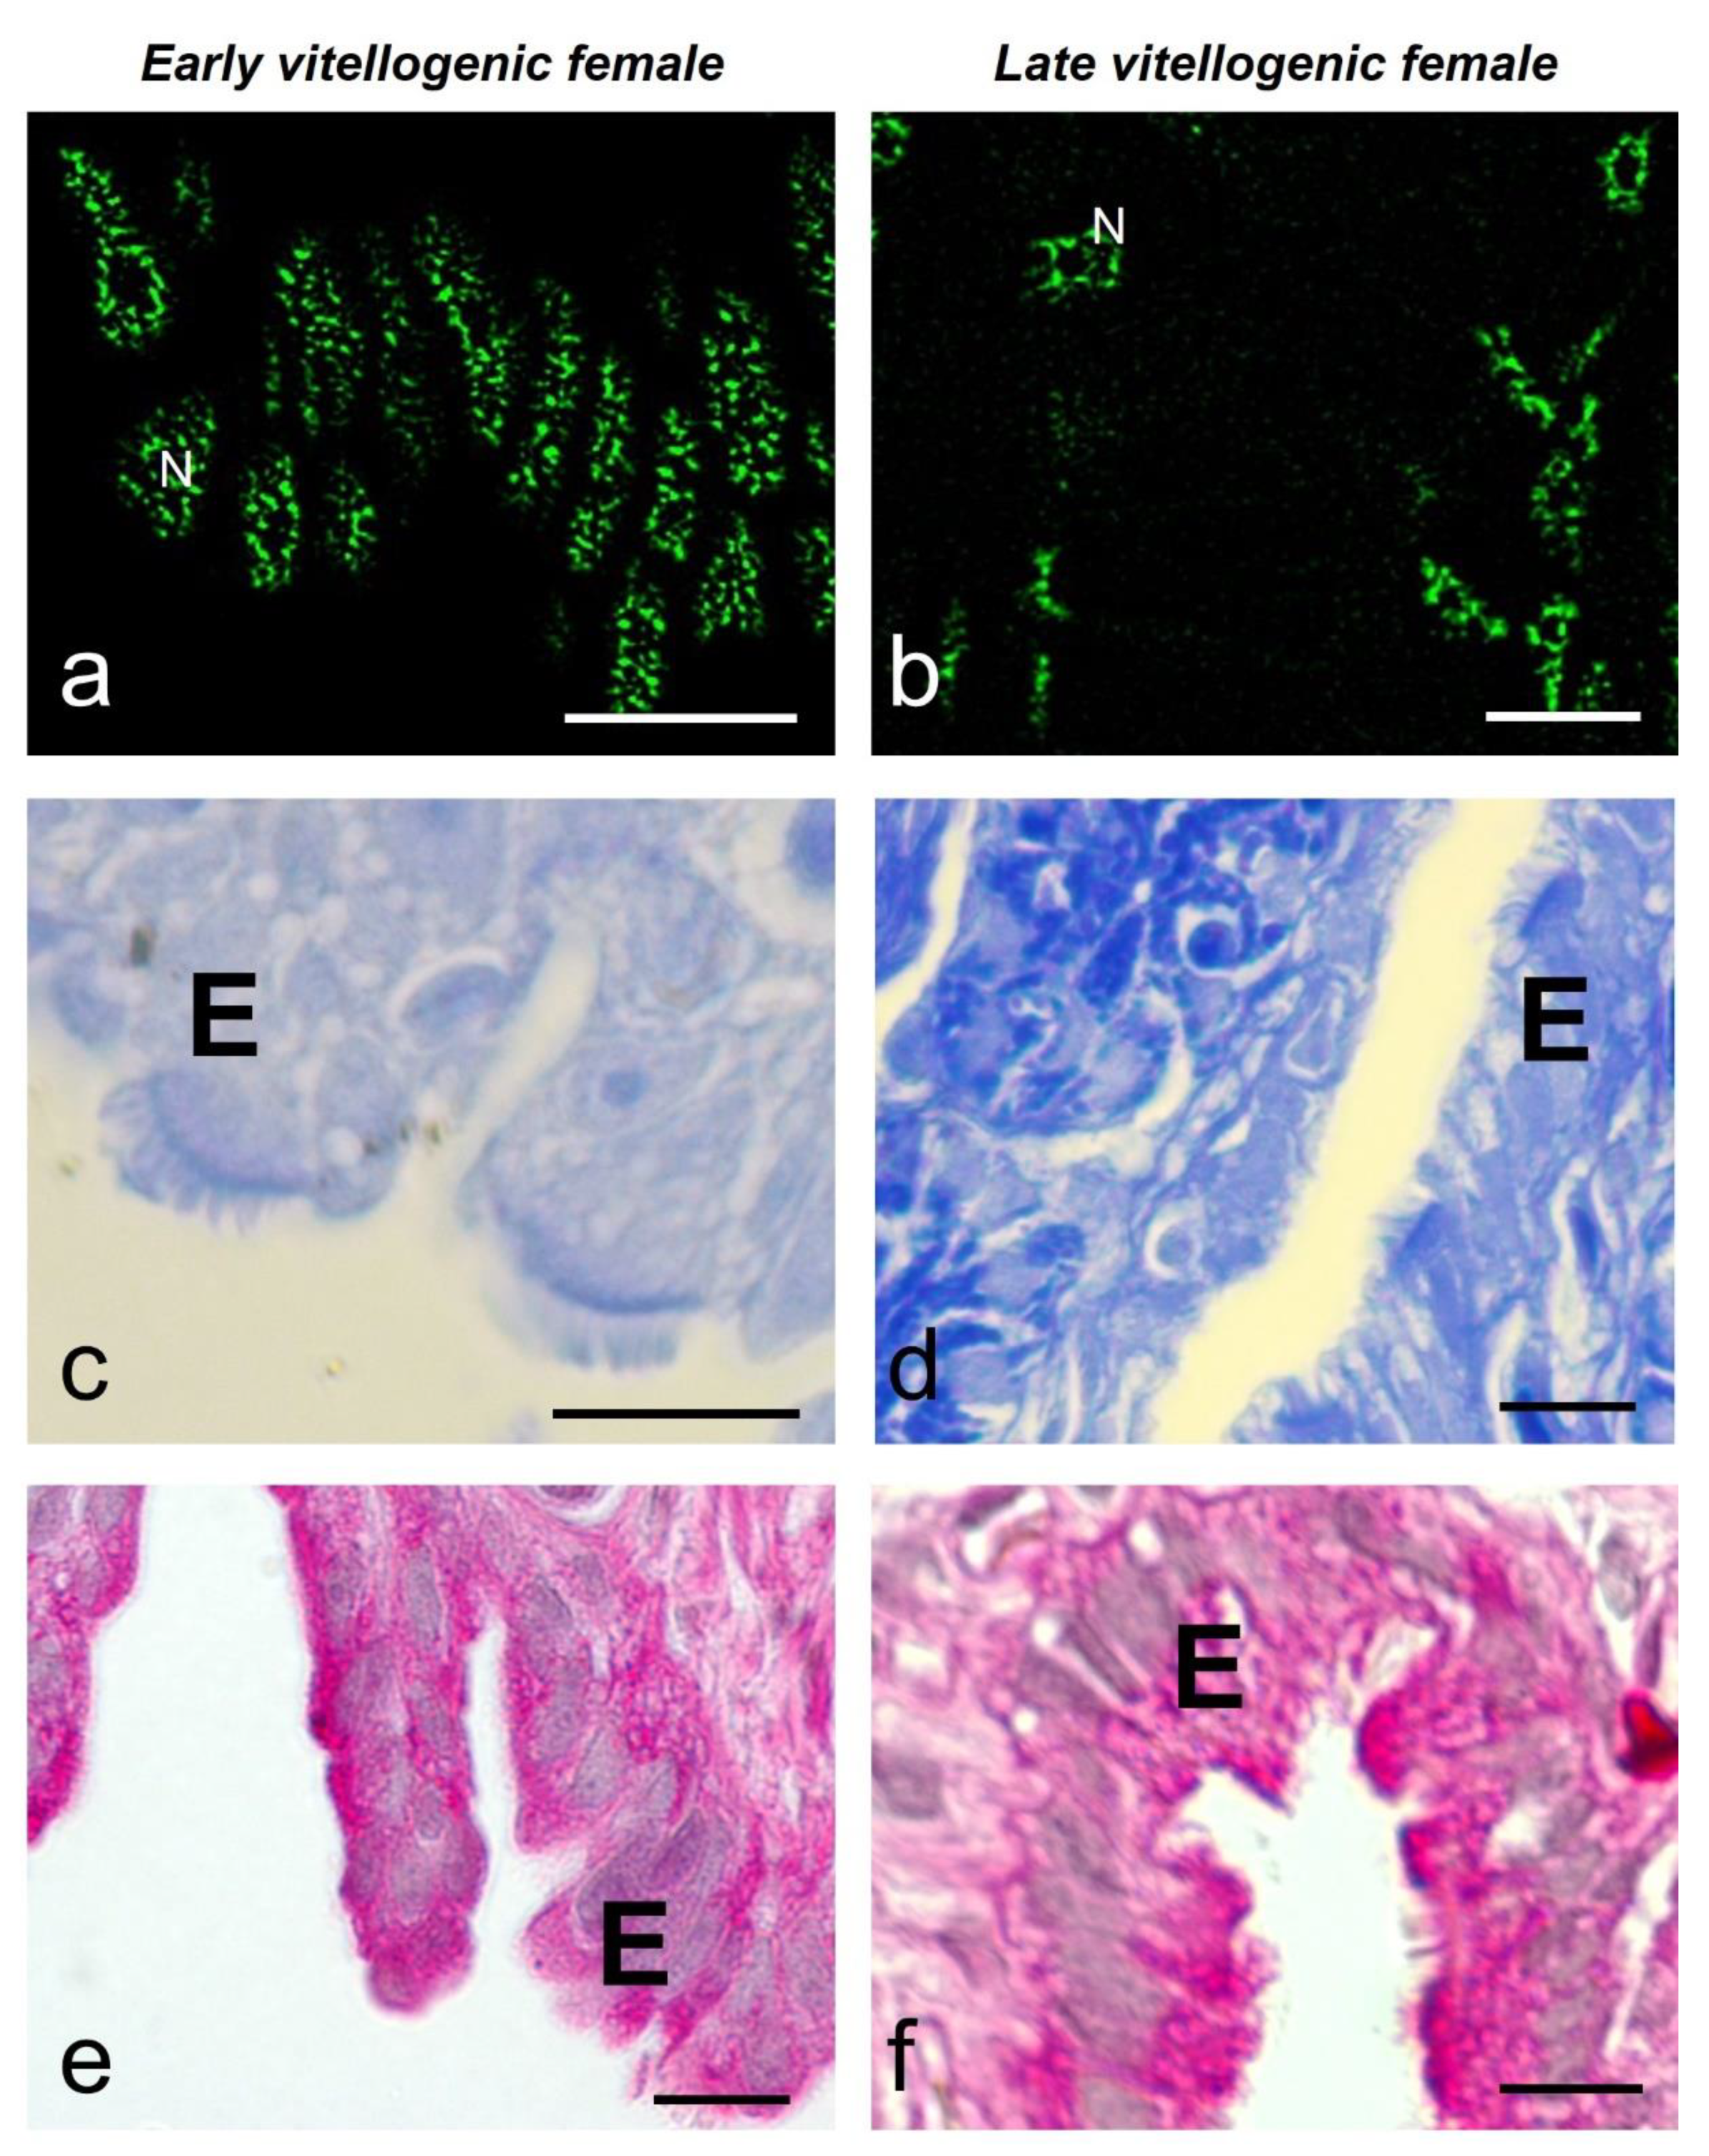
Figure 7.
MSSR images of splicing factor in hepatocytes in early (a) and late (b) vitellogenic stage of S. torquatus. PAS staining increases from early (c) to late (d) vitellogenic stage. Toluidine blue staining shows low and large amounts of droplets in the cytoplasm of the early and late vitellogenic respectively (c, d, insets, arrows). N, nucleus; bars: 10 μm, insets: 5 μm.
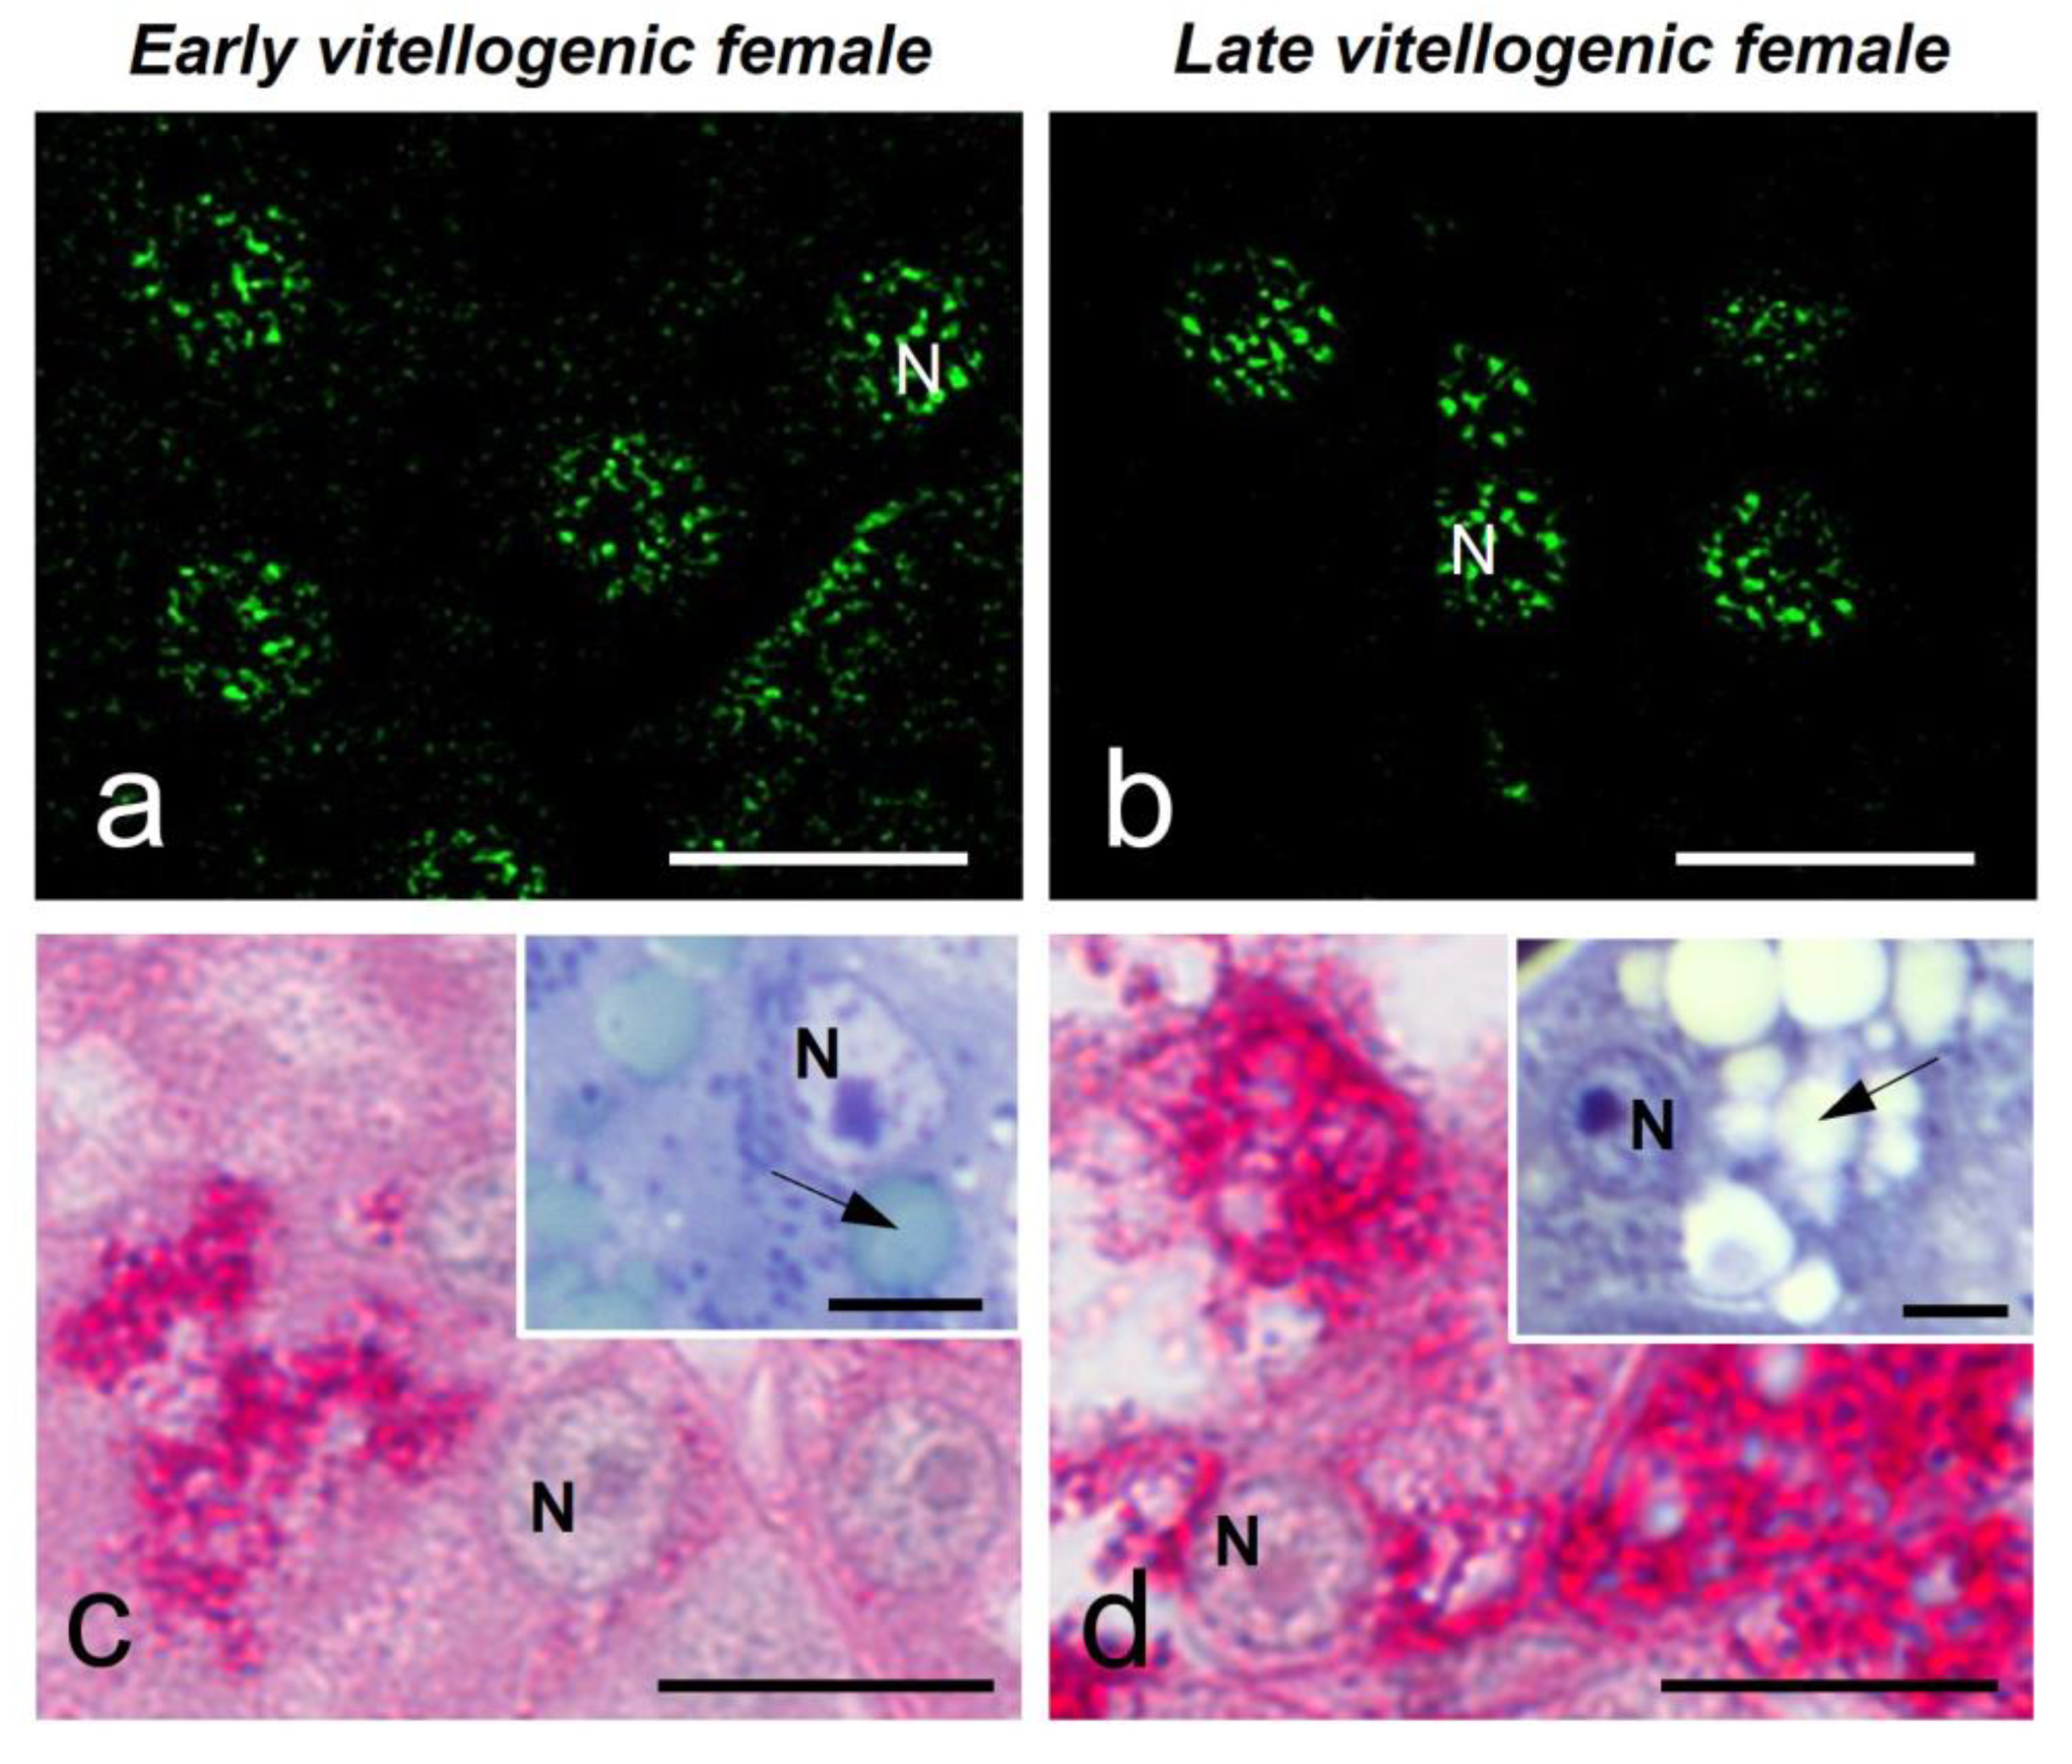

Table 1.
Number and size of the speckles in the hepatocytes of S. torquatus. Values are presented as Mean ± Standard Deviation.
Table 1.
Number and size of the speckles in the hepatocytes of S. torquatus. Values are presented as Mean ± Standard Deviation.
| Early vitellogenesis | Late vitellogenesis | |
|---|---|---|
| Number of speckles | 12.3 ± 3.9 | 10.4 ± 5.3 |
| Speckle size (µm2) | 0.24 ± 0.08 | 0.29 ± 0.18 |
Disclaimer/Publisher’s Note: The statements, opinions and data contained in all publications are solely those of the individual author(s) and contributor(s) and not of MDPI and/or the editor(s). MDPI and/or the editor(s) disclaim responsibility for any injury to people or property resulting from any ideas, methods, instructions or products referred to in the content. |
© 2024 by the authors. Licensee MDPI, Basel, Switzerland. This article is an open access article distributed under the terms and conditions of the Creative Commons Attribution (CC BY) license (http://creativecommons.org/licenses/by/4.0/).
Copyright: This open access article is published under a Creative Commons CC BY 4.0 license, which permit the free download, distribution, and reuse, provided that the author and preprint are cited in any reuse.


