
Submitted:
19 January 2024
Posted:
22 January 2024
You are already at the latest version
Abstract
The potentiality of cv. Malbec grape pomace (GP) as a functional ingredient in the formulation of bakery foods (muffins, biscuits and cereal bars) was studied. The effect of GP addition on the phenolic compounds (PCs) composition, nutritional and sensory properties were evaluated. The addition of GP increased the content of dietary fiber, proteins, ash, total phenolic content (TPC), antioxidant activity (AA), anthocyanins and non-anthocyanins PCs while decreasing the carbohydrates content. The main PCs given by the GP to supplemented foods were (-)-gallocatechin, quercetin-3-O-glucoside, rutin, caffeic acid, syringic acid and (+)-catechin. For anthocyanins, the acylated derivatives were more stable to heat treatment (baking) in food processing which was evidenced by a higher proportion of these PCs compounds when compared to the same derivatives quantified in GP. In general, when the TPC or individual concentrations of PCs were analyzed in a nutritional or functional context, one portion of the supplemented foods showed levels high enough to satisfy the recommended dose per day of these bioactive compounds. Additionally, the foods were well received by consumers during the sensory evaluation and supplemented biscuits got the highest acceptability. This study demonstrated that GP could be a viable functional ingredient in bakery foods to give nutritionally enhanced properties like TPC, PCs, AA and dietary fiber in consumer’s diets.
Keywords:
anthocyanins
; phenolic compounds
; wine industry by-products
; bakery functional foods
; antioxidant dietary fiber
1. Introduction
The wine industry annually generates large amounts of solid wastes with high seasonal disposal dependence [1]. According to previous reports, the winemaking step is one of the most relevant in terms of by-products generation and also from the point of view of its potential economic importance. In this step, grape pomace (GP) is the most abundant by-product that accounts on average 30 % of the processed grapes before winemaking. Traditional exploitation of this material was mainly based on the extraction of ethanol, tartaric acid and seeds oil, but these basic applications still retain in GP some under-exploited components. In this sense, the better use of other constituents of this by-product for novel products has been explored by performing different technological applications [2].
GP is a rich source of bioactive constituents, including PCs, proteins, lipids, soluble and insoluble fiber and minerals. Therefore, new possibilities for a potential second life by its sustainable reuse have emerged. Bioactives components of GP have been evaluated focusing on their composition and biological properties [3]. Furthermore, PCs and their association with antioxidant and antimicrobial activity as well as their interaction with other food ingredients, such as the functional fiber and grape seed fatty acids, have been reported [4]. Likewise, some previous research from our group studied the composition of Malbec GP, where high concentrations of PCs, dietary fiber and antioxidant activities have been found, and later associated with health benefits in animal experimental models [5,6]. Taking into account these previous reports related to the improvement of pathological situations, the food products containing GP or their derived bioactive constituents can be potentially considered as functional foods. Interest in by-products rich in PCs has been initially focused on the antioxidant activity (AA) resulting from their chemical structure with several hydroxyl groups [7]. Moreover, with 43-75% of content, dietary fiber is the most important constituent of GP, and has been associated with the reduction of risk of cardiovascular diseases, diabetes prevention, cancer protection, cholesterol levels decrease, constipation and obesity prevention [8,9]. The high fiber content of GP, consisting mainly of glycans, cellulose and pectins, emphasizes its nutritional value by providing a source of bioactive components in the formulation of functional foods [10,11]. Malbec GP has been reported to have a high fiber content (53%) and this composition was associated with lower blood pressure and triglyceride levels, summed to an improvement of insulin resistance of rats fed with GP [6]. GP dietary fiber is considered a matrix rich in PCs being a dietary supplement that combines on one hand the inherent benefits of dietary fiber, and on the other hand its richness in bound PCs or also defined as non-extractable polyphenols (NEPPs) with antioxidant and microbiota modulation properties [12]. The antioxidant effect of dietary fiber is based on PCs bound to polysaccharide complexes, which are released in the intestine and act as antioxidants or microflora modulators [13]. Thus, GP has potential as a raw material for the production of dietary fiber concentrates and the development of commercial fiber-rich products with added nutritional value through the content of PCs [14]. Other important components of GP include proteins, polysaccharides and oligosaccharides [15]. The protein content of GP can vary between 6% and 15%. The amino acids profile is comparable to that of cereals, with high levels of glutamic and aspartic acids, and low levels of tryptophan and sulfur-containing amino acids [16]. In terms of mineral content, it is variable and the most abundant are potassium tartrates, with contents ranging from 4 to 14% of dry matter [17]. The main fatty acids are linoleic (C18:2), oleic (C18:1) and palmitic (C16:0) acids with a content of around 70, 15 and 7 %, respectively [15]. While the ß-sitosterol represents the main sterol in the seed oil and α-tocopherol was reported as the main tocopherol [18].
Previous studies have evaluated the addition of GP and grape peels from different white and red varieties in different baked goods including bread, cookies, muffins, brownies and cakes [19,20,21,22,23,24,25]. Some of these studies evaluated the effects of the GP addition on the nutritional, sensory and chemical composition of finished products, highlighting the potential of GP as a way to incorporate bioactive components like PCs and fiber.
In this context, the aim of the present study was to investigate the effect of the addition of dried cv. Malbec GP in the formulation of muffins, cereal bars and biscuits to improve their nutritional and functional properties. The nutritional and antioxidant potential (PCs composition and AAs) were evaluated to understand the potentiality of GP as a sustainable source of active dietary fiber and bioactive phytochemicals supplementation. Additionally, a sensory analysis of control and fortified foods was performed to estimate the acceptability of the products by consumers.
2. Results and discussion
2.1. TPC and AA
TPC and AA provide valuable information on the relative composition of the samples and their potential as functional foods. Table 1 summarizes the results obtained for the determination of these parameters. The data obtained showed an increase in TPC in foods supplemented with GP compared to the control, and it was proportional to the different percentages of GP incorporation in each food. The greatest difference between the witnessed food and that elaborated with GP was observed for muffins, which increased the TPC more than 8 times. Then, the biscuits and cereal bars showed an increase in TPC of 6 and 3 times, respectively.
The results for TPC are in agreement with those reported by Mildner-Szkudlarz et al. [26]. These authors carried out a study on cookies by adding white GP. These authors observed that by adding 10% of GP to the final product, 2.11 mg GAE g-1 DW were obtained compared to the product without GP (0.85 mg GAE g-1). With the addition of 20%, they obtained 3.34 mg GAE g-1; and with 30%, 4.45 mg GAE g-1, representing an increase of 148%, 293% and 424%, respectively. Hayta et al. [22] prepared bread with up to 10% GP powder and obtained 0.89 compared to 0.35 mg GAE g-1 DW in the control (2.5-fold increase). Sporing et al. [19] added 15% Merlot and Zelen GP, obtaining 5.92 and 3.65 mg GAE g-1 DW, respectively, compared to less than 0.69 in the control bread. An increase from 0.19 in the control to 0.54 mg GAE g-1 DW in cakes with 10% GP was reported by Nakov et al. [23]. Walker et al. [25] reported that the highest TPC for bread and muffins were obtained in the 15% Pinot Noir GP fortified samples, with values (expressed as mg GAE per serving) of 22 and 512%, respectively. The control brownies had highest TPC values than the fortified samples, probably due to the high content of chocolate. If we compare the previous studies with the results obtained in this work, it can be observed that the TPC values are higher than those described previously. A possible explanation could be related to the higher content of PCs in the Malbec GP (information presented in the next section).
The above-mentioned increases were associated with the AA results. Among the studied foods, the highest increase in AA was observed in muffins (6 times), followed by biscuits (4 times) and cereal bars (3 times) for the same added proportion of GP (Table 2). Our results agree with those reported by Mildner-Szkudlarz et al. [26] in a similar kind of foods. These authors obtained 3.39 μmol TE g-1 DW in biscuits with 10% addition of GP, while with 20% addition they obtained 5.12 μmol TE g-1 DW and with 30% 7.55 μmol TE g-1 DW. Likewise, in biscuits without addition of GP they found 1.27 μmol TE g-1 DW, thus the increases were 3, 4 and 6 times compared to the control, respectively.
2.2. Characterisation of PCs composition
2.2.1. Anthocyanins
The quantification results for the identified anthocyanins in the GP supplemented foods are presented in Table 3. The non-supplemented foods did not report the presence of any of the studied anthocyanin derivatives. A total of 10 glycosylated and acylated (acetyl and p-coumaroyl derivatives) anthocyanins were quantified in fortified samples. Malvidin 3-O-p-coumaroylglucoside was the predominant compound (68, 65, and 72 % for muffins, cereal bars and biscuits, respectively), mostly followed by malvidin 3-O-glucoside in all the supplemented foods. This behavior was different to that observed in GP extracts of Malbec, where the malvidin 3-O-glucoside was the most abundant compound [5]. The potential explanation is the highest stability to higher temperatures of acylated anthocyanin derivatives compared to non-acylated forms [27]. This indicates that the coumaryl-derived compounds have prevailed after the heat treatment (baking) in food processing, while the non-acylated glycosides were more unstable. This result is also highlighted when the proportion of total acylated derivatives in foods compared to GP was calculated. In the GP supplemented foods the acylated anthocyanins content represented the 76, 73 and 82% for muffins, cereal bars and biscuits compared to the 40 % of these derivatives quantified in the same GP by Antoniolli et al. [5].
On the other hand, previous data suggested that the bioavailability of anthocyanins depends on the glycosidic substituent and, therefore, non-acylated anthocyanins are absorbed more efficiently than acylated ones [28]. In terms of anthocyanins distribution and changes presented and discussed in the present work, there are no previous publications studying in a detailed way the individual anthocyanins distribution in bakery foods supplemented with GP. Some of the previous publications supplementing GP on baked goods determined the total anthocyanin content [20,23], but the profiling and quantification of individual compounds is important to understand the changes in the profiles. This information would be useful to know the remaining concentration of potential bioavailable compounds. In this sense, more studies evaluating the bioaccessibility and bioavailability of the remaining compounds after GP supplemented food elaboration should be performed to understand the potential health beneficial effects of GP addition.
Regarding the importance of anthocyanins as functional compounds, they have recognized AA. In fact, the European Food Safety Authority (EFSA) has made recommendations for the consumers to obtain the expected health benefits of anthocyanins, suggesting a consumption of at least 20 to 40 mg per day [29]. For the supplemented foods under study, a muffins portion (55 g - as defined in the Code of Federal Regulations, 2022) [30] equates to 48.29 mg of anthocyanins per serving, a cereal bar (40 g) equates to 46.6 mg per serving and a biscuit (55 g) equates to 30.16 mg per serving. This indicates that by consuming a portion of cupcake, or a cereal bar or two of the biscuits under study, the recommended daily dose for anthocyanins to exert a beneficial effect on health will be covered. Despite the aforementioned, EFSA also mentions that the anthocyanins consumption should not exceed the acceptable daily intake of 150 mg per day [29].
2.2.2. Non-anthocyanins
Table 4 presents the data of non-anthocyanins PCs quantified in the control and GP supplemented foods. A total of 14 non-anthocyanin PCs from different chemical families, including non-flavonoids (hydroxybenzoic and hydroxycinnamic acids and stilbenes), flavonoids (flavanols and flavonols) and other compounds were identified and quantified in the extracts of GP supplemented foods. While, a smaller number and concentrations of these compounds were found in control samples. The quantified PCs included OH-tyrosol, (+)-catechin, (-)-gallocatechin, caffeic acid, syringic acid, p-coumaric acid, ferulic acid, chlorogenic acid, trans-resveratrol, quercetin-3-O-glucoside, rutin, myricetin and quercetin.
By individually analyzing the GP supplemented foods, muffins showed quantifiable levels of 13 non-anthocyanin PCs, being (-)-gallocatechin and quercetin-3-O-glucoside the most abundant PCs, with concentrations between 132.1 and 322.8 μg g-1 (DW), followed by rutin, caffeic acid, syringic acid and (+)-catechin. In control muffins, only 4 PCs were found, being absent in this sample syringic, caffeic and chlorogenic acids, trans-resveratrol, (+)-catechin, myricetin and OH-tyrosol. In the case of supplemented cereal bars, chlorogenic acid was the major compound, followed by (+)-catechin, (-)-gallocatechin and rutin in decreasing concentrations. In the case of supplemented biscuits, higher concentrations for quercetin-3-O-glucoside, (-)-gallocatechin and caffeic acid were observed.
In general, in non-supplemented foods, OH-tyrosol, (+)-catechin, trans-resveratrol, p-coumaric, ferulic and chlorogenic acids were not found. In the study carried out by Antoniolli et al. [5] it was observed in Malbec GP that the flavan-3-ols were the most abundant compounds, with (+)-catechin, (-)-epicatechin gallate and (-)-epicatechin as the most abundant compounds. In the supplemented foods analyzed here, these compounds varied from one matrix to other, even some of those found in Malbec GP, were not found in the food, as is the case of (-)-epicatechin gallate and (-)-epicatechin. The diminution or loss of flavanols like (+)-catechin and (-)-epicatechin could be related to their low stability under high temperatures like those of baking during food preparation. The loss of these compounds under high temperature treatments was previously reported [31]. For stilbene-type compounds, trans-resveratrol was found in GP with a concentration of 2 μg g-1. This level agrees with those found in GP supplemented foods, being even found in a higher proportion in biscuits, and not detected in non-supplemented foods. By comparing the results obtained by Antoniolli et al. [5] and those of the present work, indicated that both, qualitative and quantitative content of the individual PCs can vary when GP is added to processed foods. Since it comes as an ingredient in supplemented foods, variables associated with the different accompanying matrices and processing technologies (baking temperature, cooking time and interaction with food components) could affect the presence of PCs in the final products. Another novel result found in this work is related to the content of trans-resveratrol in GP supplemented foods.
According to EFSA, an amount between 1 to 10 mg per day of trans-resveratrol should be consumed to produce a beneficial effect on health [29]. For the foods under study, the trans-resveratrol content in GP supplemented samples was: 0.15 mg per portion (55 g) of muffins, 0.08 mg per portion (40 g) of cereal bars and 0.25 mg per portion (55 g) of biscuits. In this way, a portion of each of these foods, to a greater extent biscuits, would contribute to reaching the recommended daily dose for this compound. In the same vein, EFSA also establishes the recommended consumption of PCs from extracts (it does not establish criteria in specific foods), suggesting a minimum daily consumption of 300 mg of PCs [29]. In this study, the GP supplemented foods contained an average of 142, 199 and 282 mg of GAE per portion of fresh product, respectively. Thus, they are mostly able to satisfy the recommended levels.
2.3. Nutritional properties
The results of the chemical composition shown in Table 5 indicated that the most significant contribution (from a nutritional point of view) of the supplementation of foods with GP was the fiber content. In this respect, the biscuit product stands out with an increase of slightly more than 6 times compared to the control (from 0.9 g to 5.83 g/100 g FW), while cereal bars and muffins increased by 7 and 6 times, respectively.
Troilo et al. [32] added 15% GP powder with different particle sizes to muffins. They obtained between 3 and 3.9 g of total dietary fiber per 100 g of product. Nakov et al. [23], found that the addition of increasing amounts of GP powder (4 to 10%) in cakes, gradually increased fiber content and other parameters, with total fiber increasing from 6.7 g (control) to 12.5 g of total fiber per 100 g DW (10% addition). In view of the observed results, seem to be the best option to incorporate GP and add higher content of fiber.
According to FAO/WHO and Food and Drugs Administration [33,34] guidelines, the recommended daily intake of fiber is between 25 and 28 g/2000 kcal per day. The data presented here showed that the consumption of these foods supplemented with Malbec GP would increase the daily intake of fiber, helping to achieve the recommended daily dose and also improving the nutritional quality of baked goods. Furthermore, according to the EC Regulation 1924/2006, in order to claim that a food is a “source of fiber”, the product must contain at least 3 g of fiber per 100 g of food [35]. Both, the GP fortified cereal bars and the GP fortified biscuits, with 3.31 and 5.83 g of fiber per 100 g FW respectively, satisfy this requirement. The interest in including fiber in the diet, despite its indigestibility, is based on its beneficial effects on health. In this sense, it is important to provide it in an easy and practical way. Previous studies [36,37] have investigated the influence of fiber content on the glycemic index of foods showing lower values of this parameter for foods with higher fiber content. So, the presence of GP, which leads to an increase in fiber content, could contribute to a reduction in the glycemic index of foods, although specific studies should be carried out to verify its influence. In addition, the proposed baked foods are an easy way to increase the amount of fiber in modern diets.
No differences were found in the protein content of the different foods. Several studies have reported the protein content of GP. Paulos et al. [38] reported that white GP has a protein content of 10% (DW). Gazzola et al. [16] indicated that the protein content of GP can vary between 6% and 15% (DW) depending on the variety and growing conditions of vine plants. It should be noted that these values are similar to the protein content of the wheat flour used (10 to 12%), which could justify that the substitution of one ingredient for the other does not modify the final content of the fortified foods. Cereal bars were the only case where it was observed that the food with GP had a higher protein content. The reason could be that the GP was an additional ingredient in this food, making a proportional increase of protein due to the lower protein content of the other ingredients used in this food, such as corn and rice flakes.
Regarding the protein quality of GP, there are few reports on this subject. However, in a study reported by Prandi et al. [39] related to the amino acid profile of GP, leucine (5.62 mg g-1) and phenylalanine (4.09 mg g-1) were quantified. In fact, the incorporation of GP could be an interesting alternative to improve the protein quality of supplemented foods. On the other hand, Gazzola et al. [16] showed that the amino acid profile of GP was comparable to cereals, with high levels of glutamic acid and aspartic acid and low levels of tryptophan and sulfur-containing amino acids.
In terms of lipid content, there is an increased concentration in muffins and biscuits formulated with GP (14% and 23% of increase, respectively), while the control cereal bars have a higher lipid content than those formulated with GP (24%). Although a lipid profile was not performed in the present study, data previously reported by Paulós et al. [38] suggest that the addition of GP to food systems would improve their lipid profile. According to the aforementioned work, GP is rich in linoleic acid (C18:2), corresponding to 68.78% of the total fatty acids (FA), a higher value than sunflower, soybean or corn bagasse, which contain 65, 50% and 48% of the total FA, respectively. Oleic acid (C18:1) is the second acid with the highest concentration in GP (14% of the total AG). These two acids, linoleic and oleic, represent 83% of the total fatty acids in the whole GP and about 90% in the seeds. Similarly, Bordiga et al. [15] state that the seed oil is characterized by a high content of oleic and linoleic (unsaturated) acids. Furthermore, the lipid fraction is characterized by a fatty acid profile that shows a high amount of polyunsaturated/monounsaturated fatty acids and a low amount of saturated fatty acids. Linoleic (C18:2), oleic (C18:1) and palmitic (C16:0) acids are the main fatty acids in grapeseed oil, with percentages of approximately 70%, 15% and 7%, respectively [15]. The β-sitosterol represents the main sterol in the seed oil, the α-tocopherol the main tocopherol, reaching values of around 70% of tocopherols, corresponding to 3.8 mg/100 g of oil [18]. Taking into account, the incorporation of GP to the studied foods could be interesting from the nutritional point of view due to the incorporation of unsaturated fatty acids and tocopherols/tocotrienols which are important antioxidant lipid compounds and have been associated with health promoting effects [40].
In the three GP supplemented foods, a decrease of 76, 13 and 14 % of carbohydrate content was observed for muffins, cereal bars and biscuits, respectively. However, conventional and GP supplemented foods are an important source of carbohydrates. In case of a potential intention of reducing even more their content, larger amounts of other ingredients could be replaced by GP.
As far as the ash content is concerned, there was an increase in its values in the foods formulated with GP (95% in muffins, 130% in cereal bars and 72% in biscuits). This is in line with what was observed by Canett Romero et al. [41], who reported that the ash content in cookies supplemented with grape skins was higher due to the high mineral content of this by-product.
2.4. Sensory evaluation
For the new products an initial test of consumer’s acceptability of foods by a sensory analysis is necessary. As can be observed in Figure 1, the analysis showed that control foods had highest marks for all the sensory parameters, but, in general terms, GP supplemented foods presented elevated marks also (between 3.71 and to 4.42) being the GP supplemented biscuits those which got the highest evaluation marks for all the sensory parameters (except for the “texture”).
With respect to muffins, GP addition resulted in significant differences in all of the sensory attributes, except “taste” as compared to control. The highest difference was observed in the attribute “texture” (4.47 for control compared to 3.87 for supplemented muffins).
Focusing on cereal bars, it was observed that in attributes like “appearance”, “texture” and “color” there were not significant differences following Fisher’s LSD test, but for “general opinion” and “taste” parameters, differences were observed, with “taste” showing the greatest difference.
Considering the biscuits, the attribute “texture” was the only parameter without significant differences between control and GP supplemented food, being “general opinion” the attribute with more differences. To sum up, GP addition resulted in significant differences on most attributes for all tested foods, as compared to control. Although control foods had better marks compared to supplemented ones, the addition of GP powder to food products presented a notable acceptance by consumers, which is why they could be potential products to be used as a base in the preparation of functional foods with GP.
3. Materials and Methods
3.1. Chemicals
Hydrochloric acid, ethanol and Folin–Ciocalteu reagent were purchased from Merck (São Paulo, Brazil). Trolox reagent (6-hydroxy-2,5,7,8-tetramethylchroman-2-carboxylic acid), NaH2PO4 2H2O 2Na2HPO4 12H2O, fluorescein and 2,20-azobis-2-methylpropionamidine dihydrochloride (AAPH) were purchased from Sigma–Aldrich (Steinheim, Germany). Ultrapure water was obtained from a Milli-Q system (Millipore, Billerica, MA, USA). Standards of gallic acid (99%), 3-hydroxytyrosol (≥99.5%), (−)-gallocatechin gallate (≥99%), caftaric acid (≥97%), chlorogenic acid (≥95%), (+)-catechin (≥99%), caffeic acid (99%), syringic acid (≥95%), coumaric acid (99%), ferulic acid (≥99%), trans-resveratrol (≥99%), quercetin hydrate (95%), quercetin 3-β-D-glucoside (≥90%), myricetin (≥96%), rutin trihydrate (99%) and malvidin-3-O-glucoside chloride (⩾95%) were purchased from Sigma-Aldrich. Stock solutions of the above mentioned compounds were prepared in methanol at concentration levels of 1000 mg L-1. Calibration standards were dissolved in the initial mobile phase of each method (anthocyanins or non-anthocyanins, respectively). HPLC-grade Acetonitrile (MeCN) and formic acid (FA) were acquired from Mallinckrodt Baker (Inc. Phillipsburg, NJ, USA). Primary-secondary amine (PSA) and octadecylsilane (C18) were both obtained from Waters (Milford, MA, USA). Reagent grade NaCl, anhydrous Na2CO3, anhydrous MgSO4 and anhydrous CaCl2 were purchased from Sigma–Aldrich.
3.2. GP powder preparation
In this study, GP from red Vitis vinifera L. cv. Malbec was used. This was acquired from a local winery from several vineyards located in Gualtallary, Mendoza, Argentina. Fresh GP was collected immediately after pressing the grapes in the winery and placed in ice-cooled boxes during transportation to the laboratory, and then stored at -20 ºC until processing. The GP was dried at 60 ºC for 48 h, then it was ground using a food processor (kitchen blender) and sifted using a 1 mm mesh to obtain a fine powder and stored at -20 ºC until further use.
3.3. Foods preparation
3.3.1. Muffins
The formulation of the control muffin is listed in Table 1. A 5% of GP was used to replace a part of the wheat flour (w/w) to prepare the GP supplemented muffins.
The oven was conditioned with a pan of water and heated to 180 °C. All the dry ingredients were combined in a bowl. Afterwards, wet ingredients were also mixed. Then, both preparations were combined until the ingredients were completely integrated. The batter was portioned into 40 x 47 mm paper muffins liners and baked at 180 ºC for 20 min. The muffins were cooled for 60 min and stored at -20 ºC for further analysis.
3.3.2. Biscuits
The biscuit formulation is presented in Table 1. In this case, 10 % of GP instead of wheat flour (w/w) was used for GP supplemented biscuits.
The oven was preheated to 180 °C and conditioned with a pan of water. The liquid ingredients were combined in a separate bowl, added to the dry ingredients, and mixed. The batter was poured into a 30 cm x 10 cm rectangular baking pan and baked at 180 ºC for 30 min. The sponge cake obtained was cut into slices which were baked again at 200 ºC for 10 min for the roasting process. The biscuits were cooled in the pan for 60 min and stored at -20 ºC until further use.
3.3.3. Cereal bars
An amount of 10% GP (w/w) were added to the GP supplemented cereal bars formula (Table 1). To prepare the cereal bars, all ingredients were mixed and put into a rectangular pan with nonstick oven paper. The batter was baked at 160 ºC for 15 min in a preheated oven. Then the product obtained was cooled for 60 min and cut into 20 g bars (approximately 3 x 10 cm). Cereal bars were stored at -20 ºC for further analysis. It is convenient to mention that a portion of the prepared foods was kept at room temperature until the sensory analysis.
It should be noted that in GP supplemented muffins and biscuits there was a substitution of a part of the wheat flour (w/w) with GP, while in the case of GP supplemented cereal bars, GP powder was an extra ingredient. Common white wheat flour, sunflower oil, butter, eggs, vanilla, honey, oats, cornflakes, rice flakes, sugar and baking powder were purchased in local markets.
3.4. PCs extraction
Solid–liquid extraction was applied to recover the PCs from food samples. Briefly, dried samples were grinded in a laboratory mixer. Then, 5 mL of extraction solvent (ethanol:water in a 4:1 v/v ratio with 1% HCl ) were added to tubes containing 1.5 g of sample powder. The mixture was sonicated for 30 min at 25 ºC with manual shaking at 5 min intervals, and then centrifuged at (4000 rpm) for 30 min. The supernatant was removed to a clean tube. The pellet was subjected to a second extraction step. The supernatants were put together, dried and stored at -20 °C until analysis.
3.5. Total phenolic content (TPC)
The TPC was spectrophotometrically measured with an UV–vis spectrophotometer Cary-50 (Varian Inc., Mulgrave, Australia). TPC was determined by the Folin–Ciocalteu assay (FC) according to Antoniolli et al. [5]. The extracts reacted with the Folin-Ciocalteu reagent for 5 min, then were added 3.75 mL of 20% Na2CO3. The samples were incubated for 90 min in the dark at room temperature. The absorbance was measured at 750 nm using a Cary spectrophotometer Cary-50 (Varian Inc., Mulgrave, Australia). A gallic acid standard calibration curve was used to determine the TPC. Results were reported as milligrams of gallic acid equivalents (mg GAE g-1) and then referred based on dry matter.
3.6. Antioxidant activity (AA)
The ORAC was determined according to Antoniolli et al. [5]. Food extracts were diluted 1:750 v/v in 75 mmol L-1 potassium phosphate buffer (pH 7.0). Fifty microliters of diluted samples and trolox standards (0, 3.125, 6.25, 12.5, 25 and 50 µmol L-1) were added to a 96-well plate. Then 100 µL of fluorescein solution were added and the mixture was incubated at 37 ºC for 7 min before the addition of 50 µL of 140 mmol L-1 of the peroxyl radical generator AAPH. Fluorescence intensity was monitored by using 485 nm excitation and 538 nm emission at 1 min intervals for 90 min on a microplate fluorometer (Fluoroskan Ascent FL, Thermo Fisher Scientific Inc, Wilmington, DE). The area under the curve of the fluorescence decay during 90 min was calculated and the ORAC was expressed as µmol of Trolox equivalents per gram of food (µmol TE g-1 DW).
3.7. Non-anthocyanins PCs
The identification and quantification of PCs present in the food samples were carried out by high performance liquid chromatography coupled to diode array and fluorescence detectors (HPLC-DAD-FLD) using a Dionex Ultimate 3000 (Dionex Softron GmbH, Thermo Fisher Scientific Inc., Germering, Germany) equipped with a vacuum degasser unit, an autosampler, a quaternary pump, a chromatographic oven, a diode-array (Dionex DAD-3000 (RS)) and a dual-channel fluorescence detector (FLD-3400RS Dual-PMT) connected in series. The Chromeleon 7.1 software was used to control all the acquisition parameters of the LC-DAD-FLD system and to process the obtained data.
Separation and quantification were carried out on a reversed-phase Kinetex C18 column (3.0 mm × 100 mm, 2.6 μm; Phenomenex (Torrance, CA, USA). The chromatographic conditions were similar to those previously used in our previous work [42]. An aqueous solution of 0.1% FA (A) and MeCN (B) were used as mobile phases. Analytes were separated using the following gradient: 0-1.7 min, 5% B; 1.7-10 min, 30% B; 10-13.5 min, 95% B; 13.5-15 min, 95% B; 15-16 min, 5% B; 16-19, 5% B. The total flow rate was set at 0.8 mL min-1. The column temperature was 35 °C and the injection volume was 5 μL. The analytical flow cell for DAD was set to scan from 200 nm to 400 nm. Wavelengths of 254 nm, 280 nm, 320 nm and 370 nm were used depending on the targeted analytes for DAD, while an excitation wavelength (Ex) of 290 nm and a monitored emission (Em) responses of 315 nm, 360 and 400 nm were used depending on the analytes. The identification of PCs in samples were based on the comparison of the retention times (tR) in samples with those of authentic standards. Sample quantification was done by an external calibration with pure standards according to Ferreyra et al. [42]. Calibration plots for studied analytes showed linear ranges between 0.05 and 40 mg L-1 with coefficient of determination (r2) higher than 0.991.
Extracts of food samples were cleaned-up by QuEChERS (quick, easy, cheap, effective, rugged and safe) coupled with dispersive solid-phase extraction (d-SPE) clean-up according to a previous report with some modifications [43]. The analytes were extracted from an aliquot of food samples extracts of the food samples (previously acidified with 1% FA) using 2.5 mL MeCN. The rest of the protocol was as described by Fontana & Bottini [43]. An aliquot of the obtained cleaned extract was concentrated to dryness and taken up with the initial mobile phase previous to HPLC-DAD-FLD analysis.
3.8. Anthocyanins
The analysis of anthocyanins was performed with the same equipment and chromatographic column as for non-anthocyanins, following the method reported by Fontana et al. [44]. The mobile phase consisted of ultrapure water : FA : MeCN (87 : 10 : 3, v/v/v; A) and ultrapure water : FA : MeCN (40 : 10 : 50, v/v/v; eluent B) with the following gradient: 0 min, 10% B; 0-6 min, 25% B; 6-10 min, 31% B; 10-11 min, 40% B; 11-14 min, 50% B; 14-15 min, 100% B; 15-17 min, 10% B; 17-21 min, 10% B. The mobile phase flow was 0.8 mL min-1, column temperature was 35 °C, and the injection volume was 10 μL. Quantification was carried out by measuring the area at 520 nm, and the anthocyanin content was expressed as malvidin-3-glucoside, using an external standard calibration curve (1-250 μg mL-1, r2 = 0.9984). Previous to samples analysis, extracts of foods obtained as described in Section 2.7, were dried by means of speedvac concentrator and then resuspended in the initial mobile phase of the chromatographic method for anthocyanins.
3.9. Nutritional parameters
In order to define the nutritional contribution of the product, a proximal chemical analysis was carried out by evaluating moisture, proteins, carbohydrates, lipids, fiber and ashes using official methods.
Moisture content was determined using the AOAC official method 925.10 [45], by drying at 105 ºC until the resulting weight was constant. The ash value was determined by the destruction of the organic matter present in the sample by calcination and gravimetric determination of the residue using a muffle at 550 ºC until white ashes, according to AOAC official method 923.03 [45].
The Kjeldahl method was used to determine protein content with N x 6.25 (N=total nitrogen) according the AOAC (method 979.06) [45], while the lipid content was tested using the Soxhlet extraction method, as described in AOAC official method 920.39 [45].
The determination of total dietary fiber was carried out by the enzymatic-gravimetric procedure as described in the AOAC (method 985.29) [45]. Analyses were conducted in triplicate on each formulation. The carbohydrate content was determined as the difference subtracting the protein, ash, moisture and lipid contents from 100.
3.10. Sensory analysis
For the sensory evaluation, a test was carried out to obtain the degree of acceptance by potential consumers, using a hedonic scale of acceptance of the product. A total number of 45 untrained judges, habitual consumers, participated in the assays.
The evaluated samples were the GP supplemented food. Control samples without the addition of GP were also given to the judges. The sensory analysis was conducted using a scale ranging from 1 to 5 to evaluate various attributes, including “visual appearance”, “color”, “taste”, “texture”, and “general opinion”. A rating of 5 represented “like extremely”, while a rating of 1 indicated “dislike extremely” [23]. In addition, consumers answered whether or not they are regular consumers of these types of foods and whether or not they would buy the products and the reason for that potential purchase decision. The samples were served in plastic cups. Consumers were informed about the addition of GP to the food product. Sensory statistical analysis was performed by analysis of variance (ANOVA) using Infostat v 2022 program [46]. Variables were considered significant with p < 0.05 and differences were determined based on Fisher’s Least Significant Difference test (LSD).
4. Conclusions
The present study presented evidence of the potentiality of the fortification of different baked products with cv. Malbec GP to improve the antioxidant fiber and PCs content aimed to improve the foods functionality. The incorporation of GP increased the content of dietary fiber, proteins, ash, TPC, AA, anthocyanins and non-anthocyanins PCs. In terms of PCs incorporation of the foods supplemented with GP, one portion of the supplemented foods showed levels high enough to satisfy the recommended dose per day of these bioactive compounds. Also interesting was the high acceptability of the foods during the sensory evaluation, that need to be complemented with more in deep descriptors in the future. The detailed PCs profiling in these foods evidenced a group-specific anthocyanins instability, observing that the acylated derivatives were more stable to heat treatment (baking) in food processing compared to the non-acylated counterparts. Therefore, the direct utilization GP gives to these bakery foods nutritionally enhanced properties encouraging their use as sustainable sources of functional components for food industry in a growing context of circular economy.
Author Contributions
Conceptualization, A.A. and A.F.; methodology, A.A., L.B. and A.F.; validation, A.A. and A.F.; formal analysis, A.A. and A.F.; investigation, A.A., L.B. and A.F.; resources, P.P. and A.F.; data curation, A.A. and A.F.; writing—original draft preparation, A.A. and A.F.; writing—review and editing, A.A., L.B., A.F. and P.P.; visualization, A.A. and A.F.; supervision, A.A. and A.F.; project administration, A.A. and A.F.; funding acquisition, A.A., P.P. and A.F. All authors have read and agreed to the published version of the manuscript.
Funding
This research was funded by ANPCyT (Grant numbers: BID PICT 2017-2325 BID PICT 2020-1367) and SIIP-UNCuyo A016-T1 to A.F and SIIP-UNCuyo A047-T1 to A.A. P.P. and A.F. are fellows of CONICET.
Data Availability Statement
The data will be available by contacting the authors.
Conflicts of Interest
The authors declare no conflicts of interest.
References
- Bustamante, M.A.; Moral, R.; Paredes, C.; Pérez-Espinosa, A.; Moreno-Caselles, J.; Pérez-Murcia, M.D. Agrochemical Characterisation of the Solid By-Products and Residues from the Winery and Distillery Industry. Waste Management 2008, 28, 372–380. [Google Scholar] [CrossRef] [PubMed]
- Pasqualone, A.; Bianco, A.M.; Paradiso, V.M.; Summo, C.; Gambacorta, G.; Caponio, F. Physico-Chemical, Sensory and Volatile Profiles of Biscuits Enriched with Grape Marc Extract. Food Research International 2014, 65, 385–393. [Google Scholar] [CrossRef]
- Gómez-Brandón, M.; Lores, M.; Insam, H.; Domínguez, J. Strategies for Recycling and Valorization of Grape Marc. Crit Rev Biotechnol 2019, 39, 437–450. [Google Scholar] [CrossRef] [PubMed]
- Yu, J.; Ahmedna, M. Functional Components of Grape Pomace: Their Composition, Biological Properties and Potential Applications. Int J Food Sci Technol 2013, 48, 221–237. [Google Scholar] [CrossRef]
- Antoniolli, A.; Fontana, A.R.; Piccoli, P.; Bottini, R. Characterization of Polyphenols and Evaluation of Antioxidant Capacity in Grape Pomace of the Cv. Malbec. Food Chem 2015, 178, 172–178. [Google Scholar] [CrossRef] [PubMed]
- Rodriguez Lanzi, C.; Perdicaro, D.J.; Antoniolli, A.; Fontana, A.R.; Miatello, R.M.; Bottini, R.; Vazquez Prieto, M.A. Grape Pomace and Grape Pomace Extract Improve Insulin Signaling in High-Fat-Fructose Fed Rat-Induced Metabolic Syndrome. Food Funct 2016, 7, 1544–1553. [Google Scholar] [CrossRef] [PubMed]
- Padilla, F.C.; Rincón, A.M.; Bou-Rached, L. Contenido de Polifenoles y Actividad Antioxidante de Varias Semillas y Nueces. Arch Latinoam Nutr 2008, 58, 303–308. [Google Scholar] [PubMed]
- Deng, Q.; Penner, M.H.; Zhao, Y. Chemical Composition of Dietary Fiber and Polyphenols of Five Different Varieties of Wine Grape Pomace Skins. Food Research International 2011, 44, 2712–2720. [Google Scholar] [CrossRef]
- Gül, H.; Acun, S.; Şen, H.; Nayir, N.; Türk, S. Antioxidant Activity, Total Phenolics and Some Chemical Properties of Öküzgözü and Narince Grape Pomace and Grape Seed Flour. J Food Agric Environ 2013, 11, 28–34. [Google Scholar]
- Llobera, A.; Cañellas, J. Dietary Fibre Content and Antioxidant Activity of Manto Negro Red Grape (Vitis Vinifera): Pomace and Stem. Food Chem 2007, 101, 659–666. [Google Scholar] [CrossRef]
- O’Connell, J.E.; Fox, P.F. Significance and Applications of Phenolic Compounds in the Production and Quality of Milk and Dairy Products: A Review. Int Dairy J 2001, 11, 103–120. [Google Scholar] [CrossRef]
- Rajha, H.N.; Paule, A.; Aragonès, G.; Barbosa, M.; Caddeo, C.; Debs, E.; Dinkova, R.; Eckert, G.P.; Fontana, A.; Gebrayel, P.; et al. Recent Advances in Research on Polyphenols: Effects on Microbiota, Metabolism, and Health. Mol Nutr Food Res 2022, 66. [Google Scholar] [CrossRef] [PubMed]
- Mézes, M.; Erdélyi, M. Antioxidant Effect of the Fibre Content of Foods | Az Élelmiszerek Rosttartalmának Antioxidáns Hatása. Orv Hetil 2018, 159, 709–712. [Google Scholar] [CrossRef] [PubMed]
- González-Centeno, M.R.; Rosselló, C.; Simal, S.; Garau, M.C.; López, F.; Femenia, A. Physico-Chemical Properties of Cell Wall Materials Obtained from Ten Grape Varieties and Their Byproducts: Grape Pomaces and Stems. LWT - Food Science and Technology 2010, 43, 1580–1586. [Google Scholar] [CrossRef]
- Bordiga, M.; Travaglia, F.; Locatelli, M. Valorisation of Grape Pomace: An Approach That Is Increasingly Reaching Its Maturity – a Review. Int J Food Sci Technol 2019, 54, 933–942. [Google Scholar] [CrossRef]
- Gazzola, D.; Vincenzi, S.; Gastaldon, L.; Tolin, S.; Pasini, G.; Curioni, A. The Proteins of the Grape (Vitis Vinifera L.) Seed Endosperm: Fractionation and Identification of the Major Components. Food Chem 2014, 155, 132–139. [Google Scholar] [CrossRef]
- Lachman, J.; Hejtmánková, A.; Hejtmánková, K.; Horníčková, T.; Pivec, V.; Skala, O.; Dědina, M.; Přibyl, J. Towards Complex Utilisation of Winemaking Residues: Characterisation of Grape Seeds by Total Phenols, Tocols and Essential Elements Content as a by-Product of Winemaking. Ind Crops Prod 2013, 49, 445–453. [Google Scholar] [CrossRef]
- Fiori, L.; Lavelli, V.; Duba, K.S.; Sri Harsha, P.S.C.; Mohamed, H.B.; Guella, G. Supercritical CO2 Extraction of Oil from Seeds of Six Grape Cultivars: Modeling of Mass Transfer Kinetics and Evaluation of Lipid Profiles and Tocol Contents. Journal of Supercritical Fluids 2014, 94, 71–80. [Google Scholar] [CrossRef]
- Šporin, M.; Avbelj, M.; Kovač, B.; Možina, S.S. Quality Characteristics of Wheat Flour Dough and Bread Containing Grape Pomace Flour. Food Science and Technology International 2018, 24, 251–263. [Google Scholar] [CrossRef] [PubMed]
- Bianchi, F.; Cervini, M.; Giuberti, G.; Rocchetti, G.; Lucini, L.; Simonato, B. Distilled Grape Pomace as a Functional Ingredient in Vegan Muffins: Effect on Physicochemical, Nutritional, Rheological and Sensory Aspects. Int J Food Sci Technol 2022, 57, 4847–4858. [Google Scholar] [CrossRef]
- Fernández-Fernández, A.M.; Dellacassa, E.; Nardin, T.; Larcher, R.; Ibañez, C.; Terán, D.; Gámbaro, A.; Medrano-Fernandez, A.; Del Castillo, M.D. Tannat Grape Skin: A Feasible Ingredient for the Formulation of Snacks with Potential for Reducing the Risk of Diabetes. Nutrients 2022, 14. [Google Scholar] [CrossRef]
- Hayta, M.; Özuǧur, G.; Etgü, H.; Şeker, I.T. Effect of Grape (Vitis Vinifera L.) Pomace on the Quality, Total Phenolic Content and Anti-Radical Activity of Bread. J Food Process Preserv 2014, 38, 980–986. [Google Scholar] [CrossRef]
- Nakov, G.; Brandolini, A.; Hidalgo, A.; Ivanova, N.; Stamatovska, V.; Dimov, I. Effect of Grape Pomace Powder Addition on Chemical, Nutritional and Technological Properties of Cakes. LWT 2020, 134. [Google Scholar] [CrossRef]
- Rainero, G.; Bianchi, F.; Rizzi, C.; Cervini, M.; Giuberti, G.; Simonato, B. Breadstick Fortification with Red Grape Pomace: Effect on Nutritional, Technological and Sensory Properties. J Sci Food Agric 2022, 102, 2545–2552. [Google Scholar] [CrossRef] [PubMed]
- Walker, R.; Tseng, A.; Cavender, G.; Ross, A.; Zhao, Y. Physicochemical, Nutritional, and Sensory Qualities of Wine Grape Pomace Fortified Baked Goods. J Food Sci 2014, 79, S1811–S1822. [Google Scholar] [CrossRef] [PubMed]
- Mildner-Szkudlarz, S.; Bajerska, J.; Zawirska-Wojtasiak, R.; Górecka, D. White Grape Pomace as a Source of Dietary Fibre and Polyphenols and Its Effect on Physical and Nutraceutical Characteristics of Wheat Biscuits. J Sci Food Agric 2013, 93, 389–395. [Google Scholar] [CrossRef] [PubMed]
- Enaru, B.; Drețcanu, G.; Pop, T.D.; Stǎnilǎ, A.; Diaconeasa, Z. Anthocyanins: Factors Affecting Their Stability and Degradation. Antioxidants 2021, 10. [Google Scholar] [CrossRef] [PubMed]
- Yousuf, B.; Gul, K.; Wani, A.A.; Singh, P. Health Benefits of Anthocyanins and Their Encapsulation for Potential Use in Food Systems: A Review. Crit Rev Food Sci Nutr 2016, 56, 2223–2230. [Google Scholar] [CrossRef] [PubMed]
- EFSA Panel on Dietetic Products, N. and A. (NDA) Scientific Opinion on the Substantiation of Health Claims Related to Various Food (s)/Food Constituent (s) and Protection of Cells from Premature Aging, Antioxidant Activity, Antioxidant Content and Antioxidant Properties, and Protection of DNA, Proteins and Lipids from Oxidative Damage Pursuant to Article 13 (1) of Regulation (EC) No 1924/2006. EFSA Journal 2010, 8, 1489. [Google Scholar]
- Administration, U.S.F. and D. Code of Federal Regulations (Annual Edition) 2022.
- Ferreyra, S.; Bottini, R.; Fontana, A. Temperature and Light Conditions Affect Stability of Phenolic Compounds of Stored Grape Cane Extracts. Food Chem 2023, 405, 134718. [Google Scholar] [CrossRef] [PubMed]
- Troilo, M.; Difonzo, G.; Paradiso, V.M.; Pasqualone, A.; Caponio, F. Grape Pomace as Innovative Flour for the Formulation of Functional Muffins: How Particle Size Affects the Nutritional, Textural and Sensory Properties. Foods 2022, 11. [Google Scholar] [CrossRef] [PubMed]
- FAO Diet, Nutrition and the Prevention of Chronic Diseases: Report of a Joint WHO/FAO Expert Consultation; Geneva, 2019.
- FDA Daily Value on the New Nutrition and Supplement Facts Labels.
- European Parliament and Council Regulation (EC) No 1924/2006 of the European Parliament and of the Council of 20 December on Nutrition and Health Claims Made on Foods. Official Journal of the European Union 2006.
- Dávila, L.A.; Escobar, M.C.; Garrido, M.; Carrasco, P.; López-Miranda, J.; Aparicio, D.; Céspedes, V.; González, R.; Chaparro, R.; Angarita, M.; et al. Comparison of Fiber Effect on Glycemic Index and Glycemic Load in Differents Types of Bread | Comparación Del Efecto de La Fibra: Sobre El Índice Glicémico y Carga Glicémica En Distintos Tipos de Pan. Archivos Venezolanos de Farmacologia y Terapeutica 2016, 35, 100–106. [Google Scholar]
- Granito, M.; Pérez, S.; Valero, Y. Quality of Cooking, Acceptability and Glycemic Index of Enriched Pasta with Legumes | Calidad de Cocción, Aceptabilidad e Índice Glicémico de Pasta Larga Enriquecida Con Leguminosas. Revista Chilena de Nutricion 2014, 41, 425–432. [Google Scholar] [CrossRef]
- Paulos, K.; Costa, J.M.S.; Portugal, P. V; Spranger, M.I.; Sun, B.S.; Moreira, O.C.; DENTINHO, M.T.P. Caracterización Química y Nutricional de Los Subproductos de La Vinificación Para Aplicacion En La Alimentación de Rumiantes. Soc ESPAÑOLA OVINOTECNIA Y CAPRINOTECNIA 2005, 48, 223–237. [Google Scholar]
- Prandi, B.; Faccini, A.; Lambertini, F.; Bencivenni, M.; Jorba, M.; Van Droogenbroek, B.; Bruggeman, G.; Schöber, J.; Petrusan, J.; Elst, K.; et al. Food Wastes from Agrifood Industry as Possible Sources of Proteins: A Detailed Molecular View on the Composition of the Nitrogen Fraction, Amino Acid Profile and Racemisation Degree of 39 Food Waste Streams. Food Chem 2019, 286, 567–575. [Google Scholar] [CrossRef] [PubMed]
- Harbeoui, H.; Dakhlaoui, S.; Wannes, W.A.; Bourgou, S.; Hammami, M.; Akhtar Khan, N.; Saidani Tounsi, M. Does Unsaponifiable Fraction of Grape Seed Oil Attenuate Nitric Oxide Production, Oxidant and Cytotoxicity Activities. J Food Biochem 2019, 43. [Google Scholar] [CrossRef] [PubMed]
- Canett Romero, R.; Ledesma Osuna, A.I.; Robles Sánchez, R.M.; Morales Castro, R.; León-Martínez, L.; León-Gálvez, R. Characterization of Cookies Made with Deseeded Grape Pomace | Caracterización de Galletas Elaboradas Con Cascarilla de Orujo de Uva. Arch Latinoam Nutr 2004, 54, 93–99. [Google Scholar] [PubMed]
- Ferreyra, S.; Bottini, R.; Fontana, A. Tandem Absorbance and Fluorescence Detection Following Liquid Chromatography for the Profiling of Multiclass Phenolic Compounds in Different Winemaking Products. Food Chem 2021, 338, 128030. [Google Scholar] [CrossRef] [PubMed]
- Fontana, A.R.; Bottini, R. High-Throughput Method Based on Quick, Easy, Cheap, Effective, Rugged and Safe Followed by Liquid Chromatography-Multi-Wavelength Detection for the Quantification of Multiclass Polyphenols in Wines. J Chromatogr A 2014, 1342, 44–53. [Google Scholar] [CrossRef]
- Fontana, A.; Antoniolli, A.; D’Amario Fernández, M.A.; Bottini, R. Phenolics Profiling of Pomace Extracts from Different Grape Varieties Cultivated in Argentina. RSC Adv 2017, 7, 29446–29457. [Google Scholar] [CrossRef]
- AOAC Official Methods of Analysis of the Association of Analytical Chemists International. Official Methods: Gaithersburg, MD, USA 2000.
- Di Rienzo, J.A.; Casanoves, F.; Balzarini, M.G.; Gonzalez, L.; Tablada, M.; Robledo, C.W. InfoStat Versión 2018. Centro de Transferencia InfoStat, FCA, Universidad Nacional de Córdoba, Argentina. 2020. Available online: http://www.infostat. com.ar.
Figure 1.
(A) Sensory characteristics and (B) overall sensory quality of control (designed as C) and GP supplemented foods. Scale from 1 (extreme dislike) to 5 (extreme like). For each attribute and type of food, columns with different letters are significantly different (p < 0.05) following Fisher’s LSD test.
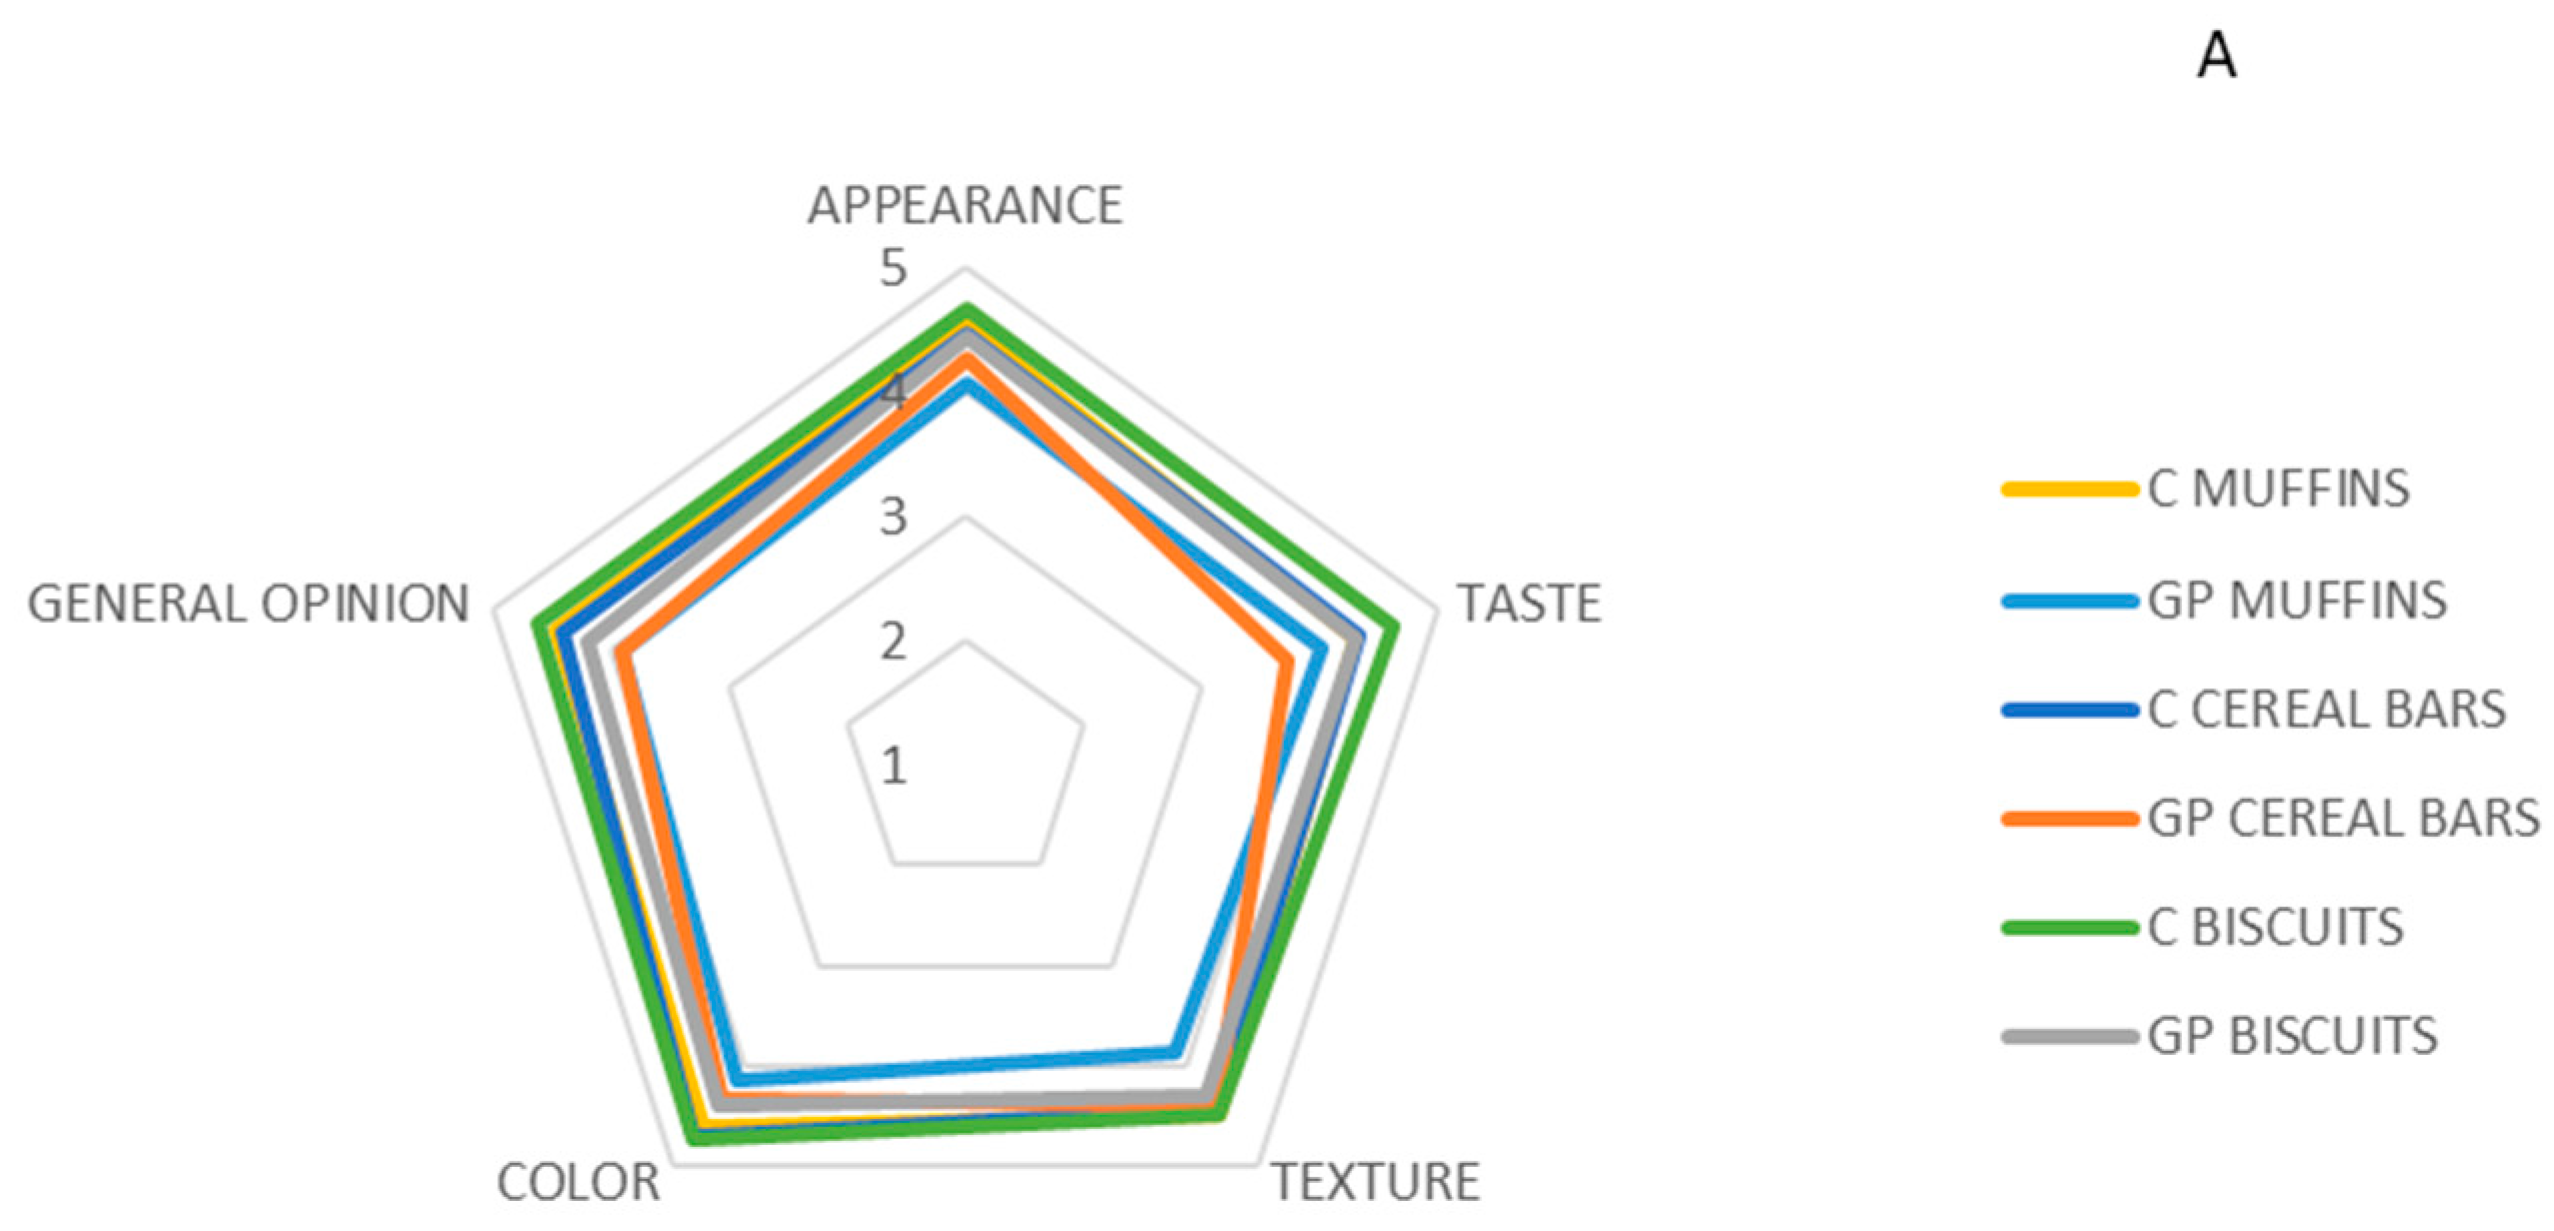
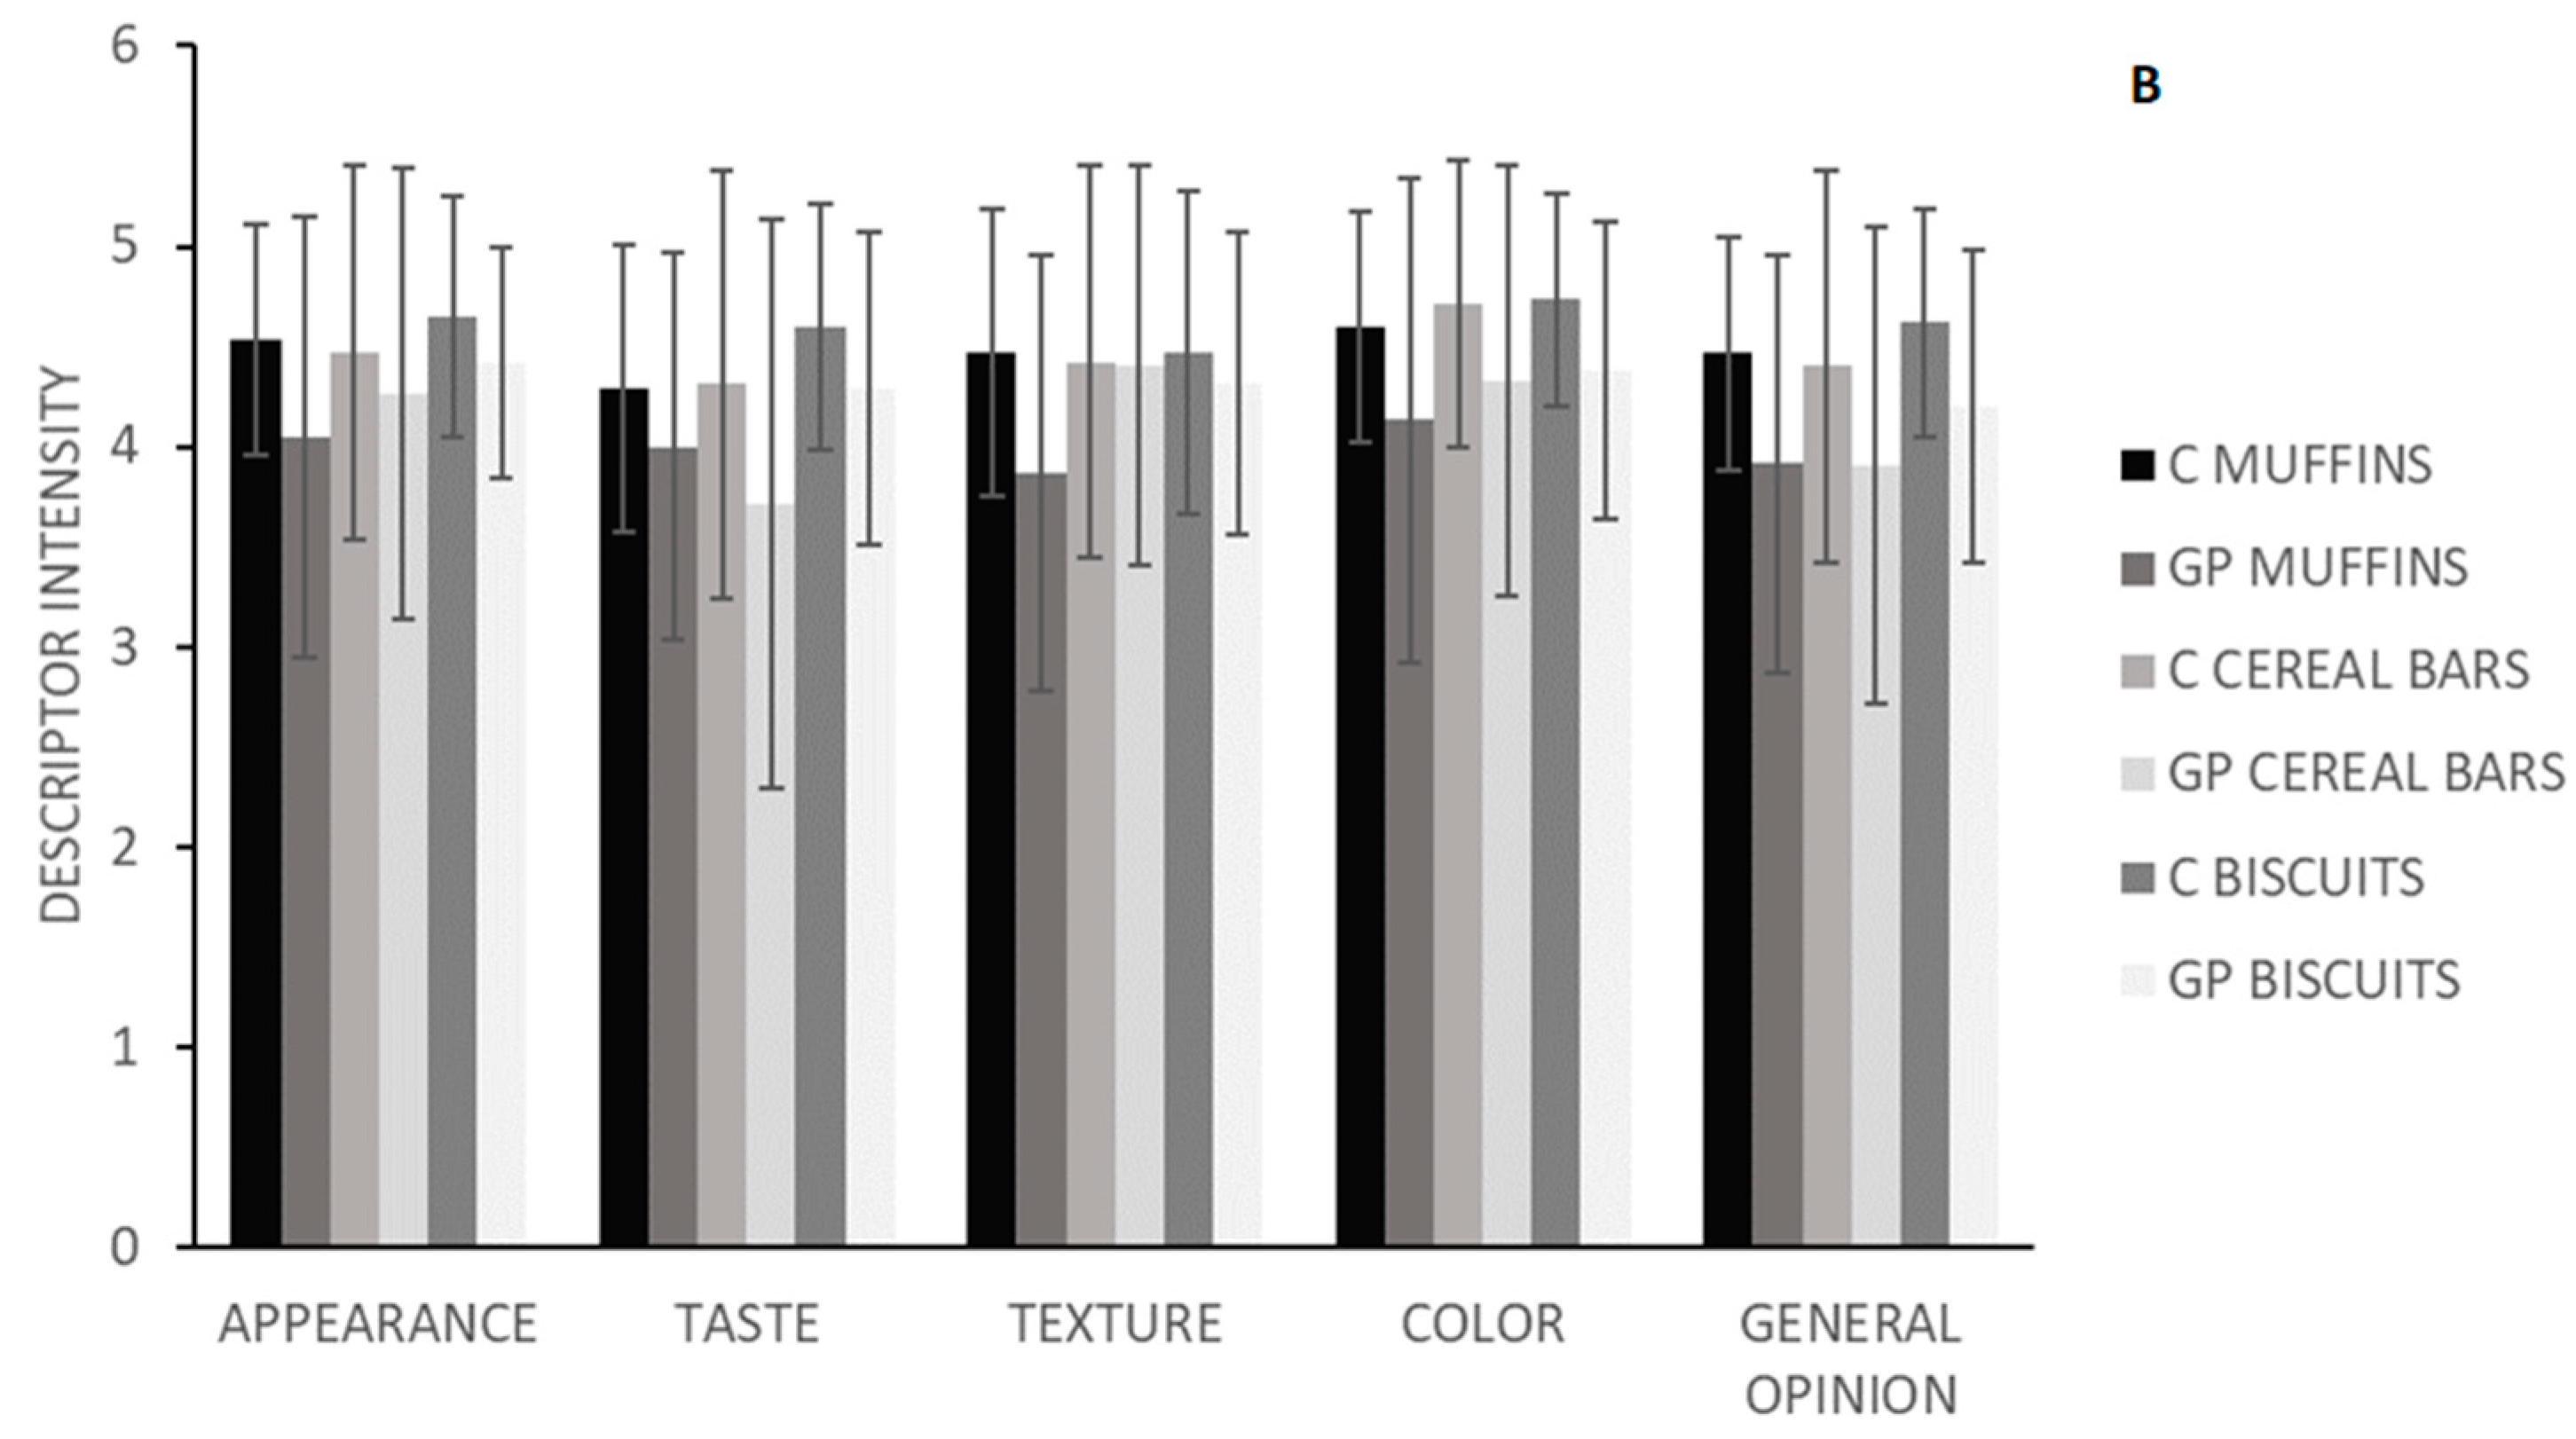

Table 1.
TPC and AA of GP enriched and control biscuits, muffins and cereal bars.
| Sample | TPC (mg GAE g-1 DW) |
AA (μmol TE g-1 DW) |
|---|---|---|
| Muffin control | 0.39 ± 0.04 | 7.22 ± 0.03 |
| GP Muffin | 3.28 ± 0.19 | 47.84 ± 1.55 |
| Cereal bar control | 2.58 ± 0.15 | 24.00 ± 0.49 |
| GP Cereal bar | 6.27 ± 0.19 | 75.40 ± 6.77 |
| Biscuits control | 0.94 ± 0.10 | 15.43 ± 0.45 |
| GP Biscuits | 6.35 ± 0.20 | 68.32 ± 4.86 |
Table 2.
Formulation for control muffin, biscuit and cereal bars.
| Muffin (% w/w) | Biscuit (% w/w) | Cereal bars (% w/w) |
| Flour 24 |
Flour 25 |
Honey 63 |
| Egg 27 |
Egg 46 |
Oats 17.5 |
| Sugar 27 |
Sugar 23 |
Cornflakes 10.5 |
| Butter 21 |
Sunflower Oil 5 |
Rice flakes 9 |
| Vanilla 0.5 |
Vanilla 0.5 |
|
| Baking Powder 0.5 |
Baking Powder 0.5 |
Table 3.
Individual anthocyanins quantification on GP supplemented foods. Average contents (µg g-1 WM of GP supplemented foods) with their standard deviations, n = 3 replicates.
Table 3.
Individual anthocyanins quantification on GP supplemented foods. Average contents (µg g-1 WM of GP supplemented foods) with their standard deviations, n = 3 replicates.
| Anthocyanin | Muffin | Cereal bar | Biscuit |
|---|---|---|---|
| Delphinidin 3-O-glucoside | 14.1 ± 0.3 | 28.8 ± 0.9 | 10.4 ± 2.9 |
| Cyanidin 3-O-glucoside | 8.2 ± 0.1 | 6.3 ± 0.1 | 4.9 ± 0.1 |
| Petunidin 3-O-glucoside | 20.2 ± 0.7 | 36.9 ± 1.1 | 9.8 ± 0.1 |
| Peonidin 3-O-glucoside | 10.3 ± 0.1 | 13.8 ± 0.3 | 5.5 ± 0.1 |
| Malvidin 3-O-glucoside | 160.2 ± 4.1 | 224.9 ± 8.9 | 69.7 ± 1.6 |
| Total glycosylated | 212.9 | 310.7 | 100.5 |
| Delfinidin 3-O-acetylglucoside | 8.9 ± 0.1 | 11 ± 0.2 | 7.4 ± 0.2 |
| Peonidin 3-O-acetylglucoside | 60.4 ± 1.9 | 80.8 ± 3.1 | 45.2 ± 0.0 |
| Total acetylated | 69.3 | 91.8 | 52.6 |
| Cyanidin 3-O-p-coumaroylglucoside | 13.8 ± 3.2 | 16.5 ± 3.7 | 7.8 ± 0.5 |
| Peonidin 3-O-p-coumaroylglucoside | 39.1 ± 1.3 | 50.1 ± 1.7 | 25.8 ± 0.2 |
| Malvidin 3-O-p-coumaroylglucoside | 558.1 ± 31.1 | 695.8 ± 34.7 | 361.5 ± 4.3 |
| Total coumaroylated | 611.1 | 762.3 | 395.1 |
| Total anthocyanins | 893.2 | 1164.8 | 548.2 |
Table 4.
Non-anthocyanins composition of GP supplemented foods. Average contents (µg g-1 WM of GP supplemented food) with their standard deviations, n = 3 replicates.
Table 4.
Non-anthocyanins composition of GP supplemented foods. Average contents (µg g-1 WM of GP supplemented food) with their standard deviations, n = 3 replicates.
| GP muffin | Control | GP cereal bar |
Control | GP biscuit |
Control | |
|---|---|---|---|---|---|---|
| Hydroxybenzoic acids | ||||||
| Syringic acid | 55.4±2.7 | n.d. | 45.5±1.8 | 4.4±1.3 | 107.8±2.4 | n.d |
| Total | 55.4 | 45.5 | 4.4 | 107.8 | ||
| Hydroxycinnamic acids | ||||||
| Caffeic acid | 60.6±3.03 | n.d | 48.4±1.8 | 20.8±2.0 | 99.3±3.5 | 6.8±0.8 |
| p-coumaric acid | 35.2±1.7 | n.d | 23.2±1.1 | n.d | 35.0±1.5 | n.d |
| Ferulic acid | 3.8±0.2 | n.d | 6.5±0.1 | n.d | 10.0±0.4 | n.d |
| Chlorogenic acid | 29.6±1.5 | n.d | 121.8± 0.1 | n.d | n/d | n.d |
| Total | 129.2 | 199.9 | 20.8 | 144.3 | 6.8 | |
| Stilbenes | ||||||
| trans-resveratrol | 2.7±0.1 | n.d | 2.0±0.1 | n.d | 4.5±0.1 | n.d |
| Total | 2.7 | 2.0 | 4.5 | |||
| Flavanols | ||||||
| (+)-catechin | 44.8±2.2 | n.d | 60.1±1.3 | n.d | 51.6±3.5 | n.d |
| (-)-gallocatechin | 253.4±12.7 | 162.8±8.1 | 53.2±23.7 | 105.3±23.7 | 162.3±23.9 | 58.2±1.1 |
| Total | 298.2 | 162.8 | 113.3 | 105.3 | 213.9 | 58.2 |
| Flavonols | ||||||
| Quercetin-3-O-glucoside | 103.7±5.2 | 126.6±6.3 | 11.0±1.7 | 44.3±8.2 | 194.8±1.7 | 285.0±5.3 |
| Quercetin | n.d | n.d | 4.7±0.8 | 4.0±0.2 | 3.9±0.2 | n.d |
| Myricetin | 4.2±0.2 | n.d | 7.6±0.2 | 5.4±0.2 | 8.0±1.1 | n.d |
| Rutin | 62.8±3.1 | 4.1±0.2 | 51.1±1.2 | 3.4±0.3 | 80.5±0.5 | n.d |
| Total | 170.7 | 130.7 | 74.4 | 57.1 | 287.2 | 285.0 |
| Other compounds | ||||||
| OH-tyrosol | 8.6±0.4 | n.d | 6.9± 0.6 | n.d | 13.3± 1.2 | n.d |
| Total | 8.6 | 6.9 | 13.3 | |||
| Total PCs | 664.8 | 293.5 | 442.0 | 186.7 | 771.0 | 350.0 |
| n.d.: not detected. |
Table 5.
Proximate composition of GP formulated foods (g/100g FW).
| Sample | Moisture | Proteins | Lipids | Fiber | Carbohydrates | Ash |
|---|---|---|---|---|---|---|
| Control Muffin | 20.25±0.17 | 6.6±1.15 | 21.33±0.64 | 0.32±0.09 | 50.89±0.92 | 0.68±0.15 |
| GP Muffin | 21.51±0.32 | 7.33±0.12 | 20.33±0.47 | 1.9±0.17 | 47.7±0.35 | 1.22±0.05 |
| Control Cereal bar | 14.31±0.81 | 4.13±0.32 | 0.70±0.14 | 0.49±0.08 | 80.18±1.49 | 0.40±0.02 |
| GP Cereal bar | 20.54±0.51 | 4.67±0.29 | 1.17±0.25 | 3.31±0.43 | 69.48±0.97 | 0.84±0.06 |
| Control Biscuits | 3.55±0.01 | 11.3±0.69 | 12.40±0.62 | 0.90±0.26 | 70.64±1.40 | 1.21±0.18 |
| GP Biscuits | 6.13±0.28 | 11.27±0.72 | 14.20±0.30 | 5.83±1.59 | 60.65±0.43 | 1.91±0.27 |
Disclaimer/Publisher’s Note: The statements, opinions and data contained in all publications are solely those of the individual author(s) and contributor(s) and not of MDPI and/or the editor(s). MDPI and/or the editor(s) disclaim responsibility for any injury to people or property resulting from any ideas, methods, instructions or products referred to in the content. |
© 2024 by the authors. Licensee MDPI, Basel, Switzerland. This article is an open access article distributed under the terms and conditions of the Creative Commons Attribution (CC BY) license (http://creativecommons.org/licenses/by/4.0/).
Copyright: This open access article is published under a Creative Commons CC BY 4.0 license, which permit the free download, distribution, and reuse, provided that the author and preprint are cited in any reuse.


