Submitted:
19 January 2024
Posted:
22 January 2024
You are already at the latest version
Abstract
The terrain of Changbai Mountain has great influence on the distribution of atmospheric flows and the occurrence and development of precipitation. This study quantitatively analyzes the regional characteristic of topographic perturbations and the relationship between terrain, wind and precipitation in Changbai Mountain region, by using a spectral analysis of the two-dimensional discrete cosine transform. Three domains with relatively heavy summer precipitation are selected as the study region. The results indicate that the overall terrain of Changbai Mountain region exhibits anisotropic characteristics. The terrain spectra of domain B are less than those of domain A and C across the whole wavelength (λ) bands, indicating that the large-scale topographic perturbations of domain B are relatively weak. The largest topographic spectral peak of domain C shows the most pronounced undulation of terrain among the three domains. The dominant wavelengths of terrain height variance for domain A and C, both close to the respective maximum wavelengths, indicate more prominent large-scale topographic perturbations. For domain A, the variation of the precipitation spectra is consistent with that of the wind spectra at the wavelength bands of λ < 390 km, showing a high correlation between wind field and the occurrence of rainfall. The inverse relationship at larger wavelengths indicates that multiple factors contribute to the occurrence of rainfall. For domain B, there is consistency in the fluctuations of terrain spectra, precipitation spectra, and wind spectra at the wavelength bands of λ < 278.3 km, implying that the smaller-scale terrain has an important effect on the occurrence of summer precipitation. For domain C, the variations of terrain spectra, precipitation spectra, and wind spectra are almost consistent across the whole wavelength bands, indicating that the large-scale terrain and minor terrain both play a crucial role in atmospheric uplift and the occurrence and development of summer rainfall.
Keywords:
Changbai Mountain
; two-dimensional discrete cosine transform
; terrain spectra
; wind spectra
; precipitation spectra
; additive synthesis
; the dominant wavelength
1. Introduction
Rainstorm is a common disastrous weather in China, which has caused serious losses to the safety of people’s lives and property. In recent years, extreme rainstorm events are gradually increasing in the context of global warming [1,2,3]. With the development of observational equipment and numerical models, scholars have made significant progress in understanding the formation mechanisms of rainstorms. Forecast accuracy of rainstorm, especially the regional organized systematic rainstorm, has also been improved to a certain extent [4,5,6,7,8]. However, it is still a universal problem to predict the occurrence and intensity of rainstorm under complex terrain, which plays a very important role in triggering precipitation and affecting its spatial and temporal distribution. Major mountain barriers can significantly modulate precipitation over mountainous areas through dynamic processes, such as upslope ascent, leeside descent, and associated gravity wave activities [9,10,11,12,13,14,15,16,17]. As topographic rainstorm usually shows characteristics of suddenness, small coverage, and short-term, it is difficult to make accurate early warning and prediction. Therefore, it often leads to mountain torrents, debris flows, landslides and other meteorological secondary disasters. Megacities built near mountains are vulnerable to natural disasters. Rainstorm and other disastrous weather could well cause serious losses to local people’s lives, property and economy. For example, an extreme weather event occurred in Northeast China on July 13, 2017, with the peak precipitation reaching 296 mm. The extensive rainfall accompanied by severe convection weather that included hailstones, thunderstorms and strong winds caused flooding damage and other geological disasters, such as debris flows and landslides, in some areas. The rainstorm affected nearly one million people and resulted in the direct economic loss of several hundred million Yuan [18,19].
Most of the rainstorm events in Northeast China are closely related to complex terrain [20,21,22,23]. The Changbai Mountain stretches for thousands of kilometers from southwest to northeast, across the east of Jilin, Liaoning, and Heilongjiang provinces, with its chief part located in the southeast of Jilin Province. It is the common birthplace of Tumen River, Yalu River, and Songhua River. With unique geographical location, it is a weather and climate sensitive area in northeast China, of which the central part is located in the transitional windward zone between the Changbai Mountain region and the Songliao Plain. The semi mountainous terrain is an area where meso- and micro-scale systems occur frequently. The local severe weather is the result of the combination of terrain and system development. Therefore, a systematic study on the topography of Changbai Mountain region is required for accurate forecast of rainstorm under the complex terrain.
Pielke and Kennedy (1980) [24] suggested that terrain characteristics can be truly represented in spectrum space, and terrain spectra can quantitatively reflect the effect of topographic dynamic forcing on atmosphere. Young and Pielke (1983) [25] and Young et al. (1984) [26] found that the spectral analysis of terrain cross-sections can be used to investigate the terrain spectra. Since then, the one-dimensional operation along several adjacent terrain sections has been extensively used for the high computational efficiency [25,26,27,28]. Steyn and Ayotte (1985) [29] proposed that if the terrain of a given area is directional, the one-dimensional spectral analysis method may not be accurate to deal with the terrain. Salvador et al. (1999) [30] determined a grid size of 2 km for mesoscale models of the east coast of Spain based on a two-dimensional spectral analysis. However, it is computationally time-consuming to calculate the two-dimensional terrain spectra for a larger study region, in spite of the rapid development of computational resources [31]. Wang and Wang (2004) [32] revealed the physical mechanism of the topographic effect on the westerly over the central and eastern China, using one-dimensional weighted-average spatial spectral method, which was also used to study the mechanism of terrain forcing on precipitation distribution in Tibet Plateau by Shu et al. (2006) [33].
However, the one-dimensional or two-dimensional spectral analysis method mentioned above all used traditional discrete Fourier transform (DFT). Denis et al. (2002) [34] proposed that spectral analysis of atmospheric fields on limited-area grids using Fourier transforms can lead to the aliasing or projection of the large-scale trend on the high-wavenumber components, though the DFT is well suited for global atmosphere. The two-dimensional discrete cosine transform (2D-DCT) is suitable for spectral analysis of data on a limited area. Since then, the DCT was widely applied in spectral analysis of atmospheric fields on limited-area grids [35,36,37,38,39]. For example, Huang and Cui (2016) [39] used 2D-DCT to decompose the terrain height field and torrential rainfall distribution field in Sichuan, China.
Although the terrain of Changbai Mountain plays an important role in atmospheric flows and occurrence and development of rainfall, there is currently a lack of quantitative research on the real terrain characteristics and the terrain effect on precipitation distribution in this region. The aim of this study was to quantitatively explore the effect of topographic dynamic forcing on precipitation distribution in Changbai Mountain region, by using 2D-DCT. The regional characteristic of topographic perturbations can be accurately depicted based on the terrain characteristics represented in spectrum space. The relationship among terrain dynamic forcing, wind and precipitation in spectrum space, and the possible reasons for the high incidence of local rainstorm were also investigated by analyzing the distributions of terrain spectra, wind spectra, precipitation spectra. In this paper, the data and the spectral analysis method are presented in section 2. The precipitation distribution characteristics, the terrain spectra of Changbai Mountain region, and spectral analysis of terrain, precipitation, and wind field are investigated in Section 3. The discussion and conclusions are summarized in Section 4.
2. Data and Methods
2.1. Data
The latest SRTM (Shuttle Radar Topographic Mission) 90 m digital elevation database, originally produced by National Aeronautics and Space Administration (NASA), was used for the algorithm of terrain spectra. The observed precipitation was from the merged hourly precipitation product, which had a horizontal resolution of 0.1°×0.1°. It is based on the optimum interpolation technique through the combination of the hourly precipitation observed by automatic weather stations and retrieved from CMORPH (Climate Prediction Center Morphing technique) satellite data [40]. The wind data at 850 hPa were from the European Centre for Medium-Range Weather Forecasts (ECMWF) global data, which had a horizontal resolution of 0.125°×0.125°. Data of wind and precipitation from June to September of each year from 2008 to 2022, were used in this study.
2.2. Methods
Spectral decomposition of terrain height field, wind field at 850 hPa, and precipitation field on Changbai Mountain domain was determined by the algorithm of 2D-DCT. The DCT was first applied to atmospheric spectral analysis by Denis et al. (2002) [34]. In the spectral analysis of atmospheric fields on limited-area domains, fields on the grids are generally aperiodic and dominated by large-scale factors whose wavelengths are greater than the domain in most cases. Trying to use a standard Fourier transform on limited-area domains can lead to the aliasing of the large-scale trend on the high-wavenumber components, thus destroying all usefulness of spectra at high wavenumbers. The DCT is particularly well adapted for spectral analysis of atmospheric fields on a limited area, compares favorably with the periodic Fourier transform. It does not need any trend removal or any other prior modification before applying the DCT and can overcome the problem of the aliasing of large-scale variance into shorter scales [39].
An algorithm of spectral computation has been coded, based on Denis et al.’s (2002) study, which used the 2D-DCT. For a two-dimensional physical field of Ni by Nj grid points, the direct and inverse DCT are respectively defined as,
and
with
Here, F(m,n) is the spectral coefficient corresponding to the (m,n) adimensional wavenumbers. The spectral variance can be computed from the spectral coefficients:
In order to analyze the relationship between terrain height spectral variance, total precipitation spectral variance, and wind spectral variance, the two-dimensional spectral coefficients are performed additive synthesis to obtain the relationship between variance and total wavelength. Instead of adding the contribution σ2(m, n) only to wavenumber k as in Denis et al. (2002) [34], an alternative method is to assign this contribution between the two wavenumbers k and k +1, using the distance weight coefficients [38]. Different from the allocation method of variance in Ricard et al. (2013) [38], the allocation is adjusted that the closer the distance, the stronger the weight. The weight coefficients are distributed into wavenumbers k and k+1 as follows:
In the equation (4), α(m, n) is the standardized two-dimensional wavenumber, and the specific meaning of and α′(k+1) is α′(k) shown in Ricard et al. (2013) [38].
3. Results
3.1. Precipitation Distribution in Changbai Mountain Region and Selection of Study Region
Before spectral decomposition of terrain height field, wind field, and precipitation field, the precipitation in Changbai Mountain region is analyzed first. Figure 1 shows the distribution of monthly average precipitation in the Changbai Mountain region from June to September during the period of 2008 to 2022. The precipitation in this region is concentrated from June to August, especially in August (Figure 1c), which is mainly distributed in the southwest of Changbai Mountain. For a better understanding of the relationship between the spatial distribution of precipitation and topography, the terrain height of Changbai Mountain region and the total precipitation from June to August averaged over 2008-2022 in this area are represented in Figure 2. As shown in Figure 2b, the rainband presents a northeast-southwest distribution and the precipitation is mainly concentrated in the areas between 40°N and 42°N and between 47°N and 48°N with three main centers at 129°E, 47°N, 125°E, 41°N and 127°E, 41.2°N, which have values of 450, 750 and 550 mm, respectively. The three precipitation centers, distributed in steep terrain areas, are located in the Xiaoxing’an Mountain area in the northwest of Changbai Mountain, the southwest part of the main Changbai Mountain Range, and the eastern part of Jilin Province, respectively. Based on the distribution characteristics of precipitation, three regions, namely domain A with limits of 126°E—130°E, 45.5°N—49°N (the rectangular A in Figure 2), domain B with limits of 122.4°E—126.2°E,40°N—42.5°N (the rectangular B in Figure 2) and domain C with limits of 126.2°E—129.4°E,41.2°N—45°N (the rectangular C in Figure 2), are selected for the spectral analysis.
The terrain height fields of the three study areas are shown in Figure 3. It can be seen that the western terrain of all three areas is relatively lower, whereas the rest areas showing the towering and complex terrain with crisscrossing gullies. In Figure 3a, though domain A is relatively low-lying compared to other two domains, there are still many high mountains and deep valleys, ravines, mainly distributed in the northeast of this region, which is conducive to the accumulation and uplift of water vapor, thus forming rainfall in this region. In Figure 3b, the mountain range presents a northeast-southwest orientation in domain B, of which the southern part shows a trumpet-shaped topography, which plays an essential role in the lifting of the low-level southwest air flow, thus resulting in the rainfall mainly distributed in the trumpet-shaped area. In Figure 3c, the high mountains are mainly located in the southeast of domain C, where the northwest terrain is relatively flat. The terrain height increases gradually from the northwest to the southeast, and the precipitation is mainly distributed in the southern region of the complex terrain.
3.2. The Terrain Spectra of Changbai Mountain Region
The 2D-DCT routine is applied over the height values of the three study areas in Changbai Mountain region, and the resulting spectra depict the distribution of terrain height variances in either wavenumber (k) or wavelength (λ = 1/k) (Figure 4). Terrain height variance spectra reveal the effect of topographic dynamic forcing on the atmosphere, and the greater the spectral energy then the stronger the topographic dynamic forcing [41]. As shown in Figure 4, the terrain height variance in each domain declines with increasing k, implying that the topographic dynamic forcing weakens with the gentleness of the topographic relief. In order to investigate whether there are isotropic features in each study area, the distributions of terrain height variance versus wavelength (km) with the wavenumber (0,0) as the starting point, and the angel (θ) between the rays (as shown in Figure 4) and the x-axes, are represented in Figure 5, Figure 6 and Figure 7, respectively. Because of the discreteness of terrain height variance and the integer variables of the zonal and meridional wavenumbers, the angels meeting with tan θ= 1/4, 1/2, 1, 2, and 4 are used for analyzing. It can be seen that, along these angles in each study area, the longer wavelength presents a larger terrain height variance, and the relatively short wavelength corresponds to the smaller terrain height variance. The variance at the whole wavelength bands is in an uptrend with increasing λ, in spite of several departures. Also, the majority of discrete points of terrain height variance are scattered at shorter wavelengths (λ < 1 km), under which the values of the variance are basically less than 1.0 × 10⁻³ m2.
A power law relationship between the terrain height variance () and wavelength λ in the form of is fitted using the least squares method, and the relevant parameters a, b and the correlation coefficient r can be obtained by the fitting algorithm. The coefficient a, representing the terrain height variance when λ = 1 km, reflects the intensity of topographic forcing. The exponent b, which is the spectral slope of the fitting curve in the log-log space, indicates the terrain smoothness. The smaller b shows the greater terrain height variance at shorter wavelength bands and videlicet the more pronounced small-scale perturbation. The values of a, b and r at the wavelength bands of λ ≥ 1 km for the five sections of the three study areas, are given in Table 1. It can be found that the values of a and b have considerable differences among these sections in each domain. The average fitting slopes b of the three study areas are 2.98, 2.70 and 2.91, respectively, indicating a pronounced perturbation of large-scale topography in domain A and C. The minimum b of 2.70 implies that the perturbation of small-scale topography is more significant in domain B. The exponent b varies from 2.70 to 2.98, indicating that the terrain of Changbai Mountain region is complex and there is difference in the terrain features of different areas, though domain B and C are adjacent.
The values of maximum and minimum b in each domain can be obtained from Table 1. The calculated ratios of the range of b (the difference between the maximum and minimum) to the average value of b for domain A, B and C are 24.83%, 2.96%, and 10.31%, respectively. Similarly, the ratios of the range of a to the average a for domain A, B and C are 143.33%, 80%, and 61.01%, respectively. Obviously, the ratios of 24.83% and 143.33%, corresponding to domain A, are the largest in the three study areas, which shows the most obvious anisotropy in the three domains. The minimum ratio of 2.96%, corresponding to domain B, indicates that the anisotropy in this region is the least significant. However, the coefficient a varies considerably from 2.37 to 5.41, and the ratio of the range of a to the average a reaches 80%, implying differing geographic coverage among these sections of domain B. It shows that the overall terrain of Changbai Mountain region is complex and the anisotropy characteristics are relatively obvious, indicating that simply using one-dimensional terrain spectra may not better present the overall terrain characteristics of this region.
3.3. The Spectral Analysis of Terrain, Precipitation and Wind Field
In order to investigate the correlation between terrain spectra, total precipitation spectral variance and average wind spectral variance, the relationship between variance and total wavelength is obtained by performing additive synthesis on the two-dimensional spectral coefficients. Figure 8 shows the distributions of synthesized terrain height variance, total precipitation spectral variance, and average wind spectral variance from June to August averaged over 2008-2022 with respect to λ in the three study areas. It can be seen that the majority of terrain height variance (solid line) is distributed at larger wavelengths (λ > 100 km), under which the values of the variance are basically greater than 1000 m2. The dominant wavelengths (DWs) corresponding to the topographic spectral peak, represent the most evident undulation of terrain and videlicet the maximum topographic dynamic forcing. When the wavelength is shorter than the DW, the forcing mainly decreases with decreasing λ, in spite of several departures. In Figure 8b, the DW is 278.3 km, corresponding to the maximum spectral energy of 4200 m2 for domain B, less than the values for domain A and C. It indicates that the large-scale topographic perturbations of domain B are relatively weak and the topographic relief of domain B is gentler than that of the other two areas. However, the fluctuation of terrain height variance is more pronounced when λ < DW, indicating significant smaller-scale topographic perturbations of domain B, which is consistent with the result of smaller b for domain B obtained by the previous analysis. Moreover, the maximum topographic spectral energy of 2.6 × 10⁴ m2 for domain C is larger than the values for the other two domains, indicating that the undulation of terrain in domain C is the most pronounced. Also, as shown in Figure 8a,c, the overall fluctuations of terrain height variance are relatively similar, and the DWs are both close to the respective maximum wavelengths for domain A and C, indicating more prominent large-scale topographic perturbations of domain A and C, compared to that of domain B.
Further insight into the total precipitation spectral variance (dashed line in Figure 8) and wind spectral variance (dotted line in Figure 8) is gain. It can be seen that the precipitation variance of the three study areas is not exactly the same. The DWs correspond to the spectral peak of precipitation in precipitation spectrum space. As shown in Figures 8a, the DW of precipitation is 390 km, corresponding to the maximum spectral energy of 5200 mm2 for domain A. When λ < 390 km, the precipitation spectral variance decreases with decreasing λ, whereas the trend of spectral variance is downward with increasing λ when λ > 390 km. The DWs of precipitation in Figure 8b,c are both close to the respective maximum wavelengths for domain B and C, indicating that the precipitation spectral variance increases with increasing λ at the whole wavelength bands. Similarly, the wind spectral variance of all the three domains has an upward trend with increasing λ, corresponding to the DWs of wind at the maximum wavelengths.
A further analysis is undertaken on the relation between the terrain height spectra, wind spectra and precipitation spectra. Obviously, there is a strong correlation between the variances of the terrain height, total precipitation and wind field in respective study regions.
For domain A, the variation of the precipitation spectral variance is consistent with that of the wind spectral variance at the wavelength bands of λ < 390 km (the DW of precipitation), implying a high correlation between wind field and the occurrence of rainfall. The inverse relationship between terrain spectra and precipitation spectra appears at larger wavelengths of λ > 390 km, indicating that many factors contribute to the occurrence of rainfall in this region. The distribution of summer precipitation is actually influenced by both terrain and non-topographic factors.
In Figure 8b, it can be seen that there is consistency in the fluctuations of terrain spectra, precipitation spectra, and wind spectra at the wavelength bands of λ < 278.3 km (the DW of terrain), especially at the range of 50-100 km. The consistency shows that the small-scale terrain in this region plays an important role in the uplift of atmosphere and therefore the occurrence and development of summer precipitation. When λ > 278.3 km, there is a reverse relationship of the variation between the terrain height variance and the precipitation spectral variance, whereas the fluctuations of precipitation spectra and wind spectra are relatively consistent. It indicates that the large-scale topographic perturbations of domain B is relatively weak, and precipitation is mainly dominated by certain precipitation weather systems.
For domain C, the fluctuations of terrain spectra, precipitation spectra, and wind spectra show a significant positive correlation across the whole wavelength bands. The occurrence of resonance between terrain, wind field, and precipitation implies that the large-scale terrain and minor terrain both play a crucial role in atmospheric uplift and the occurrence and development of summer rainfall in domain C. The precipitation systems are impacted by continuous periodic topographic forcing. When the frequency of topographic forcing equals or almost equals the vibration frequency of the precipitation systems or the background fields, the precipitation systems resonates with topographic forcing, thus resulting in the formation of precipitation.
4. Discussion and Conclusions
The terrain of Changbai Mountain has great influence on the distribution of mesoscale atmospheric flows and the occurrence and development of precipitation through dynamic processes. However, quantitative studies on the real terrain characteristics and the terrain effect on precipitation distribution are scant at present, and even fewer studies reference Changbai Mountain region. This study quantitatively analyzes the distributions of terrain spectra, wind spectra and precipitation spectra in this region, by using a spectral analysis of 2D-DCT. The regional characteristic of topographic perturbations, the distribution characteristics of summer precipitation and the relationship between terrain, wind field and precipitation in spectrum space are discussed. The main conclusions are presented below.
The summer precipitation in Changbai Mountain region is mainly concentrated in August, which is mostly distributed in the southwest of Changbai Mountain. The rainband of the summer precipitation presents a northeast-southwest distribution and the precipitation is mainly concentrated in the areas between 40°N and 42°N and between 47°N and 48°N, of which the terrain is steep. Based on the distribution characteristics of precipitation, three domains with relatively heavy precipitation are selected as the study region for the spectral analysis. The results of the two-dimensional spectral decomposition of the terrain height field in each domain indicate that the overall terrain of Changbai Mountain region shows anisotropic characteristics. The anisotropy of the terrain in domain A is the most obvious among the three domains, while the terrain in the southwest of the main Changbai Mountain Range shows the least significant anisotropy. The complex terrain implies that only using one-dimensional terrain spectra may not better present the overall terrain characteristics of this region, whereas the terrain spectra performing the 2D-DCT routine can successfully demonstrate the anisotropic characteristics.
Through the comparison among the three spectral curves of synthesized terrain height variance with respect to λ in the three study areas, the values of the variance for domain B are basically less than the values for domain A and C at the whole wavelength bands, indicating that the large-scale topographic perturbations of domain B are relatively weak, and the topographic relief is gentler than that of the other two domains. However, the smaller-scale topographic perturbations of domain B is prominent because of undulation of terrain at the shorter wavelength bands. The dominating peak value of terrain height variance for domain C is larger than the values for the other two domains, indicating that the undulation of terrain in domain C is the most pronounced. Also, the dominant wavelengths of terrain height variance for domain A and C are both close to the respective maximum wavelengths and the overall fluctuation of terrain height variance for domain A is similar to that for domain C, indicating more prominent large-scale topographic perturbations of domain A and C compared to that of domain B. The distributions of the total precipitation spectral variance of the three domains are not exactly the same. The DW corresponding to the spectral peak of precipitation for domain A is 390 km, whereas the DWs for domain B and C are close to the maximum wavelengths, respectively. It indicates that the precipitation spectra of domain B and C both increase with increasing λ at the whole wavelength bands. Similarly, the wind spectral variance of all the three domains has an upward trend with increasing λ.
Based on the analysis of the relation between the terrain height spectra, wind spectra and precipitation spectra, the variation of the precipitation spectral variance is consistent with that of the wind spectral variance at the wavelength bands of λ < 390 km for domain A, showing a high correlation between wind field and the occurrence of rainfall. The inverse relationship between terrain spectra and precipitation spectra at larger wavelengths indicates that many factors contribute to the occurrence of rainfall and the terrain effect is weakened by other factors. For domain B, there is consistency in the fluctuations of terrain spectra, precipitation spectra, and wind spectra at the wavelength bands of λ < 278.3 km, implying that the dynamic forcing of the smaller-scale terrain has an important effect on the occurrence of summer precipitation. When λ > 278.3 km, a reverse fluctuation exists between the terrain spectra and the precipitation spectra, indicating that the large-scale topographic perturbations is relatively weak, and precipitation is mainly dominated by certain precipitation weather systems. For domain C, the variations of terrain spectra, precipitation spectra, and wind spectra are almost consistent across the whole wavelength bands. The occurrence of resonance between terrain, wind field, and precipitation implies that the large-scale and smaller-scale terrain both play a crucial role in atmospheric uplift and the occurrence and development of summer rainfall in domain C.
References
- Sun, W.Y.; Mu, X.M.; Song, X.Y.; Wu, D.; Cheng, A.F.; Qiu, B. Changes in extreme temperature and precipitation events in the Loess Plateau (China) during 1960–2013 under global warming. Atmosphere 2016, 168, 33–48. [Google Scholar] [CrossRef]
- Zhao, Y.F.; Zou, X.Q.; Cao, L.G.; Xu, X. Changes in precipitation extremes over the Pearl River Basin, southern China, during 1960–2012. Quat. Int. 2014, 333, 26–39. [Google Scholar] [CrossRef]
- Domroes, M.; Schaefer, D. Recent climate change affecting rainstorm occurrences: a case study in East China. Clim. Past, 2008, 4, 303–309. [Google Scholar] [CrossRef]
- Chen, S.J.; Wang, W.; Lau, K.H.; Zhang, Q.H.; Chung, Y.S. Mesoscale convective systems along the Meiyu front in a numerical model. Meteorol. Atmos. Phys. 2000, 75, 149–160. [Google Scholar] [CrossRef]
- Hu, B.W.; Cui, C.G.; Fang, C.H. Causes of a two-day successively heavy rain along the Changjiang Valley in the eastern Hubei Province during 21–22 July 1998. Chinese J. Atmos. Sci. 2001, 25, 479–491. (In Chinese) [Google Scholar]
- Ding, Z.Y.; Zhang, X.Q.; Shou, S.W. Analysis of relation of South Asia High and rainstorm caused by northwesterly upper-level jet. J. Appl. Meteor. Sci. 2002, 13, 671–679. (In Chinese) [Google Scholar]
- Chen, J.; Liu, L. Characteristics of urban rainstorm and its disaster cause over Beijing in flood season of 2011. Torrential Rain Disasters 2011, 30, 282–287. (in Chinese). [Google Scholar]
- Wang, C.X.; Gao, S.T.; Liang, L.; Ding, D.F.; Gong, H.N. Multi-scale characteristics of moisture transport during a rainstorm process in North China. Atmos. Res. 2014, 145–146, 189–204. [Google Scholar] [CrossRef]
- Scorer, R.S. Theory of waves in the lee of mountains. Q. J. R. Meteorol. Soc. 1949, 75, 41–56. [Google Scholar] [CrossRef]
- Mclntyre, M.E. On Long’s hypothesis of no upstream influence in uniformly stratified or rotating flow. J. Fluid Mech. 1972, 52, 209–243. [Google Scholar] [CrossRef]
- Klemp, J.B.; Lilly, D.K. Numerical simulation of hydrostatic mountain waves. J. Atmos. Sci. 1978, 35, 78–107. [Google Scholar] [CrossRef]
- Tucker, D.F.; Reiter, E.R. Modeling heavy precipitation in complex terrain. Meteorol. Atmos. Phys. 1988, 39, 119–131. [Google Scholar] [CrossRef]
- Johnson, G.L.; Hanson, C.L. Topographic and atmospheric influences on precipitation variability over a mountainous watershed. J. Appl. Meteor. 1995, 34, 68–87. [Google Scholar] [CrossRef]
- Aebischer, U.; Schar, C. Low-level potential vorticity and cyclogenesis to the lee of the Alps. J. Atmos. Sci. 1998, 55, 186–207. [Google Scholar] [CrossRef]
- Jiang, Q.F. Precipitation over concave terrain. J. Atmos. Sci. 2006, 63, 2269–2288. [Google Scholar] [CrossRef]
- Jiang, Q.F. Precipitation over multiscale terrain. Tellus. 2007, 59, 321–335. [Google Scholar] [CrossRef]
- Steeneveld, G.J.; Holtslag, A.A.M.; Nappo, C.J.; van de Wiel, B.J.H.; Mahrt, L. Exploring the possible role of small-scale terrain drag on stable boundary layers over land. J. Appl. Meteor. Climatol. 2008, 47, 2518–2530. [Google Scholar] [CrossRef]
- Jia, B.S.; Jia, F.N.; Zhang, W.T.; Liu, G.Y.; Cui, Z.Q. Analysis of heavy rainstorm weather process in Jilin province from July 13 to 14, 2017. Modern Agricultural Science and Technology 2021, 4, 176–180. (In Chinese) [Google Scholar]
- Yu, J.H.; Gong, Y.F.; Mao, W.S. Comparative analysis on two extreme severe precipitation events in Yongji county, Jinlin province in July 2017. J. Chengdu University of information technology 2019, 3, 287–296. (In Chinese) [Google Scholar]
- Zhang, L.; Li, Z.C. The reason of a heavy rain event in Nenjiang valley in August, 1998. Meteor. Mon. 2003, 8, 7–12. (In Chinese) [Google Scholar]
- Zheng, X.Y.; Zhang, Y.Z.; Bai, R.H. Rainstorm in Northeast China; Meteorology Press: Beijing, China, 1992; pp. 142–145. [Google Scholar]
- He, B.H.; Sun, J.Q.; Yu, E.T.; Wang, H.J.; Zhang, M.Q.; Hua, W. Simulation study on the Influence of the great Khingan Strip and Changbai Mountain on summer rainfall in Northeast China. Climatic and Environmental Research 2020, 3, 268–280. (in Chinese). [Google Scholar]
- Liu, C.H.; Wang, Y.; Yan, Q.; Tan, Z.H.; Liu, S.; Jiao, H.R.; Jin, Y. Impact of flow over and flow around caused by super low-level jet on a sudden rainstorm over the Changbai Mountains. Torrential Rain Disaster. 2023, 3, 273–282. (in Chinese). [Google Scholar]
- Pielke, R.A.; Kennedy, E. Mesoscale Terrain Features. Report UVA-ENV SCI-MESO-1980-1; University of Virginia: Charlottesville, VA, USA, 1980; p. 19. [Google Scholar]
- Young, G.S.; Pielke, R.A. Application of terrain height variance spectra to mesoscale modeling. J. Atmos. Sci. 1983, 40, 2555–2560. [Google Scholar] [CrossRef]
- Young, G.S.; Pielke, R.A.; Kessler, R.C. A comparison of the terrain height variance spectra of the Front Range with that of a hypothetical mountain. J. Atmos. Sci. 1984, 41, 1249–1252. [Google Scholar] [CrossRef]
- Srinivasan, K.; Ramanathan, N. Terrain variance spectra for Indian Western Ghats. Proc. Indian natn Sci. Acad. 1994, 60A, 133–138. [Google Scholar]
- Ramanathan, N.; Srinivasan, K. An estimation of optimum grid size for Kashmir Valley by spectral method. J. Appl. Meteor. 1995, 34, 2783–2786. [Google Scholar] [CrossRef]
- Steyn, D.G.; Ayotte, K.W. Application of two-dimensional terrain height spectra to mesoscale modeling. J. Atmos. Sci. 1985, 42, 2884–2887. [Google Scholar] [CrossRef]
- Salvador, R.; Calbo, J.; Millan, M.M. Horizontal grid size selection and its influence on mesoscale model simulations. J. Appl. Meteor. 1999, 38, 1311–1329. [Google Scholar] [CrossRef]
- Wang, C.X.; Liang, L.; Zhang, W.C.; Gao, S.T.; Yang, S. The Impact of Improved Topographic Resolution on the Distribution of Terrain Spectra and Grid-Size Selection for Mesoscale Models. Atmosphere 2022, 13, 708. [Google Scholar] [CrossRef]
- Wang, W.T.; Wang, Y. A spectral analysis of satellite topographic profile: A coincident pattern between latitudinal topographic and westerly perturbation on the lee side of Qinghai-Tibet Plateau. J. Nanjing Univ. 2004, 40, 304–317. (In Chinese) [Google Scholar]
- Shu, S.J.; Wang, Y.; Li, Y. Effect of topographic perturbation on the precipitation distribution in Tibetan Plateau. Adv. Water Sci. 2006, 17, 585–591. (In Chinese) [Google Scholar]
- Denis, B.; Cote, J.; Laprise, R. Spectral decomposition of two-dimensional atmospheric fields on limited-area domains using the discrete cosine transform (DCT). Mon. Wea. Rev. 2002, 130, 1812–1829. [Google Scholar] [CrossRef]
- Zheng, Y.J.; Jin, Z.Y.; Chen, D.H. Kinetic energy spectrum analysis in a semi-implicit semi-Lagrangian dynamical frame work. Acta Meteor. Sinica 2008, 70, 371–386. (In Chinese) [Google Scholar]
- Jiang, C.; Shen, X.S. Assessment of the simulative performance of the GRAPES model on the convective boundary layer based on the large eddy simulations. Acta Meteor. Sinica 2013, 71, 879–890. (In Chinese) [Google Scholar]
- Prein, A.F.; Holland, G.J.; Rasmussen, R.M. Importance of regional climate model grid spacing for the simulation of heavy precipitation in the Colorado Headwaters. J. Climate 2013, 26, 4848–4857. [Google Scholar] [CrossRef]
- Ricard, D.; Lac, C.; Riette, S.; Legrand, R.; Mary, A. Kinetic energy spectra characteristics of two convection-permitting limited-area models AROME and Meso-NH. Q. J. R. Meteorol. Soc. 2013, 139, 1327–1341. [Google Scholar] [CrossRef]
- Huang, Y.J.; Cui, X.P. Spectral characteristics of terrain in the Sichuan basin and the horizontal grid size selection for a mesoscale model. Acta Meteor. Sinica 2016, 1, 114–126. (In Chinese) [Google Scholar]
- Pan, Y.; Shen, Y.; Yu, J.J.; Zhao, P. Analysis of the combined gauge-satellite hourly precipitation over China based on the OI technique. Acta Meteor. Sinica 2012, 6, 1381–1389. (In Chinese) [Google Scholar]
- Pielke, R.A. Mesoscale Meteorological Modeling; Academic Press: SanDiego, CA, USA, 1984; p. 599. [Google Scholar]
Figure 1.
Distribution of monthly average precipitation in Changbai Mountain region from 2008 to 2022 (Contour, Unit: mm) in (a) June, (b) July, (c) August, (d) September.
Figure 1.
Distribution of monthly average precipitation in Changbai Mountain region from 2008 to 2022 (Contour, Unit: mm) in (a) June, (b) July, (c) August, (d) September.
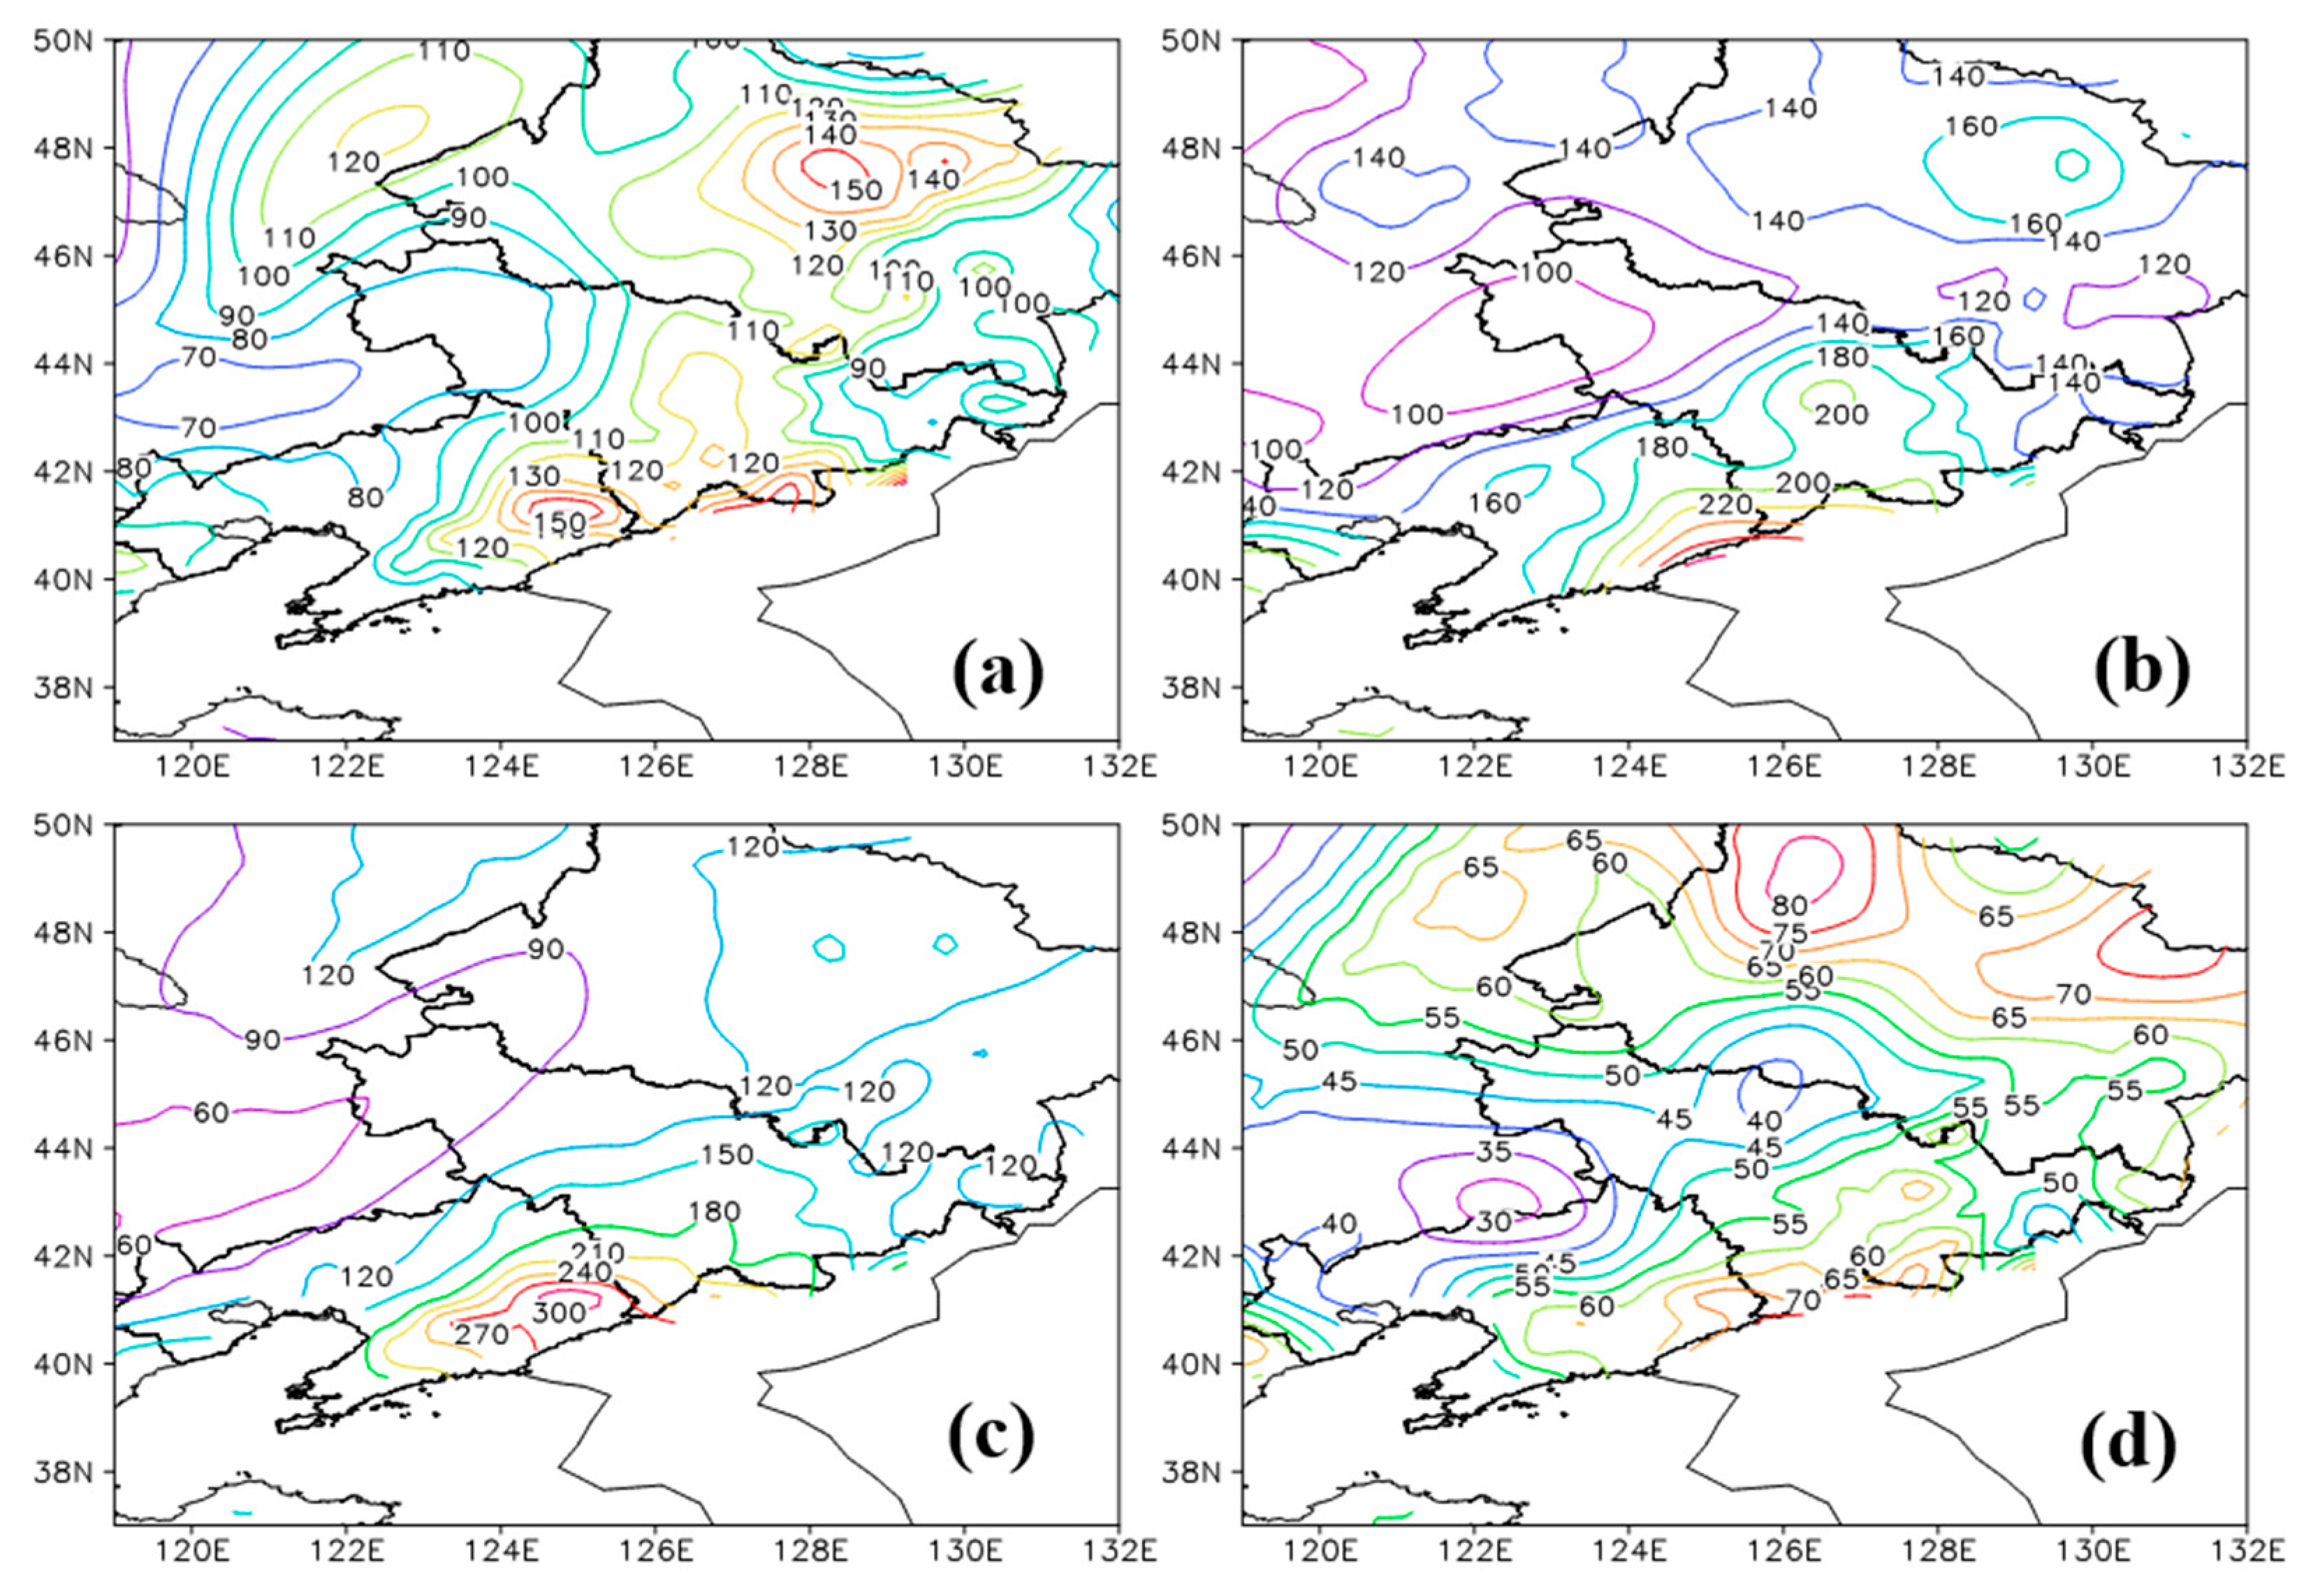
Figure 2.
(a) Topographic height of Changbai Mountain region (Shade, Unit: m) and (b) Distribution of the total precipitation from June to August averaged over 2008-2022 in Changbai Mountain region (Contour, unit: mm). The red rectangles indicate the three study areas (A, B, and C) in this study.
Figure 2.
(a) Topographic height of Changbai Mountain region (Shade, Unit: m) and (b) Distribution of the total precipitation from June to August averaged over 2008-2022 in Changbai Mountain region (Contour, unit: mm). The red rectangles indicate the three study areas (A, B, and C) in this study.
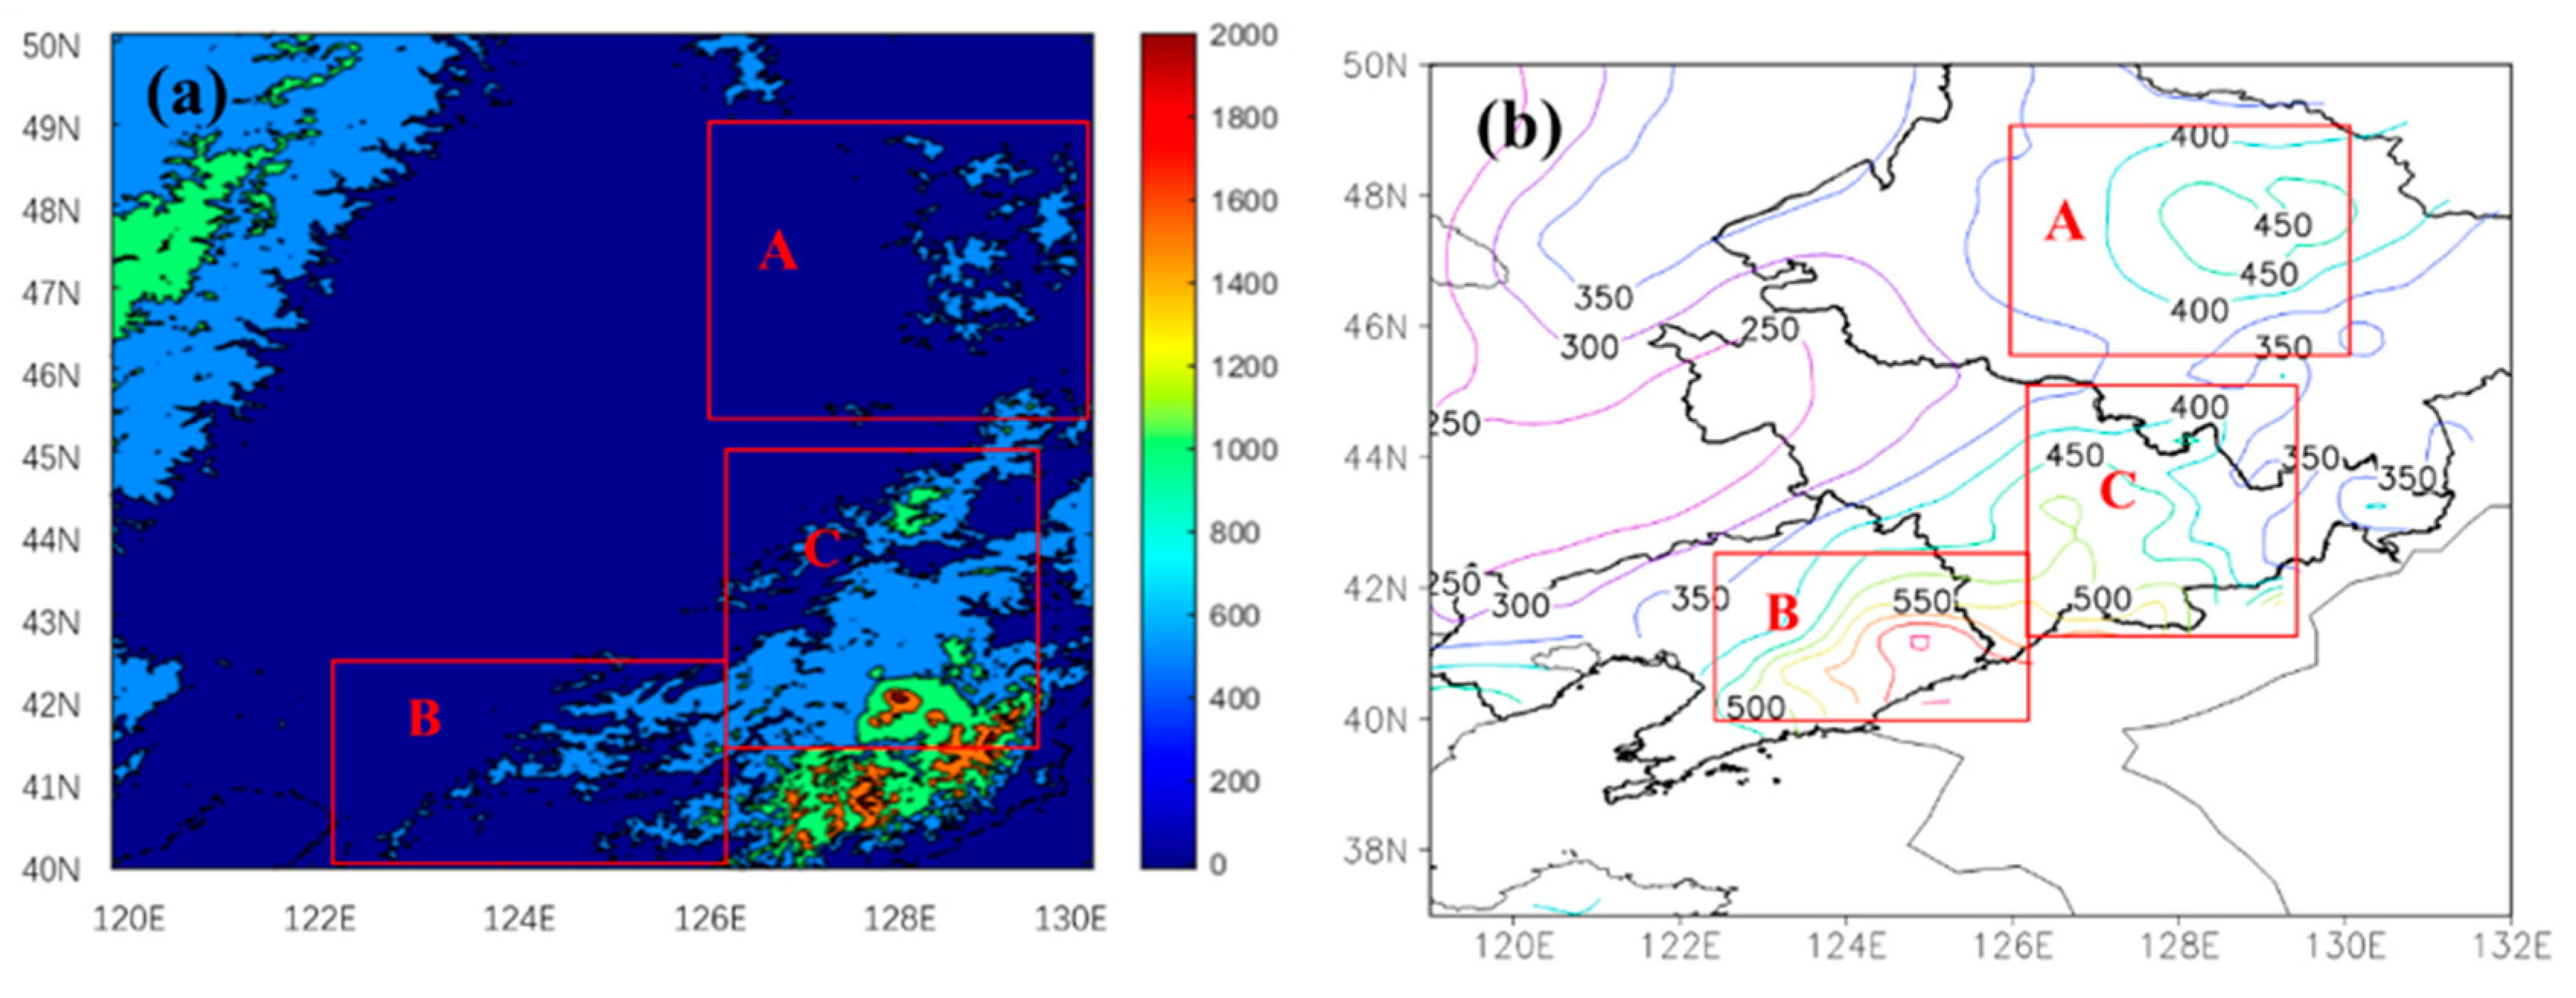
Figure 3.
Terrain height fields in the study area A (a), B (b), and C (c). The study area locations are plotted in Figure 2.
Figure 3.
Terrain height fields in the study area A (a), B (b), and C (c). The study area locations are plotted in Figure 2.
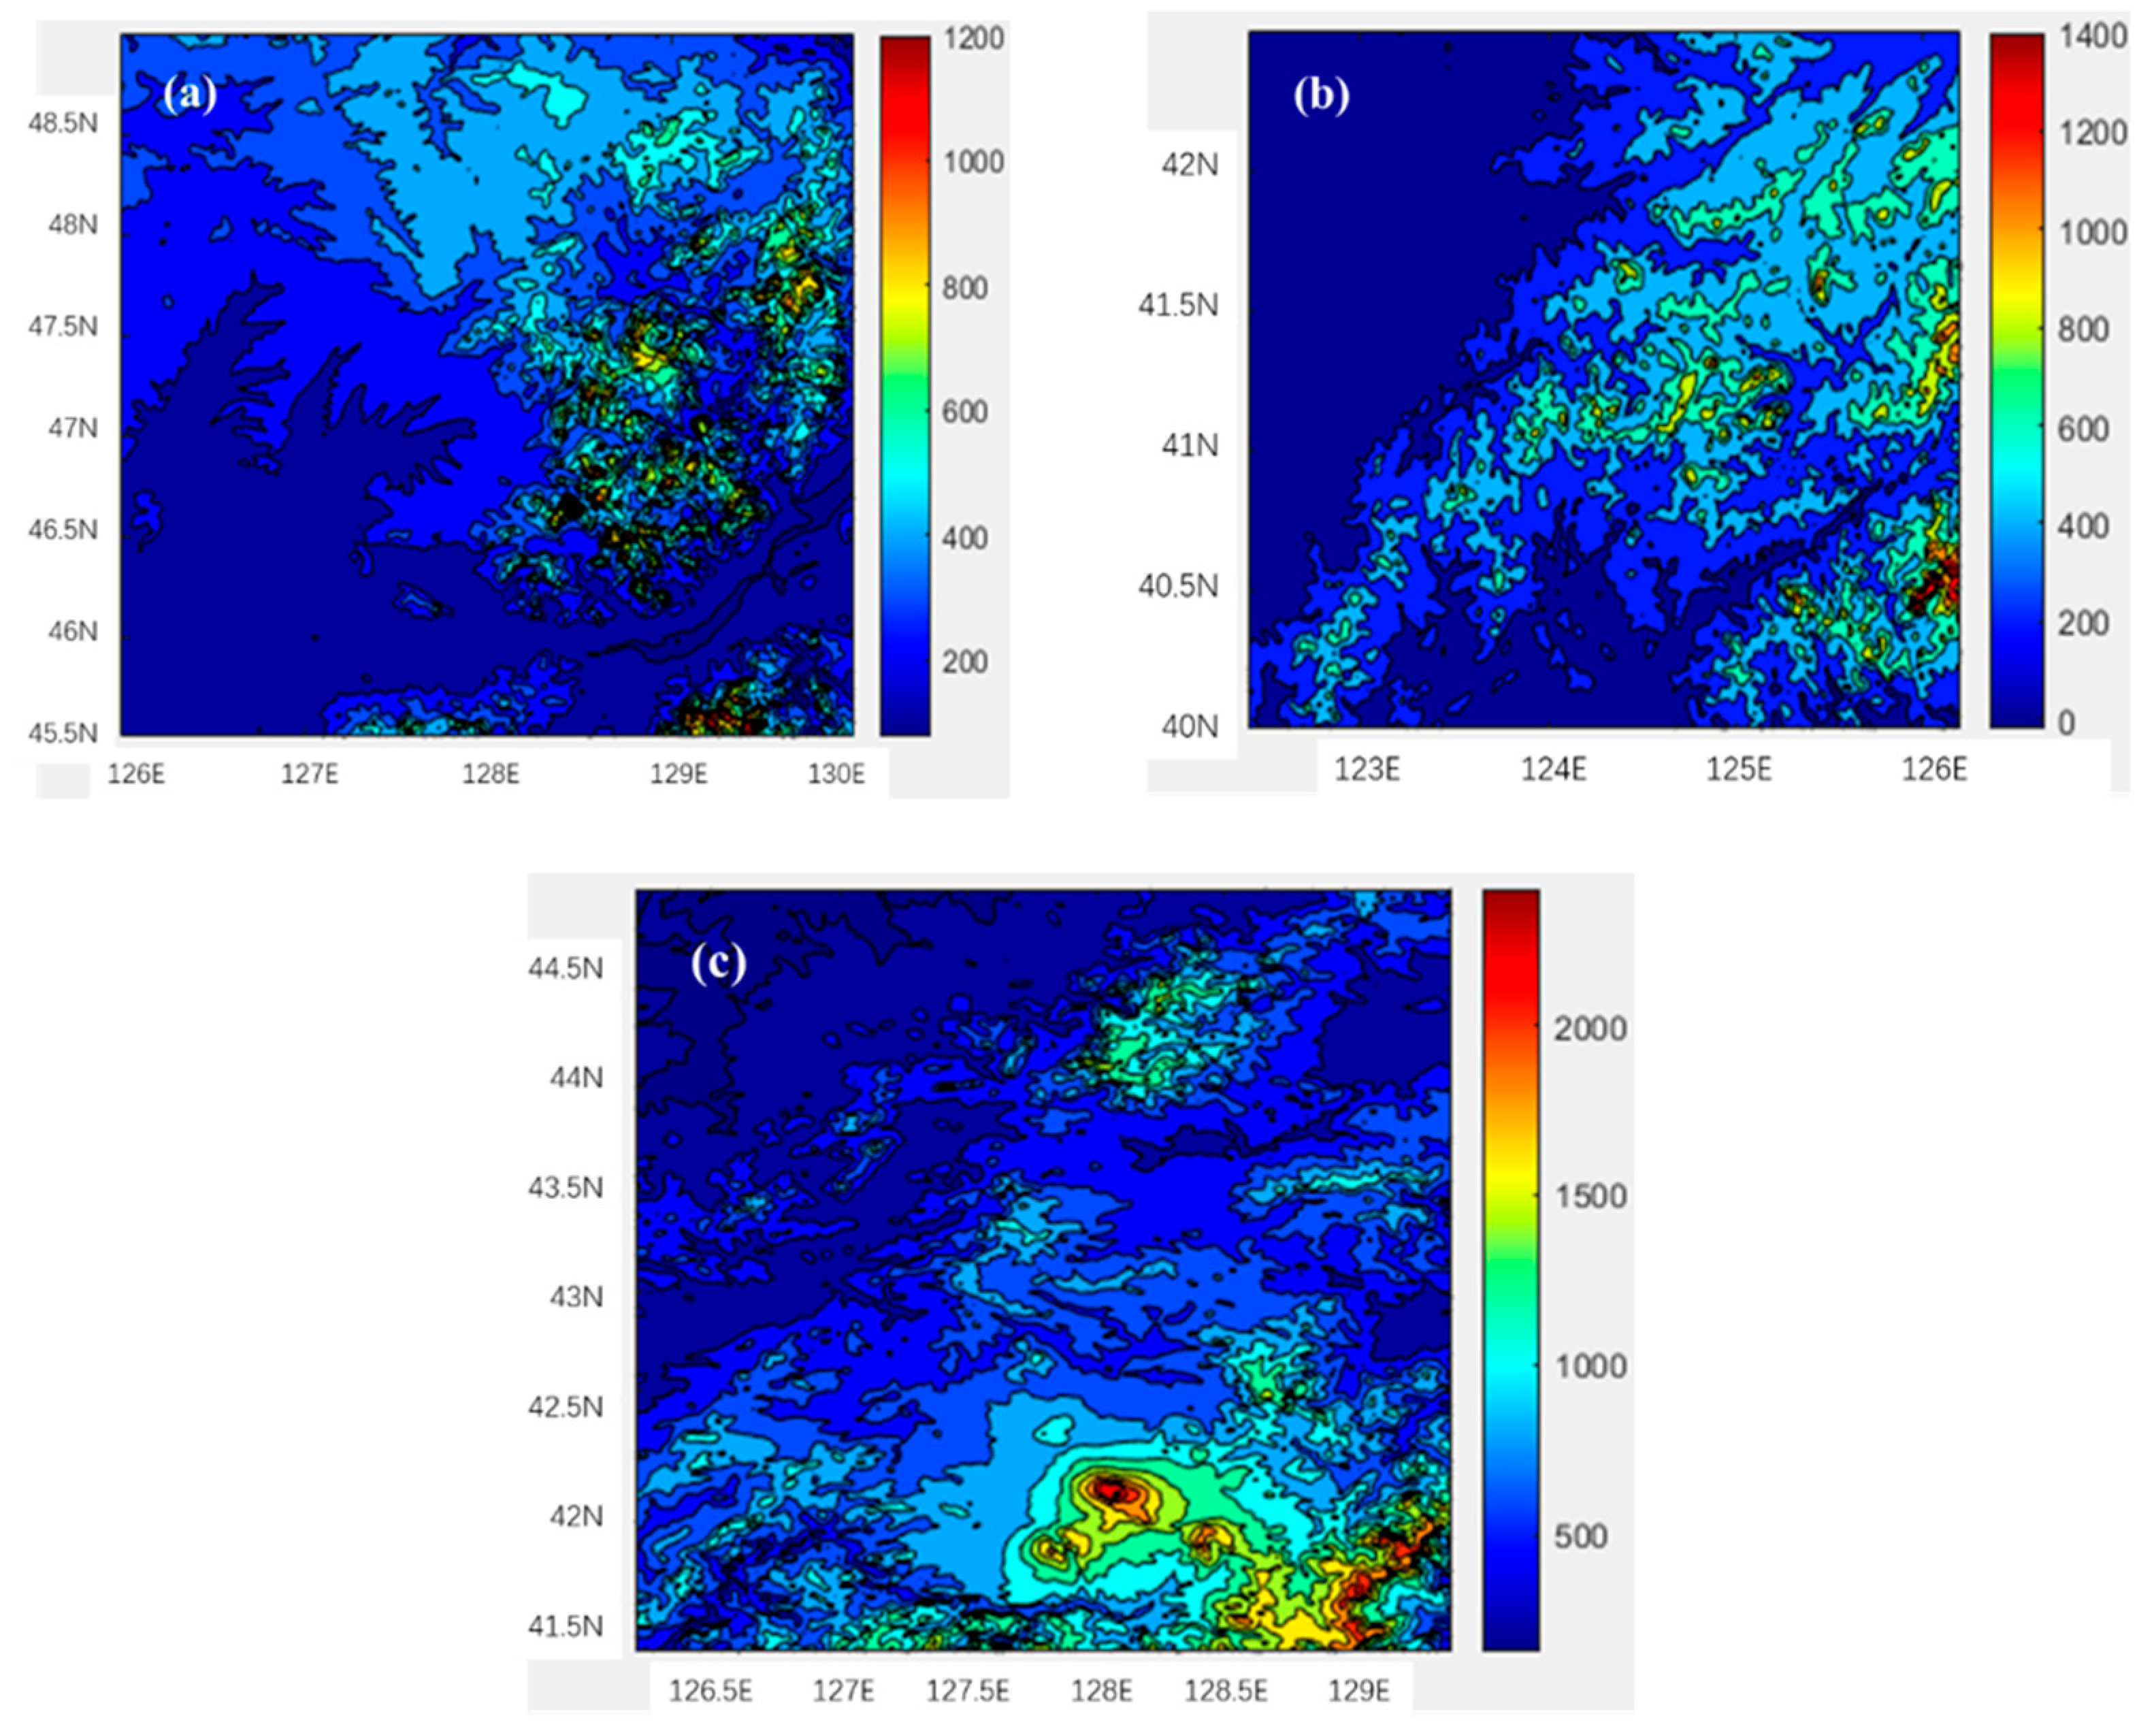
Figure 4.
The logarithm distribution (lgσ2) of two-dimensional terrain height spectral variance(σ2) in domian A (a), B (b), and C (c). x and y represent the zonal and meridional wavenumber axes, respectively.
Figure 4.
The logarithm distribution (lgσ2) of two-dimensional terrain height spectral variance(σ2) in domian A (a), B (b), and C (c). x and y represent the zonal and meridional wavenumber axes, respectively.
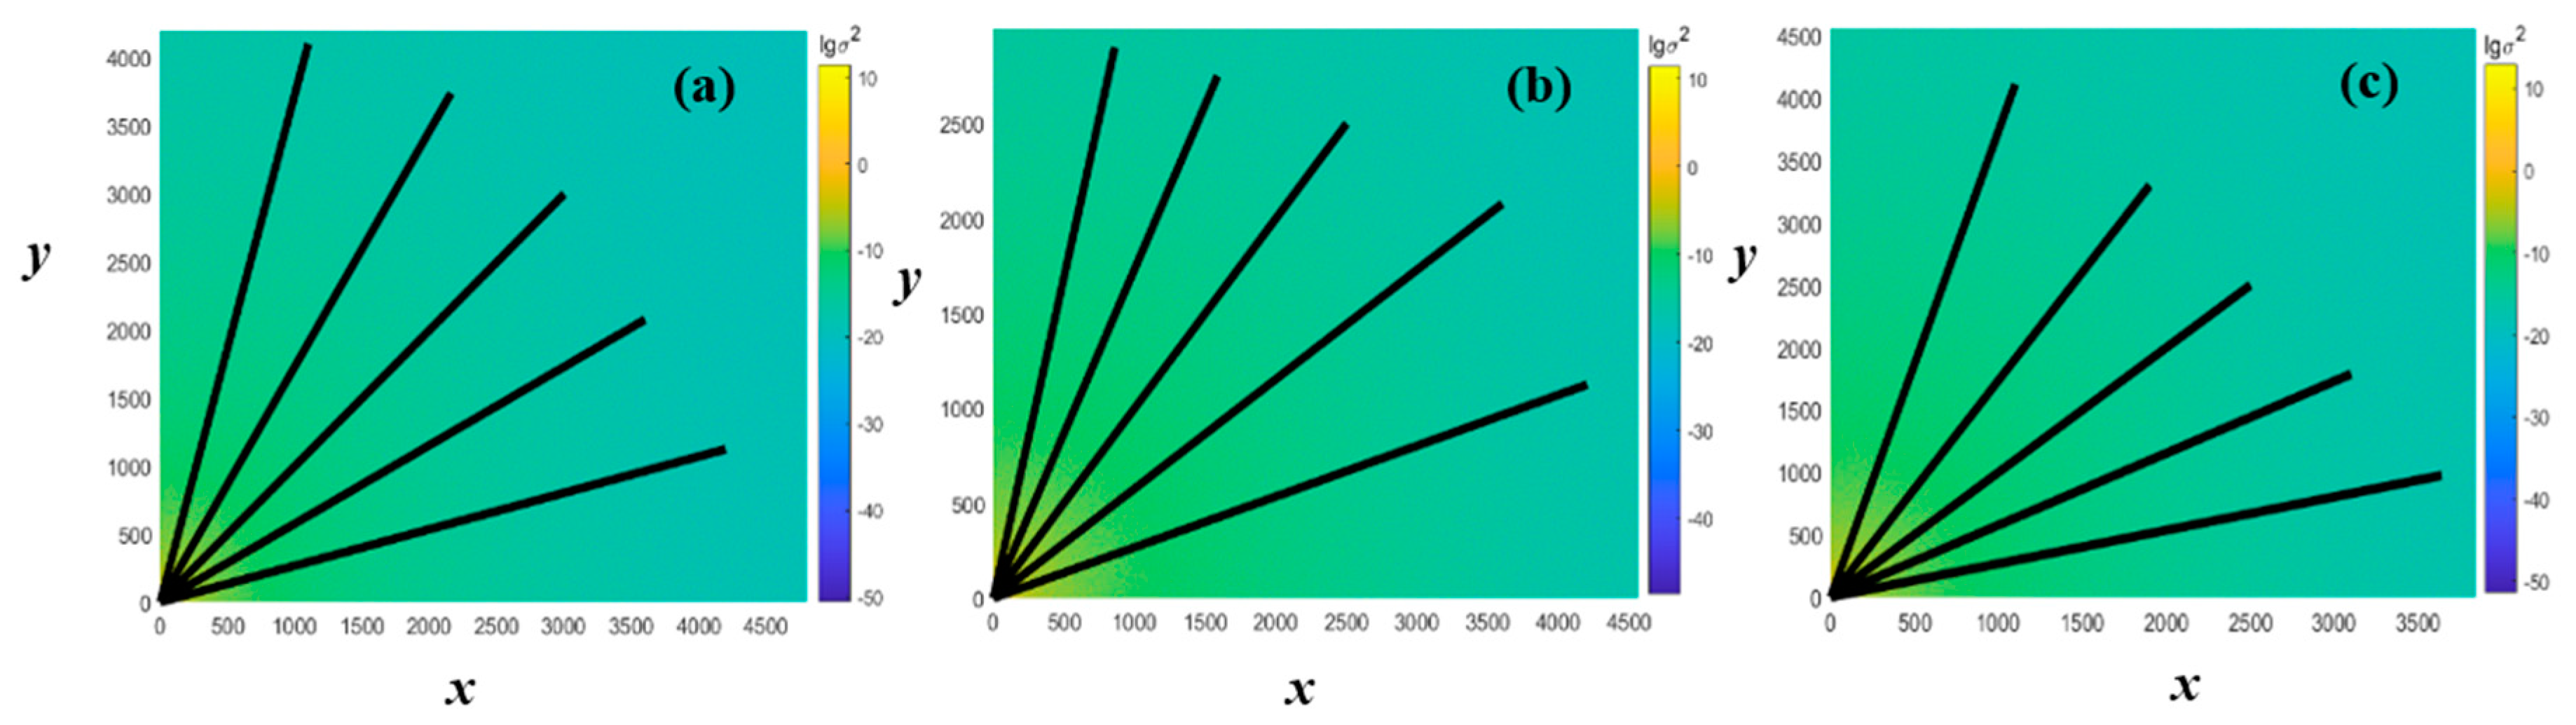
Figure 5.
The distribution of terrain height variance () versus wavelength () with the wavenumber (0,0) as the starting point, and the angel (θ) between the rays (as shown in Figure 4a) and the x-axes, meeting with tanθ =1/4 (a),1/2 (b),1 (c),2 (d) and 4 (e) respectively for domain A.
Figure 5.
The distribution of terrain height variance () versus wavelength () with the wavenumber (0,0) as the starting point, and the angel (θ) between the rays (as shown in Figure 4a) and the x-axes, meeting with tanθ =1/4 (a),1/2 (b),1 (c),2 (d) and 4 (e) respectively for domain A.
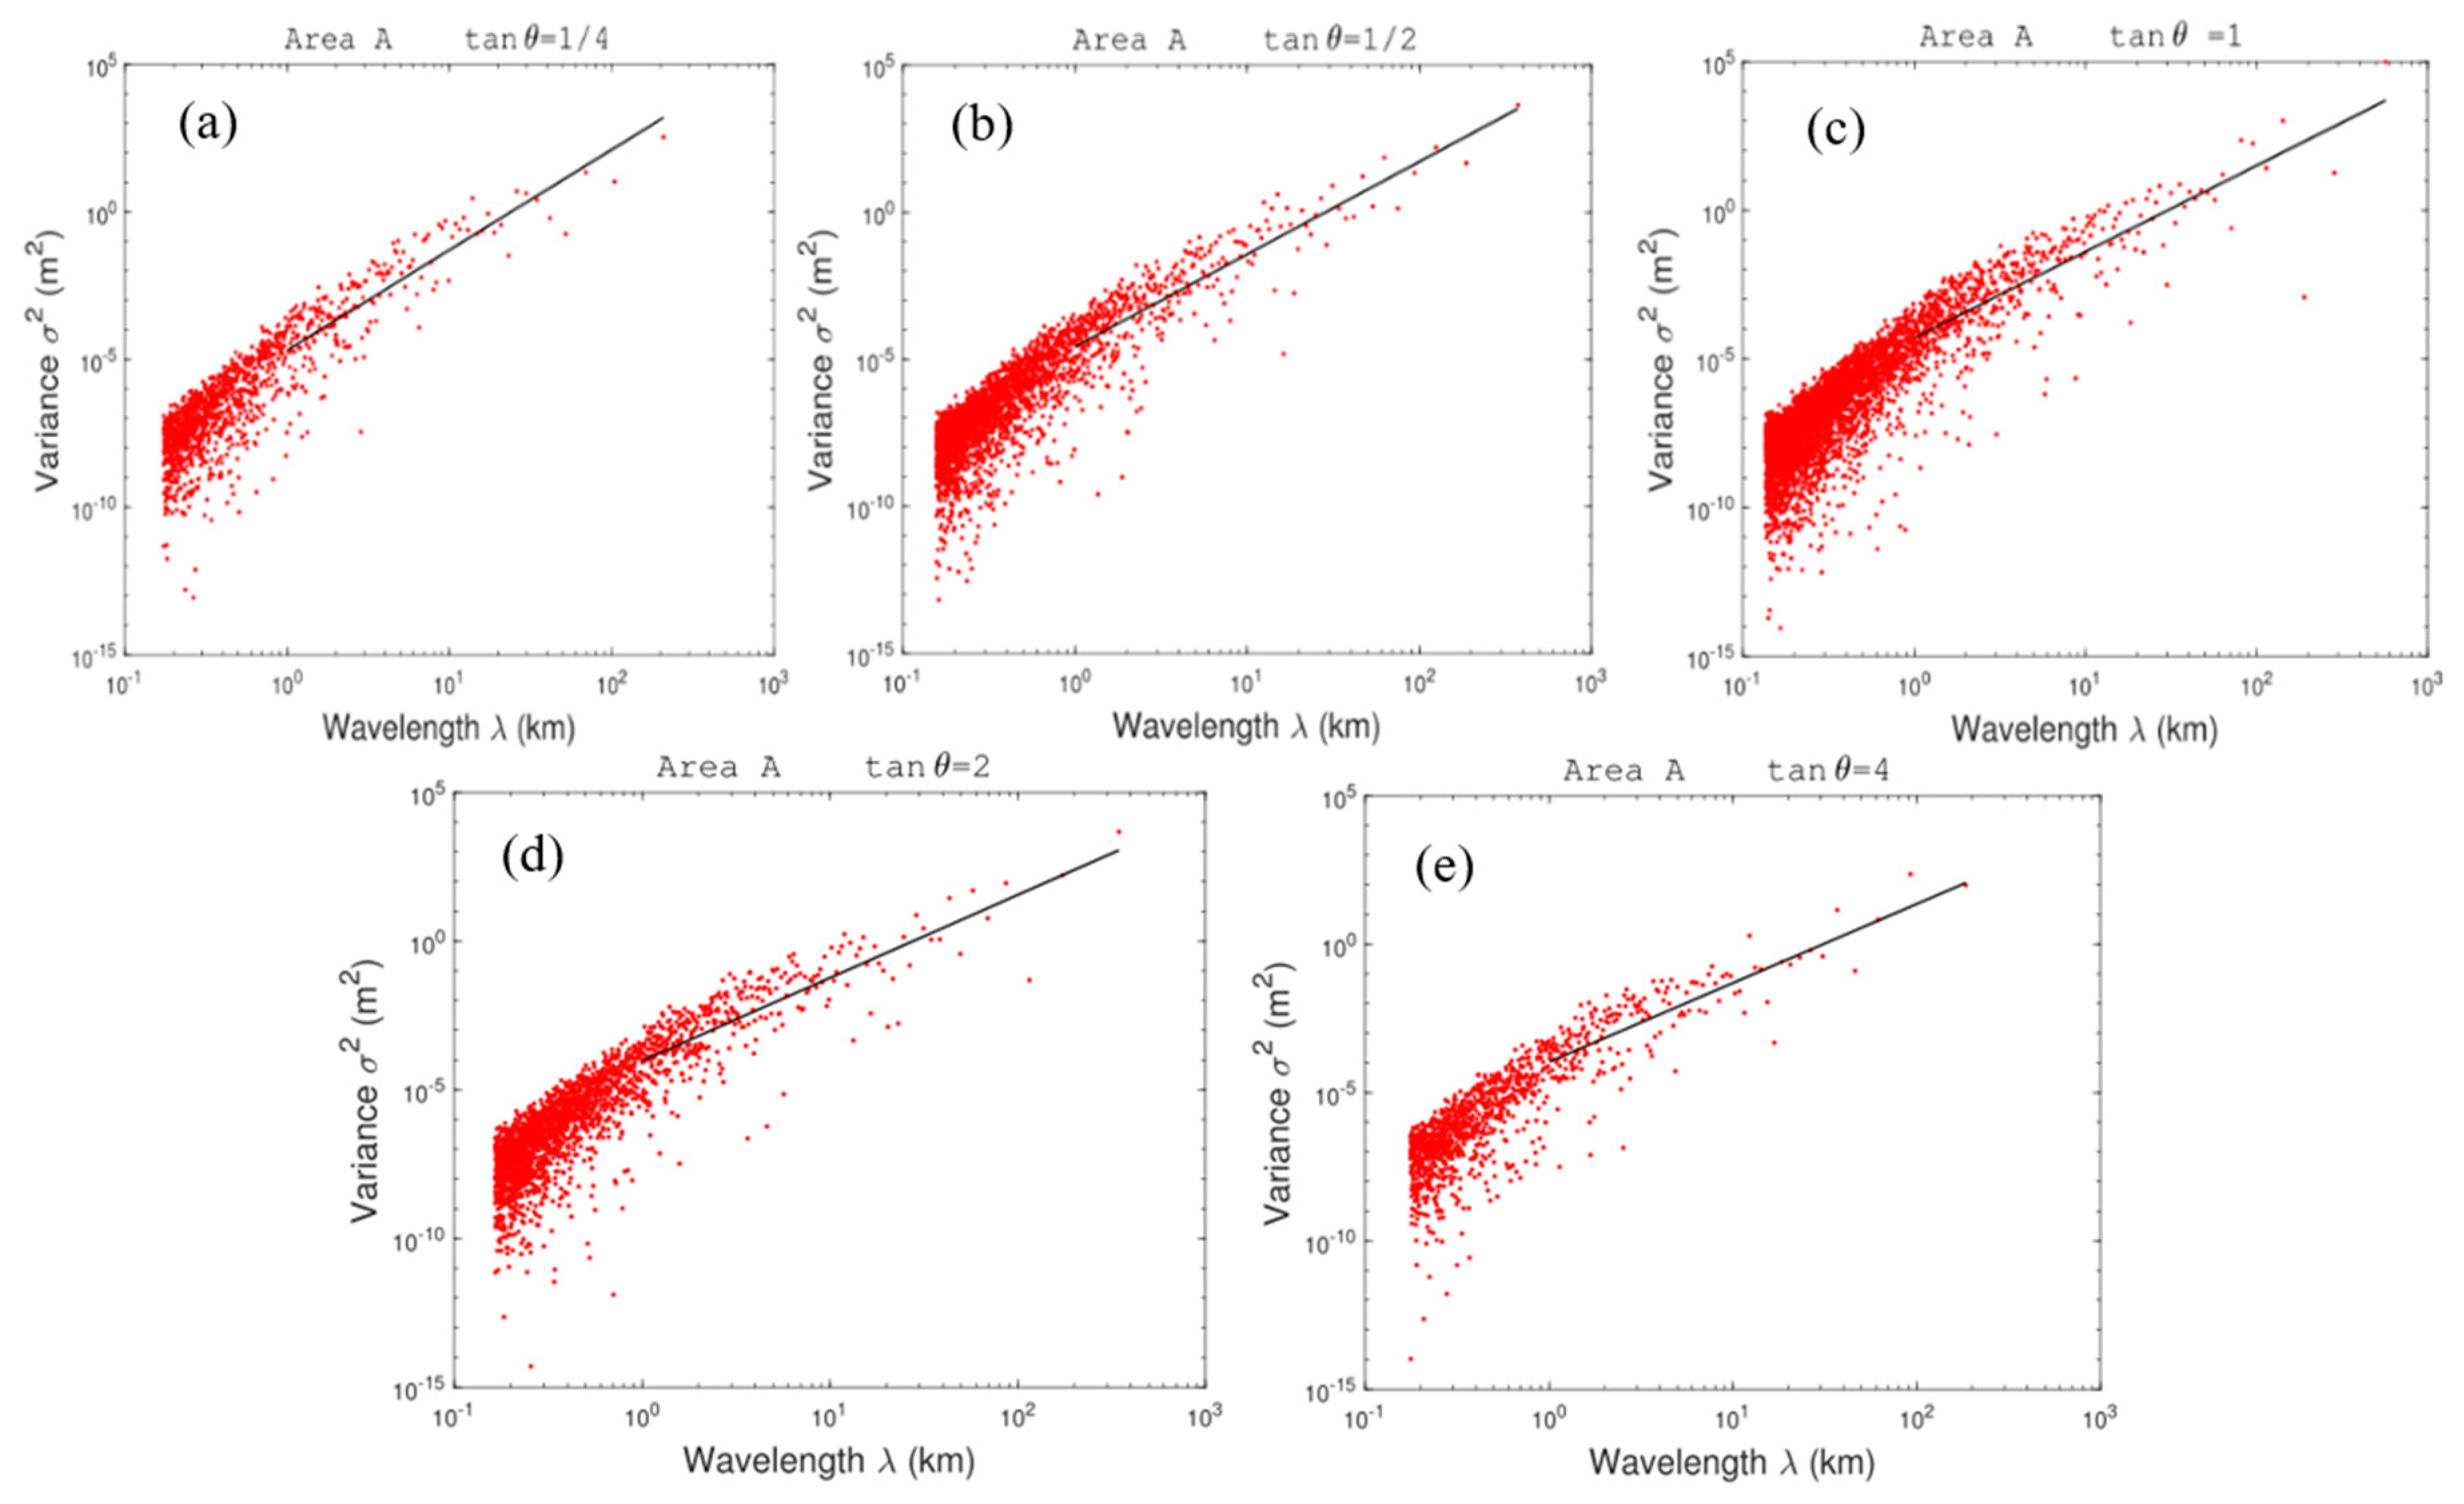
Figure 6.
The distribution of terrain height variance () versus with the wavenumber (0,0) as the starting point, and the angel (θ) between the rays (as shown in Figure 4b) and the x-axes, meeting with tanθ =1/4 (a),1/2 (b),1 (c),2 (d) and 4 (e) respectively for domain B.
Figure 6.
The distribution of terrain height variance () versus with the wavenumber (0,0) as the starting point, and the angel (θ) between the rays (as shown in Figure 4b) and the x-axes, meeting with tanθ =1/4 (a),1/2 (b),1 (c),2 (d) and 4 (e) respectively for domain B.
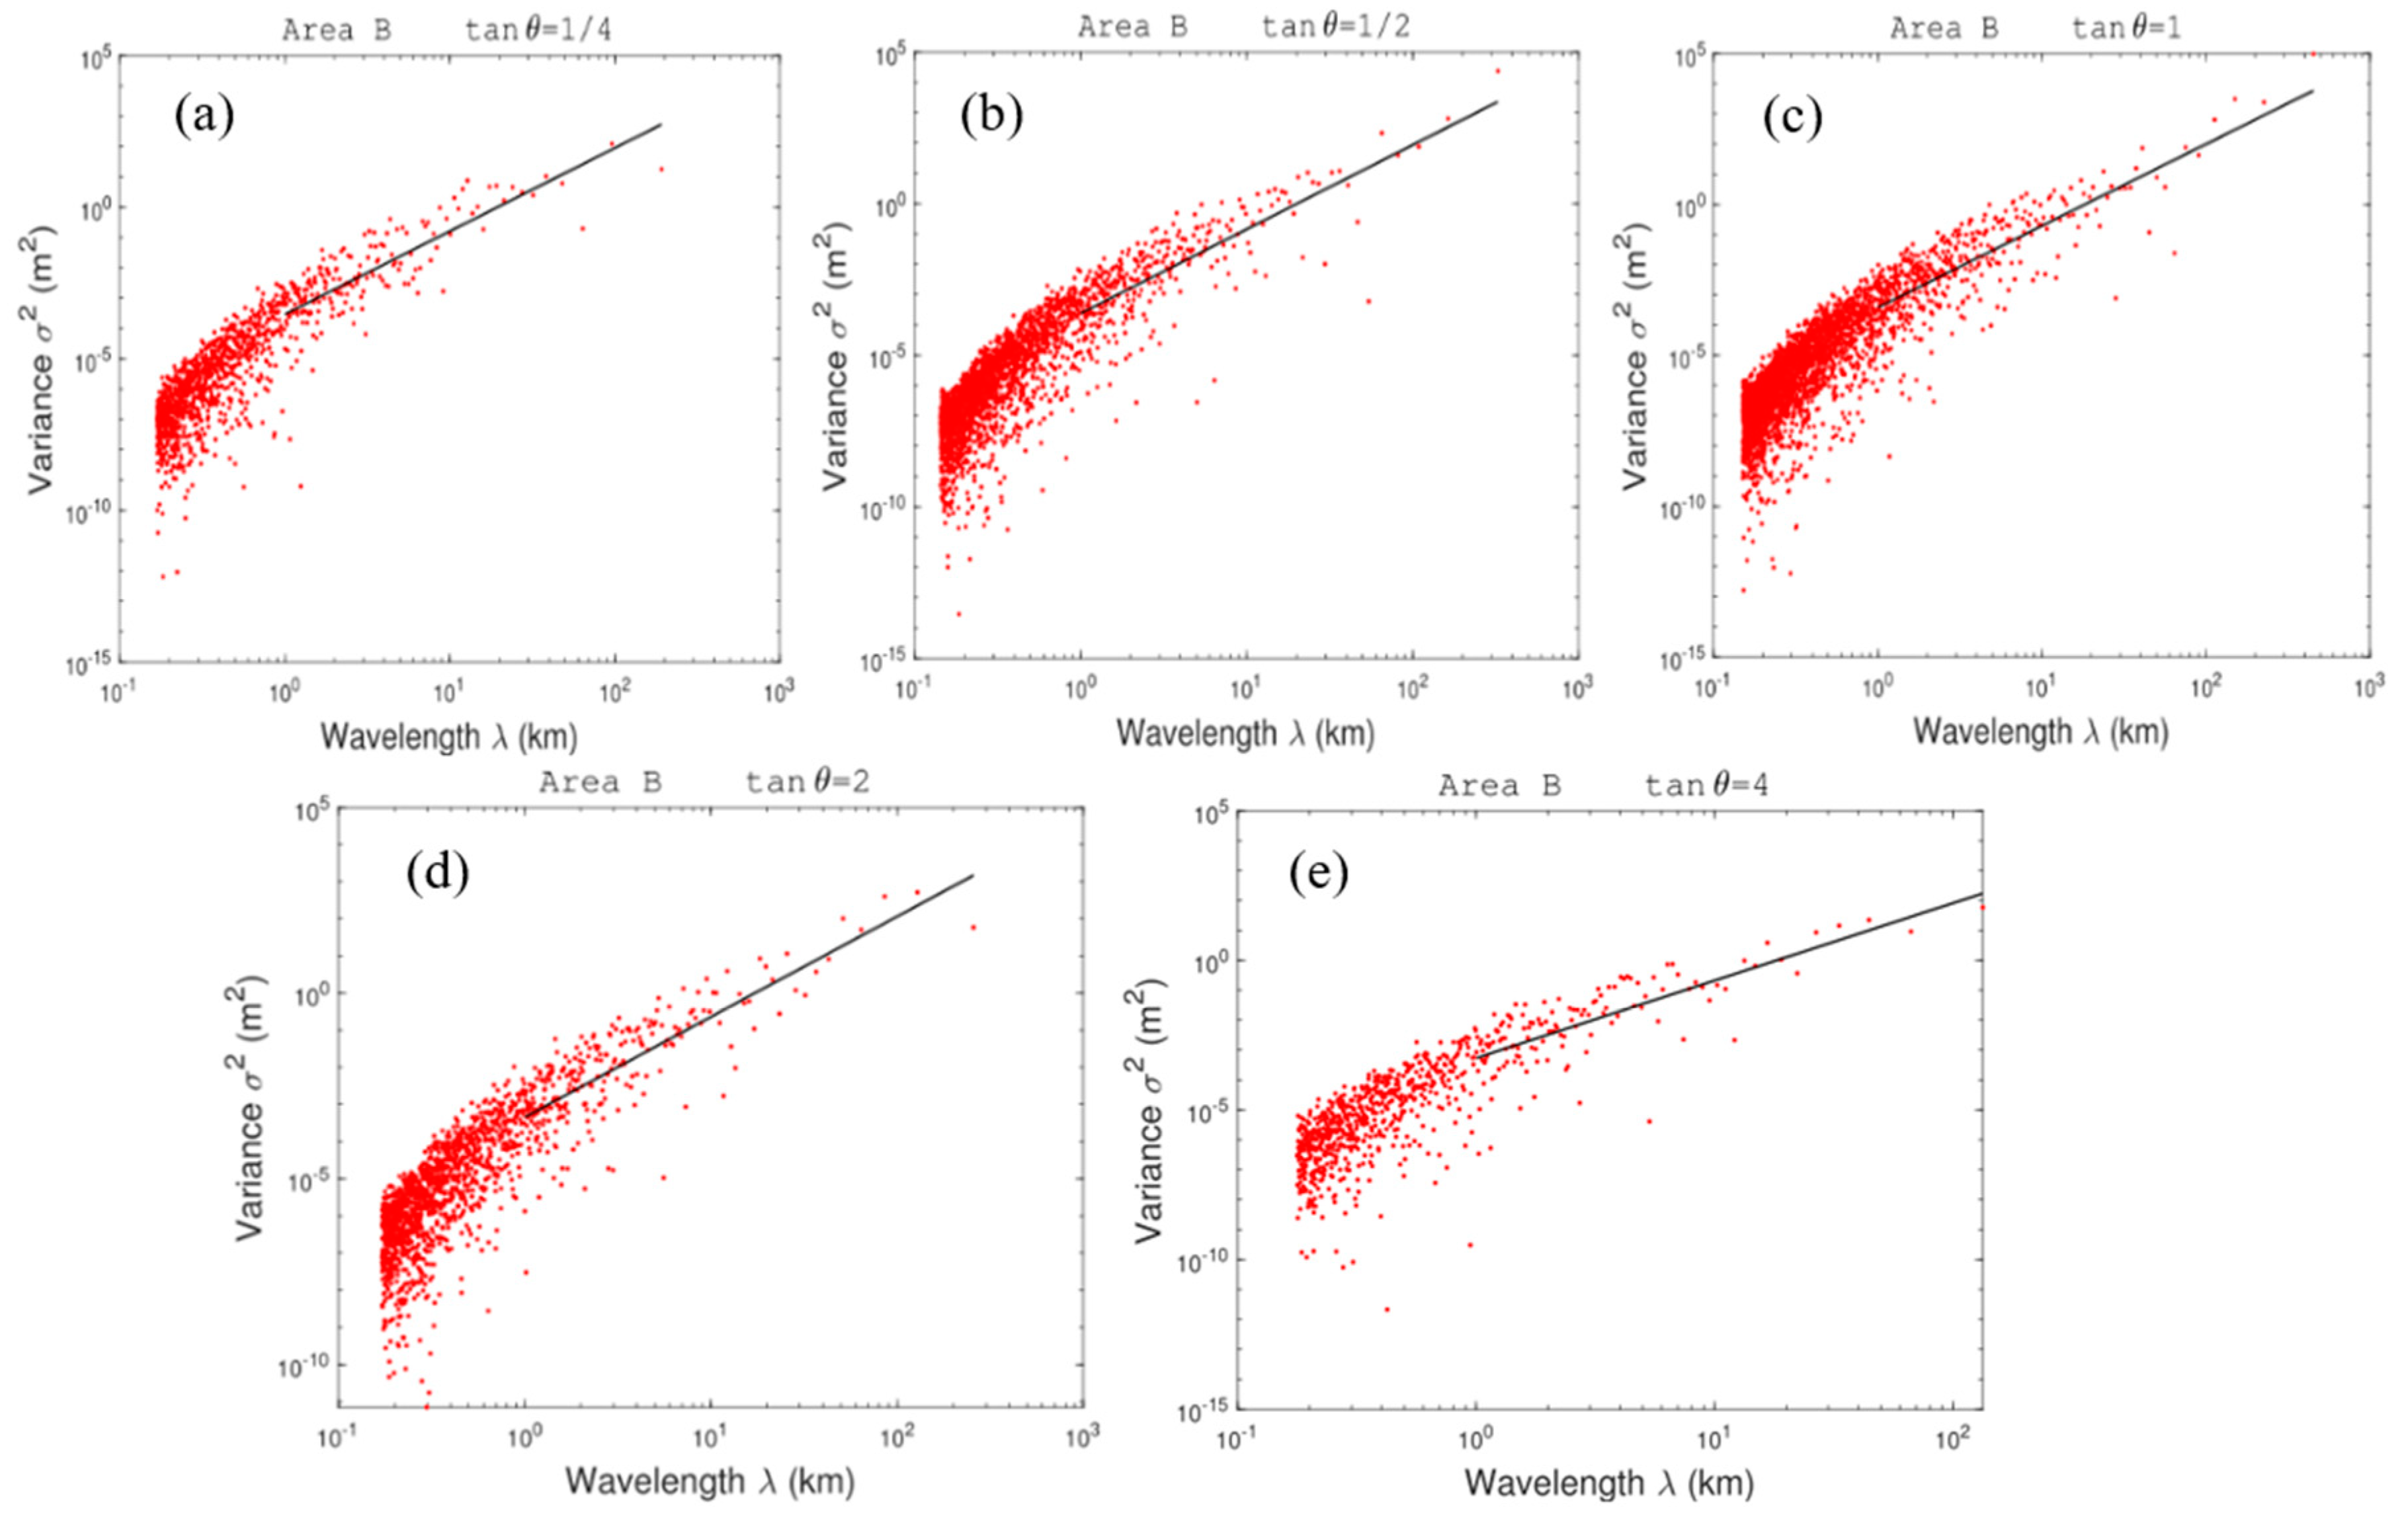
Figure 7.
The distribution of terrain height variance () versus wavelength with the wavenumber (0,0) as the starting point, and the angel (θ) between the rays (as shown in Figure 4c) and the x-axes, meeting with tanθ =1/4 (a),1/2 (b),1 (c),2 (d) and 4 (e) respectively for domain C.
Figure 7.
The distribution of terrain height variance () versus wavelength with the wavenumber (0,0) as the starting point, and the angel (θ) between the rays (as shown in Figure 4c) and the x-axes, meeting with tanθ =1/4 (a),1/2 (b),1 (c),2 (d) and 4 (e) respectively for domain C.
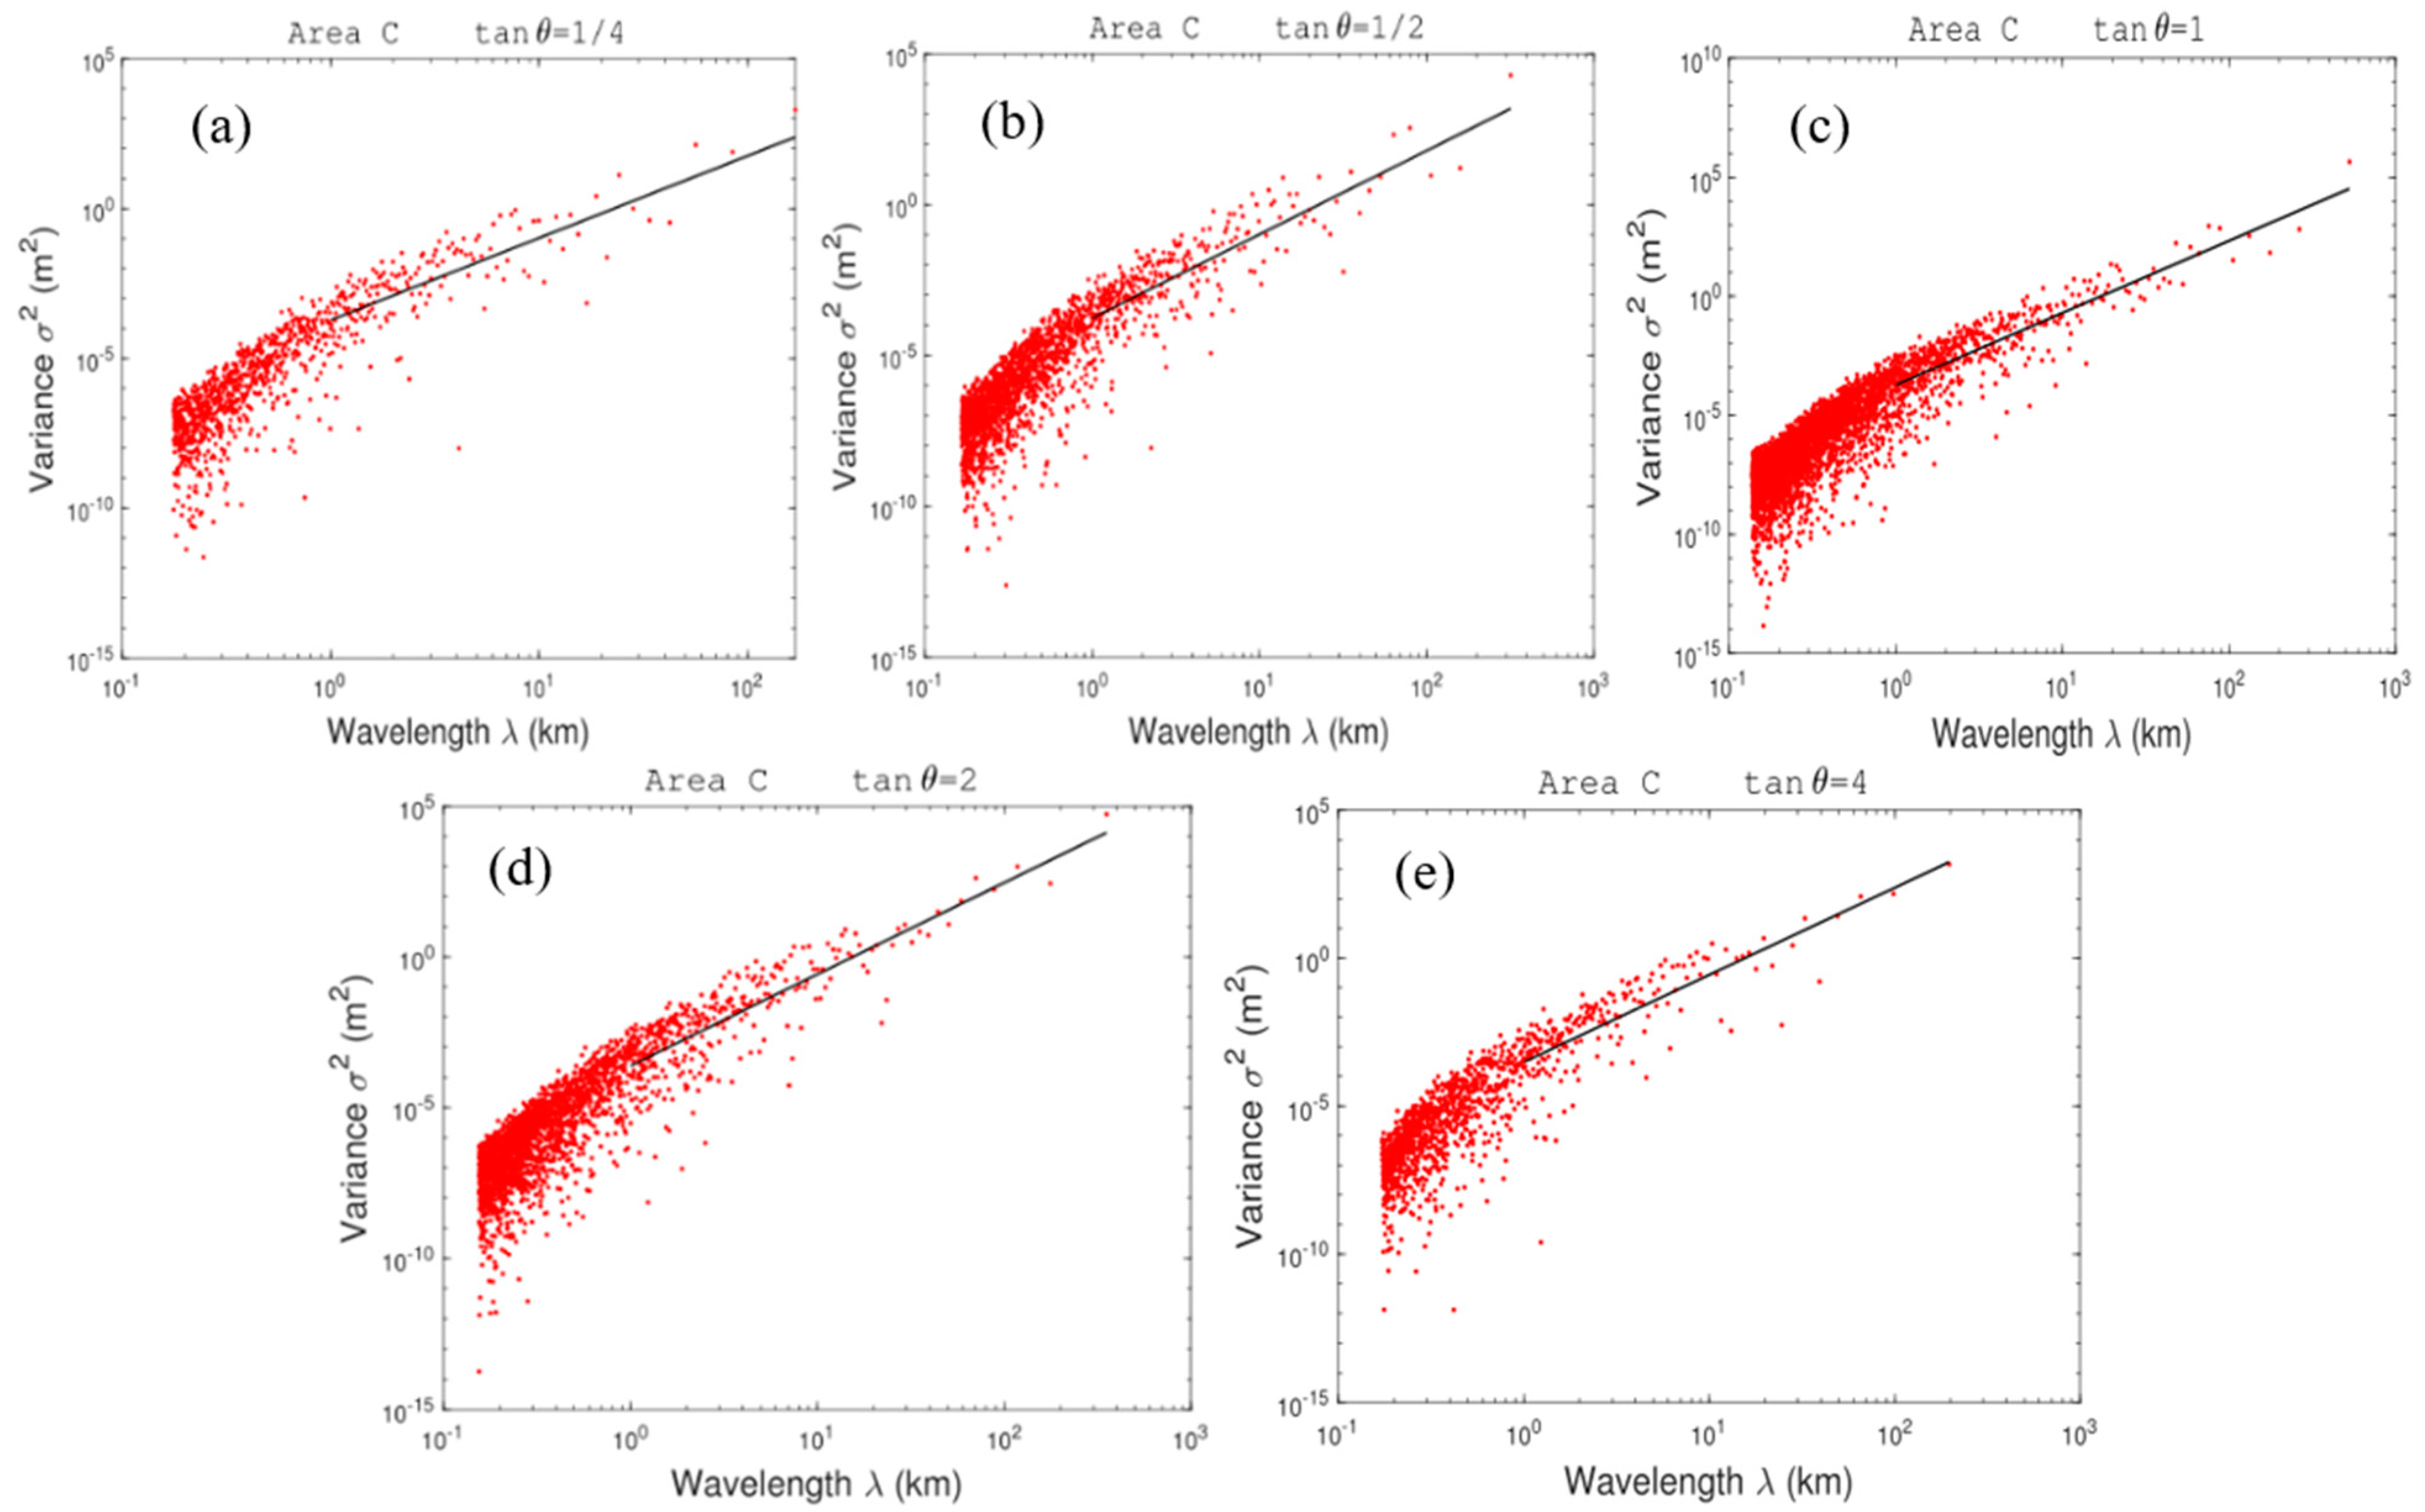
Figure 8.
The distributions of terrain height variance (solid line), total precipitation variance (dashed line), and average wind spectral variance (dotted line) from June to August averaged over 2008-2022 versus wavelength for domain A (a), B (b), and C (c).
Figure 8.
The distributions of terrain height variance (solid line), total precipitation variance (dashed line), and average wind spectral variance (dotted line) from June to August averaged over 2008-2022 versus wavelength for domain A (a), B (b), and C (c).
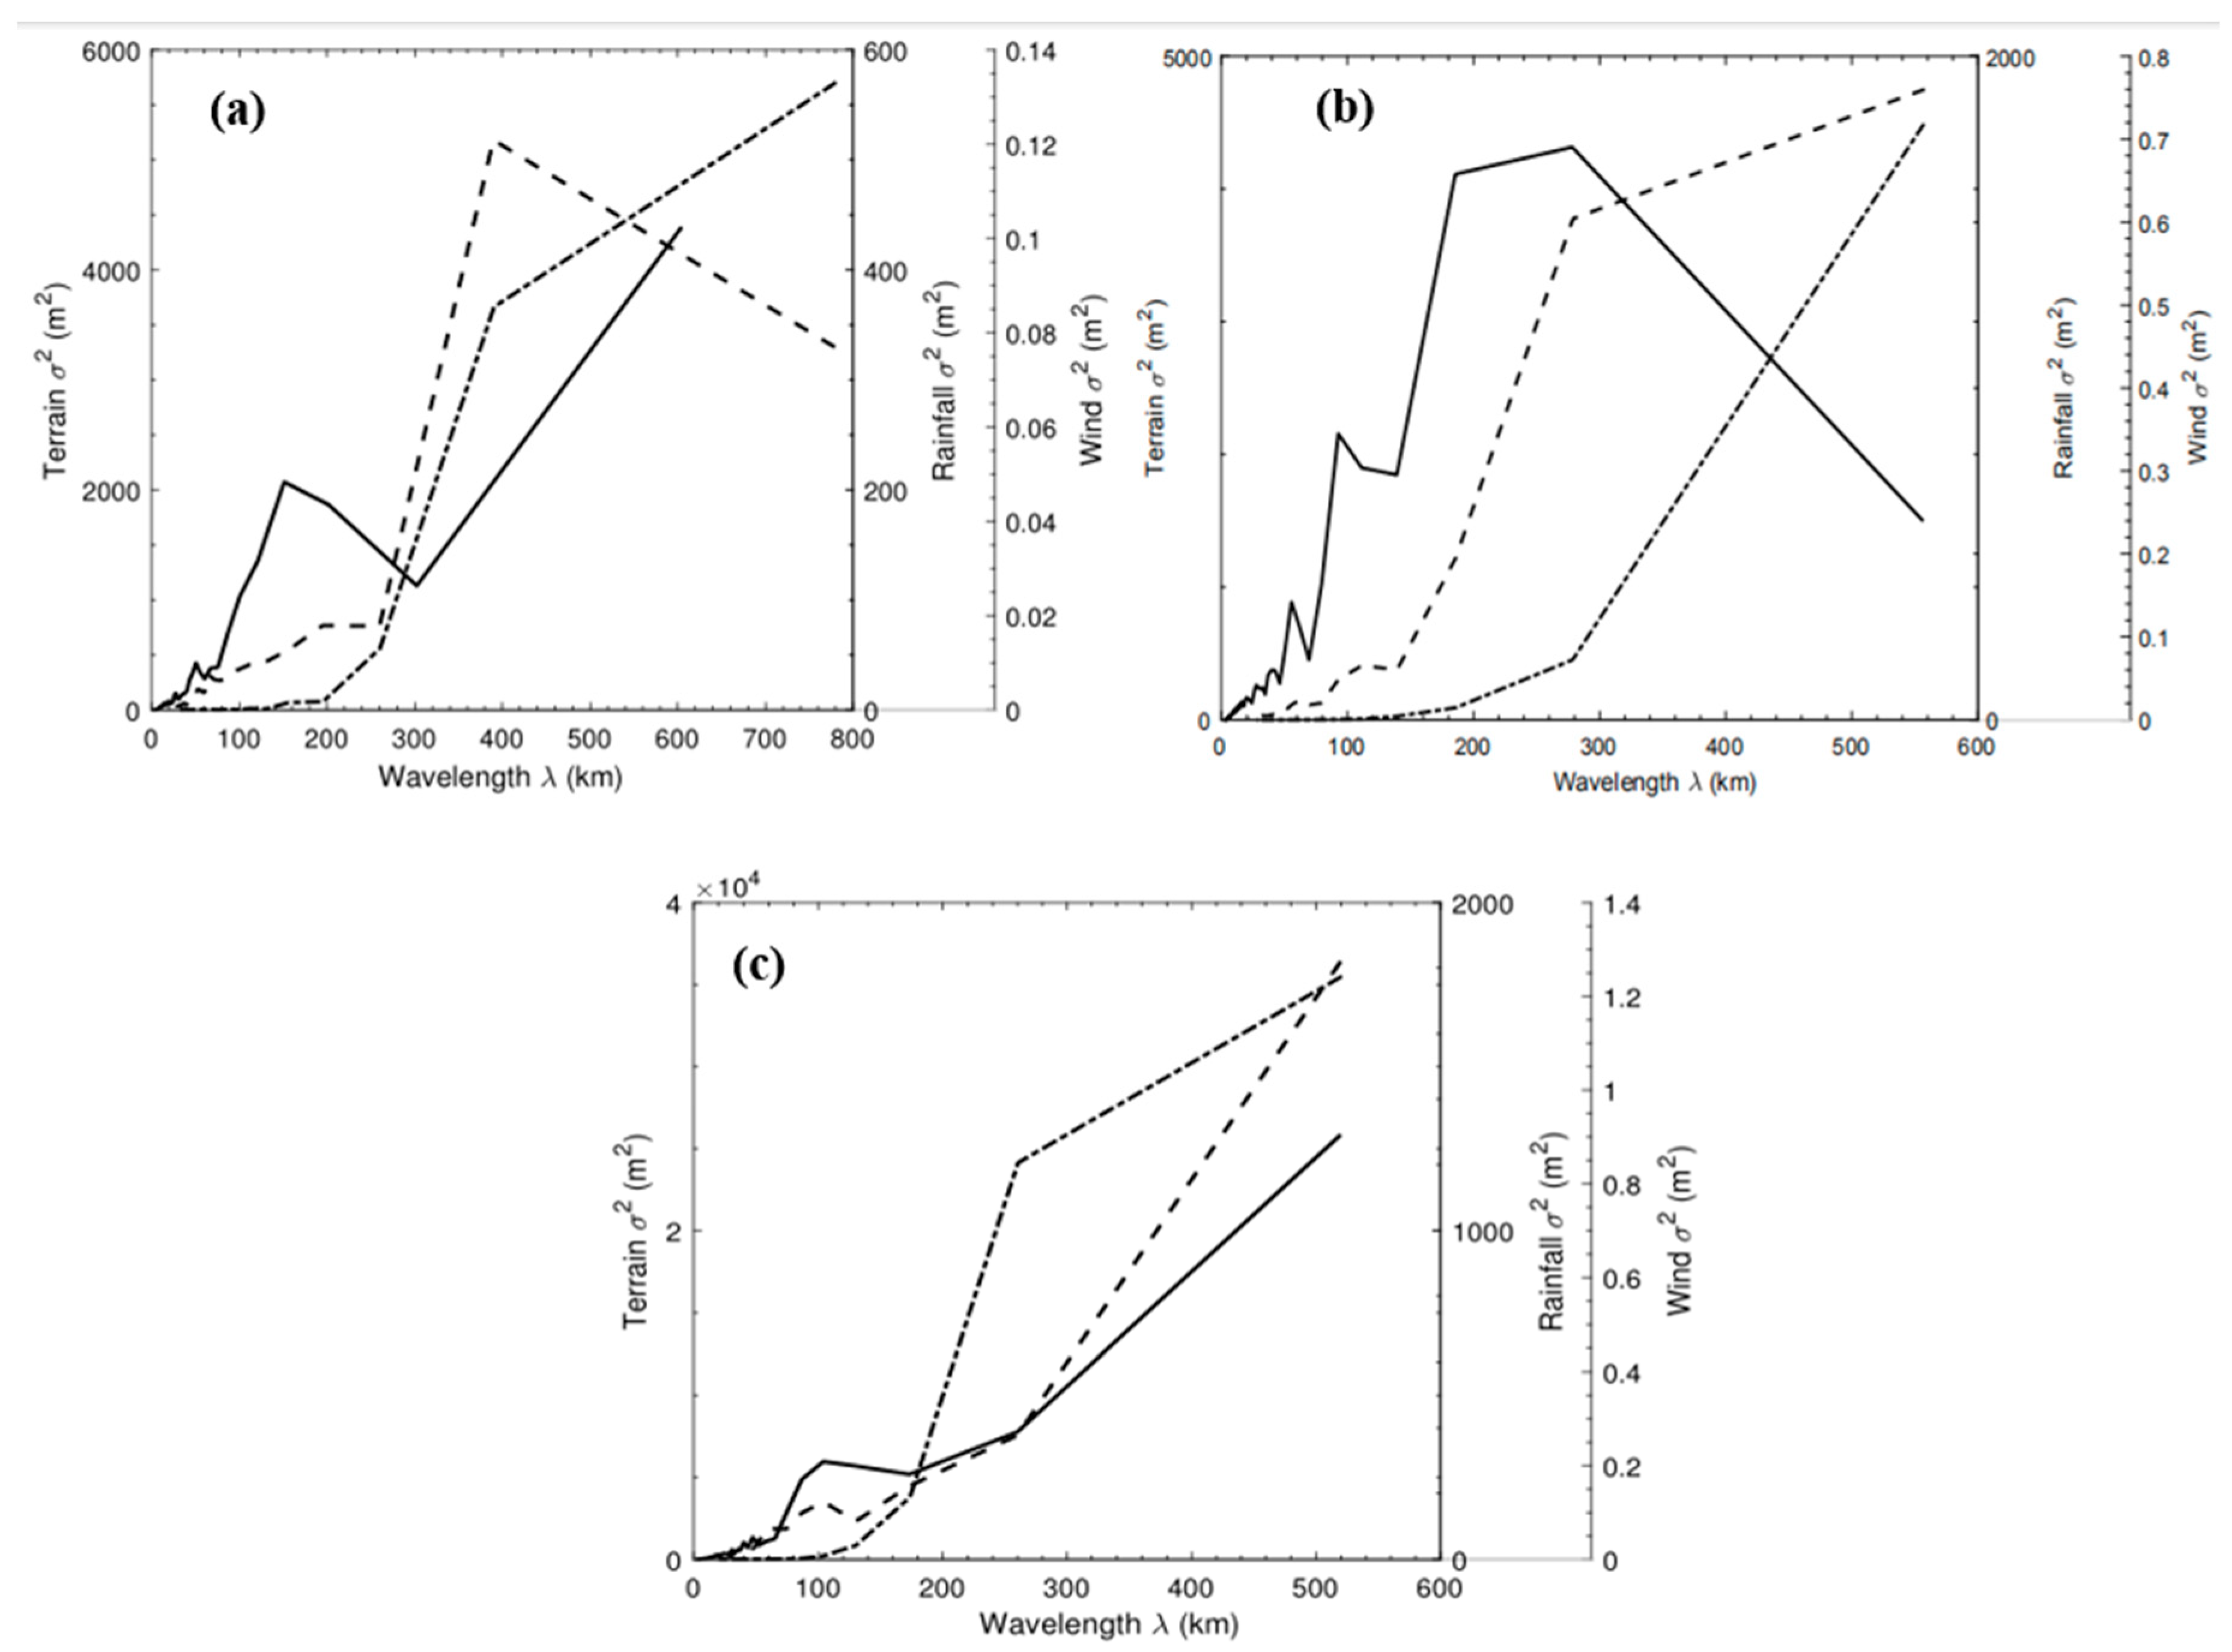

Table 1.
Parameters of the least-square fitting relation ( λ ≥ 1 km) for the five sections in each domain.
Table 1.
Parameters of the least-square fitting relation ( λ ≥ 1 km) for the five sections in each domain.
| Domain | tan θ | 1/4 | 1/2 | 1 | 2 | 4 | Average |
| A |
a(10-4) b r |
0.21 3.40 0.94 |
0.27 3.14 0.93 |
0.50 2.90 0.93 |
0.94 2.79 0.93 |
1.07 2.66 0.92 |
0.60 2.98 |
| B |
a(10-4) b r |
2.90 2.75 0.93 |
2.37 2.78 0.94 |
3.80 2.70 0.91 |
4.50 2.70 0.92 |
5.41 2.59 0.91 |
3.80 2.70 |
| C |
a(10-4) b r |
1.90 2.74 0.90 |
1.70 2.77 0.90 |
1.87 3.03 0.91 |
2.38 3.04 0.92 |
3.03 2.95 0.91 |
2.18 2.91 |
Disclaimer/Publisher’s Note: The statements, opinions and data contained in all publications are solely those of the individual author(s) and contributor(s) and not of MDPI and/or the editor(s). MDPI and/or the editor(s) disclaim responsibility for any injury to people or property resulting from any ideas, methods, instructions or products referred to in the content. |
© 2024 by the authors. Licensee MDPI, Basel, Switzerland. This article is an open access article distributed under the terms and conditions of the Creative Commons Attribution (CC BY) license (http://creativecommons.org/licenses/by/4.0/).
Copyright: This open access article is published under a Creative Commons CC BY 4.0 license, which permit the free download, distribution, and reuse, provided that the author and preprint are cited in any reuse.


